Introduction
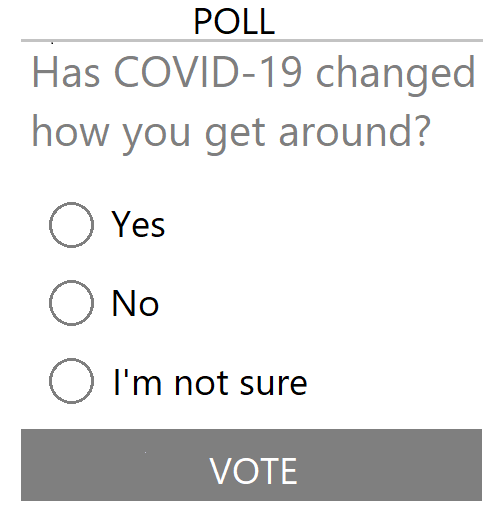
On June 24, 2020, an online poll appeared on msn.com asking the
question "Has COVID-19 changed how you get around?" There 410,530 responses
to the poll and 45% of these said "yes".
What do we learn from this poll and is that information reliable? We know that 45% of
the people who responded say COVID-19 has changed the way they get around. However, in
most polls, an important goal is to be able to generalize the results to some larger
population. Though it isn't stated here, someone asking the question in this poll might
be interested in knowing the percentage of all Americans who would answer 'yes' to this
same question. In this case, 'Americans' would be the population of interest and
the respondents would constitute a subset or sample from this population.
Population: the entire group of objects or subjects about which we'd like to draw conclusions.
Sample: a subset of a population.
The process of generalizing information from a sample to draw conclusions about a population, Statistical Inference, is an important goal of many statistical analyses.
Statistical Inference: The process of using information from a sample to draw conclusions about a population.
The goal of the COVID poll above is to ascertain the percentage of the population that has changed the way they get around due to COVID-19. This percentage is a parameter of the population, that is, a numeric value that describes the population. A parameter may be any numeric characteristic of a population but many statistical questions deal with means, proportions, and percentages. When populations are very large or otherwise inaccessible, parameters are usually unknown. In statistical inference, a sample is chosen from the population and the value of a statistic is computed. The statistic is a numeric characteristic of the sample that is analogous to and used to estimate the population parameter.
Parameter: a numerical characteristic of a population (the value is usually unknown).
Statistic: a numerical characteristic of a sample used to estimate a population parameter.
A July 2020 study from the Pew Research Center estimated that 18% of American adults get the majority of their political news through social media.
In this study, the population of interest is American adults and the parameter of interest is the percentage of American adults that gets their news from social media. The value of the statistic computed from a sample of American adults recruited by the research center is 18%. Therefore, an estimate of the population parameter is 18%.
Sample Bias
Not all samples are created equal. The researchers using the COVID poll above may have conducted statistical inference
by using the information from the sample who responded to the poll to try to learn something about a larger population,
however, the way the sample was chosen may bias the results and introduce error in the parameter estimates.
Bias often results when certain types of subjects are either over-represented or under-represented in a study.
Suppose that the population of interest for the COVID poll is Americans. Posting the poll online would influence who sees it.
People who don't read MSN.com or who don't have access to the internet would be left out of the sample.
Excluding people who don't read MSN.com might tend to leave out younger people since they are more likely to get their
news from social media than from a news site. Additionally, lower income people might be under-represented since they
are less likely to have ready access to the internet. This is called undercoverage bias.
Undercoverage bias results when some parts of the population are systematically left out of the sampling process.
There are likely many people who saw the poll but did not respond to it. This would include people who don't care, people who are in a hurry, people who skip over the polls, etc. In fact, the people who are most likely to respond to polls of this type are people who feel strongly about the issue. For the COVID poll, the people who feel most strongly about the question are likely those who have been most affected by it. Thus, the percentage who indicate that COVID-19 has changed how they get around may be higher than the percentage in the general population. Bias that results when people who don't respond are systematically different from those who do, is called nonresponse bias.
Nonresponse bias results when those who participate in the sample are systematically different from those who do not.
It is important to consider potential sources of bias when choosing a sample and to elimintate them if possible. When a sample is representative of a population, statistical inference is justified. A statistic computed from a sample can be a good estimate of the population paramter.
Representative Samples
To ensure that a sample is representative of the population and avoid bias:
- Choose the sample from the entire population.
- Choose the sample randomly.
Choose the sample from the entire population.
In order to be representative of the population, each object or individual in the sample must have some chance of being included in the sample.
Suppose the target population of the online COVID-19 poll described above is all American adults. Given that the poll was online and posted at msn.com, not everyone in the sample had a chance to participate. People who don't visit msn.com or who don't have internet access have no chance to participate. Furthermore, these people might be more likely to give one or other of the possible answers than those who do visit msn.com or who do have internet access. Thus the results of the poll would be biased.
Choose the sample randomly
The process of randomization or choosing a random sample eliminates bias that may be introduced by allowing people to choose who will be in the sample.
The sample for the COVID poll was not chosen randomly. Respondents self-selected. This can introduce bias if those who choose to respond are somehow different from those who do not. For instance, people who are angry tend to be more likely to respond to polls and surveys than those who are not. Perhaps angry people are more likely to answer 'yes' than 'no'. If participants self-select, this would lead to an inflated percentage of 'yeses'.
Randomization
The word random is used frequently everyday conversation to indicate something that is strange or unexpected. Do an internet search of "random images" and you'll see lots of pictures that would seem to fit this definition. However, the meaning of random in a statistical setting is somewhat different. In essence, 'random' describes something that occurs without "method or conscious decision". An event is random if it is the result of a chance process such as rolling dice or flipping a coin.
Random: the result of a chance process.
Simple Random Sample
There are many different ways to use randomization in choosing a sample and the methods of analyses depend on which of these is selected. Perhaps the simplest method results in a simple random sample. This is when each member of the population has the same chance of being selected for the sample. The methods that we use in this site will be based on simple random sampling. If the name of every member of a population were put in a hat and mixed and a handful of these were chosen, the result would be a simple random sample.
Simple Random Sample (SRS): A sample in which each member of the population has the same chance of being included.