Hypothesis Tests
Is 90 minutes the mean length of a movie on Netflix? There were 834 movies available on Netflix on Memorial Day, 2020 so finding the mean length of all of them
(the parameter value) would be laborious. Another
option is to obtain a random sample of the movies available on that day, compute the mean of the sample and use that to make a determination about the parameter
(the mean length of all 834 movies).
This second option relies on statistical inference and is much more practicable than the first though the results will be subject to some error.

Hypothesis Testing allows us to assess the plausibility of a specific statement or hypothesis about a population parameter, for example, "is the mean length
of a Netflix movie is 90 minutes?" In this section, we'll introduce the hypothesis testing procedure in the context of a hypothesis test for a population mean. In subsequent
sections we will discuss how this procedure can be used to conduct hypothesis tests for other parameters.
The Hypothesis Testing Process:
- State hypotheses about the parameter.
- Collect data.
- Construct a test statistic.
- Apply a decision rule.
- Draw conclusions (in statistical terms and in context).
Step 1: State Hypotheses
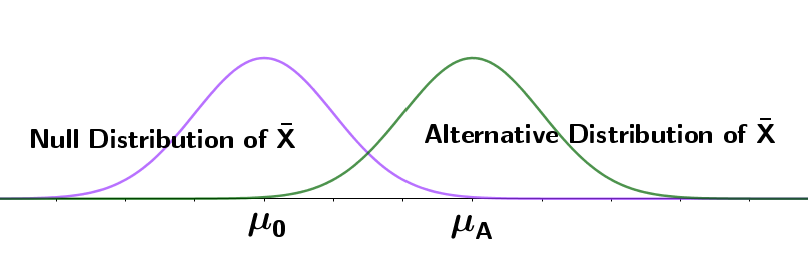
Typically, a hypothesis test is concerned with making a determination between two possible hypotheses, called the null hypothesis and the alternative hypothesis. The null hypothesis is usually a statement that the parameter is equal to a single specified value (this is called a simple hypothesis). This hypothesis often corresponds to the status quo (in the coin example from the previous page, the status quo would be that the coin is fair, i.e. P(heads) = 0.5) or the usual outcome. The alternative hypothesis indicates an alternative value for the parameter. In some cases, the alternative hypothesis might also be simple.
The Null Hypothesis ($H_0$) is a statement about the value of a parameter. This often corresponds to the status quo.
The Alternative Hypothesis ($H_A$) is an alternative statement about the value of a parameter.
A simple hypothesis specifies a single value for the parameter.
Is the mean length, $\mu$, of a Netflix movie is 90 minutes or 120 minutes?
Since the original questions was whether the mean movie length is 90 minutes, 90 is the value for the null hypothesis (null value) and 120 is the alternative value.
The null hypothesis is that the mean movies length is 90 minutes. We write $H_0:\mu=90$.
The alternative hypothesis is that the mean movies length is 120 minutes. We write $H_A:\mu=120$.
The value specified for the parameter under the null hypothesis is called the null value. The null value
for a mean is denoted $\mu_0$. The alternative value can be specified as $\mu_A$.
Both of the hypotheses in the example above are simple since a single value is specified. However, usually, a composite
alternative hypothesis in which a range of possible values for the parameter is specified is more useful. In general, the goal is not to
choose between two possible values for the parameter but rather to determine whether or not one specific value could be true. For instance,
rather than ask 'is the probability of heads in the coin toss 0.5 or 0.3' we'd probably want to ask 'is the probability of heads in the coin toss 0.5 or isn't it?'.
Is the mean length, $\mu$, of a Netflix movie 90 minutes?
$H_0:\mu=90$.
$H_A:\mu\neq 90$.
Recall from the discussion of sampling distributions and the central limit theorem that
- If the sample is drawn from a normal population with mean $\mu$ and variance $\sigma^2$ then $\bar{X}\sim N(\mu, \frac{\sigma^2}{n})$.
- If the sample is drawn from any non-normal normal population with mean $\mu$ and variance $\sigma^2$ and the sample size is large then $\bar{X}\stackrel{\cdot}{\sim} N(\mu, \frac{\sigma^2}{n})$.
- If the population consists of $p\cdot 100\%$ 1's and the rest 0's, if the sample size, n, is large then the sample mean $\hat{p}\sim N(p,\frac{p(1-p)}{n})$.
This means that, when conducting a hypothesis test for a mean, if the null hypothesis is true, $\bar{X} \sim N(\mu_0, \sigma^2)$ and if the alternative hypothesis is true $\bar{X} \sim N(\mu_A, \sigma^2)$ at least approximately and when conducting a hypothesis test for a proportion, if the if the null hypothesis is true, $\hat{p}\sim N(p_0,\frac{p_0(1-p_0)}{n})$ and if the alternative hypothesis is true $\hat{p}\sim N(p_A,\frac{p_A(1-p_A)}{n})$.
The form of an alternative hypothesis depends on the type of question being asked.
| Question | Null Hypothesis | Alternative Hypothesis |
|---|---|---|
| Is the mean equal to a specified value? | $H_0: \mu = \mu_0$ | $H_A:\mu \neq \mu_0$ |
| Is the mean less than a specified value? | $H_0: \mu = \mu_0$ | $H_A:\mu < \mu_0$ |
| Is the mean greater than a specified value? | $H_0: \mu = \mu_0$ | $H_A:\mu > \mu_0$ |
The null hypothesis is sometimes expressed as a composite hypothesis complementary to the alternative hypothesis, however, we will continue to express the null hypotheses as simple hypotheses since these most clearly identify the null distribution of the mean. The outcome of the hypothesis test depends on the alternative hypothesis that is set up. However, the results from one type of alternative hypothesis are easily obtainable from the results of the others.
The alternative hypothesis for the movie length question should be set up based on the question that is being asked. The possible cases are shown here.
Is the mean length, $\mu$, of a Netflix movie 90 minutes?
$H_0:\mu=90$.
$H_A:\mu\neq 90$.
Is the mean length, $\mu$, of a Netflix movie more than 90 minutes?
$H_0:\mu=90$.
$H_A:\mu > 90$.
Is the mean length, $\mu$, of a Netflix movie less than 90 minutes?
$H_0:\mu=90$.
$H_A:\mu < 90$.
Step 2: Collect Data
Data should be collected after the hypotheses are specified. If the data are collected first, the patterns we see in the data might influence how we set up our hypotheses which, in turn, would introduce bias.
For a hypothesis test of whether the mean Netflix movie length is 90 minutes, we chose a random sample of 32 of the available movies. The mean runtime for this sample was 104 minutes with a sample standard deviation of 18 minutes.
Step 3: Construct a Test Statistic
The test statistic summarizes the data. This statistic could be as simple as a count (e.g. the number of heads observed in 100 coin tosses) or a mean (e.g. the mean length of the Netflix movies in our sample). However, it is more useful to use a statistic that indicates how different the results we observed are from what would have been expected if the null hypothesis were true.
A test statistic is a statistic used in a hypothesis test that indicates how different the observed results are from what would be expected if the null hypothesis is true.
The observed results are summarized with the sample mean $\bar{X}$. The value we would expect under the null hypothesis is $\mu_0$ so the difference between what we expect and what we observe can is $\bar{X}-\mu_0$. However, considering this difference only could be misleading.
Two possible null distributions of $\bar{X}$ are shown in the plot, one in which $s.e.(\bar{X})$ is large and one in which it is small. Under the first distribution, the observed value of $\bar{x}$ shown is fairly likely, however, it is extremely unlikely under the other distribution. Thus, in addition to the raw difference between the observed value of the sample mean and the null value, the test statistic must take into account the standard error.
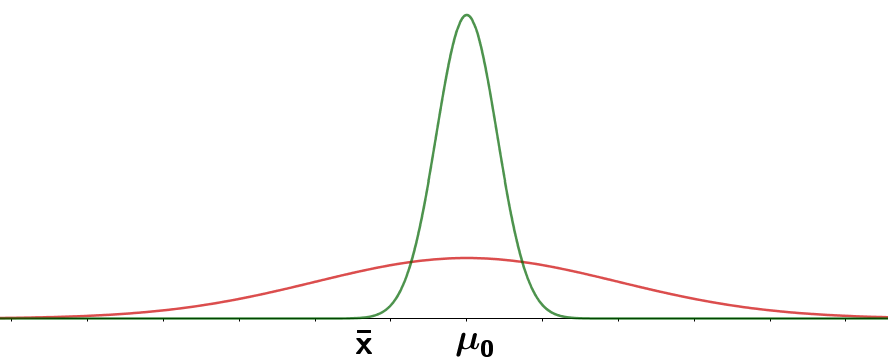
The test statistic thus has the familiar form: $\frac{\bar{X}-\mu_0}{s.e.(\bar{X})}$. These cases arise:
- If $X_1, X_2, \ldots X_n$ are independent random variables such that $X_i\sim N(\mu, \sigma^2)$ then $\bar{X}\sim N(\mu,\frac{\sigma^2}{n})$
- If $X_1, X_2, \ldots X_n$ are independent random variables such that $E(X_i) = \mu$ and $Var(X_i) = \sigma^2$ and n is large then $\bar{X}\stackrel{\cdot}{\sim} N(\mu,\frac{\sigma^2}{n})$
- If $X_1, X_2, \ldots X_n$ are independent random variables such that $X_i\sim N(\mu, \sigma^2)$ then $\frac{\bar{X}-\mu}{S/\sqrt{n}}\sim t_{n-1}.$
Since $\sigma^2$ is usually unknown, in most cases, the test statistic looks like this: $\frac{\bar{X}-\mu}{S/\sqrt{n}}$. As the sample size increases, the t-distribution converges to the normal distribution thus for a hypothesis test for a mean, we will use the statistic $T=\frac{\bar{X}-\mu}{S/\sqrt{n}}\sim t_{n-1}.$
$T=\frac{\bar{X}-\mu}{S/\sqrt{n}}\sim t_{n-1}$
When we conduct a hypothesis test, after collecting data, we compute a value of the test statistic based on the observed data. We can compare this value to the distribution to know how likely or improbable our results may be.
For a hypothesis test of whether the mean Netflix movie length is 90 minutes, we chose a random sample of 32 of the available movies. The mean runtime for this sample was 104 minutes with a sample standard deviation of 18 minutes. That is, $\bar{x} = 104$, $s=18$. We previously stated that the null hypothesis for this test is $H_0:\mu = 90$. The value of the test statistic is:
$T=\frac{104-90}{18/\sqrt{32}}=4.40$
Step 4: Apply a decision rule
A decision rule tells us when to reject the null hypothesis. This can be framed in two different ways that we'll describe here. First, a decision rule can be framed in terms of a rejection region. A rejection region specifies the values of the test statistic that will lead us to reject the null hypothesis. Second, a decision rule can be framed in terms of a p-value. This indicates the probability of obtaining results like those observed if the null hypothesis is true. We'll discuss each of these in detail below.
A decision rule indicates when to reject the null hypothesis.
A rejection region specifies the values of the test statistic for which to reject the null hypothesis.
A p-value is the probability of obtaining the observing results or something more extreme if the null hypothesis is true.
Rejection Region
A rejection region specifies the values of the test statistic for which we would reject the null hypothesis. This is usually identified by specifying an acceptable probability of rejecting the null hypothesis when it is true. This probability is called the significance level of the test. 0.05 is the most commonly used significance level. However, this value is determined by the researcher and can be whatever value they think is reasonable.Significance level: The acceptable probability of rejecting a true null hypothesis.
For a hypothesis test of whether the mean Netflix movie length is 90 minutes, identify a rejection region that would lead to a probability of 0.05 of rejecting the null hypothesis when it is true.
We will reject the null hypothesis when the mean movie length is either a lot larger or a lot smaller than 90 minutes. Thus the rejection region will be divided into two pieces, with a probability of 0.025 associated with each. Since the test statistic has a $\small{t_{31}}$ distribution, we can use this to find that the rejection region consists of values that are at least 2.04 SD's away from the mean. That is, we'd reject the null hypothesis if the value of the mean is less than $\small{90-2.04*\frac{18}{\sqrt{32}}}$ or greater than $\small{90+2.04*\frac{18}{\sqrt{32}}}$. That is, reject for $\small{\bar{X}<83.509}$ or $\small{\bar{X}>96.491}$.
P-value
A p-value looks at the rejection region and the test statistic in terms of how likely the values are. Specifically, it is the probability of observing a test statistic as extreme or more extreme than that observed if the null hypothesis is true.- As extreme or more extreme: the p-value is the probability of getting a test statistic at least as different from the expected as the test statistic observed.
- If the null hypothesis is true: a p-value is a conditional probability. When computing the p-value, we begin by assuming that the null hypothesis is true. In that case, the null distribution of the sample mean will be centered at the null value.
For a hypothesis test of whether the mean Netflix movie length is 90 minutes, the value of the test statistic is $T = 4.40$.
$P(|t_{31}| > 4.4)=0.0001$
A Comment on Decision Rules
In practice, it is most common to use p-values to formulate a decision rule. Consequently, as we discuss other types of hypothesis tests, we'll replace the
fourth step "apply a decision rule" with "compute a p-value".
The Hypothesis Testing Process:
- State hypotheses about the parameter.
- Collect data.
- Construct a test statistic.
- Compute a p-value.
- Draw conclusions (in statistical terms and in context).
Step 5: Draw Conclusions
Statistical Conclusions
If the test statistic is in the rejection region or the p-value is smaller than the significance level, we reject the null hypothesis and say that the results are statistically significant. Otherwise, we fail to reject the null hypothesis.
Contextual Conclusions
For a hypothesis test of whether the mean Netflix movie length is 90 minutes, we rejected the null hypothesis so we conclude that there is evidence that the mean movie length is not 90 minutes.