- The population of interest is 'Americans'.
- The parameter of interest is the percentage of American that eats fast food at least monthly
- 80% is the value of the statistic. In a poll, information is obtained from a sample and is used to estimate the value of the population parameter.
Introduction
Many important crops, including almonds, avocados, and apples rely on pollination by bees. According to the United Nations Food and Agriculture Organization, "close to 75 percent of the world's crops producing fruits and seeds for human consumption depend, at least in part, on pollinators for sustained production, yield and quality." The world's population of bees is declining due to a number of threats, including varroa mites.
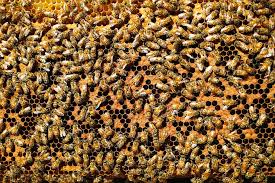
Suppose that within a certain region, there are 5000 beekeepers. (Beekeeping is on the rise, most beekeepers are hobbyists.) It would be useful to know the proportion of beekeepers that have had to deal with varroa mites. Statistical inference could be used to estimate this proportion. To do this, researchers would choose a sample of beekeepers, find the proportion of these that have had to deal with the mites and use the results to estimate the proportion of all the beekeepers in the region who have had to deal with them.
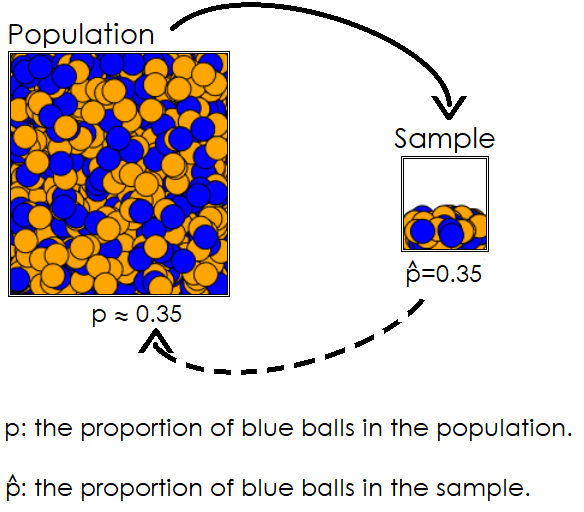
Statistical Inference is the process of drawing conclusions about a population based on information obtained from a sample.
With statistical inference, researchers can use statistics obtained from a sample to estimate parameters of a population.
Population: the entire group of objects or subjects about which we'd like to draw conclusions.
Parameter: a numerical characteristic of a population (the value is usually unknown).
Sample: a subset of a population.
Statistic: a numerical characteristic of a sample used to estimate a population parameter.
- Population: all the shells that can be found on a particular beach.
- Parameter: the proportion of all the shells that are broken.
- Sample: a subset of the shells from the beach.
- Statistic: the proportion of shells in the sample that are broken.
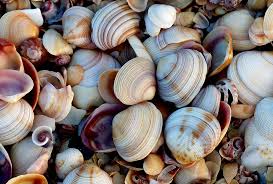
Note: The parameter and statistic identified here are examples only. There are many other possible parameters and related statistics:
mean width of a shell, proportion of clam shells, median shell weight, to name a few.
What other parameters might be of interest?
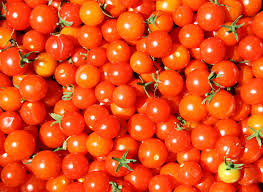
- Population: all the cherry tomatoes in a harvest.
- Parameter: the mean diameter of the tomatoes.
- Sample: a subset of the tomatoes in the harvest.
- Statistic: the mean diameter of the tomatoes in the sample.
Methods of Inference
Much of inference is geared toward one of two purposes: estimation or comparison. The methods we will discuss that can be used to acheive these purposes can be classified as
A Confidence intervals (CI) is used to estimate the value of a parameter. It can be thought of as a set of
plausible values for the parameter or as an estimate of parameter accompanied by a margin of error.
A Hypothesis Tests (HT) is used to make comparisons. It is a process for determining whether a specified value is a reasonable value for
a parameter of interest.
The sections that follow introduce these methods in the context of conducting inference for a mean or proportion. Similar methods can be used to
conduct inference in a variety of scenarios.