Probability Models
A probability model is a convenient way to describe the distribution of the outcomes of an experiment. It
consists of all the possible outcomes of an experiment their corresponding probabilities. It is often useful to display the
probability model with a table.
A probability model consists of the experimental outcomes and their probabilities.
 A probability model for the Virginia raffle looks like this.
A tire company received its new shipment of tires, and discovered that the manufacturers had not been very consistent with the tires' sizes. Of the 600 tires in the shipment, just 320 of them were exactly the needed size. 115 of the tires were slightly small, 65 of the tires were too small, 70 of the tires were slightly large, and 30 of the tires were too large. After the tire company had separated the tires into appropriate piles, an intern still learning the forklift controls accidentally knocked all the piles over, mixing them up. Unbeknownst to other workers at the company, the intern quickly stacked the tires back up in a random order and kept working.
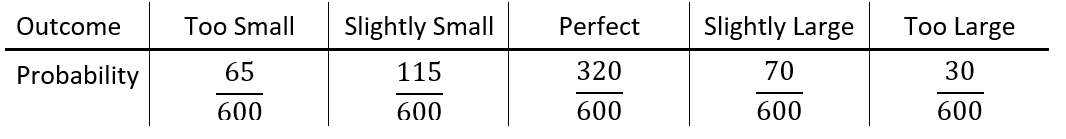 A probability model for the tire size the next customer might receive would look like this.
In a probability model, it is useful to identify each outcome with a number that can represent that outcome.

From the tire company example above, suppose we labeled each of the tires in terms of the number of millimeters the tire size is "off" from the needed size, in diameter. Then the perfect tires are 0 mm off in diameter from the needed size. The slightly small tires were about 7 mm smaller than the correct size in diameter, the tires that were too small were about 14 mm smaller than the correct size, the slightly large tires were about 7 mm bigger than the correct size, and the tires that were too large were about 14 mm bigger than the correct size.
Create a probability model to display the distribution of outcomes, in terms of millimeters in diameter from the correct size, for when the next customer arrives, orders a tire, and receives one of the inconsistent tire sizes from the jumbled piles.
 A probability model for the tire size the next customer might receive would look like this.
Expressing experimental outcomes as numerical values enables us to address mathematical questions about the experiment, such as:
- What is the expected outcome?
- How much do the outcomes vary?
- What would be the expected outcome we repeated the experiment many times?
- How much will people win on average?
- How much will the winnings vary?
- How much would we expect to win if we bought 10 tickets?
Expected Value
On average, how much will a person who plays the VA lottery win?
At first thought, it might seem useful to find the mean of the four amounts a person could win: \(\small{\frac{1000000+100000+500+0}{4} = 275125}\).
If only it worked that way, but this number is way too high! Taking the mean of the possible winnings doesn't take into account the fact that a person
is much more likely to win $\$0$ than anything else.
Though some people win a great deal of money, most of the 375,000 tickets sold result
in $\$0$ in winnings, so the average winnings will be fairly low as well.
To get a better idea of average winnings, we can weight the each value by its probability. This is equivalent adding the individual ticket values
and dividing the sum by 375,000. Since three tickets are worth
$\$1,000,000$, five tickets are worth $\$100,000$, 500 tickets are worth $\$500$, and 374,492
tickets are worth $\$0$, on average, a person who plays the VA lottery wins \(\frac{(3*1000000)+(5*100000)+(500*500)+(374492*0)}{375000} = 10\).
The mean found by summing outcomes weighted by their probabilities is called the "expected value" of the experiment. An expected values is a long-term average of experimental results rather than a description of short-term results. Saying that the expected value of the VA lottery winnings is $\$10$, does not mean that you should expect to win $\$10$ if you purchase a ticket. In fact, none of the tickets is worth $\$10$. Instead, the expected value tells us that if many people played the lottery (or one person played many times), we would expect them to win an average of $\$10$ per ticket. (Keep in mind that this doesn't take into consideration the cost of the ticket. When cost is accounted for, expected winnings for most lotteries and other games of chance are negative.)
Recall the probability model for the size of tires (in millimeters) in comparison to the correct size of tire at the tire company:
When a customer orders and receives a tire from this tire company, what is the expected number of millimeters that their tire will deviate in diameter from the correct tire size?
The expected value for the number of millimeters a tire will deviate in diameter from the correct tire size is -1.34 mm.
Variance
On average, how much will winnings per ticket vary?
No one will win exactly $\$10$ from their lottery ticket, most people will win nothing and a few will win a lot. We describe the variation around
the mean with the variance. The variance is a summary of the deviations of the variable values from the mean.
The $\$1,000,000$ tickets are 3 tickets that have a winning value
of 999,990 above the expected value of 10. There are 5 $\$100,000$ tickets, which are 99,990 above the
expected value. There are 500 $\$500$ tickets, which are 490 above the expected value, and there are
374,492 $\$0$ tickets, which are 10 below the expected value.
The mean of these deviations is [(3*999990)+(5*99990)+(500*490)+(374492*-10)]/375000 = 0. In fact, the mean
of the deviations will be 0 for any probability model because the positive and negative deviations cancel each other.
This is not informative. The value 0 implies that every possible value is the same.
To obtain a meaning answer, squaring the deviations prevents the positive and negative values from cancelling.
The mean of the squared deviations, the variance, is
[(3*9999902)+(5*999902)+(500*4902)+(374492*(-10)2)]
/375000 = 8,133,566.67.
The units of the variance are the squared units of the experiment. In the case of the VA lotter, ticket has an expected winning of $\$10$, with a variance of $28,133,566.67. Since the concept of "square dollars" is difficult to comprehend, it is usual to report the square root of the variance, the "standard deviation." The this is an indication of how much any one outcome of an experiment will vary from the expected value, on average. For a variance of $28,133,566.67, the standard deviation is $\$2,851.94$. The expected winnings for a VA lottery ticket are $\$10$, give or take $\$2,851.94$.
The probability model for the difference between the size of tires (in millimeters) and the correct size is:
When a customer orders and receives a tire from this tire company, what is the variance and the standard deviation for the distribution of millimeters that a tire will deviate in diameter from its correct tire size?
The standard deviation is $\sqrt{44.34}=6.66$.
The average number of millimeters a tire from the tire company will be from the correct diameter length is -1.34 mm, give or take 6.66 mm.