Try to use a computer and software of your choice if possible. Include printouts, screendumps, or photos of your results. Note that CrunchIt cannot produce back-to-back stemplots.
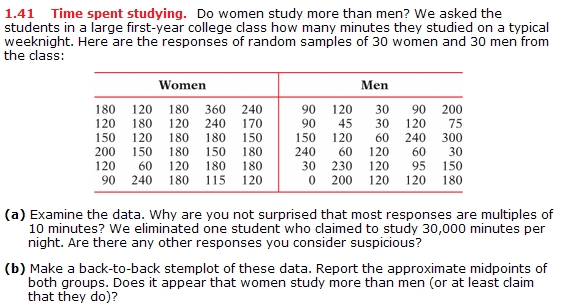
- Exercise 1.41 (2 points; data set name in CrunchIt: studytime.xls):
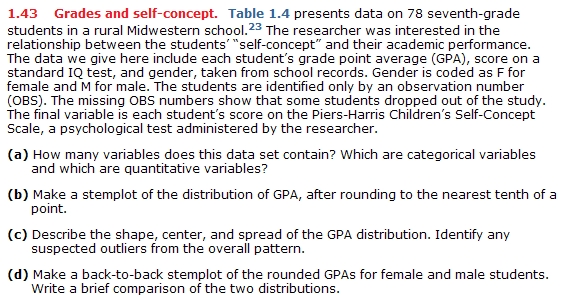
- Exercise 1.43 (4 points; data set name in CrunchIt: seventhgrade.xls):
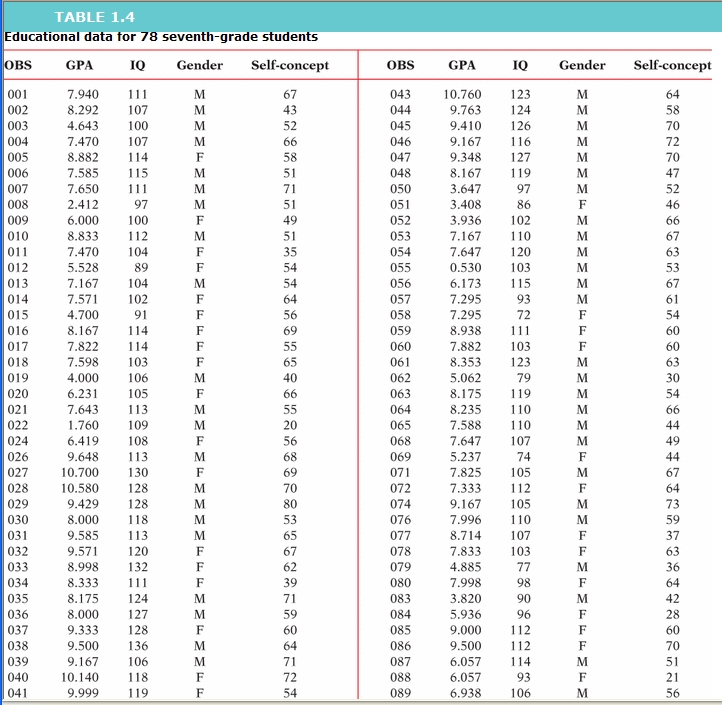
- Exercise 1.46 (1 point; data set name in CrunchIt: marathon.xls):
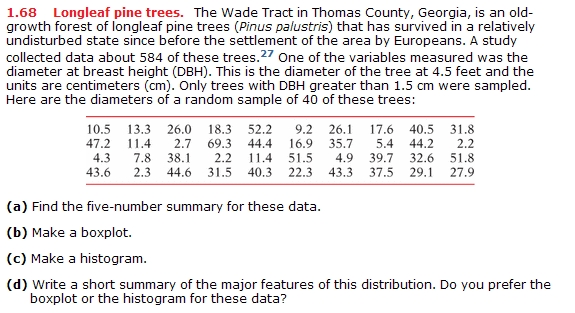
- Exercise 1.68 (4 points; data set name in CrunchIt: longleaf.xls):
- Exercise 1.72 (1 point; data set name in CrunchIt: lucky.xls):

The file http://www.math.usu.edu/~symanzik/teaching/2012_stat2000/Yellowstone_2001_2010.csv was created from data accessible at the US National Park Service (NPS) web site at http://www.nature.nps.gov/stats/park.cfm. This file contains the total monthly number of visitors at Yellowstone National Park (NP) over a 10-year period (i.e., 120 months) from January 2001 (MonthSeq = 1) through December 2010 (MonthSeq = 120).
Try to use a computer and software of your choice if possible. Include printouts, screendumps, or photos of your results.
(a) Make a histogram of the number of "Visitors" and describe the pattern and any striking deviations that you see. Create meaningful titles and labels!
(b) Make a time plot of the number of visitors and describe its pattern in terms of long-term trend and seasonal variation (if any of these is applicable). If you work with CrunchIt, then use "Visitors" for "Data" and "MonthSeq" for "Labels". Create meaningful titles and labels!
(c) Which of these two plots is better suited to explain the number of visitors at Yellowstone NP from 2001 through 2010? Justify your answer.
Revisit the "Mean and Median" applet at http://www.math.usu.edu/~schneit/CTIS/MM/. Increase the number of columns to 20. Then create the following plots and include printouts, screendumps, or photos of your results:
(a) A plot that consists of at least 10 observations where the mean is at least 3 bigger than the median.
(b) A plot that consists of at least 10 observations where the mean and the median are exactly the same, but the plot is not perfectly symmetric (i.e., the left and right sides may be similar, but they can't be exactly the same).
(c) Calculate the exact values for the mean and the median for your two previous plots. Show your calculations. Note that all of your values are whole numbers in the range from 1 to 20 (as you were asked to increase the number of columns to 20).
(d) Now select the option "Identify window" from the "Menu" choice on the upper left side of the plot window. Use the data from "Test Scores". Find a plot each where the orange triangle relates to one of the four possible outcomes, i.e., one plot where the orange triangle marks only the mean, one plot where it marks only the median, one plot where it marks both, and ont plot where it marks neither. Include printouts, screendumps, or photos of your results.
(e) As in (c), calculate the exact values for the mean and the median for your four previous plots. Show your calculations.
Download the additional pdf and solve the five sums for the homework part from hw02_sums_order.pdf
Download the additional pdf and solve the six sums for the Recitation Problems part from hw02_sums_order.pdf
Each week, several students will be given the opportunity to present their answers to some of the RPs to the other students in a recitation session. Depending on the length, difficulty, and correctness of your presentation, you may be awarded up to 3 bonus points each week. We will try to give as many students as possible an opportunity to present their answers. However, there is no guarantee that in a particular week you will be among the students who can present their answers.