- Exercise
3.17, 3.18, 3.19,
3.25, 3.27, 3.28,
3.30, 3.32, 3.35, 3.46,
3.52, 3.53, 3.54
Note: Always use Table B from the textbook at the specified line (even if the question states that you could use software or Table B)!
A past student created a two-way table for gender and grade level for his Stat 2000 course via StatCrunch, but completely forgot to annotate this table. Can you help this student?
- (i) What is the total number of students in this Stat 2000 course? Circle the value!
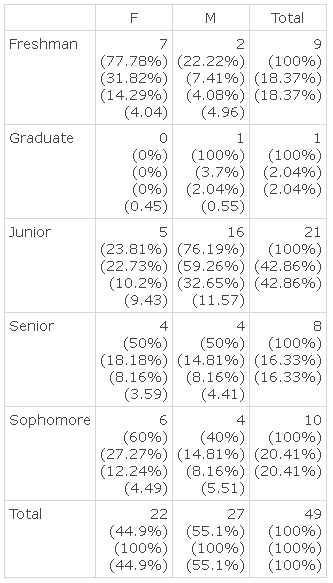
- (ii) Which percentages make up the joint distribution? Circle all of them!
- (iii) Which percentages make up the marginal distribution for grade level? Circle all of them!
- (iv) Which percentages make up the conditional distribution for gender, given that a
student is a Junior? Circle all of them!
Is there a relationship between gender and wearing shorts? We want to answer this question using data from the Fall 2015 semester of Stat 2000 and the statistical variables Gender and WearingShorts from this data set.
The file http://www.math.usu.edu/~symanzik/teaching/2017_stat2000/Survey_F2015_Population.xlsx contains in-class survey data for the students in the Fall 2015 Stat 2000 class.
- (i) First construct the two-way table where Gender is the row variable and WearingShorts is the column variable. Include a copy of this table.
- (ii) What is the marginal distribution of WearingShorts? Answer this question in 1 or 2 sentences.
- (iii) What is the conditional distribution of WearingShorts, given that Gender = F? And what is the conditional distribution of WearingShorts, given that Gender = M? Answer this question by contructing two separate bar charts. You could make use of the "Where:" or the "Goup by:" options in StatCrunch. Make sure to switch to percentages, rather than using counts. Also, use the same scales for the y-axis in your bar charts.
- (iv) So, is there an obvious difference how male and female students have been wearing shorts at thet start of the Fall 2015 semester? Answer this question in 3 to 5 sentences. You should compare the marginal distribution with the two conditional distributions.