Route Calculations using ArcGIS Pro Networking tools and some advanced geoprocessing
Overview
In this scenario, the BLM has decided they want to create 10 random study sites for data collection in western Utah. In order to get a good, unbiased distribution of sites, they’ve decided to hire you for your powerful ArcGIS Pro skills to create those random sites, then route the most efficient path between the sites and calculate travel time for the field crew. You will also generate directions for them as they are pretty helpless.
Here’s a brief overview of the steps you’ll take.
Challenge yourself to complete the bolded steps without the detailed instructions!
- Start with 1000 randomly generated points within the area of interest
- Final plots must be will have a half kilometer diameter
- Select the sites that are fully within BLM land
- Sites must be within 500 meters of a road
- Sites must be at least 100 meters away from a road
- Further reduce to remove sites that are near municipalities
- From the remaining suitable locations, generate a random subset of 10 sites
- Use Network Analysis to map the most efficient route, calculate total driving time from and back to the nearest BLM field office
- Oh, and don’t forget the driving instructions
Provided data:
- AOI.shp (Belmont)
- LandOwnership.shp (https://gis.utah.gov/data/cadastre/land-ownership/)
- Municipal Boundaries (https://gis.utah.gov/data/boundaries/citycountystate/)
- Utah Street Network Analysis (https://gis.utah.gov/data/transportation/street-network-analysis/)
- Road_network
- This is a complex dataset that has been retrieved and clipped down to the area of interest for you.
Let’s get started!
These instructions are detailed for review purposes. Later instructions will not include this level of detail.
Create a geoprocessing_outputs folder on your local drive.
Download and unzip the data file from Canvas into your geoprocessing outputs folder.
Start ArcGIS Pro, then:
- Under New, click the Map template.
- In the Create a New Project window, for Name, type Geoprocessing.
- For Location, browse to and choose your Geoprocessing_Outputs folder.
- Uncheck Create a new folder for this project and click OK.
Add the data provided to you.
Turn off the visibility of all map layers except the AOI (area of interest) polygon.
This lab serves as a refresher for the Advanced GIS course at USU. These step-by-step reminders won't be included going forward.
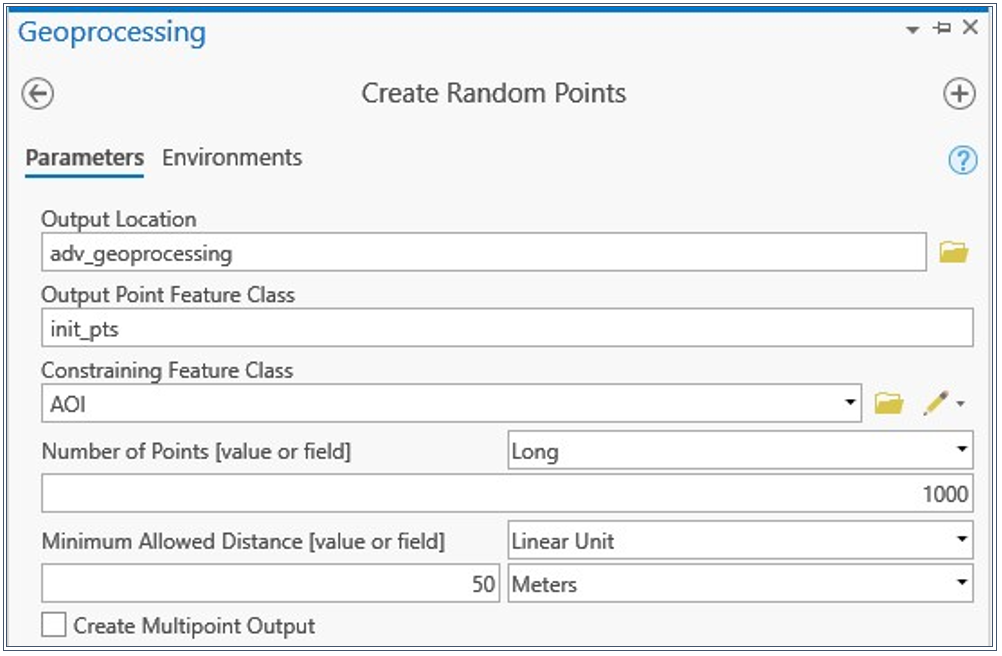
Step 1: The first step is to create the initial random site locations within area of interest (AOI).
Use the tool “Create Random Points”
From the Analysis tab, in the Geoprocessing section choose Tools to open the geoprocessing search window.
- Use this tool to create 1000 random points distributed within the area of interest polygon.
- The first parameter is asking you for the name of the folder to which you will save your points.
- Browse to your files and create a new folder called “output_geoprocessing” or something along those lines. This will serve as the folder for all the data you will be creating in this exercise.
- Remember: No spaces in the folder name!
- Second parameter is the name for your new point file. Keep it simple.
- Suggestions: “Init_pts” “onek_pts” “points”
- Third parameter is the constraining feature. Add the AoI polygon here.
- Number of points = 1000 points
Run
Step 2: Select points on BLM land
Steps in brief:
- Select BLM polygons
- Buffer 50 meters inside
- Select points within the slightly decreased BLM area
Thinking ahead, we know the 500 meter diameter sites need to be entirely on BLM land, so let's decrease the area of the BLM land by 50 meters to make sure we are moving foward with a suitable area.
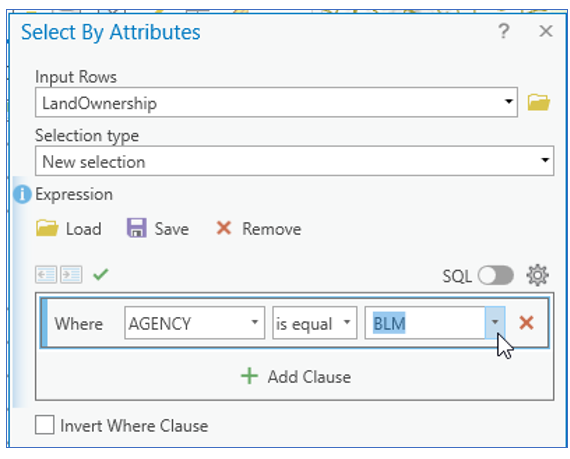
First: Select BLM polygons
Open the attribute table for LandOwnership.
Open Select by Attribute in the table.
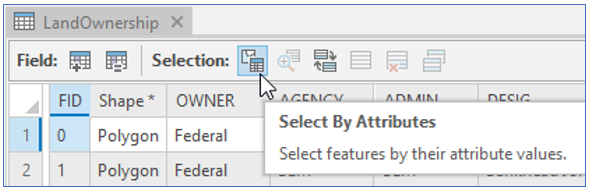
Create a new expression where Agency = BLM
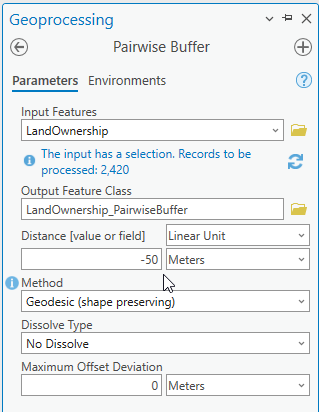
Second: Buffer inside the BLM selection
Open the Pairwise Buffer tool.
Use a negative Distance Value.
I'm choosing 50 meters for an inside buffer somewhat arbitrarily.
Evaluate the results.
Clear your original selection and zoom in.
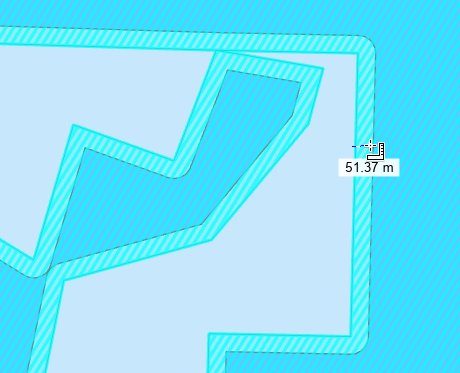
Shown below - the original BLM areas in yellow and the smaller buffered area in blue.
Third: Choose the points that fall within the reduced BLM area.
There are many ways to do this:
- Select by Location
- Clip
- Intersection
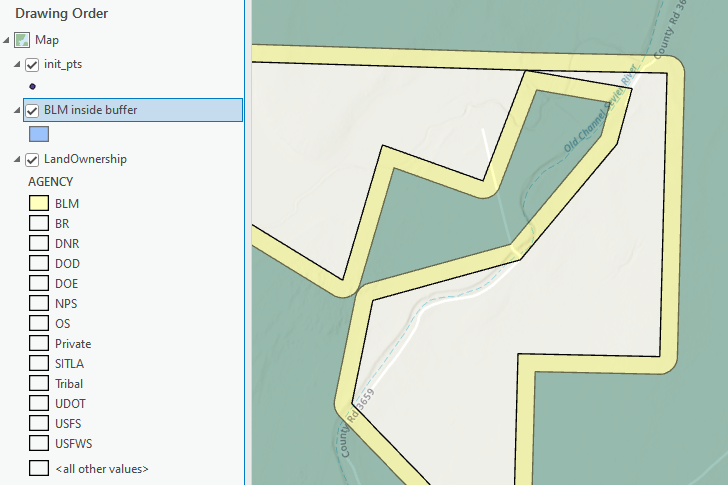
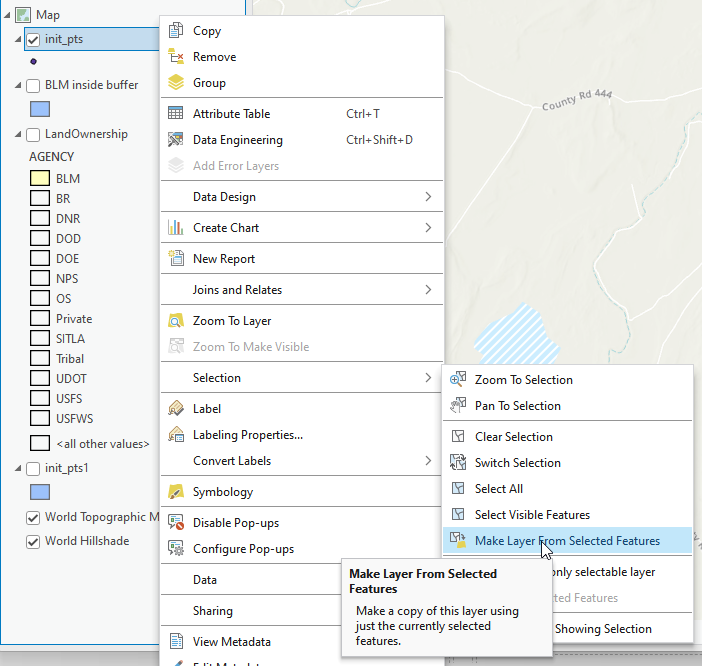
If you use Select by Location, create a layer from the selection.
Evaluate the selection by:
- Opening the 1000 point attribute table and identifying how many points are selected
- Zoom and panning around the map to see if the points are indeed sitting on BLM land.
- Turn off visibility of competing layers so you can really see what is going on.
You now have a subset of random points within BLM land.
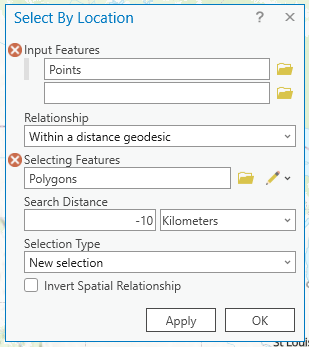
Step 3: Removing points within 100 meters of a road
Clear all selections.
Use Select by Location to select points that are within 100 meters of the roads layer (road_network_aoi)
Delete these points.
Check totals in the attribute tables to verify you are reducing the number of random points.
Step 4: Ensuring points are not near a municipality
Use the Municipal Boundaries dataset to remove any points within one kilometer of their boundary.
Step 5: Choosing a random subset of 10 site points from the remaining point
Use the Subset Features tool
- Name the Output training feature class to signify that these will be the final 10 sites.
- You don’t need to name an output test feature class
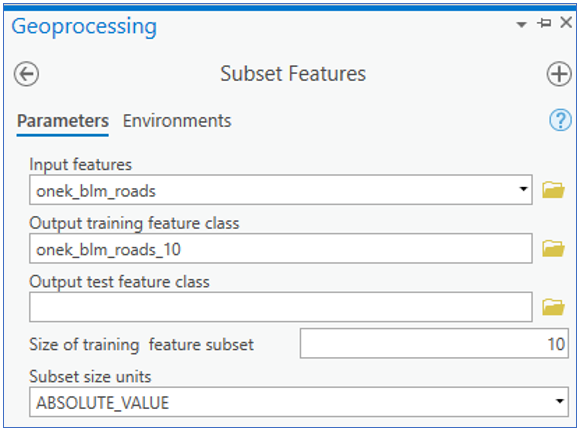
You should now have a shapefile containing 10 valid sites.
Verify that the results are correct by zooming in and measuring distances to roads, BLM boundaries, and municipalities.
Step 6: Calculate the most efficient route from the nearest BLM field office to each of the sites.
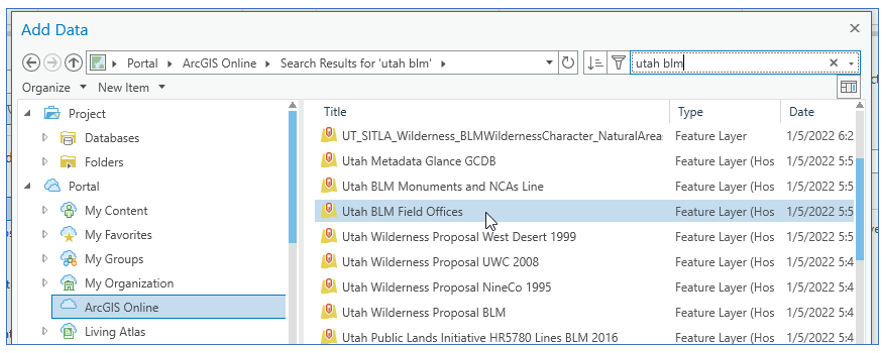
First find the location of the BLM Field Offices.
Search ArcGIS Online for “Utah BLM office"
Filter by Title. You might have to scroll to find it. You may need to adjust your search terms.
The name of this dataset may have changed. Experiment. You will know you have the right data if you have points representing BLM field offices in Utah.
Add Data button:
Inspect the locations and find the nearest field office to the area of interest.
Notice there is an office in Fillmore, on the east side of the AoI.
Merge the field office into the site locations layer
Select the Fillmore field office point on the map or from the attribute table.
With that BLM field office point selected, you can Merge the two point datasets.
Run the Merge tool and merge this point with your 10 sites points.
You are doing this so that the field office is in the same dataset as the site locations and can be included in your network routing calculations.
You CAN merge them because the geometries are the same (point and point).
Create an Extra Field Office Point so it can be the First and Last stop
We eventually want to create a Loop route.
The only way I know to do this (at the time of writing this) is to add a point next to the BLM Field Office Point. One point will serve as the starting point and one point will serve as the end point of our loop route.
We will number the points to indicate the start and stop points.
Use the Edit tools to add a second point next to the field office.
Edit tab > Features section, press Create to open the Create Features window.
Select the merged point file (the one with your final 10 sites and the Fillmore field office location).
Click on the map next to the Fillmore field office point to add the second field office point.
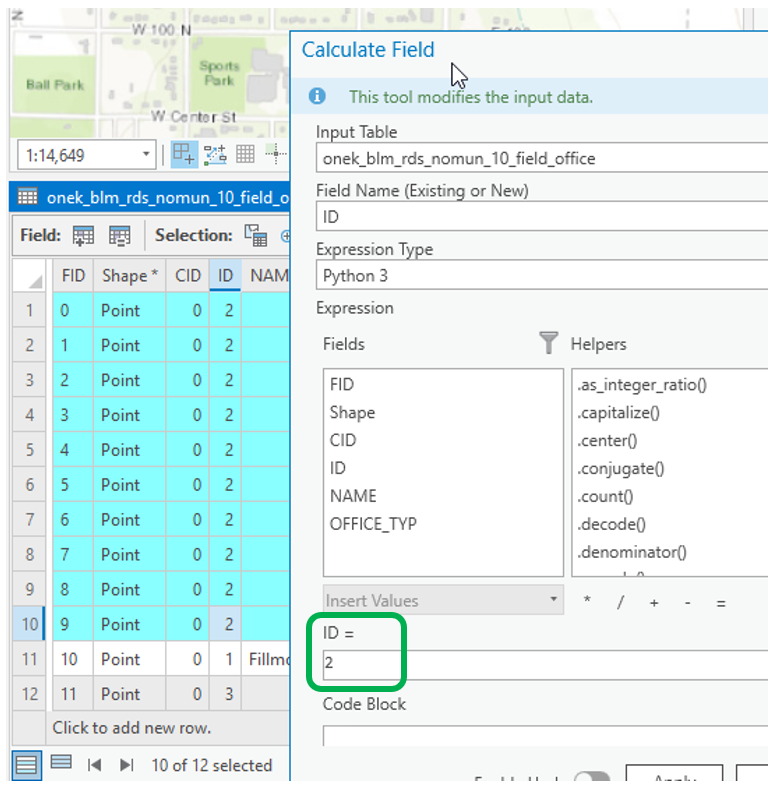
Create ID values you can use to sort the locations to ensure the field office is both the first and last stop.
Open the attribute table to edit the ID field.
If you don't have an unpopulated ID field, use the CID field or add a new field that you can populate with integers.
In the field, enter “1” for one of the field office points and “3” for the other field office point.
1 is the starting point and 3 is the ending point.
The remaining points should remain unranked but should fall numerically between the first and last stop. So assign then all “2”. That way the Route tool can choose the best order to connect the stops.
Shortcut: Using the shift key highlight the remaining 10 points.
Right click on the ID field header > Calculate Field.
Set the Field Name to ID and enter “2” in the parameter window like you see in the image below.
SAVE ALL EDITS
(...not the Project, the Edits)
Route Tool
Use the Route tool in the Network toolset to create an efficient path between sites.
In the Analysis tab, Workflows section, click the Network Analysis drop down, choose Route:

Also, verify that you are signed in.
ArcGIS Pro creates a Route analysis layer with a suite of sublayers that will be used to structure your inputs and outputs.
In the Contents pane, click Route to select the group layer.
Route Layer appears as a new Tab at the top of ArcGIS Pro.
Click Route Layer to see the tab's controls.
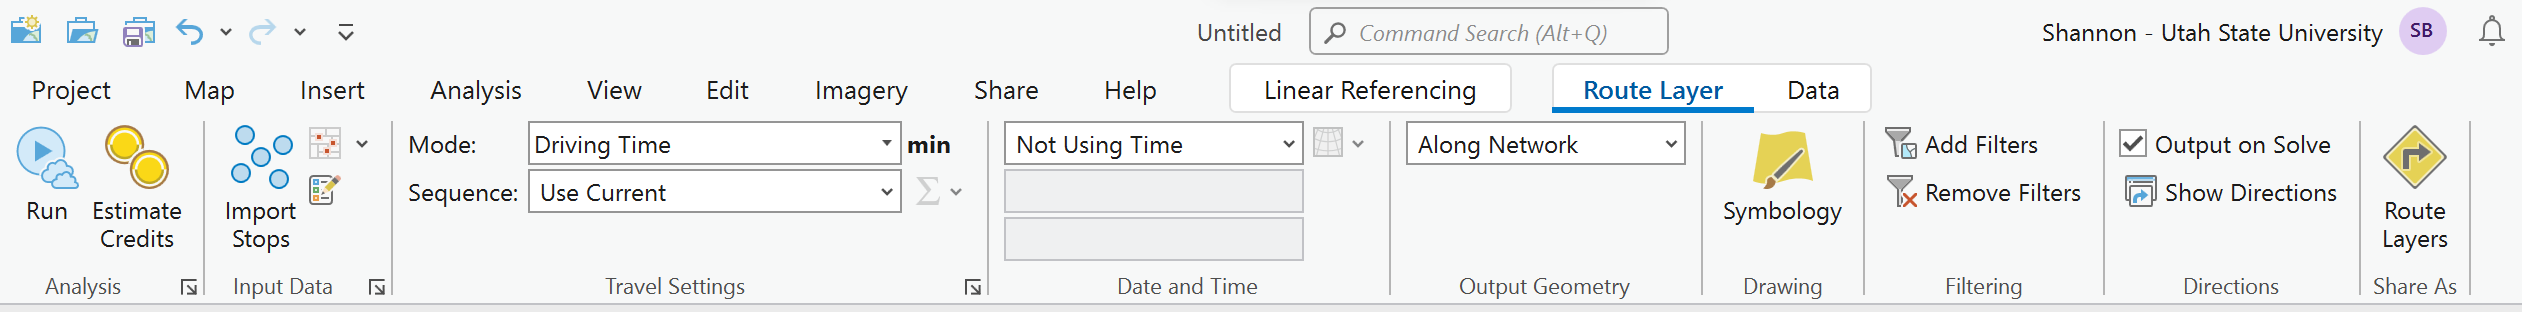
You will use these controls to define the route you want to generate.
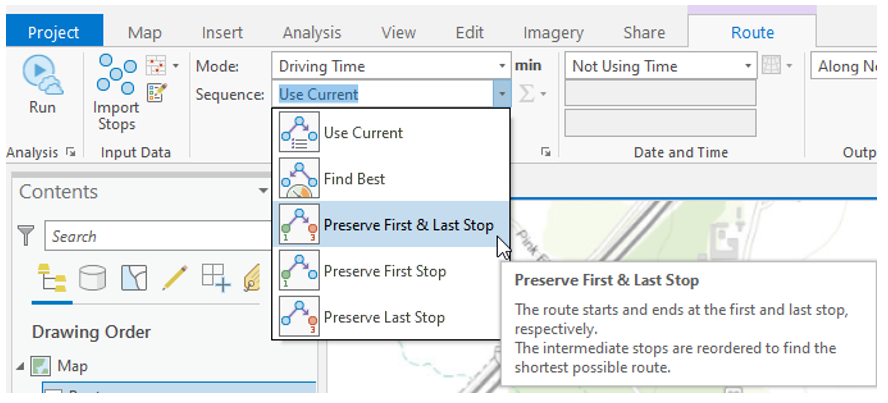
In the Travel Settings section, Set the Sequence to Preserve the First & Last Stop
Create stops
Think of a stop as a point you need to visit along a journey. The route solver finds the optimal path through the network, connecting the stops you designate.
Set your final sites (plus BLM Field office points) layer as the Input Data for the Route.
Press the Import Stops button:
- The Input Network Analysis Layer is filled for you.
- The Sub Layer is filled for you.
- You designate the Input Locations as your 12 points layer (final sites + BLM office points).
- Change the Field Name to the field containing your 1, 2, 3 attribute designations for the stops.
- In the Advanced settings, set the Sort Field to the same field containing the 1, 2, 3 attribute designations.
Ok to finish adding stops.
Run the Network Analysis
On the Route Layer toolbar, in the Analysis section, click Run to process the analysis.
Note: the Network Analyst requires use of Credits.
Verify your results. Is it a loop?
The results show the fastest path through the network, connecting all the stops you created.
Open the attribute table for the Stops.
Notice which field provides the order for the stops
Note:
To run the Route tool again, you need to create a New Route.
(Analysis tab > Network Analysis > Route)
Label the stops with their route order.
Try to do this without instructions.
But here are the instructions:
- Select Stops in the Contents pane.
- Select Labeling (new tab above the toolbar).
- Layer section: click the label button to label this layer.
- Label Class section: Change the Field to the field in the stops attribute table that contains the numbered order for the stops.
- Visibility Range: remove any limitations
Submission:
Clean up your map by turning off unnecessary input layers.
Take a screenshot of your labeled route for submission.
Your results will of course be different:
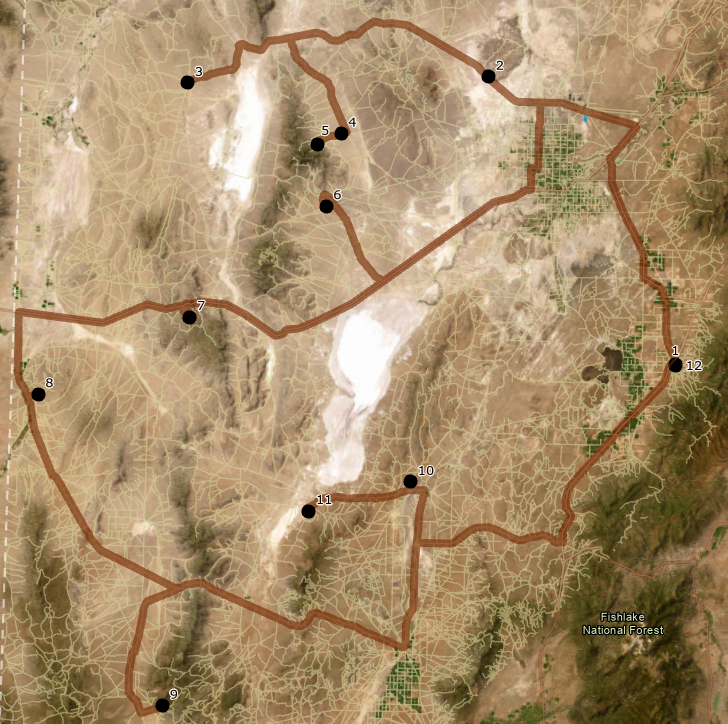
Look closer at stops 4, 5, and 6.
The Route was optimized by back-tracking to the north and driving around to reach stop 6 even though there is a road available:
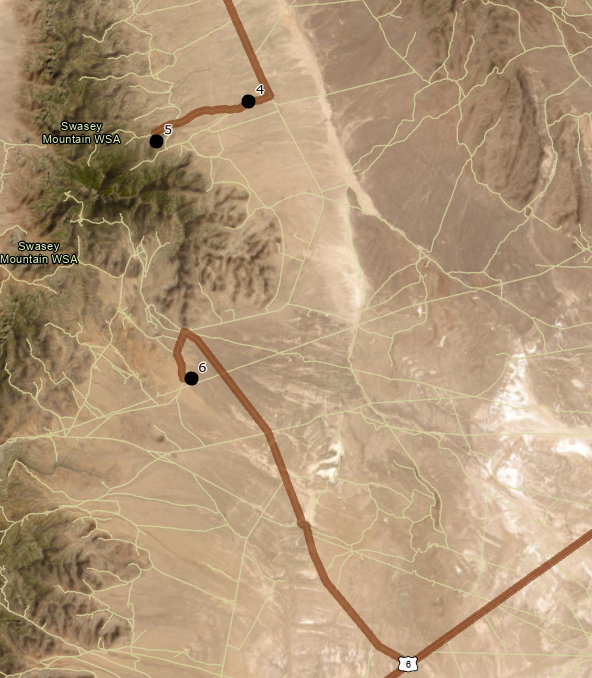
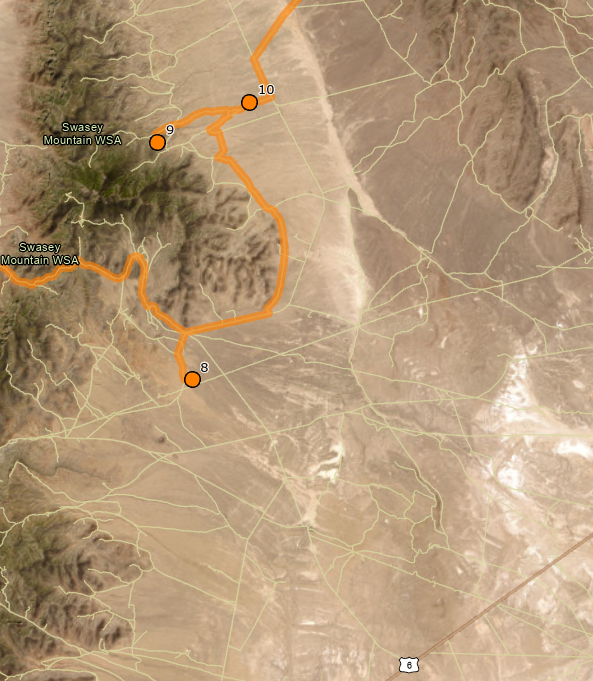
I created a new route and changed the Travel Settings to Mode: Rural Driving Distance and produced a route that utilized the rough road available between stops 4/5 and 6. (The route sequence was changed as well - indicated by the new stop numbers.)
Determine drive time and directions
From the Route Layer tab, Directions section, press Show Directions.
Scroll to the bottom of the directions to find the total time and distance calculations:
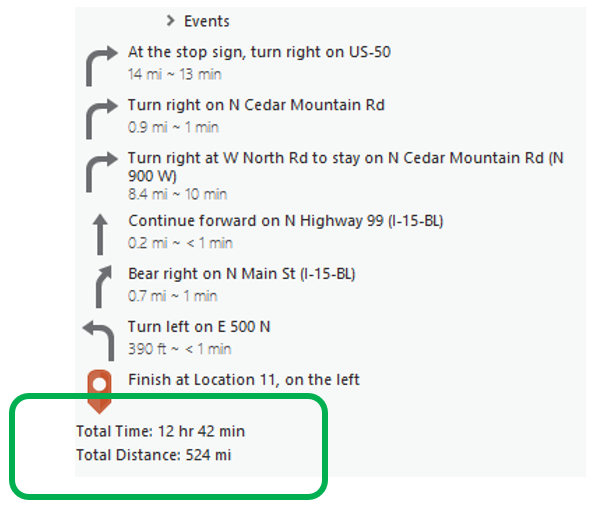
What to Submit
- Screenshot of your final loop route with stops labeled in order of driving sequence.
- Screenshot of the Total Time and Total Distance from the Directions window (similar to above)
- In your own words, demonstrate your understanding of the workflow
- How do you know the critical steps 'worked'?
- Specific examples of how you were evaluating yourself along the way.