Correlation
From the scatter plot of heights and speeds of roller coasters, it is clear that there is a strong relationship between these variables. As the height of a coaster increases, the speed tends to increase as well. The relationship between height and speed could be summarized with a straight line.

Association
An association is a relationship between two variables. We say that variables are associated
if knowing something about one of the variables tells us something about the other.
For instance, there is an
association between the amount of time students spend studying and the scores they get on their tests. This association
is positive, meaning that as the study time increases, scores also tend to increase, however, it's not perfect.
That is, a student's study time does not tell us exactly what score they'll get on a test nor do the students who study
most always get the highest scores.
- Weight and circumference of a grapefruit.
- The amount of time a person spends per day reading and the amount of time they spend watching TV.
- The amount of garbage generated by side-by-side houses.
- The amount of garbage generated by randomly selected pairs of houses.
Correlation
Correlation, ρ, describes a linear relationship between two variables, that is, the extent
to which the relationship can be summarized by a straight line. Correlation is estimated from a sample by computing the
correlation coefficient, r. The correlation coefficient indicates both the strength and the direction of the linear relationship
between two variables.
r varies between -1 and 1. |r| = 1 indicates that the points in the scatterplot fall precisely along a straight line. |r| close to 1 indicates
a strong relationship between the variables.
r ≈ 0 when there is no linear relationship between the variables.
Since the relationship between two variables is not affected by the way they are plotted, interchanging the explanatory and response variables does not affect the value of r.
Click on the applet on the right to create a scatterplot. The applet will display the value of the corresponding
correlation coefficient.
How many ways can you find to do the following? Can you do them with points that are close together and also with points that are far apart?
- Create a plot for which r < 0.
- Create a plot for which r > 0.
- Create a plot for which r = 1.
- Create a plot for which r = -1.
- Create a plot for which r ≈ 0.
- Create a plot for which r ≈ 0.5.
Computing the Correlation Coefficient
The correlation coefficient, $r$, is also known as the Pearson Product Moment correlation coefficient. 'Moment' refers to a mean. The product moment correlation coefficient is computed by finding the mean of the products of the standarized values of the x and y coordinates of each point, denoted $(x_1,y_1), (x_2, y_2), \ldots, (x_n, y_n)$. It is usually computed with software.
Later Harry Potter books tend to be long than earlier ones. What is the correlation between book order and book length?
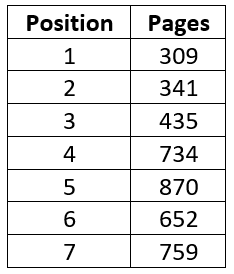 Position: mean = 4 and sd = 2
Pages: mean = 585.7 and sd = 205.8.
To compute the value of the correlation coefficient:
- Standardize each value by subtracting the mean and dividing the result by the standard deviation, e.g. (1-4)/2 = -1.5 and (309-585.7)/205.8 = -1.34.
- Take the product of the standarized values across each row, e.g. (-1.5)(-1.34) = 2.01.
- Find the mean of the products of the standardized values.
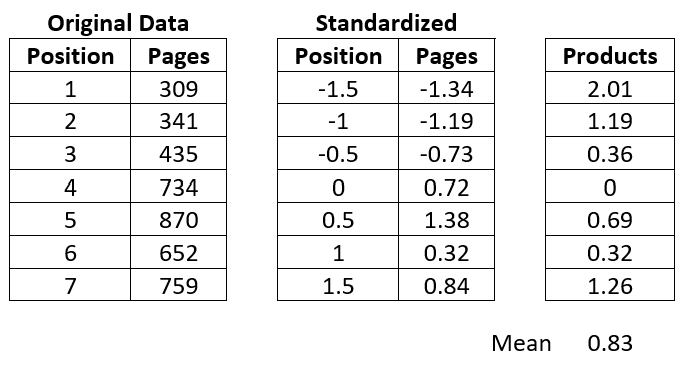 The value of the correlation coefficient is 0.83.
A common, equivalent, formula for $r$ is shown below.