Linear Regression
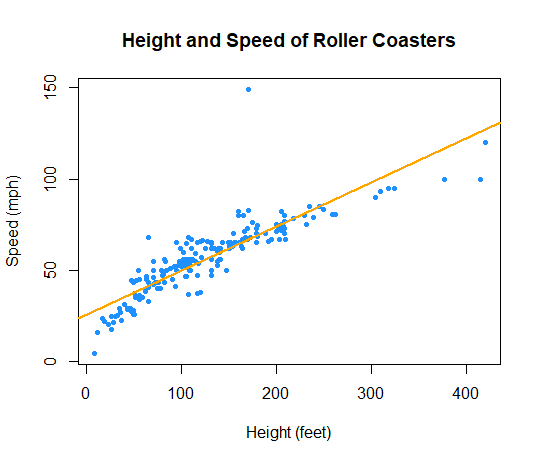
A linear relationship between variables can be summarized with a straight line. Such a line can be used to relate the values of the explanatory and response variables and address questions such as, "how fast would a roller coaster be expected to go that is 150 feet tall?"
A height of 150 feet corresponds to a speed of 61.7 mph on the line.
Click the button below to show how to use the line to estimate the speed of a roller
coaster that is 150 feet tall.
The process of fitting a line to bivariate data is called linear regression. There may be several lines that appear to summarize a linear relationship well. The line that is used for linear regression is called the least squares line
Linear regression is the method of modeling a relation between two variables with a line.
The Least Squares Line
The 'Least Squares' line is found by minimizing the total squared vertical distances from the points to the line.
Applet Instructions:
- Drag the blue points to adjust the data in the scatterplot.
- Drag the orange points to adjust the line.
- Use the checkbox to show the squared errors.
- See if you can find the line that minimizes the squared errors.
- Show the Least Squares Line to check your results.
The least squares line is written as \[y=\beta_0+\beta_1x\] where $\beta_0$ is the y-intercept and $\beta_1$ is the slope of the line.
The Slope of the Least Squares Line
The slope of the least squares line indicates how much, on average, the value of the dependent variable changes for a 1 unit increase in the value of the independent variable.
Height: mean = 123.7 feet, sd = 67.8 feet
Speed: mean = 55.4 mph, sd = 18.7 mph
r = 0.88
Find the slope of the least squares line for estimating a roller coaster's speed from its height.
\(\begin{array}{rcl} \beta_1 & = & r\times \frac{sd_y}{sd_x}\\ & = & 0.88\times\frac{18.7}{67.8}\\ & = & 0.24\end{array}\)
For every one foot increase in height, speed increases by an average 0.24 mph.
The Intercept of the Least Squares Line
The intercept of the least squares line indicates the average value of the dependent variable when the independent variable is equal to 0. However, this is not always useful. If 0 is outside of the range of the values of the independent variable then interpreting the intercept is probablematic and may return nonsense.
Height: mean = 123.7 feet, sd = 67.8 feet
Speed: mean = 55.4 mph, sd = 18.7 mph
r = 0.88
Find the intercept of the least squares line for estimating a roller coaster's speed from its height.
\(\begin{array}{rcl}\beta_0 & = & \bar{Y}-\beta_1\bar{X}\\ & = & 55.4 - 0.24*123.7 \\ & = & 25.712\end{array}\)
Interpreted literally, the estimate of the speed of a roller coaster that is 0 feet tall is 25.712 miles per hour.
All roller coasters have at least some height so this estimate doesn't make much sense. In this case, the intercept can be viewed as simply an anchor for the regression line.
$\beta_0 = 25.712$
$\beta_1 = 0.24$
Find the equation for the least squares regression line.
\(\begin{array}{rcl}y & = & \beta_0+\beta_1x\\ y & = & 25.712 + 0.24x\end{array}\)
Estimation
The regression line can be used to estimate the value of the response variable for a given value of the explanatory variable.
As shown above, the equation for the regression line for predicting roller coaster speed from height is y = 25.712 + 0.24x. To estimate the speed of a coaster given its height, substitute the desired height in for x in the equation. For example, using the line, we'd estimate that the speed of a roller coaster that is 150 feet tall would be 25.712 + 0.24(150) = 61.7 mph.
Click the button below to show how to use the line to estimate the speed of a roller
coaster that is 150 feet tall.
Cautions
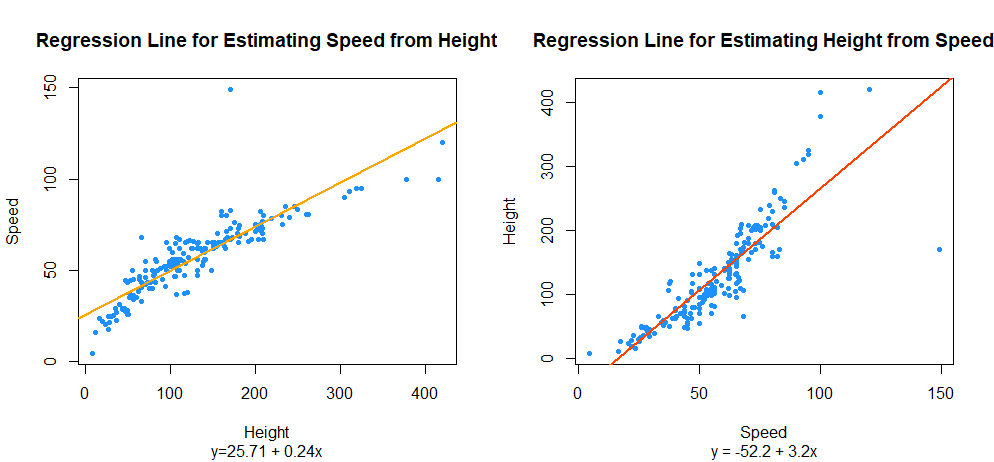
Two Regression Lines
The regression line used to estimate y from x CANNOT be used to estimate x from y. That is, the line for estimating the speed of a coaster from its height cannot be used to estimate the height of a coaster from its speed. To estimate height from speed it would be necessary to construct a new line.
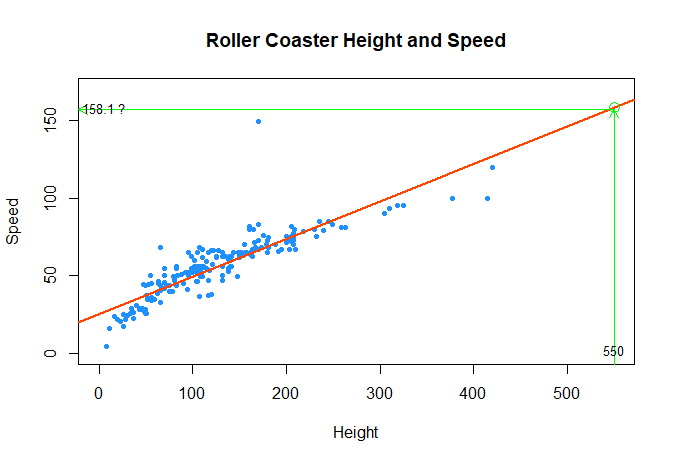
Extrapolation
The regression line should not be used to estimate values of the reponse variable for values of the explanatory variable that are outside of the range of the observed data. The data do not tell us anything about the relationship between the variables beyond the limits of the observed values.
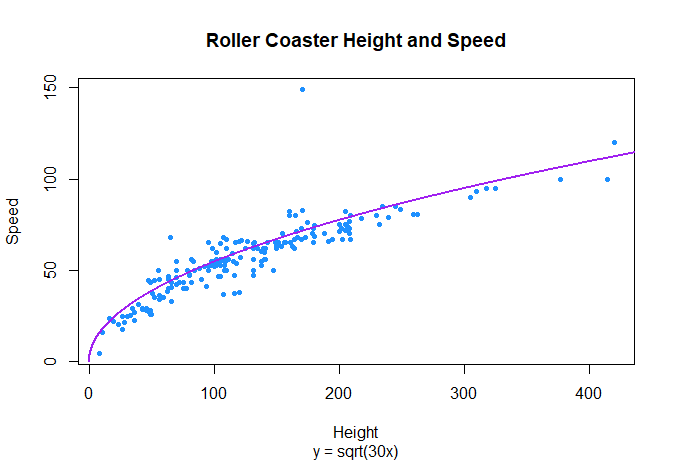
Linearity
Methods of linear regression only recognize linear relationships between variables. In the roller coaster data, though there is a strong linear relationship between the variables, the graph shows that the relationship actually has some curvature to it. It may be possible to obtain a better fit using non-linear regression.