Academics
Planetary Thinking in the Curriculum
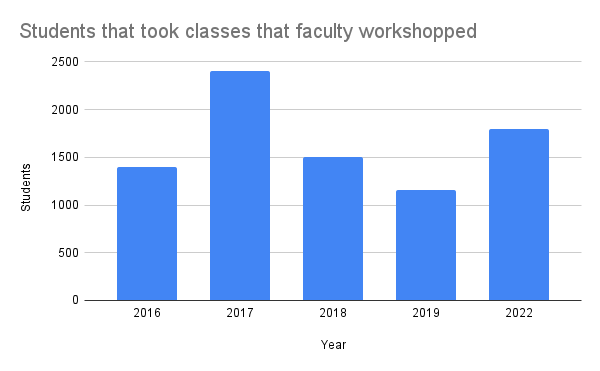
In May 2016 a group of faculty launched Destinations: Planetary Thinking in the Curriculum. This workshop engages faculty in teaching about sustainability and the UN sustainable development goals in their curriculum. Integration into the curriculum, instead of a standalone course, ensures students encounter concepts of sustainability as it relates to their field of study, therefore providing multiple touch points to the concepts throughout their time at USU.
Sustainability Courses
| Courses Offered | Undergraduate | Graduate |
| Sustainability Focused Courses | 16 | 5 |
| Sustainability Related Courses | 67 | 38 |
| Total Courses offered | 1272 | 649 |
*Taken from the 2021 AASHE Report
AASHE Report-
"75 faculty participants and 8,250+ students reached since 2016"
-
"6.56% of courses at USU are sustainability courses"
-
"47.27% of academic departments have sustainability course offerings"
Emissions
USU is committed to carbon neutrality by 2040. Carbon means that through emissions reduction and some offsets, USU will be contributing no carbon dioxide to the atmosphere.
In 2019 the faculty senate accelerated our carbon neutrality goal to 10% reduction each year until neutrality.
In the near term, by 2030 we hope to reach 30,915.25 MTCO2e (Metric Tons of Carbon Dioxide), which represents a 72% reduction from our 2018 baseline of 109,458.87 MTCO2e


How we are doing it
- Reduce Energy Usage Intensity (EUI) annually.
- Decarbonize the central energy plant by 2040.
- Launch a pilot study on EV integration in the USU fleet.
- Invest in on-campus renewables whenever possible.
- Increase the share of low-carbon transportation alternatives (carpool, bus, and non-motorized transportation) utilized by students and employees by 5% each year.
Energy
USU's energy profile is managed by USU Facilities. The way we heat and cool our buildings, and keep our lights on every day is a large part of our emissions inventory. Reducing energy use and increasing energy efficiency is essential to reach USU's carbon neutrality goals.
Big Goals
- Decarbonize central energy plant by 2040.
- Increase investment in HVAC commissioning and electrification ready technology for all current buildings and new construction.
- Procure at least 50% renewable energy for USU Logan campus by 2030.
- Assist statewide in measuring energy savings from efficiency projects.
Transportation
Transportation accounts for about 13% of USU's emissions. How can we improve this? By electrification! Tangable actions inlude investing in electric vehicles for our fleet and advocating for alternative transportation options for our students, faculty, and staff.
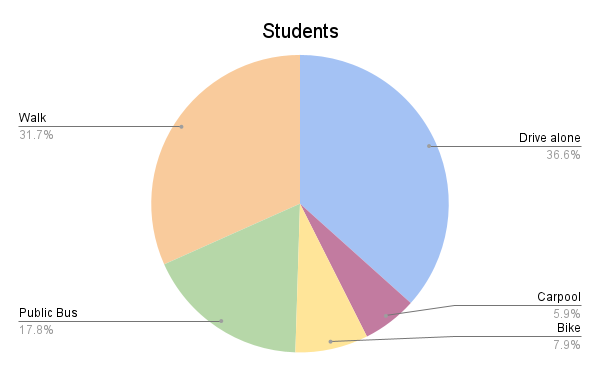
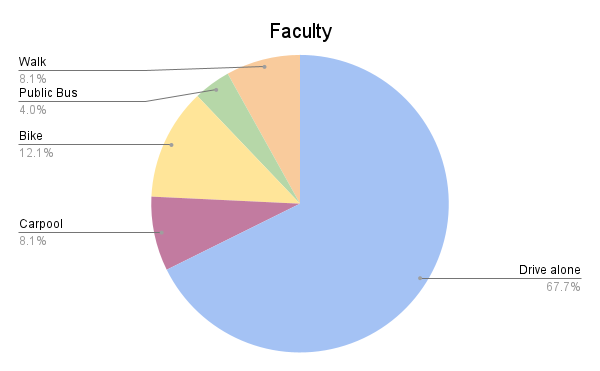

*Data from the 2019 commuter survey
35.4% of employees use sustainable transportation options, 67.6% of students use sustainable transportation options. Efforts to increase sustainable transportation include the Commuter Club, Aggie Blue Bikes, the Aggie Shuttle, and bicycle infrastructure improvements like bike lanes and covered bike racks across campus.
USU has a variety of vehicles in it's fleet. From the aggie shuttle buses to the landscaping crew vehicles, we maintain a mixture of gas, hybrid, electric and diesel options.


Waste and Recycling
The Goals
- Increase waste diversion to 35% by FY 2025 from 25% in FY 2012.
- Develop a university wide waste reduction policy.
How We're Doing
- New recycling stations were installed on campus with landfill, paper, and container bins.
- Outdoor recycling bins were installed in fall 2017.
- The university installed a commercial composter in 2015, which has been so successful that demand already exceeds capacity.
- Currently streamlining labeling across University owned and maintained buildings.
- Integrating recycling collection at the Spectrum and Stadium.
- Working with the sustainability club and COSAS on waste diversion from tailgating and during football games.

Water
USU is committed to reducing our water usage. This can be implemented with efficient building technology, like low flow toilets. USU Landscaping and Operations Maintenance (LOAM) is working to implement the Drought Resiliency Landscape plan to incorporate native and water-wise plants, and reduce traditional turfgrass to 20% (down from 60%) of campus, not including park spaces.
Over 60% of Main Campus open space is turf grass. This includes spaces like the Quad and the Library/Engineering Quad. USU is planning to replace park strips, parking areas, small disconnected spaces, shade impacted areas, and low-use landscapes away from turfgrass.
Fall 2022 Baseline Irrigation Use Calculations
| Usage Estimates | Gallons | Irrigated Acres |
| Culinary Irrigation | 63,215,110 | 72.16 |
| Secondary Irrigation | 259,742,595 | 278.18 |