2022 Report on Growth Perspectives
Data from Utah Cities on Population Growth and Economic Development
Findings from Utah Wellbeing Surveys 2019-2022
Dr. Courtney Flint, Utah State University
The Utah Wellbeing Survey is a partnership with multiple cities in Utah. The survey has been conducted since 2019, though cities have entered and left
the project at various times. There were 33 cities in the 2022 Wellbeing Survey. An additional 10 cities have participated in previous years. See Appendix A for the number of survey responses per city per year.
Two questions in the survey address population growth and economic development:
- How would you describe the current rate of population growth in [city]?
- How would you describe the current pace of economic development in [city]?
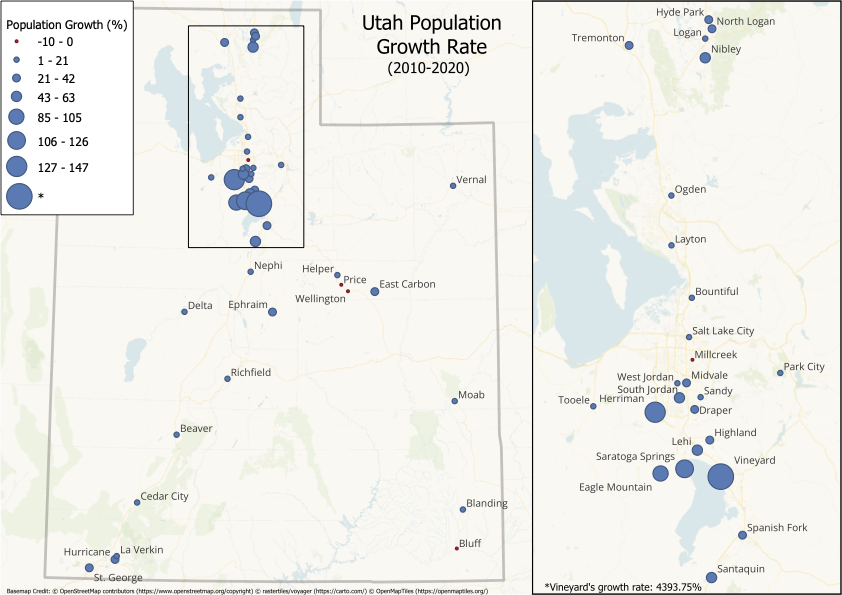
It's valuable context to consider the growth rates of Utah cities as the context for the Wellbeing Survey. The graph below shows population growth rates (2010-2020) from the US Census. Most cities are growing and some, particularly those in Utah County and south Salt Lake County, are growing very rapidly. Rural places are also generally growing, with a couple exceptions.
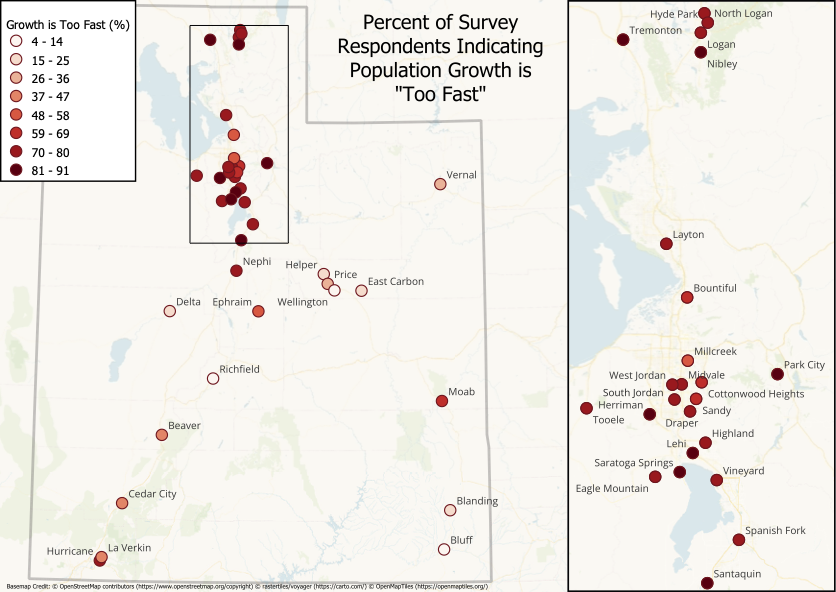
Perspectives on population growth often correspond with the measured rate of growth in cities, but not always. The graph below shows a "heat map" of perceptions that population growth is "too fast". One example of a misalignment between perceptions and measured growth is Millcreek where 49% of respondents said population growth is "too fast" but the 2010-2020 growth rate is negative. Cities in Cache Valley and Tremonton are higher on perceptions of growth as "too fast" than their measured population change might suggest.
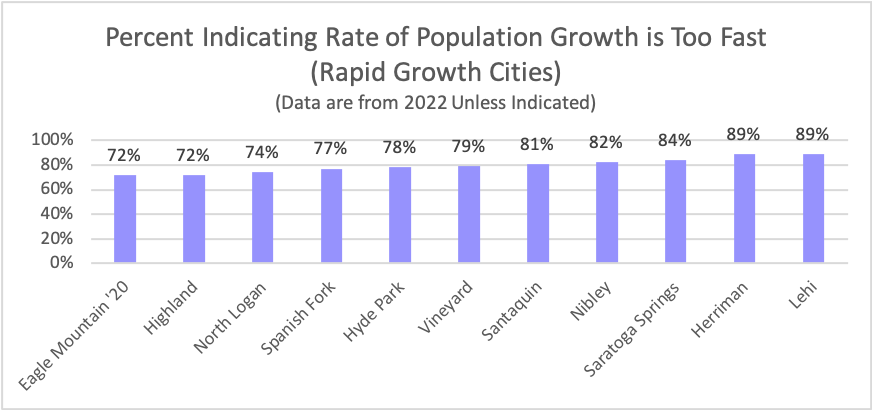
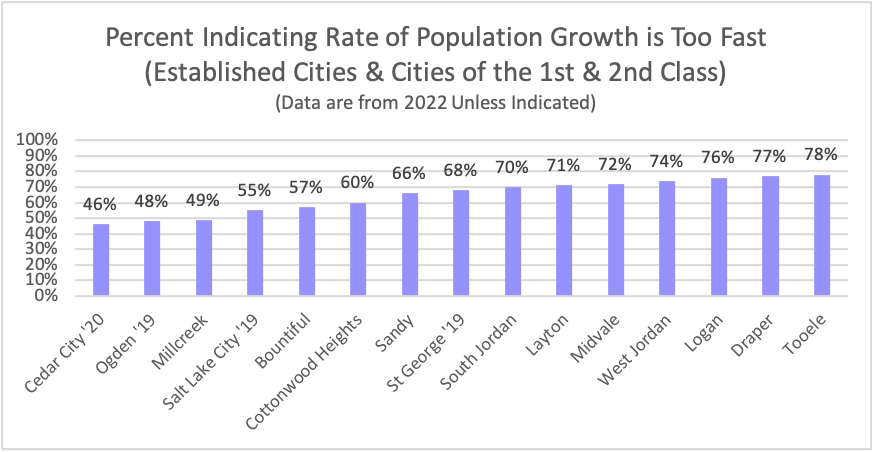
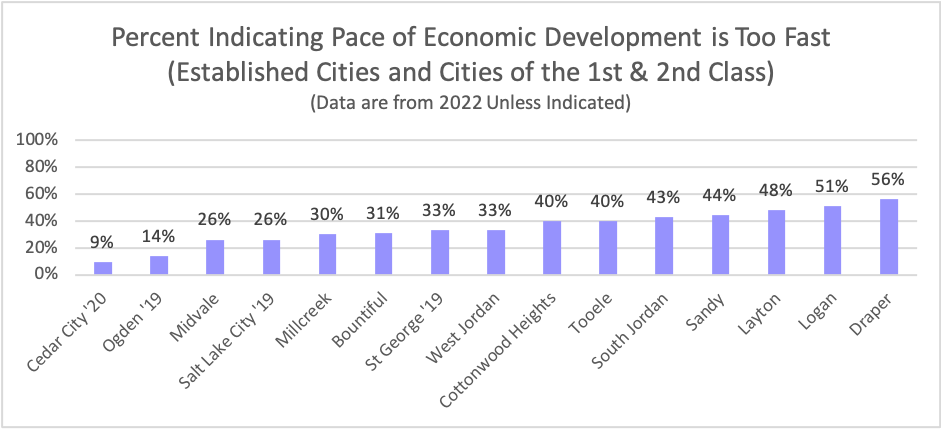
As the graphs below show clearly, for cities designated by the Utah League of Cities and Towns as Rapid Growth Cities, Established Cities, and Cities of the 1st & 2nd Class, the rate of current population growth was perceived to be “too fast” by the majority of survey respondents in most cities.
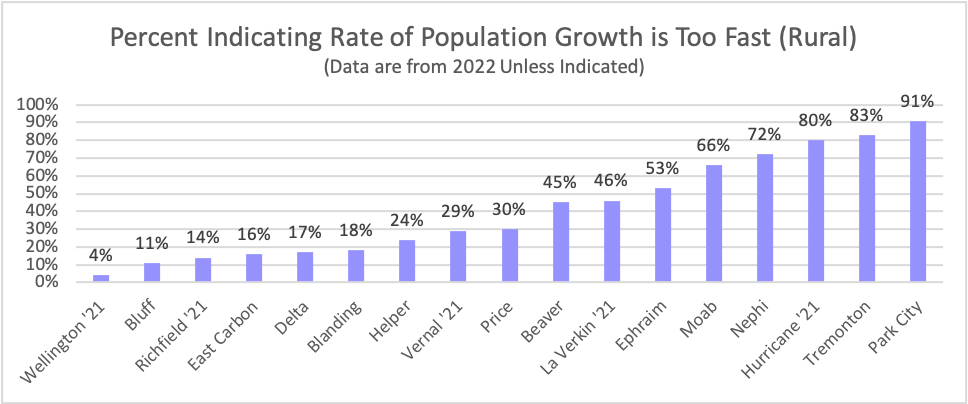
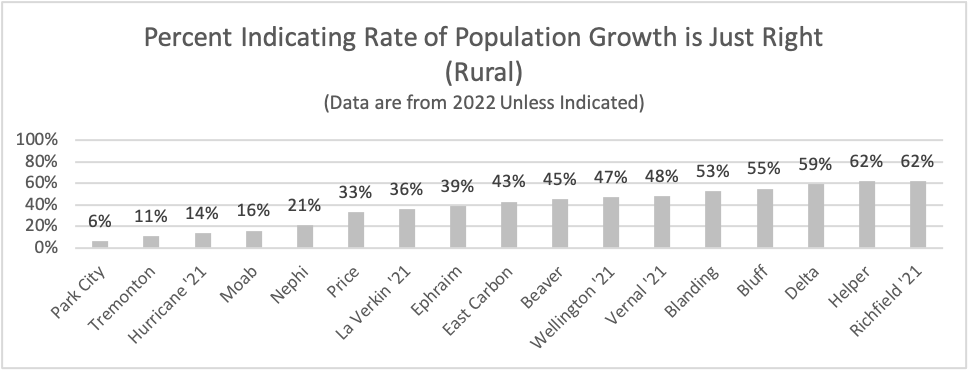
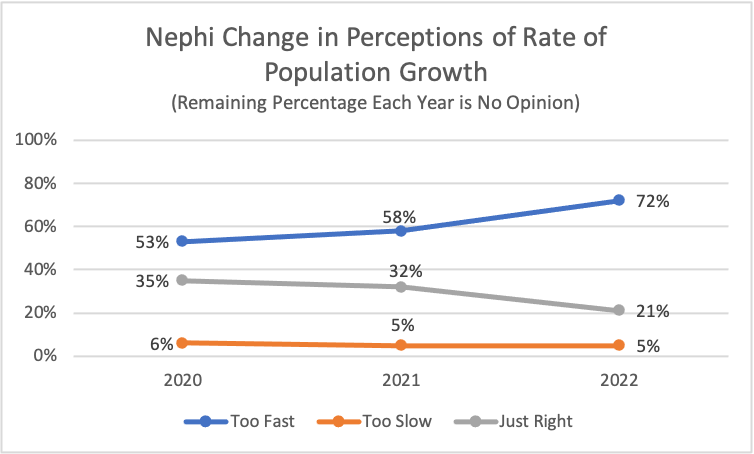
For cities designated by the Utah League of Cities and Towns as Rural Hub/Resort or Traditional Rural, there was considerably more difference regarding perceptions of population growth. For Ephraim, Moab, and Nephi, at least half of survey respondents indicated the current rate of population is “too fast”. For Hurricane, Tremonton, and Park City respondents, the percentage indicating the current rate of current population growth is “too fast” was between 80% and 91%. For respondents from Blanding, Bluff, Delta, Helper, and Richfield, over half of the survey respondents indicated that the current rate of population growth was “just right”.
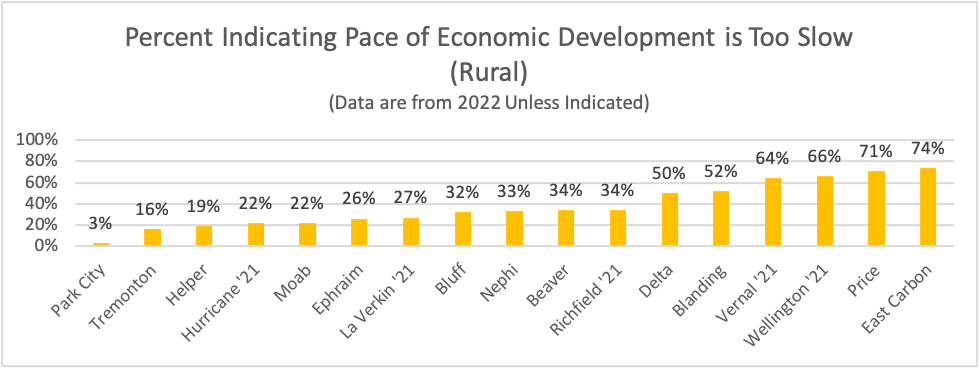
On the pace of economic development, rural communities continued to show varying perceptions. For those from Tremonton, Moab, and Park City, over
half of respondents indicated the current pace of economic development is “too fast”. Respondents from Delta, Blanding, Vernal, Wellington, Price and
East Carbon were more inclined to say that the current pace of economic development is “too slow”.
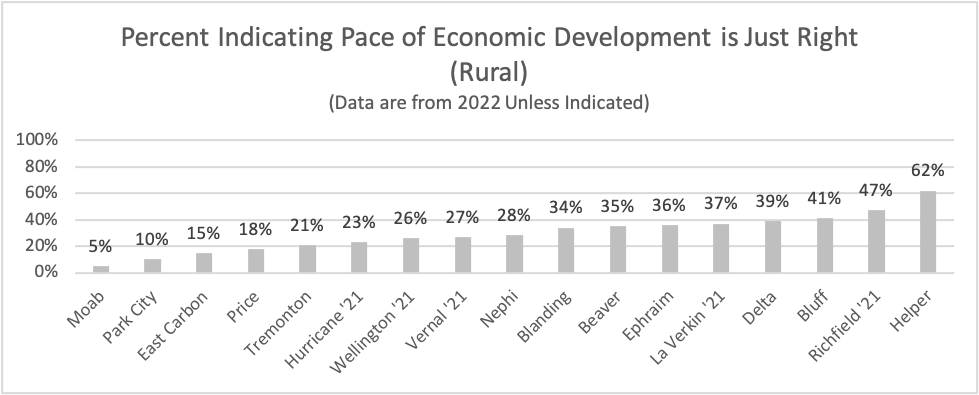
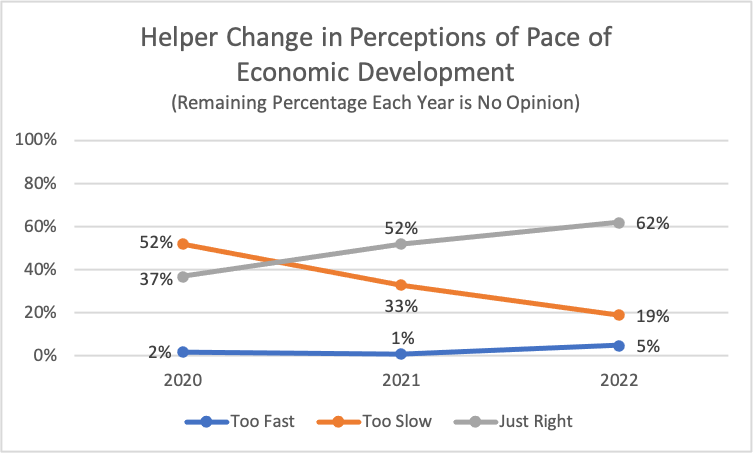
Respondents from Helper were the most likely among Rural respondents to indicate that the current pace of economic development is “just right”.
There were considerable variations in responses from respondents from Rapid Growth, Established Cities, and Cities of the 1st & 2nd Class on the question of economic development. Respondents from Lehi were the most likely to indicate that the pace of economic development is “too fast” (69%).
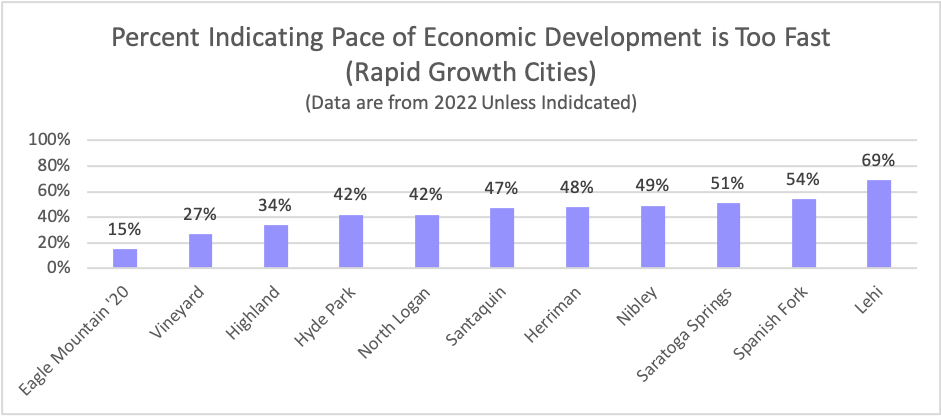
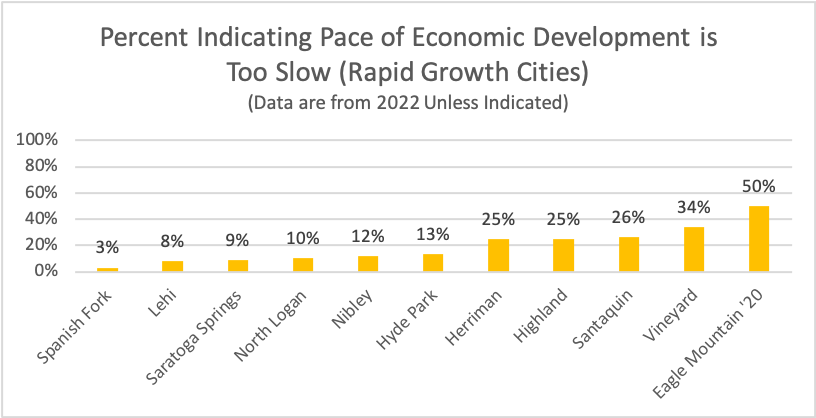
Respondents from Eagle Mountain were the most likely among those from Rapid Growth Cities to say that the pace of economic development is “too
slow”.
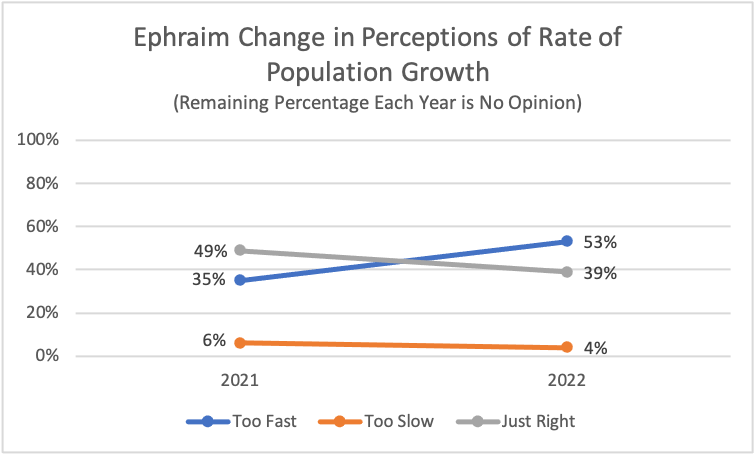
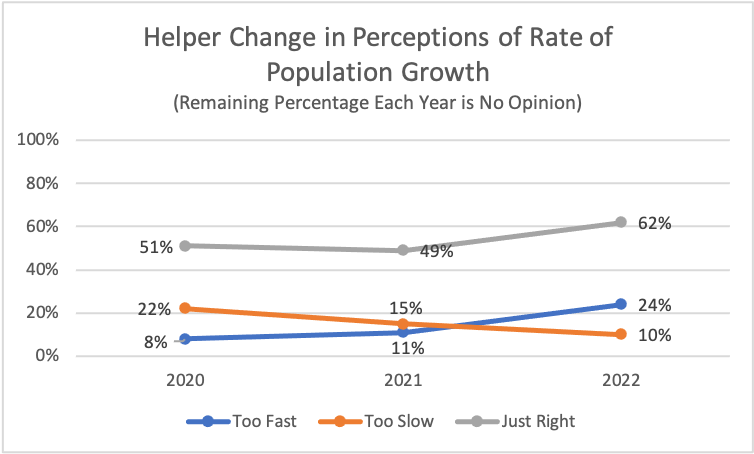
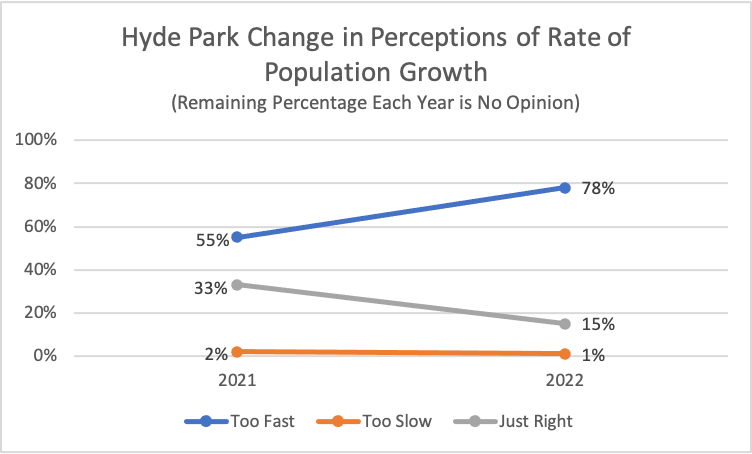
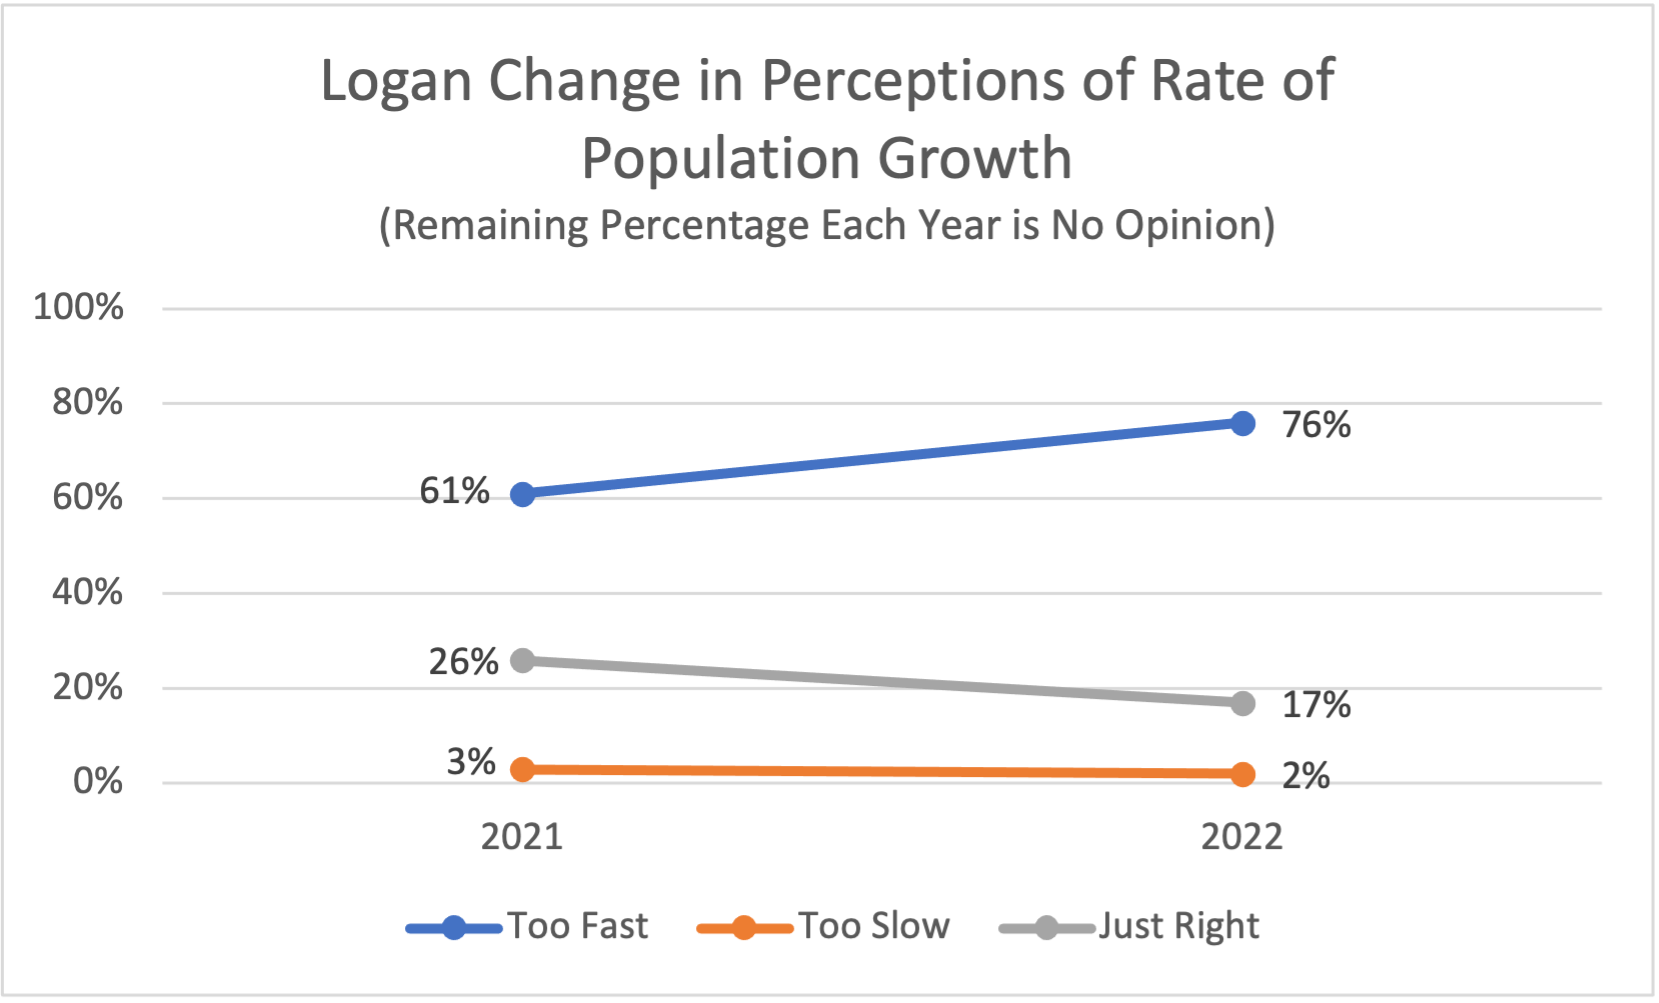
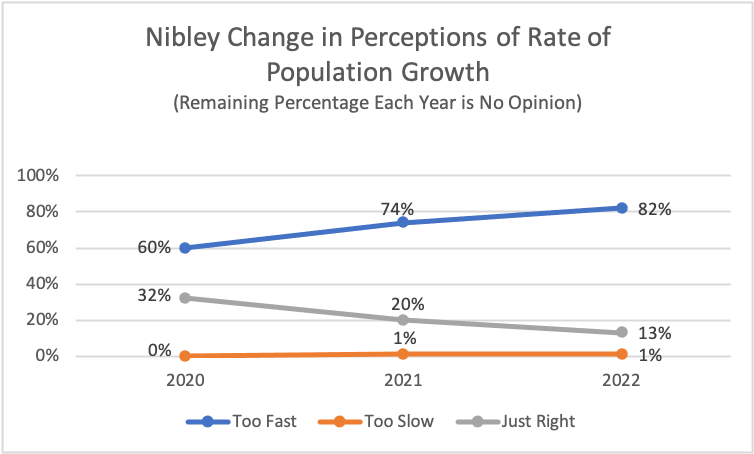
Cities with rather dramatic change in perceptions about population growth (at least 15% difference in “Too Fast” over a year or more) include Ephraim,
Helper, Hyde Park, Logan, Nephi, and Nibley.
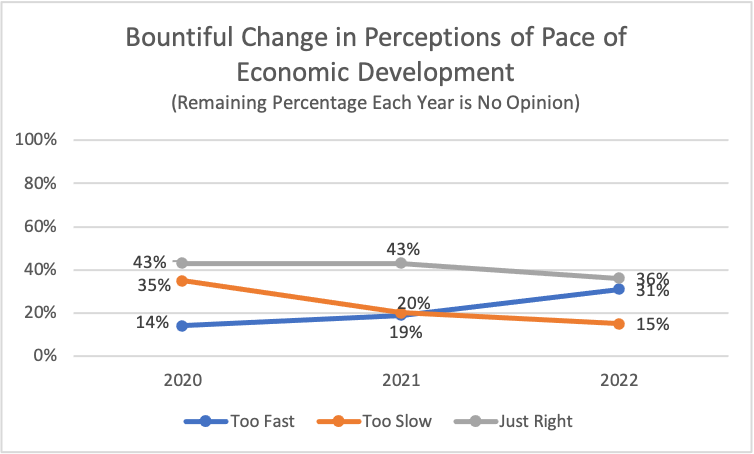
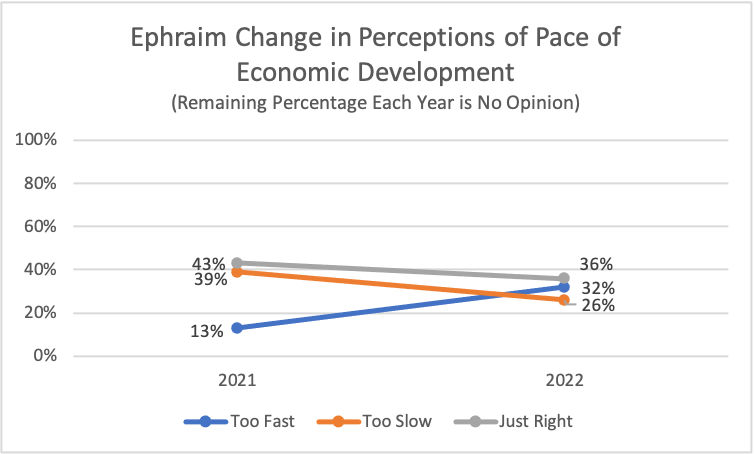
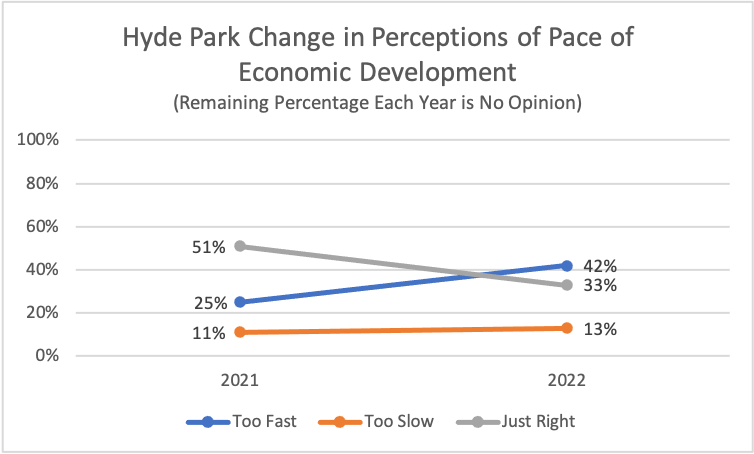
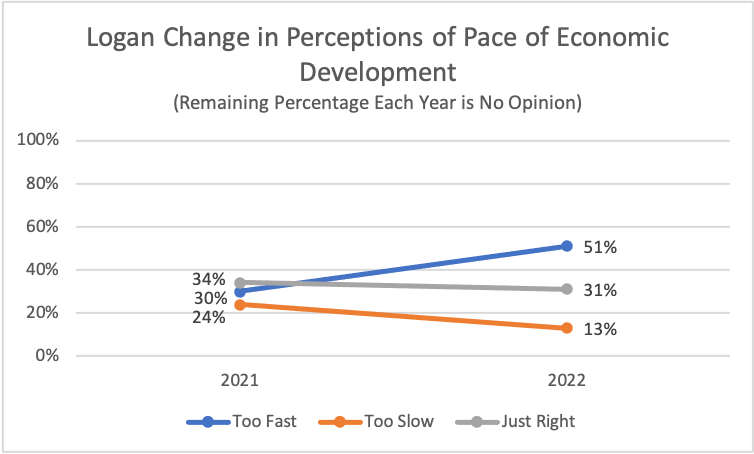
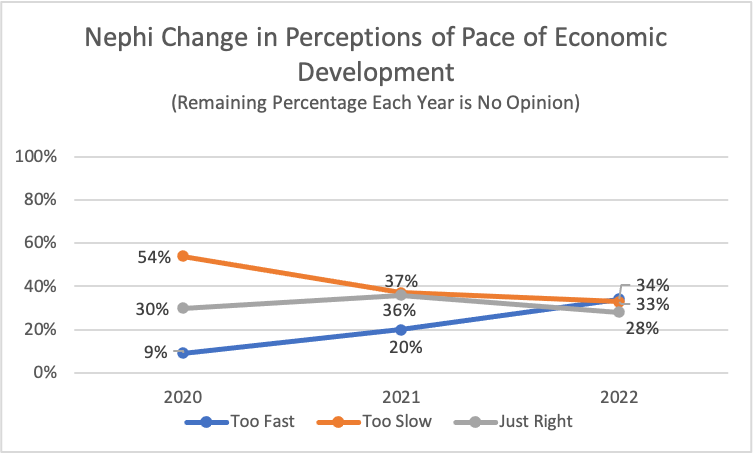
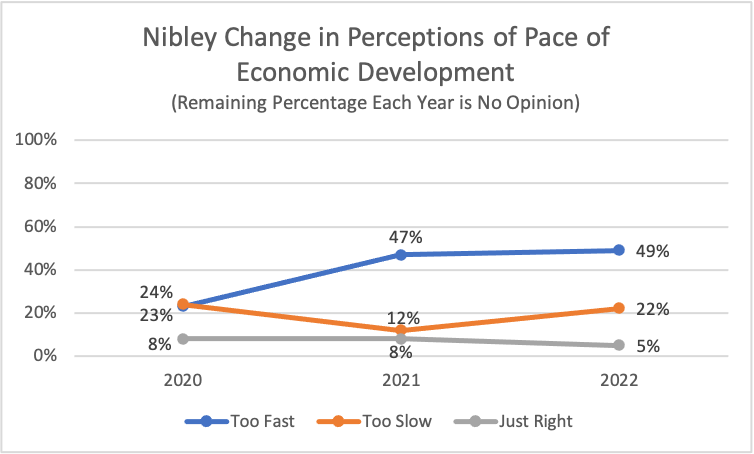
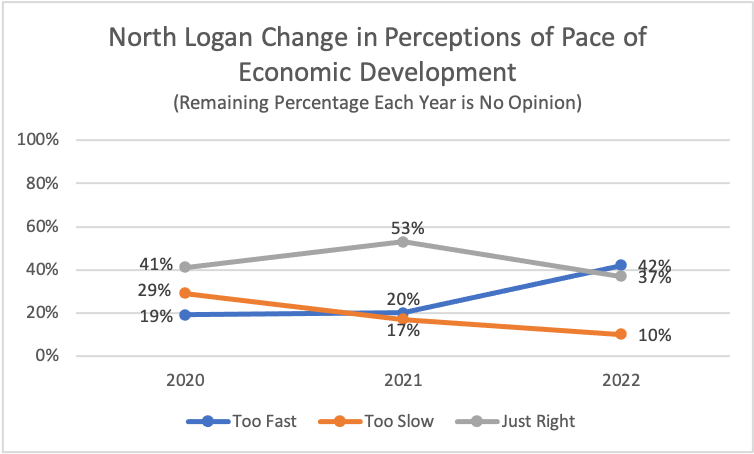
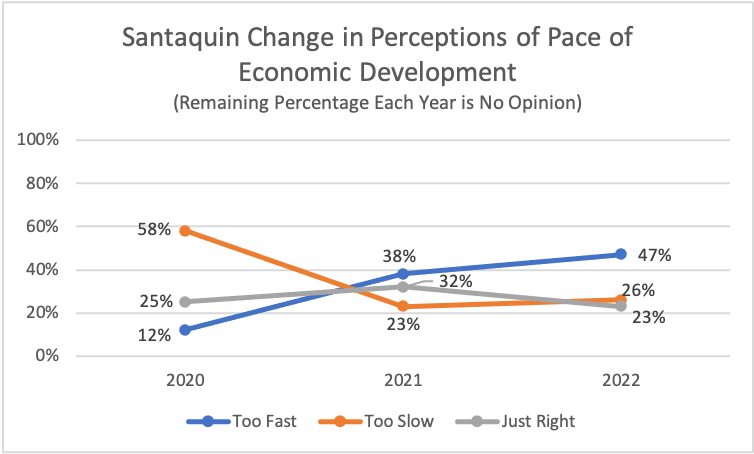
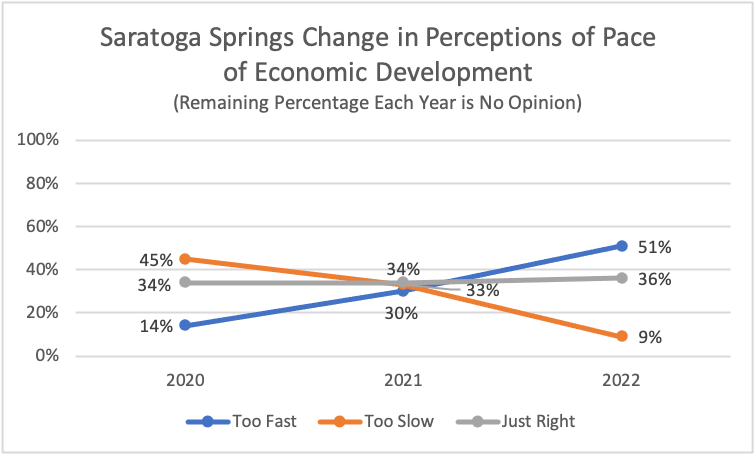
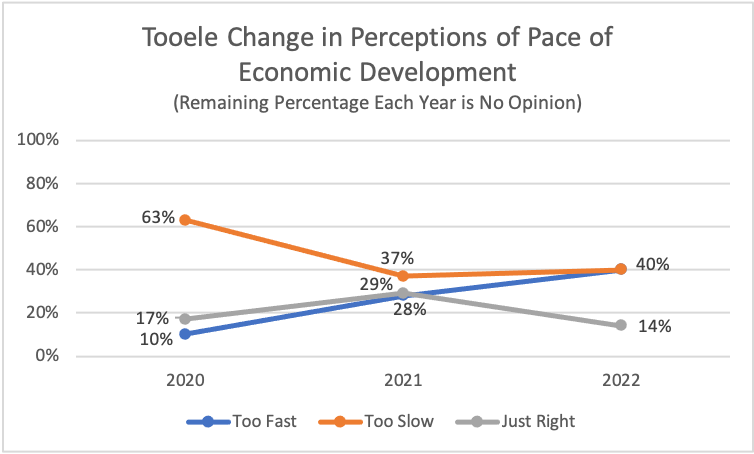
Cities with rather dramatic change in perceptions about economic development (at least 15% difference in “Too Fast” or “Too Slow” over a year or more) include Bountiful, Delta, Ephraim, Helper, Hyde Park, Logan, Nephi, Nibley, North Logan, Santaquin, Saratoga Springs, and Tooele.
Appendix A - Number of Survey Responses
| 2019 (I-Pad Survey) |
2020 (Online Survey) |
2021 (Online Survey) |
2022 (Online Survey) |
|
|---|---|---|---|---|
| Beaver | 131 | |||
| Blanding | 282 | 207 | ||
| Bluff | 83 | |||
| Bountiful | 375 | 213 | 270 | |
| Cedar City | 170 | 262 | ||
| Cottonwood Heights | 227 | |||
| Delta | 88 | 90 | 77 | |
| Draper | 61 | 355 | 375 | 888 |
| Eagle Mountain | 506 | |||
| East Carbon | 104 | 131 | ||
| Ephraim | 101 | 106 | ||
| Helper | 62 | 101 | 100 | 46 |
| Herriman | 375 | 231 | 136 | |
| Highland | 187 | |||
| Hurricane | 55 | 254 | 271 | |
| Hyde Park | 328 | 448 | ||
| La Verkin | 27 | 105 | 150 | |
| Layton | 403 | 319 | ||
| Lehi | 126 | 295 | 243 | 245 |
| Logan | 131 | 563 | 476 | |
| Midvale | 52 | |||
| Millcreek | 274 | |||
| Moab | 354 | 443 | 208 | |
| Nephi | 275 | 144 | 250 | |
| Nibley | 62 | 305 | 457 | |
| North Logan | 56 | 79 | 102 | 299 |
| Ogden | 122 | |||
| Park City | 52 | 390 | ||
| Price | 92 | 230 | 261 | |
| Richfield | 94 | 65 | ||
| Salt Lake City | 162 | |||
| Sandy | 1159 | 809 | ||
| Santaquin | 180 | 241 | 50 | |
| Saratoga Springs | 131 | 377 | 157 | 109 |
| South Jordan | 101 | 467 | ||
| Spanish Fork | 770 | 595 | ||
| St. George | 159 | |||
| Tooele | 173 | 252 | 210 | 332 |
| Tremonton | 337 | |||
| Vernal | 98 | |||
| Vineyard | 379 | 418 | ||
| Wellington | 66 | |||
| West Jordan | 672 |