Bear River Region Wellbeing Survey Report

By Dr. Courtney Flint and Team


utah wellbeing survey logo

Contact Information

Summary

The Utah Wellbeing Survey project is designed to assess the wellbeing and local perspectives of city residents, and to provide information to city leaders to inform their general planning processes. Questions include rating and importance of ten different domains or categories of wellbeing, participation in recreation and nature-related activities, perspectives on local population growth and economic development, the influence of landscape features on wellbeing, concerns for the future, and an array of demographic characteristic questions. Some cities added additional questions to their survey, particularly regarding housing and city amenities.

What is in this report?

This report summarizes findings from the 2022 survey from four cities in Cache County (Logan, Hyde Park, Nibley, and North Logan) and one city in Box Elder County (Tremonton). Please see the individual city reports on the Utah Wellbeing Project website for more details.

How was the survey conducted?

In early 2022, cities in the Bear River Region advertised the survey via social media, email lists, newsletters, and other ways of reaching out to local residents. All city residents age 18+ were encouraged to take the online Qualtrics survey.

Who Responded?

  • 2,017 viable surveys were recorded in this 2022 survey effort from the Bear River Region.
  • Logan had 476 responses, Hyde Park had 448 responses, Nibley had 457 responses, North Logan had 299 responses, and Tremonton had 337 responses

Additional Information

Reports summarizing city-specific results from the survey may be found on the Utah Wellbeing Project Website. This information may help cities refine their messaging with residents on key issues, affirm existing plans, support future planning, and have practical implications for spending and providing services.

This project benefits from the partnership with the Utah League of Cities and Towns, which is helping cities envision ways to use the findings from the wellbeing survey to inform their general planning processes. Logan falls into the category of Established/Mid-Sized Cities and Tremonton falls into the category of Rural Hub/Resort Communities. Hyde Park, Nibley, and North Logan are all categorized in the Rapid Growth cluster of cities according to the Utah League of Cities and Towns.

Key Findings in the Bear River Region


Overall Personal Wellbeing and Community Wellbeing scores were above average for Hyde Park, Nibley, Tremonton, and North Logan, but below average for Logan compared to other study cities. 

Highest Rated Wellbeing Categories:

  • Safety and Security

Most Important Wellbeing Categories:

  • Safety and Security
  • Mental Health
  • Physical Health
  • Living Standards

Red Zone Wellbeing Categories: 
(High Importance, Lower Quality)

  • Logan - None (Mental Health, Living Standards, Leisure Time, and Local Environmental Quality approached this zone)
  • Tremonton - None (Education and Leisure Time approached this zone)
  • North Logan - Mental and Physical Health
  • Hyde Park and Nibley - Physical Health

Top concerns for the future of cities in the Bear River Region:

  • Air Quality
  • Affordable Housing
  • Water Supply
  • Roads and Transportation 

What do people value most about their city in the Bear River Region?
Small-town feel, positive social climate, and feelings of safety.

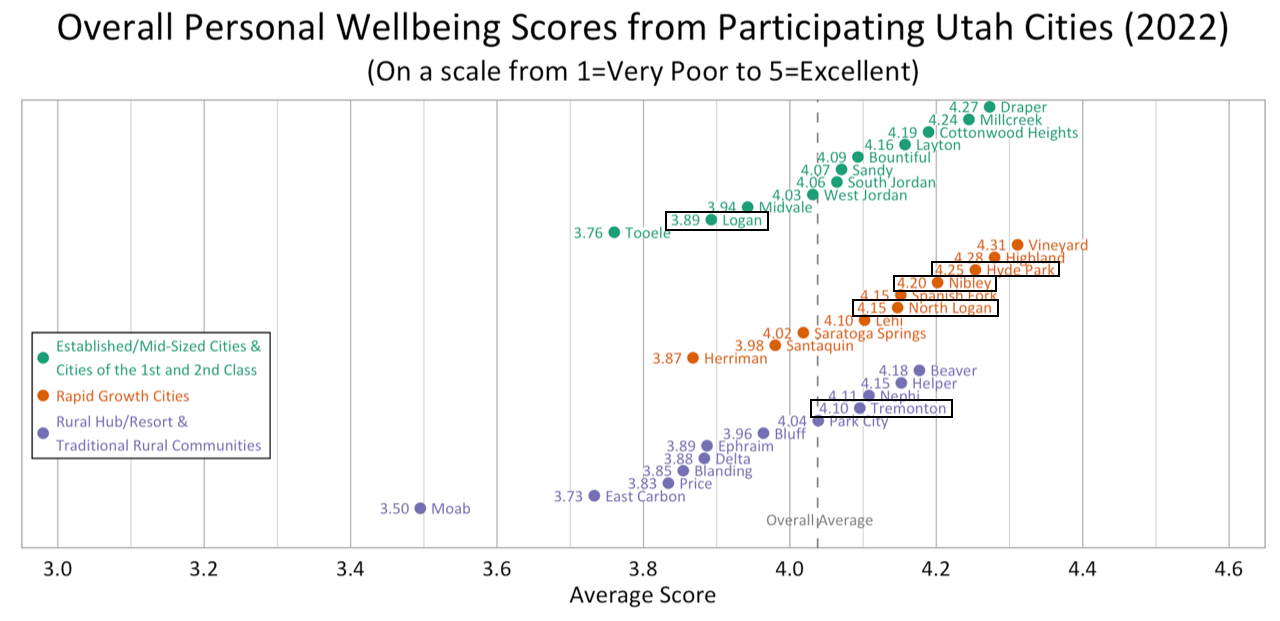
Overall Personal Wellbeing and Community Wellbeing in the Bear River Region Study Cities

Overall Personal Wellbeing and Community Wellbeing scores were above average for Hyde Park, Nibley, Tremonton, and North Logan, but below average for Logan compared to other study cities. 

Dot Plot. Title: Overall Personal Wellbeing Scores from Participating Utah Cities (2022). Subtitle: (On a scale from 1=Very Poor to 5=Excellent). Group: Established/Mid-Sized Cities. Draper: Average Score 4.27; Millcreek: Average Score 4.24; Cottonwood Heights: Average Score 4.19; Layton: Average Score 4.16; Bountiful: Average Score 4.09; Sandy: Average Score 4.07; South Jordan: Average Score 4.06; West Jordan: Average Score 4.03; Midvale: Average Score 3.94; Logan: Average Score 3.89; Tooele: Average Score 3.76. Group: Rapid Growth Cities. Vineyard: Average Score 4.31; Highland: Average Score 4.28; Hyde Park: Average Score 4.25; Nibley: Average Score 4.20; Spanish Fork: Average Score 4.15; North Logan: Average Score 4.15; Lehi: Average Score 4.10; Saratoga Springs: Average Score 4.02; Santaquin: Average Score 3.98; Herriman: Average Score 3.87. Group: Rural, Rural Hub, & Resort and Traditional Communities. Beaver: Average Score 4.18; Helper: Average Score 4.15; Nephi: Average Score 4.11; Tremonton: Average Score 4.10; Park City: Average Score 4.04; Bluff: Average Score 3.96; Ephraim: Average Score 3.89; Delta: Average Score 3.88; Blanding: Average Score: 3.85; Price: Average Score 3.83; East Carbon: Average Score: 3.73; Moab: Average Score: 3.50. 

Dot Plot. Title: Overall Community Wellbeing Scores from Participating Utah Cities (2022). Subtitle: (On a scale from 1=Very Poor to 5=Excellent). Group: Established/Mid-Sized Cities. Draper: Average Score 4.03; South Jordan: Average Score 4.02; Bountiful: Average Score 3.84; Sandy: Average Score 3.79; Millcreek: Average Score 3.79; Cottonwood Heights: Average Score 3.72; Layton: Average Score 3.71; West Jordan: Average Score 3.55; Logan: Average Score 3.46; Midvale: Average Score 3.24; Tooele: Average Score 3.15. Group: Rapid Growth Cities. Highland: Average Score 4.15; Hyde Park: Average Score 4.05; North Logan: Average Score 3.99; Spanish Fork: Average Score 3.98; Nibley: Average Score 3.87; Vineyard: Average Score 3.84; Santaquin: Average Score 3.72; Lehi: Average Score 3.61; Herriman: Average Score 3.49; Saratoga Springs: Average Score 3.47. Group: Rural, Rural Hub, & Resort and Traditional Communities. Helper: Average Score 4.09; Bluff: Average Score 3.84; Beaver: Average Score 3.82; Ephraim: Average Score 3.75; Nephi: Average Score 3.62; Park City: Average Score 3.50; Delta: Average Score 3.44; Blanding: Average Score 3.44; Tremonton: Average Score: 3.32; Price: Average Score 3.15; East Carbon: Average Score: 2.98; Moab: Average Score: 2.84. 

Wellbeing Domains

The highest rated wellbeing domains for the five Bear River Region study cities were:

  • Safety & Security (all 5 cities)
  • Mental Health (Nibley, North Logan, Tremonton, and Hyde Park)
  • Living Standards (Nibley, North Logan, Tremonton, and Hyde Park)
  • Education (Nibley, North Logan, Logan, and Hyde Park)
  • Physical Health (Tremonton and Logan)
  • Connection with Nature (Logan only)

The most important wellbeing domains for the five Bear River Region study cities were:

  • Living Standards (all 5 cities)
  • Safety and Security (all 5 cities)
  • Mental Health (all 5 cities)
  • Physical Health (all 5 cities)
  • Education (North Logan only)

The Red Zone Domains (higher importance, lower quality) for the 5 the Bear River Region study cities were:

  • Logan – None (Mental Health, Living Standards, Leisure Time, and Local Environmental Quality approached this zone)
  • Tremonton – None (Education and Leisure Time approached this zone)
  • Hyde Park and Nibley – Physical Health
  • North Logan – Mental Health and Physical Health

Community Connectedness and Action

In terms of Community Connection, Hyde Park and North Logan scored higher than the other Bear River Region study cities. Perceived Community Action was highest for Hyde Park, followed by North Logan and Nibley in the middle range. 

Likert Graph. Title: Comparing Community Connection Across Cities. Subtitle: How connected do you feel to your city as a community? 1 being not at all. 5 being a great deal. Data – City: Helper 29% of respondents indicate a community action score of 1, 2, or 3 while 71% indicate a community action score of 4 or 5; City: Bluff 40% of respondents indicate a community action score of 1, 2, or 3 while 60% indicate a community action score of 4 or 5; City: Beaver 42% of respondents indicate a community action score of 1, 2, or 3 while 58% indicate a community action score of 4 or 5; City: Spanish Fork 50% of respondents indicate a community action score of 1, 2, or 3 while 50% indicate a community action score of 4 or 5; City: Delta- 51% of respondents indicate a community action score of 1, 2, or 3 while 49% indicate a community action score of 4 or 5; City: Highland- 56% of respondents indicate a community action score of 1, 2, or 3 while 44% indicate a community action score of 4 or 5; City: North Logan- 56% of respondents indicate a community action score of 1, 2, or 3 while 44% indicate a community action score of 4 or 5; City: Hyde Park- 56% of respondents indicate a community action score of 1, 2, or 3 while 44% indicate a community action score of 4 or 5; City: Nephi- 57% of respondents indicate a community action score of 1, 2, or 3 while 43% indicate a community action score of 4 or 5; City: Millcreek- 58% of respondents indicate a community action score of 1, 2, or 3 while 42% indicate a community action score of 4 or 5; City: Park City- 58% of respondents indicate a community action score of 1, 2, or 3 while 42% indicate a community action score of 4 or 5; City: Ephraim- 59% of respondents indicate a community action score of 1, 2, or 3 while 41% indicate a community action score of 4 or 5; City: South Jordan- 59% of respondents indicate a community action score of 1, 2, or 3 while 41% indicate a community action score of 4 or 5; City: Draper- 61% of respondents indicate a community action score of 1, 2, or 3 while 39% indicate a community action score of 4 or 5; City: Bountiful- 61% of respondents indicate a community action score of 1, 2, or 3 while 39% indicate a community action score of 4 or 5; City: Blanding- 62% of respondents indicate a community action score of 1, 2, or 3 while 38% indicate a community action score of 4 or 5; City: Vineyard- 62% of respondents indicate a community action score of 1, 2, or 3 while 38% indicate a community action score of 4 or 5; City: Logan- 64% of respondents indicate a community action score of 1, 2, or 3 while 36% indicate a community action score of 4 or 5; City: Nibley- 64% of respondents indicate a community action score of 1, 2, or 3 while 36% indicate a community action score of 4 or 5; City: Santaquin- 65% of respondents indicate a community action score of 1, 2, or 3 while 35% indicate a community action score of 4 or 5; City: Moab- 66% of respondents indicate a community action score of 1, 2, or 3 while 34% indicate a community action score of 4 or 5; City: Layton- 67% of respondents indicate a community action score of 1, 2, or 3 while 33% indicate a community action score of 4 or 5; City: East Carbon- 67% of respondents indicate a community action score of 1, 2, or 3 while 33% indicate a community action score of 4 or 5; City: Sandy- 68% of respondents indicate a community action score of 1, 2, or 3 while 32% indicate a community action score of 4 or 5; City: Tremonton- 69% of respondents indicate a community action score of 1, 2, or 3 while 31% indicate a community action score of 4 or 5; City: Cottonwood Heights- 70% of respondents indicate a community action score of 1, 2, or 3 while 30% indicate a community action score of 4 or 5; City: Price- 70% of respondents indicate a community action score of 1, 2, or 3 while 30% indicate a community action score of 4 or 5; City: Tooele- 71% of respondents indicate a community action score of 1, 2, or 3 while 29% indicate a community action score of 4 or 5; City: Lehi- 73% of respondents indicate a community action score of 1, 2, or 3 while 27% indicate a community action score of 4 or 5; City: Herriman- 78% of respondents indicate a community action score of 1, 2, or 3 while 22% indicate a community action score of 4 or 5; City: West Jordan- 79% of respondents indicate a community action score of 1, 2, or 3 while 21% indicate a community action score of 4 or 5; City: Saratoga Springs- 81% of respondents indicate a community action score of 1, 2, or 3 while 19% indicate a community action score of 4 or 5; City: Midvale- 85% of respondents indicate a community action score of 1, 2, or 3 while 15% indicate a community action score of 4 or 5.

Likert Graph. Title: Comparing Community Action Across Cities. Subtitle: In your city to what degree do people take action together in response to local problems or opportunities? 1 being not at all. 5 being a great deal. Data – City: Helper- 23% of respondents indicate a community action score of 1, 2, or 3 while 77% indicate a community action score of 4 or 5; City: Delta 29% of respondents indicate a community action score of 1, 2, or 3 while 71% indicate a community action score of 4 or 5; City: Bluff 33% of respondents indicate a community action score of 1, 2, or 3 while 67% indicate a community action score of 4 or 5; City: Beaver 42% of respondents indicate a community action score of 1, 2, or 3 while 58% indicate a community action score of 4 or 5; City: Blanding 48% of respondents indicate a community action score of 1, 2, or 3 while 52% indicate a community action score of 4 or 5; City: Hyde Park 48% of respondents indicate a community action score of 1, 2, or 3 while 52% indicate a community action score of 4 or 5; City: Highland 50% of respondents indicate a community action score of 1, 2, or 3 while 50% indicate a community action score of 4 or 5; City: Spanish Fork 51% of respondents indicate a community action score of 1, 2, or 3 while 49% indicate a community action score of 4 or 5; City: Bountiful 53% of respondents indicate a community action score of 1, 2, or 3 while 47% indicate a community action score of 4 or 5; City: North Logan 55% of respondents indicate a community action score of 1, 2, or 3 while 45% indicate a community action score of 4 or 5; City: Nibley 55% of respondents indicate a community action score of 1, 2, or 3 while 45% indicate a community action score of 4 or 5; City: Nephi 57% of respondents indicate a community action score of 1, 2, or 3 while 43% indicate a community action score of 4 or 5; City: South Jordan 57% of respondents indicate a community action score of 1, 2, or 3 while 43% indicate a community action score of 4 or 5; City: Vineyard 59% of respondents indicate a community action score of 1, 2, or 3 while 41% indicate a community action score of 4 or 5; City: Millcreek 60% of respondents indicate a community action score of 1, 2, or 3 while 40% indicate a community action score of 4 or 5; City: Draper 61% of respondents indicate a community action score of 1, 2, or 3 while 39% indicate a community action score of 4 or 5; City: Ephraim 65% of respondents indicate a community action score of 1, 2, or 3 while 35% indicate a community action score of 4 or 5; City: Santaquin 65% of respondents indicate a community action score of 1, 2, or 3 while 35% indicate a community action score of 4 or 5; City: Moab 66% of respondents indicate a community action score of 1, 2, or 3 while 34% indicate a community action score of 4 or 5; City: Tremonton 66% of respondents indicate a community action score of 1, 2, or 3 while 34% indicate a community action score of 4 or 5; City: Layton 66% of respondents indicate a community action score of 1, 2, or 3 while 34% indicate a community action score of 4 or 5; City: Price 66% of respondents indicate a community action score of 1, 2, or 3 while 34% indicate a community action score of 4 or 5; City: Sandy 69% of respondents indicate a community action score of 1, 2, or 3 while 31% indicate a community action score of 4 or 5; City: Tooele 71% of respondents indicate a community action score of 1, 2, or 3 while 29% indicate a community action score of 4 or 5; City: Logan 71% of respondents indicate a community action score of 1, 2, or 3 while 29% indicate a community action score of 4 or 5; City: Lehi 72% of respondents indicate a community action score of 1, 2, or 3 while 28% indicate a community action score of 4 or 5; City: Herriman 72% of respondents indicate a community action score of 1, 2, or 3 while 28% indicate a community action score of 4 or 5; City: Cottonwood Heights 73% of respondents indicate a community action score of 1, 2, or 3 while 27% indicate a community action score of 4 or 5; City: Saratoga Springs 74% of respondents indicate a community action score of 1, 2, or 3 while 26% indicate a community action score of 4 or 5; East Carbon 75% of respondents indicate a community action score of 1, 2, or 3 while 25% indicate a community action score of 4 or 5; West Jordan 81% of respondents indicate a community action score of 1, 2, or 3 while 19% indicate a community action score of 4 or 5; Midvale 89% of respondents indicate a community action score of 1, 2, or 3 while 11% indicate a community action score of 4 or 5.

Participation in Recreation and Nature-Related Activities

Respondents in each Bear River Region city were asked to indicate whether or not they participated in eight different recreation or nature-based activities in the past 12 months. Enjoying wildlife and birds in your yard or neighborhood (85%) and recreating in parks in the city (79%) were the most common activities for all Bear River Region respondents, followed by gardening (78%) and non-motorized recreation on public lands or waters (77%). 

Type: Bar Graph Title: Participation in Recreation and Nature-based Activities in the Bear River Region. Subtitle: Have you participated in any of the following activities during the past 12 months? Data - 77% of respondents indicated yes to non-motorized recreation on public lands or waters in Utah. 85% of respondents indicated yes to enjoying wildlife or birds in your yard or neighborhood. 42% of respondents indicated yes to motorized recreation on public lands or waters in Utah. 79% of respondents indicated yes to recreating in parks in your city. 78% of respondents indicated yes to gardening. 45% of respondents indicated yes to city recreation programs. 58% of respondents indicated yes to watching or reading nature-related programs or publications. 50% of respondents indicated yes to walking with a pet in your city.

Landscapes and Wellbeing in the Bear River Region Study Cities

The survey asked respondents to rate the influence of various landscape features on their wellbeing. Natural landscapes such as mountains, rivers, trails, city parks, lakes and farmland were all found to have highly positive impacts on wellbeing. Developed landscapes were mixed in their influence on wellbeing.

Likert Graph. Title: The Role of Landscape Features in the Bear River Region Residents' Wellbeing. Subtitle: How does the presence of the following landscape features influence your wellbeing? Feature: Mountains - 0% of respondents indicated very negatively or negatively, 3% indicated neither, 97% indicated positively or very positively; Feature: Rivers and Streams - 0% of respondents indicated very negatively or negatively, 6% indicated neither, 94% indicated positively or very positively; Feature: Lakes - 0% of respondents indicated very negatively or negatively, 15% indicated neither, 85% indicated positively or very positively; Feature: Trails - 1% of respondents indicated very negatively or negatively, 11% indicated neither, 88% indicated positively or very positively; Feature: Red Rock - 2% of respondents indicated very negatively or negatively, 47% indicated neither, 51% indicated positively or very positively; Feature: City Parks - 2% of respondents indicated very negatively or negatively, 9% indicated neither, 89% indicated positively or very positively; Feature: Farmland - 2% of respondents indicated very negatively or negatively, 14% indicated neither, 84% indicated positively or very positively; Feature: Residential Development -45% of respondents indicated very negatively or negatively, 34% indicated neither, 21% indicated positively or very positively; Feature: Commercial Development - 39% of respondents indicated very negatively or negatively, 37% indicated neither, 23% indicated positively or very positively; Feature: Extractive Industry - 51% of respondents indicated very negatively or negatively, 41% indicated neither, 8% indicated positively or very positively; Feature: Manufacturing Industry - 38% of respondents indicated very negatively or negatively, 47% indicated neither, 15% indicated positively or very positively.

Perspectives on Population Growth and Economic Development

The majority of respondents felt the Rate of Population Growth in their city was too fast. Perceptions of the Pace of Economic Development were mixed with the largest group in each city indicating it's too fast and a moderately sized group saying it's just right.

Graph 23: Population Growth Opinion Type: Likert Graph. Title: Population Growth. Subtitle: How would you describe the current rate of population growth in your city/town?  Subtitle: Established/Mid-Sized Cities and cities of the first and second class. Data – City: Logan – 2% of respondents rated too slow, 69% of respondents rated too fast; City: Draper – 1% of respondents rated too slow, 69% of respondents rated too fast; City: Tooele – 2% of respondents rated too slow, 67% of respondents rated too fast; City: Layton – 1% of respondents rated too slow, 65% of respondents rated too fast; City: West Jordan – 1% of respondents rated too slow, 63% of respondents rated too fast;  City: South Jordan – 1% of respondents rated too slow, 63% of respondents rated too fast; City: Midvale – 2% of respondents rated too slow, 62% of respondents rated too fast; City: Sandy - 2% of respondents rated too slow, 61% of respondents rated too fast; City: Cottonwood Heights - 2% of respondents rated too slow, 56% of respondents rated too fast; City: Bountiful - 2% of respondents rated too slow, 51% of respondents rated too fast; City: Millcreek - 1% of respondents rated too slow, 44% of respondents rated too fast. Subtitle: Rapid Growth Cities. Data – City: Lehi – 1% of respondents rated too slow, 76% of respondents rated too fast; City: Herriman – 1% of respondents rated too slow, 74% of respondents rated too fast; City: Santaquin – 0% of respondents rated too slow, 71% of respondents rated too fast; City: Spanish Fork – 1% of respondents rated too slow, 71% of respondents rated too fast; City: Nibley – 1% of respondents rated too slow, 71% of respondents rated too fast; City: Hyde Park – 0% of respondents rated too slow, 69% of respondents rated too fast; City: North Logan – 0% of respondents rated too slow, 69% of respondents rated too fast; City: Vineyard – 0% of respondents rated too slow, 66% of respondents rated too fast; City: Saratoga Springs – 1% of respondents rated too slow, 65% of respondents rated too fast;City: Highland – 1% of respondents rated too slow, 65% of respondents rated too fast. Subtitle: Rural Hub/Resort and Traditional Rural Communities. Data – City: Park City – 1% of respondents rated too slow, 82% of respondents rated too fast;City: Tremonton – 1% of respondents rated too slow, 67% of respondents rated too fast; City: Nephi – 4% of respondents rated too slow, 63% of respondents rated too fast; City: Moab – 4% of respondents rated too slow, 60% of respondents rated too fast; City: Ephraim – 4% of respondents rated too slow, 50% of respondents rated too fast; City: Beaver – 9% of respondents rated too slow, 40% of respondents rated too fast; City: Price – 21% of respondents rated too slow, 25% of respondents rated too fast; City: Helper – 9% of respondents rated too slow, 23% of respondents rated too fast; City: Blanding – 16% of respondents rated too slow, 15% of respondents rated too fast; City: East Carbon – 20% of respondents rated too slow, 15% of respondents rated too fast; City: Delta – 13% of respondents rated too slow, 14% of respondents rated too fast; City: Bluff – 19% of respondents rated too slow, 10% of respondents rated too fast.   Graph 24: Economic Development Opinion Type: Likert Graph. Title: Economic Development. Subtitle: How would you describe the current pace of economic growth in your city/town?  Subtitle: Established/Mid-Sized Cities and cities of the first and second class. Data – City: Draper – 3% of respondents rated too slow, 50% of respondents rated too fast; City: Logan – 12% of respondents rated too slow, 47% of respondents rated too fast; City: Layton – 9% of respondents rated too slow, 44% of respondents rated too fast; City: Sandy – 7% of respondents rated too slow, 41% of respondents rated too fast; City: Cottonwood Heights – 10% of respondents rated too slow, 38% of respondents rated too fast; City: South Jordan – 6% of respondents rated too slow, 38% of respondents rated too fast; City: Tooele – 34% of respondents rated too slow, 34% of respondents rated too fast; City: Bountiful – 13% of respondents rated too slow, 28% of respondents rated too fast; City: West Jordan – 19% of respondents rated too slow, 28% of respondents rated too fast; City: Millcreek – 8% of respondents rated too slow, 27% of respondents rated too fast; City: Midvale – 24% of respondents rated too slow, 22% of respondents rated too fast. Subtitle: Rapid Growth Cities. Data – City: Lehi – 7% of respondents rated too slow, 59% of respondents rated too fast; City: Spanish Fork – 2% of respondents rated too slow, 49% of respondents rated too fast; City: Nibley – 11% of respondents rated too slow, 42% of respondents rated too fast; City: Saratoga Springs – 8% of respondents rated too slow, 39% of respondents rated too fast; City: North Logan – 9% of respondents rated too slow, 39% of respondents rated too fast; City: Herriman – 21% of respondents rated too slow, 39% of respondents rated too fast; City: Santaquin – 23% of respondents rated too slow, 38% of respondents rated too fast; City: Hyde Park – 12% of respondents rated too slow, 37% of respondents rated too fast; City: Highland – 23% of respondents rated too slow, 30% of respondents rated too fast; City: Vineyard – 29% of respondents rated too slow, 23% of respondents rated too fast. Subtitle: Rural Hub/Resort and Traditional Rural Communities. Data – City: Park City – 3% of respondents rated too slow, 77% of respondents rated too fast; City: Moab – 19% of respondents rated too slow, 59% of respondents rated too fast; City: Tremonton – 13% of respondents rated too slow, 45% of respondents rated too fast; City: Nephi – 27% of respondents rated too slow, 31% of respondents rated too fast; City: Ephraim – 24% of respondents rated too slow, 30% of respondents rated too fast; City: Beaver – 30% of respondents rated too slow, 18% of respondents rated too fast; City: Bluff – 33% of respondents rated too slow, 14% of respondents rated too fast; City: Blanding – 43% of respondents rated too slow, 5% of respondents rated too fast; City: Delta – 43% of respondents rated too slow, 5% of respondents rated too fast; City: Helper – 16% of respondents rated too slow, 2% of respondents rated too fast; City: Price – 61% of respondents rated too slow, 2% of respondents rated too fast; City: East Carbon – 67% of respondents rated too slow, 0% of respondents rated too fast.

Concerns for the Future of the Bear River Region Study Cities

Top concerns varied across the study cities in the Bear River Region as follows:

Moderate to Major Concerns by Over Two-Thirds of Respondents

  • Logan
    • Affordable Housing 89%
    • Air Quality 86%
    • Water Supply 86%
    • Roads and Transportation 74%
    • Climate Change 70%
  • Hyde Park
    • Water Supply 95%
    • Air Quality 77%
    • Roads and Transportation 70%
    • Affordable Housing 68%
  • Nibley
    • Water Supply 83%
    • Affordable Housing 77%
    • Air Quality 76%
    • Roads and Transportation 73%
  • North Logan
    • Water Supply 87%
    • Affordable Housing 79%
    • Air Quality 79%
    • Roads and Transportation 70%
  • Tremonton
    • Water Supply 91%
    • Roads and Transportation 84%
    • Affordable Housing 79%
    • Public Safety 77%
    • Opportunities for Youth 74%
    • Access to Public Land 71%
    • Access to Quality Food 69%
    • Suicide 69%
    • Recreation Opportunities 68%

Other concerns were raised by respondents who filled in the “other” category. The most frequently mentioned topics specific to each city included:

  • Traffic and parking and government in Logan
  • Overdevelopment and development related water issues in Hyde Park
  • Traffic and road safety and overpopulation in Nibley
  • Preserving rural-feel and open space and overdevelopment in North Logan
  • Education and overcrowded schools in Tremonton

Open Comments Relating to Value

Respondents were asked to comment on what they value most about their cities at the end of each survey. All responses have been read, compiled, and then shared with city leaders. The main themes in the Bear River Region in the responses to this question were valuing the small town feel and overall social climate. Many people also valued the feelings of safety they have in their cities.