Utah County Wellbeing Survey Report
By Dr. Courtney Flint and Team
![]()
courtney.flint@usu.edu
435-797-8635
Summary
The Utah Wellbeing Survey project is designed to assess the wellbeing and local perspectives of city residents, and to provide information to city leaders to inform their general planning processes. Questions include rating and importance of ten different domains or categories of wellbeing, participation in recreation and nature-related activities, perspectives on local population growth and economic development, the influence of landscape features on wellbeing, concerns for the future, and an array of demographic characteristic questions. Some cities added additional questions to their survey, particularly regarding housing and city amenities.
What is in this report?
This report summarizes findings from the 2022 survey from six cities in Utah County: Highland, Lehi, Santaquin, Saratoga Springs, Spanish Fork, and Vineyard. Please see the individual city reports on the Utah Wellbeing Project website for more details.
How was the survey conducted?
In early 2022, cities in Utah County advertised the survey via social media, email lists, newsletters, and other ways of reaching out to local residents. All city residents age 18+ were encouraged to take the online Qualtrics survey.
Who Responded?
- 1,604 viable surveys were recorded in this 2021 survey effort from Utah County.
- Highland had 187 responses, Lehi had 245 responses, Santaquin had 50 responses, Saratoga Springs had 109 responses, Spanish Fork had 595 responses, and Vineyard had 418 responses.
Additional Information
Reports summarizing city-specific results from the survey may be found on the Utah Wellbeing Project Website. This information may help cities refine their messaging with residents on key issues, affirm existing plans, support future planning, and have practical implications for spending and providing services.
This project benefits from the partnership with the Utah League of Cities and Towns, which is helping cities envision ways to use the findings from the wellbeing survey to inform their general planning processes. Utah County cities all fall in the Rapid Growth cluster of cities according to the Utah League of Cities and Towns.
Key Findings in Utah County
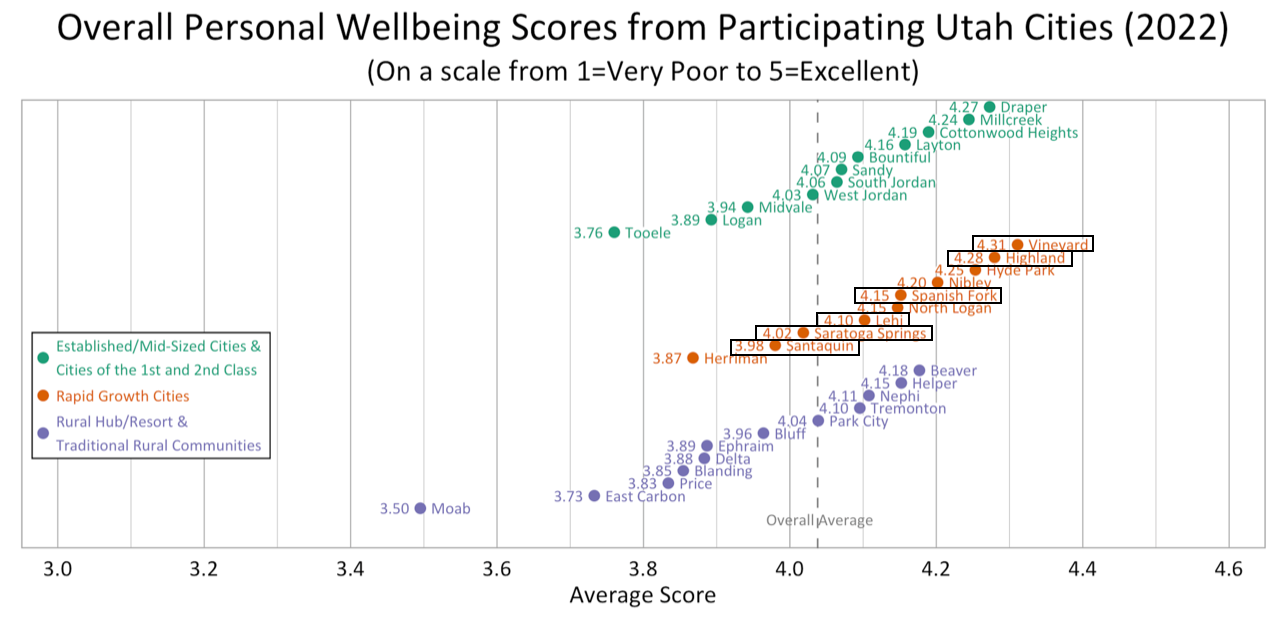
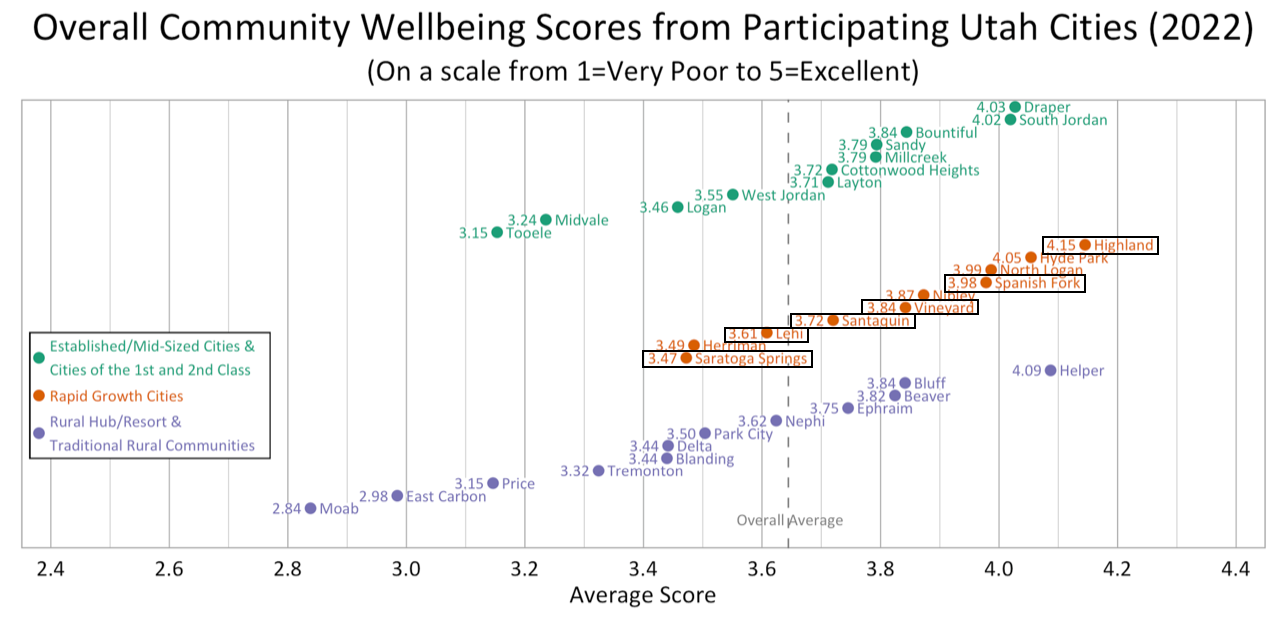
Overall Personal Wellbeing scores were above average for Vineyard, Highland, Spanish Fork, and Lehi, but below average for Saratoga Springs and Santaquin compared to other study cities. Community Wellbeing scores were above average for Vineyard, Highland, Spanish Fork, and Santaquin, but below average for Saratoga Springs and Lehi compared to other study cities.
Highest Rated Wellbeing Categories:
- Safety and Security
- Living Standards
Most Important Wellbeing Categories:
- Safety and Security
- Mental Health
- Physical Health
- Living Standards
Red Zone Wellbeing Categories:
(High Importance, Lower Quality)
- Lehi - None (Local Environmental Quality approached this zone)
- Highland and Spanish Fork - Physical Health
- Santaquin - Physical Health and Leisure Time
- Vineyard - None (Physical Health and Leisure Time approached this zone)
- Saratoga Springs - None (Leisure Time approached this zone)
- Water Supply
- Air Quality
- Affordable Housing
- Roads & Transportation
What do people value most about their city in Utah County?
Great location, positive social climate, and abundant recreation opportunities.
Overall Personal Wellbeing and Community Wellbeing in Utah County Study Cities
Overall Personal Wellbeing scores were above average for Vineyard, Highland, Spanish Fork, and Lehi, but below average for Saratoga Springs and Santaquin compared to other study cities. Community Wellbeing scores were above average for Vineyard, Highland, Spanish Fork, and Santaquin, but below average for Saratoga Springs and Lehi compared to other study cities.
Wellbeing Domains
The highest rated wellbeing domains for the six Utah County study cities were:
- Living Standards (all 6 cities)
- Safety and Security (all 6 cities)
- Mental Health (Vineyard, Spanish Fork, Santaquin, Lehi)
- Education (Vineyard, Spanish Fork, Saratoga Springs, Highland)
The most important wellbeing domains for the six Utah County study cities were:
- Safety & Security (all 6 cities)
- Mental Health (all 6 cities)
- Living Standards (all 6 cities)
- Physical Health (all 6 cities)
The Red Zone Domains (higher importance, lower quality) for the six Utah County study cities were:
- Lehi – none, but Local Environmental Quality approached this zone
- Highland and Spanish Fork – Physical Health
- Santaquin – Physical Health and Leisure Time
- Vineyard – none, but Physical Health and Leisure Time approached this zone
- Saratoga Springs – none, but Leisure Time approached this zone
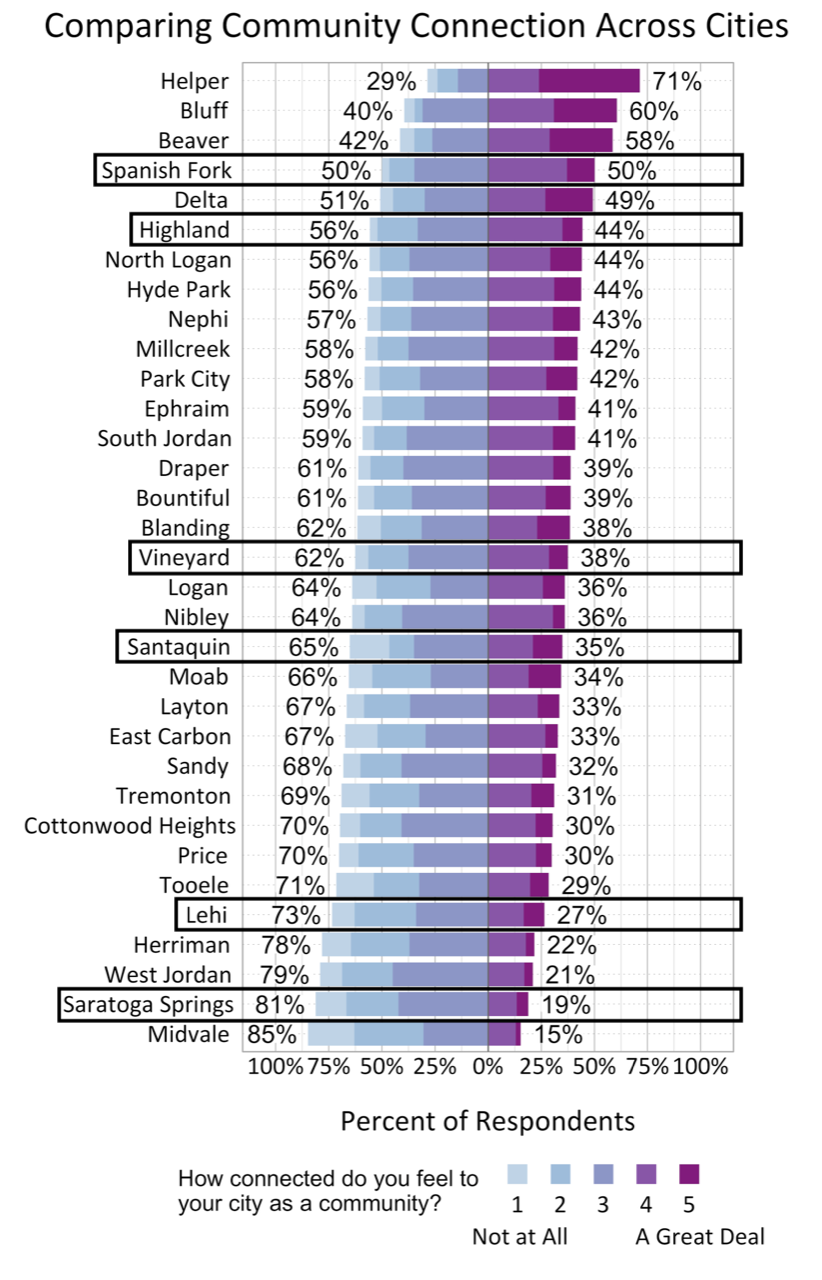
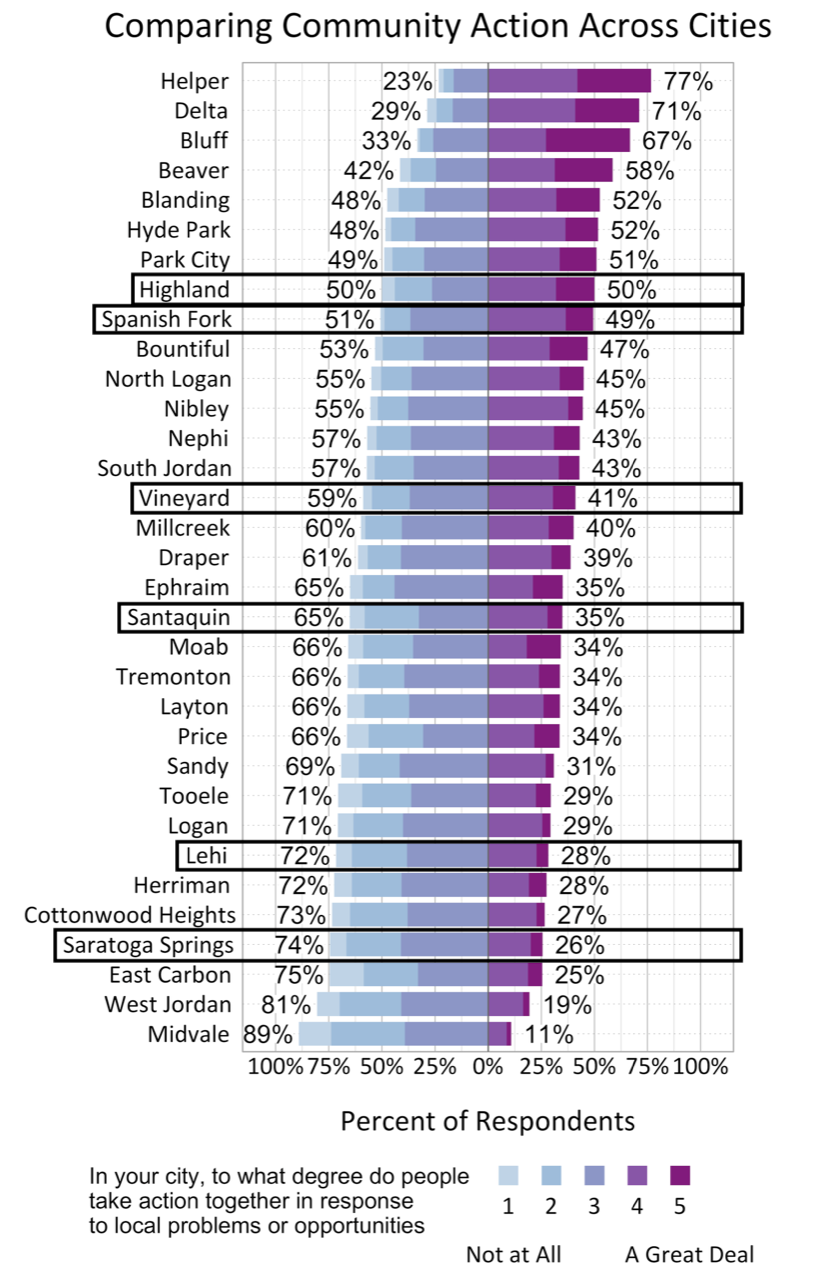
Community Connectedness and Action
Community Connection and Perceived Community Action were highest for Spanish Fork and Highland.
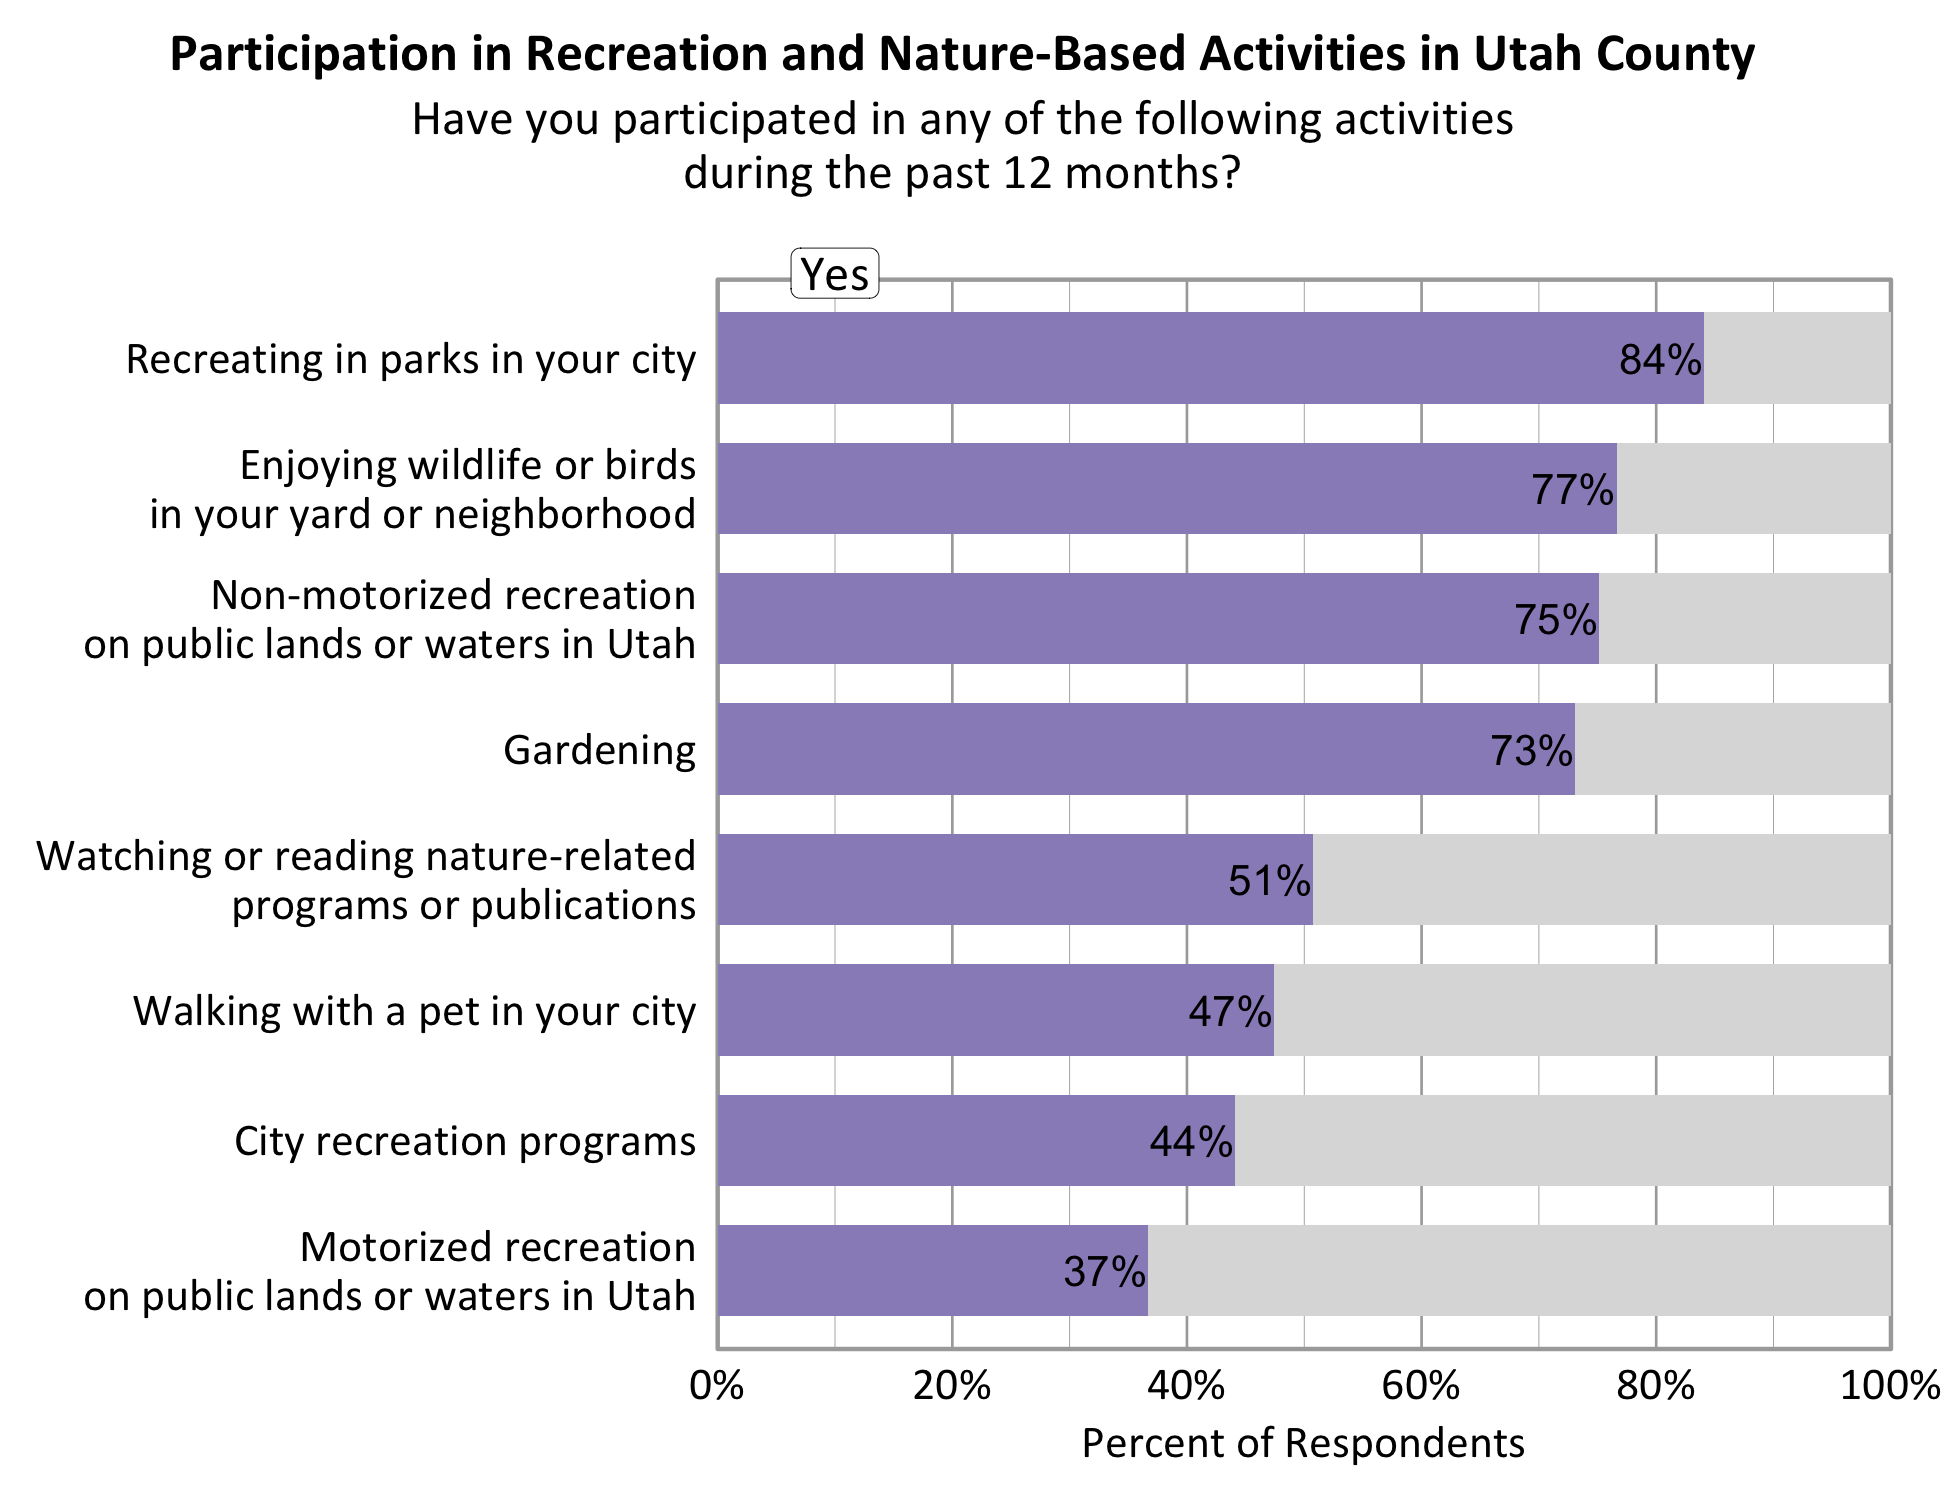
Participation in Recreation and Nature-Related Activities
Respondents in each Utah County city were asked to indicate whether or not they participated in eight different recreation or nature-based activities in the past 12 months. Recreating in parks in the city (84%) and enjoying wildlife and birds in your yard or neighborhood (77%) were the most common activities for all Utah County respondents, followed by non-motorized recreation on public lands or waters (75%) and gardening (73%).
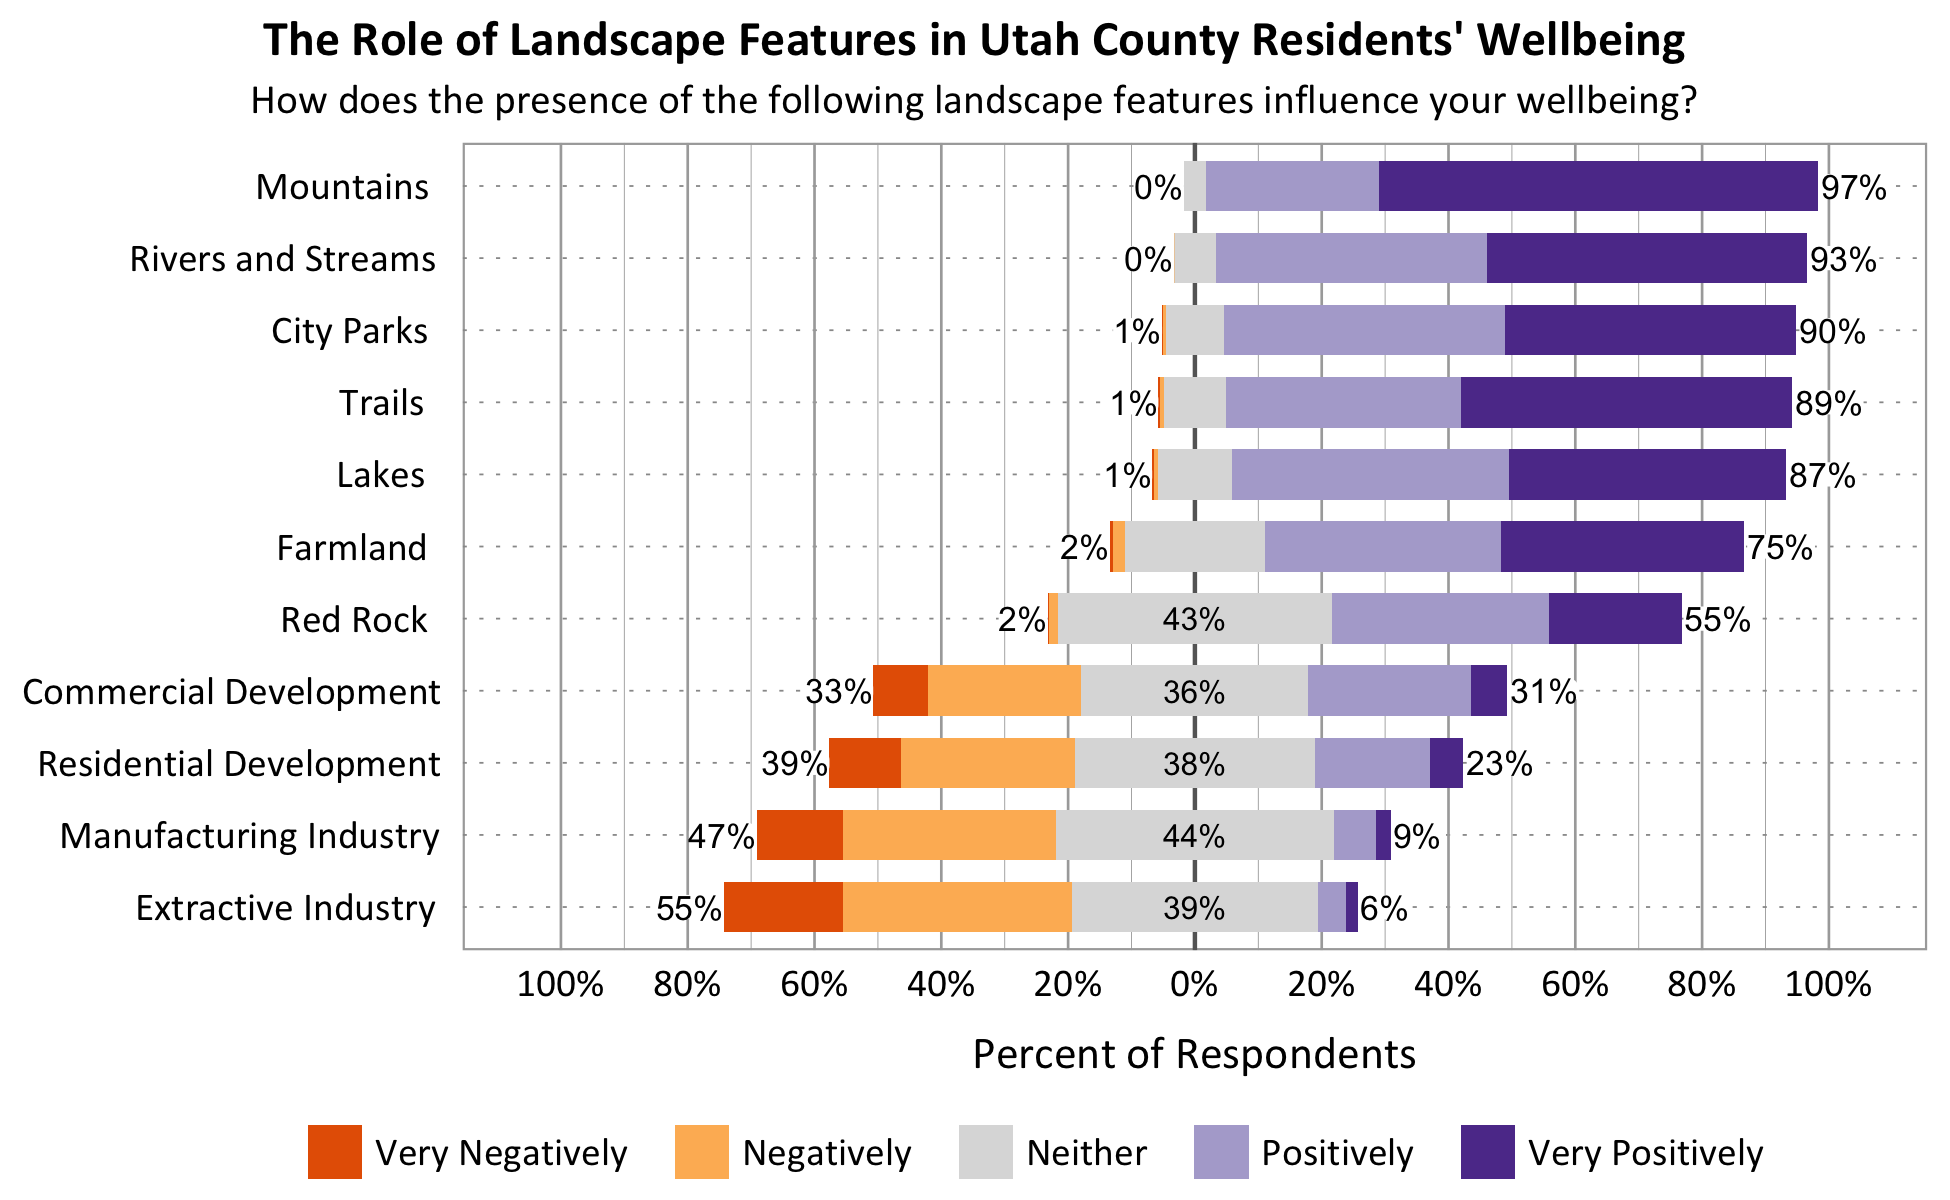
Landscapes and Wellbeing in Utah County Study Cities
The survey asked respondents to rate the influence of various landscape features on their wellbeing. Natural landscapes such as mountains, rivers, trails, city parks, lakes and farmland were all found to have highly positive impacts on wellbeing. Developed landscapes were mixed in their influence on wellbeing.
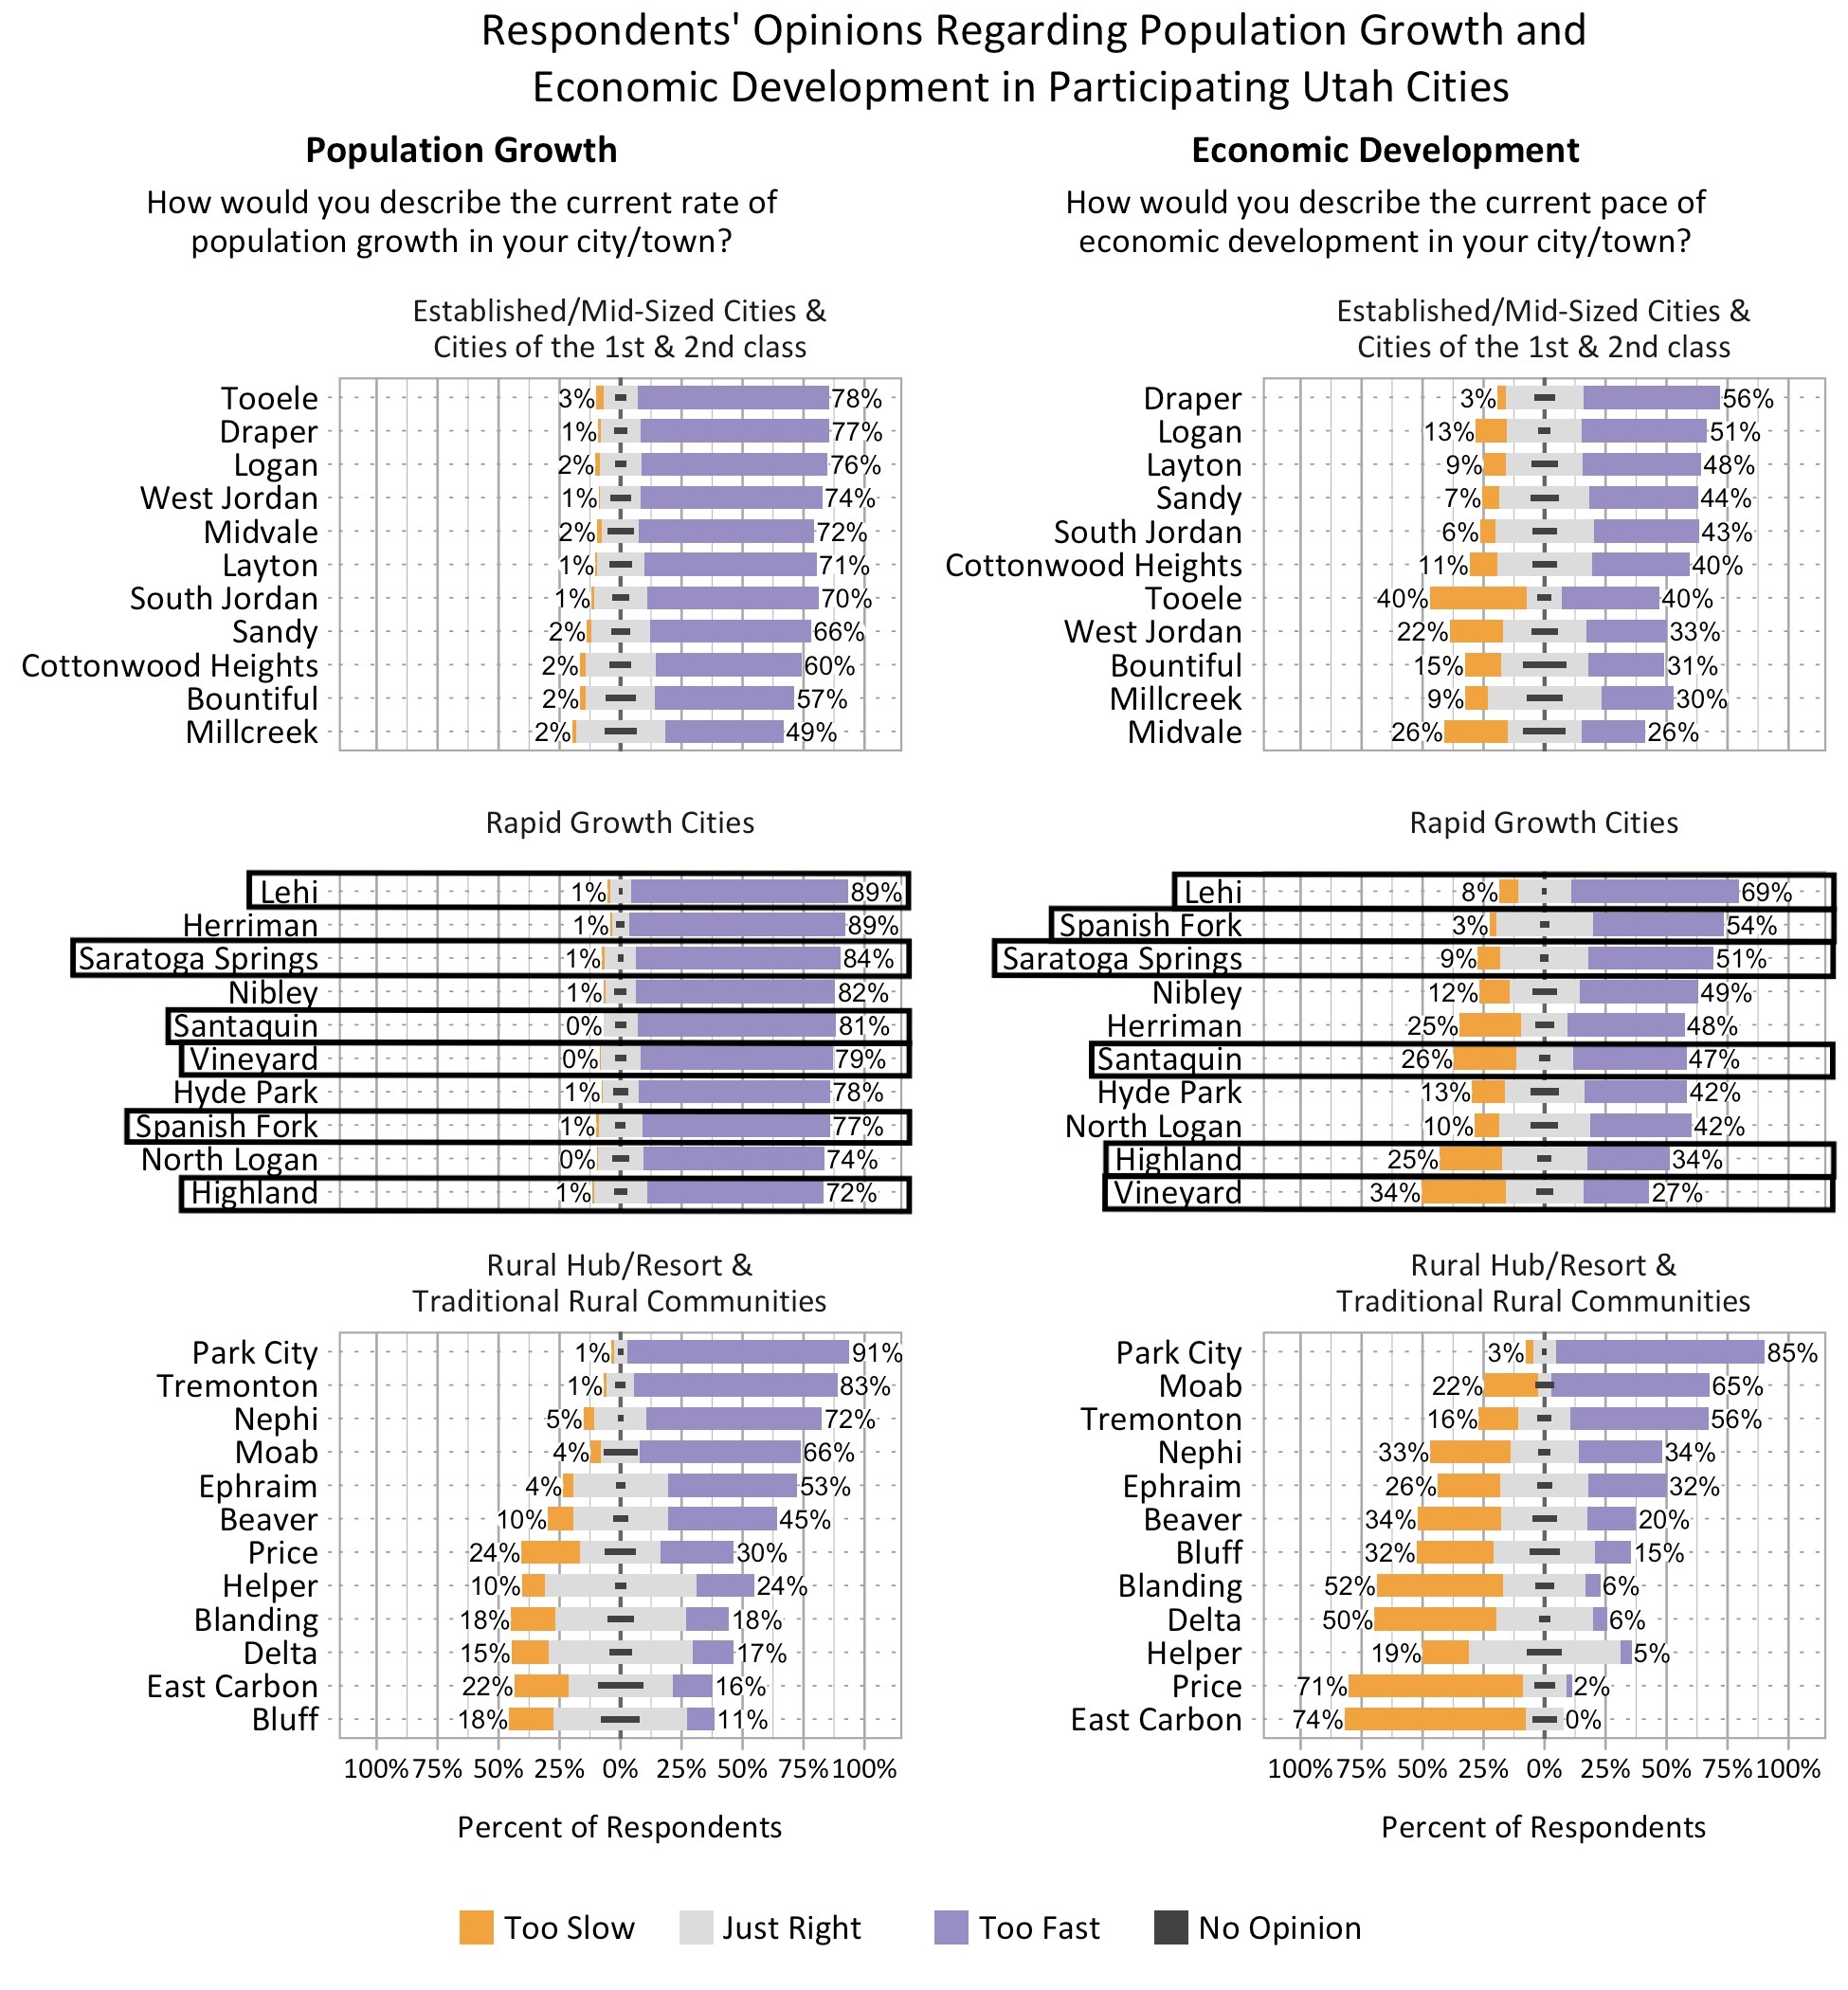
Perspectives on Population Growth and Economic Development
The majority of respondents felt the Rate of Population Growth was too fast, while respondents were more divided over the Pace of Economic Development.
Concerns for the Future of Utah County Study Cities
Top concerns varied across the study cities in Utah County as follows:
Moderate to Major Concerns by Over Two-Thirds of Respondents
- Highland
- Water Supply 88%
- Air Quality 75%
- Affordable Housing 75%
- Roads & Transportation 67%
- Lehi
- Water Supply 93%
- Air Quality 90%
- Roads & Transportation 90%
- Affordable Housing 86%
- Access to Public Land 70%
- Santaquin
- Affordable Housing 77%
- Roads & Transportation 74%
- Air Quality 67%
- Saratoga Springs
- Roads & Transportation 92%
- Water Supply 88%
- Air Quality 84%
- Affordable Housing 79%
- Spanish Fork
- Affordable Housing 82%
- Water Supply 77%
- Roads & Transportation 74%
- Air Quality 72%
- Vineyard
- Roads & Transportation 81%
- Air Quality 79%
- Water Supply 77%
- Public Safety 68%
- Access to Quality Food 67%
Other concerns were raised by respondents who filled in the “other” category. The most frequently mentioned topics specific to each city included:
- Traffic/traffic safety and high-density housing in Highland
- Traffic and overdevelopment in Lehi
- No infrastructure for new growth in Santaquin
- Traffic and trail systems in Saratoga Springs
- Traffic and overdevelopment in Spanish Fork
- Overpopulation and high-density housing in Vineyard
Open Comments Relating to Value
Respondents were asked to comment on what they value most about their cities at the end of each survey. All responses have been read, compiled, and then shared with city leaders. The main themes in Utah County in response to this question were valuing the overall social climate of their cities. Many people also valued the location of their cities and the many recreational opportunities available.