Herriman Wellbeing Survey Findings
May 2021

Summary
Herriman City is one of 30 cities currently participating in the Utah Wellbeing Survey Project and has been involved since 2020. This project is designed to assess the wellbeing and local perspectives of city residents and to provide information to city leaders to inform their general planning process. It is important to note that the 2021 survey was conducted during the COVID-19 pandemic. This was intentional as the last round of wellbeing surveys were conducted in 2020 prior to the pandemic. This allows us to assess changes at this unique period of time. Future surveys are anticipated to gauge recovery.
What is in this report?
This report describes findings from the 2021 Herriman survey with initial information on changes since 2020 and some comparative information with other project cities. Feedback from city leaders and planners is welcome. We will continue with analysis and reporting.
How was the survey conducted?
In February 2021, Herriman City advertised the survey via newsletter, social media, city website, and electronic marquee signs. All city residents age 18+ were encouraged to take the online Qualtrics survey.
- 231 viable surveys were recorded in this 2021 survey effort with 77% complete responses.
- The 2020 survey had 375 responses. The 2020 Herriman Wellbeing Survey report is available on the Utah Wellbeing Project website.
-
The adult population of Herriman was estimated at 23,942 based on the 2015-2019 American Community Survey. The 231 survey responses represent 1.0% of the adult population and have a conservative margin of error of 6.42%.
Key Findings in Herriman
Overall Personal Wellbeing and Community Wellbeing in Herriman were below average among 29 study cities.
Highest Rated Wellbeing Domains:
- Living Standards
- Safety and Security
Most Important Wellbeing Domains:
- Safety and Security
- Mental Health
- Physical Health
- Living Standards
Red Zone Domain: (High Importance, Low Rating)
- Local Environmental Quality
- Leisure Time
COVID-19 had greatest impact on Social Connections, Cultural Opportunities, and Mental Health. Overall personal wellbeing declined in last year for 48% of respondents. Wellbeing in Herriman declined in the last year for 54% of respondents. Community wellbeing was more likely to decline for male respondents, those without a college degree and those living in Herriman for more than 5 years.
Manufacturing and Extractive Industry and Residential Development were seen to have negative influences on wellbeing for the majority of respondents, though Natural Landscapes were highly positive.
The majority of respondents felt Population Growth in Herriman was too fast. Respondents were more divided about the Pace of Economic Development.
Top concerns for the future of Herriman were:
- Roads and Transportation (90% Moderate or Major Concern)
- Air Quality (78% Moderate or Major Concern)
- Water Supply (76% Moderate or Major Concern)
- Public Safety (69% Moderate or Major Concern)
- Recreation Opportunities (67% Moderate or Major Concern)
- Access to Public Land (67% Moderate or Major Concern)
Many also mentioned concern about too much high-density housing in their comments.
Adding capacity to major roads and intersections was ranked as the top transportation need by 64% of respondents.
What do people value most about Herriman ?
Small town feel, good trails, access to nature, good location, and feelings of safety.
Survey Respondent Characteristics
| Full Time Residents of Herriman | 99.1% |
| Part Time Residents of Herriman | 0.9% |
| Length of Residency - Range | 1-43 years |
| Length of Residency - Average | 8 years |
| Length of Residency - Median | 5 years |
| Length of Residence 5 Years or Less | 53.2% |
Demographic characteristics of the survey respondents are compared below with U.S. Census information from the 2015-2019 American Community Survey. As the table shows, people who are married were particularly overrepresented and people age 18-39 were particularly underrepresented, but otherwise, the 2021 respondents were quite representative of Herriman. Not all respondents provided demographic information. Weighting was not used in any of the analysis for the findings presented below. Updates will be provided later in 2021 to account for weighting by demographic characteristics.
Table 1
Demographic Characteristics of Survey Respondents and U.S. Census Data for Herriman
| Demographic Characteristics | Online Surveys | American Community Survey 2016-2020 Estimates |
|
|---|---|---|---|
| 2020 (N=375) | 2021 (N=231) | ||
| Age 18-29 | 11.2% | 12.9% | 23.8% |
| Age 30-39 | 26.5% | 34.3% | 27.5% |
| Age 40-49 | 20.8% | 34.8% | 23.1% |
| Age 50-59 | 16.0% | 10.7% | 13.9% |
| Age 60-69 | 13.4% | 6.2% | 6.2% |
| Age 70 or over | 12.1% | 1.1% | 5.5% |
| Adult female | 70.7% | 66.9% | 53.1% |
| Adult male | 29.3% | 33.1% | 46.9% |
| No college degree | 46.9% | 52.2% | 61.4% |
| College degree (4-year) | 53.1% | 47.8% | 38.6% |
| Median household income | NA | NA | $102,096 |
| Income under $25,000 | 1.0% | 0.6% | 3.3% |
| Income $25,000-$49,999 | 5.8% | 4.7% | 12.6% |
| Income $50,000 to $74,999 | 14.4% | 12.9% | 16.5% |
| Income $75,000 to $99,999 | 17.0% | 15.3% | 14.3% |
| Income $100,000 to $149,999 | 38.5% | 41.2% | 29.4% |
| Income $150,000 or over | 23.4% | 25.3% | 23.9% |
| Latter-day Saint | 56.6% | 54.4% | NA |
| Other religion | 17.5% | 18.1% | NA |
| No religious preference | 25.9% | 27.5% | NA |
| Hispanic/Latino | NA | 7.9% | 9.0% |
| White | 83.3% | 95.3% | 86.7% |
| Nonwhite | 11.7% (includes Hispanic/Latino) | 4.7% | 13.3% |
| Married | 89.7% | 89.3% | 64.7% |
| Children under 18 in household | 74.5% | 75.3% | 60.8% |
| Employed (combined) | 76.1% | 72.9% | 72.2% |
| Out of work and looking for work | 0.6% | 0.6% | 3.2% |
| Other | 23.3% | 26.5% | 24.5% |
| Own home/owner occupied | NA | 91.0% | 85.0% |
| Rent home/renter occupied/other | NA | 9.0% | 15.0% |
Overall Personal Wellbeing and Overall Wellbeing in Herriman
Survey participants were asked about their overall personal wellbeing and overall community wellbeing in Herriman. These wellbeing indicators both measured on a 5-point scale from very poor (1) to excellent (5). The average personal wellbeing score in Herriman was 3.86, with 73% of respondents indicating their wellbeing at a 4 or 5 on the 5-point scale. The average score for community wellbeing in Herriman was 3.47 with 54% of respondents indicating city wellbeing at a 4 or 5 on the 5-point scale.


The graph below compares 2020 and 2021 survey data for personal wellbeing score and community wellbeing. The number of respondents differed between years and individuals are not tracked from year to year. The average personal wellbeing score declined from 3.99 to 3.86 and the average community wellbeing score declined from 3.54 to 3.47 in the last year.

Perceived Changes to Wellbeing in the Last Year
The COVID-19 pandemic dominated much of 2020. Survey respondents were asked in early 2021 if their overall personal wellbeing or wellbeing had changed in the last year. Survey findings show that personal wellbeing declined for 48% of Herriman respondents and 54% indicated that wellbeing in Herriman declined as well.


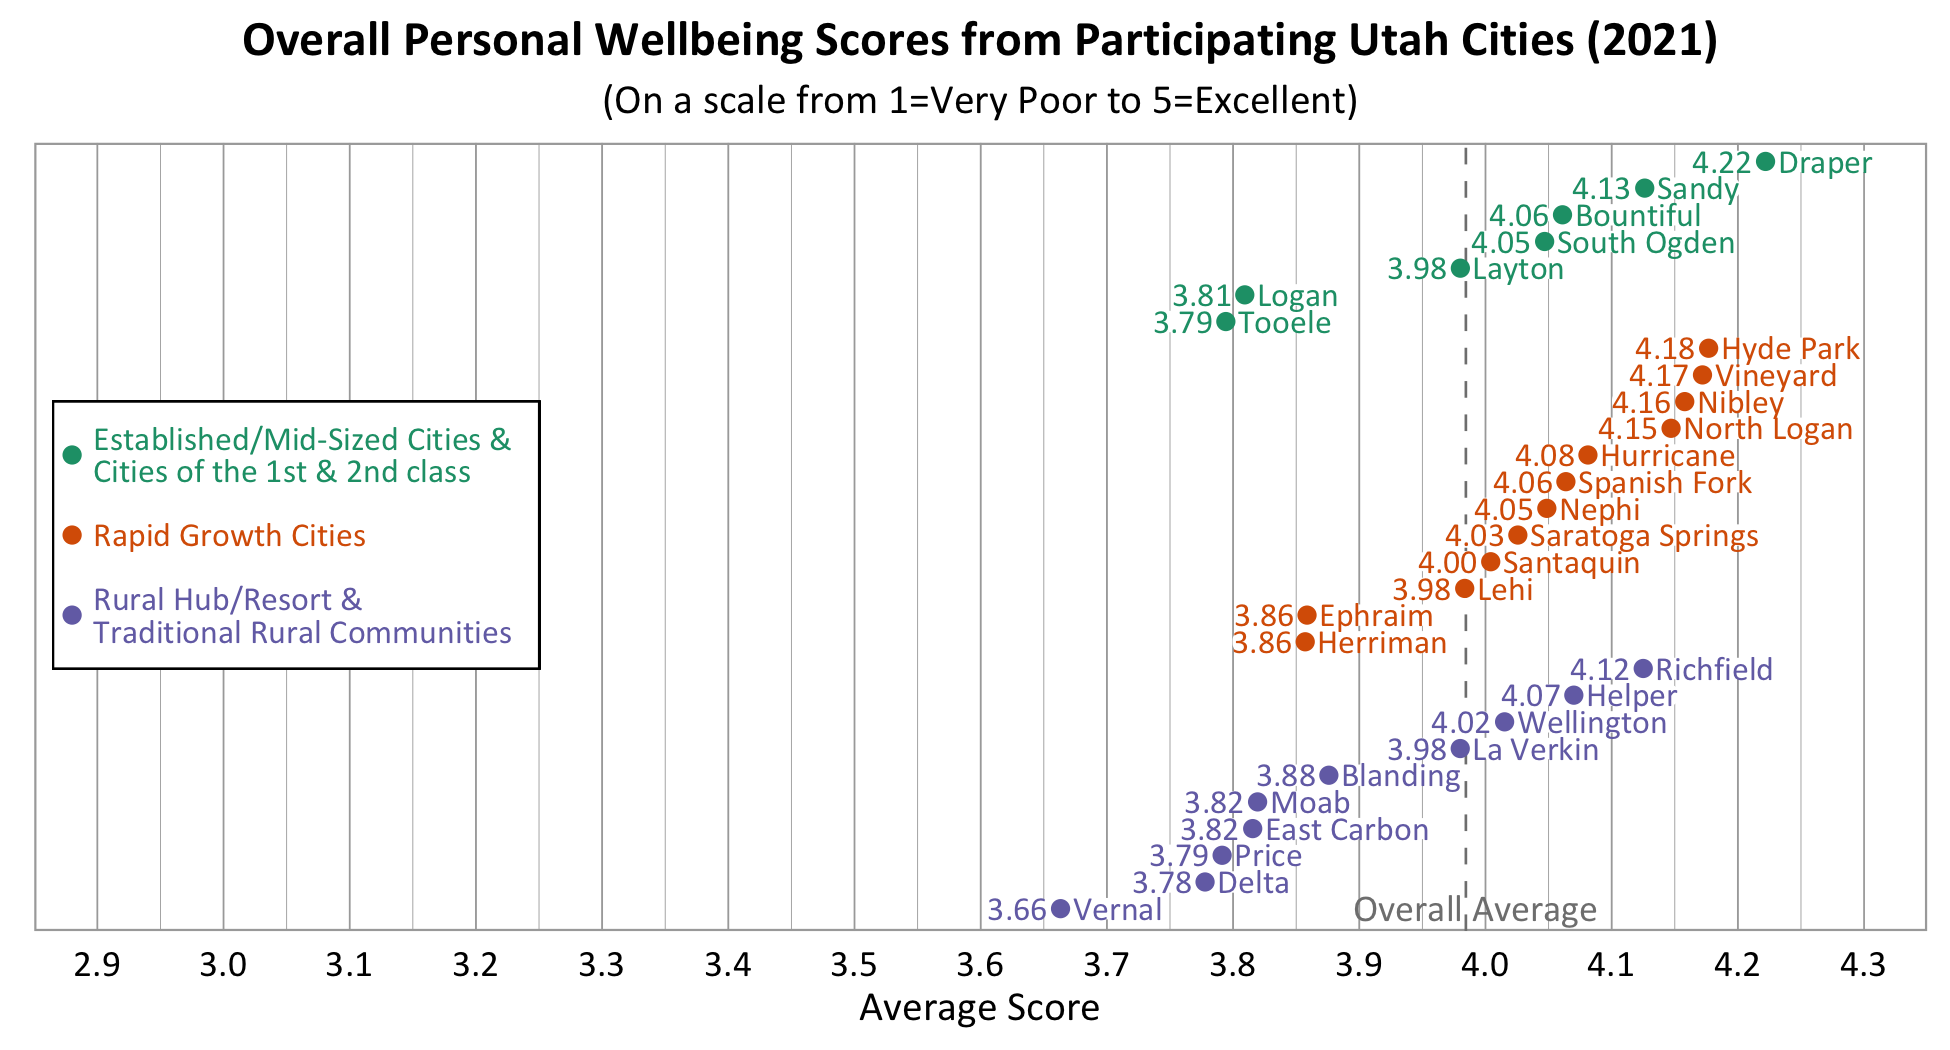
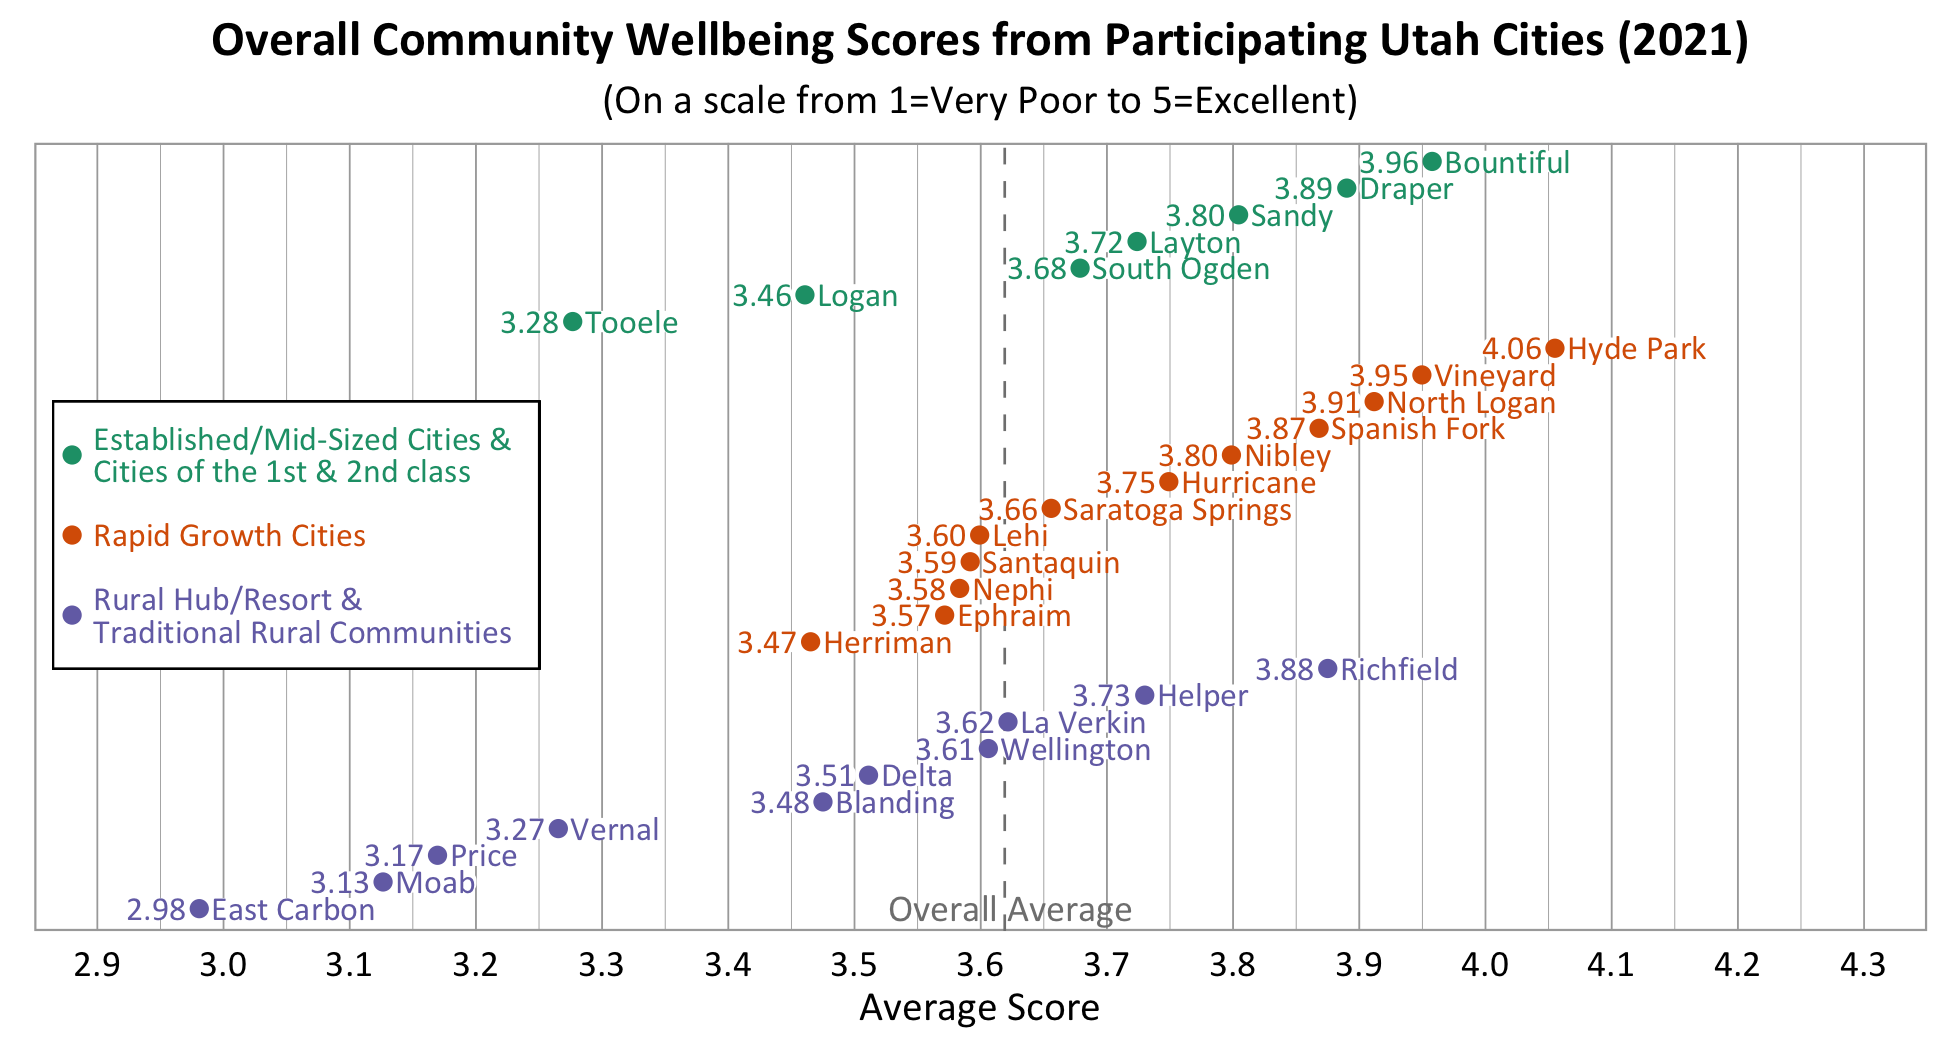
Comparing Wellbeing Across Utah Cities
The Utah League of Cities and Towns classifies Herriman as a Rapid Growth City. Within this cluster of cities, Herriman falls below average in terms of the average overall personal wellbeing score and average community wellbeing score. Herriman is statistically significantly lower than North Logan, Nibley, Vineyard, and Hyde Park in terms of overall personal wellbeing and is significantly lower than Spanish Fork, North Logan, Vineyard, and Hyde Park in terms of overall community wellbeing.
Wellbeing Domains in Herriman
According to national and international entities that track wellbeing, there are a number of common dimensions or domains of wellbeing. In this survey, respondents rated ten domains on a 5-point scale from poor to excellent, suggesting how their wellbeing was doing well in each area. They were also asked to indicate the importance of each domain to their overall personal wellbeing on a 5-point scale from not at all important to very important. The top three highest rated wellbeing domains for respondents in Herriman were Living Standards, Safety and Security, and Education. The four most important wellbeing domains were Safety and Security, Mental Health, Physical Health, and Living Standards.


Wellbeing Matrix for Herriman
The graph below illustrates the relationship between the average rating and the average importance of wellbeing domains for survey respondents from Herriman. Living Standards and Safety and Security were highly important and rated above average among the domains. Local Environmental Quality and Leisure Time fell into the red quadrant or “Red Zone”, indicating that they were of higher-than-average importance, but rated lower than average. Physical Health and Mental Health approach this quadrant as their importance score was above average, but ratings are near the overall average rating.

How did the COVID-19 Pandemic Impact Wellbeing Domains?
The COVID-19 pandemic’s impact was most strongly felt regarding Social Connections, Cultural Opportunities and Mental Health. Improvements were reported in Connection to Nature for 18% of respondents.

The following relationships were found in Herriman between demographic variables and declines due to COVID-19 pandemic:
-
Community wellbeing was more likely to decline for male respondents, those without a college degree, and those living in Herriman more than 5 years.
-
Cultural opportunities were more likely to decline for those with a college degree.
-
Education was less likely to decline for females.
-
Leisure time was more likely to decline for Latter-day Saints than Agnostics/Atheists/No Preference.
-
Safety and security was more likely to decline for those age 40-59 than age 60+.
The graphs below show how the domains were rated in 2020 and 2021 by Herriman residents. Note that the survey method was different in 2019 (with iPads in public places) and the number of respondents changed over time.

How are Demographic Characteristics Related to Wellbeing?
The demographic variables age, gender, college degree, religion, and income were found to have varying relationships with wellbeing perspectives among 2021 Herriman respondents as shown in the table below based on a multivariate generalized linear model (significance based on p < 0.1). The +/- sign indicates whether the demographic group was statistically significantly higher or lower than others in that category. Color indicates the strongest relationships (p< .05).
Relationship Between Demographic Characteristics and Wellbeing Domains in Herriman
| Domains Rated | Demographic Variables | |||||
|---|---|---|---|---|---|---|
| Age 60+ | Female | College Degree | Latter-day Saint | Higher Income | Resident 5 Years or Less | |
| Wellbeing Ratings | ||||||
| Overall Personal Wellbeing | ||||||
| Wellbeing in Herriman | + | + | ||||
| Connection to Nature | ||||||
| Cultural Opportunities | + vs A/A/NRP | |||||
| Education | + | + vs A/A/NRP | ||||
| Leisure Time | + vs A/A/NRP | + Over $150,000 > Under $75,000 |
||||
| Living Standards | + | + | + Over $150,000 > Under $75,000 |
|||
| Local Environmental Quality | ||||||
| Mental Health | ||||||
| Physical Health | ||||||
| Safety & Security | + | |||||
| Social Connections | ||||||
| Age 60+ | Female | College Degree | Latter-day Saint | Higher Income | Resident 5 Years or Less | |
| Domains | Domain Importance | |||||
| Connection to Nature | – vs Other | |||||
| Cultural Opportunities | + | + | – vs A/A/NRP | |||
| Education | + | |||||
| Leisure Time | + | |||||
| Living Standards | + | |||||
| Local Environmental Quality | + |
– vs A/A/NRP | ||||
| Mental Health | + | |||||
| Physical Health | + | |||||
| Safety and Security | + | |||||
| Social Connections | + |
|||||
Community Action & Connections in Herriman
Survey participants were asked about community actions and community connection in Herriman. Both questions were scored on a 5-point scale from not at all (1) to a great deal (5). When asked about the degree to which people take action together in response to local problems or opportunities in Herriman, the average score was 3.05. When asked about the degree they feel connected to their community, the average score was 2.72.


Female respondents reported higher perceptions that people in Herriman take action than males. Latter-day Saints indicated higher levels of community connection than Agnostic/Atheist/No Religious Preference. This is based on a multivariate generalized linear model with unweighted data (significance based on p < 0.1). Color indicates the strongest relationships (p< .05).
Demographic Characteristics and Community Questions
| Community Questions | Age 60+ | Female | College Degree | Latter-day Saint | Higher Income | Resident 5 Years or Less |
|---|---|---|---|---|---|---|
| Do people in Herriman take action? | + | |||||
| Do you feel connected to your community? | + vs A/A/NRP |
A/A/NRP = Agnostic/Atheist/No Religious Preference
A significant, positive relationship was found between individuals’ community connection and overall personal wellbeing.

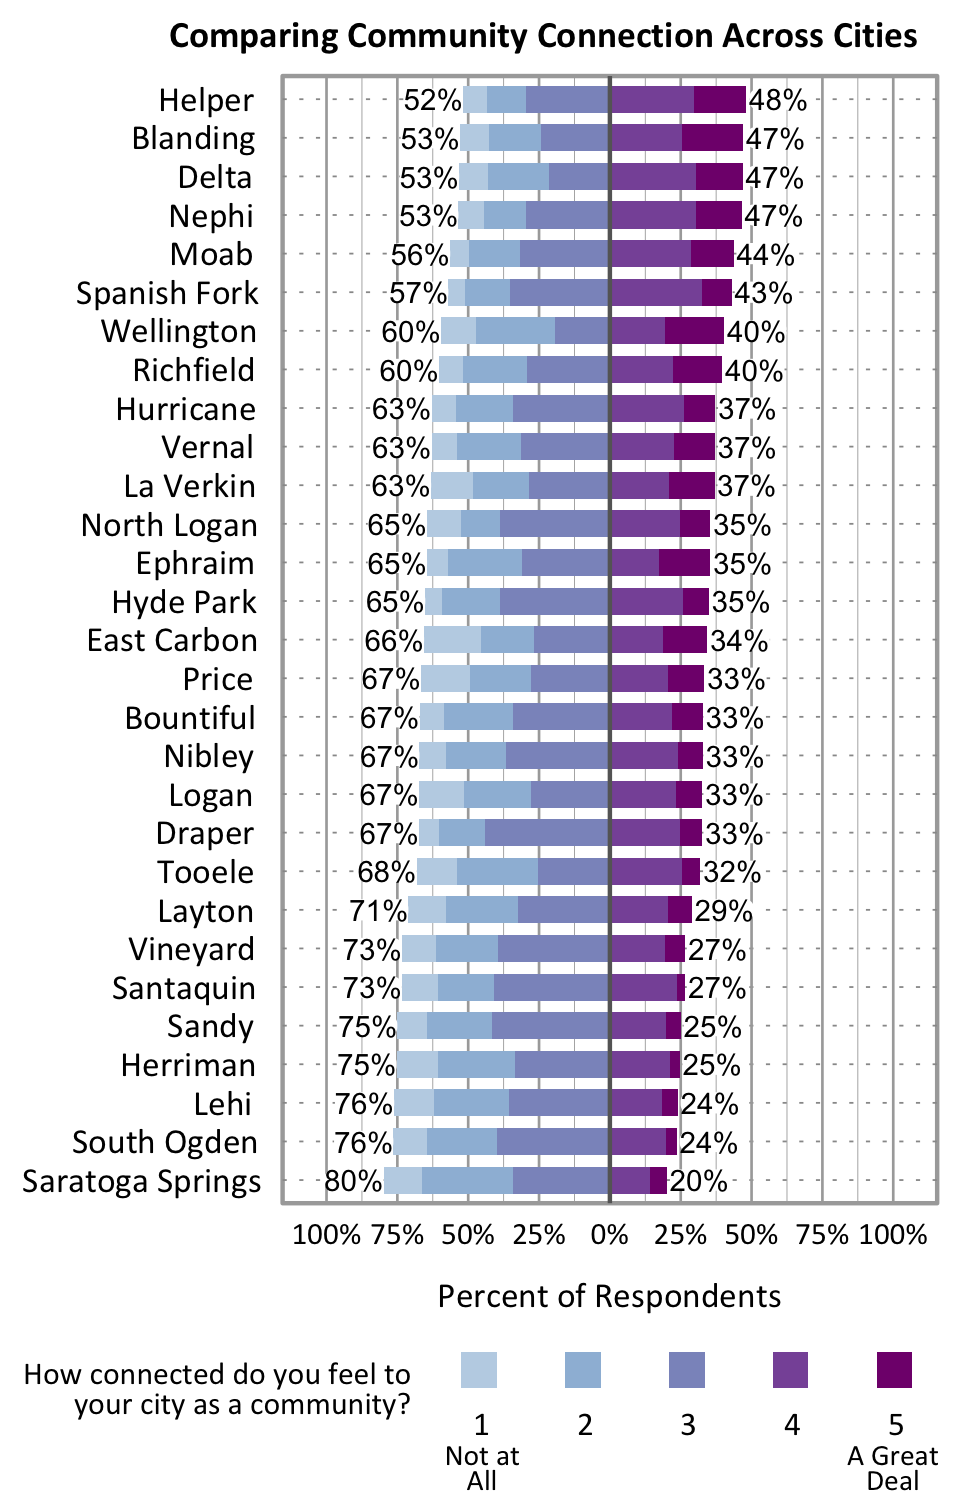
Comparing Community Action and Connection Across Cities
The graphs below show how Wellbeing Project cities compare on the degree to which people take action in response to local problems and opportunities and how connected people feel to their city as a community. Herriman is in the lower half on perceived community action and community connection based on the number of people indicating a 4 or 5 on a 5-point scale.

Participation in Community Activities
Respondents were asked to indicate whether or not they participated in seven different activities and a community activeness score was calculated by adding activities. The average community activeness score for Herriman was 2.74. Church group activities (50%) was the most common activity for respondents, followed by contacting a public official about an issue (44%).

Influence of Landscape on Wellbeing
Survey participants were asked about the influence of landscape features on their wellbeing. Natural landscape including mountains, trails, rivers and streams, and city parks were found to have an overwhelmingly positive influence on wellbeing. In terms of development and industry in the landscape, respondents were more divided. Extractive industry was indicated to have a particularly negative influence on wellbeing.

Perspectives on Population Growth and Economic Development
The vast majority of Herriman survey respondents (90%) indicated they felt population growth was too fast. Regarding the pace of economic development, respondents were more divided with 39% indicating it is too fast, 28% indicating it is too slow, and 27% indicating just right.


The graphs below show how Herriman compares to other participating cities in the Wellbeing Project on these perceptions of population growth and economic development.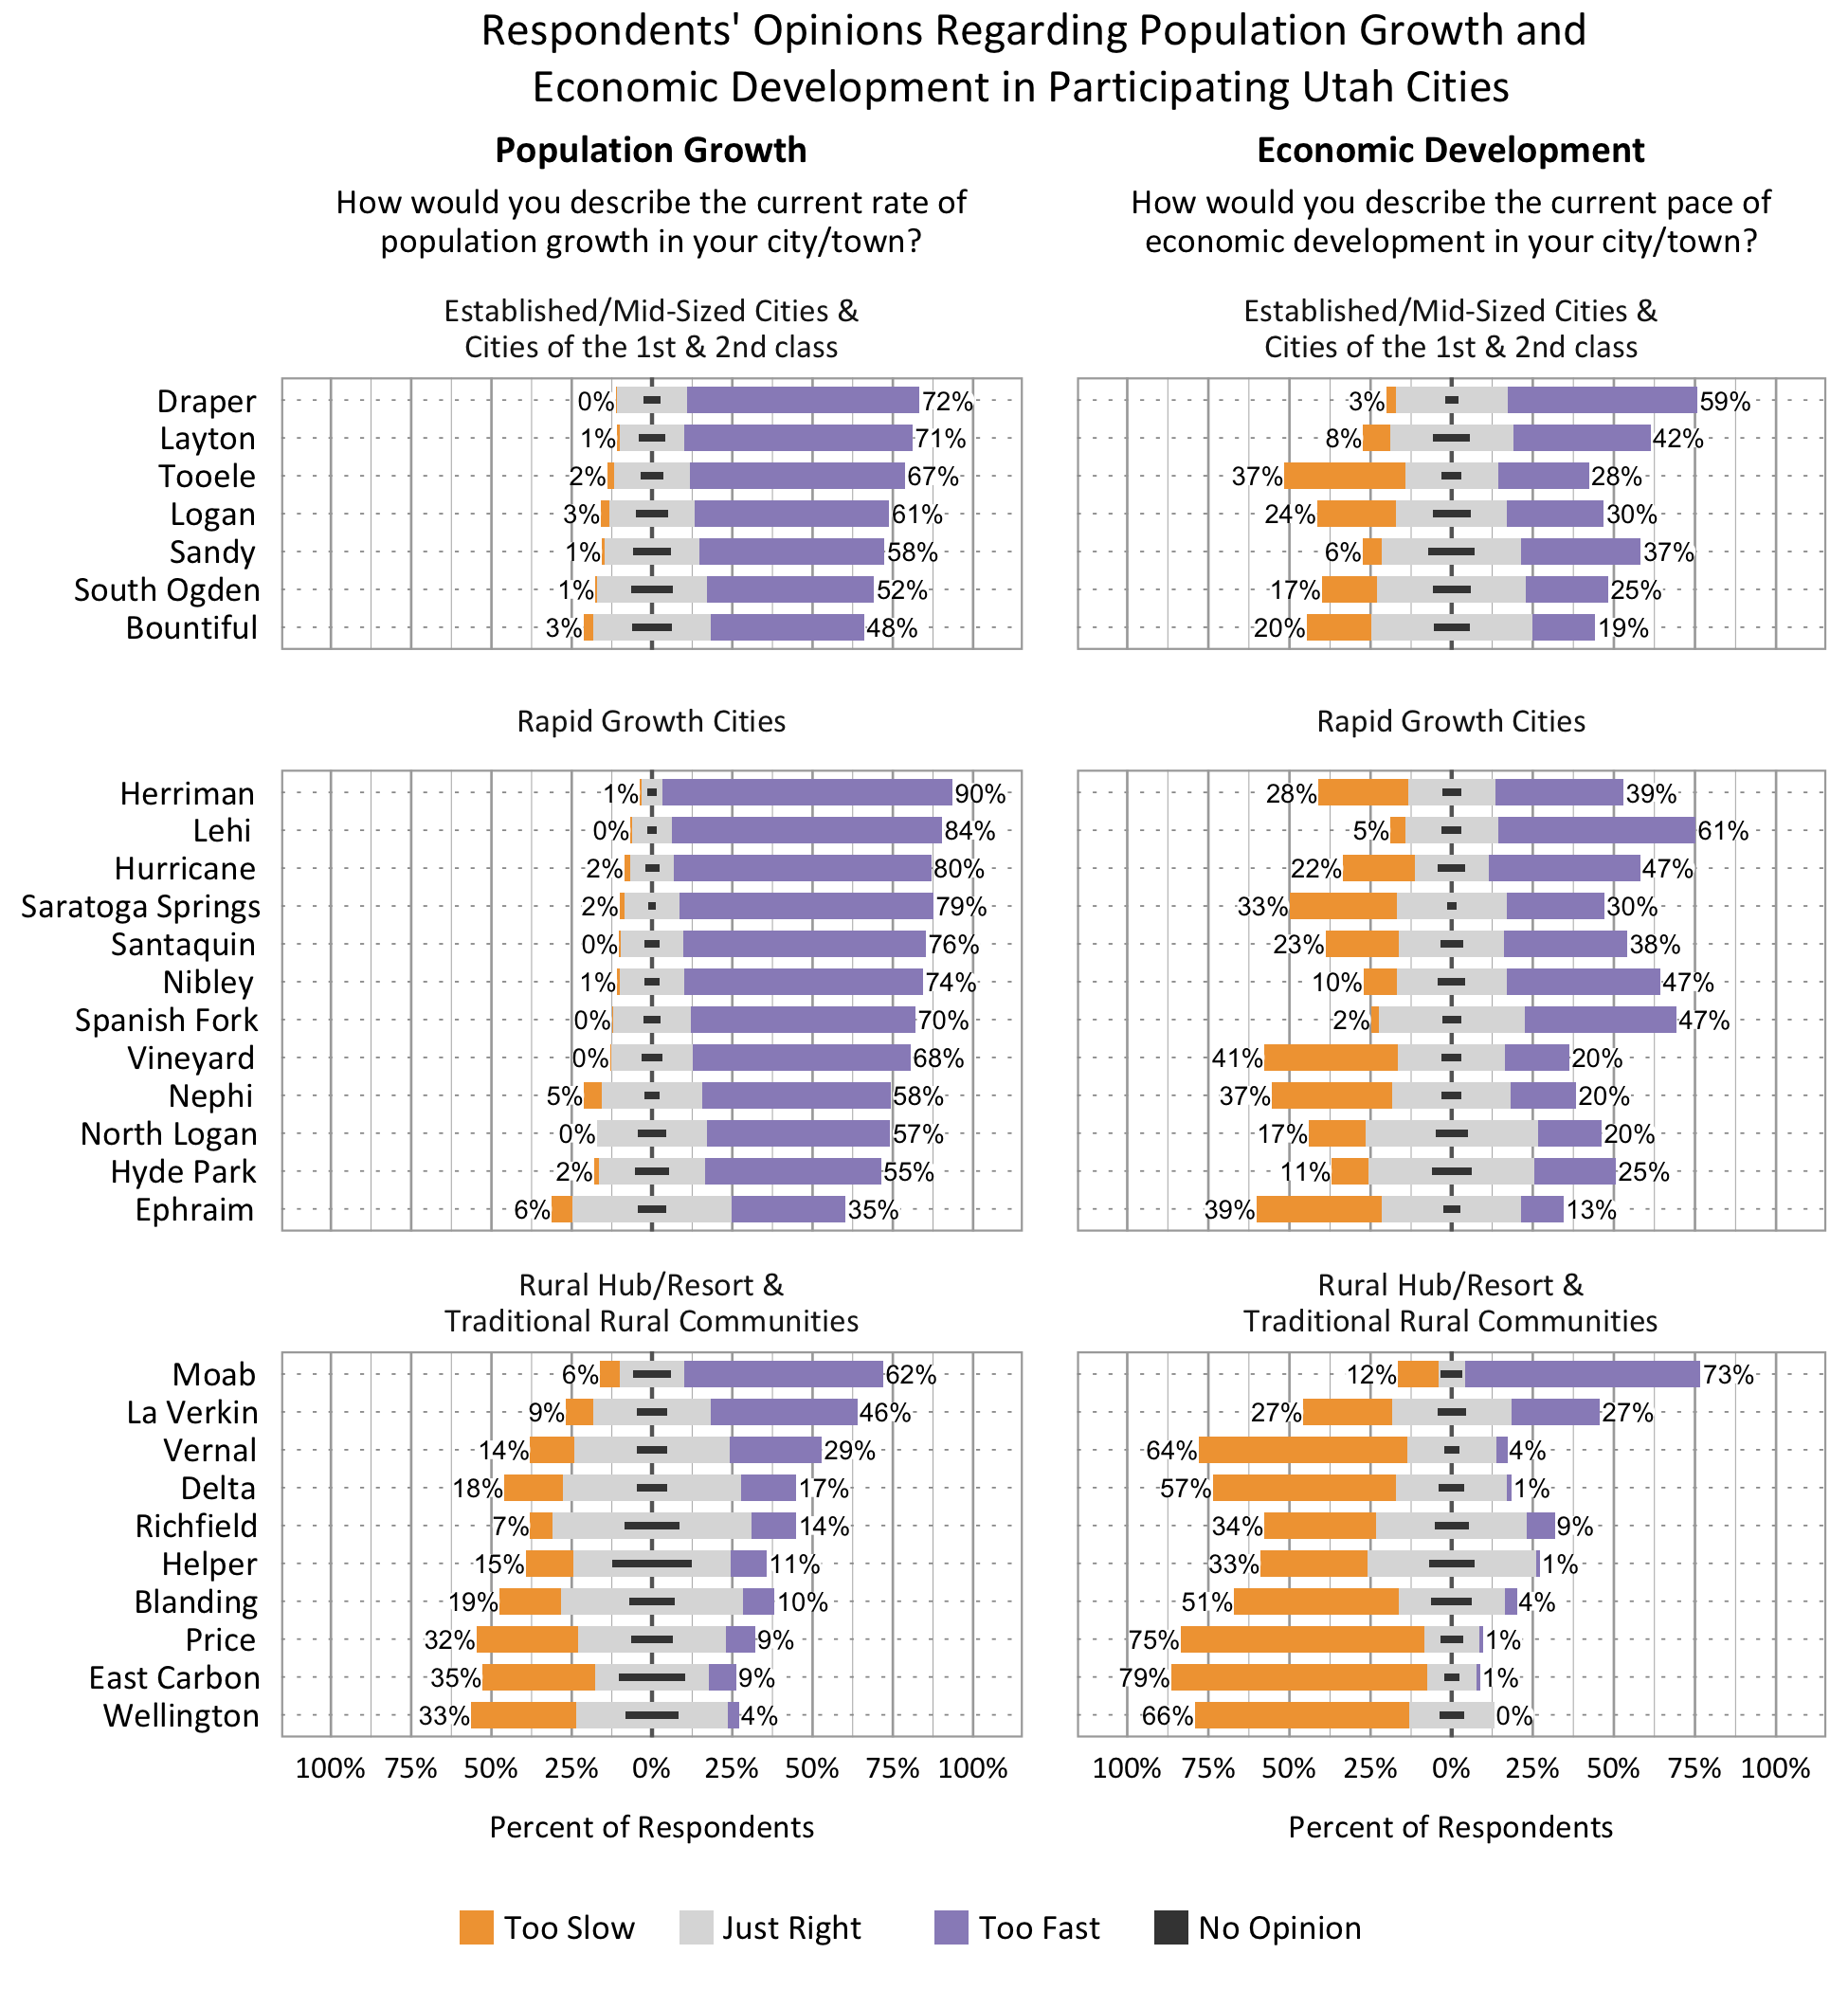
Concerns in Herriman
Survey respondents indicated the degree to which a number of possible local issues were a concern as they look to the future of Herriman. Roads and Transportation, Air Quality, and Water Supply were the top three concerns with 76% to 90% of respondents indicating these were moderate or major concerns.

Other concerns were raised by 56 respondents who filled in the “other” category.
Other Concerns Mentioned |
|
|
Too much high-density housing/multi-family housing (26) |
Population, population density, overcrowding (8) |
|
Traffic (6) |
Growth, construction (2) |
|
No east-west roadway between 134th S and Porter Rockwell. Need to open up 144th and 150th to account for population growth, not enough roads (2) |
Bullying at school (1) |
|
Declining under Biden (1) |
Drug dealing neighbor (1) |
|
Education (1) |
Election integrity (1) |
|
Have lost what it was – could’ve done better (1) |
Insufficient infrastructure (1) |
|
Local election officials (1) |
No diversity of building types in HTC (1) |
|
Number of cars parked street-side and causing safety hazards (1) |
Olympia Hills (1) |
|
Open space (1) |
Property protection (1) |
|
Restrictions and “mandates” (1) |
Sound pollution (1) |
|
Transportation out of city (1) |
Well thought out development (1) |
|
Youth mental health support (1) |
|
Transportation and Commuting in Herriman
On transportation
The survey asked, “Thinking specifically about transportation as you look to the future of Herriman, please rank the following in the order of importance to you:”
- Adding capacity to major roads and intersections
- Making transportation corridors and intersections more visually appealing with landscaping or urban design elements
- Working with UTA to improve transit service
- Enhancing bicycle and pedestrian paths, sidewalks, and trails
- Improving and/or adding crosswalks to provide safe walking/biking routes
- Improving the connections between neighborhoods and neighboring communities
Adding Capacity to Major Roads and Intersections was Ranked #1 by 64% of Respondents
There was little differentiation among the other options, though visual appeal and working with UTA were ranked the lowest options.
57% of Herriman Respondents Commute for Work
96% Commute Via Personal Vehicle
Average Commute 29 Minutes
(Range = 2-60 Minutes)
There was no statistically significant correlation between commuting or commute time and overall personal wellbeing.
Summary of Open Comments
The survey included opportunities in the survey were provided for respondents to share their ideas about Herriman with one question on what they value most about their city and another for any additional comments on wellbeing. A summary of values is below. Analysis is ongoing regarding all additional comments and a summary will be added to the report later in 2021.
Key themes in response to “Please tell us what you value most about living in Herriman ”

Contact Information
Dr. Courtney Flint
courtney.flint@usu.edu
435-797-8635
On This Page
The Utah League of Cities and Towns is a collaborator on this project and the following people have contributed to this effort in many ways: Casey Trout, Rachel Sagers, Madison Fjeldsted, Jordan Hammon, and Sarah Wilson.
Utah State University is an affirmative action/equal opportunity institution and is committed to a learning and working environment free from discrimination, including harassment. For USU’s non-discrimination notice, see equity.usu.edu/non-discrimination.