La Verkin Wellbeing Survey Findings
May 2020
Dr. Courtney Flint
Utah State University Extension

Summary
La Verkin is one of 25 cities participating in the Utah Wellbeing Project. This project is designed to assess the wellbeing and local perspectives of city residents and to provide information to city leaders to inform their general planning process.
Eighteen cities participated in an online survey effort in February and March 2020. La Verkin City advertised the survey via social media. All city residents age 18 and over were encouraged to take the online Qualtrics survey, available from February 10, 2020 to March 13, 2020.
A total of 95 completed surveys were recorded during this effort. This report contains descriptive information based on La Verkin resident responses and comparisons with other cities from this most recent survey effort.
Respondent Characteristics
Nearly all of the La Verkin survey respondents (94.7%) were full-time residents. The length of residency ranged from 1 to 50 years with an average of 12.2 years. Nearly two-thirds of respondents (64.3%) of the respondents lived in La Verkin for more than 5 years.
Table 1 details the demographic characteristics of the respondents and allows for comparison with U.S. Census information from the 2014-2018 American Community Survey. As the table shows, females, those age 40-59, those with middle incomes ($75,000-$99,999) and those with college degrees are overrepresented in the resulting survey sample. The survey under-represents those age 18-39 and 60+, those with lower incomes, and those who are nonwhite or Latino. There is no census comparison for religion. These characteristics should be taken into consideration when interpreting the findings from the survey, as survey respondents may not be fully representative of La Verkin residents.
Table 1
Demographic Characteristics of Survey Respondents and U.S. Census Data for La Verkin
| Demographic Characteristics | La Verkin iPad Survey 2020 (27 Respondents) |
La Verkin Online Survey 2020 (95 Respondents) |
American Community Survey 2016-2020 Estimates |
|---|---|---|---|
| Age 18-39 | 40.7% | 26.2% | 42.6% |
| Age 40-59 | 25.9% | 52.4% | 25.9% |
| Age 60 or Over | 34.3% | 21.4% | 31.5% |
| Female | 66.7% | 68.7% | 51.4% |
| Male | 33.3% | 31.3% | 48.6% |
| No college degree | 76.0% | 67.9% | 78.0% |
| College degree (4-year) | 24.0% | 32.1% | 22.0% |
| Median household income | NA | NA | $49,954 |
| Income Under $50,000 | 32.0% | 29.8% | 50.0% |
| Income $50,000 to $74,999 | 36.0% | 29.8% | 33.6% |
| Income $75,000 to $99,999 | 12.0% | 29.8% | 7.6% |
| Income $100,000 to $149,999 | 8.0% | 8.3% | 6.6% |
| Income $150,000 or over | 12.0% | 2.4% | 2.2% |
| Religion: Church of Jesus Christ of Latter-day Saints |
44.4% | 51.8% | NA |
| Other religion | 22.2% | 28.9% | NA |
| No religious preference | 14.8% | 19.3% | NA |
| White (non-Latino) | 88.0% | 92.8% | 82.8% |
| Nonwhite or Latino | 12.0% | 7.2% | 17.2% |
| Children under 18 in household | NA | 41.7% | 44.1% |
| Employed (combined) | NA | 61.4% | 58.9% (in labor force age 16+) |
| Out of work and looking for work | NA | 1.2% | 3.5% (unemployed) |
| Other | NA | 38.4% | 37.7% (not in labor force) |
Overall Personal Wellbeing and Overall Wellbeing in La Verkin
Survey participants were asked about their overall personal wellbeing and overall community wellbeing in La Verkin. These wellbeing indicators are both measured on a 5-point scale from very poor (1) to excellent (5). The average personal wellbeing score among La Verkin respondents was 4.18, with 79% of respondents indicating their wellbeing at a 4 or 5 on the 5-point scale. The average score for community wellbeing in La Verkin was 3.69.


The average personal wellbeing score in La Verkin falls above average as compared to the wellbeing scores for all cities surveyed in early 2020. The Utah League of Cities and Towns classifies La Verkin in the “Rapid Growth Cities” group, along with eight other cities in this study as indicated in the graph below. La Verkin is above average on personal wellbeing scores in this group, but there is no statistically significant difference in the average wellbeing score among these cities.

Wellbeing Domains in La Verkin
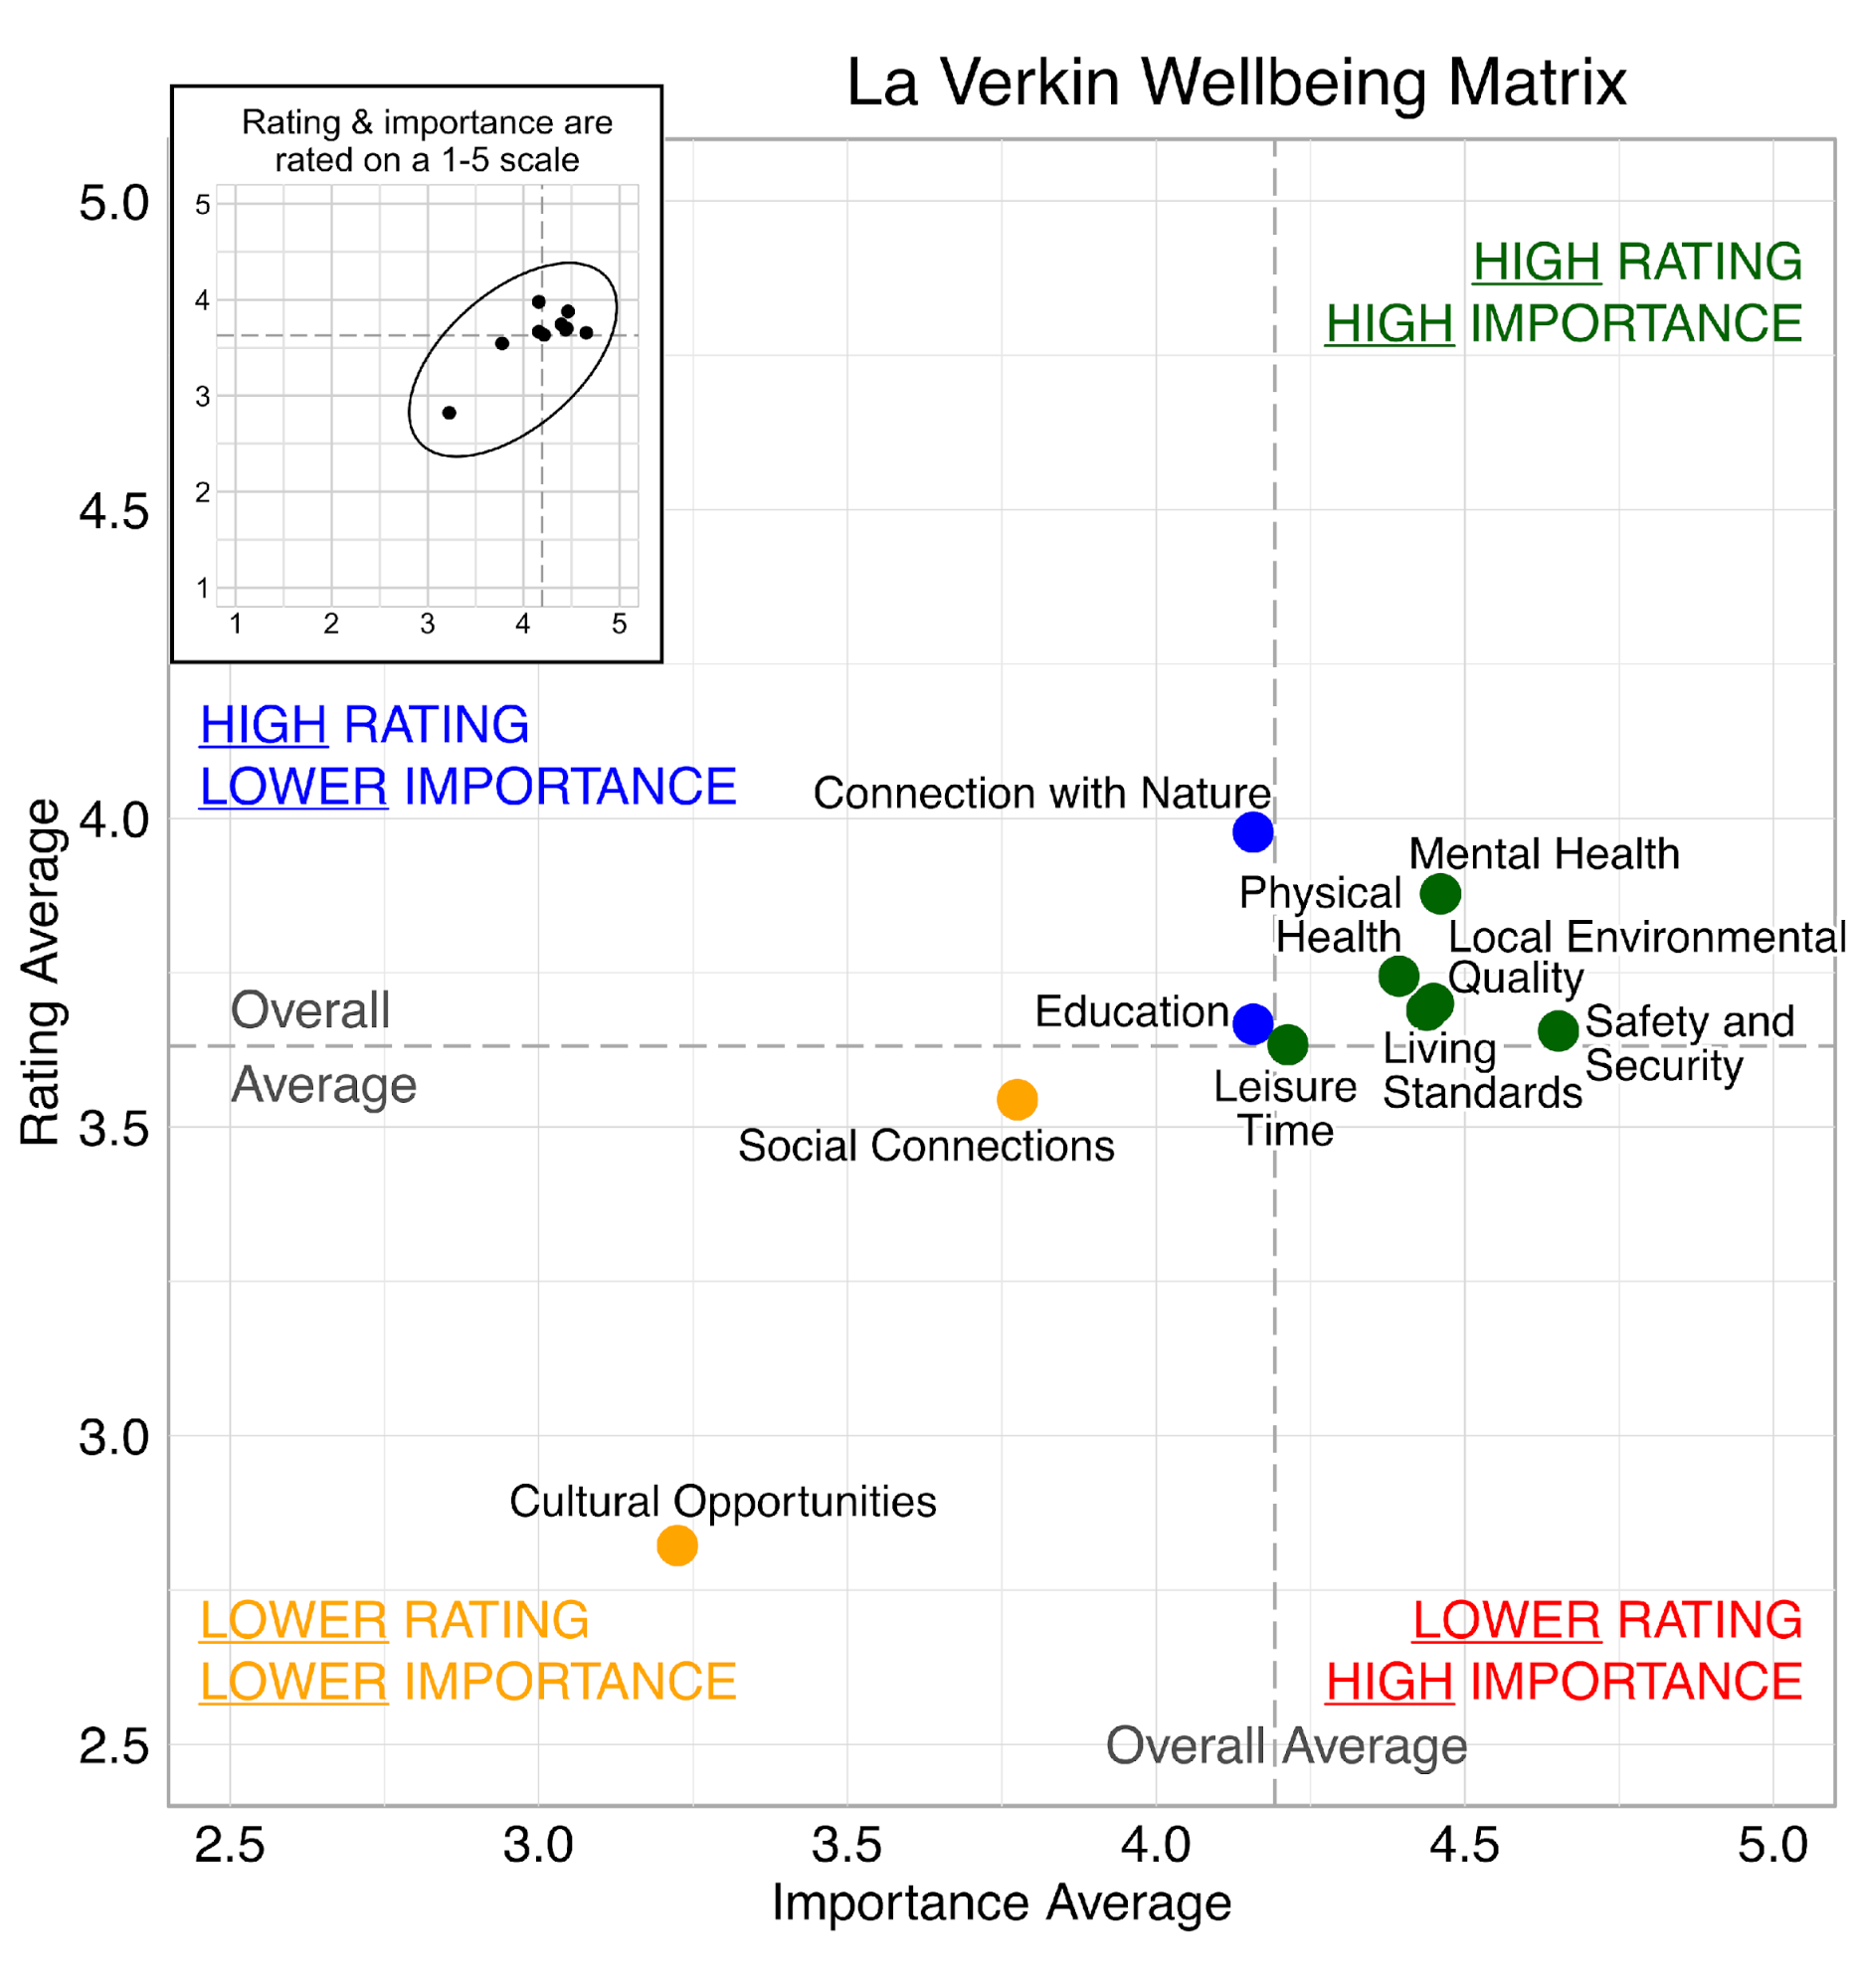
According to national and international entities tracking wellbeing, a number of common domains make up wellbeing. In this survey, respondents rated ten domains on a 5-point scale from poor to excellent, and indicated their importance to their overall personal wellbeing on a 5-point scale from not at all important to very important. Based on percentage with a good or excellent rating, the top three highest rated wellbeing domains for respondents were Connection with Nature, Mental Health, and Safety and Security. The three most important wellbeing domains were Safety and Security, Living Standards, and Mental Health.


The demographic variables for age, gender, religion and income were significantly related to various wellbeing perspectives among La Verkin respondents. These relationships are shown in Table 2 and are based on a multivariate generalized linear model using the categories from Table 1, excluding children in household and employment.
Table 2
Relationship Between Demographic Characteristics and Wellbeing Domains
| Domains Rated | Demographic Variables | |||||
|---|---|---|---|---|---|---|
| Age 60+ | Female | College Degree | Latter-day Saint | Higher Income | Nonwhite or Latino | |
| Wellbeing Ratings | ||||||
| Overall Personal Wellbeing | ||||||
| Wellbeing in La Verkin | ||||||
| Connection to Nature | ||||||
| Cultural Opportunities | ||||||
| Education | ||||||
| Leisure Time | – vs no religious preference |
|||||
| Living Standards | + | |||||
| Local Environmental Quality | – | |||||
| Mental Health | ||||||
| Physical Health | ||||||
| Safety & Security | ||||||
| Social Connections | + vs no religious preference |
+ $150,000+ > $100,000-$149,999 | – | |||
| Age 60+ | Female | College Degree | Latter-day Saint | Higher Income | Nonwhite or Latino | |
| Domain Importance | ||||||
| Connection to Nature | + $150,000+ > $100,000-$149,999 | |||||
| Cultural Opportunities | + | |||||
| Education | – vs 18-39 |
+ | ||||
| Leisure Time | ||||||
| Living Standards | – vs 18-39 |
– | – | |||
| Local Environmental Quality | + | + | ||||
| Mental Health | + | |||||
| Physical Health | ||||||
| Safety and Security | – | + | – | |||
| Social Connections | ||||||
Wellbeing Matrix for La Verkin
The graph below illustrates the relationship between the average rating and the average importance of wellbeing domains for survey respondents from La Verkin. There is a clear positive relationship between wellbeing domain importance and wellbeing domain ratings: domains that are rated as more important also tend to be rated higher. None of the domains fall into the red quadrant, which identifies domains where the average importance rating is above the overall average importance across all domains and the average rating is below the overall average rating across all domains. However, safety and security approaches this quadrant, as its average rating is only slightly higher than the overall average rating but its average importance is well above the overall average importance. It is important to note that all domains except for cultural opportunities have an average rating above 3.0 (moderate) and the importance score for all domains was higher than 3.0 (moderately important).
Community Action & Connections in La Verkin
Survey participants were asked about community actions and connectedness to community in La Verkin. Both questions were scored on a 5-point scale from not at all (1) to a great deal (5). When asked about the degree to which people take action together in response to local problems or opportunities in La Verkin, the average score was 3.24. When asked about the degree they feel connected to their community, the average score was 3.08. Responses to these questions did not differ statistically across age, gender, education, religion, income, or race/ethnicity.


Influence of Landscape on Wellbeing
Survey participants were asked about the influence of landscape features on their wellbeing. Rivers and streams, mountains, red rock, and trails were found to have an overwhelmingly positive influence on respondents’ wellbeing. Farmland, city parks, and lakes also had a positive influence for over three-fourths of survey respondents.
In terms of development and industry in the landscape, over half of respondents noted commercial development as having a positive influence on their wellbeing. Additionally, more respondents noted that residential development and manufacturing industry have a positive influence on their wellbeing than those that noted that they have a negative influence. However, more respondents viewed extractive industry as negative than those that viewed it as positive, though almost half of respondents (49%) noted that it is neither positive nor negative.

Perspectives on Population Growth and Economic Development in La Verkin
Nearly half of the respondents indicated that they felt population growth was just right (49%) and 35% indicated they thought it was too fast. Comparatively, over one-half of respondents felt that economic development was too slow (56%), while almost one-third of respondents felt that it was just right (31%). Compared to the other cities in the winter 2020 survey, La Verkin residents were more satisfied in terms of population growth but had a relatively high proportion of respondents that noted that economic development is too slow.


Risks and Assets for Wellbeing in La Verkin
Survey respondents indicated the degree to which a number of possible local issues were a major or minor risk or asset to wellbeing in La Verkin (see Table 3).
Table 3
Top Rated Risks and Assets by La Verkin Respondents
| Highest Rated Assets (indicated by at least 80% of respondents) |
Highest Rated Risks (Indicated by at least 20% of respondents) |
| Air Quality | Substance Abuse |
| Public Safety | Affordable Housing |
| Recreation Opportunities | Access to Healthcare |
| Access to Public Land | Shopping Opportunities |
| Water Supply |
Respondents also wrote in other assets and risks as shown in Table 4. It is clear that some people not only listed current assets, but also those they wish La Verkin had.
Table 4
Other Assets and Risks Mentioned by La Verkin Respondents
| Other Assets | Other Risks | ||
|---|---|---|---|
| Affordable housing/rental | City rec center | Care of personal property | Code enforcement |
| Commercial growth | Good neighborhood | Lack of local restaurants | Lack of odor control |
| Gun range | Neighborhood watch | Police presence | Taxes too high (and other tax concerns) |
| Parks, walkways, splashpad for kids, shade above public play areas | Police Protection | Too many rental homes in area | |
| Wildlife | |||
Summary of Open Comments
Respondents were given the opportunity to provide comments at the end of the survey. Comments were made by 30 respondents (32%) of the 95 completing the survey).
Dominant themes in comments:
- Improve city image and code enforcement
- Would like safer walking trails and sidewalks
- Too many vacation rentals in neighborhoods
- More shopping and dining options
A Few Quotes
- “We need new blood in the community. We need jobs. We need some roads fixed. We need something to keep our young people here. We need options for shopping.”
- “I would like to see our city bring in more base level jobs. There is real risk of a major economic driver closing down with nothing to replace it.”
- “We need more public facilities such a recreation center or multipurpose center that can be used for medium to large sized group gatherings. Also would like to see more economic development and an increase in businesses that can support our city.”
- “I love the small town feeling and the rural atmosphere. I love the clean air and the mountains. I love how friendly people are and think we have a friendly community.”