The purpose of study guides is to organize lecture notes and text book material so that you can increase your comprehension and memory of large amounts of information. Preparing study guides that are visual is even more effective, as the visual organization helps you see related concepts and make meaningful connections with the material, thus acquiring the higher levels of learning expected by many of your professors.
Study Guides and Learning Levels
Preparing for tests often involves more than knowing facts, figures, formulas, and definitions. Many professors expect you to demonstrate critical thinking, which involves more than rote memorization. Therefore, you must organize and process course materials so that you can increase your comprehension and ability to think critically.
Examples of Learning Levels
Review the following examples of test questions from a sociology class. The first question only requires that you recall a definition, which you can do well through rote memorization techniques, such as flash cards. The remaining questions require you to make connections or conclusions that may not have been directly presented by your professor or your text book.
- Question 1: A group of relatives by marriage constitutes a) a conjugal family b) an extended family c) a nuclear family d) none of the above
- Question 2: Describe the similarities and differences of these societal forms: matriarchal, neolocal, and patriarchal societies...
- Question 3: Illustrate the economic flow and functions of a neolocal society.

To correctly answer test questions like those in the example, you must create study guides that will help you:
- Condense course material into smaller amounts of information that are easier to remember.
- Visualize, understand, and demonstrate relationships among concepts and ideas.
- Create examples and apply information to “real world” situations.
Common Types Of Study Guides
Within this Idea Sheet are examples of common types of study guides or “visual organizers”.
These study guides can be adapted based on your personal learning style and the information you need to organize. Experiment with these, as well as using other study guide formats that you have found to be effective. Remember, the purpose for study guides is to organize information so that you can demonstrate your knowledge at the critical thinking level your professor expects.
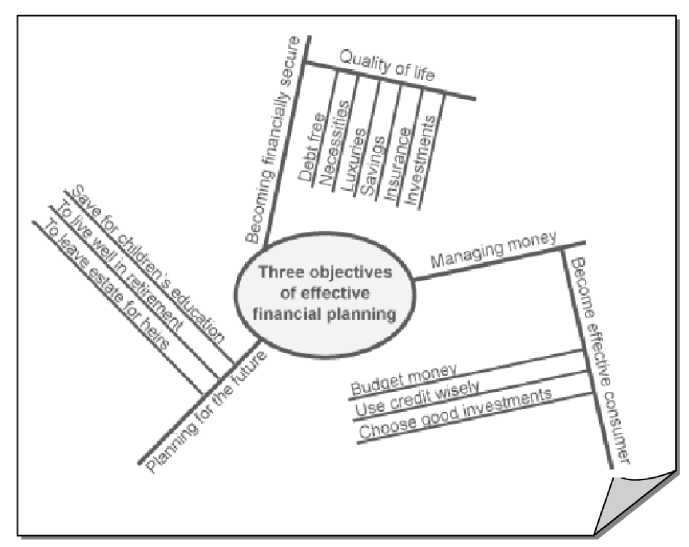
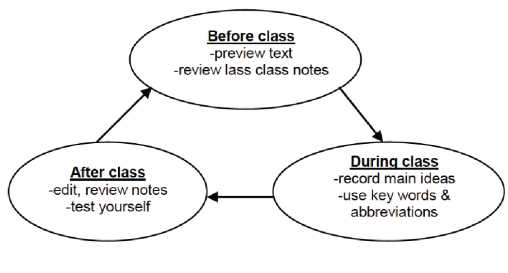
Concept Map and Branching Diagram
Many students benefit when information is presented visually. Concept maps and branching diagrams allow you to organize information spatially versus in a linear outline format. However, you still organize information from the general to the specific. You can then add details and examples that help you apply the information. Concept maps and branching diagrams are useful for classes in any subject area.

Comparison Chart
A comparison chart allows you to organize information visually so that you can see relationships among categories or characteristics. It is a very effective format when you need to be able to understand the differences or similarities among facts, theories, theorists, processes, etc.
| Information you are comparing | Characteristics you are comparing | ||
|---|---|---|---|
| Transmission | Vaccine | Symptoms | |
| Hepatitis A | |||
| Hepatitis A | |||
| Hepatitis A | |||
|
Type of memory |
Information stored |
Capacity |
Duration of info. |
Format |
|---|---|---|---|---|
|
sensory |
temporary; senses |
high |
<1 sec. (vision) few seconds (hearing) |
literal |
|
short-term |
brief; info, currently being used |
limited |
<20 seconds |
auditory & verbal |
|
long-term |
relatively permanent |
unlimited (?) |
long or perm. (?) |
semantic |
|
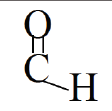
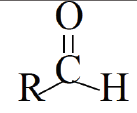
Name of organic compound |
Functional group |
Structure |
|---|---|---|
|
||
|
|
|
|
|
|
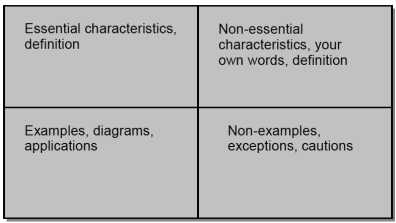
Concept Card
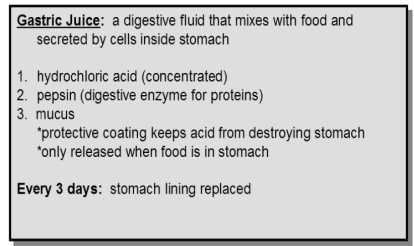
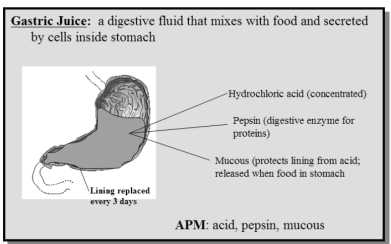
Concept cards are “flash cards on steroids”, and you create them using index cards that are 3x5 or larger. On the front of the card, you write the:
-
key idea or concept you want to learn
-
organizing term or phrase (upper right-hand corner). This is the category or term that allows you to see how your key ideas or concepts are organized.
-
source of the information (textbook page, date of lecture, etc.

On the back of the card, you write what is most important to know and learn about the concept, in your own words. To ensure you do more than just memorize the information, include examples, summaries, and synthesis of main points as well as definitions. Include diagrams, time lines, or other visuals that will help you understand the information at the level your professor expects.
Example 3: Front
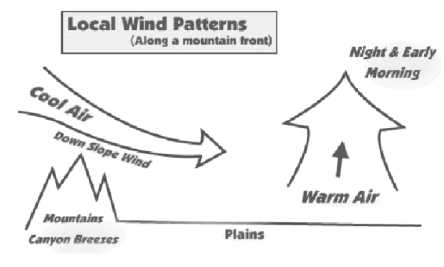
Diagram
Diagrams allow you to visually represent dynamic information such as a process, procedure, stages, and steps. For example, in a geology class, you could create a diagram to describe how rock layers are formed. In a political science class, a diagram can help you understand and learn the process for how a bill is passed into law.
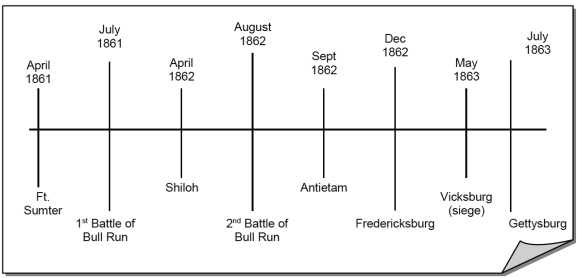
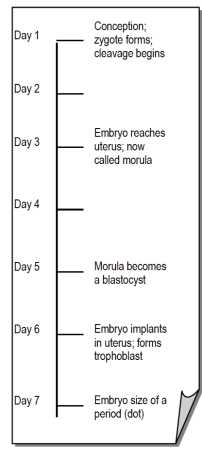
Time Line
A time line allows you to organize information chronologically. You are able to review information that must be understood and remembered in sequence. Time lines would be effective for classes in which you are presented:
- historical developments: history, anthropology, political science, music, art
- biological developments: biology, anatomy, physiology
- human or other developments: psychology, biology, natural resources
Example 1: Development of an embryo
Example 2: Major Civil War Battles 1861-1863