Spring 2021 Newsletter
In this issue, we give a brief report of ozone in the Uinta Basin during the past winter and discuss a few ongoing projects, including measurement of emissions from engines, recent modeling work, and thoughts on NOx versus VOC control of winter ozone. And we introduce Dr. Liji David, a photochemical modeler who has recently joined our research team. Welcome, Liji!

Two Exceedances of the EPA Ozone Standard During Winter 2020-21
Seth Lyman
December and January storms blanketed most of the Uinta Basin with snow. Because snow cover reflects sunlight and keeps the earth's surface cold, inversion conditions (inversion = colder air at the surface than aloft) existed in the lowermost parts of the Basin through most of winter 2020-21 . The graph at right shows that ozone at Ouray increased during these inversion periods, as is common during snow-covered inversion conditions in the Uinta Basin. Ozone only exceeded the EPA ozone standard twice during the winter, in spite of these sustained inversion conditions. Also, preliminary data show that ozone at other regulatory stations in the Basin did not exceed the EPA standard.Marc Mansfield recently published a paper in the journal Atmosphere that shows a reduction in Uinta Basin wintertime ozone has occurred over the past decade. Much remains to be learned about the reason for this decline, but it appears to be driven by a reduction in ozone-forming pollution, rather than changes in meteorology. Fortunately, Marc's finding means that less ozone is forming now when we have snow-covered inversion conditions than occurred in the past. We caution, however, that winters with many ozone exceedance days are still possible, and that winter ozone depends on pollutant emissions, so reducing pollution in the Basin is still paramount, especially during winter months.
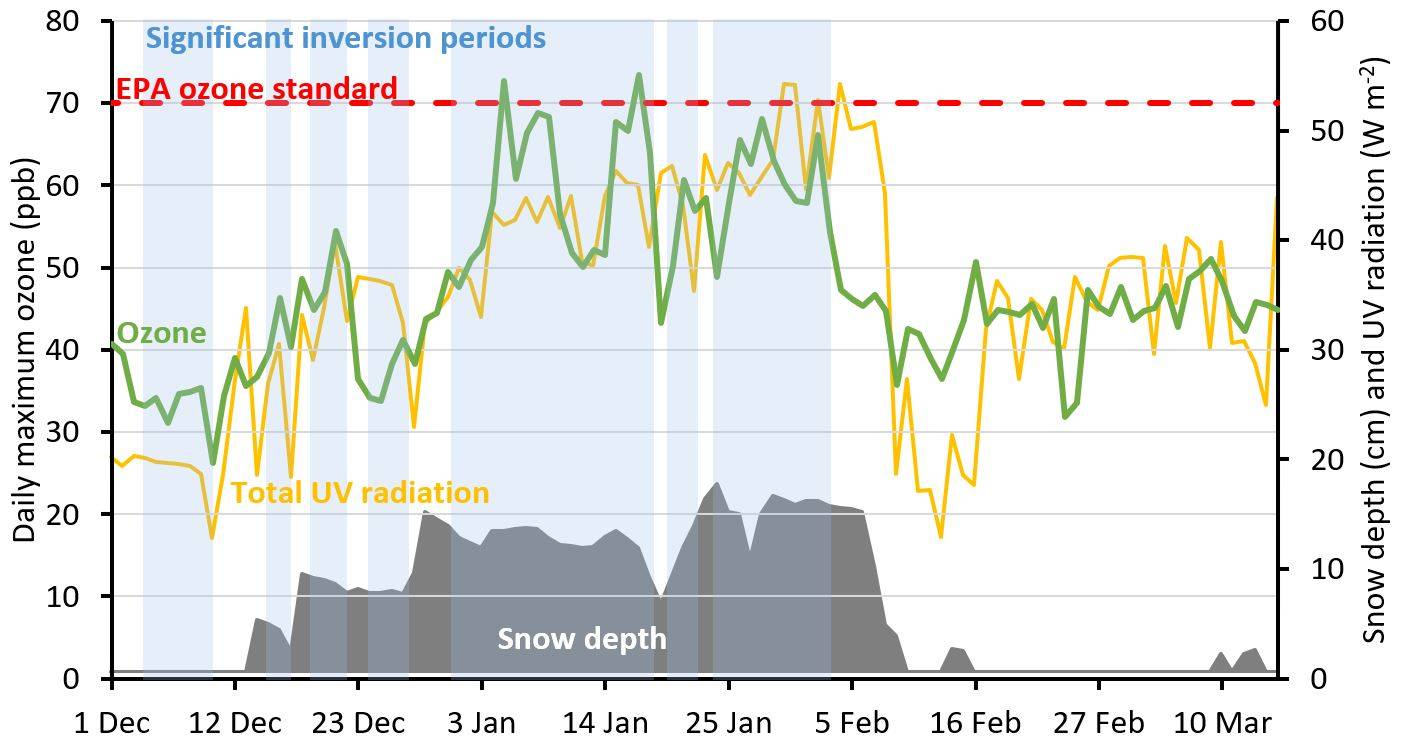 Time series of daily maximum 8-hr average ozone at the Ouray monitoring station from 1 December 2020 through 15 March 2021. Total (incoming and reflected) UV radiation and snow depth at the Horsepool station are also shown, and periods with inversion conditions are indicated by blue shading. "Inversion conditions" were determined as days during which the daily average temperature at Ouray was at least 5 C lower than the daily average temperature at Fruitland (Fruitland is at high elevation and above the inversion layer). Ouray data were collected by the Ute Indian Tribe and accessed from EPA's website.
Team News
 Dr. Liji David has joined our research team as a photochemical modeler: Liji uses regional and global chemical transport models, in situ, and satellite data to understand the chemistry of pollutants in the atmosphere to achieve better air quality and human health. Her studies have focused on ozone and PM2.5 concentrations associated with atmospheric transport and anthropogenic emissions. The results from her studies have implications for monitoring, regulations, health, and policy. She has studied the influence of exceptional events (e.g., wildfire, dust) on ozone, PM2.5, and PM10 over the continental US, and has extended her work to study the effect of present and future emissions of short-lived HFCs (HFO-1234yf) as a refrigerant on the environment, with a particular focus on India, China, and the Middle East. At the Bingham Center, she will be working on improving air quality models of wintertime conditions in the Uinta Basin. She will also work on modeling the transport and oxidation chemistry of mercury at regional and global scales. Liji earned a PhD in Physics at the University of Kerala (2013) at the Space Physics Laboratory, Indian Space Research Organization (ISRO), and was an ISRO fellow. She did her postdoctoral studies with Prof. A. R. Ravishankara at the Departments of Chemistry and Atmospheric Science, Colorado State University.
- Funds from Chevron and Dominion Energy: Chevron donated $25,000 last year to the Bingham Center that allowed us to purchase a new liquid chromatograph for our laboratory. We use the chromatograph to measure atmospheric concentrations of aldehydes, which are important precursors to winter ozone production. We had been using a liquid chromatograph that was at the end of its useful life, and we were having difficulty finding parts for repairs. Our new instrument provides much better detection and faster sampling times and will be an important asset for our team for many years. Dominion Energy also recently provided $25,000 in an environmental stewardship grant. Those funds are being used for student research and to upgrade lab and computational resources. We used these funds to hire two local undergraduate students to work with us this winter and beyond. Read more about these donations here: https://www.usu.edu/today/story/understanding-ozone-in-uintah-basin.
- New NSF project to develop and build instrumentation for atmospheric mercury measurements: We recently received funding from the National Science Foundation to participate with the University of Nevada, Reno in a project to measure and understand oxidized mercury in the atmosphere. Over the past several years, our team has developed several new instruments to measure oxidized mercury and to verify those measurements, and our role in this new project is to improve and help deploy some of these instruments around the U.S. In a separate NSF-funded project, we have worked with collaborators at University of Utah, Colorado College, and the University of Colorado to deploy some of these instruments atop Storm Peak at the Steamboat Springs Ski Resort in Colorado. The photo at the top right of this page is of graduate student Tyler Elgiar installing mercury instrumentation at Storm Peak.
- Team participates in Air Quality: Science for Solutions Conference: Our team recently helped organize and participated in the fifth annual Air Quality: Science for Solutions conference, a Utah-centric air quality research conference. The following is a list of the presentations we gave. Ask us if you'd like a copy of any of them, or visit the conference website.
- Ozone pollution in the Uinta Basin is attenuating (Marc Mansfield)
- Simulation of Hydrocarbon Composition from Oil and Gas Production in the Uinta Basin (Huy Tran)
- Fluxes of organic compounds at the air-snow interface (Makenzie Holmes)
- Characterization of Emissions from Oilfield Engines (Seth Lyman)
NOx vs. VOC Control of Winter Ozone In the Uinta Basin
Marc Mansfield
 Imagine you want to host a tea party. You have eight teacups and twelve saucers. Adding or subtracting a few saucers will not impact the number of guests you can serve. To do that, you have to add or subtract a few teacups. We could say that the number of guests you can serve is under the control of the teacups. Similarly, ozone formation requires both oxides of nitrogen (NOx) and volatile organic compounds (VOC) to be present in the atmosphere, but there is a critical VOC:NOx ratio above which VOCs are in excess and changing their concentration has only a weak effect on ozone formation. Above that ratio, we would say that ozone formation is “NOx limited” or is under “NOx control.” Below the critical ratio, we would say that the airshed is “VOC limited” or is under “VOC control.” But unlike the tea service analogy, the critical VOC:NOx ratio is not 1:1. Rather it depends on local conditions within the airshed such as temperature, absolute humidity, and the types of VOCs present. Extensive study, usually including modeling, is needed to determine the critical ratio in any given region. A knowledge of the ratio can be used to guide policy and regulatory decisions. For example, pollution controls targeting VOC in a NOx-limited region would be less effective.
Some preliminary evidence now suggests that winter ozone in the Uinta Basin may be under NOx control, though most pollution controls that have been applied over the last decade to control ozone have targeted VOCs. There are three pieces of evidence, presented below. Over the past decade, winter ozone concentrations seem to be more strongly correlated with NOx than with VOC (see the figure at right). NOx and ozone concentrations have both trended downward over the previous decade. VOC concentrations have also trended downward, but the available data show a recent upturn. No corresponding upturn is seen in ozone concentrations, which might be interpreted as insensitivity to VOC. However, with VOC recorded at only two sites, the VOC traces in Figure 1 cannot be assumed to reflect basin-wide trends.
- Researchers in Mexico City described a data analysis technique that computes sensitivity of ozone to NOx. [Wood et al., Atmospheric Chemistry and Physics, 9, 2499-2516, 2009] We have applied the technique to Uinta Basin data. [https://binghamresearch.usu.edu/files/reports/UBAQR_2018_AnnualReport.pdf] The analysis indicates relatively strong NOx sensitivity, although it gives no information about VOC sensitivity. Interestingly, it indicates that the critical VOC:NOx concentration may be changing over the course of the winter.
- NOAA researchers studied a model of Uinta Basin ozone, and reported that sensitivity to NOx is stronger than sensitivity to VOC. [Edwards et al., Nature, 514, 351-354 (2014)] They only modeled conditions in early February 2013, and so their work cannot confirm the early-to-late-winter trend cited in the previous paragraph, and atmospheric chemical conditions may have changed since that time.
We are currently seeking funding to study the question in greater detail. The single, most significant NOx sources in the basin are the pump jack engines used to lift oil. We hope to study the impact of converting pump jacks from engines to electric motors. We also want to examine the impact of the proposed Uinta Basin Railway, since it is expected to open up new markets for Uinta Basin oil. More oil will likely mean more pump jacks and more NOx.
Engine Emissions Measurement Study
Seth Lyman
With funding from the Utah Division of Air Quality, the Utah Legislature, and the Uintah Impact Mitigation Special Service District, we have been measuring emissions from engines in the Uinta Basin since January. Our study focuses on emissions from natural gas-fueled lift engines, or the engines that are used to power pumps that pull oil up from subsurface reservoirs. There are two reasons that this study is important for understanding and improving the winter ozone situation in the Uinta Basin:1)Previous measurements in ambient air have shown higher concentrations of reactive organics (i.e., organic compounds with a high potential to form ozone), including aldehydes and alkenes (e.g. ethylene, propylene) in areas with more of these types of engines.
2) Currently, very little detailed data about the composition of emissions from these types of engines is available. The preferred dataset modelers use to simulate their emissions composition is based on measurements from two engines in California in the 1980's. An update to this knowledge base is clearly needed.
We are measuring exhaust temperature, dewpoint, gas flow rate, and concentrations of CO2, CO, NO2, NO, O2, methane, and a suite of 70 individual non-methane organic compounds, including alkanes, alkenes, aromatics, alcohols, and aldehydes. So far, we have measured emissions from 30 engines, and we are gearing up to measure more. A very preliminary synopsis of our early findings (subject to change) is available in a poster we produced for the Air Quality: Science for Solutions Conference in March.
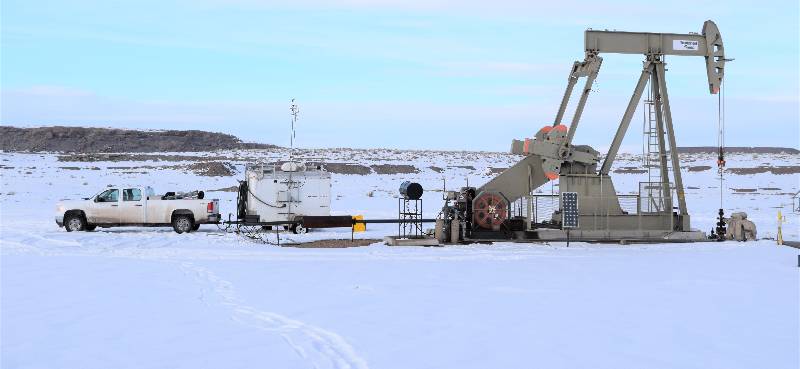
USU team measuring emissions from a lift engine in the Uinta Basin.
Photochemical Modeling Improvements
Huy Tran
We evaluated photochemical model performance during a high-ozone episode during winter 2019 with the CAMx modeling platform and Utah Division Air Quality’s 2017 oil and gas emissions inventory (OGEI2017). The OGEI2017 has been updated recently and shows a significant increase in Volatile Organic Compound (VOC) emissions from oil and gas activities in Duchesne and Uintah counties in comparison to its first release in late 2019 (103,723 tpy vs. 66,185). The largest VOC emissions increases in the revision are from tanks, water disposal facilities, and tank emissions control effectiveness. Interestingly, these increases led to simulated ozone that was much higher than that simulated with the original OGEI2017 (see figure below). Simulated ozone at several stations, including Castle Peak, was even higher than observed ozone. Poor ozone performance in the model on February 26, 2019 and later days (shown in the figure above) was due to discrepancies in the meteorological model. 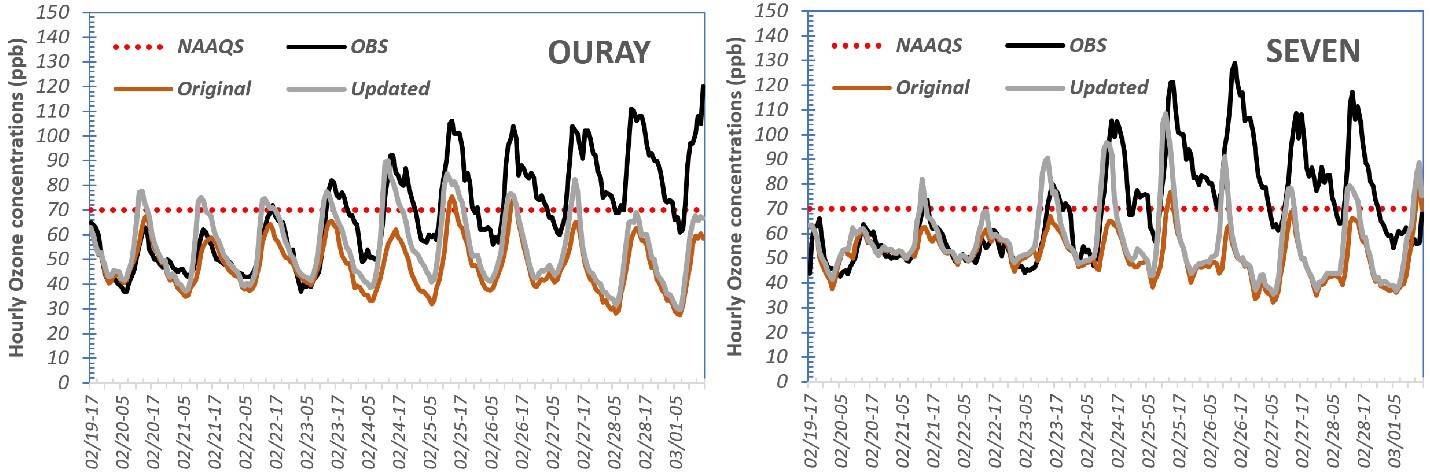
Observed (OBS) vs. simulated ozone concentrations at the Ouray and Seven Sisters monitoring stations as simulated by the CAMx model with the Updated and Original OGEI2017.
Total VOC was well approximated at Roosevelt but underestimated at the Horsepool station. Modeled highly reactive VOC compounds, such as alkenes, aromatics, and carbonyls, were also highly underestimated at Horsepool but had better agreement with observed values at Roosevelt. Comparison of simulated VOC composition to observed values from the distributed canisters that were deployed in the past winters also showed lower concentrations of reactive compounds in the simulated VOC (see figure below). We are improving meteorological model performance to improve ozone performance for this winter episode. Further analyses with observed VOC from the distributed canisters to identify potential improvement in the VOC composition of oil and gas emissions are also underway.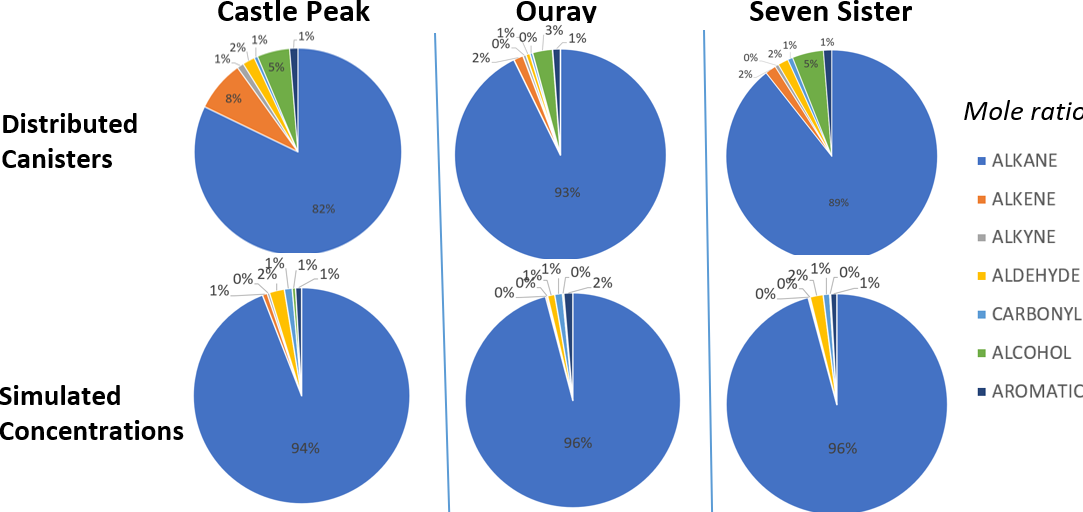
USU team measuring emissions from a lift engine in the Uinta Basin.
Coming Up Next
- Over the next few months, we will be continuing with emissions measurements from engines, continuing modeling work, and finalizing all data collected this winter. Watch for more updates in our summer 2021 newsletter and our 2021 Annual Report, to be released in November.
- We received lots of great suggestions from stakeholders in response to our survey last year. Things get pretty busy for us in the winter months, but we plan to connect with stakeholders this spring to ask for more information about what we can do to improve. If you'd like to be part of that process, email Seth Lyman at seth.lyman@usu.edu.