A tree diagram is helpful for working with event intersections and conditional probabilities.
A tree consists of nodes and branches representing different stages in an experiment. Tree 1 shows an
experiment in two stages with two possible outcomes at each stage. At the first stage, the possibilities are A and A'. Once one of
those is chosen, the options at the next stage are B and B'.
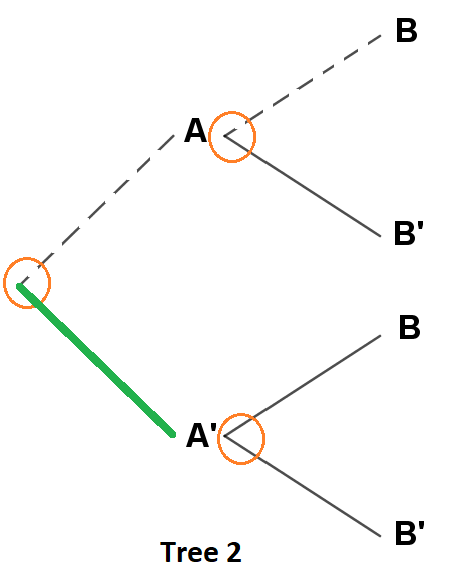
The nodes represent the starting point of each stage in the experiment. In the Tree 2, the nodes are circled. Branches are lines
that extend to each of the outcomes at each stage. The branch indicating that A' is the outcome of the first stage is shown as a thick green line in the tree.
A path is a sequence of connected lines through the tree. This tree has four paths. The path corresponding to outcome A at the first stage followed by
outcome B at the second stage is show as a dotted line.
Branches of a probability tree are commonly labeled with probabilities of the corresponding events as show in Tree 3.
The probability associated with a complete path through the tree is labeled to the right of the tree and can be found by multiplying along
the branches that make up the path. To illustrate, the topmost path in the tree corresponds to obtaining
outcome A at the first stage and outcome B at the second stage, thus the branches that make up the path represent P(A) and P(B|A). The complete path represents
A ∩ B and the probability, P(A ∩ B) can be found by multiplying along the branches: P(A ∩ B) = P(A)P(B|A).
In the probability tree, the branches extending from a given node represent all the possible outcomes at that stage of the experiment.
Thus the sum of the probabilities extending from a given node must be 1. In particular, we see that P(B'|A) = 1 - P(B|A).
Scientists investigated whether
certain lizards are more
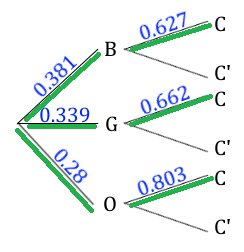
tolerant of humans who are wearing the lizards' sexually selected color (orange). 38.1% of the researchers attempts to capture a lizard were made wearing a
blue shirt, 33.9% of attempts were made while wearing a green shirt, and 28% of attempts were made while wearing an orange shirt. The probability that a researcher
wearing blue successfully caught a lizard was 0.627, the probability that a researcher
wearing green successfully caught a lizard was 0.662, and the probability that a researcher wearing orange successfully caught a lizard was 0.803.
Set up a probability tree to model this scenario..
Because the probabilities related to capture were conditional on the color
the researcher was wearing, the color events are the outcomes at the first stage and the conditional events
(capture given color) are at the second stage.
Use the tree to find the probability that a randomly selected capture attempt was made by a researcher
wearing green and was unsuccessful?
The probability that a randomly selected capture attempt was made by a researcher wearing green and was unsuccessful is P(G ∩ C').
To find this probability
we will multiply the probabilities corresponding to the branches of the appropriate path, highlighted in the tree. That is P(G ∩ C') = P(G)P(C'|G).
P(G) = 0.339 and P(C|G) = 0.662. P(C'|G) = 1 - P(C|G) = 1 - 0.662 = 0.338.
P(G ∩C') = P(G)P(C'|G) = 0.339(0.338) = 0.115.
The probability that a randomly selected capture attempt was made by a researcher wearing green and was unsuccessful is 0.115.
What is the probability that any capture attempt was successful?
The probability that any capture attempt was successful is P(C). All successful capture attempts are represented on the
tree by paths that end with C and are highlighted in the tree.
Since these paths are mutually exclusive, P(C) = P(B ∩ C) + P(G ∩ C) + P(O ∩C).
To find the probability of each intersection, multiply the probabilities along the corresponding path.
$$\small{\begin{array}{rcl} P(C) & = & P(B)\cdot P(C|B) + P(G)\cdot P(C|G) + P(O)\cdot P(C|O) \\
& = &(0.381 \cdot 0.627) + (0.339 \cdot 0.662) + (0.28 \cdot 0.803)\\ & = & 0.688\end{array}}$$
The probability that any capture attempt was successful is 0.688.
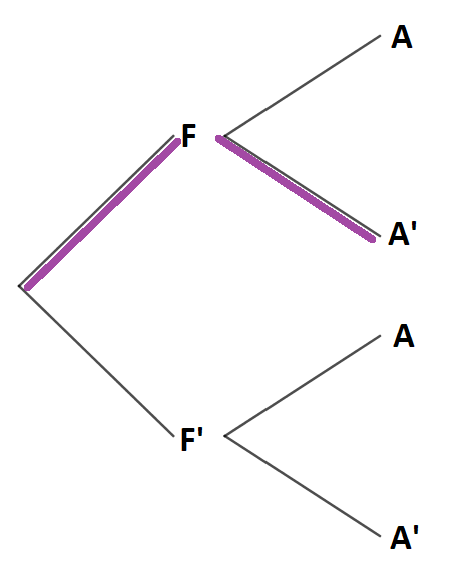
Let A denote the event that a survey participant had taken an advanced math class and let F denote the event that the participant is female.
The tree is shown here with the path corresponding to P(F ∩ A') highlighted. Note that P(A'|F) = 1 - P(A|F) = 1 - 0.72 = 0.28.
P(F ∩ A') = P(F)P(A'|F). To find this probability using the tree, multiply the probabilities associated with the highlighted branches.
P(F ∩ A') = P(F)P(A'|F) = 0.258(0.28) = 0.072.
7.2% of surveyed students were female and had not taken a higher math class.