Bountiful Wellbeing Survey Findings 2024
By Dr. Courtney Flint and Team
![]()
Contact Information
Dr. Courtney Flint
courtney.flint@usu.edu
435-797-8635
Summary
Bountiful is one of 51 cities participating in the Utah Wellbeing Survey Project in 2024. This project is designed to assess the wellbeing and local perspectives of city residents and to provide information to city leaders to inform general planning processes. Additional analysis is underway and this report may be updated over time.
We are grateful to all those who took the survey and to our city partners who helped to make this possible. We are grateful to a number of entities for funding: the Utah League of Cities and Towns, USU Extension, USU’s Institute for Land Water and Air, the Wasatch Front Regional Council, Utah Department of Transportation, the Utah Agricultural Experiment Station, and the cities of Alpine, Cedar Hills, Draper, Millcreek, Nephi, North Salt Lake, Ogden, Orem, Pleasant Grove, Providence, Springdale, Tremonton, West Bountiful, and West Valley City.
This report describes findings from the 2024 Bountiful survey and comparative information with other project cities. In March, April, and May 2024, Bountiful City advertised the survey for residents largely through social media and newsletters. All city residents age 18+ were encouraged to take the online Qualtrics survey.
How many people responded?
- 211 viable surveys were recorded in this 2024 survey effort.
- The Bountiful 2022 survey had 270 responses and the Bountiful 2021 survey had 213 responses and the Bountiful 2020 survey had 350 responses.
- The adult population of Bountiful was estimated at 31,927, based on the American Community Survey by the U.S. Census. The 211 survey responses in 2024 represent 0.7% of the adult population and have a conservative margin of error of 6.72%.
Survey Respondent Characteristics
| Resident Statistics | |
|---|---|
| Full Time Residents of Bountiful | 98.1% |
| Part Time Residents of Bountiful | 1.9% |
| Length of Residency — Range | 1-70 years |
| Length of Residency — Average | 24.2 years |
| Length of Residency — Median | 21 years |
| Length of Residency 5 Years or less | 17.1% |
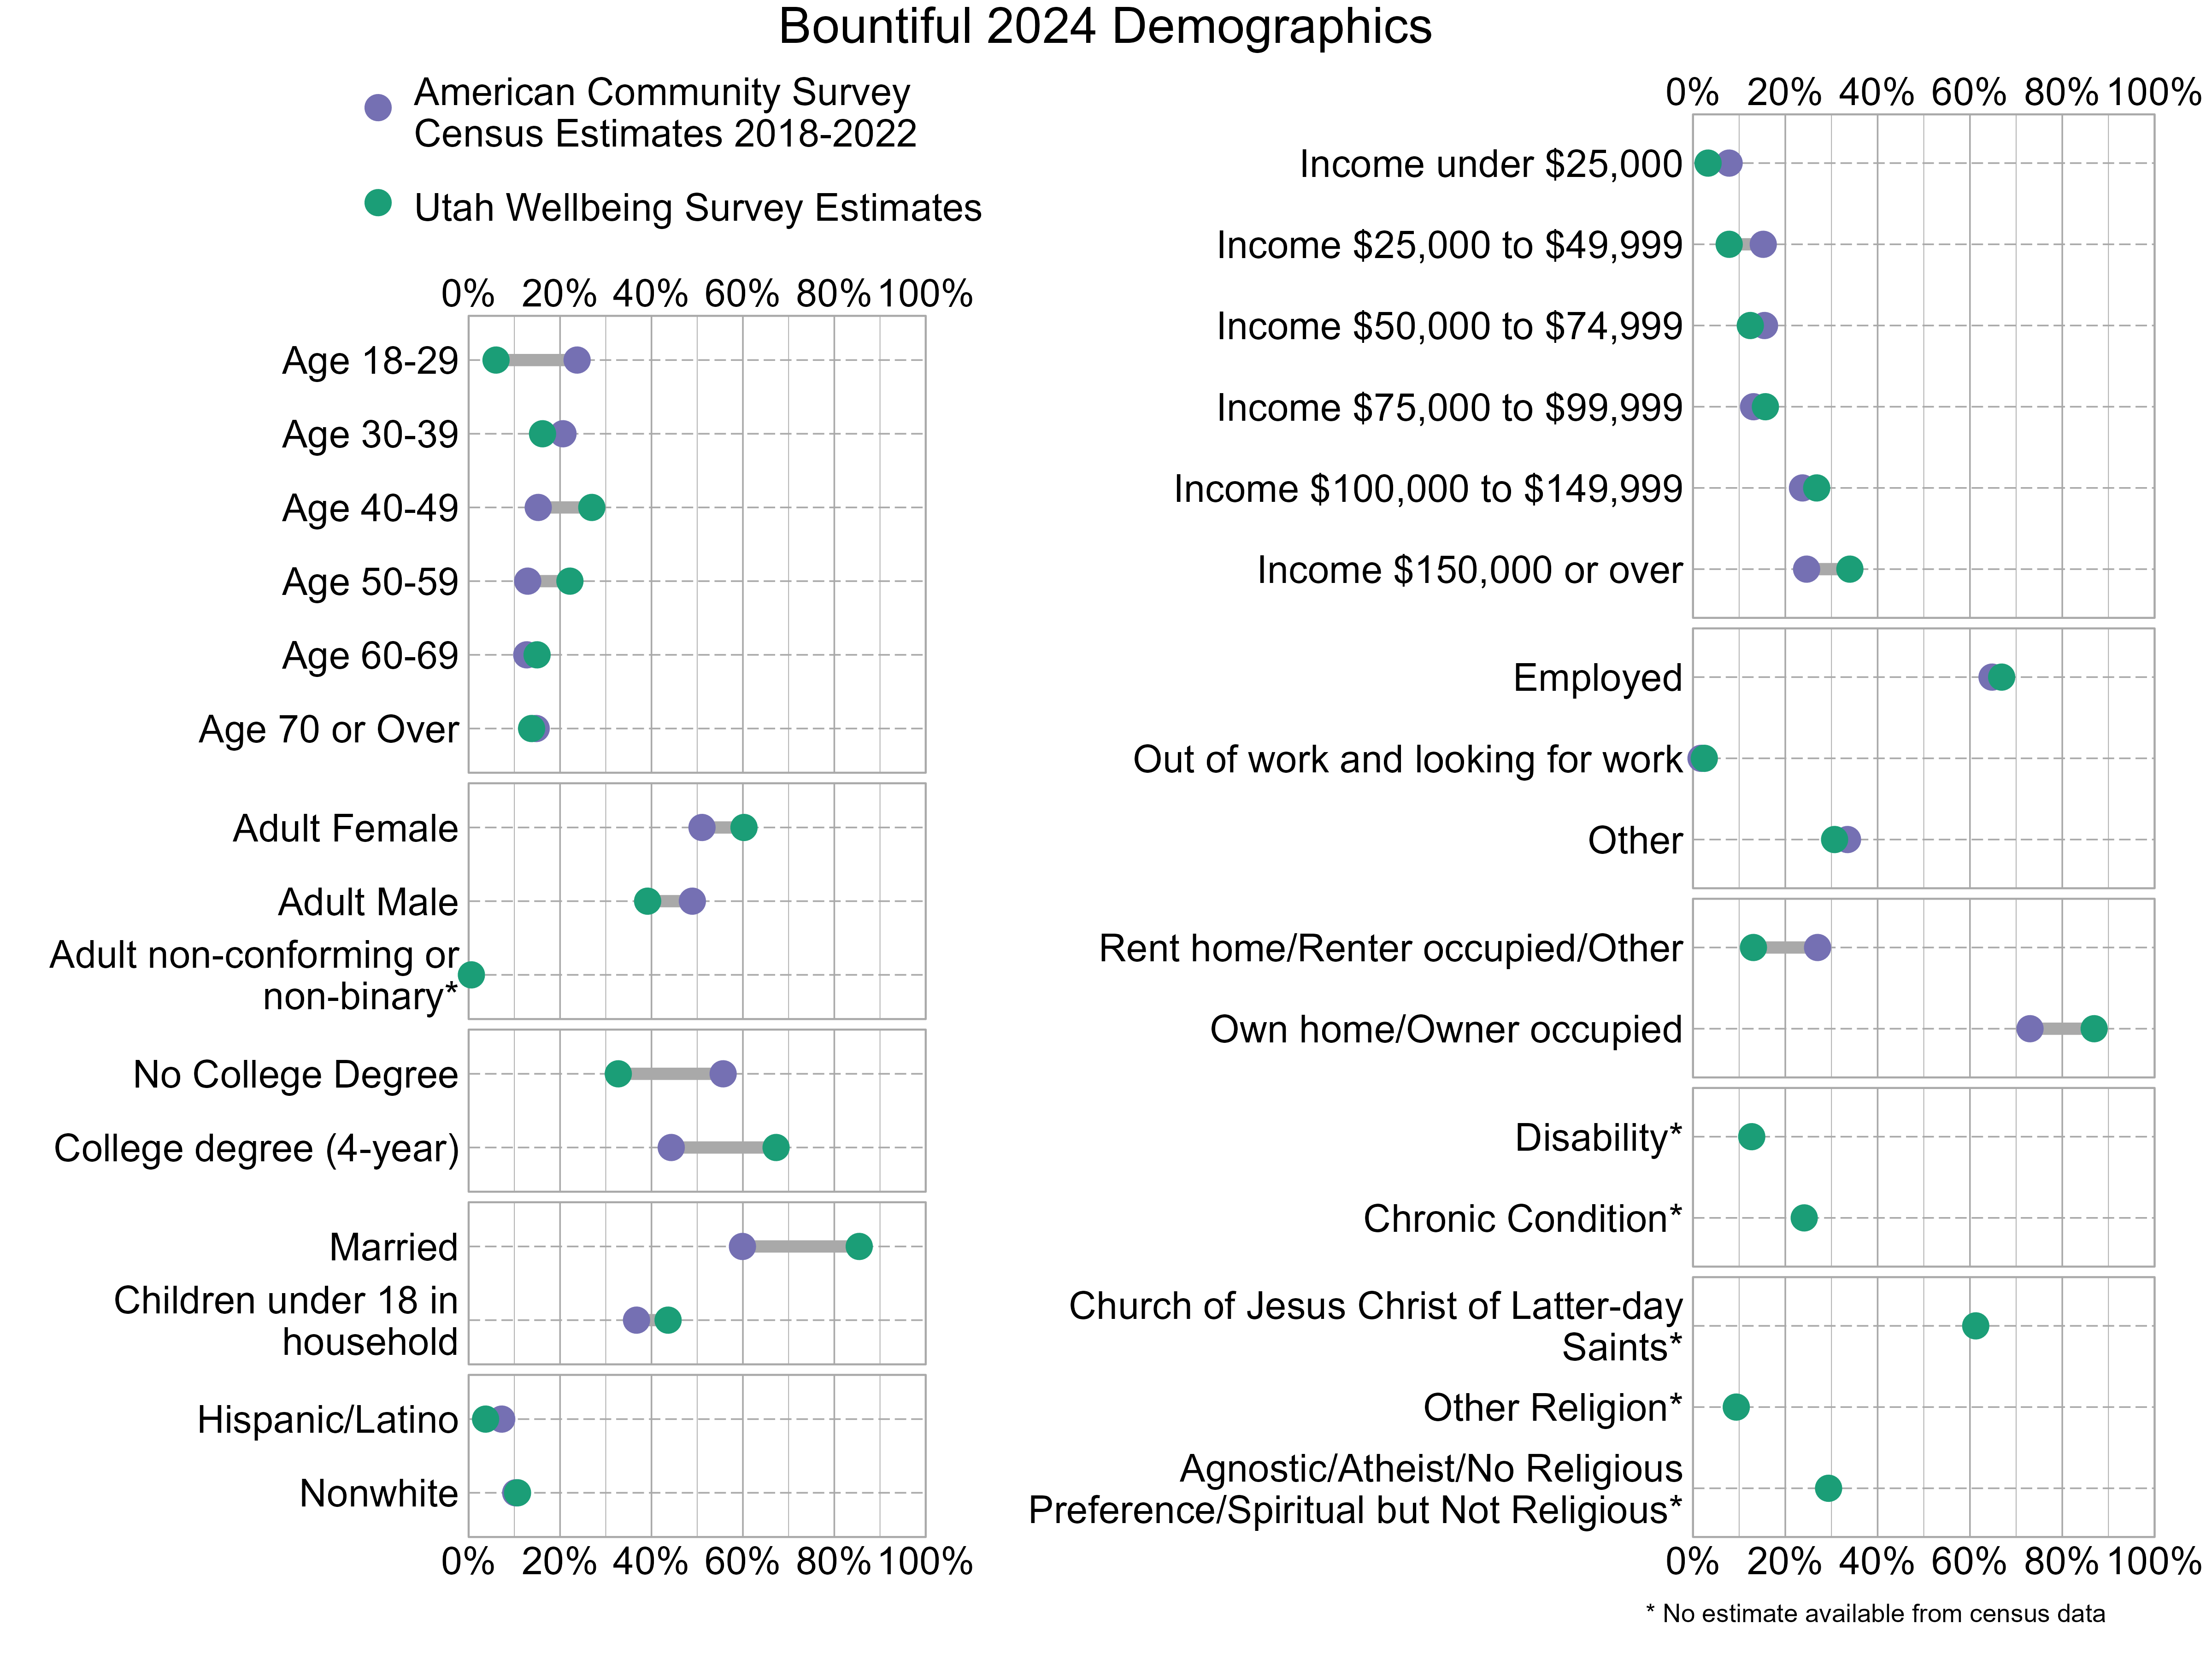
Demographic characteristics of the survey respondents were compared below with U.S. Census information from the 2018-2022 American Community Survey. In the graph below, gray bars indicate differences between the American Community Survey estimates and the Utah Wellbeing Project surveys. The wider the gray bars, the larger the differences. Also note that estimates for religious affiliation, adult non-conforming or non-binary gender, disability, and chronic conditions are unavailable from the census data. There can also be a variable margin of error in the American Community Survey estimates, and caution should be used when comparing estimates. Not all respondents provided demographic information. As the graph shows, 2024 survey respondents were not fully representative of Bountiful. People who have at least a 4-year college degree and are married were overrepresented while those who are age 18-29 and do not have a college degree were underrepresented.
Overall Personal Wellbeing and Overall Wellbeing in Bountiful
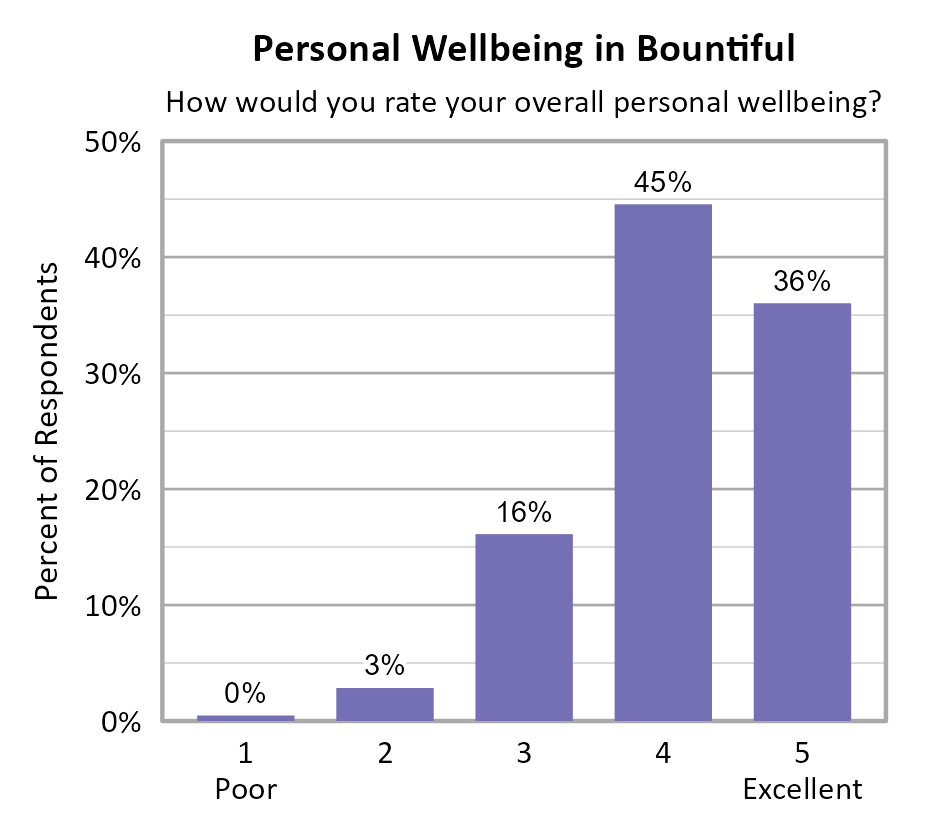
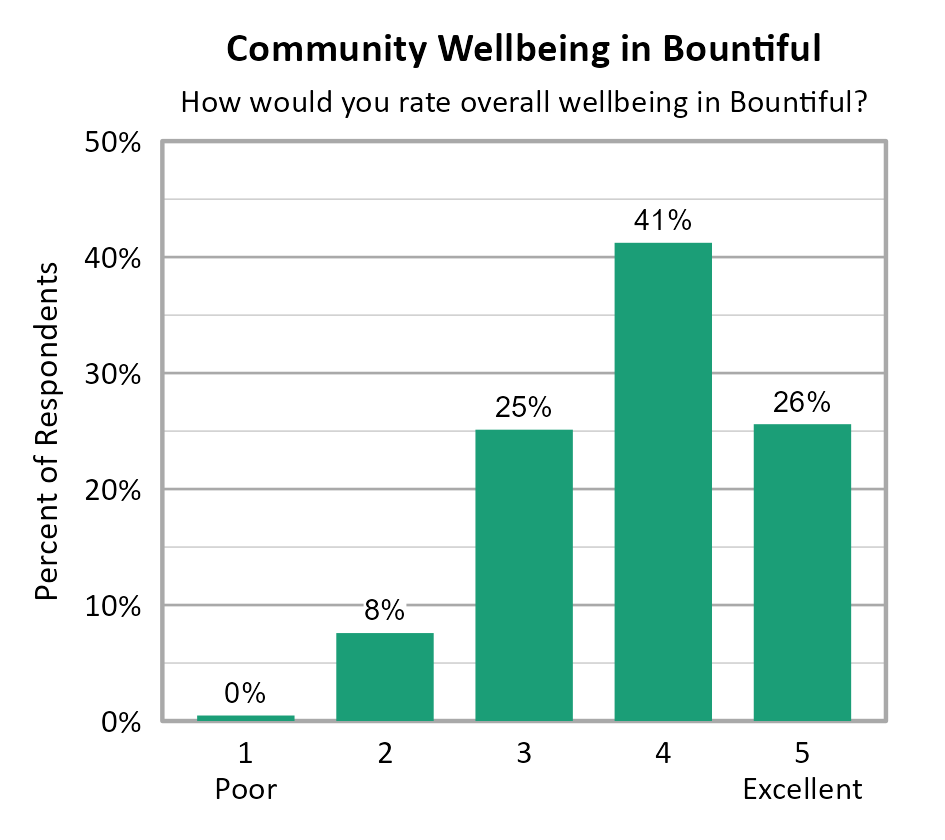
Survey participants were asked about their overall personal wellbeing and overall community wellbeing in Bountiful. These wellbeing indicators were both measured on a 5-point scale from poor (1) to excellent (5). The average personal wellbeing score in Bountiful was 4.13 with 81% of respondents indicating their wellbeing at a 4 or 5 on the 5-point scale. The average score for community wellbeing in Bountiful was 3.84 with 67% of respondents indicating community wellbeing at a 4 or 5 on the 5-point scale.
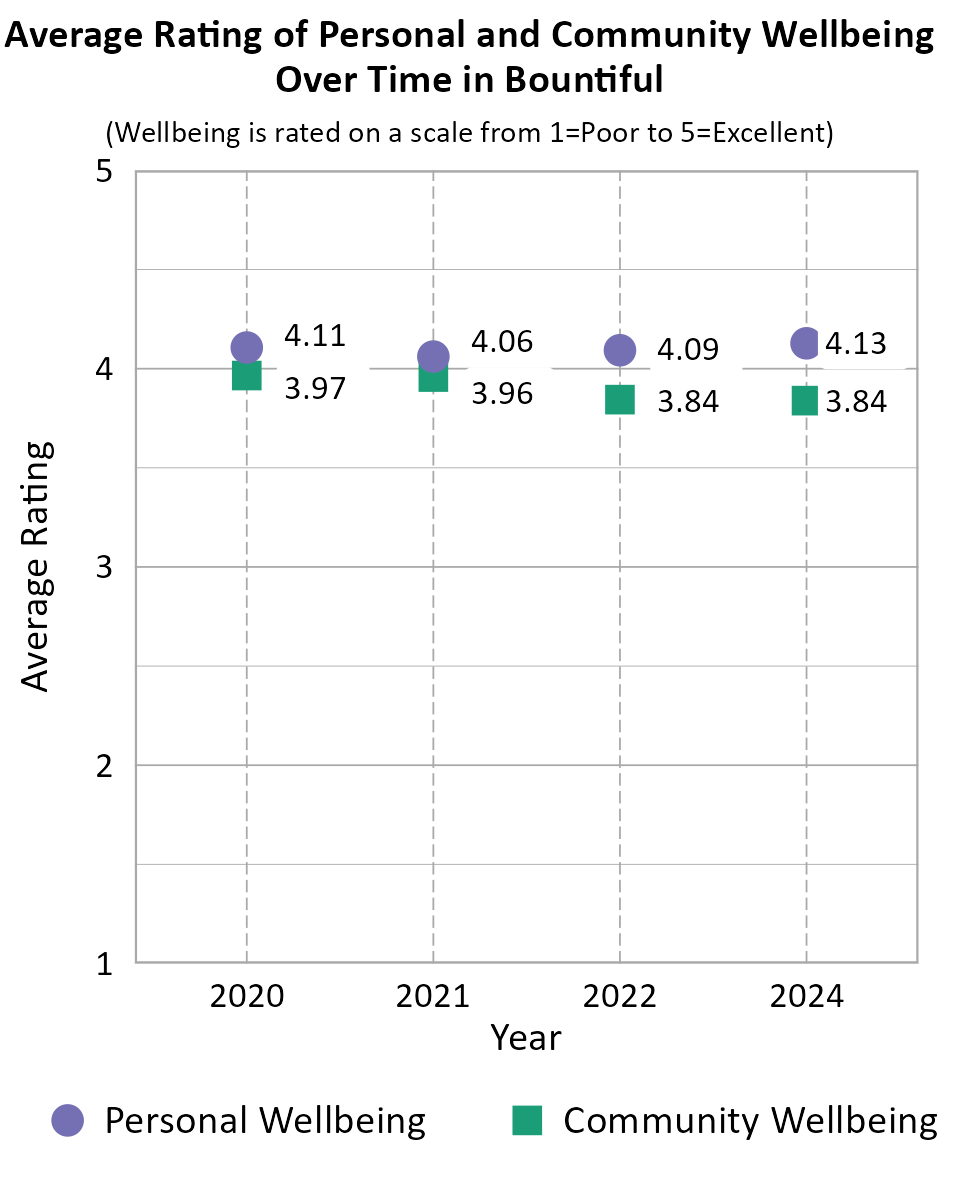
When comparing survey data from Bountiful over the years as shown in the information below, we can see that the average personal wellbeing score has remained fairly consistent across the survey years. The average community wellbeing score remained nearly the same between 2020 and 2021, and declined between 2021 and 2022, and remained nearly the same between 2022 and 2024. Note that the number of respondents differed between years, there is no tracking of individuals from one year to the next, and the low end of the scale was "Poor" in 2024 but "Very Poor" in prior years which may account for differences in scores over time.
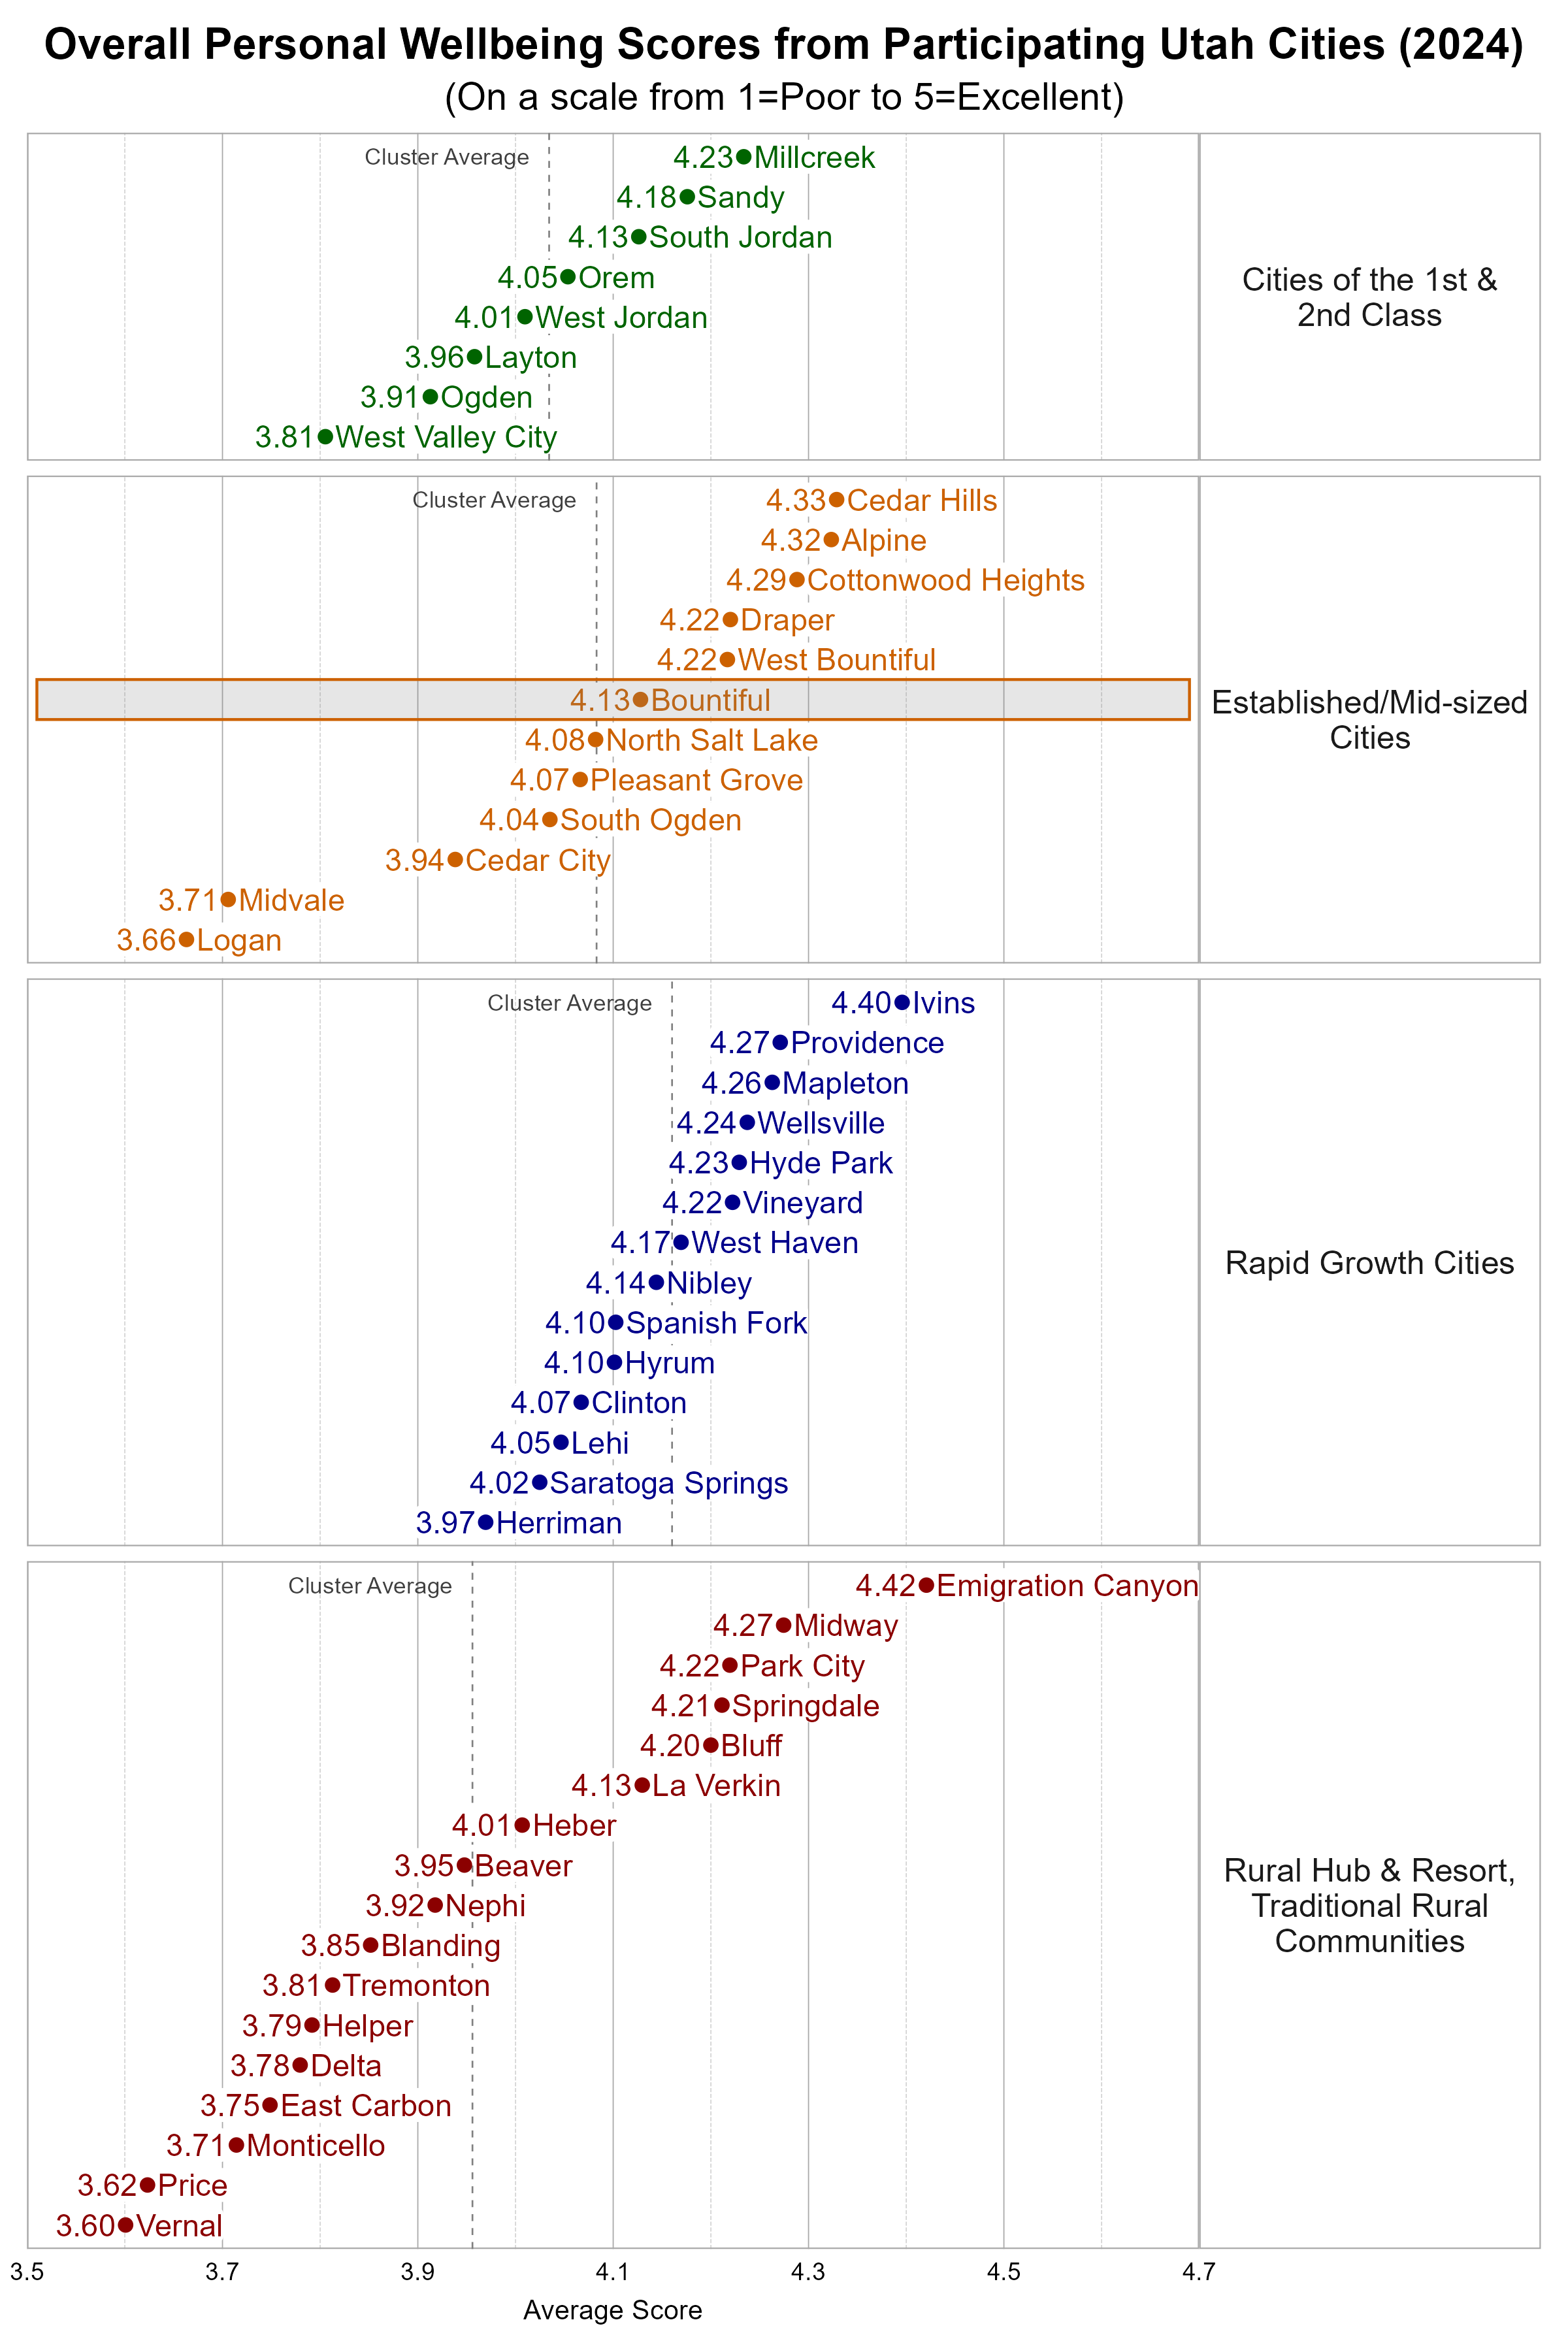
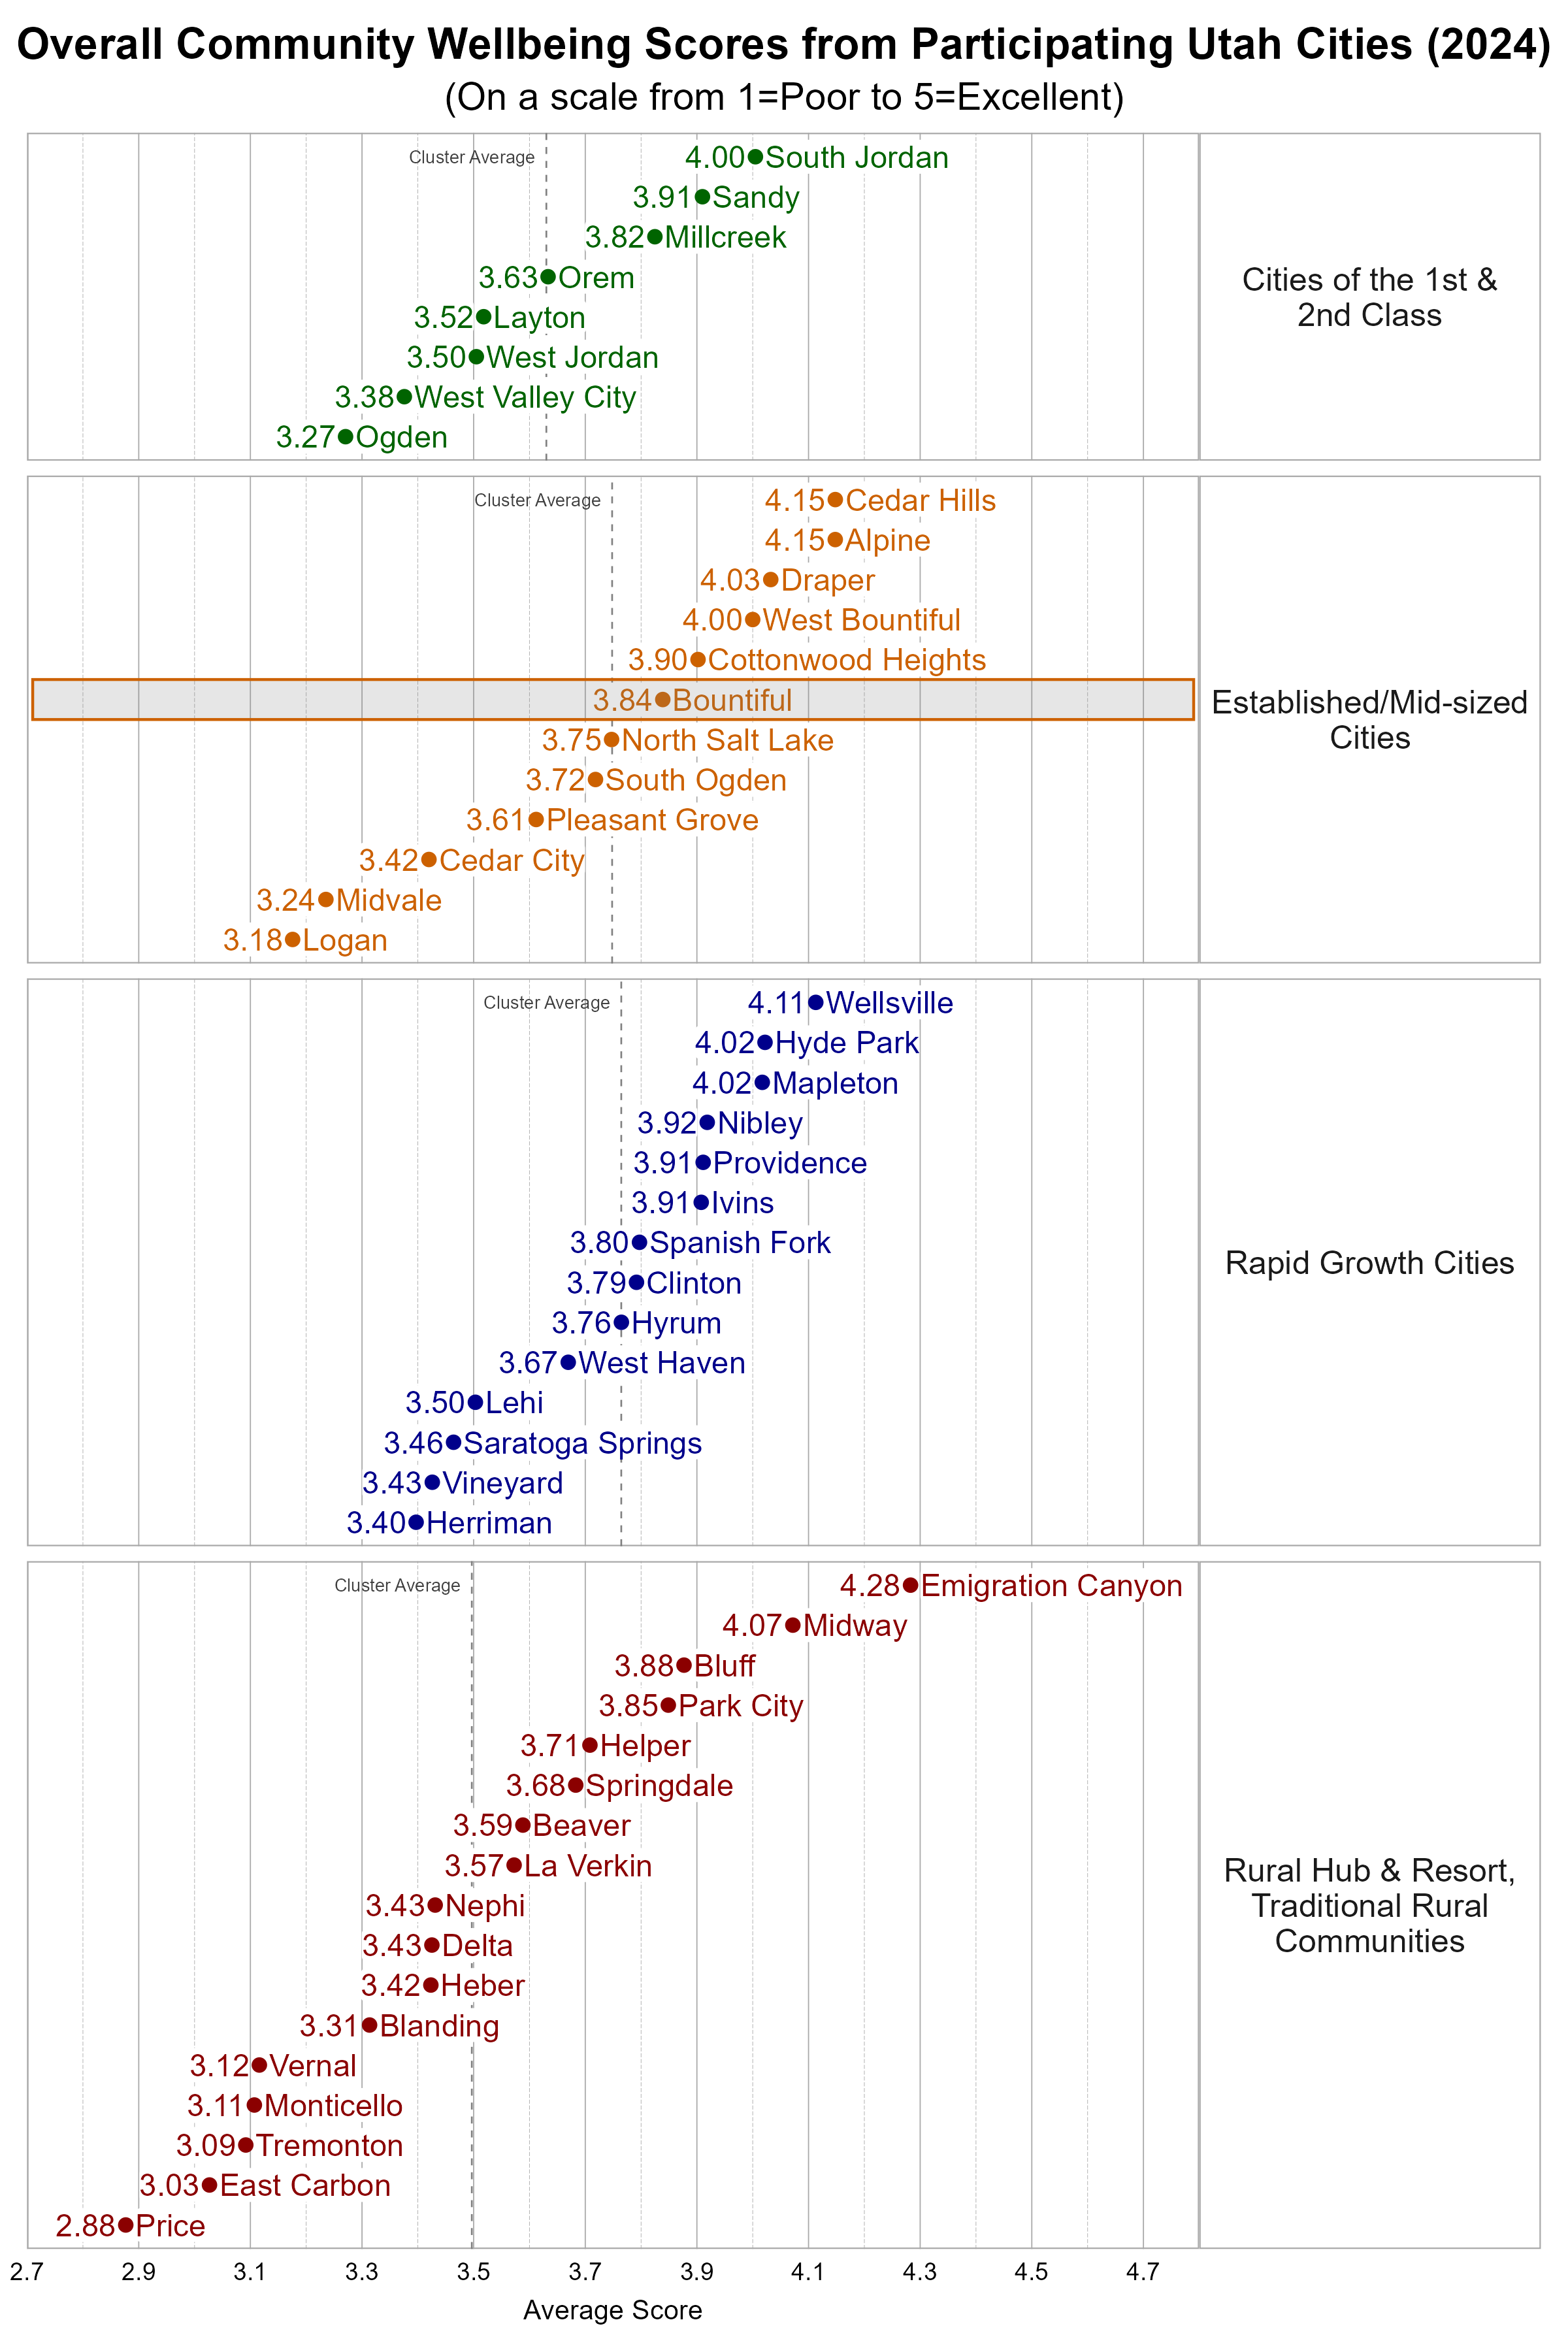
Comparing Wellbeing Across Utah Cities
The Utah League of Cities and Towns clusters cities and towns into five different categories based on size and growth rates. We utilize these clusters in our analysis. Bountiful is classified as an Established/Mid-sized City. Some cities may fit within more than one cluster.
Within the more Urban city cluster, Bountiful was slightly above the average overall personal wellbeing score and slightly above the average overall community wellbeing score.
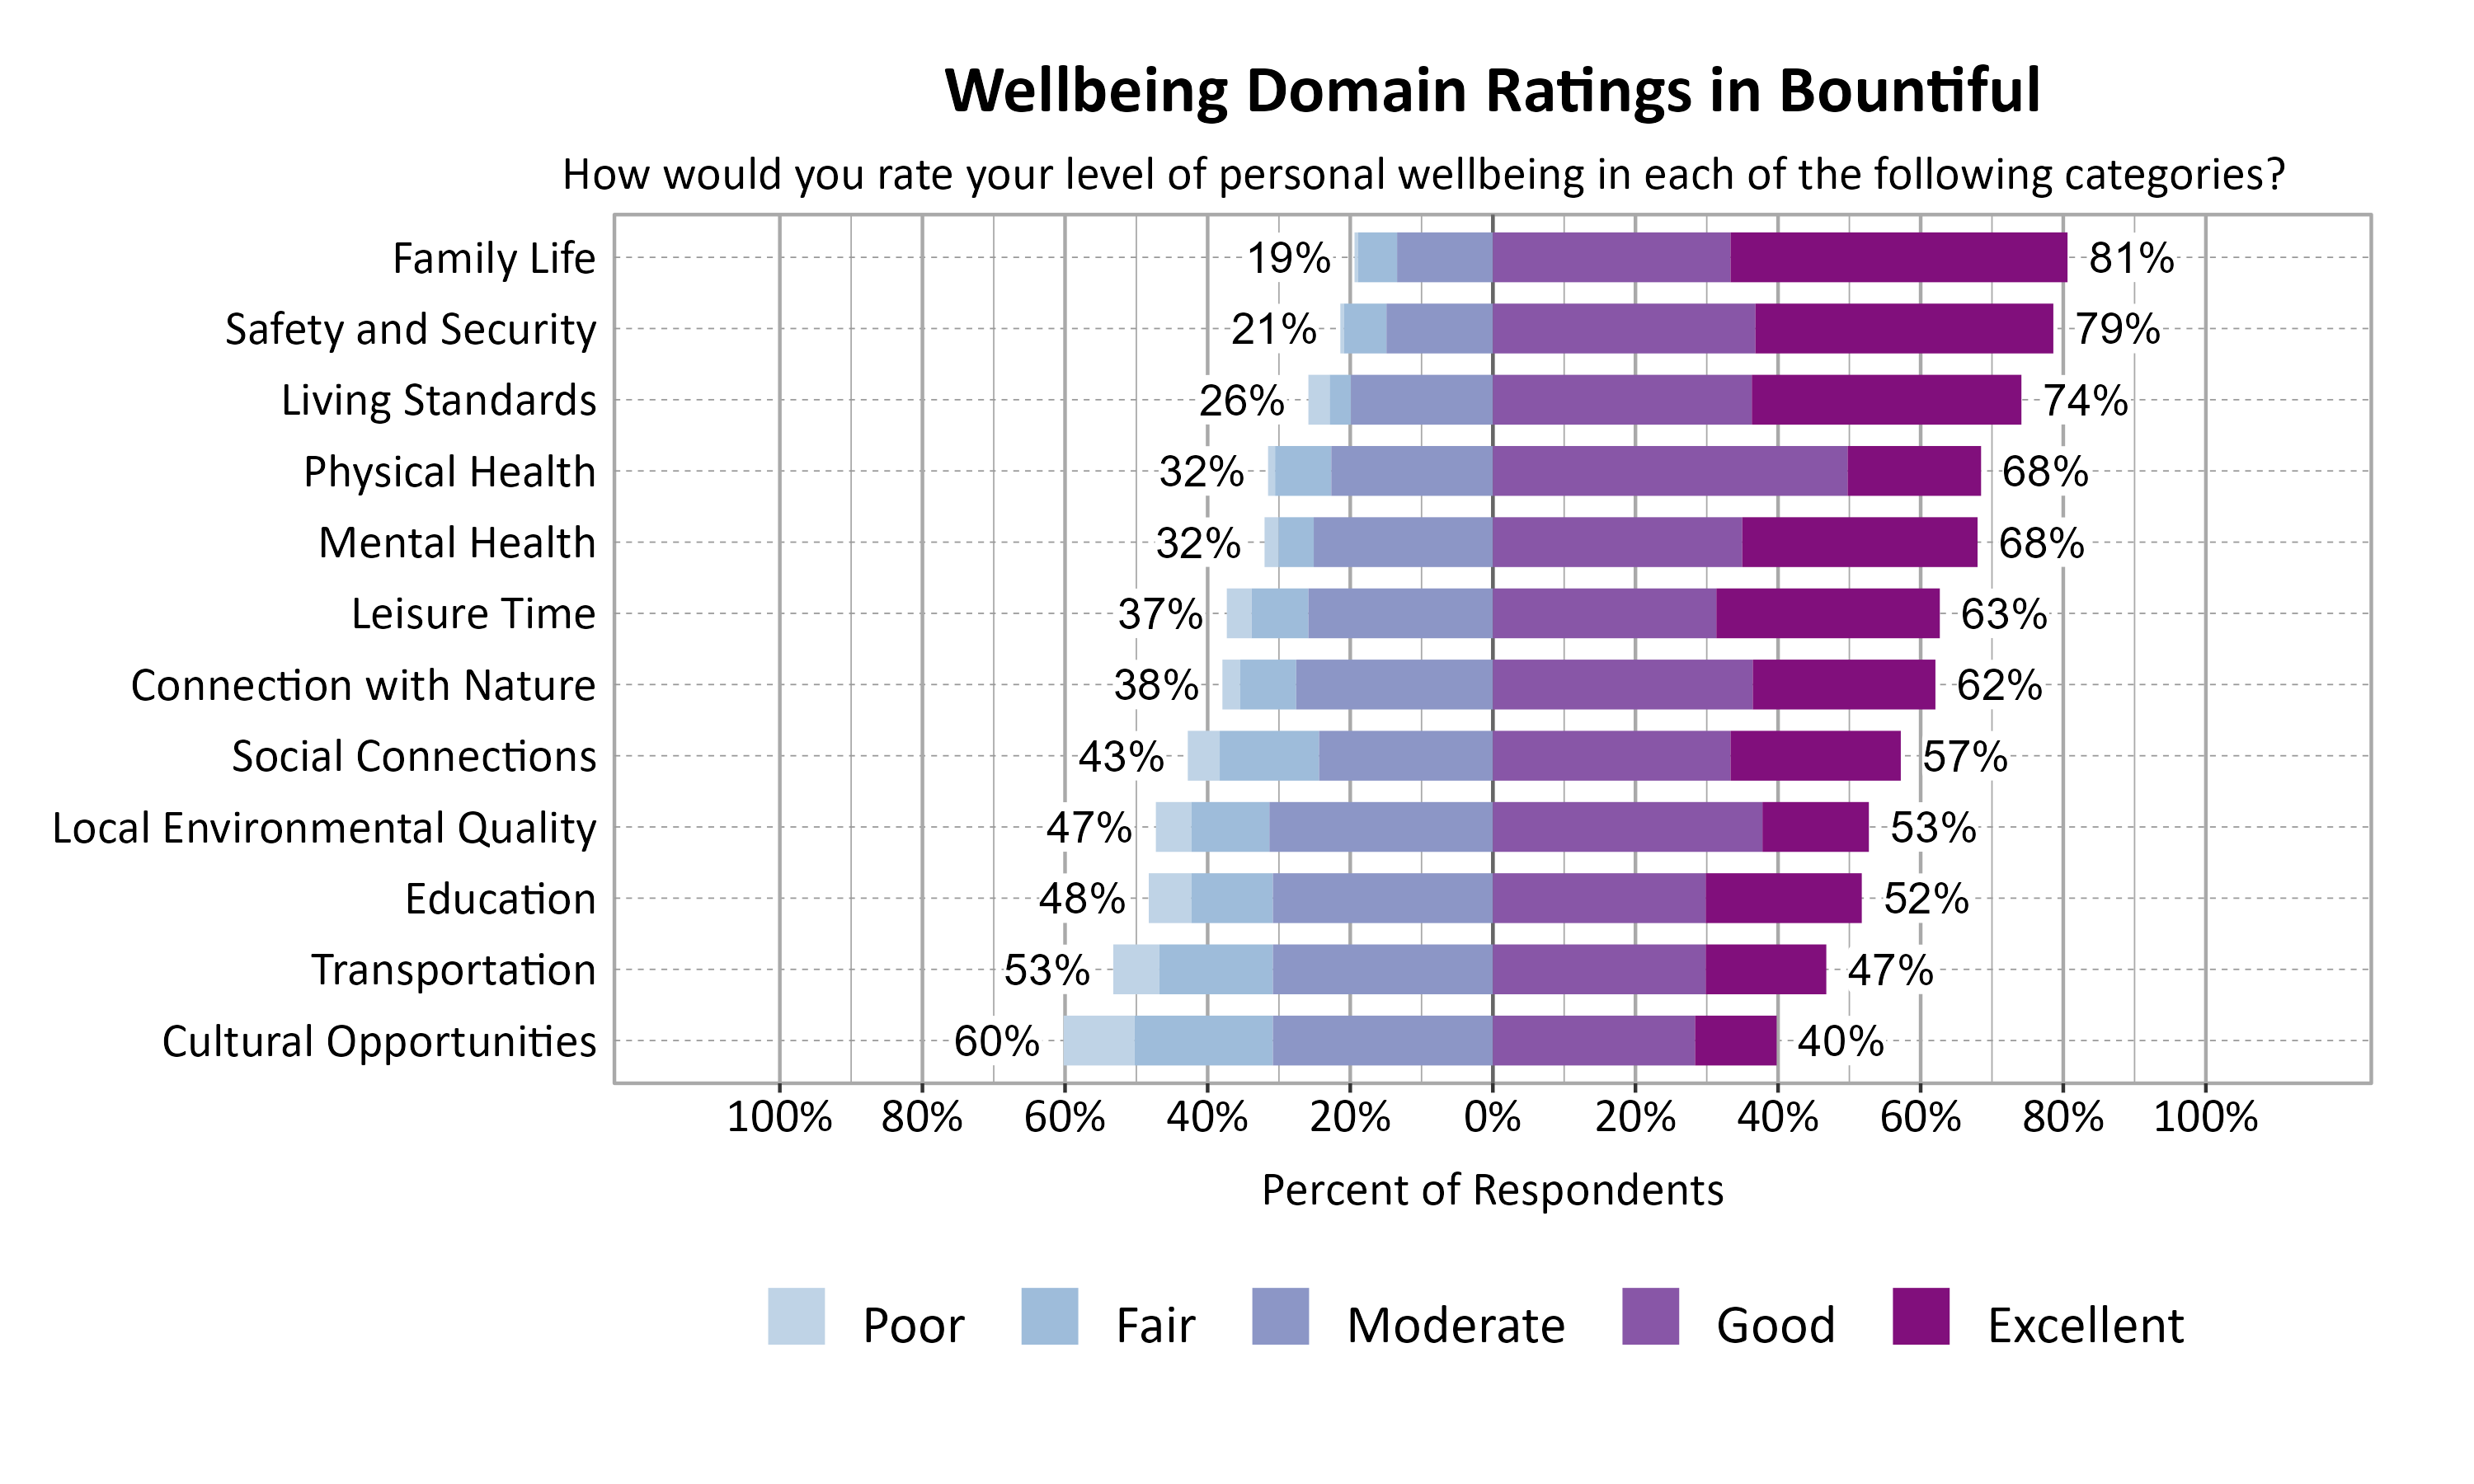
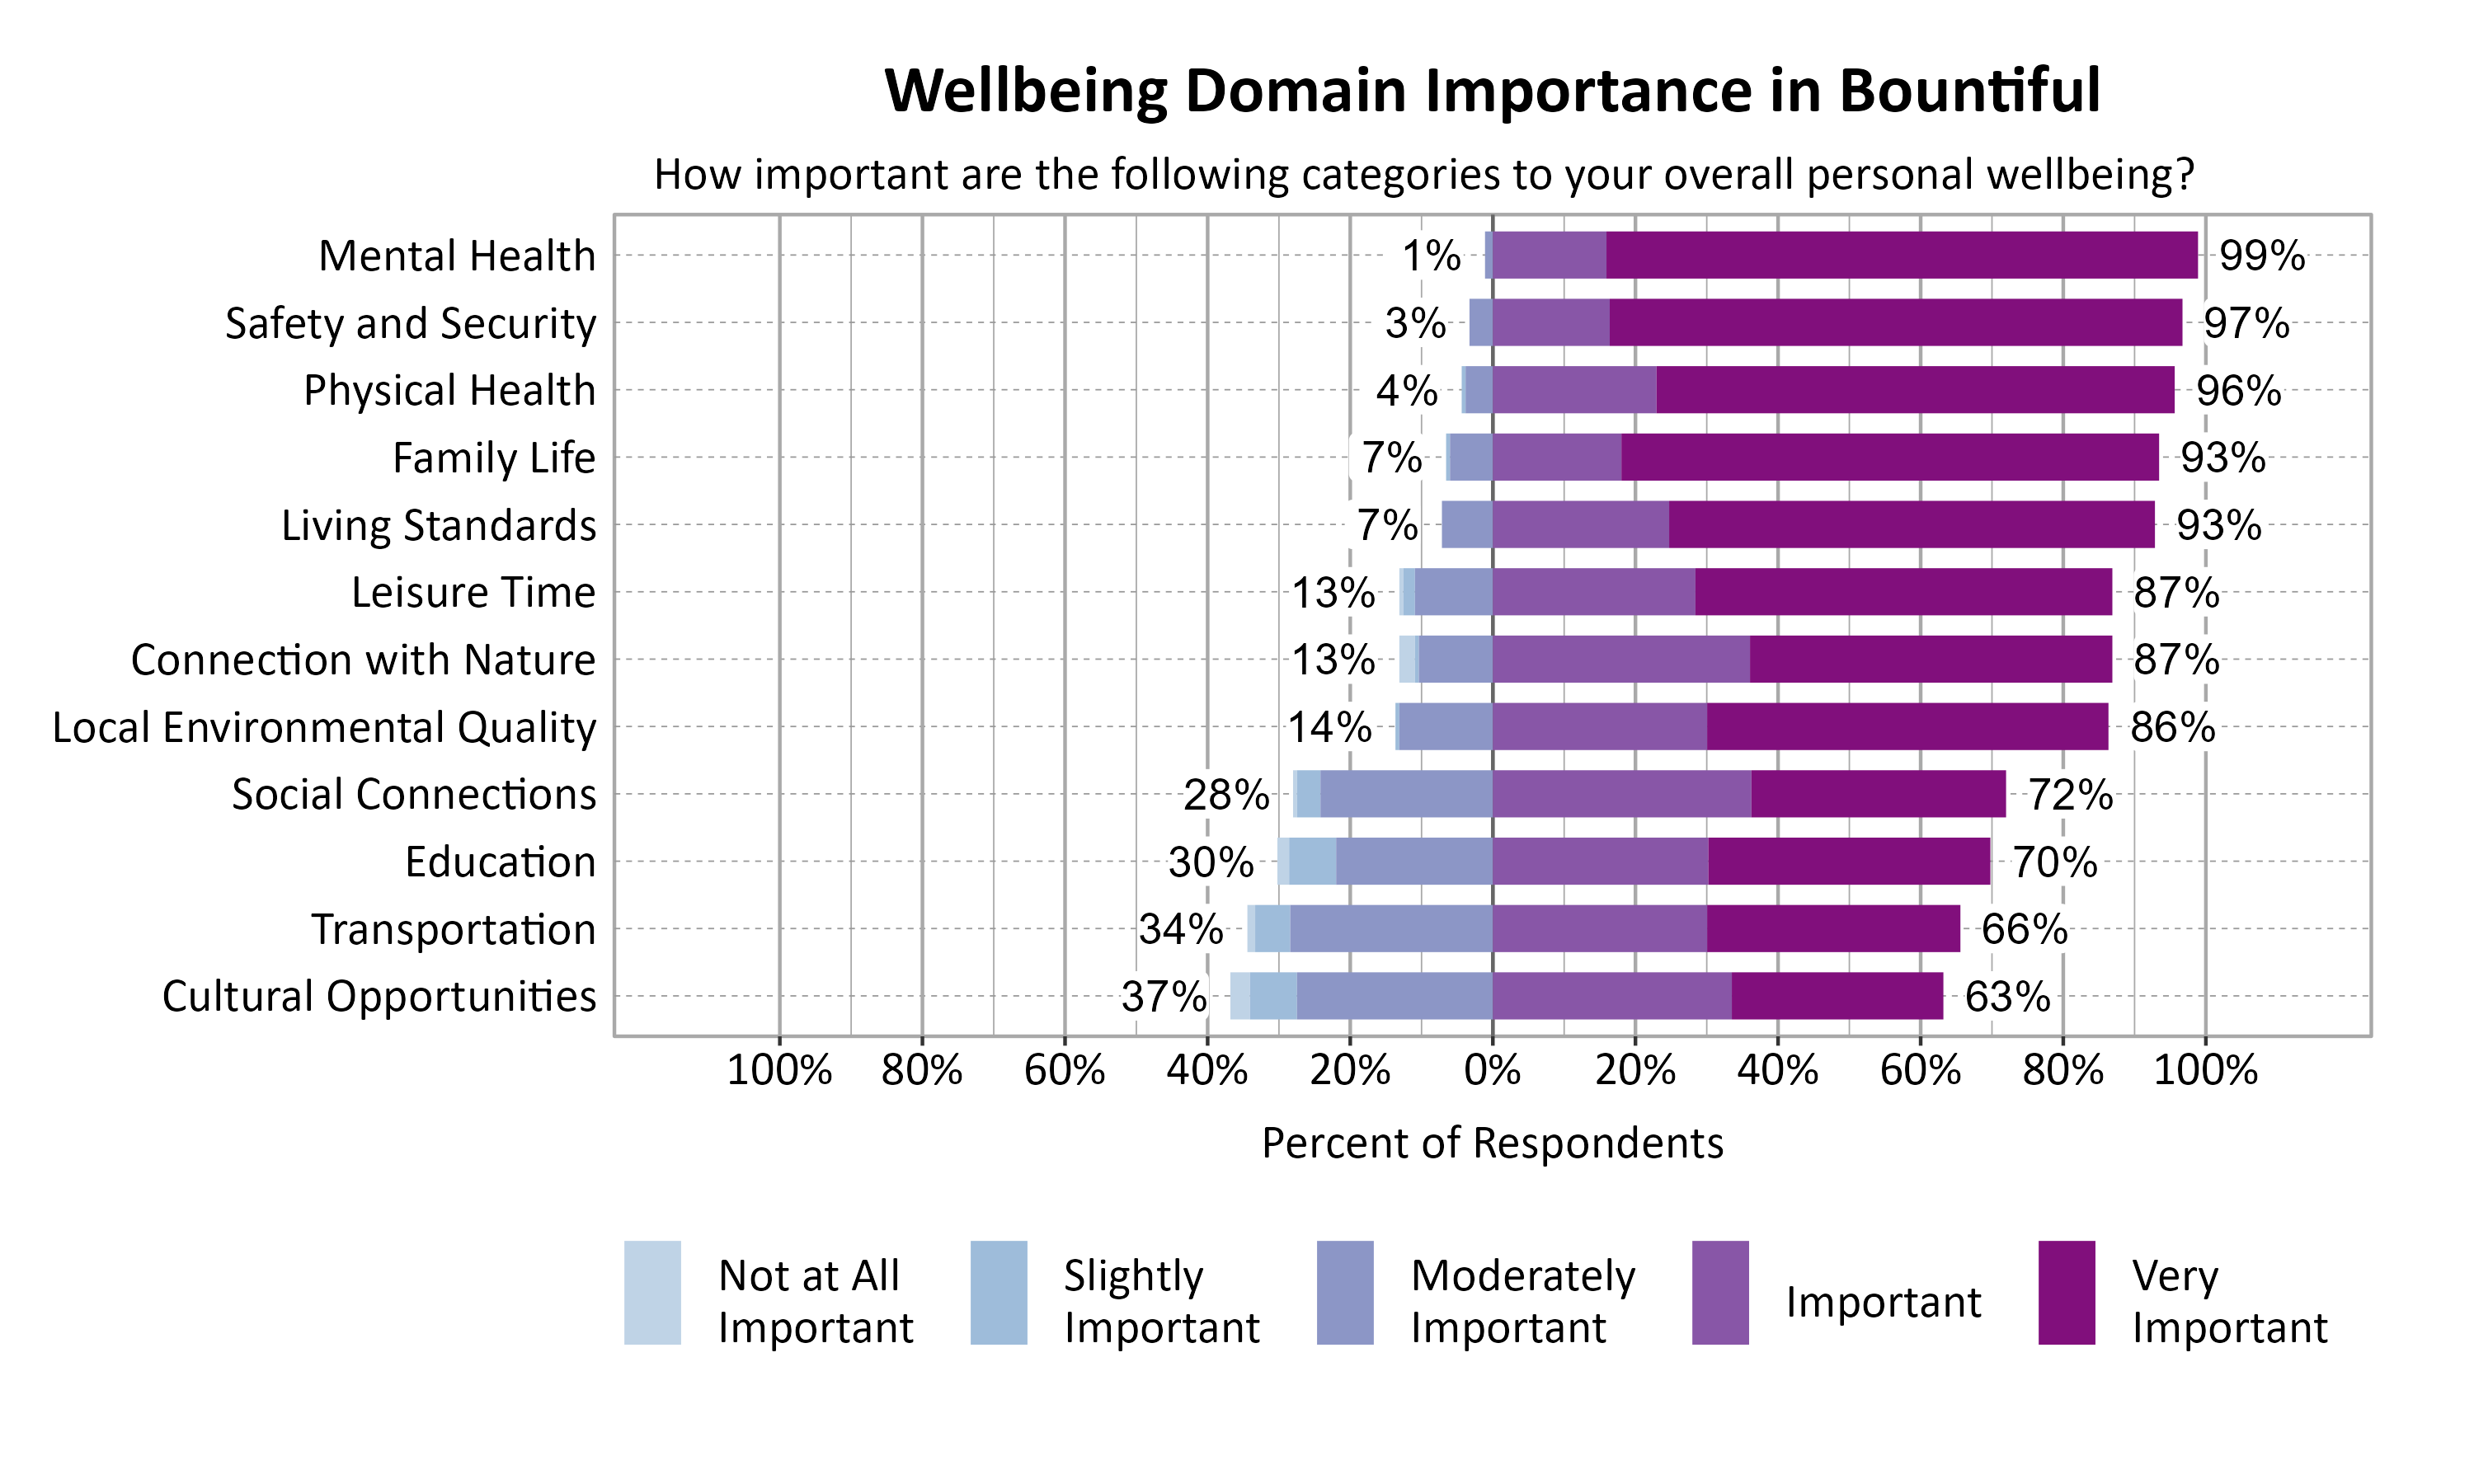
Wellbeing Domains in Bountiful
According to national and international entities that track wellbeing, there are a number of common dimensions or domains of wellbeing. Survey respondents rated twelve domains on a 5-point scale from poor to excellent. They were also asked to indicate the importance of each domain to their overall personal wellbeing on a 5-point scale from not at all important to very important. The highest rated wellbeing domains for respondents in Bountiful were Family Life (81%), Safety and Security (79%), and Living Standards (74%). The most important wellbeing domains were Mental Health (99%), Safety and Security (97%), and Physical Health (96%).
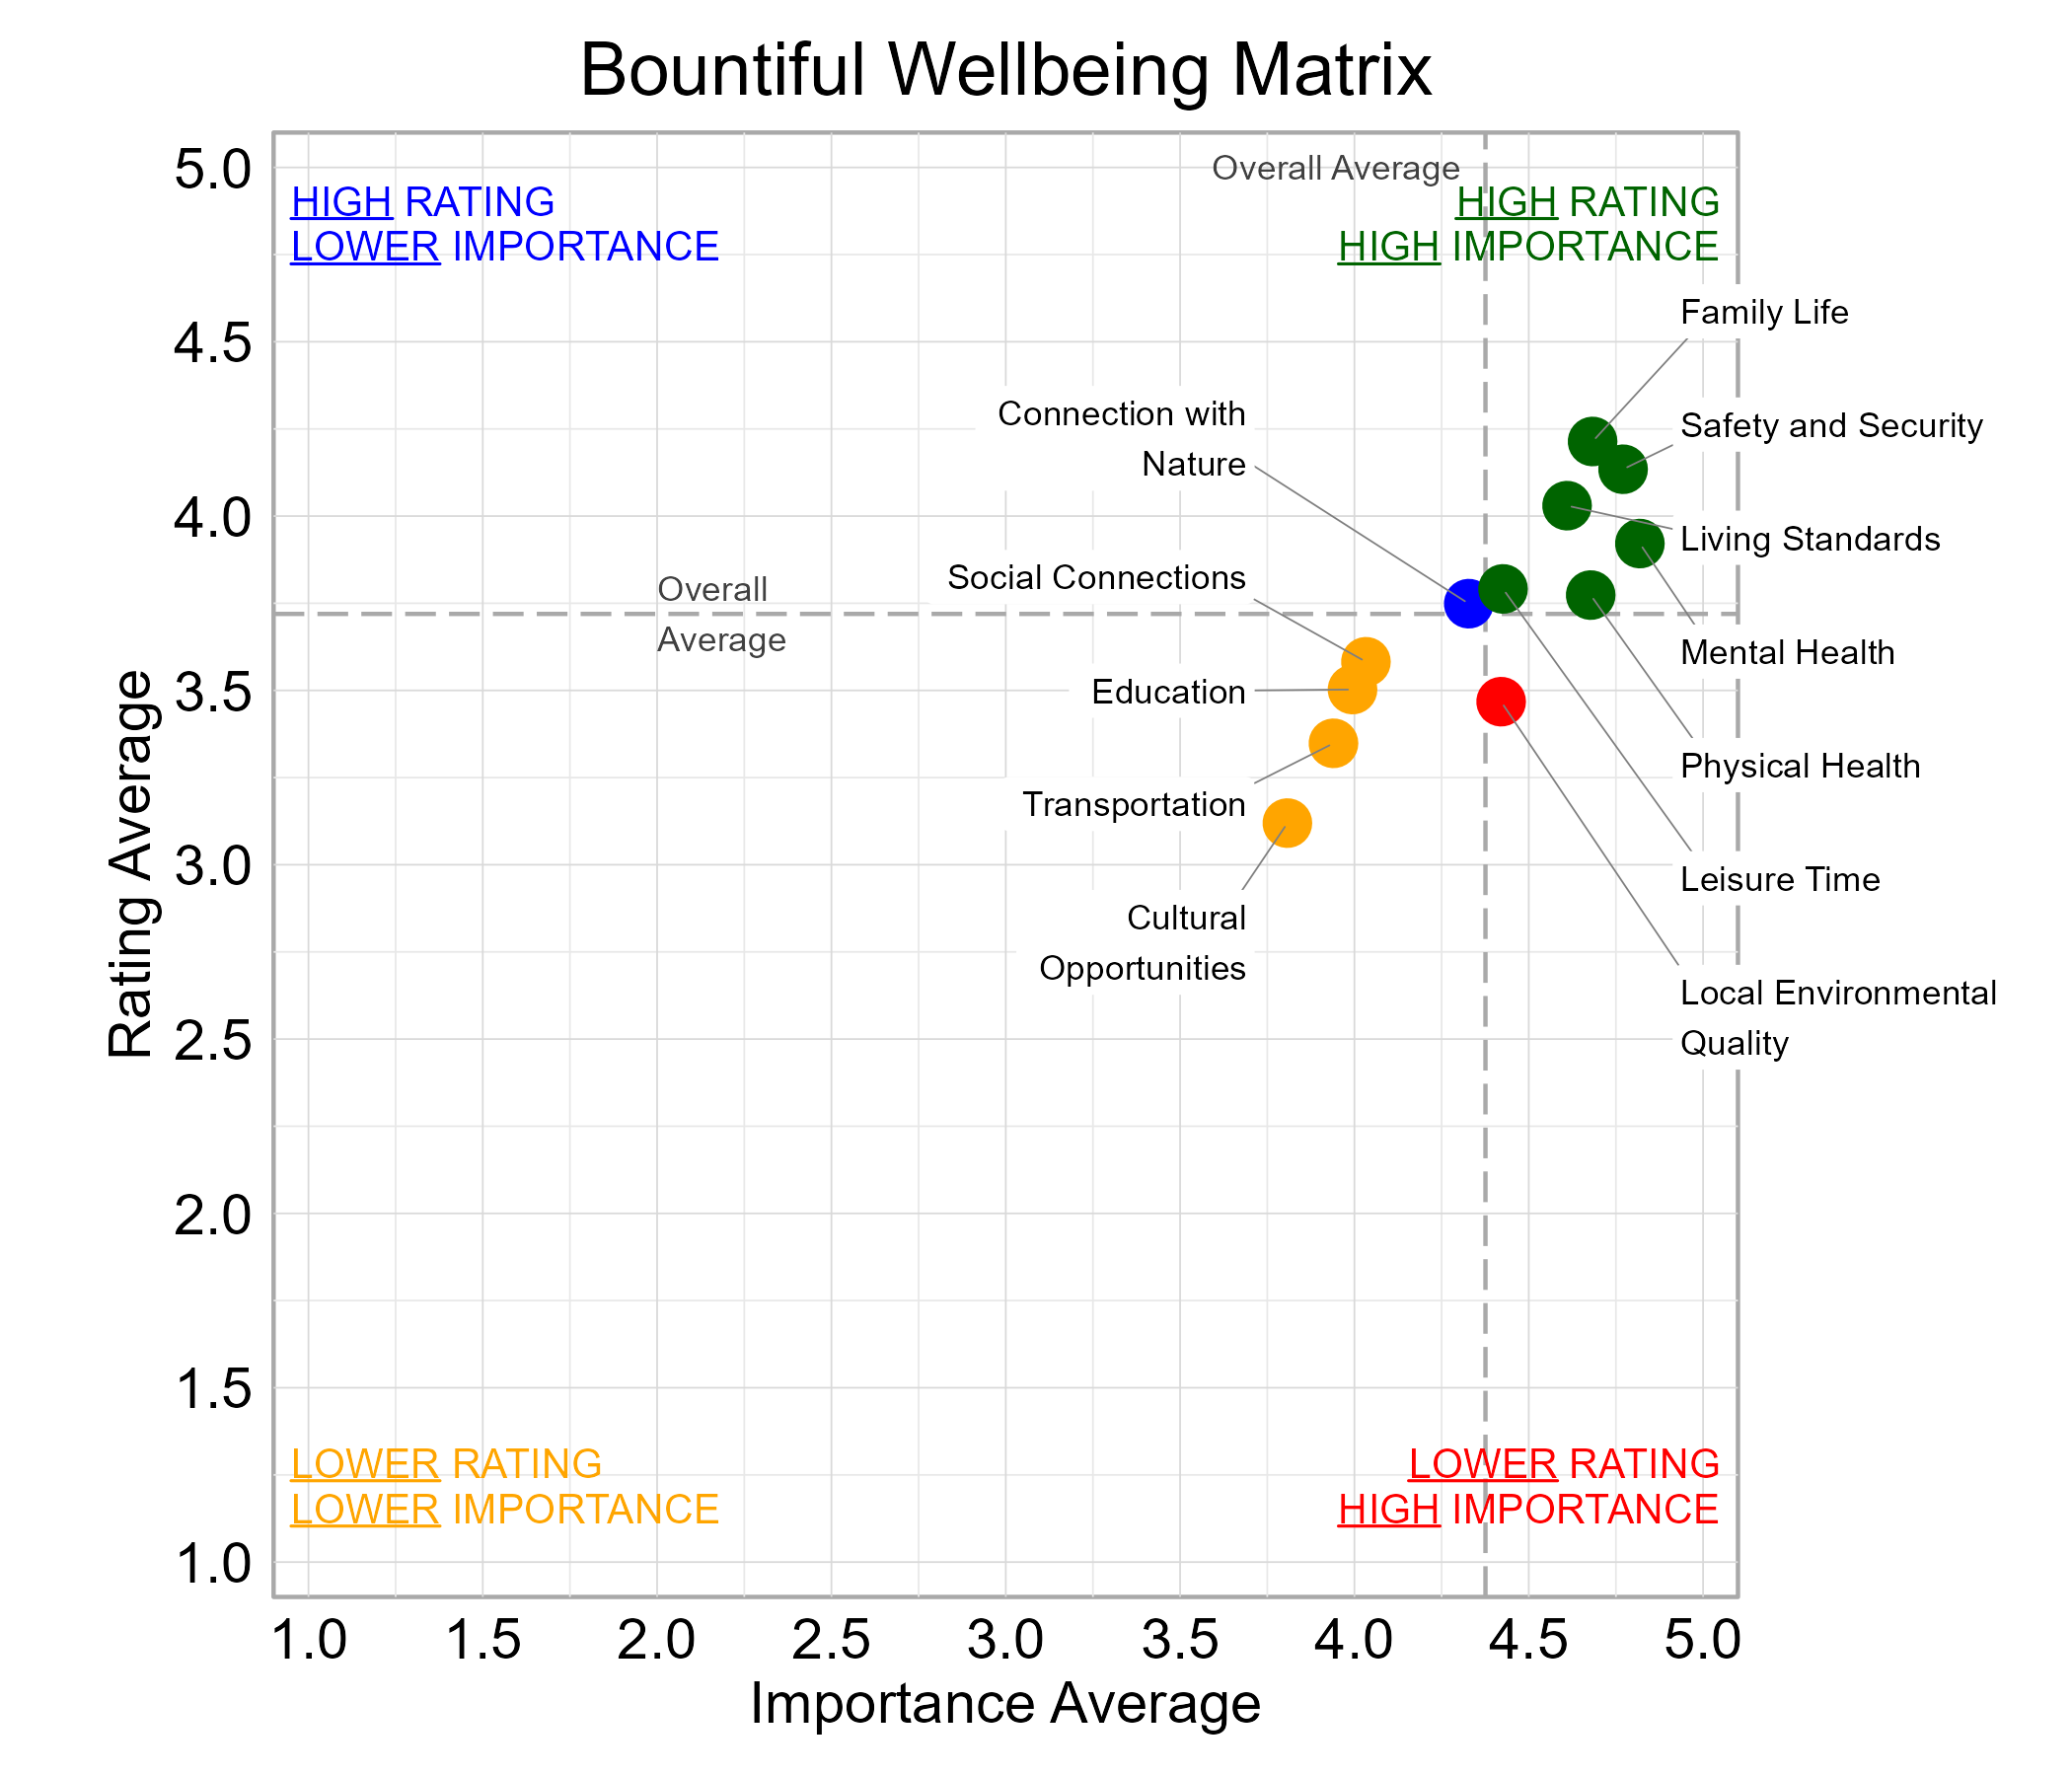
Wellbeing Matrix for Bountiful
The graph below illustrates the relationship between the average rating and the average importance of wellbeing domains for survey respondents from Bountiful. Family Life, Leisure Time, Living Standards, Mental Health, Physical Health, and Safety and Security were highly important and rated above average among the domains. Local Environmental Quality fell in the “red zone” of higher importance and lower ratings.
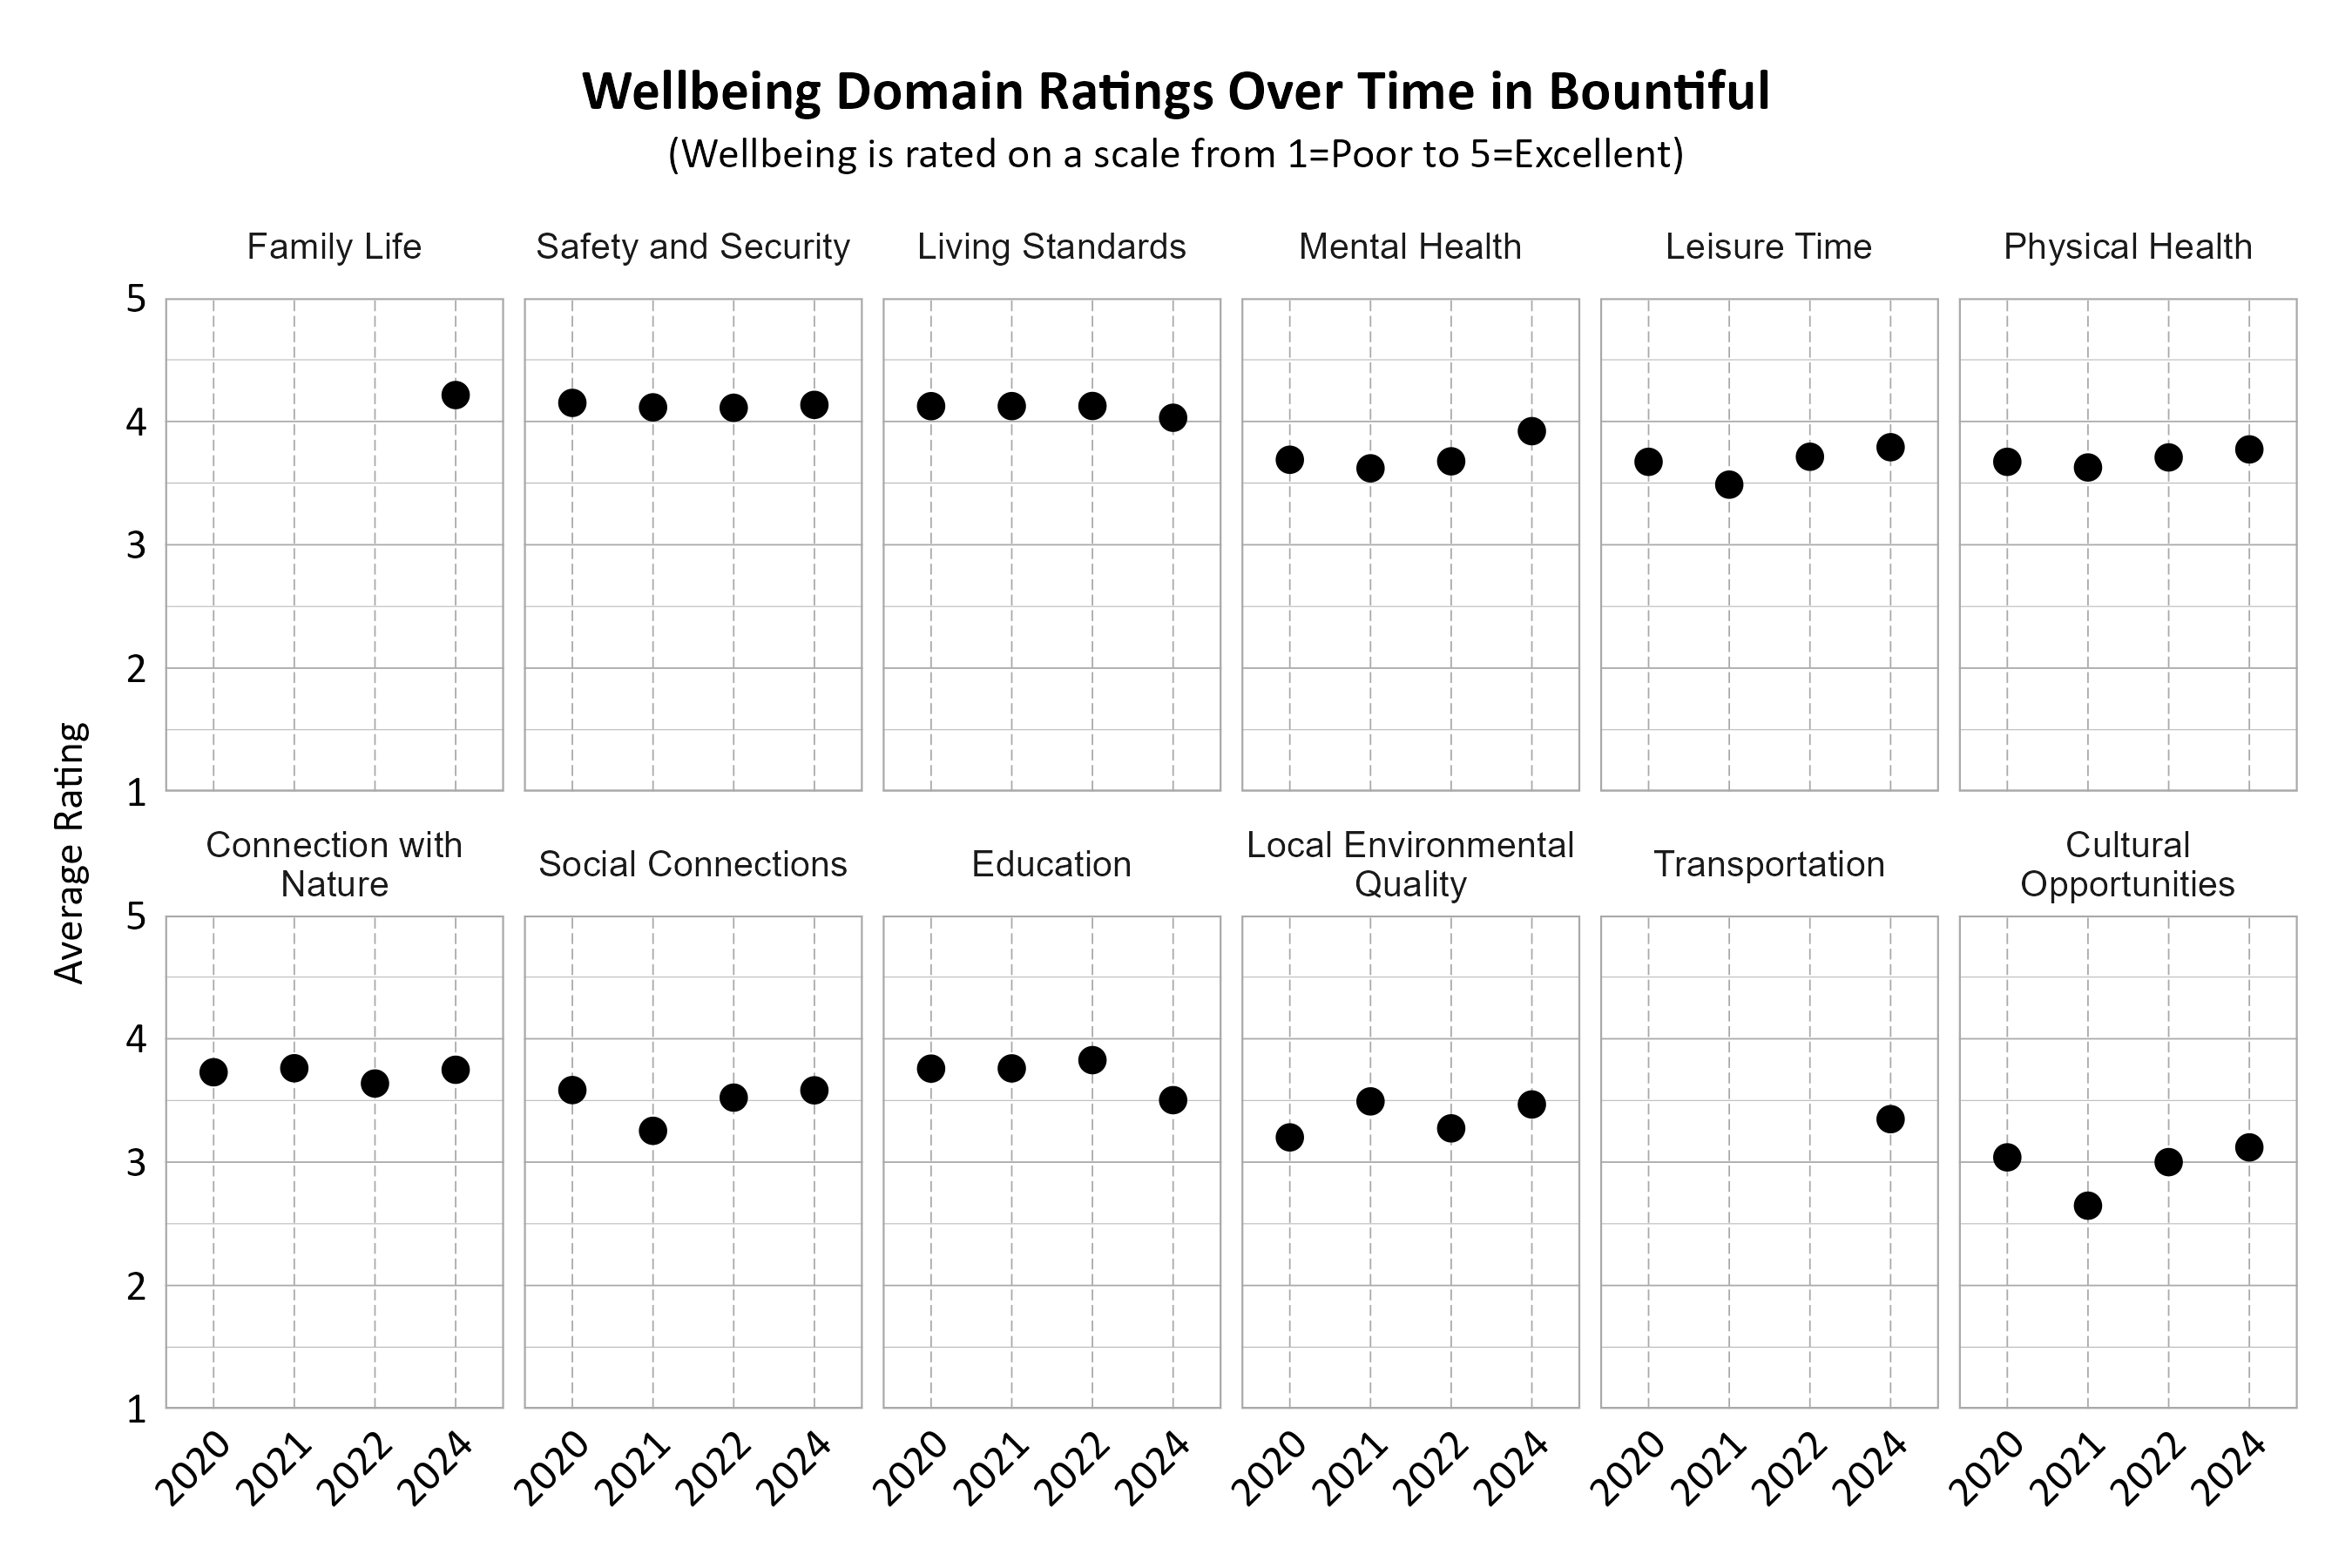
Wellbeing Domains Over Time in Bountiful
The graphs below show how the domains were rated over the years by Bountiful residents. The number of respondents changed over time. Note that the two domains Family Life and Transportation were new categories in the 2024 survey and were not measured in previous years. Safety and Security and Living Standards have been consistently highly rated across the years. Most domain ratings noticed a slight increase from 2022 to 2024, except for Education and Living Standards which saw a slight decrease.
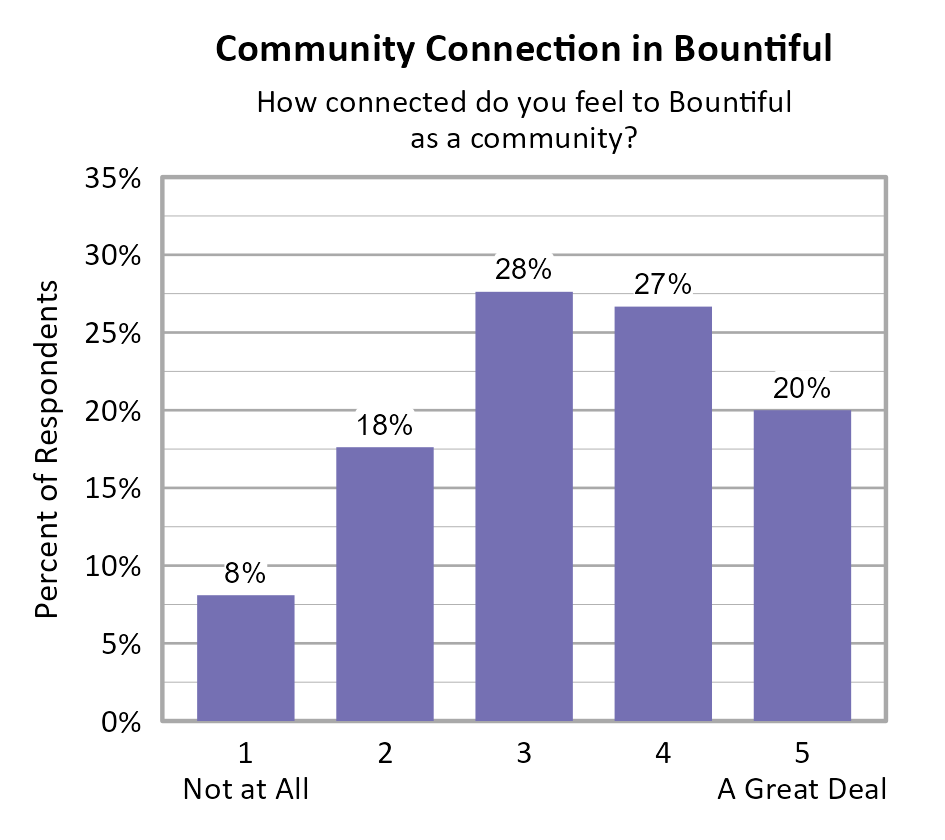
Community Connection in Bountiful
Survey participants were asked about how connected they feel to Bountiful on a 5-point scale from not at all (1) to a great deal (5), and the average score of all respondents was 3.33.
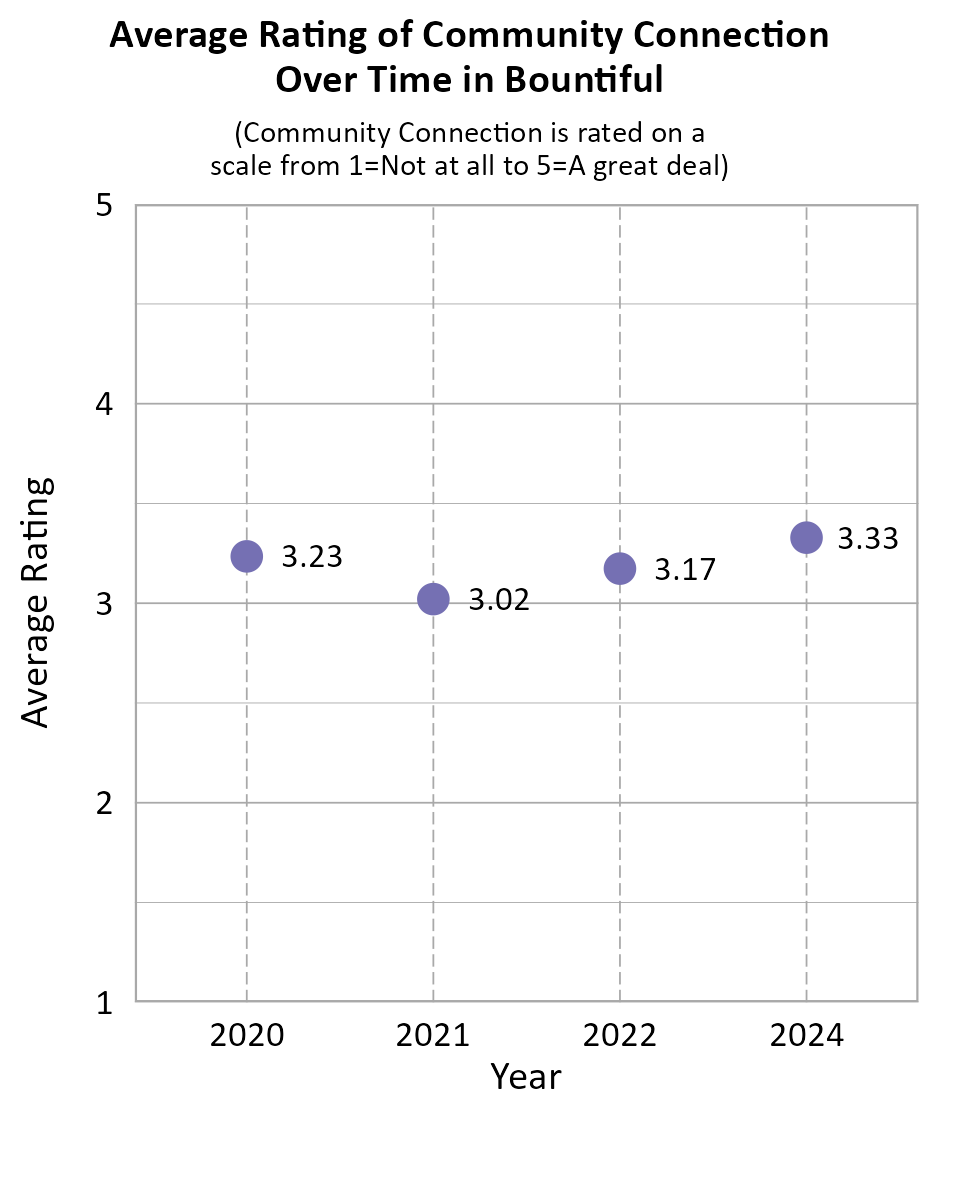
When comparing survey data from Bountiful over the years as shown in the information below, we can see that the average community connection score declined between 2020 and 2021, but has improved gradually since then.
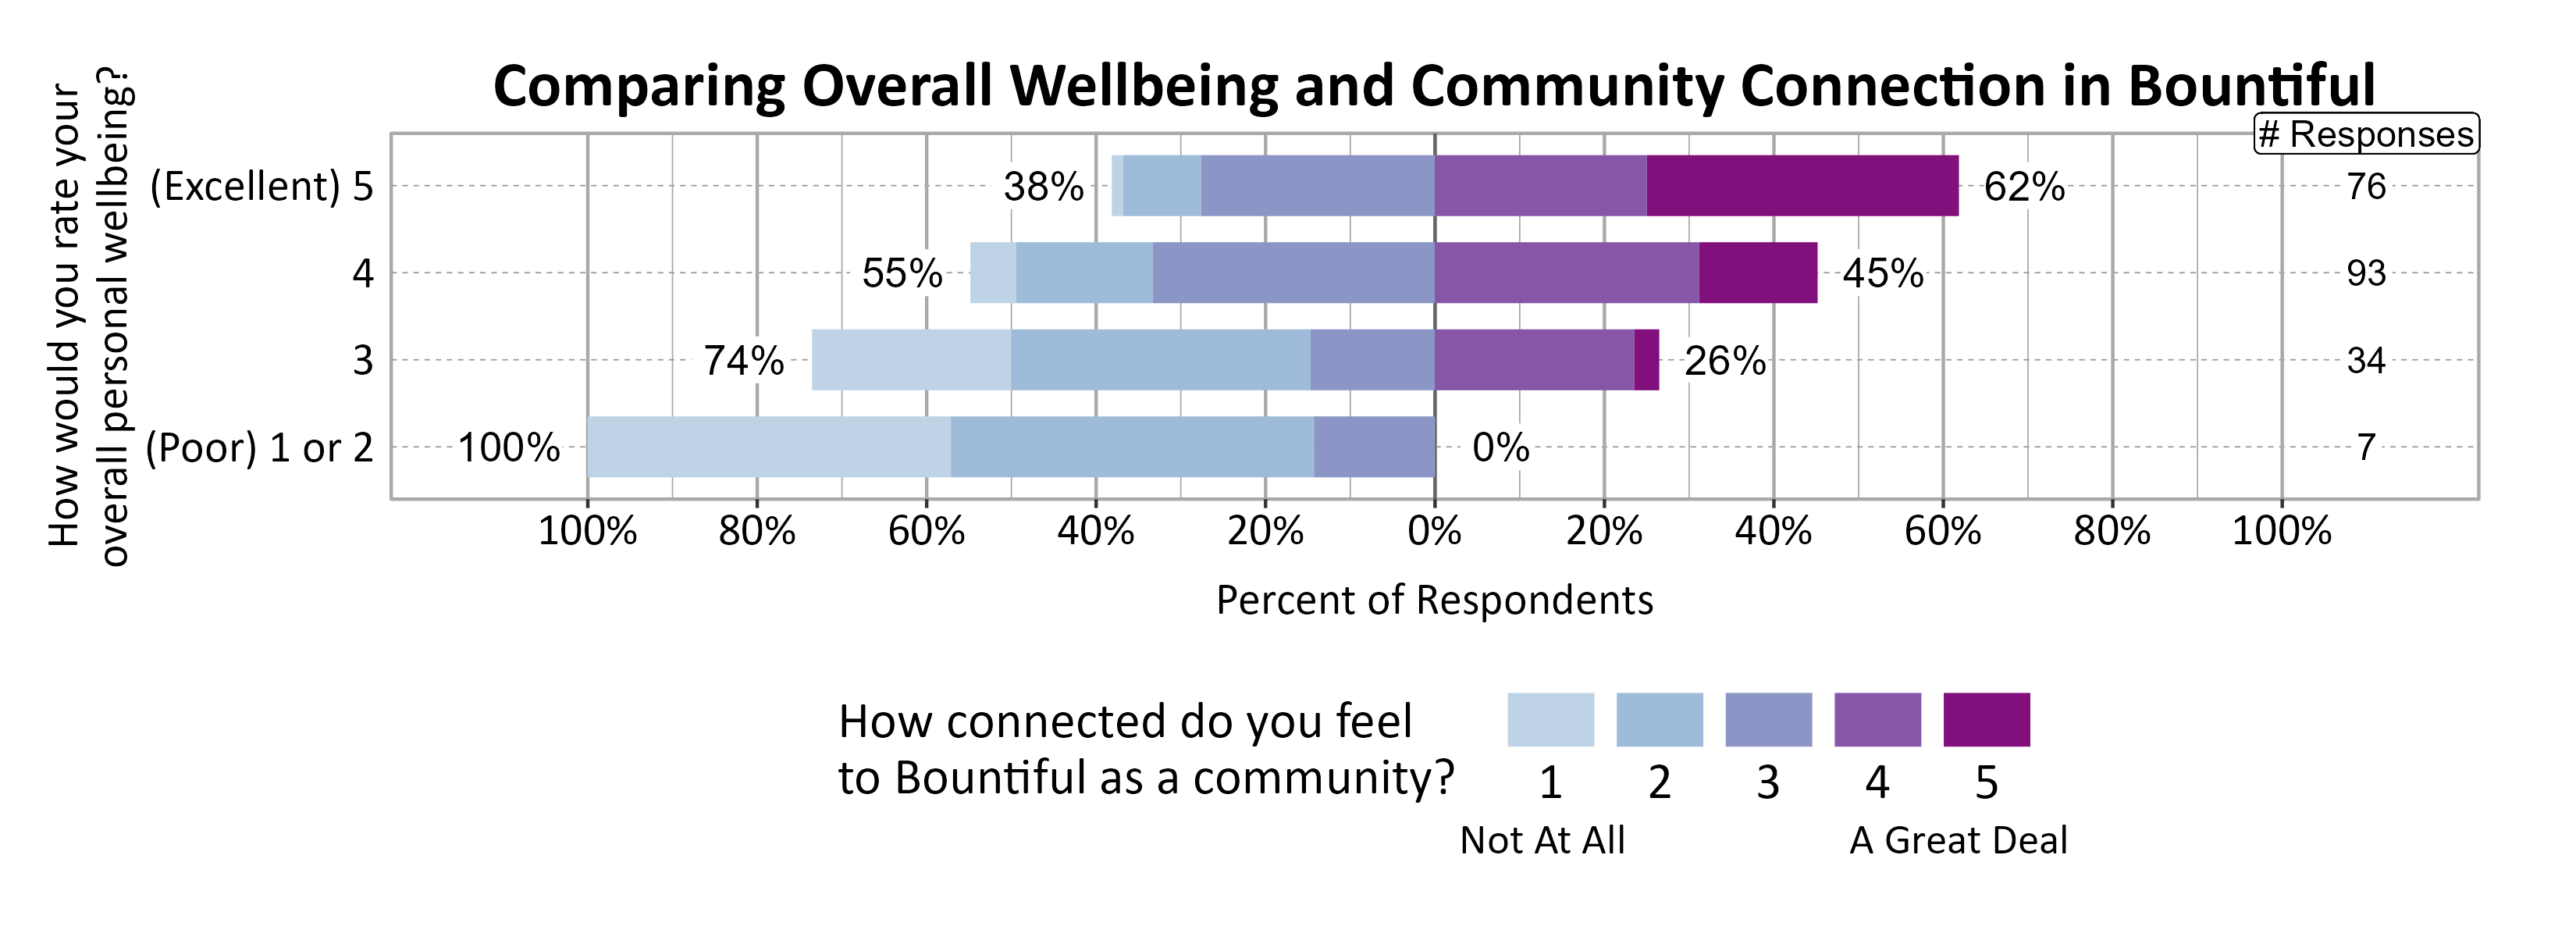
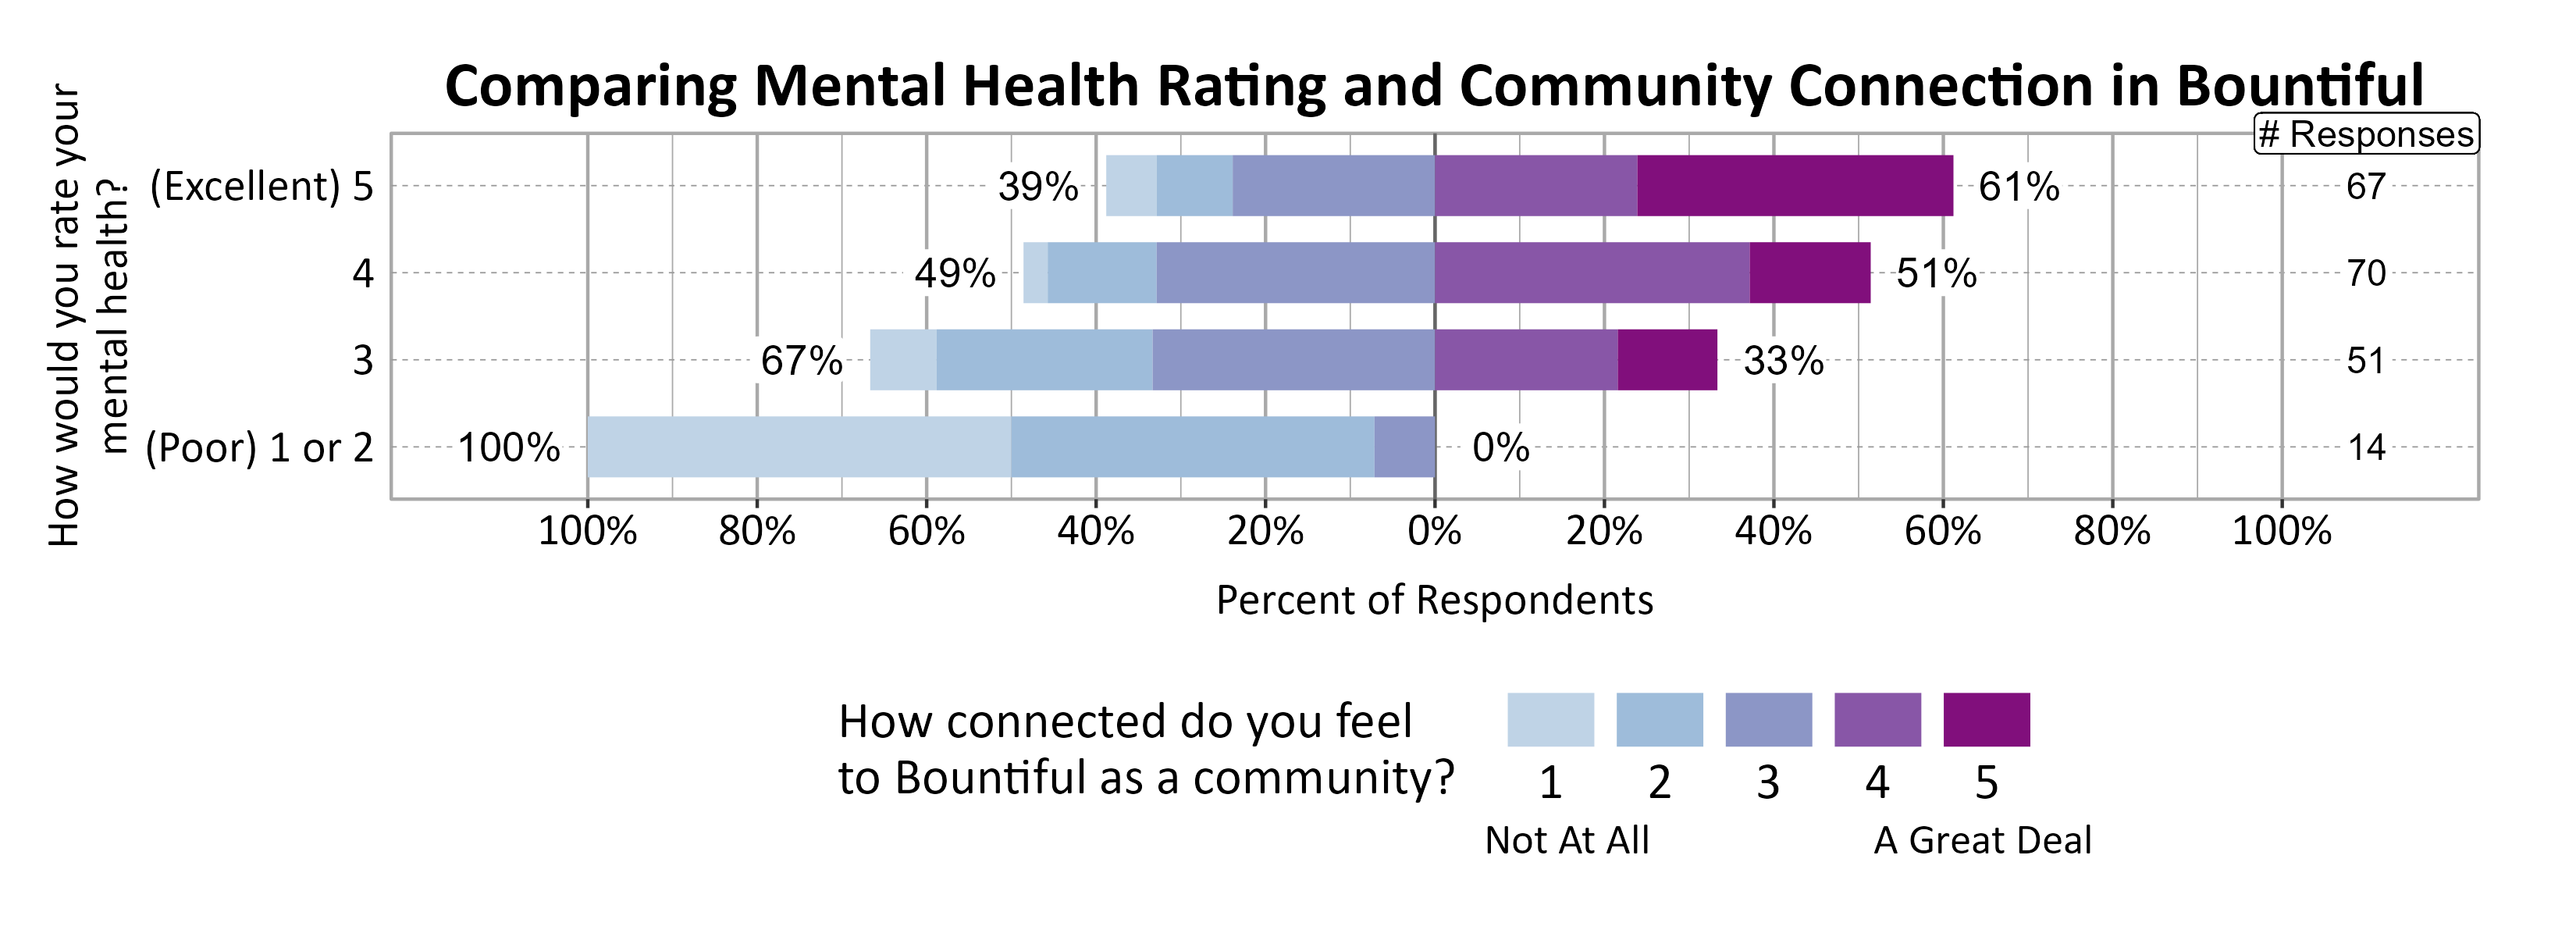
A positive relationship was found between individuals’ community connection and overall personal wellbeing as well as mental health.
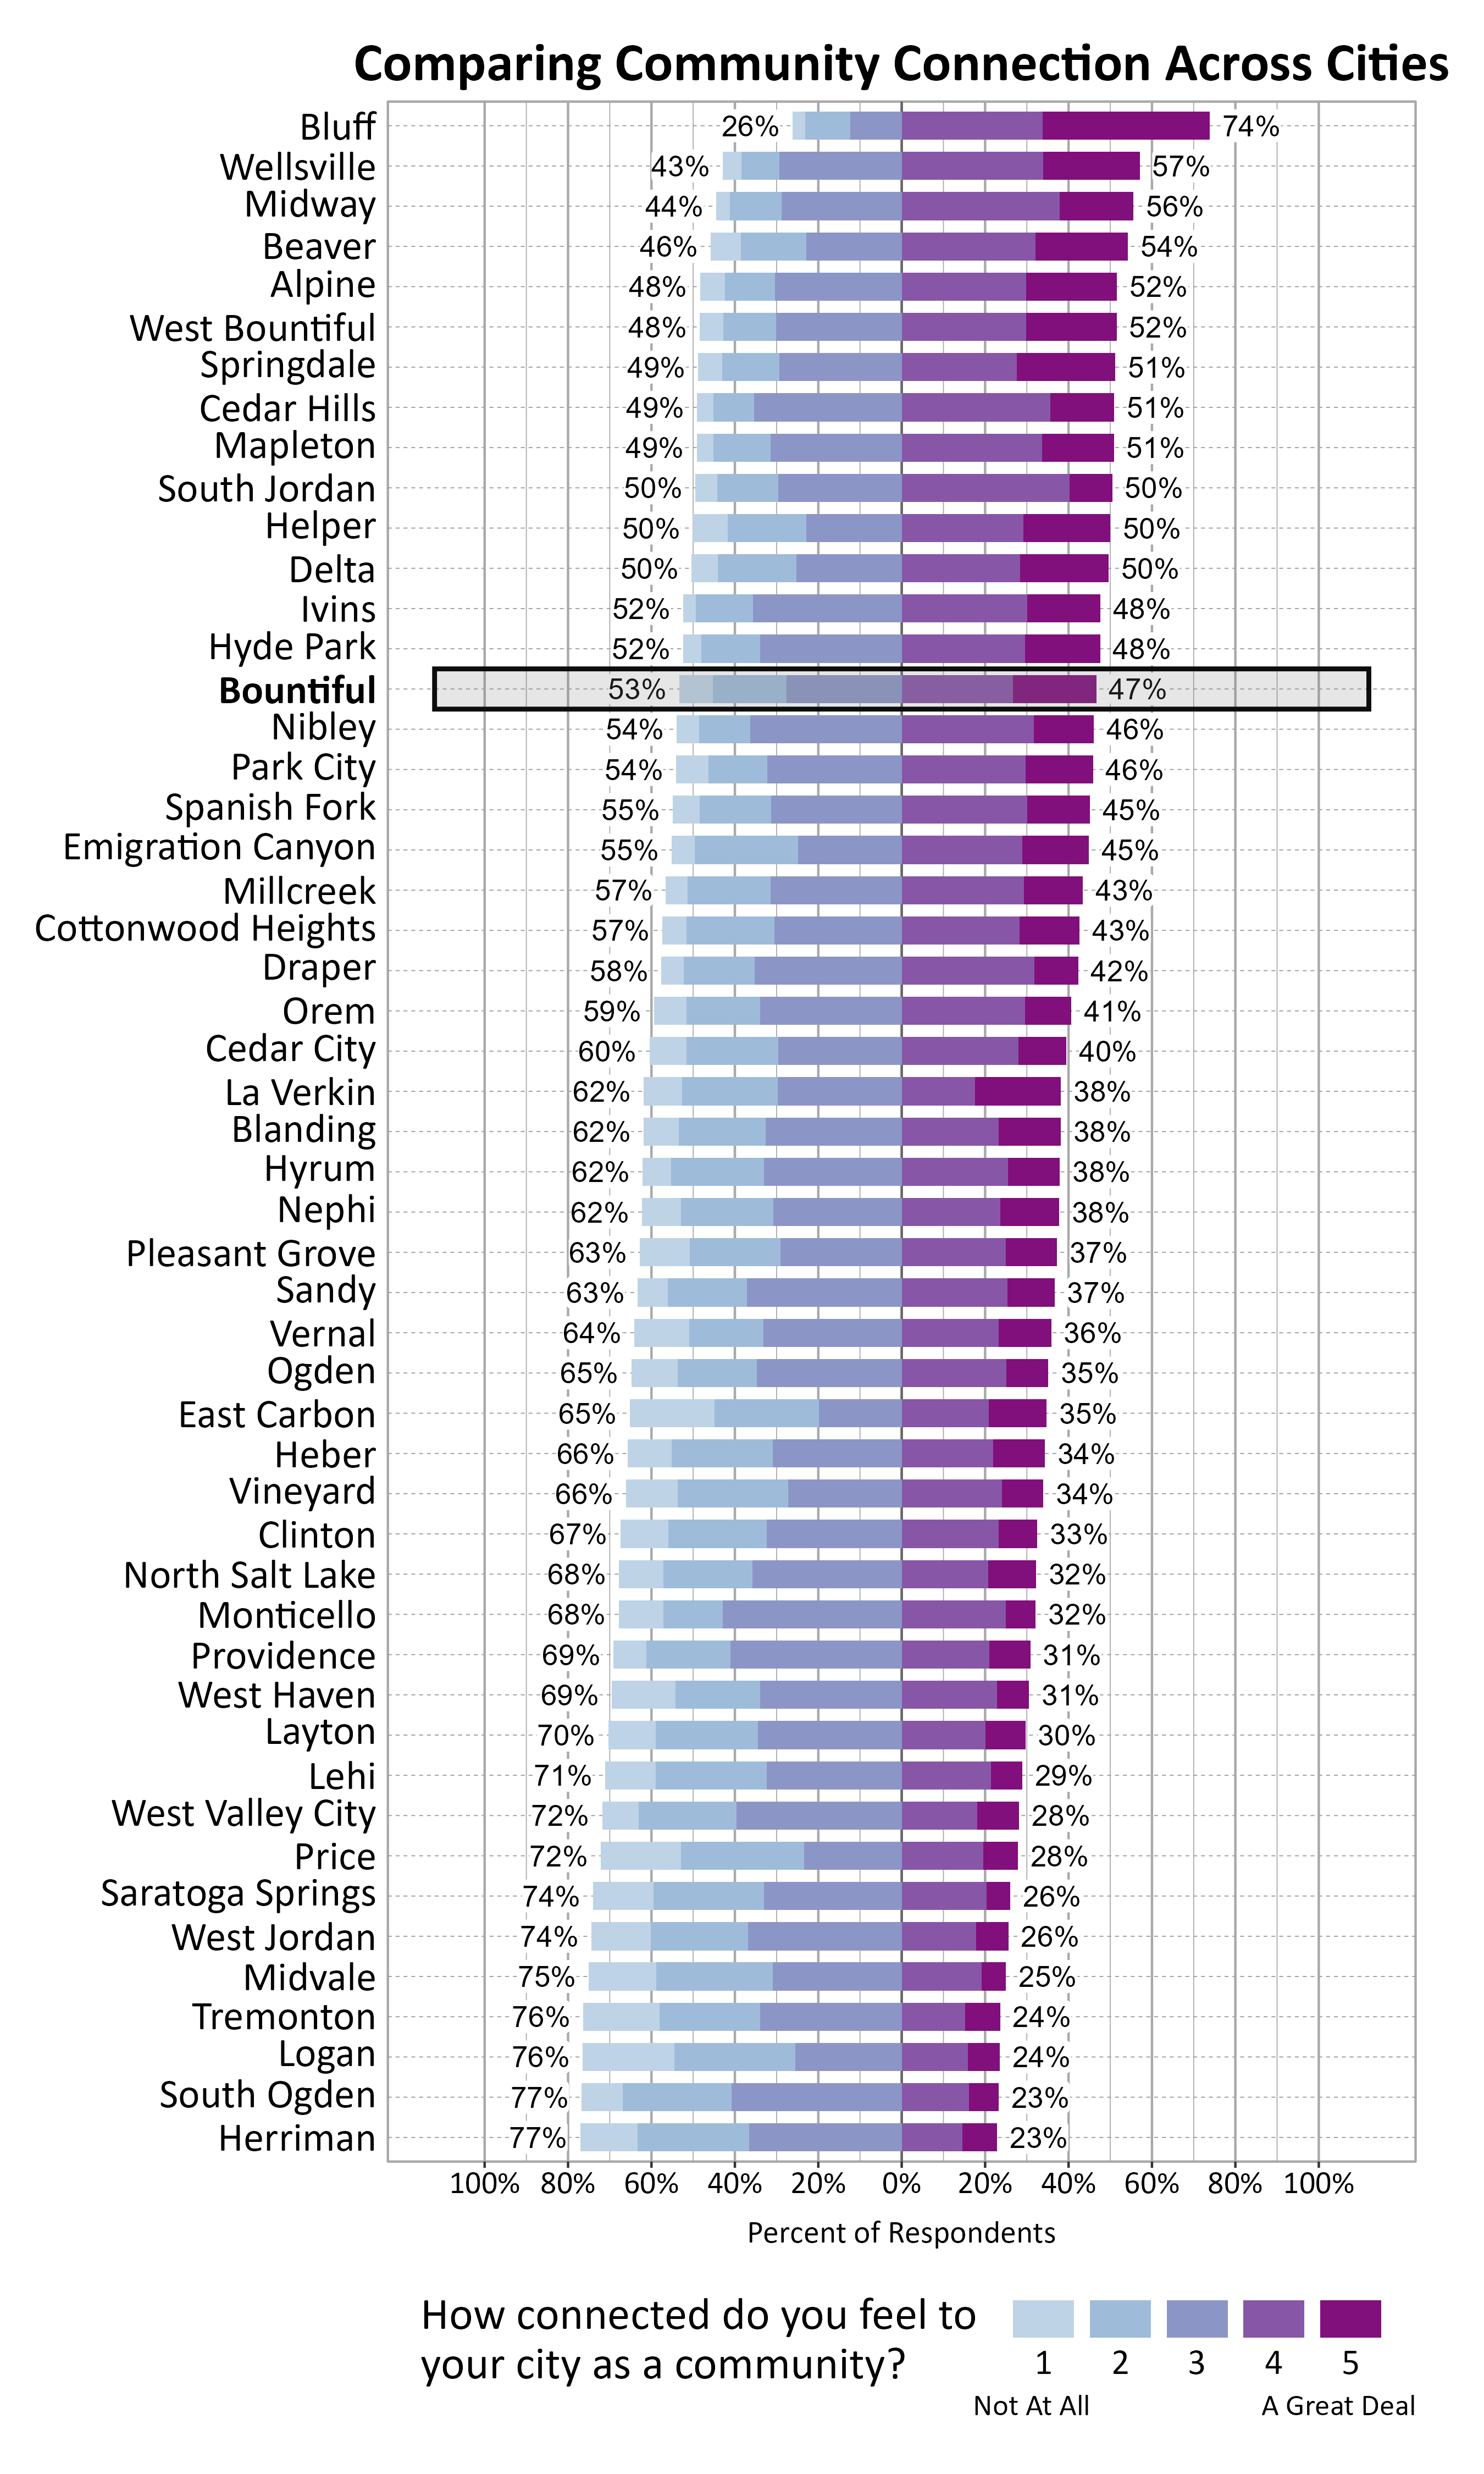
The graph below shows how Wellbeing Project cities and towns compare on feelings of community connection based on the percentage of respondents who answered 4 or a 5 on a 5-point scale from “not at all” to “a great deal” connected to their city or town. Bountiful ranked 15 out of the 51 cities that participated.
Participation in Recreation and Nature-Related Activities
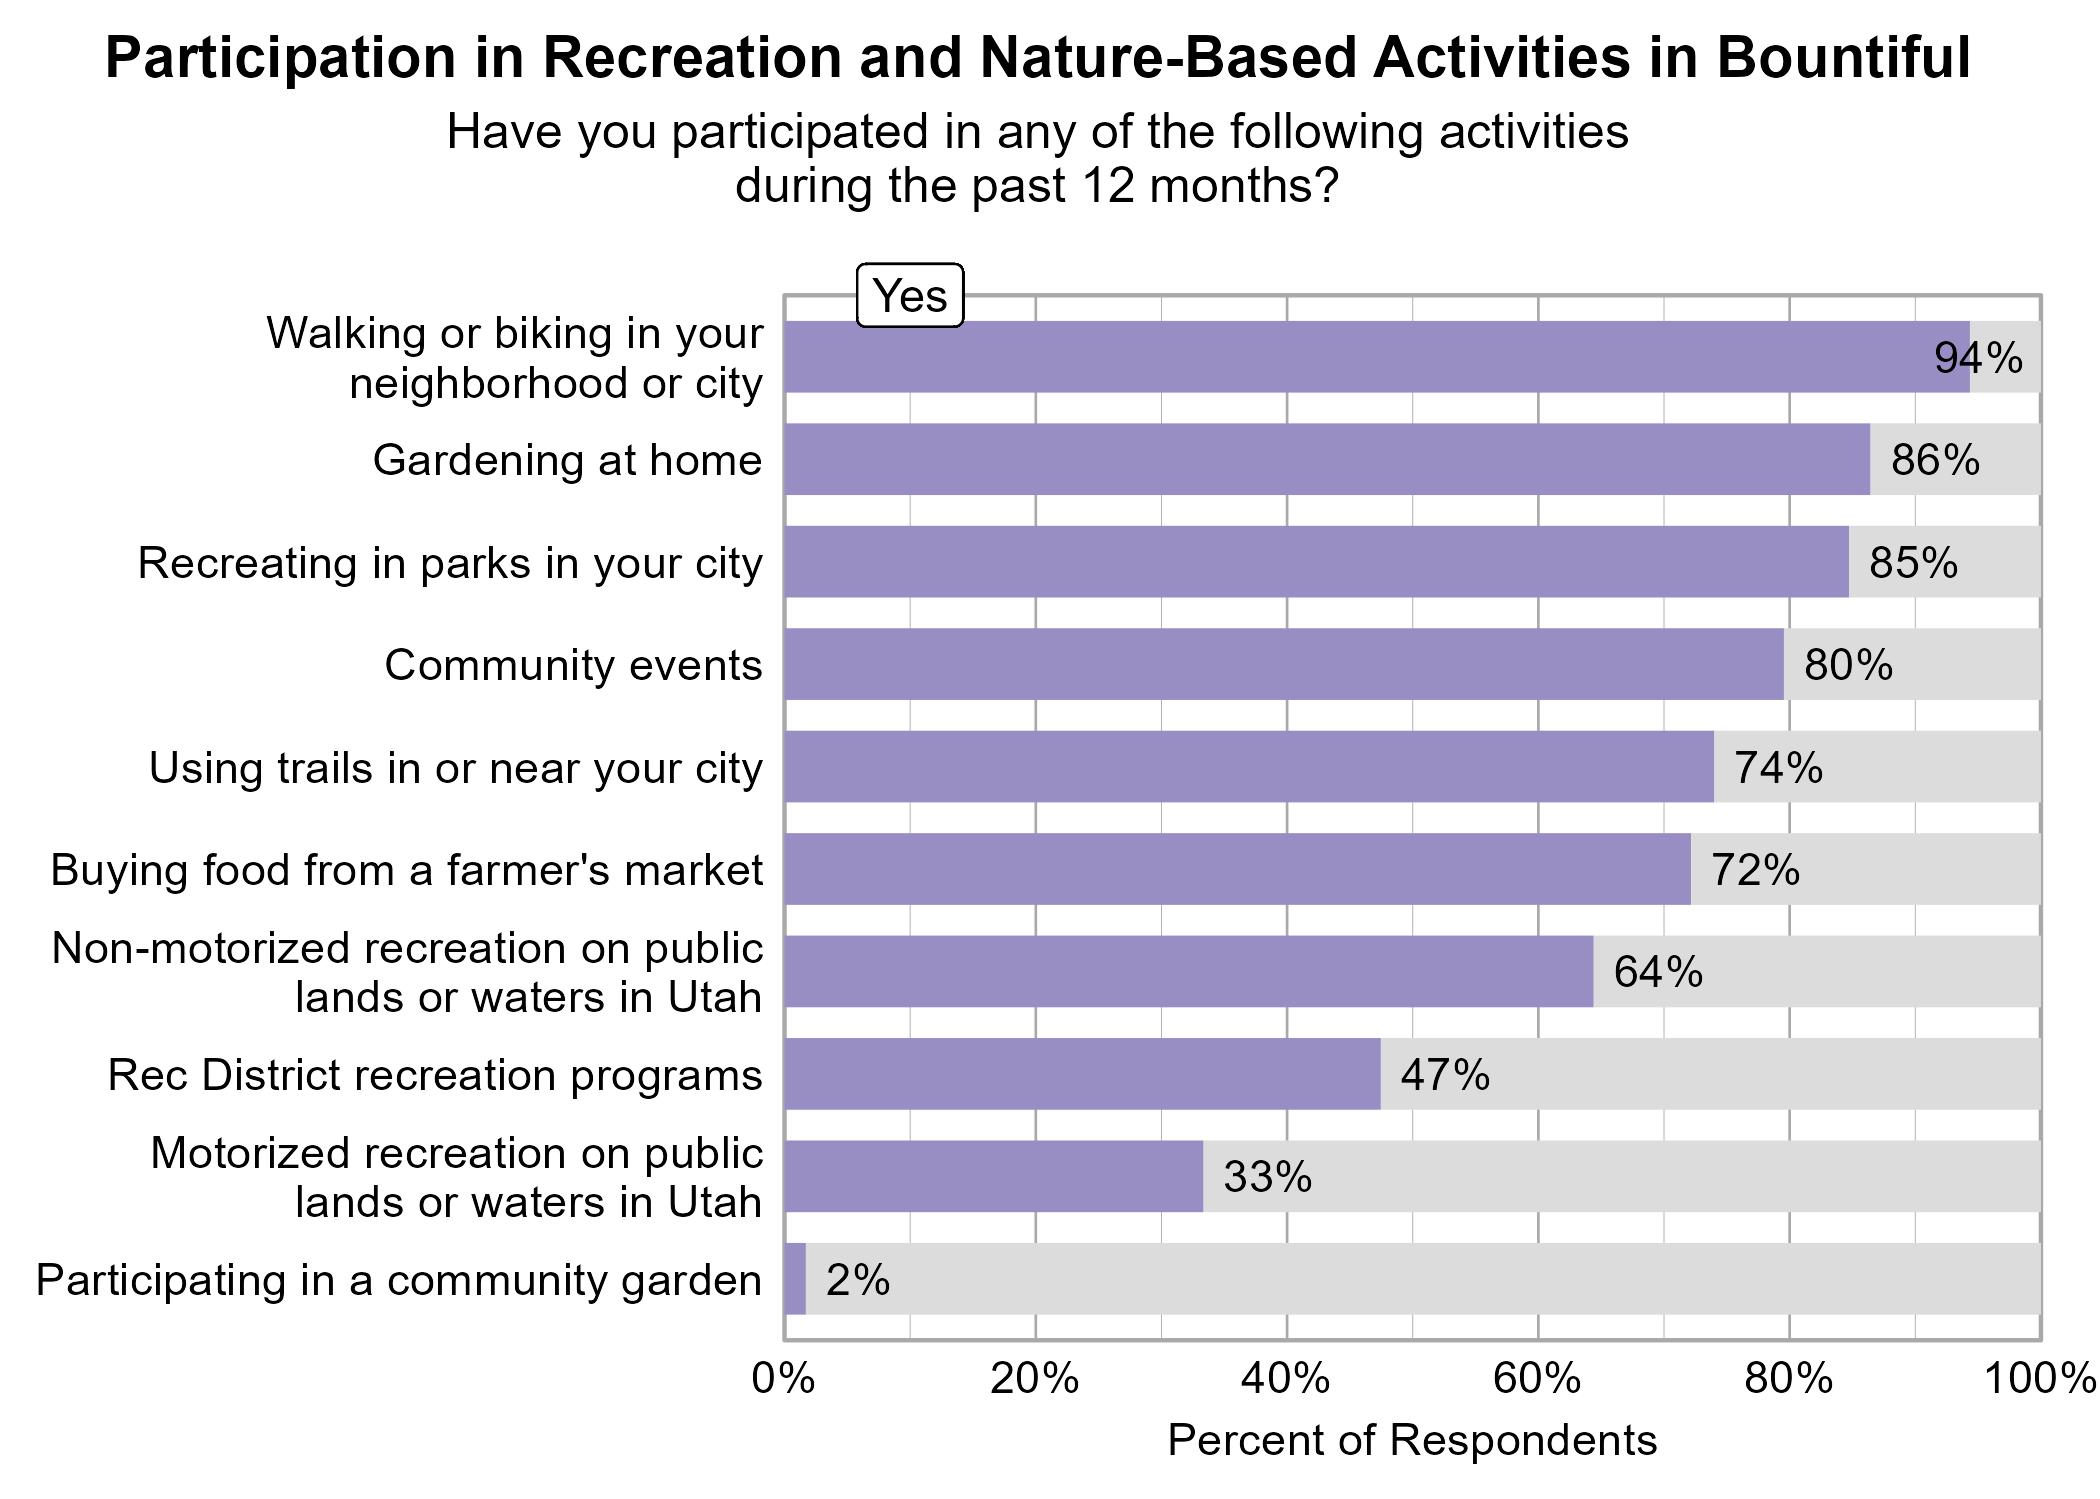
Respondents were asked to indicate whether or not they participated in various activities in the last 12 months. The most popular activities were walking or biking in your neighborhood or city (94%), gardening at home (86%), and recreating in parks in your city (85%).
Non-motorized recreation on public lands or waters in Utah was significantly related to higher ratings of personal wellbeing.
Buying food from a farmer's market, participating in community events, and non-motorized recreation on public lands or waters in Utah were significantly related to higher ratings of community wellbeing and community connection.
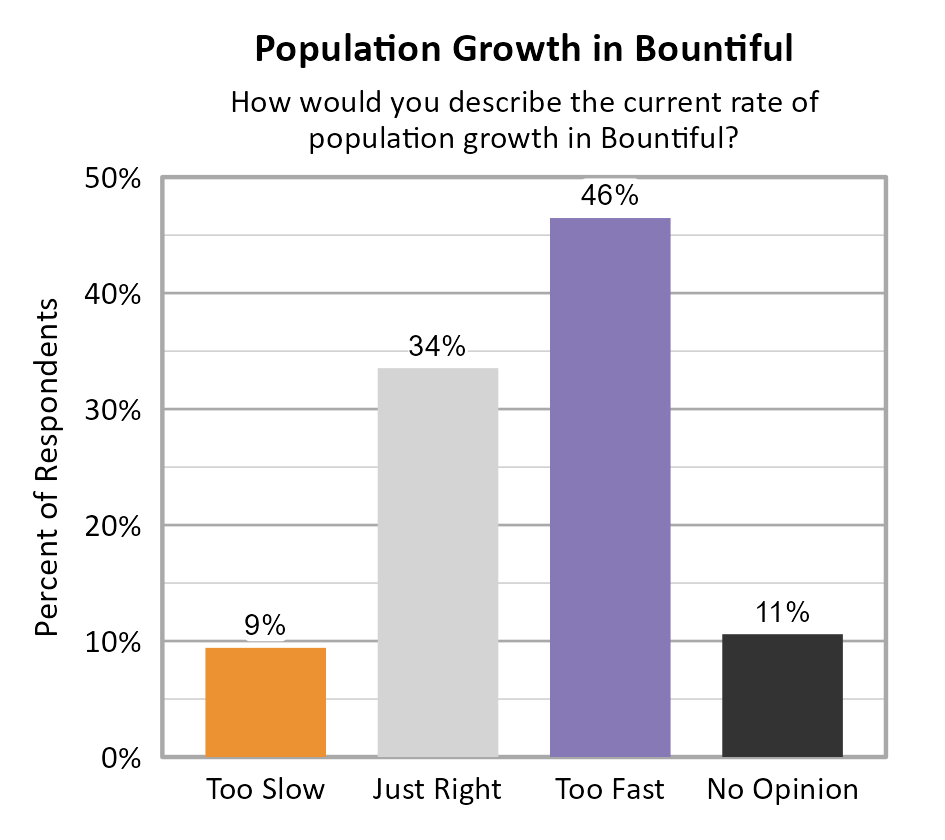
Perspectives on Population Growth and Economic Development
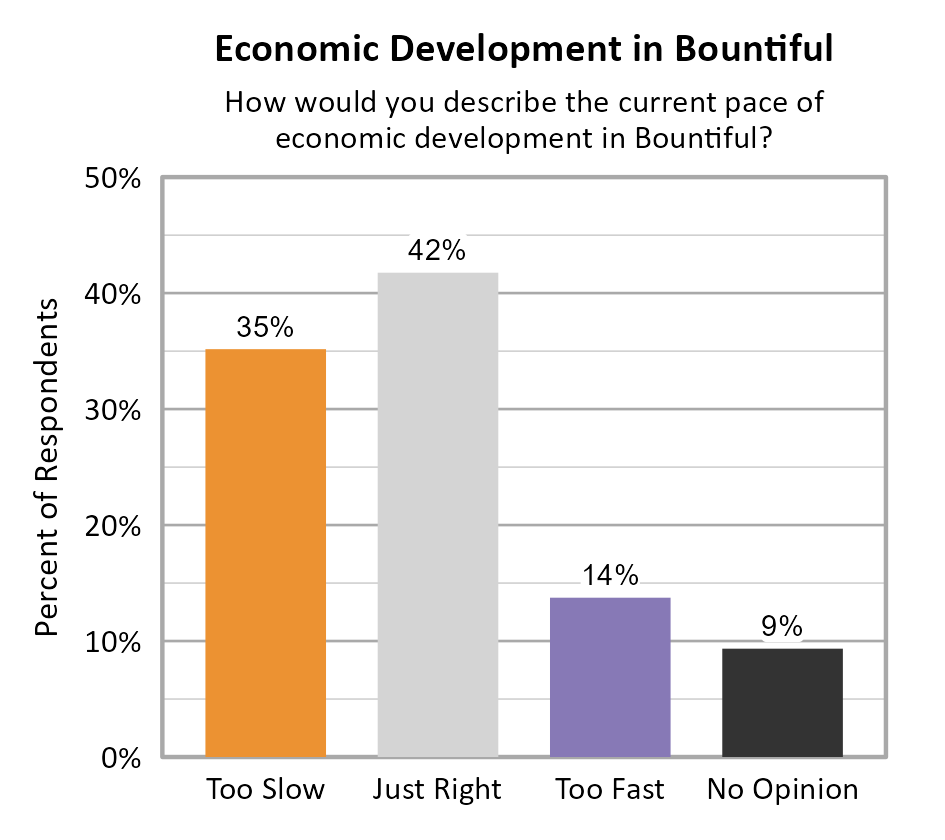
The largest proportion of respondents in Bountiful indicated that they felt the population growth was too fast (46%). For the pace of economic development, respondents were split between opinions that it was just right (42%) and too slow (35%).
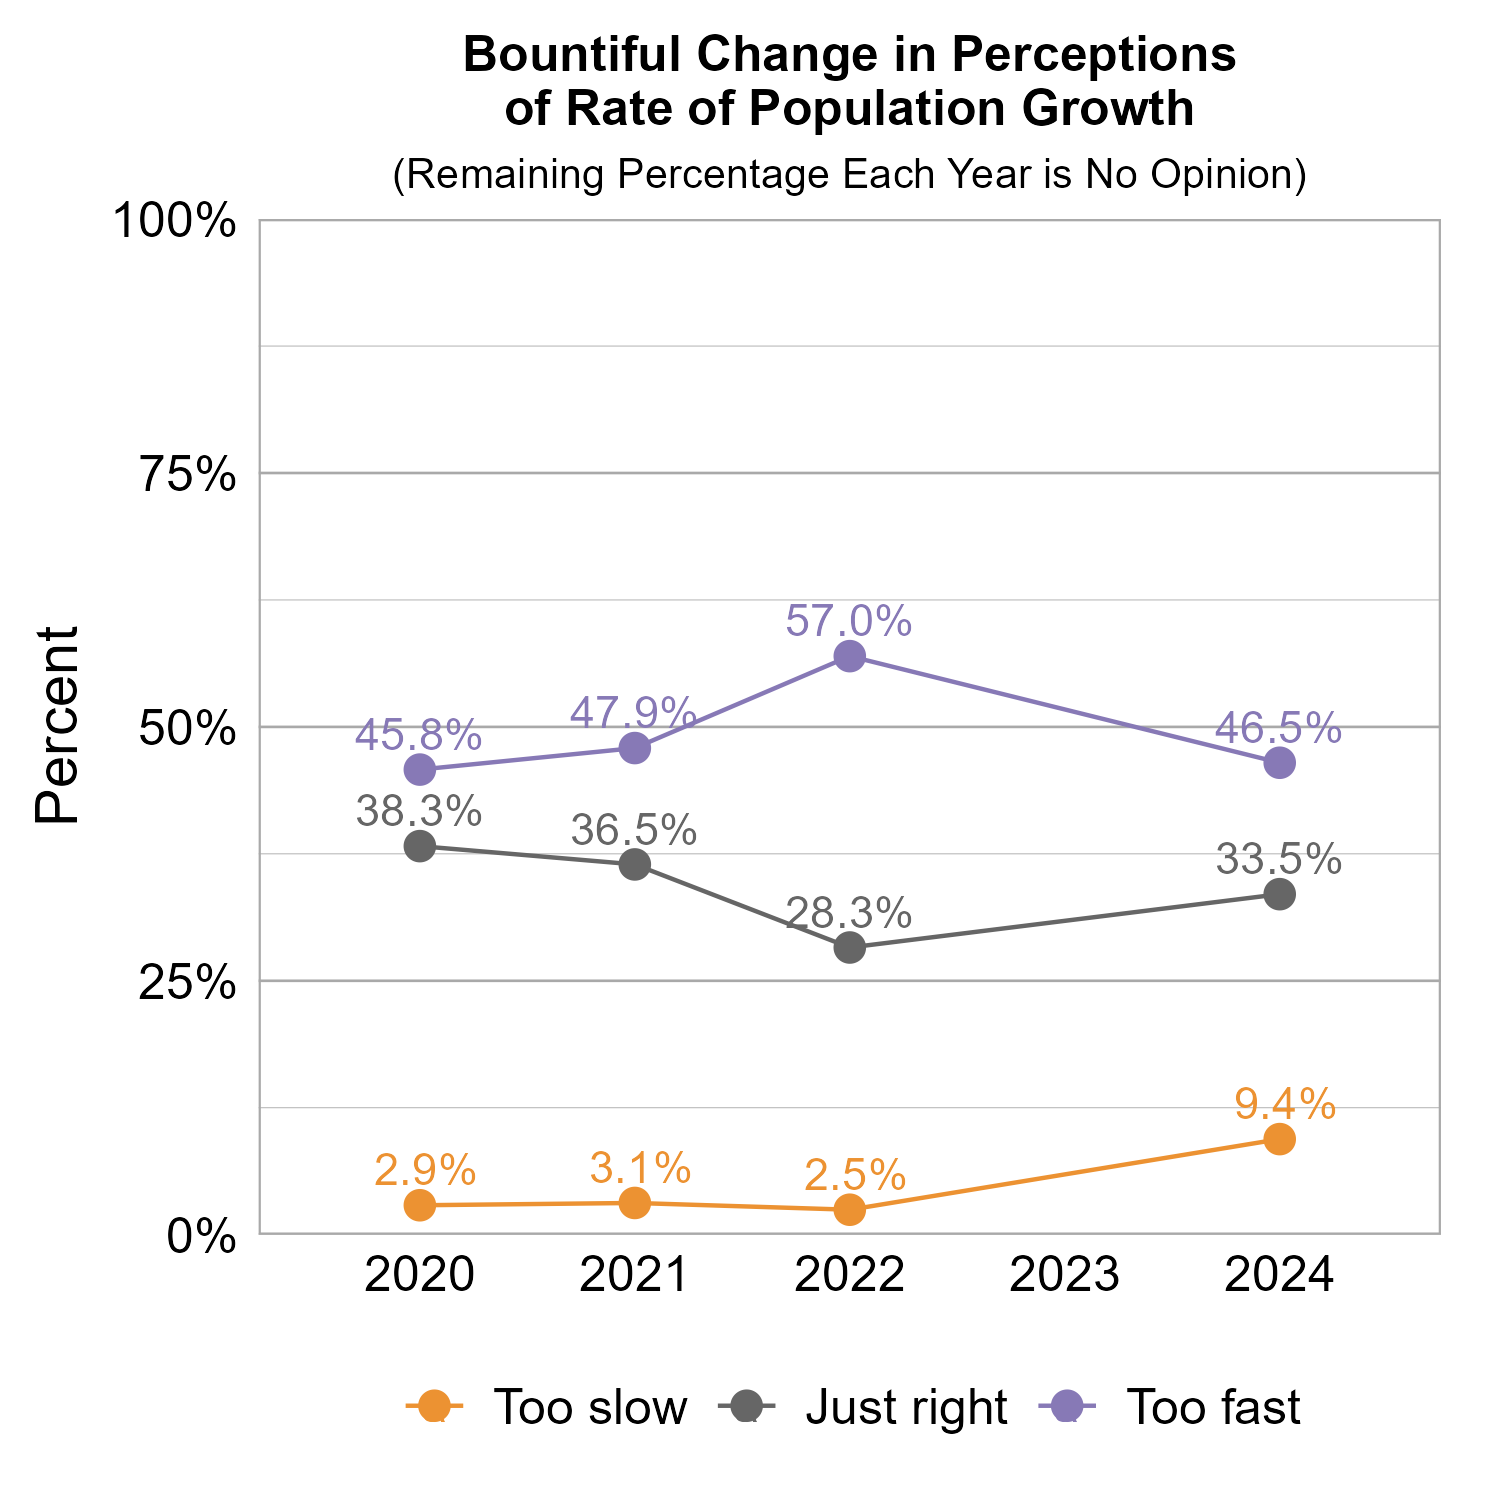
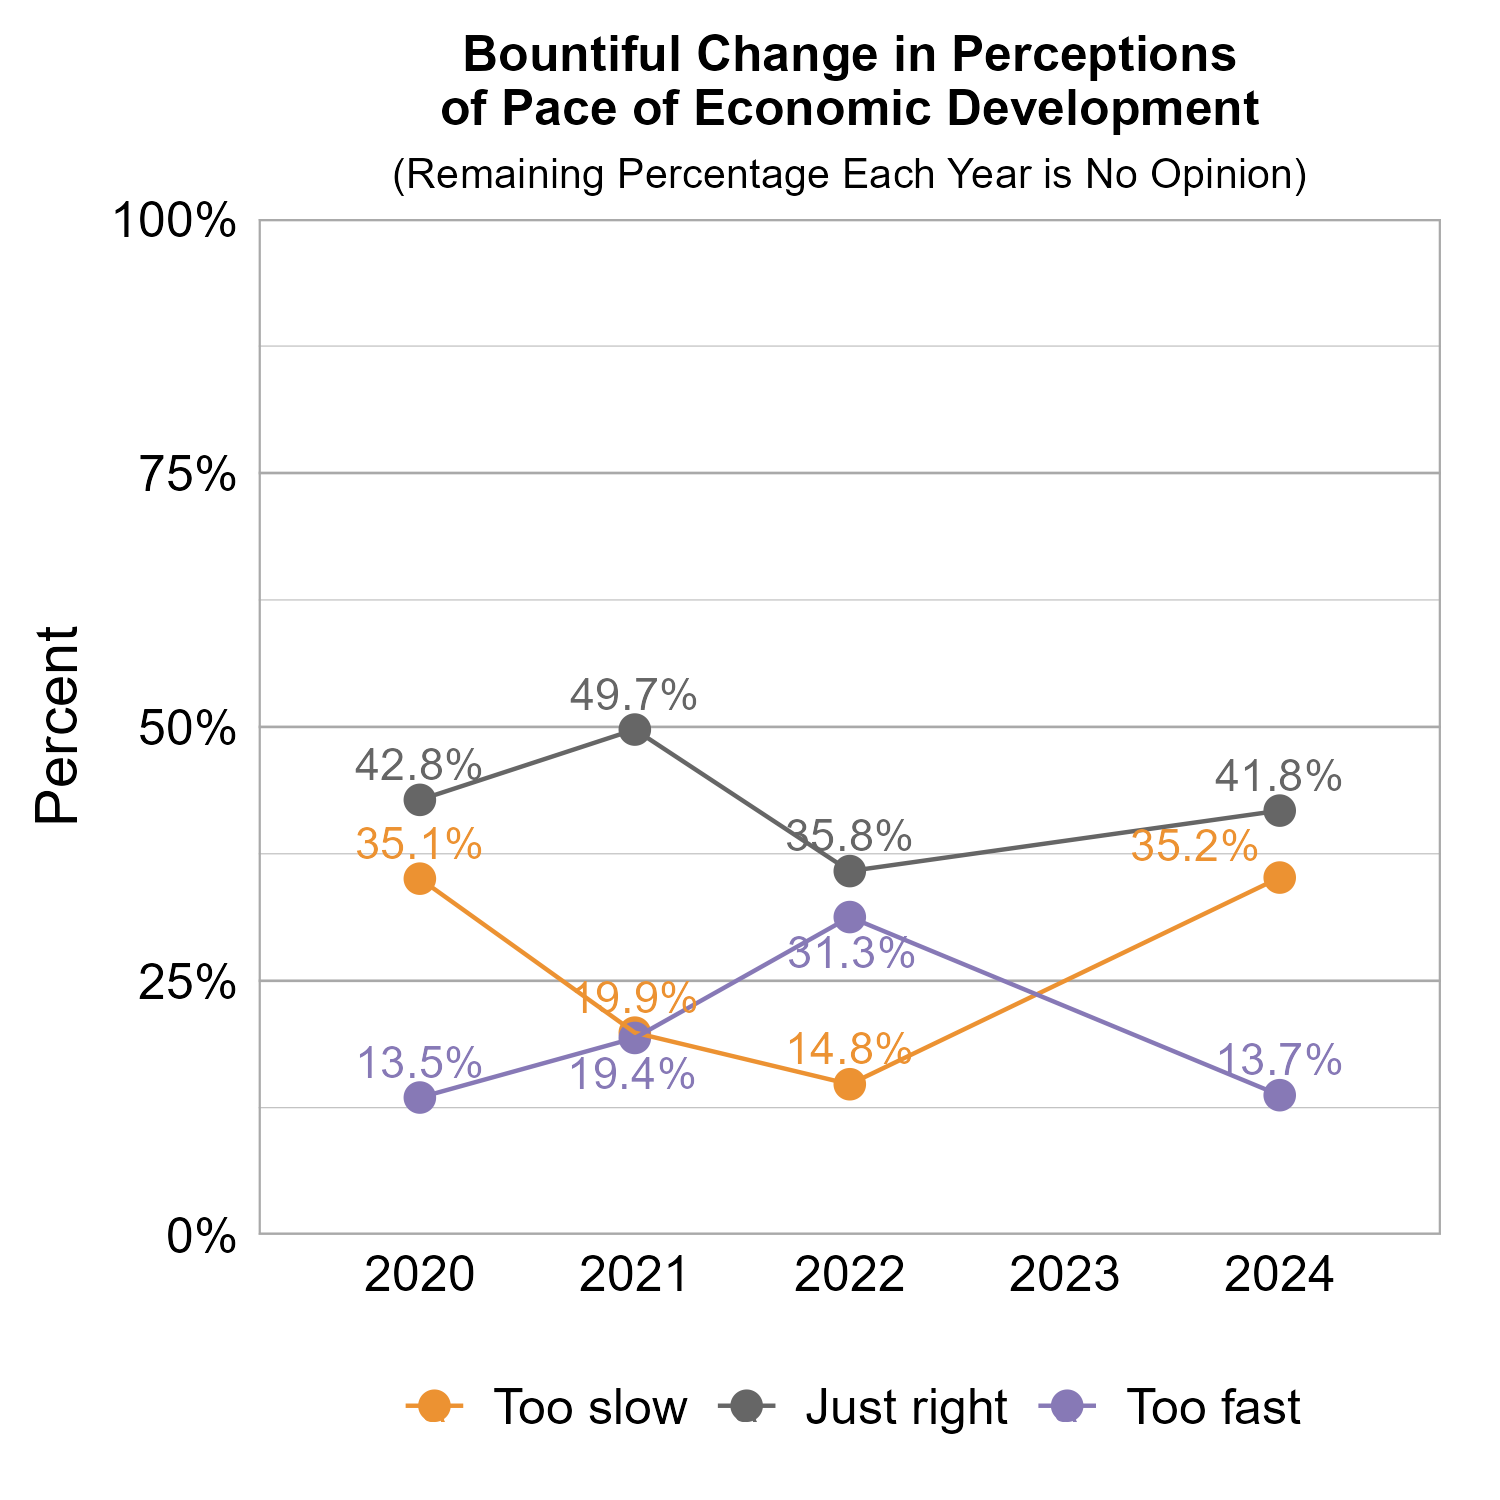
The graphs below show how perceptions of population growth and economic development in Bountiful have varied across recent years of Wellbeing Surveys. Perception that population growth is too fast and the pace of economic growth is just right has been the most popular in all the survey years. Perception that both population growth and economic development was too fast saw an uptick in 2022, but came back down in 2024.
The graphs below show perceptions of population growth and economic development for Bountiful compared to other participating cities and towns in the Established/Mid-sized Cities cluster.

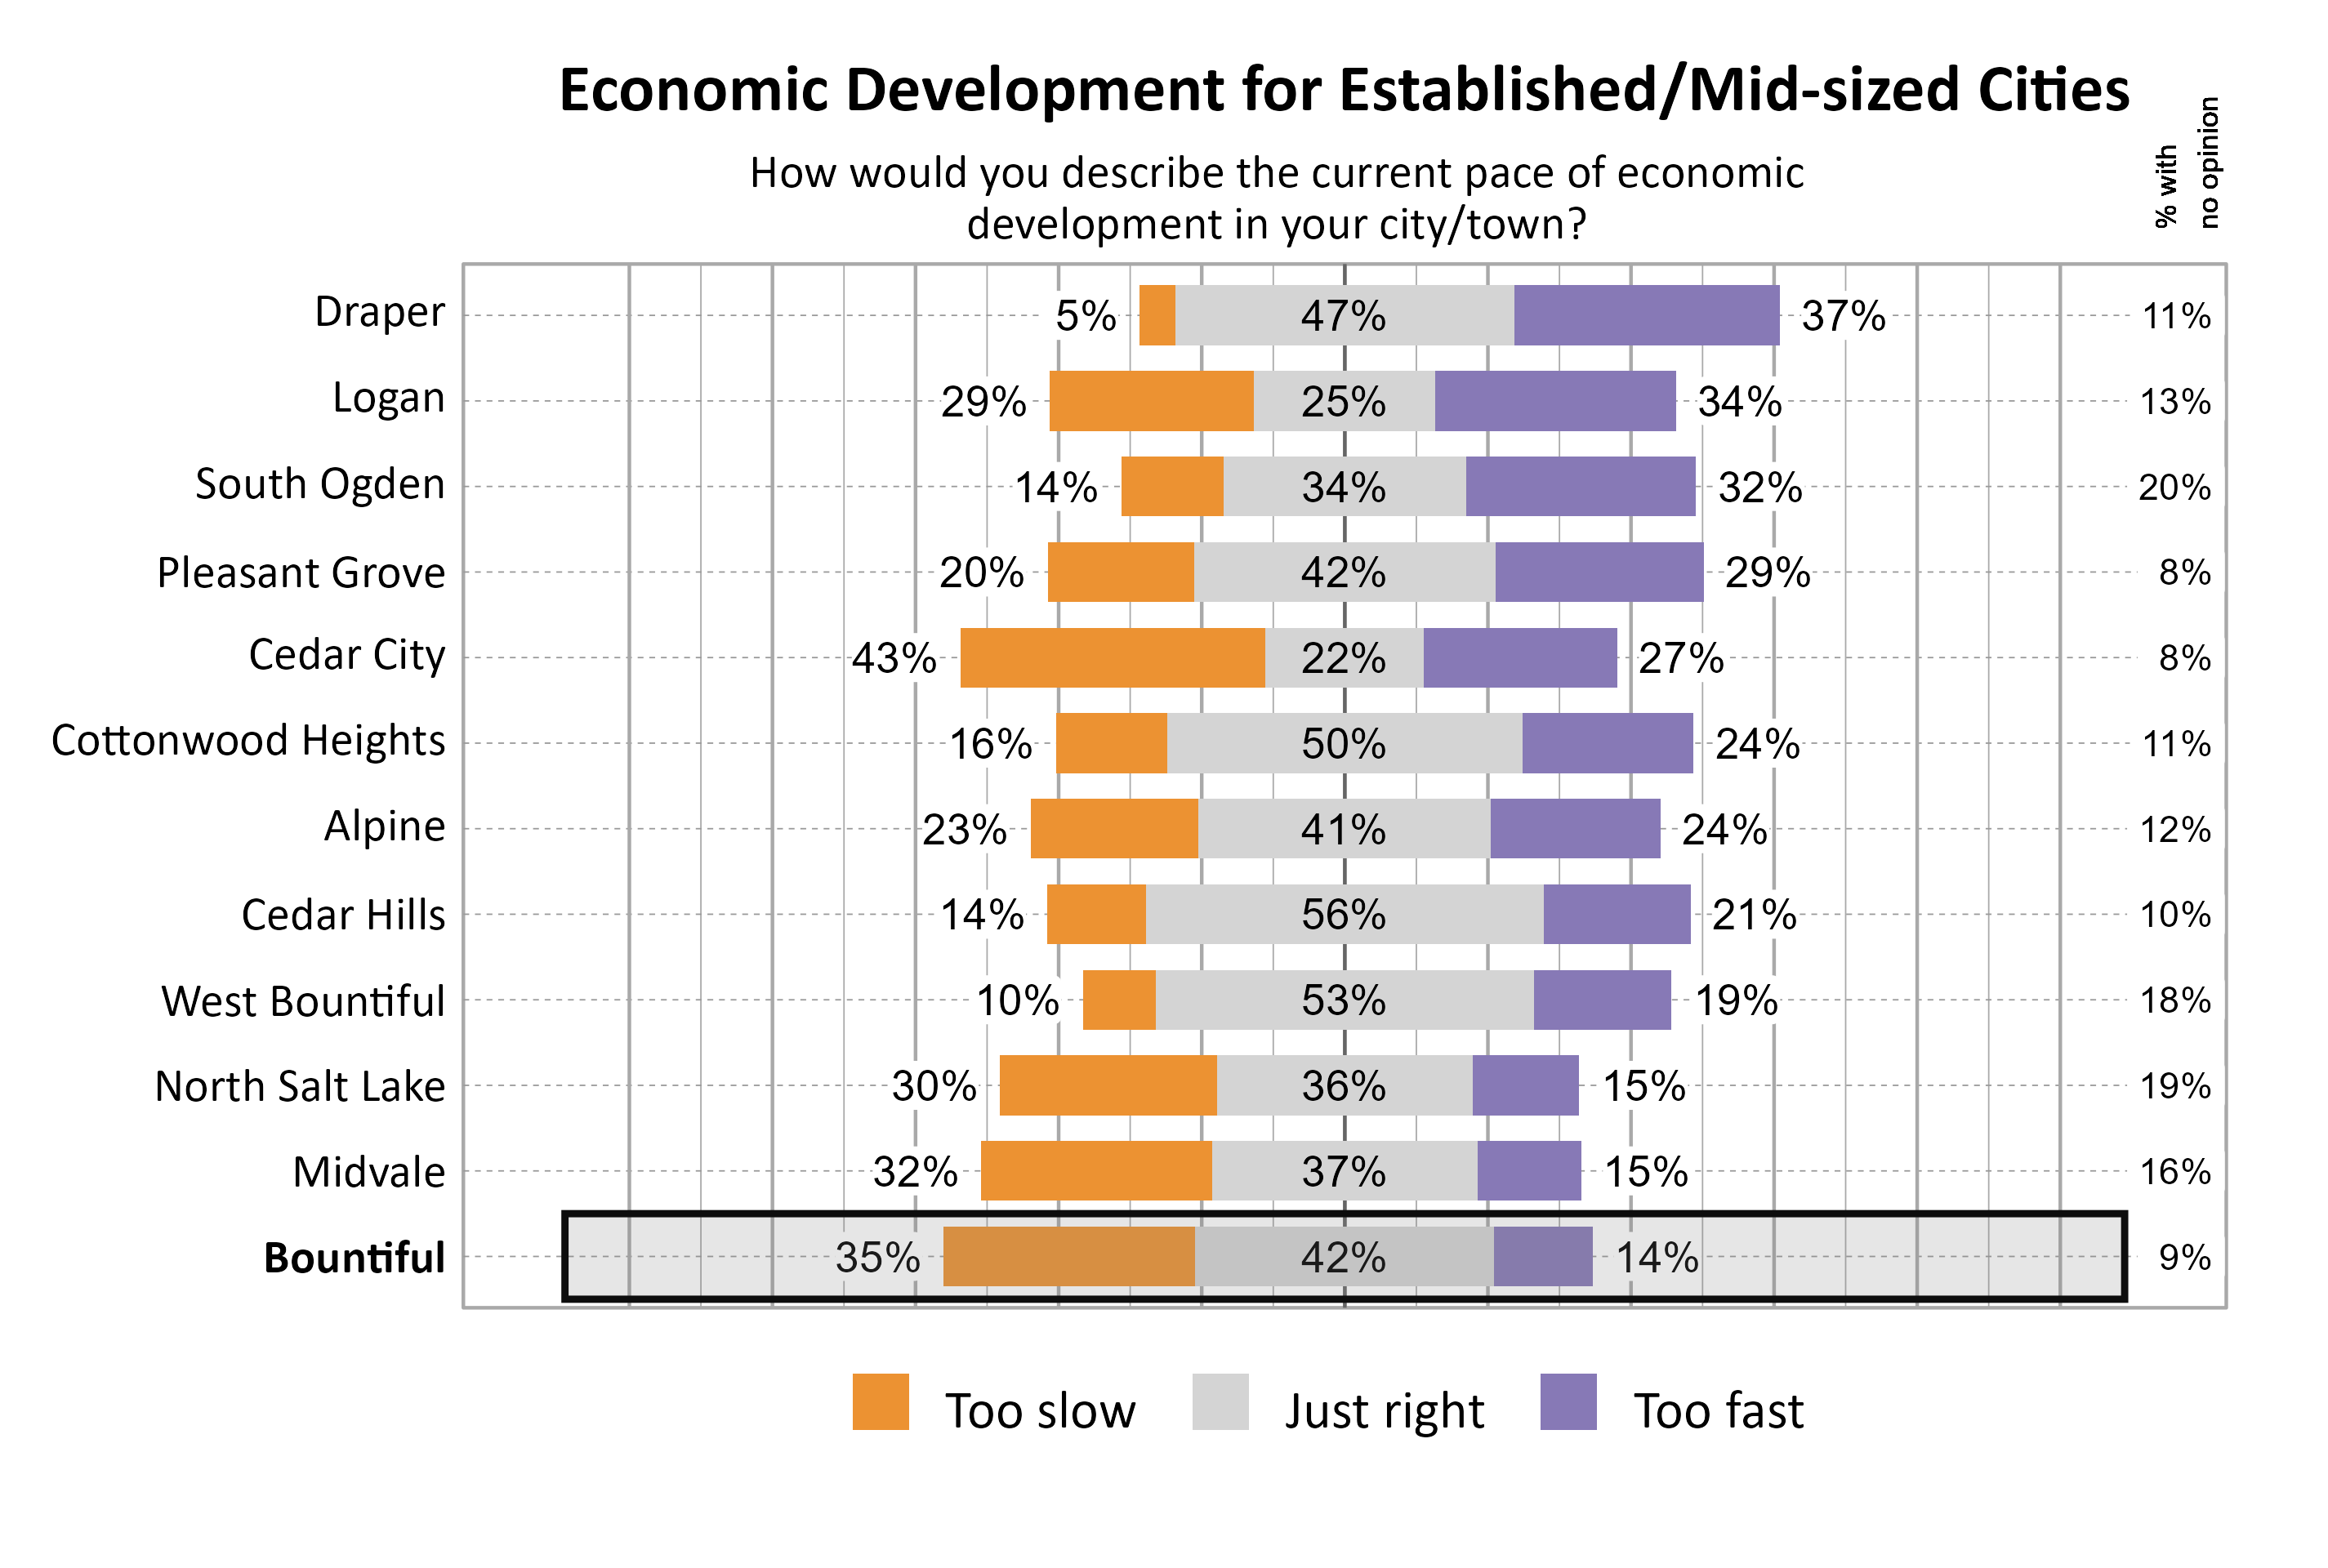
The graph below illustrates how many respondents perceived the pace of economic development as too slow, just right, too fast, or had no opinion, with additional breakdowns for the number of respondents who provided comments.
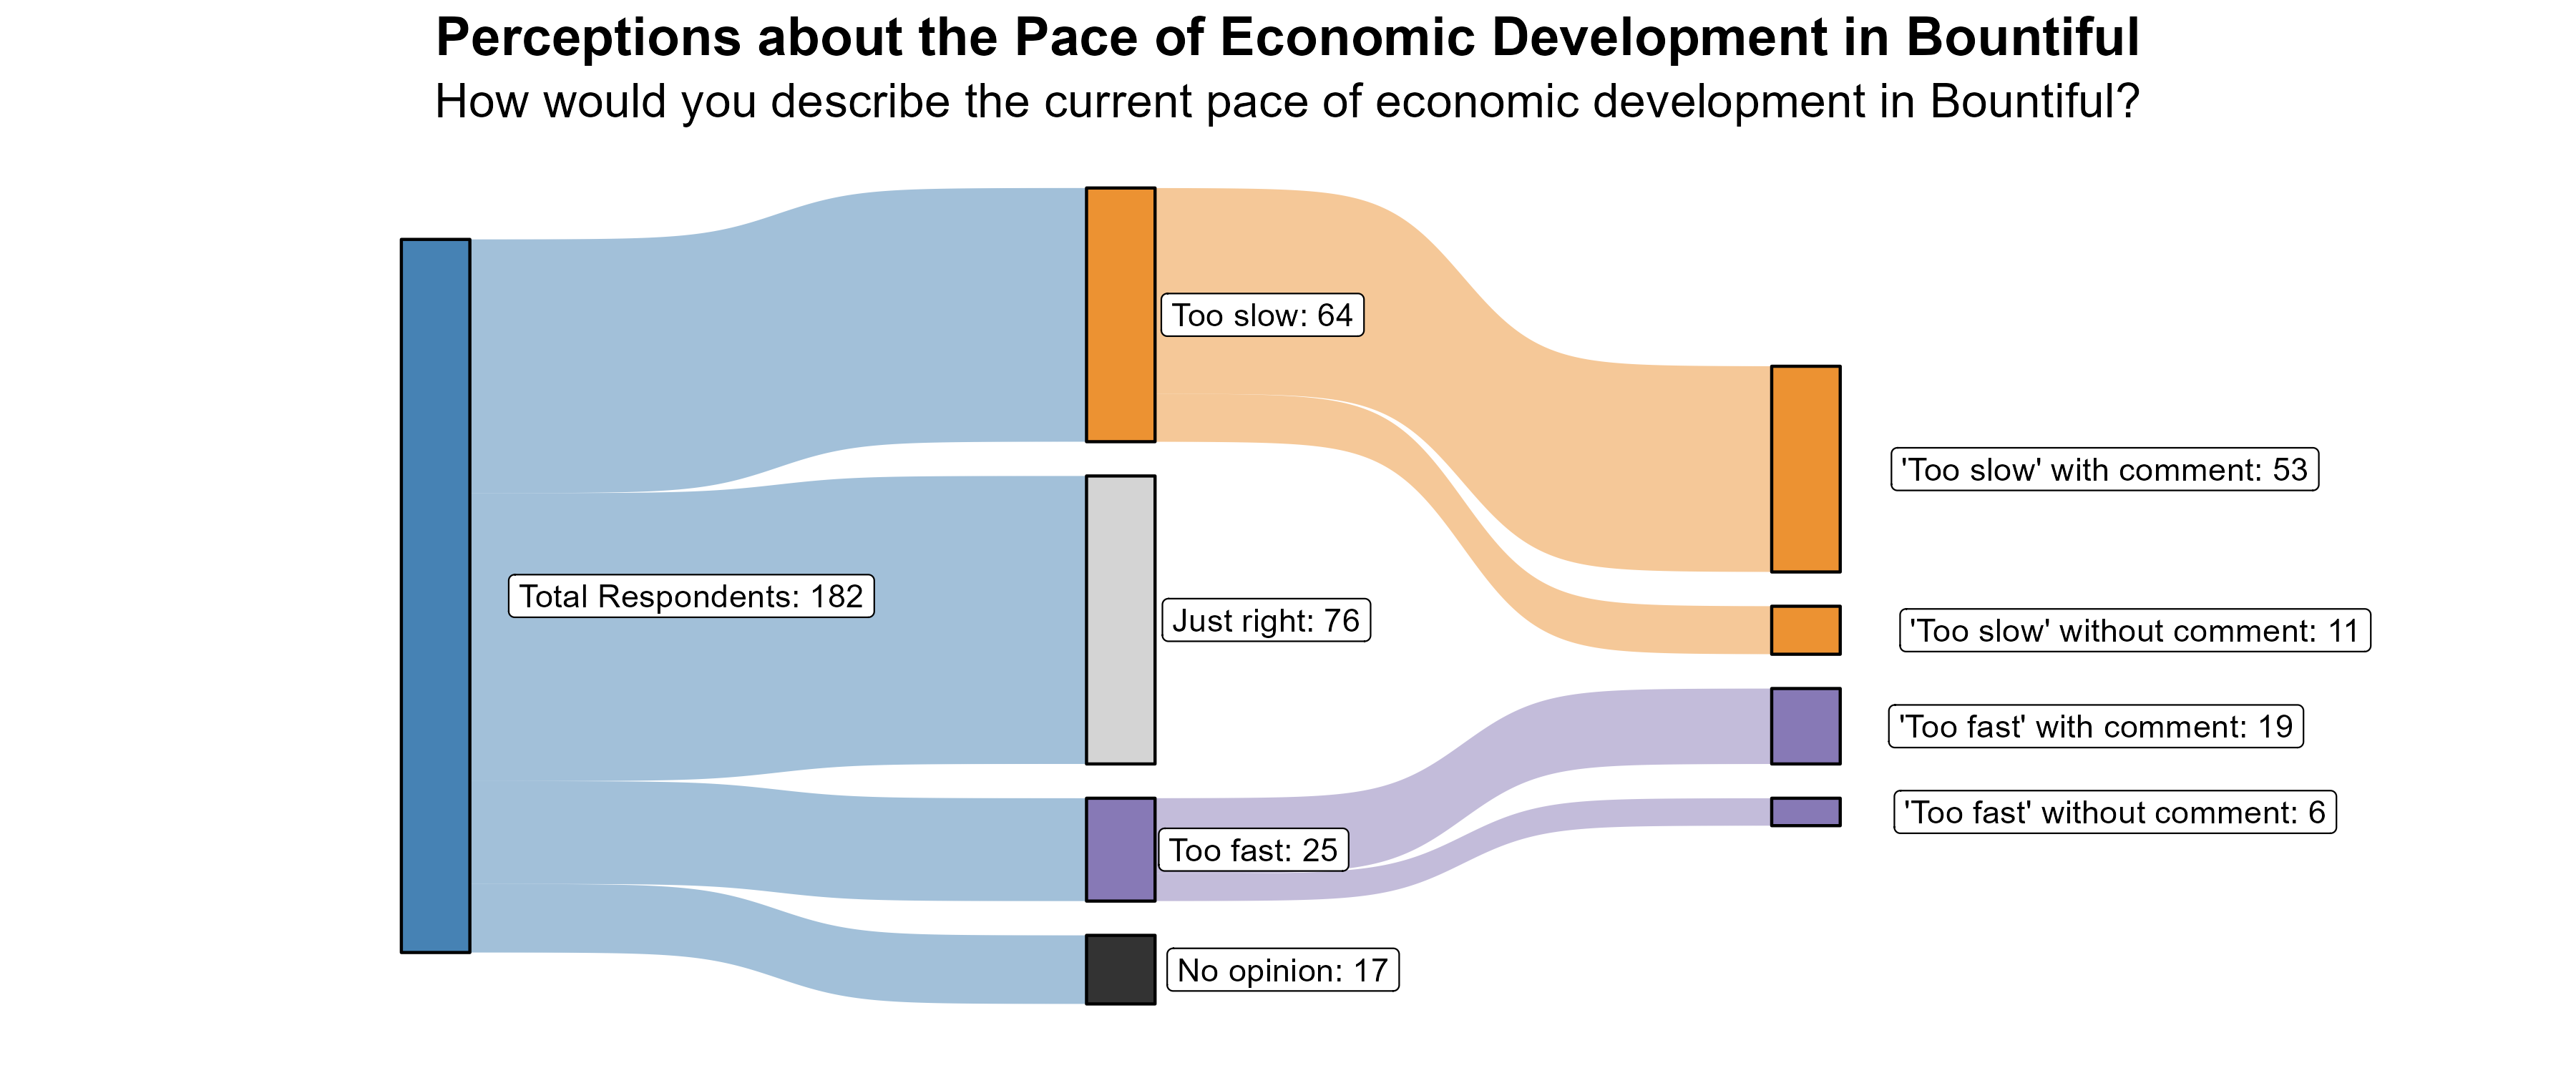
The 35% of respondents who rated the pace of economic growth as “too slow” were further asked what aspects of the local economy they would like to see more of in Bountiful. Comments emphasized the need for more retail and business options, particularly local business. Many called for more housing options and greater attention to planning and governance as well as employment opportunities. Quite a few comments mentioned the need for better maintenance and upkeep of existing buildings.
Additionally, the 14% of respondents who rated the pace of economic growth as “too fast” were further asked what aspects of the local economy they feel are growing too quickly in Bountiful. Comments often mentioned concern about the pace of housing development, particularly high-density housing. Some mentioned concern about availability of water and the loss of green space and open space. There were a number of comments relating to the change of town character.
Transportation in Bountiful
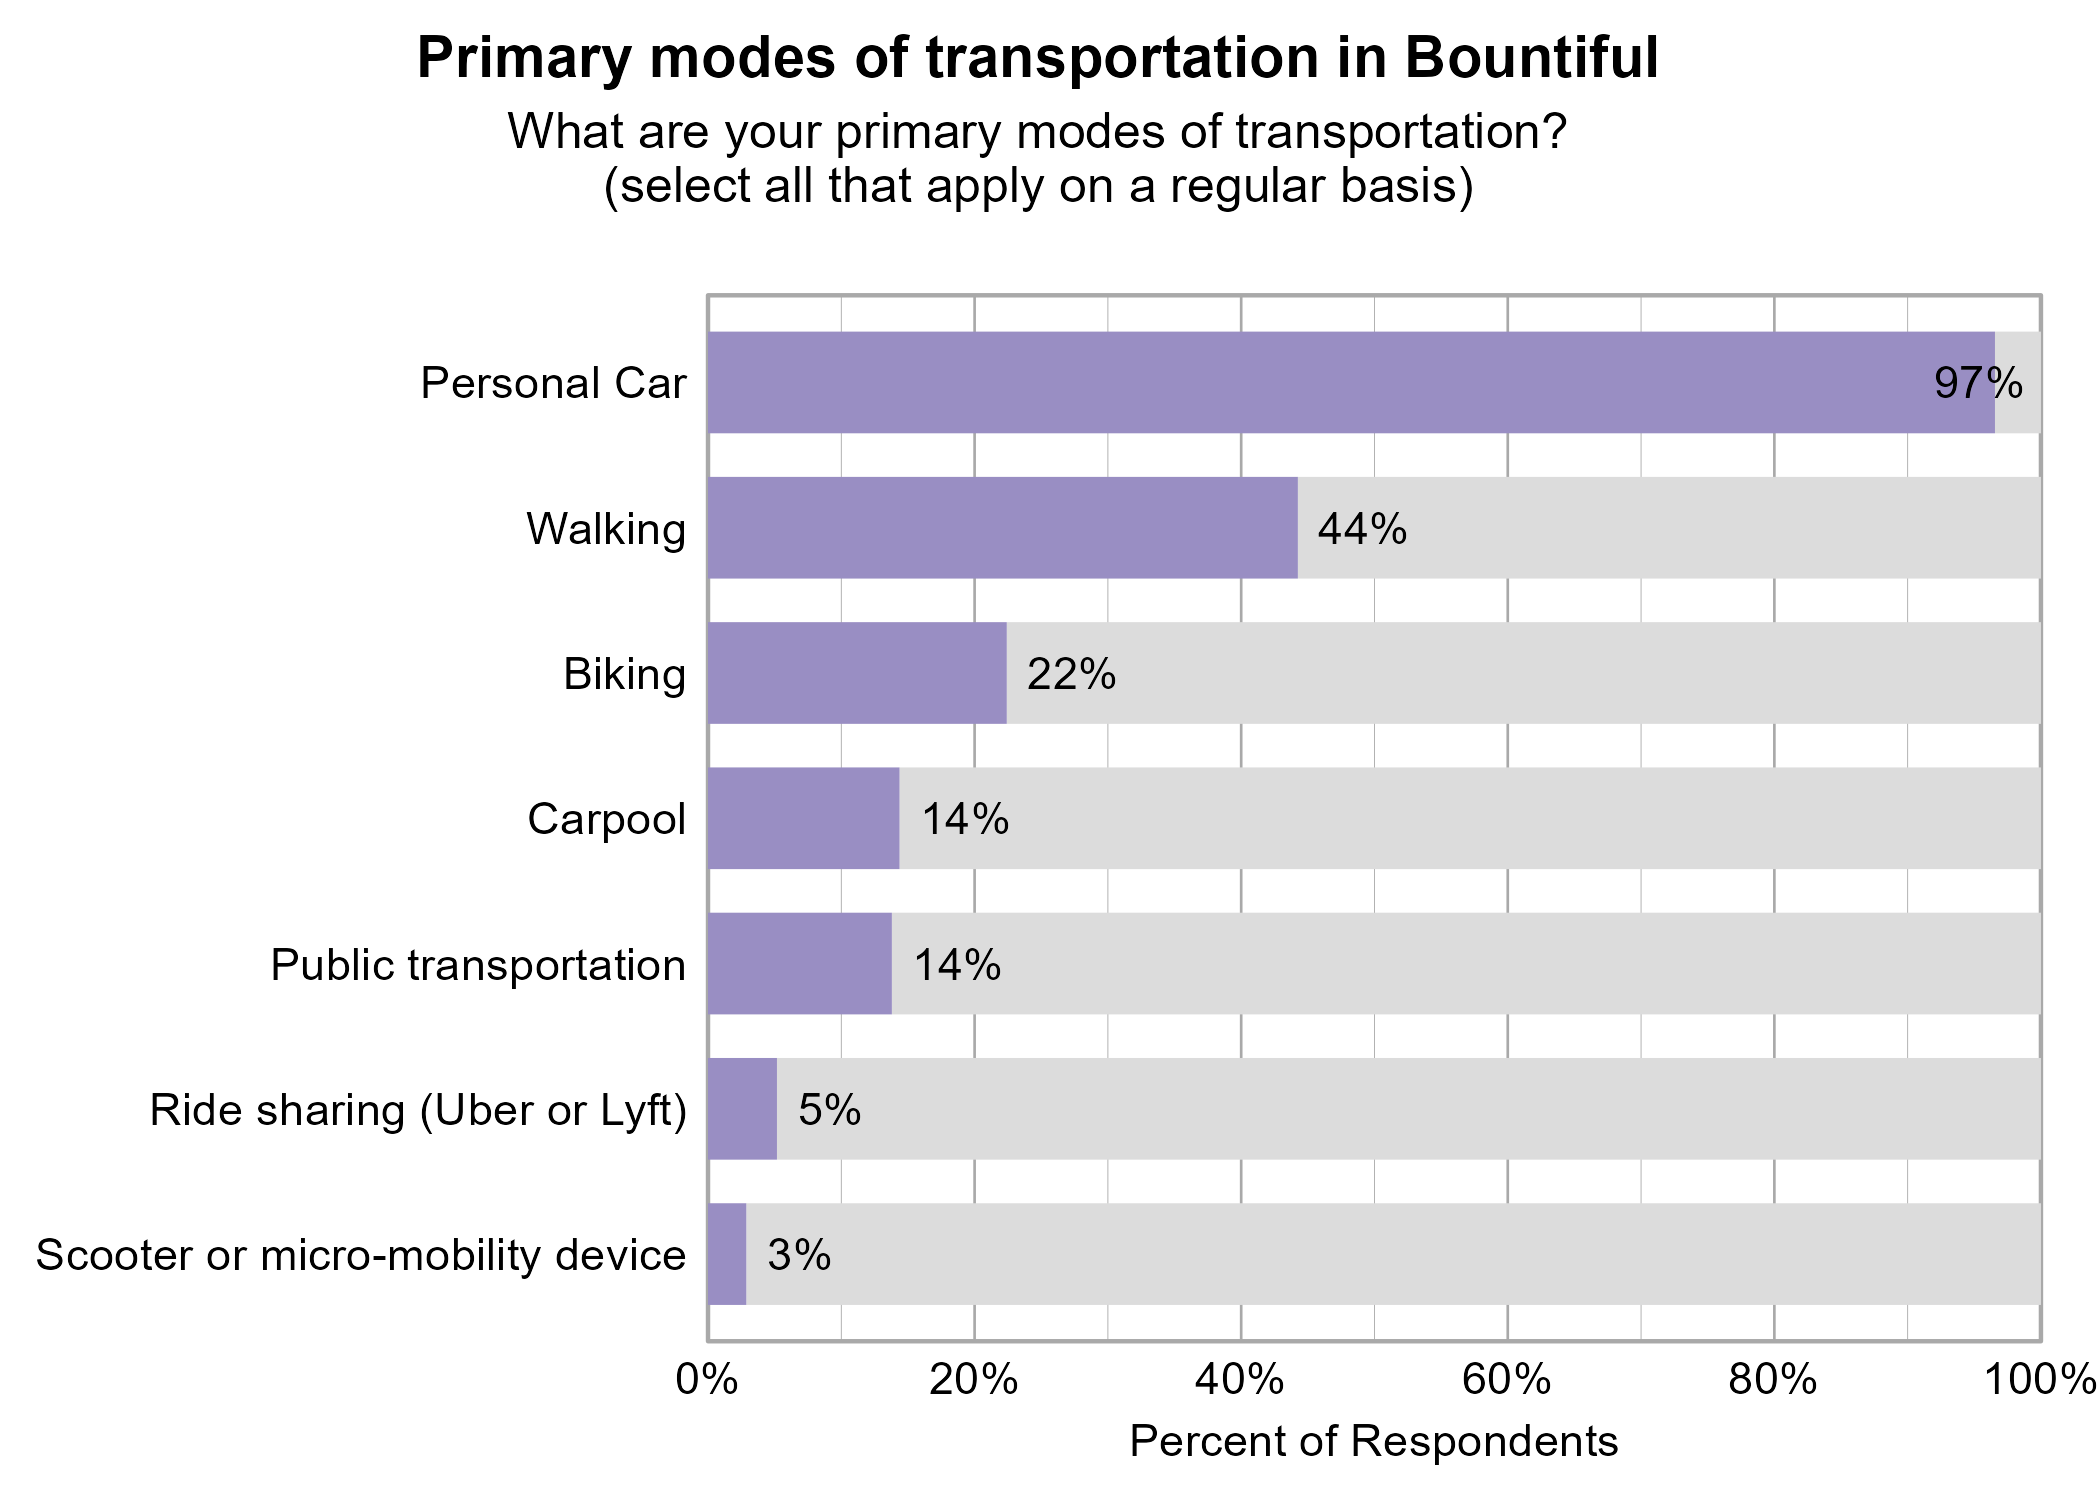
Respondents were asked to indicate all of their primary modes of transportation on a regular basis in Bountiful. The most popular modes of transportation were personal car (97%) and walking (44%).
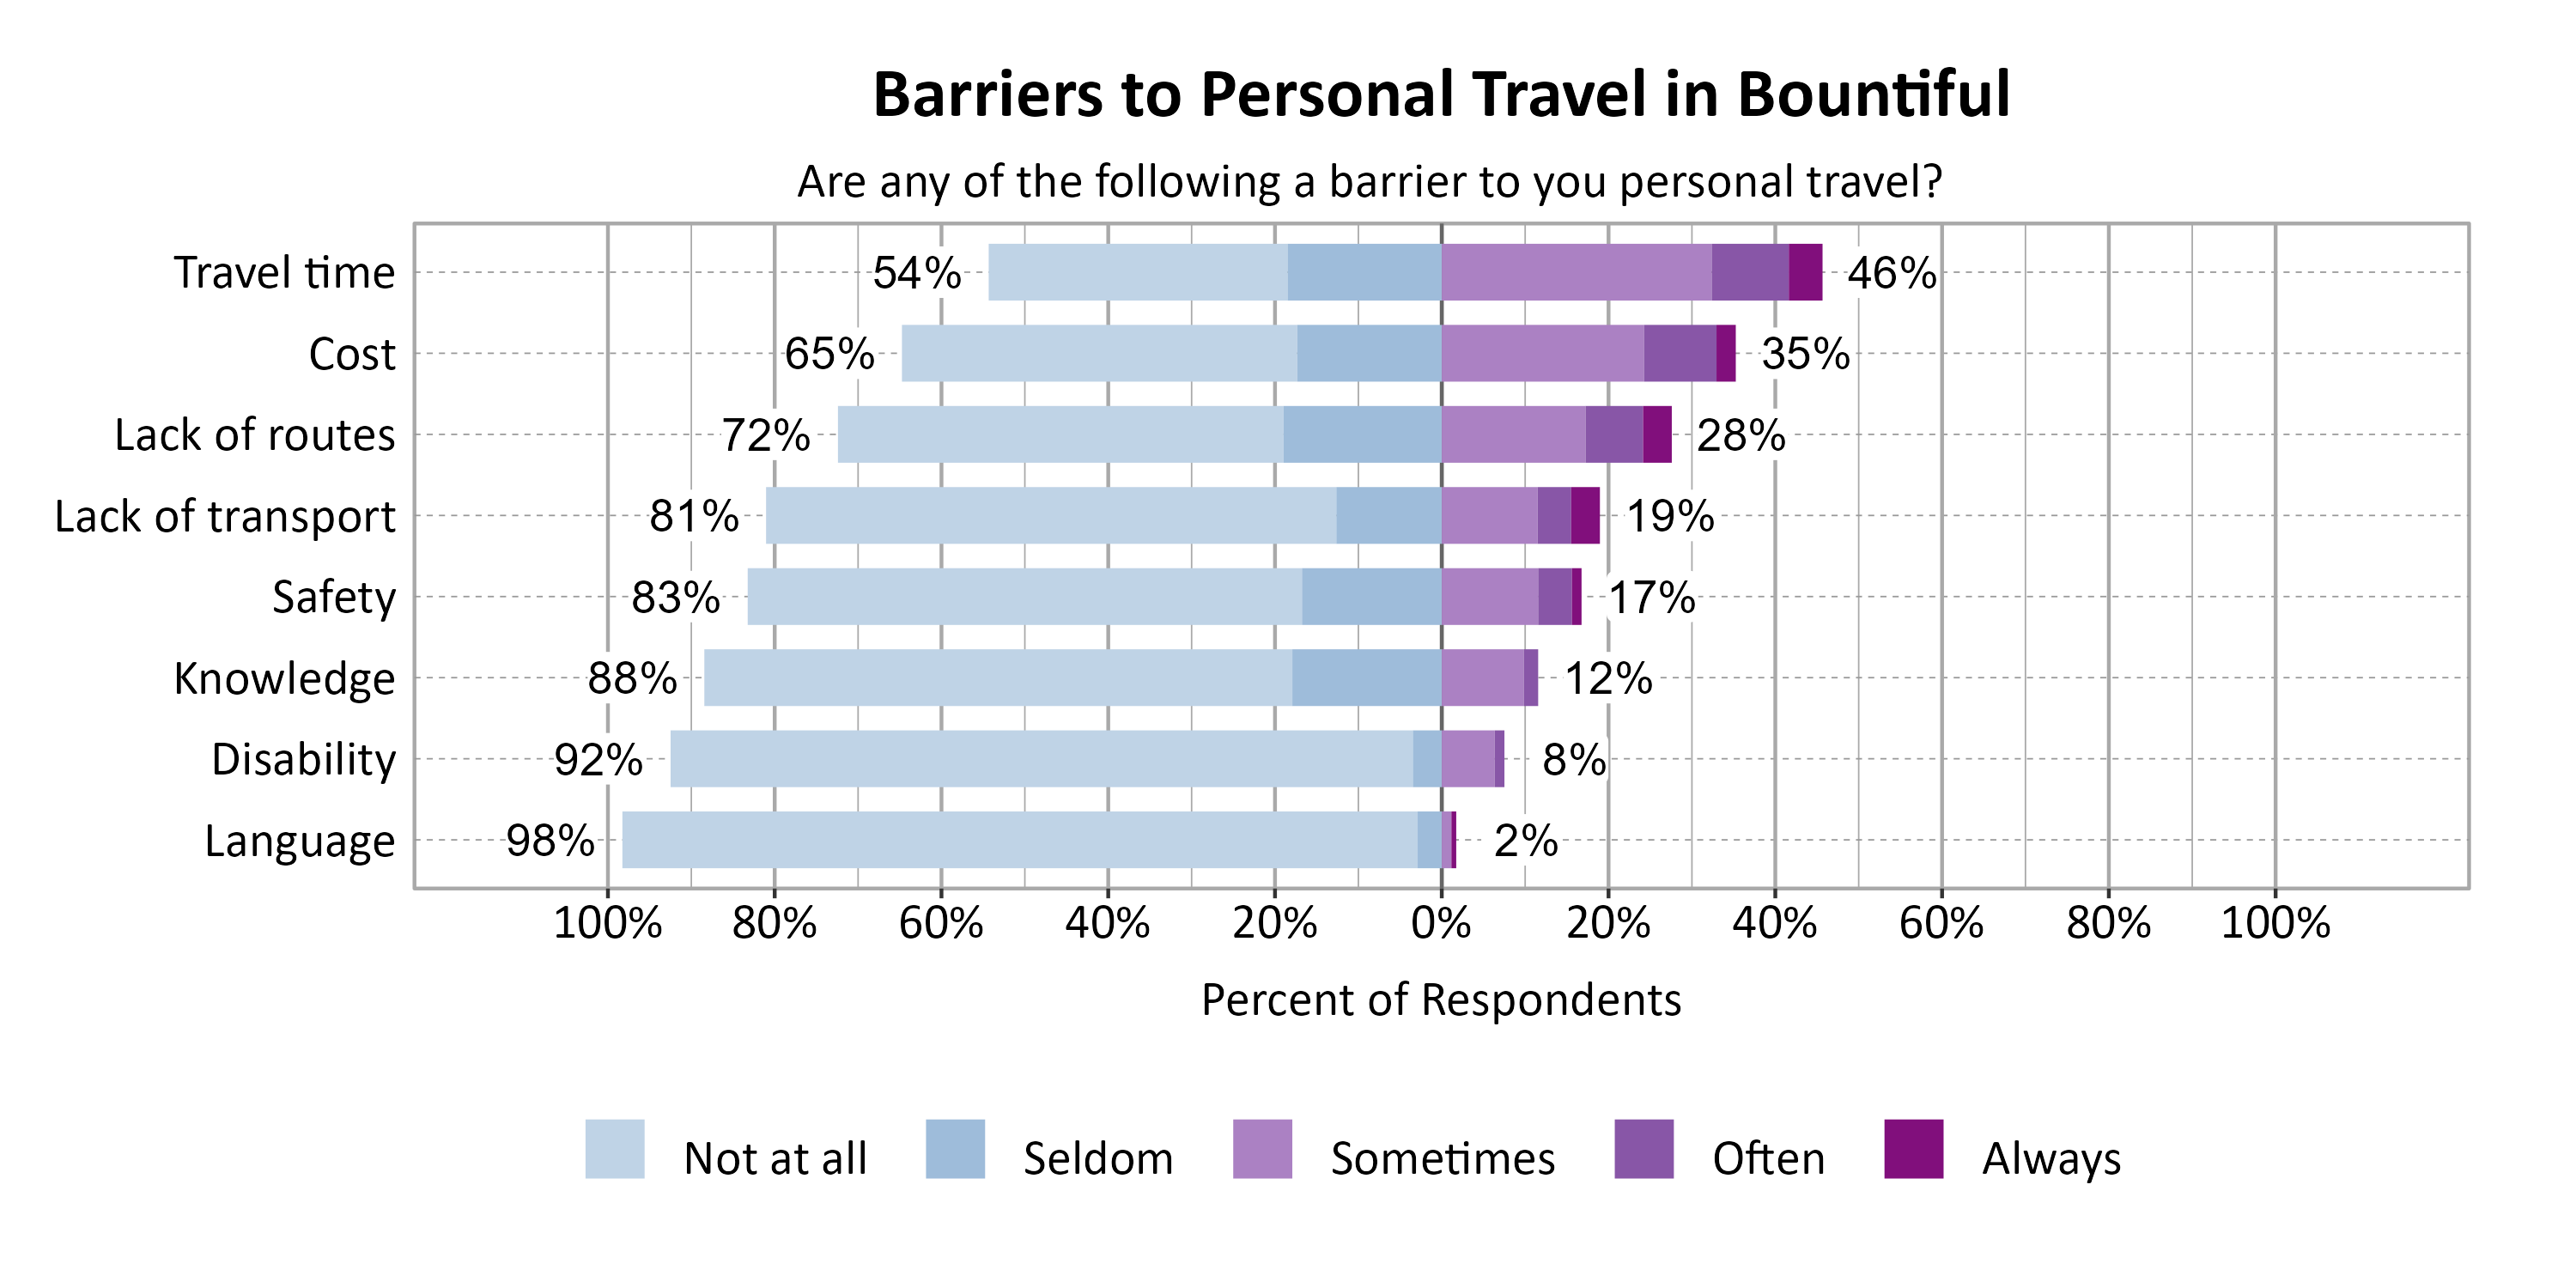
Respondents were asked to indicate the most common barriers to transportation in Bountiful. The most problematic barriers were Travel time (46%) and Cost (35%).
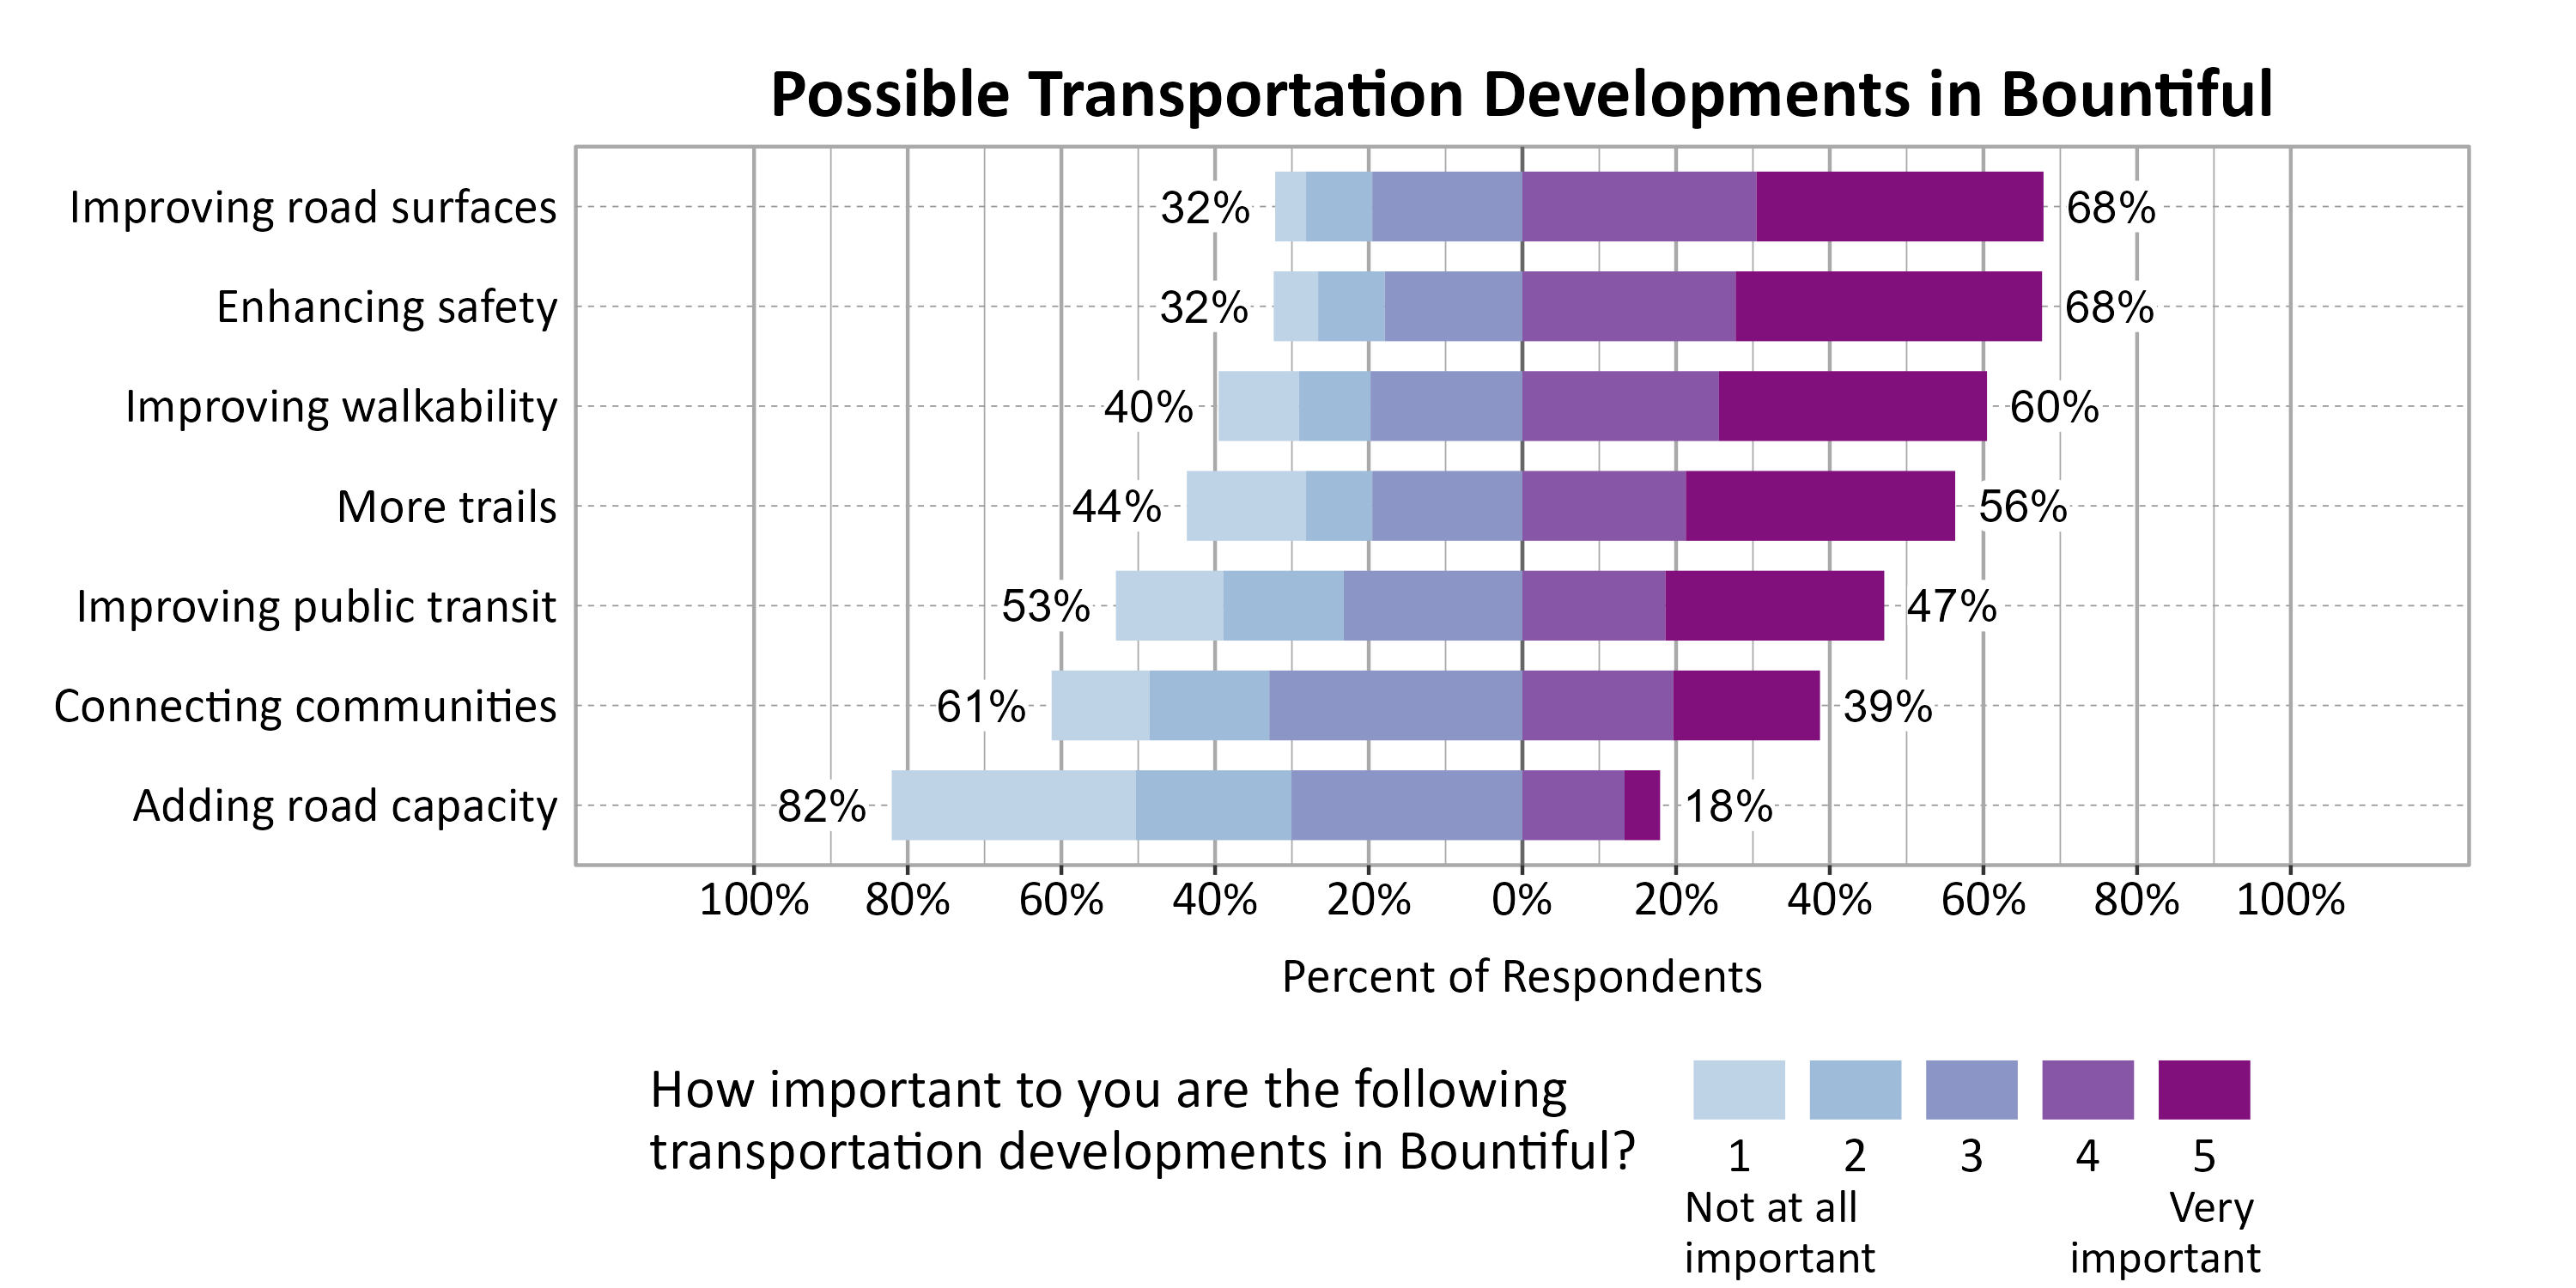
Respondents were asked to indicate the importance of a set of possible transportation developments in Bountiful. The most important development to respondents were Improving road surfaces (68%), Enhancing safety (68%), and Improving walkability (60%).
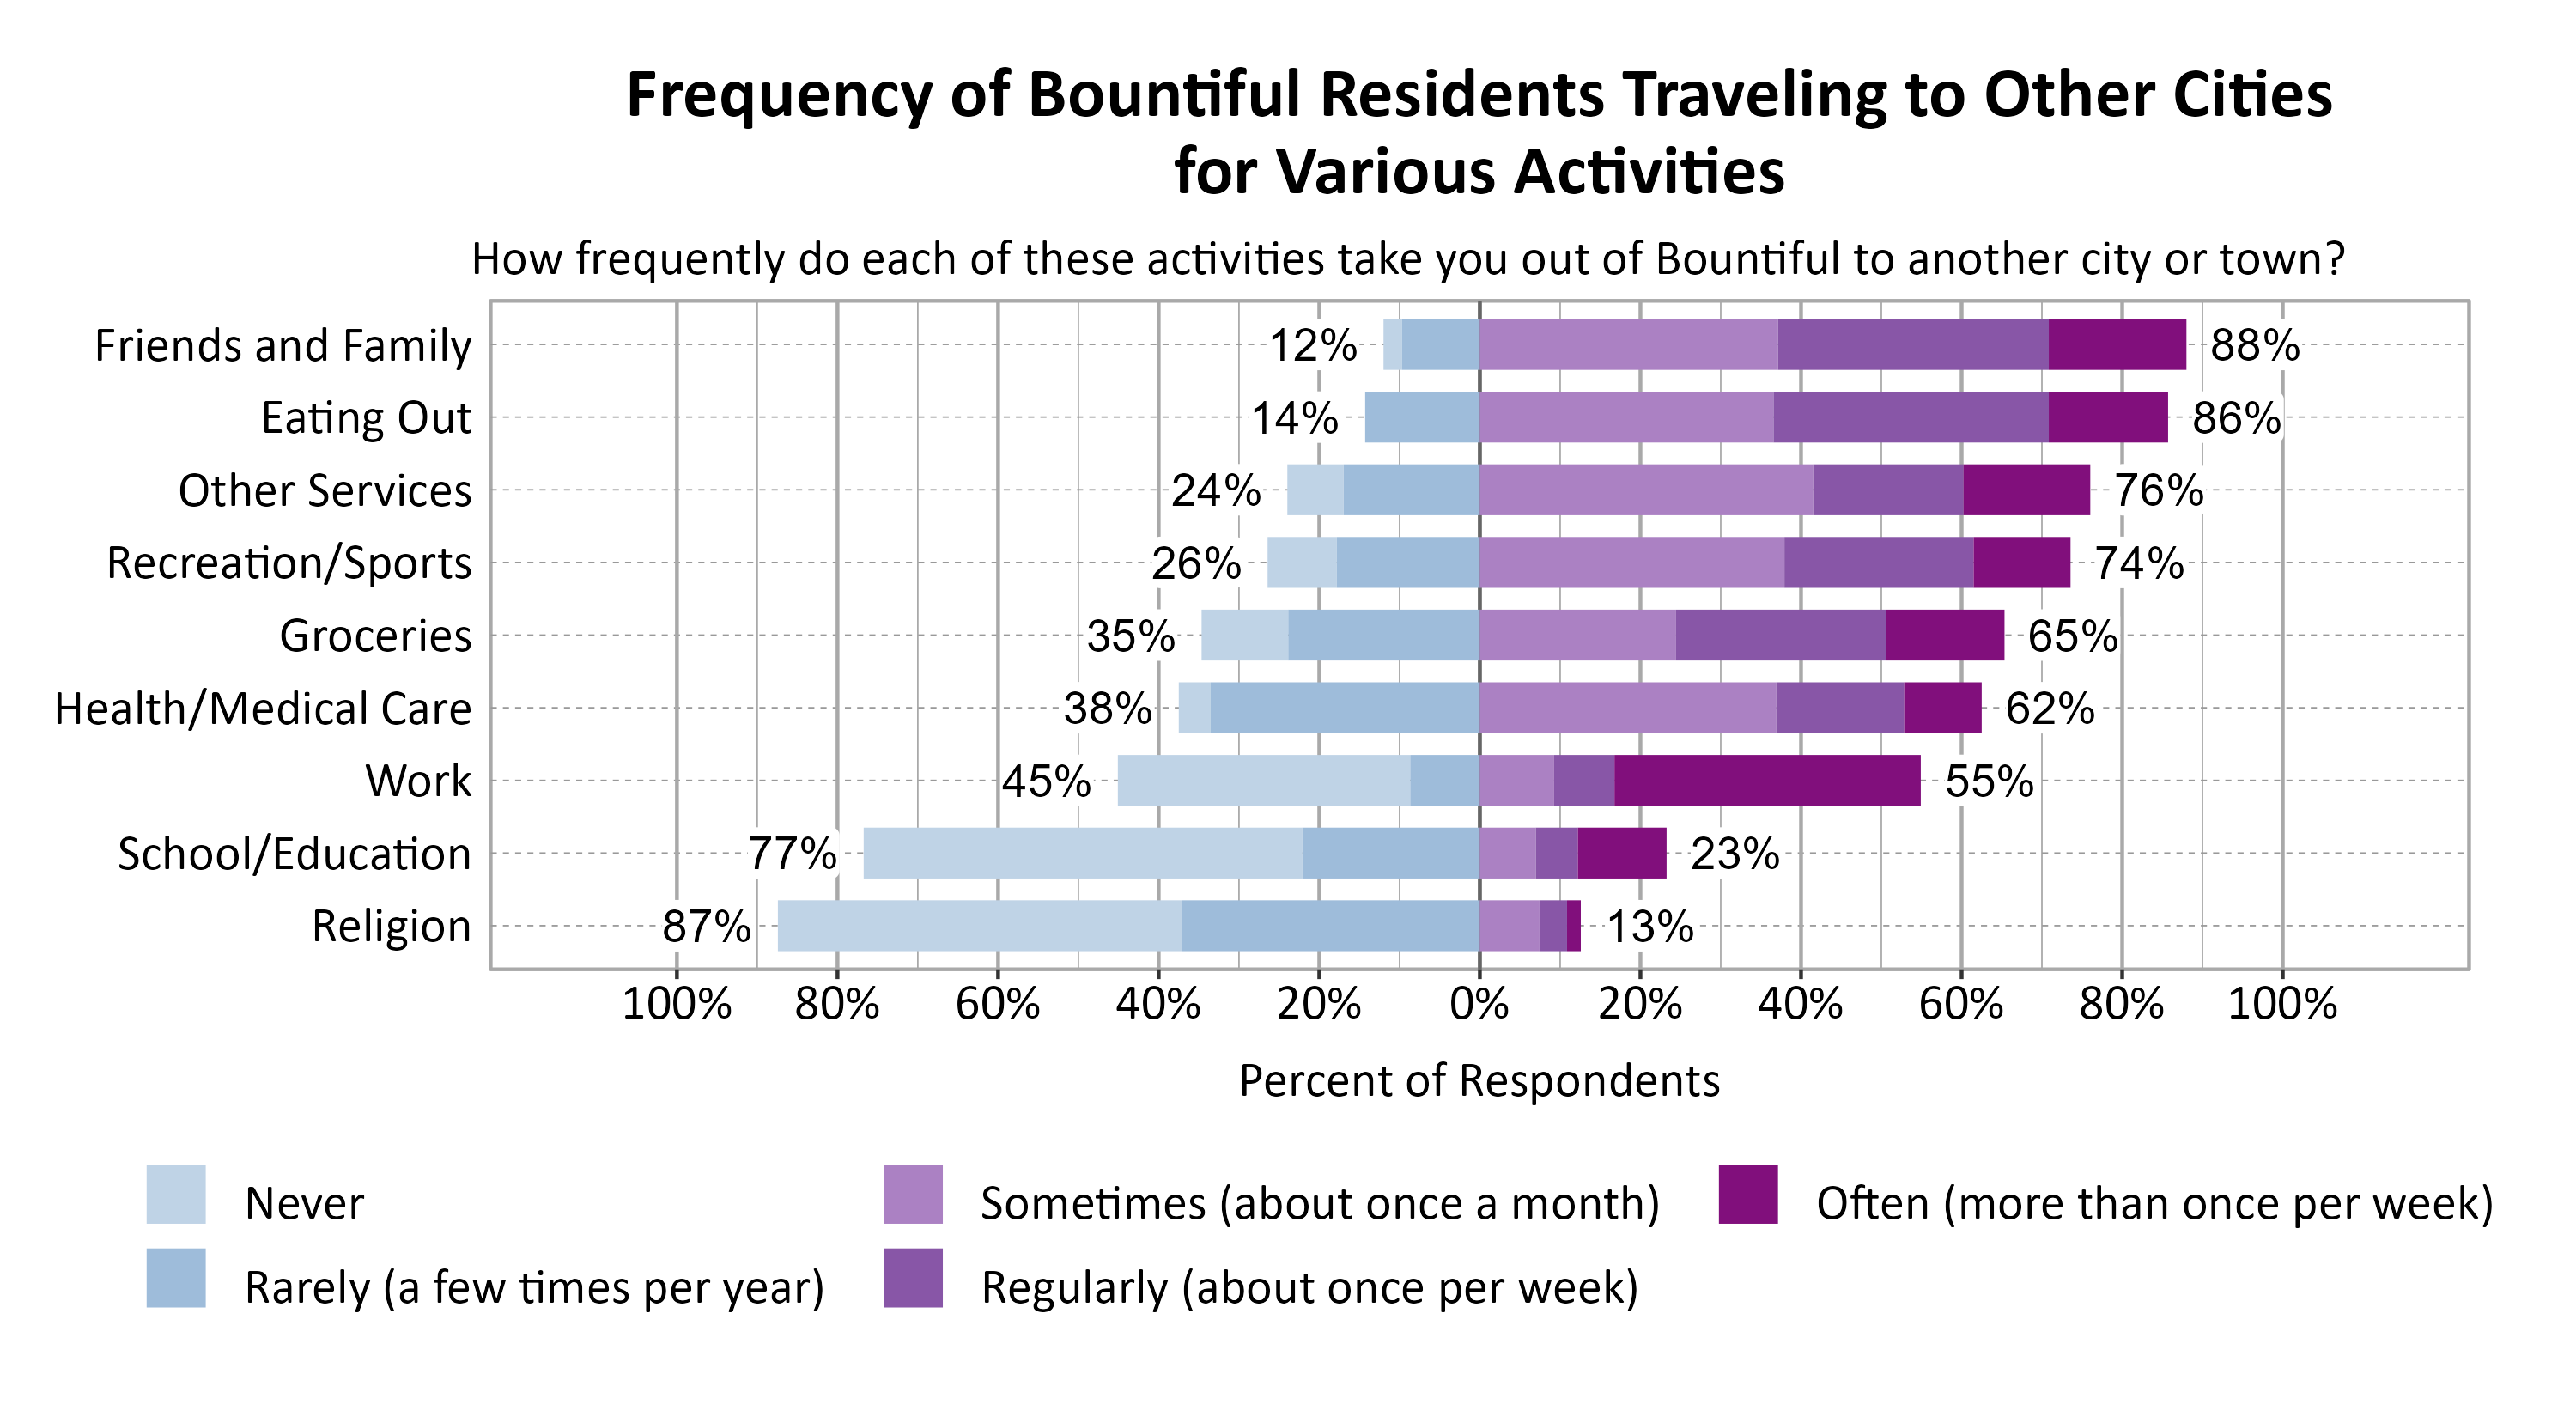
Respondents were asked to indicate how frequently various activities take them out of Bountiful to another city or town. The most commonly indicated reasons for traveling to another city or town at least sometimes or once a month were Friends and Family (88%), Eating Out (86%), and Other Services (76%).
Concerns in Bountiful
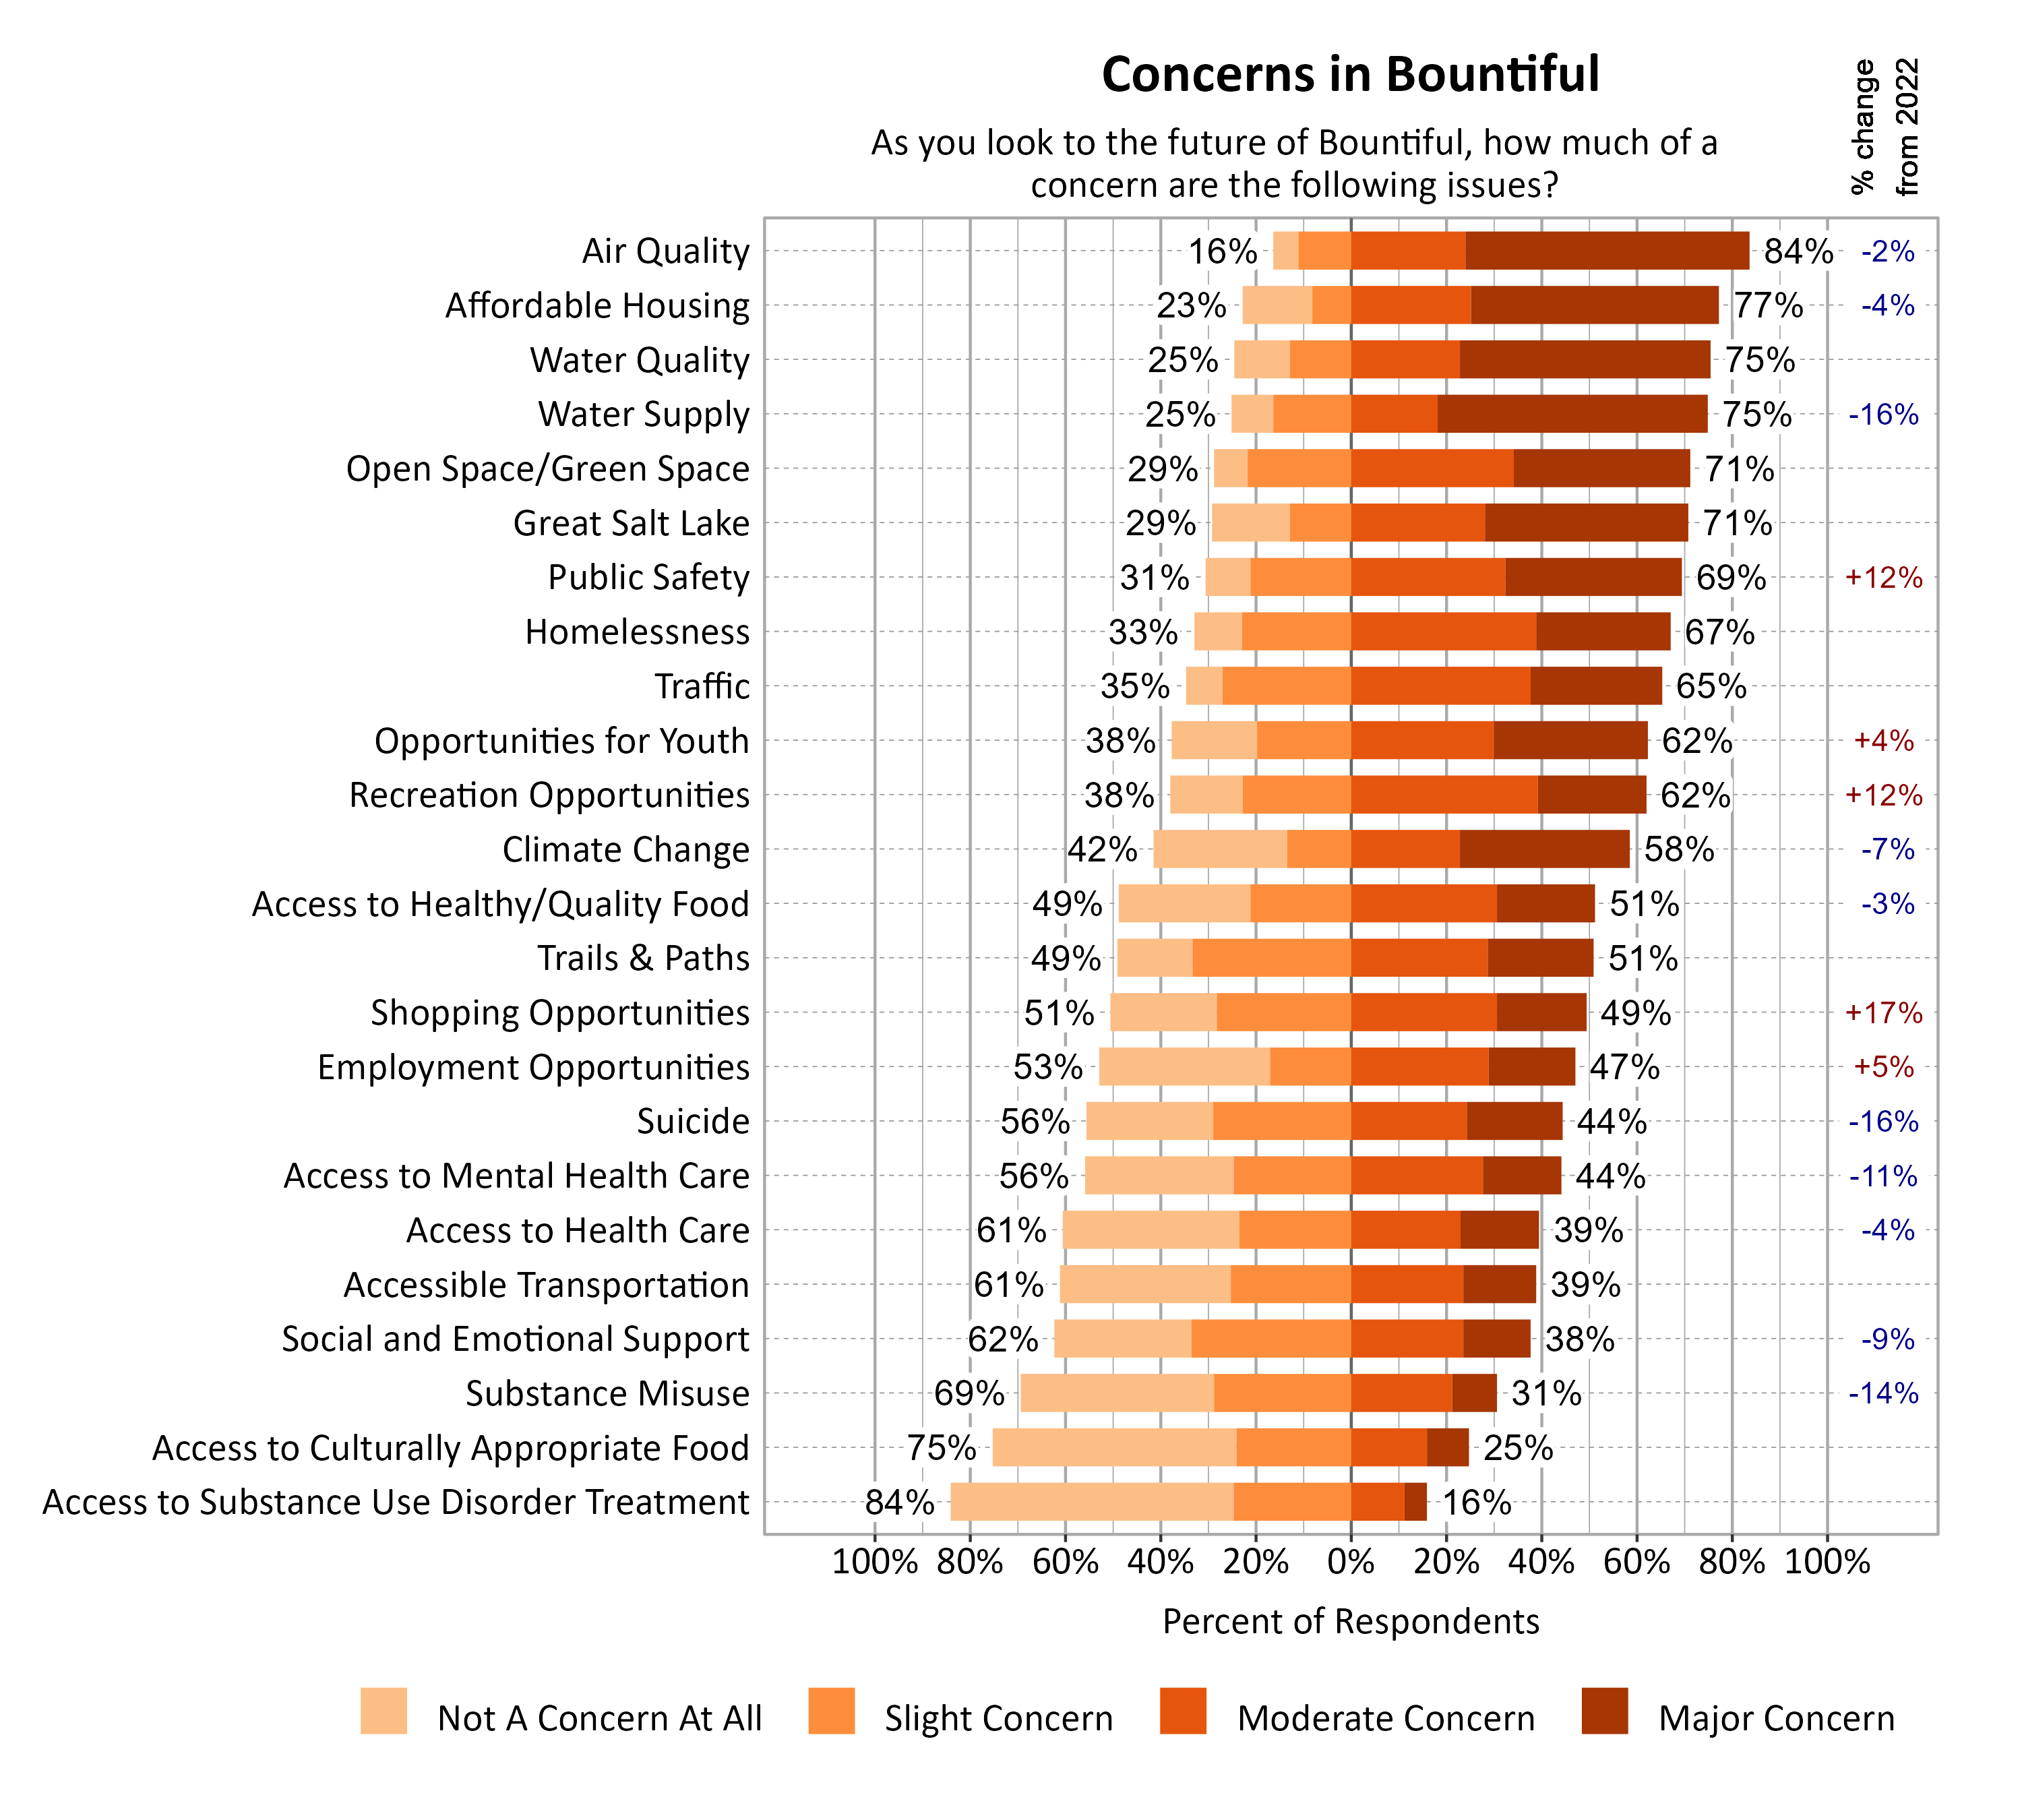
Survey respondents indicated the degree to which a number of possible local issues were a concern as they look to the future of Bountiful. Air Quality (84%), Affordable Housing (77%), Water Quality (75%), and Water Supply (75%) were the top concerns. Since 2022, moderate or major concern about shopping opportunities (+17%), recreation opportunities (+12%), and public safety (+12%) notably increased, while concern about suicide (-16%), water supply (-16%), substance misuse (-14%), and access to mental health care (-11%) notably decreased.
Open Comments
All open comments collected in the survey were shared with city leaders. Only general observations and themes are shared here.
What Respondents Value Most in Bountiful
Survey respondents were asked to comment on what they value most about Bountiful. The most common words and phrases from all city comments are included in the word cloud below. It is possible that negative or unrelated words may appear since these words have been taken out of context, and they may not indicate the respondent’s intended meaning. Many comments expressed the value of friendly neighbors and a sense of community. In addition, Bountiful respondents valued being close to their family. Safety was also a highly valued, characterized by a low crime rate and a secure environment. Many respondents appreciated Bountiful’s small-town atmosphere, while being conveniently close to larger urban areas, especially Salt Lake City. This proximity allows for easy access to major amenities, transportation hubs like the airport, and cultural activities, all while maintaining the charm and intimacy of a smaller community.

Local Environmental Quality in Bountiful
The 47% of respondents who rated the Local Environmental Quality domain as 1, 2, or 3 (Poor, Fair, or Moderate) were further asked if there are specific aspects of local environmental quality that they feel are problematic. Respondents raised concerns regarding health, pollution, and appearance of the refineries nearby. The Great Salt Lake was also a point of concern regarding health, air quality, and water scarcity. Air quality was also noted as a general concern, with particular mention of air pollution and inversions.
Improving Wellbeing in Bountiful
Survey respondents were asked if there is anything that could be done to improve wellbeing in Bountiful. Many comments express wanting safer sidewalks, better public transportation, and more bike and walking paths. There was a strong call for more affordable housing, diverse local businesses, and improved community spaces. Environmental sustainability and community inclusivity were also significant concerns.
Additional Comments
Respondents were also asked if they had any additional comments on wellbeing in Bountiful. While some praise the city’s community feel and government efforts, there were concerns about social divides and a lack of diversity from others. Issues of racism, economic disparity, and a growing divide between different socioeconomic and cultural groups were mentioned. The need for tolerance and a reduction in divisions within the community was highlighted. Concerns were also raised about the affordability of housing. The rapid development of apartments and high-density housing was seen as a threat to the small-town feel and quality of life, potentially leading to increased crime and overcrowding. There was a call to restrict developers from focusing solely on high-end housing to preserve community character. The local government was generally seen as active and committed to the community’s well-being. However, there were some feelings that more could be done to listen to and engage with residents, especially regarding development and zoning issues.