Cedar City Wellbeing Survey Findings 2024
By Dr. Courtney Flint and Team
![]()
Contact Information
Dr. Courtney Flint
courtney.flint@usu.edu
435-797-8635
Summary
Cedar City is one of 51 cities participating in the Utah Wellbeing Survey Project in 2024. This project is designed to assess the wellbeing and local perspectives of city residents and to provide information to city leaders to inform general planning processes. Additional analysis is underway and this report may be updated over time.
We are grateful to all those who took the survey and to our city partners who helped to make this possible. We are grateful to a number of entities for funding: the Utah League of Cities and Towns, USU Extension, USU’s Institute for Land Water and Air, the Wasatch Front Regional Council, Utah Department of Transportation, the Utah Agricultural Experiment Station, and the cities of Alpine, Cedar Hills, Draper, Millcreek, Nephi, North Salt Lake, Ogden, Orem, Pleasant Grove, Providence, Springdale, Tremonton, West Bountiful, and West Valley City.
This report describes findings from the 2024 Cedar City survey and comparative information with other project cities. In April and May 2024, Cedar City advertised the survey for residents largely through social media and newsletters. All city residents age 18+ were encouraged to take the online Qualtrics survey.
How many people responded?
- 762 viable surveys were recorded in this 2024 survey effort.
- The Cedar City 2020 survey had 262 responses.
- The adult population of Cedar City was estimated at 26,115, based on the American Community Survey by the U.S. Census. The 762 survey responses in 2024 represent 2.9% of the adult population and have a conservative margin of error of 3.5%.
Survey Respondent Characteristics
| Resident Statistics | |
|---|---|
| Full Time Residents of Cedar City | 98.2% |
| Part Time Residents of Cedar City | 1.8% |
| Length of Residency — Range | 0.5-77 years |
| Length of Residency — Average | 17.1 years |
| Length of Residency — Median | 11 years |
| Length of Residency 5 Years or less | 32.3% |
| ZIP Code | Percent |
|---|---|
| 84720 | 53.1% |
| 84721 | 46.9% |
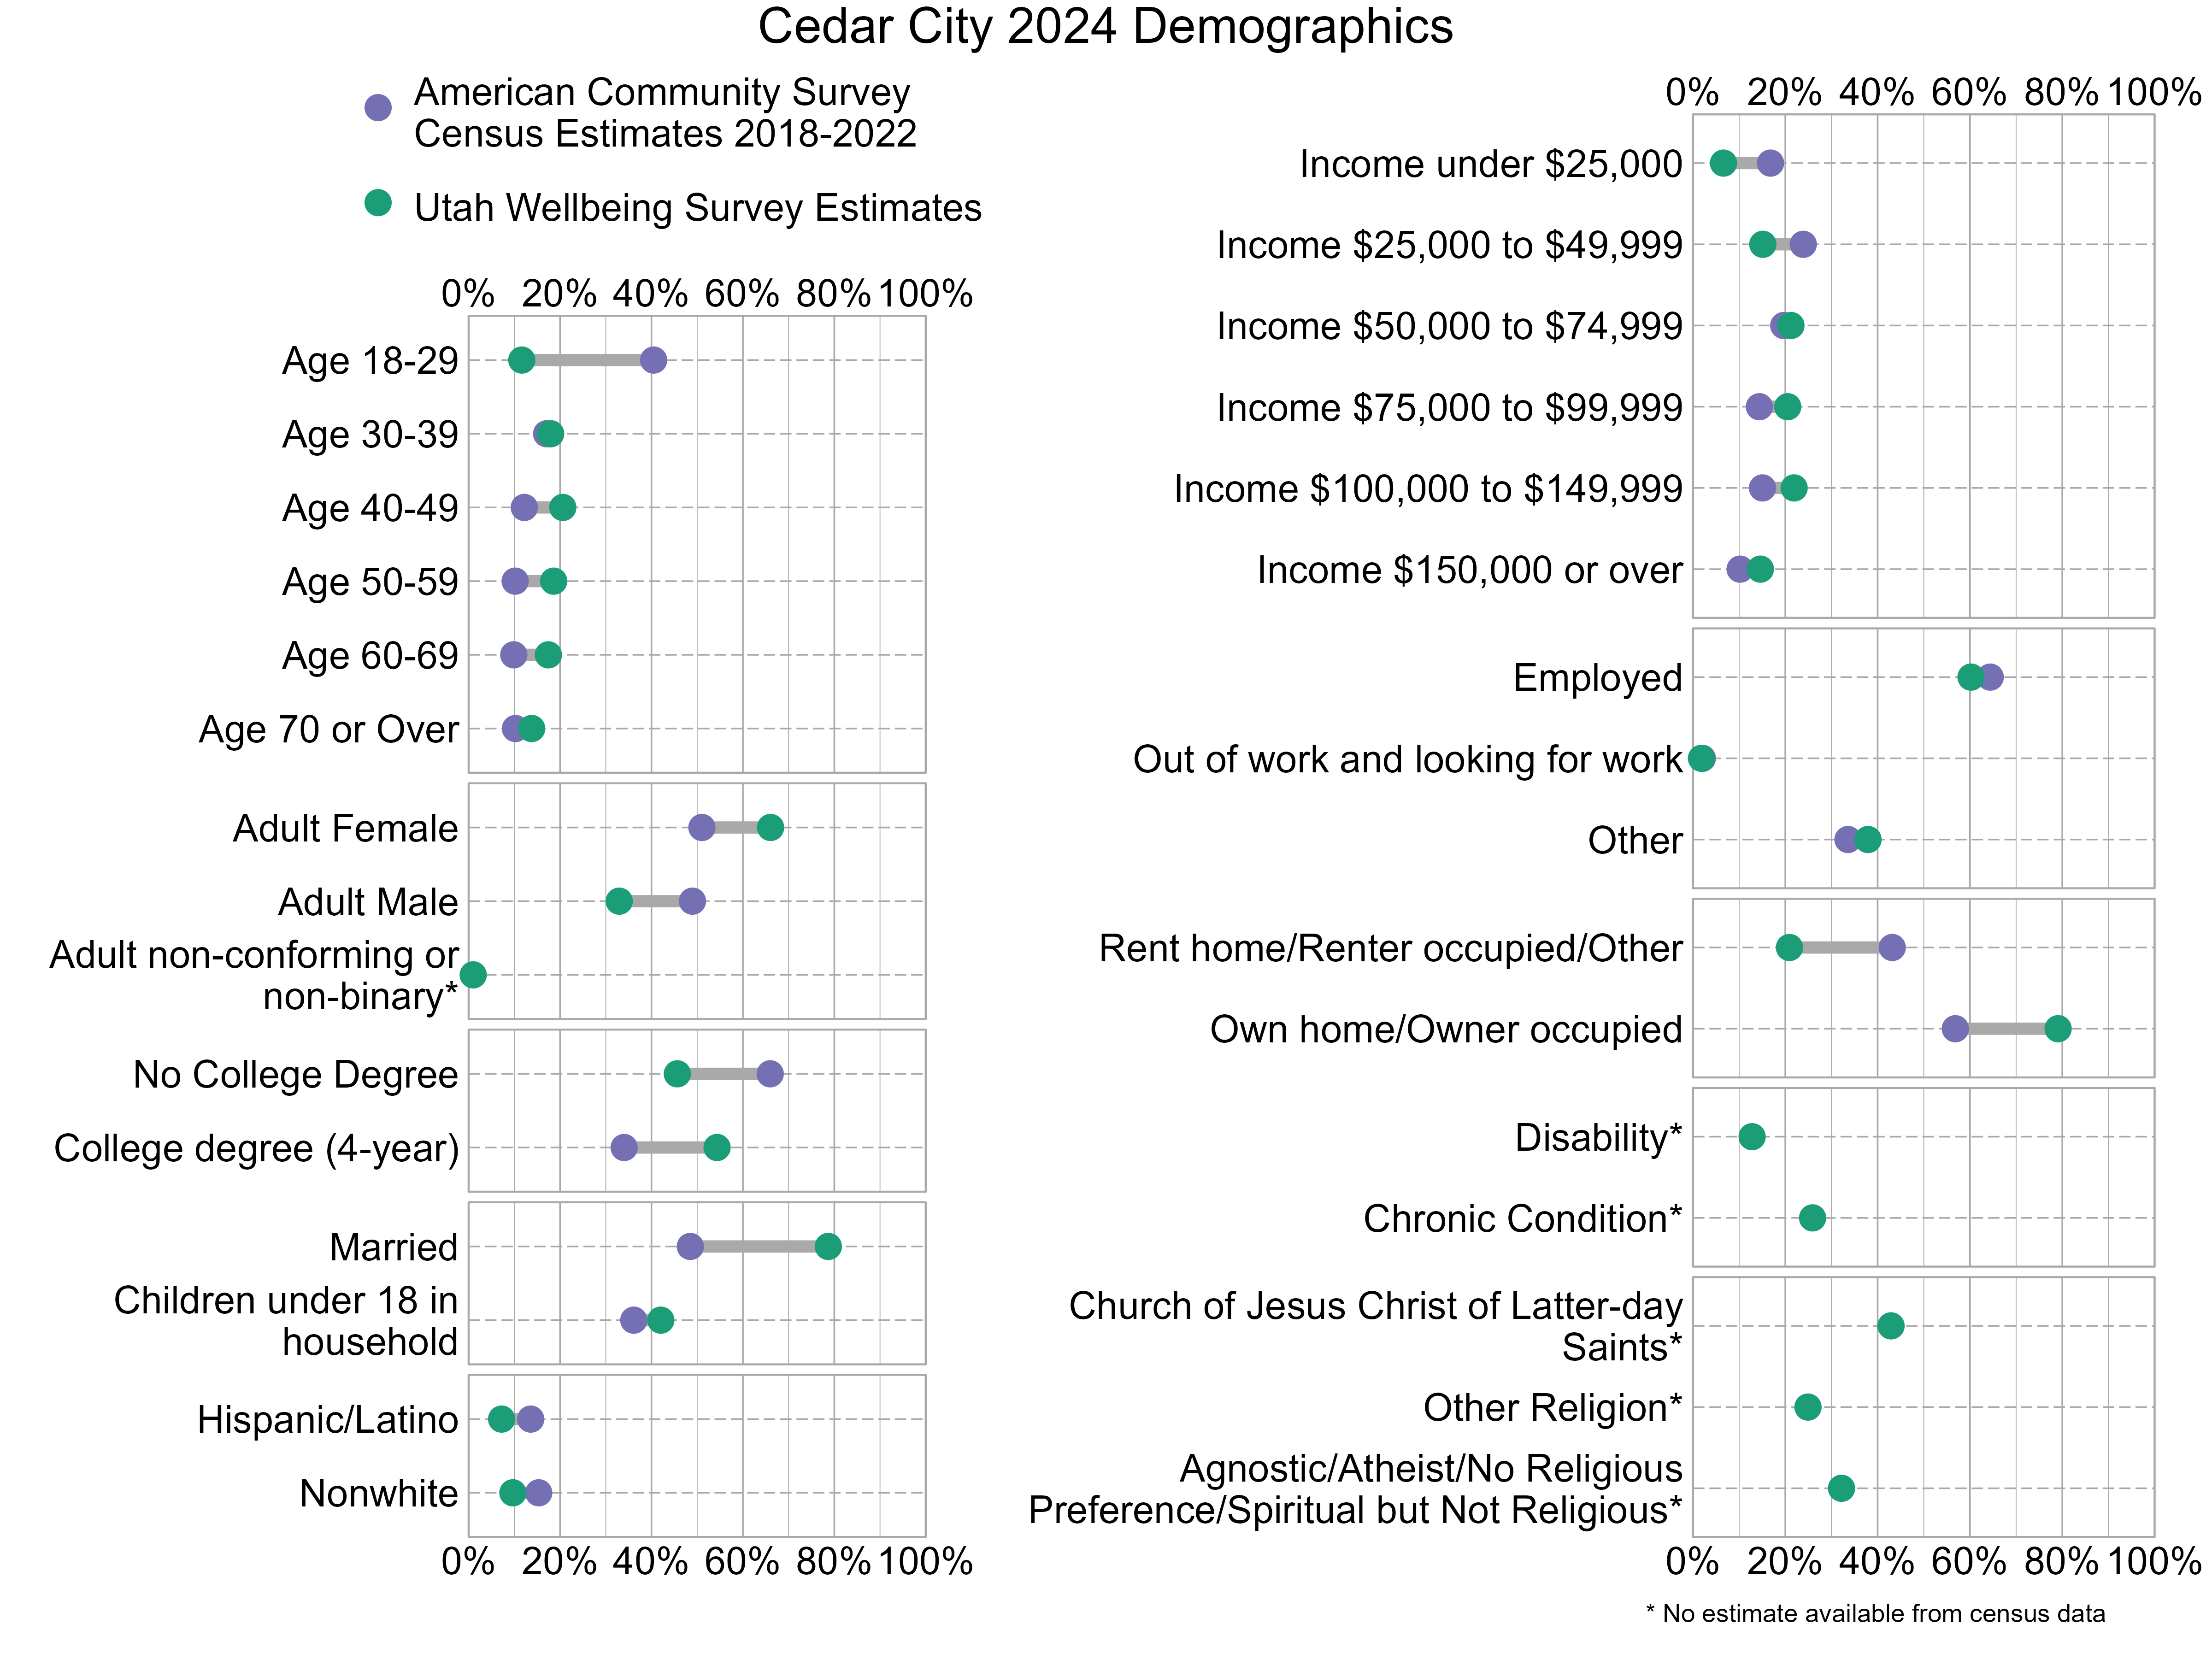
Demographic characteristics of the survey respondents were compared below with U.S. Census information from the 2018-2022 American Community Survey. In the graph below, gray bars indicate differences between the American Community Survey estimates and the Utah Wellbeing Project surveys. The wider the gray bars, the larger the differences. Also note that estimates for religious affiliation, adult non-conforming or non-binary gender, disability, and chronic conditions are unavailable from the census data. There can also be a variable margin of error in the American Community Survey estimates, and caution should be used when comparing estimates. Not all respondents provided demographic information. As the graph shows, 2024 survey respondents were not fully representative of Cedar City. People who are adult females, have at least a 4-year college degree, are married, and own their homes were overrepresented while those who are age 18-29, are adult males, do not have a college degree, and are renters were underrepresented.
Overall Personal Wellbeing and Overall Wellbeing in Cedar City
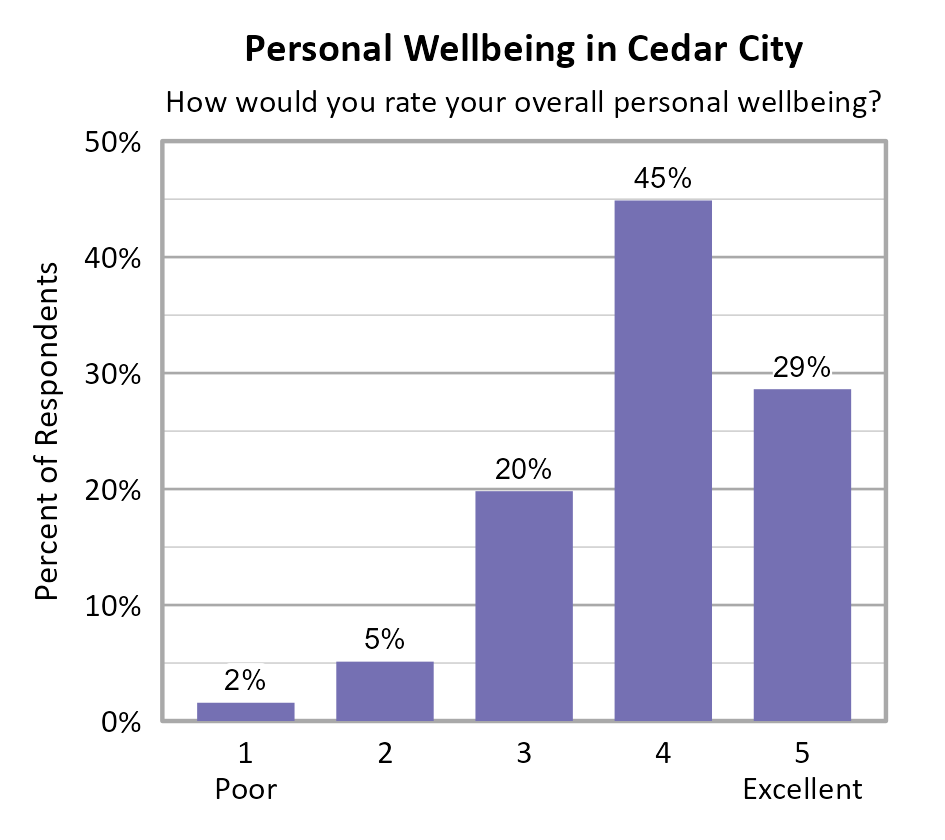
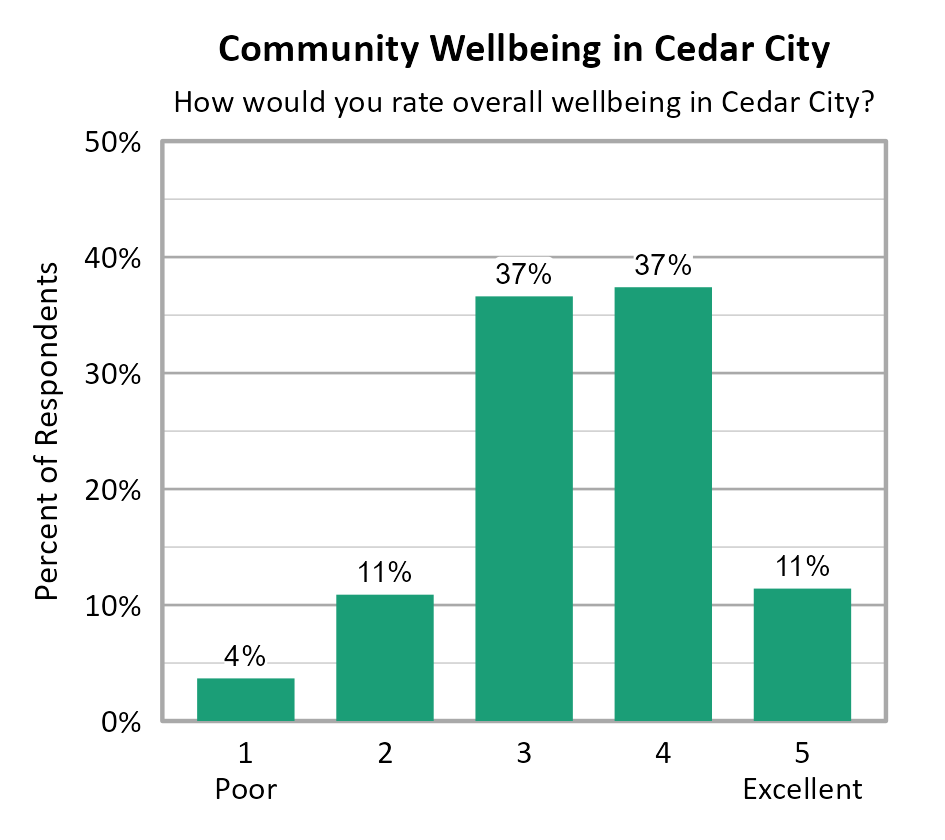
Survey participants were asked about their overall personal wellbeing and overall community wellbeing in Cedar City. These wellbeing indicators were both measured on a 5-point scale from poor (1) to excellent (5). The average personal wellbeing score in Cedar City was 3.94 with 73% of respondents indicating their wellbeing at a 4 or 5 on the 5-point scale. The average score for community wellbeing in Cedar City was 3.42 with 49% of respondents indicating community wellbeing at a 4 or 5 on the 5-point scale. ZIP code 84720 had statistically higher overall community wellbeing score when compared to ZIP code 84721; however, no significant difference was found between ZIP codes for overall personal wellbeing scores.
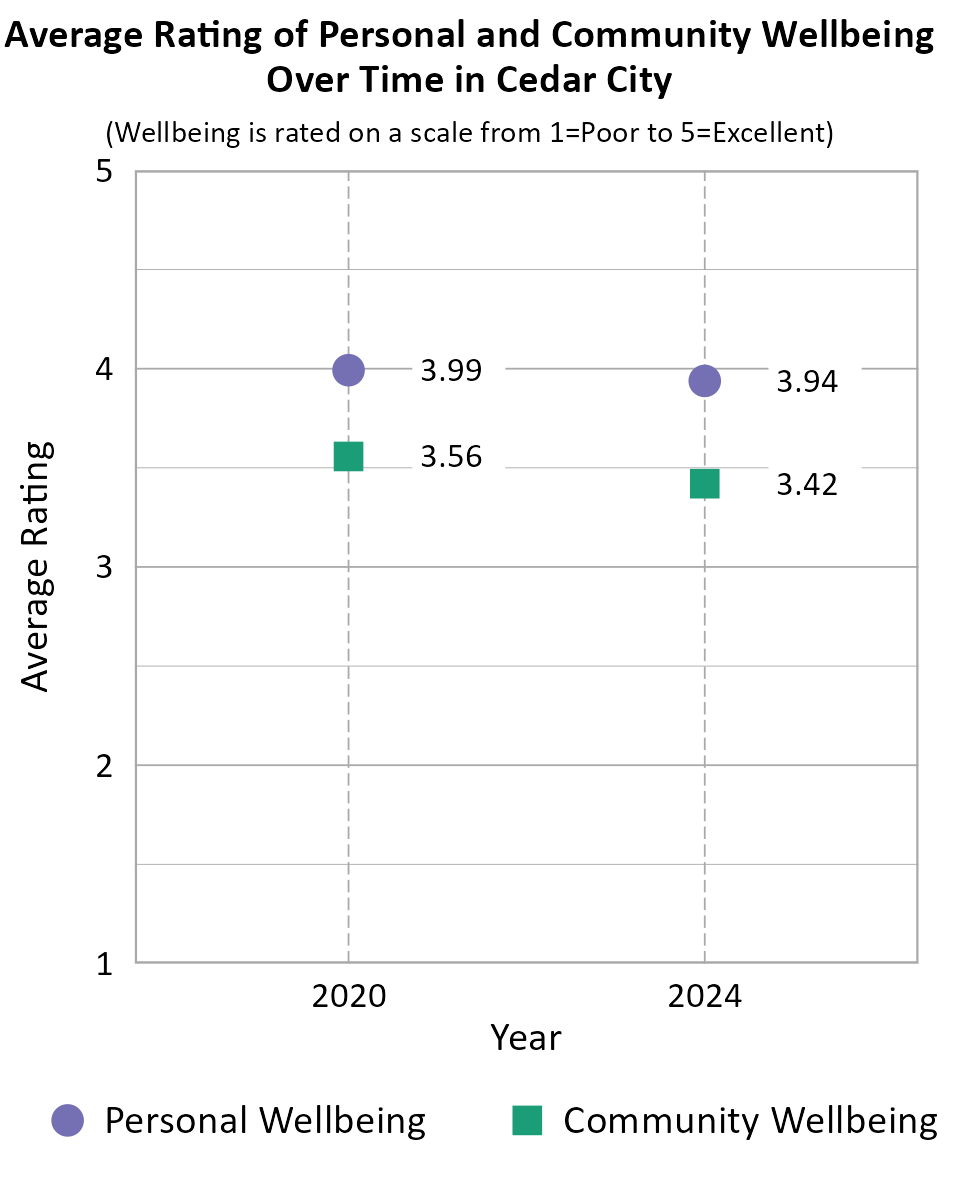
When comparing survey data from Cedar City over the years as shown in the information below, we can see that the average personal wellbeing score remained nearly the same between 2020 and 2024. The average community wellbeing score declined between 2020 and 2024. Note that the number of respondents differed between years, there is no tracking of individuals from one year to the next, and the low end of the scale was "Poor" in 2024 but "Very Poor" in prior years which may account for differences in scores over time.
Comparing Wellbeing Across Utah Cities
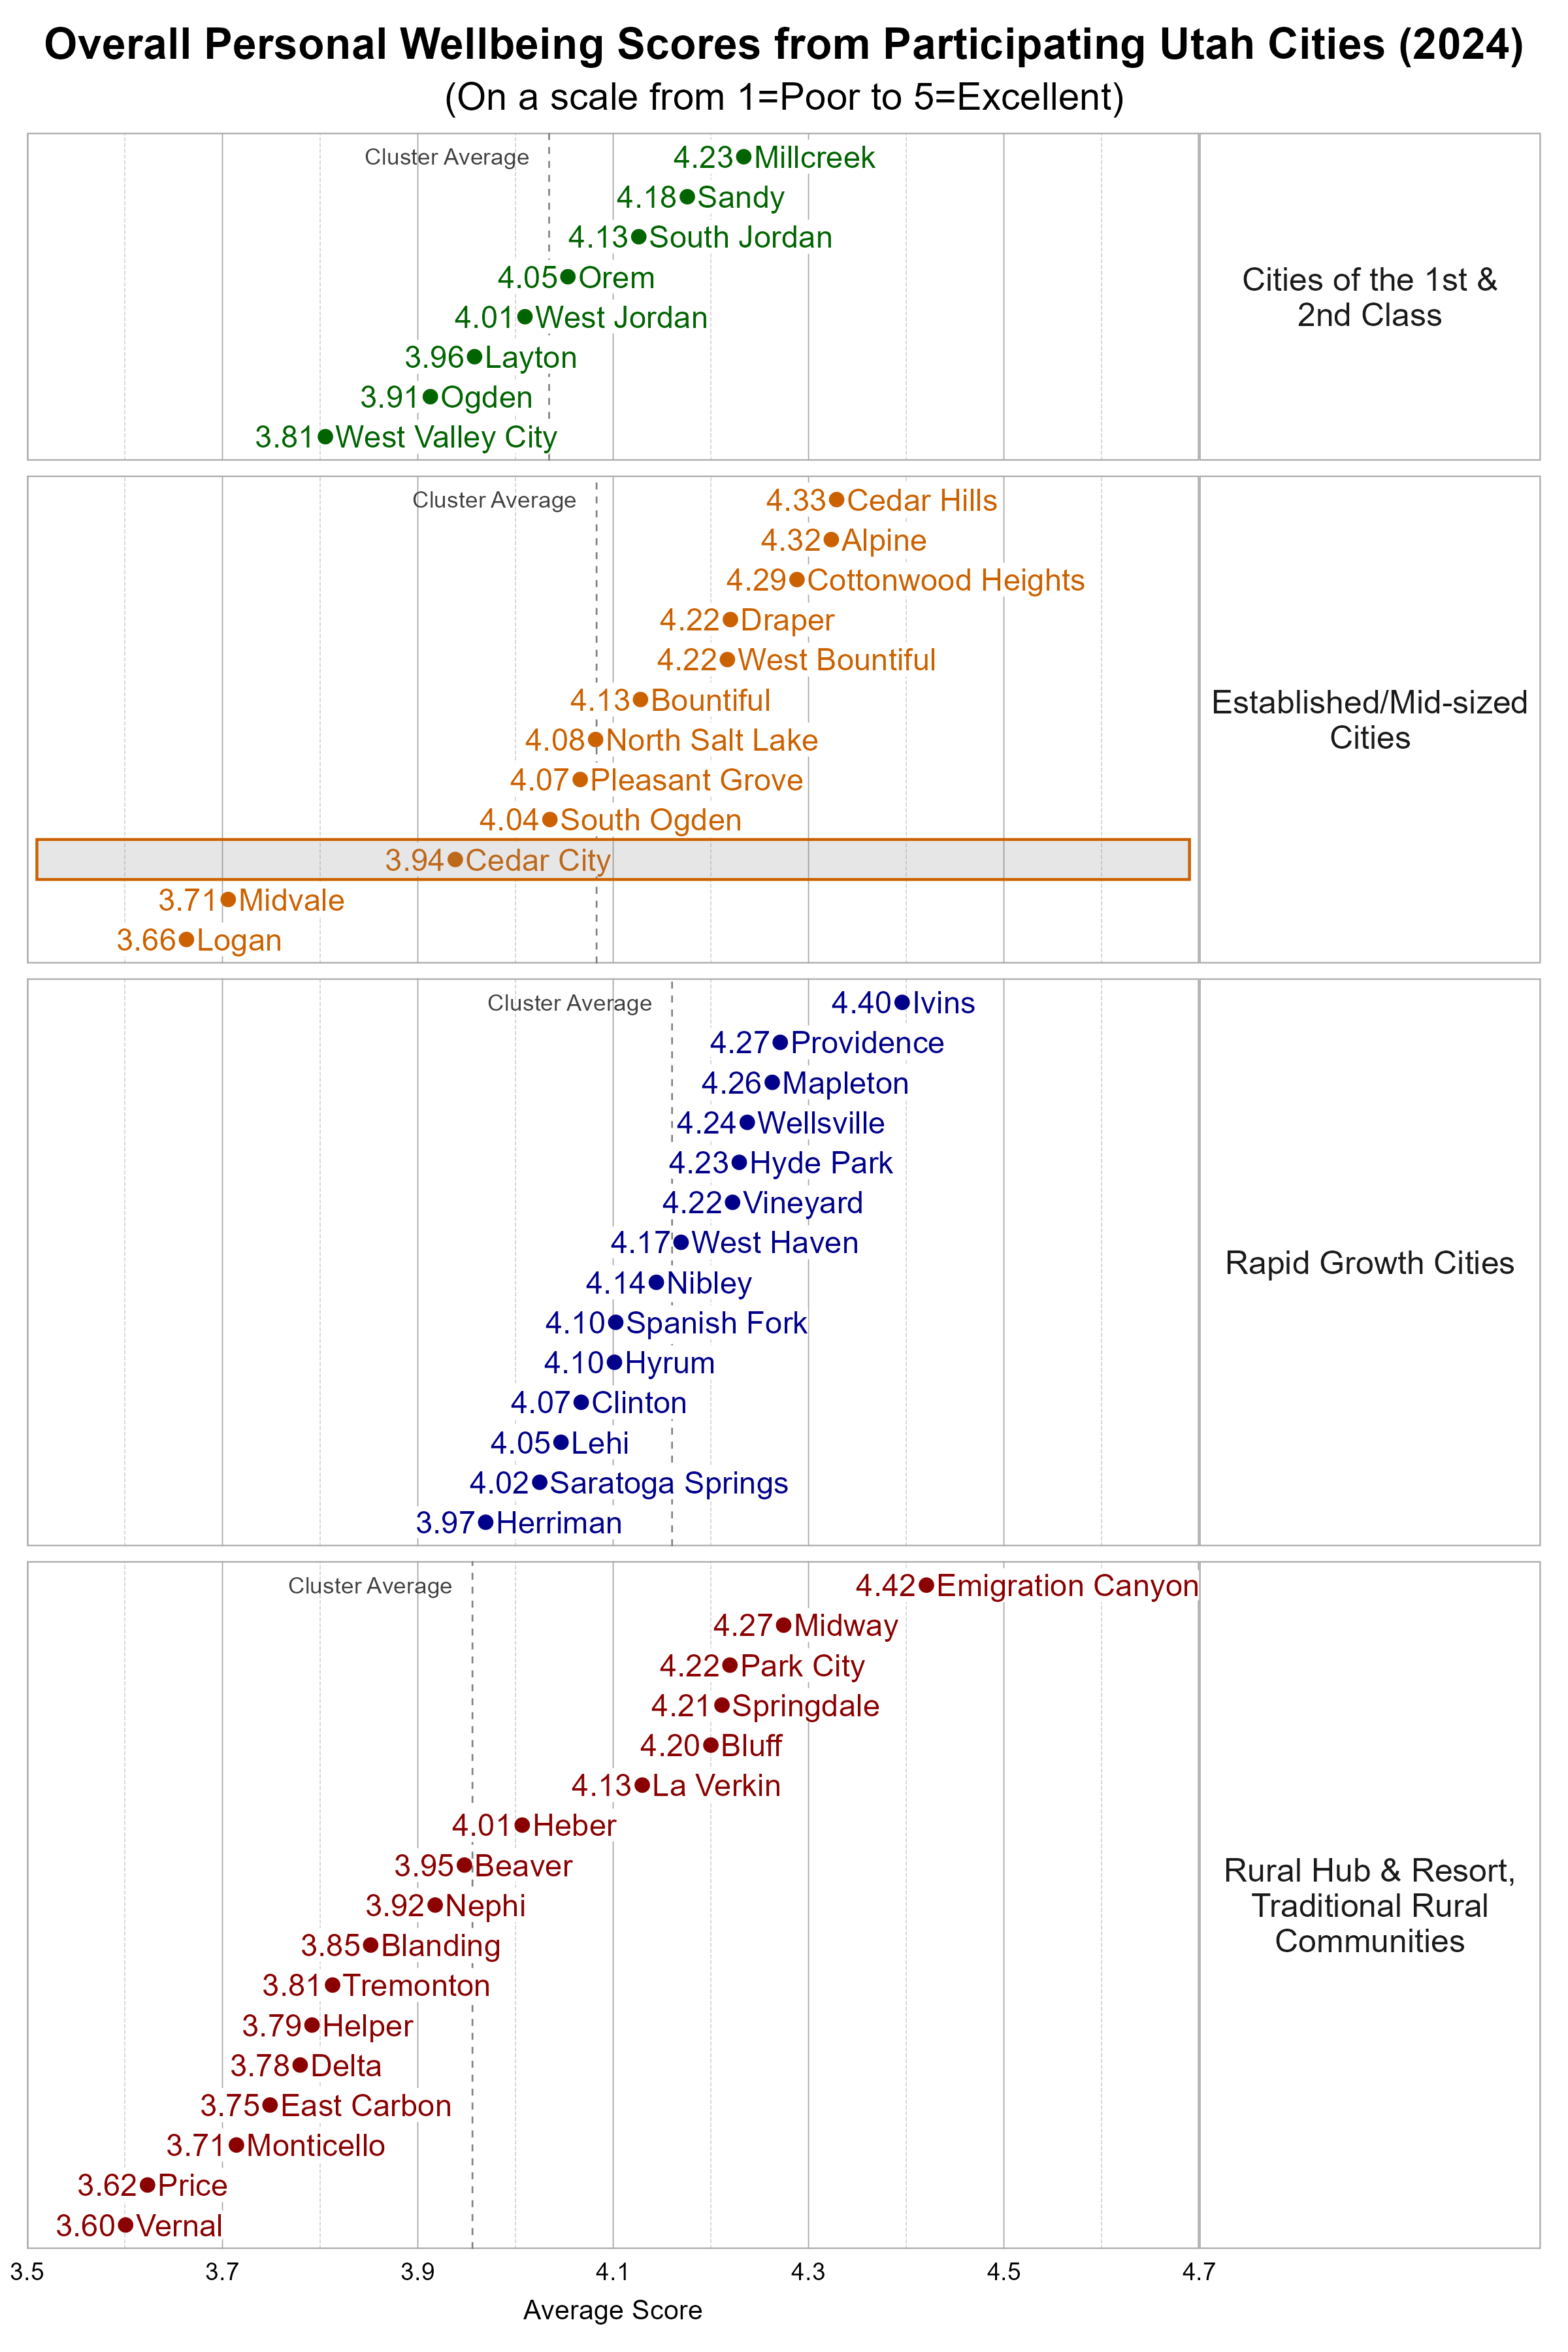
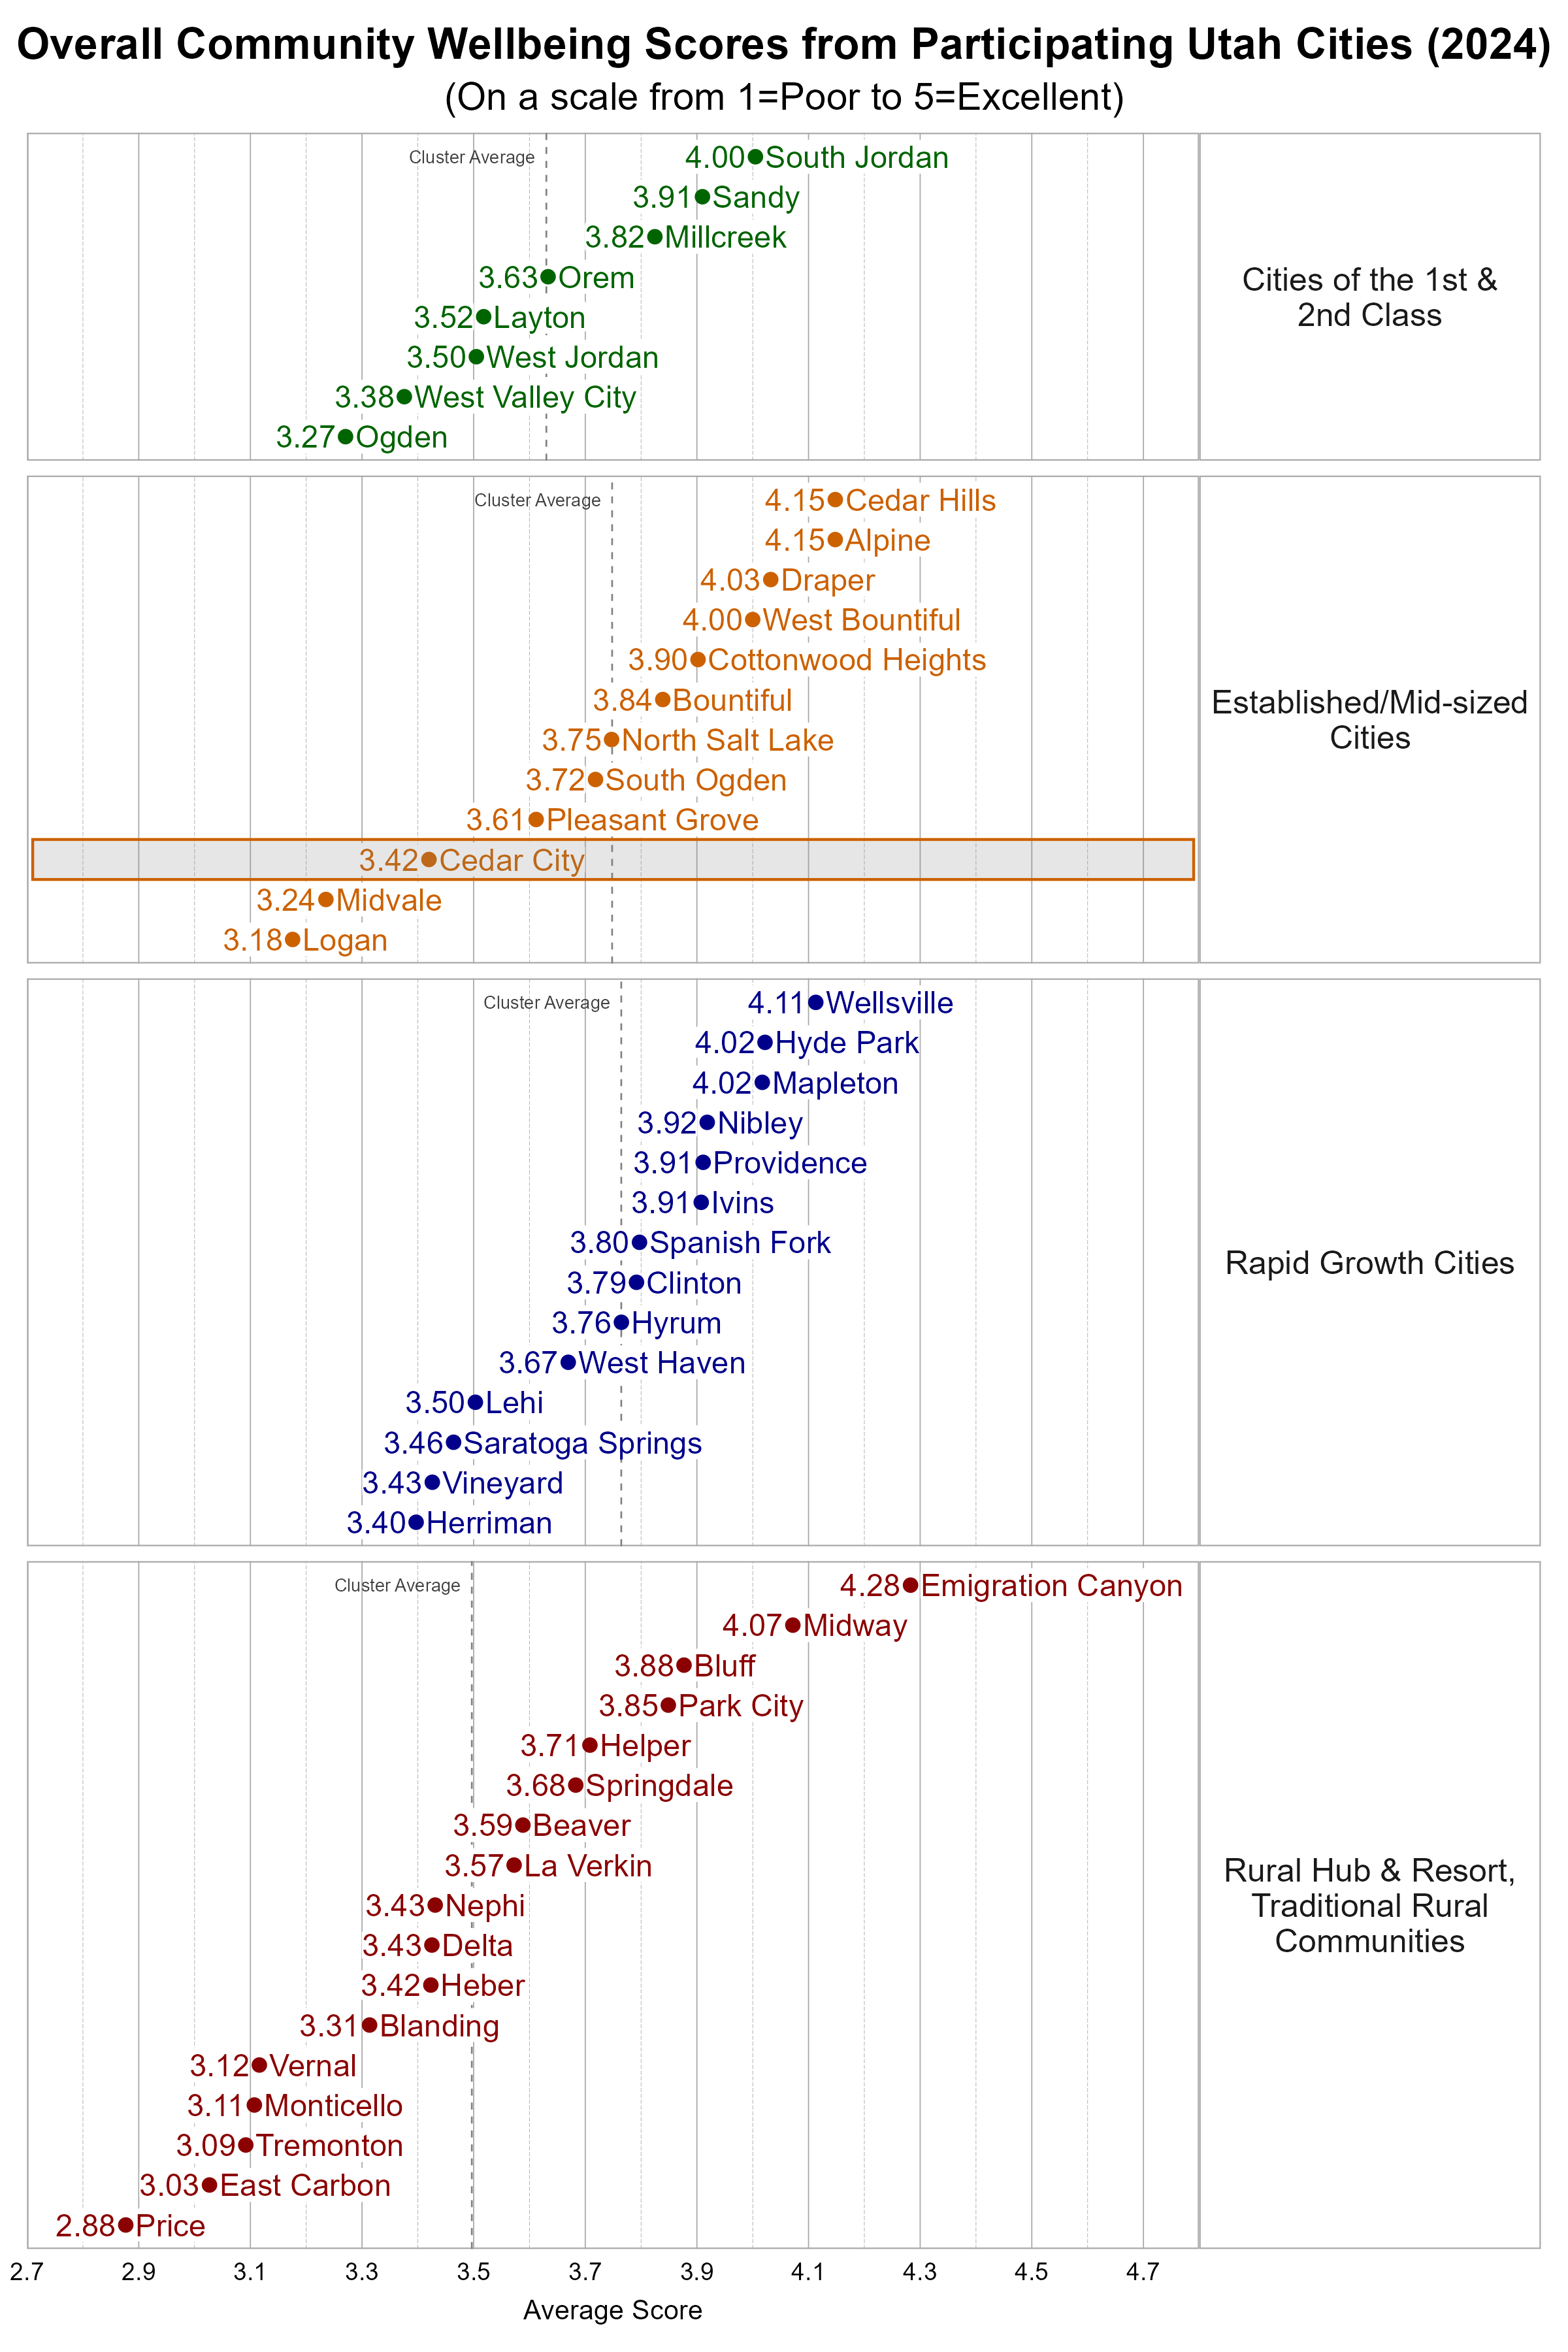
The Utah League of Cities and Towns clusters cities and towns into five different categories based on size and growth rates. We utilize these clusters in our analysis. Cedar City is classified as an Established/Mid-sized City. Some cities may fit within more than one cluster.
Within the more Urban city cluster, Cedar City was below the average overall personal wellbeing score and below the average overall community wellbeing score.
Wellbeing Domains in Cedar City
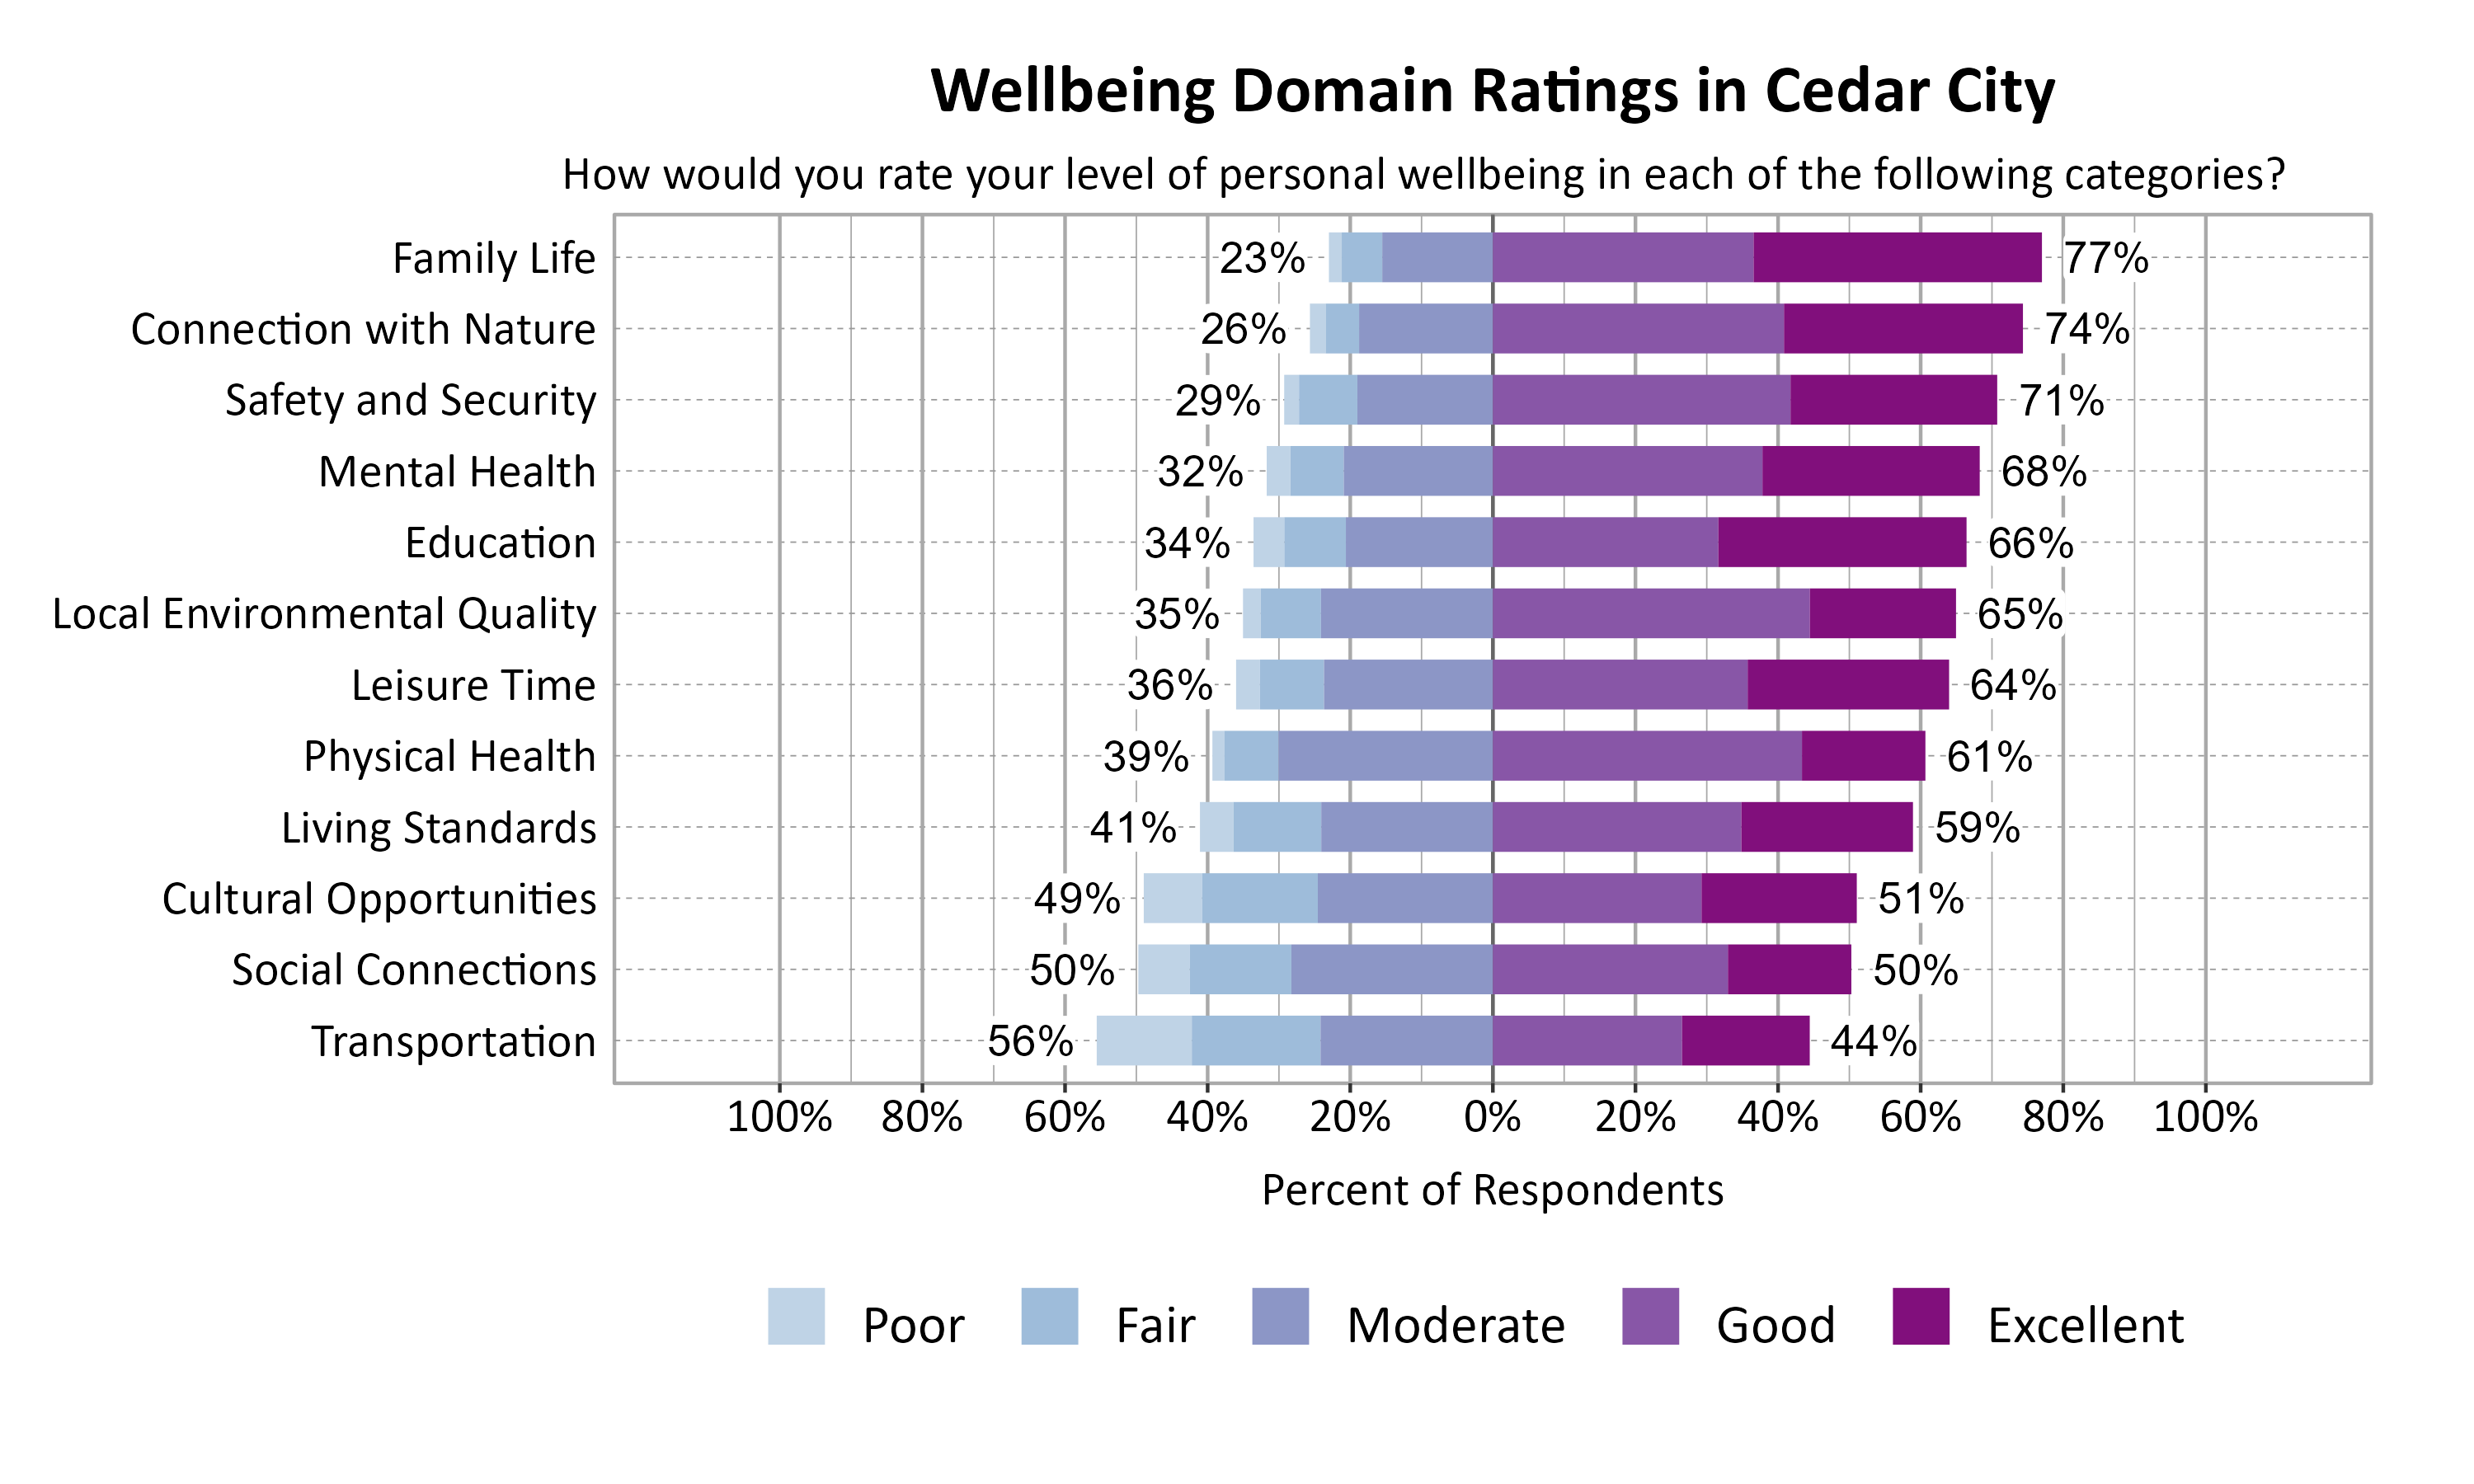
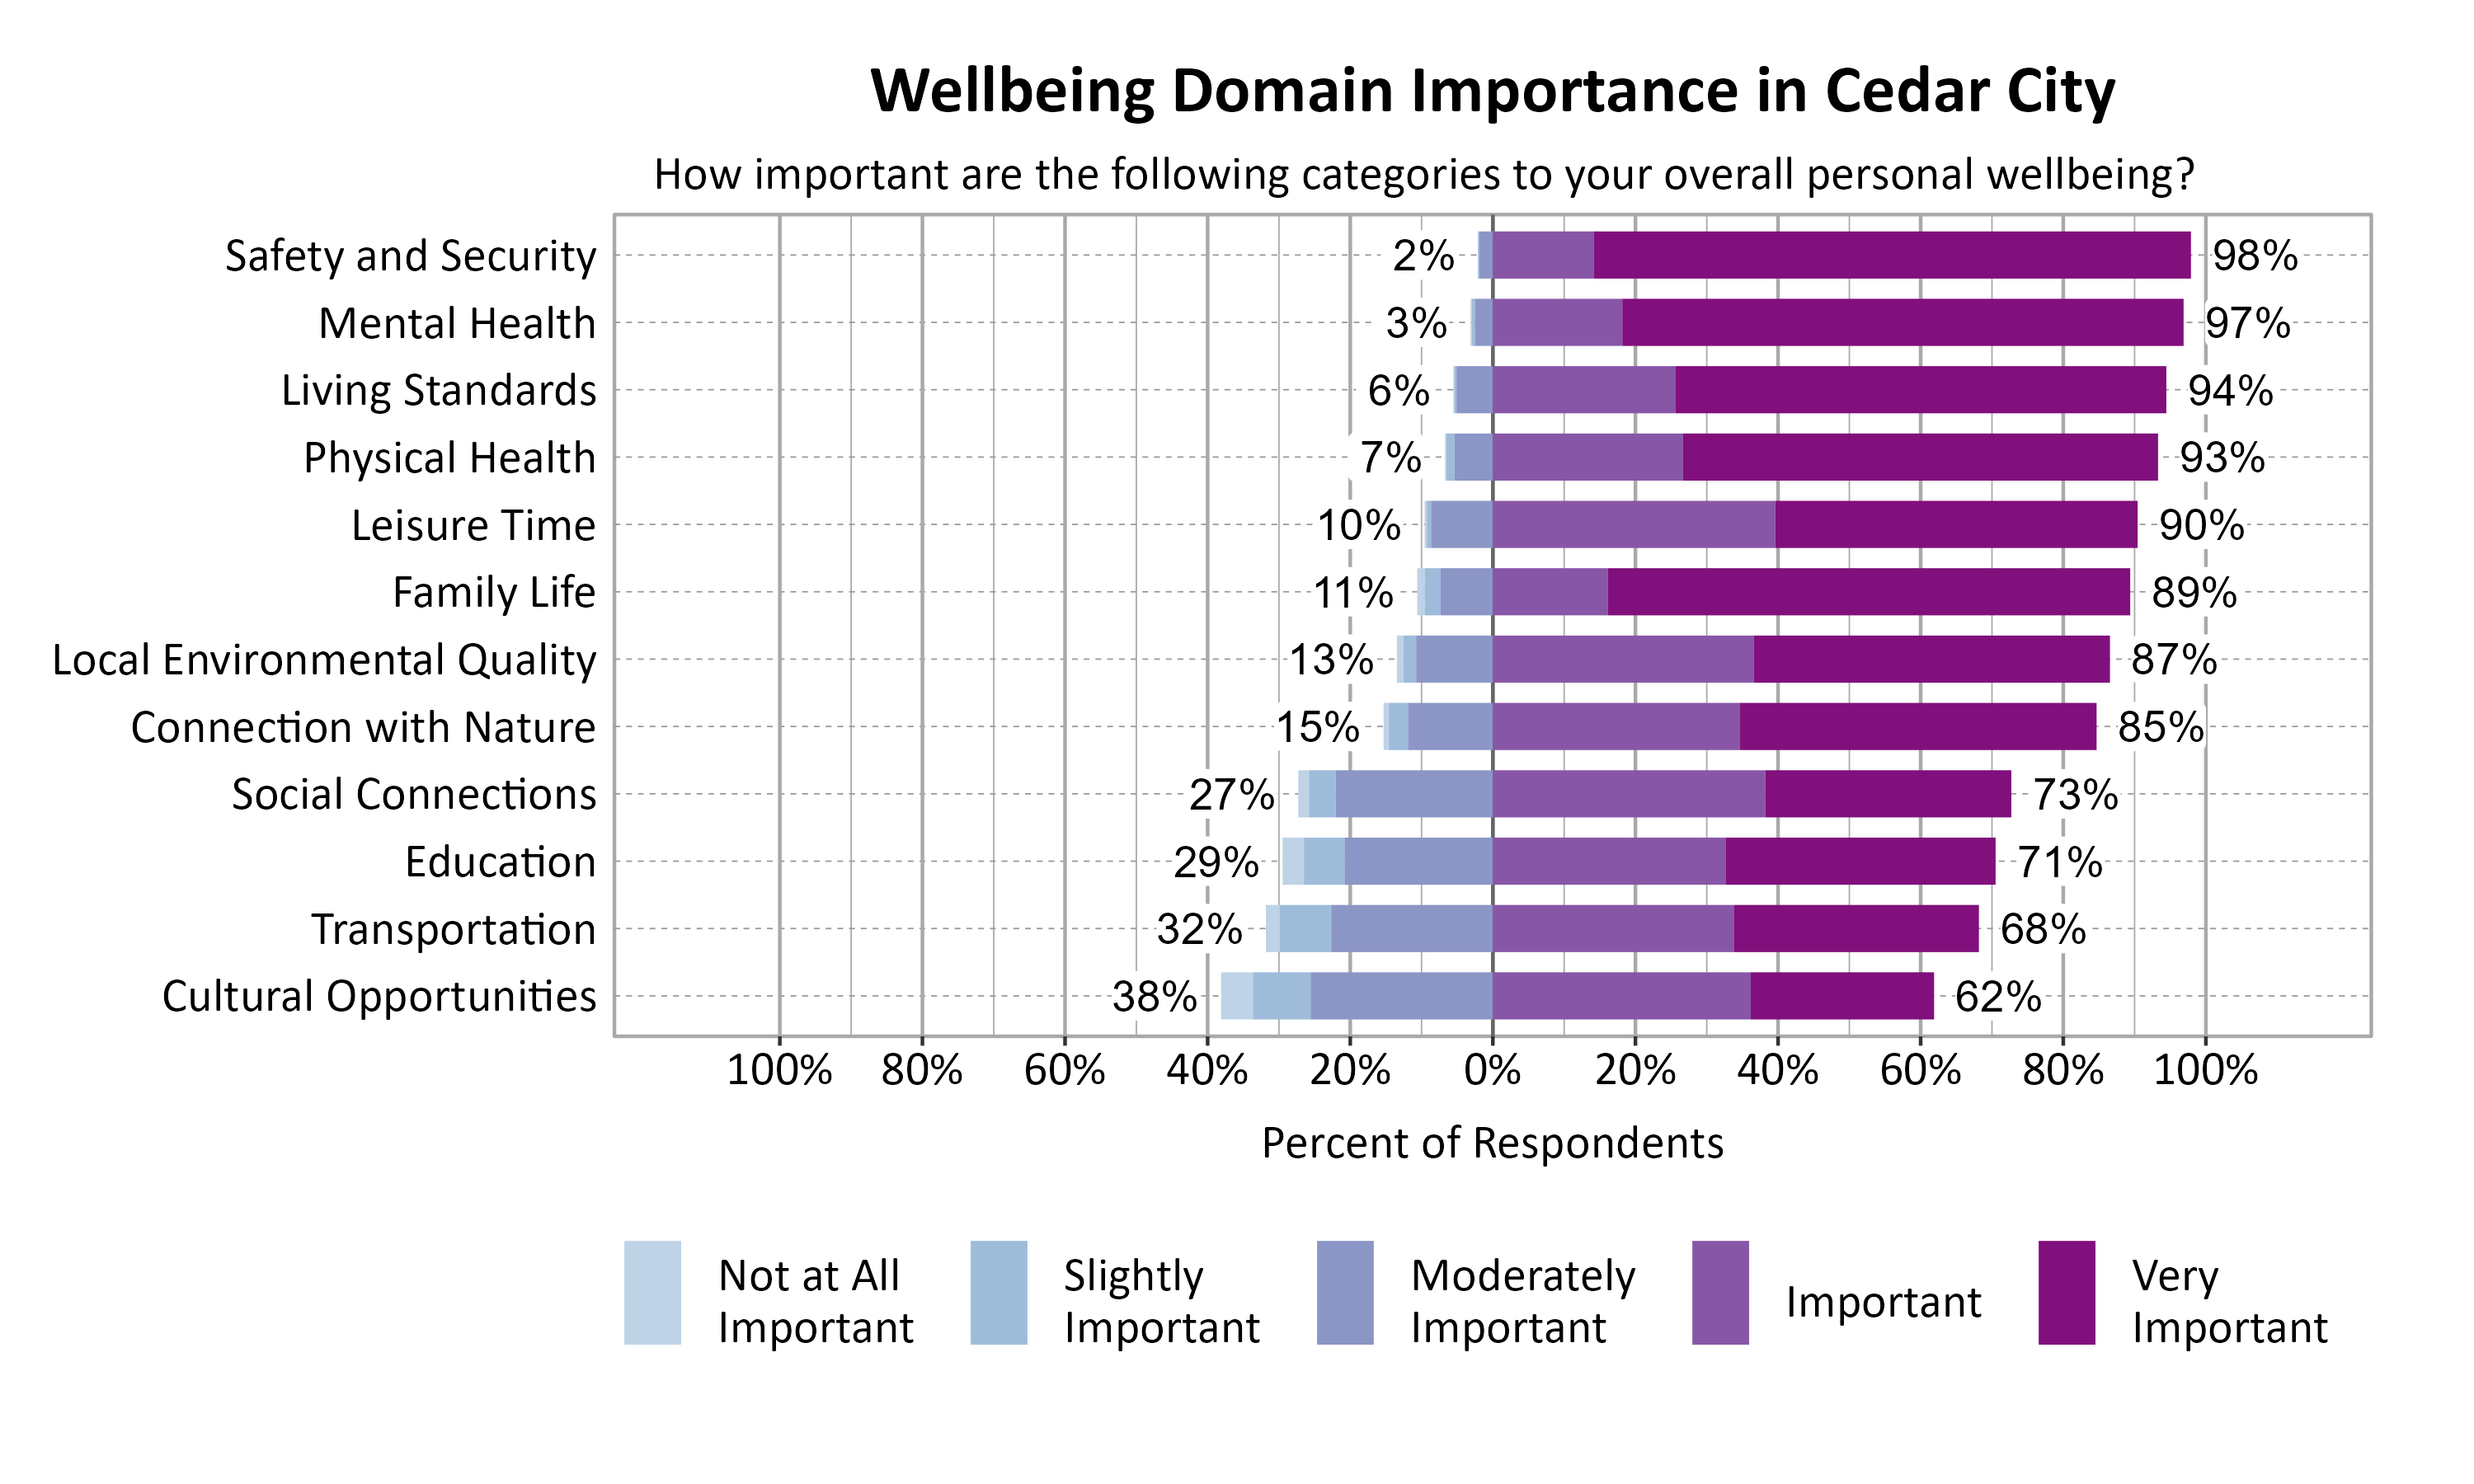
According to national and international entities that track wellbeing, there are a number of common dimensions or domains of wellbeing. Survey respondents rated twelve domains on a 5-point scale from poor to excellent. They were also asked to indicate the importance of each domain to their overall personal wellbeing on a 5-point scale from not at all important to very important. The highest rated wellbeing domains for respondents in Cedar City were Family Life (77%), Connection with Nature (74%), and Safety and Security (71%). The most important wellbeing domains were Safety and Security (98%), Mental Health (97%), Living Standards (94%), and Physical Health (93%).
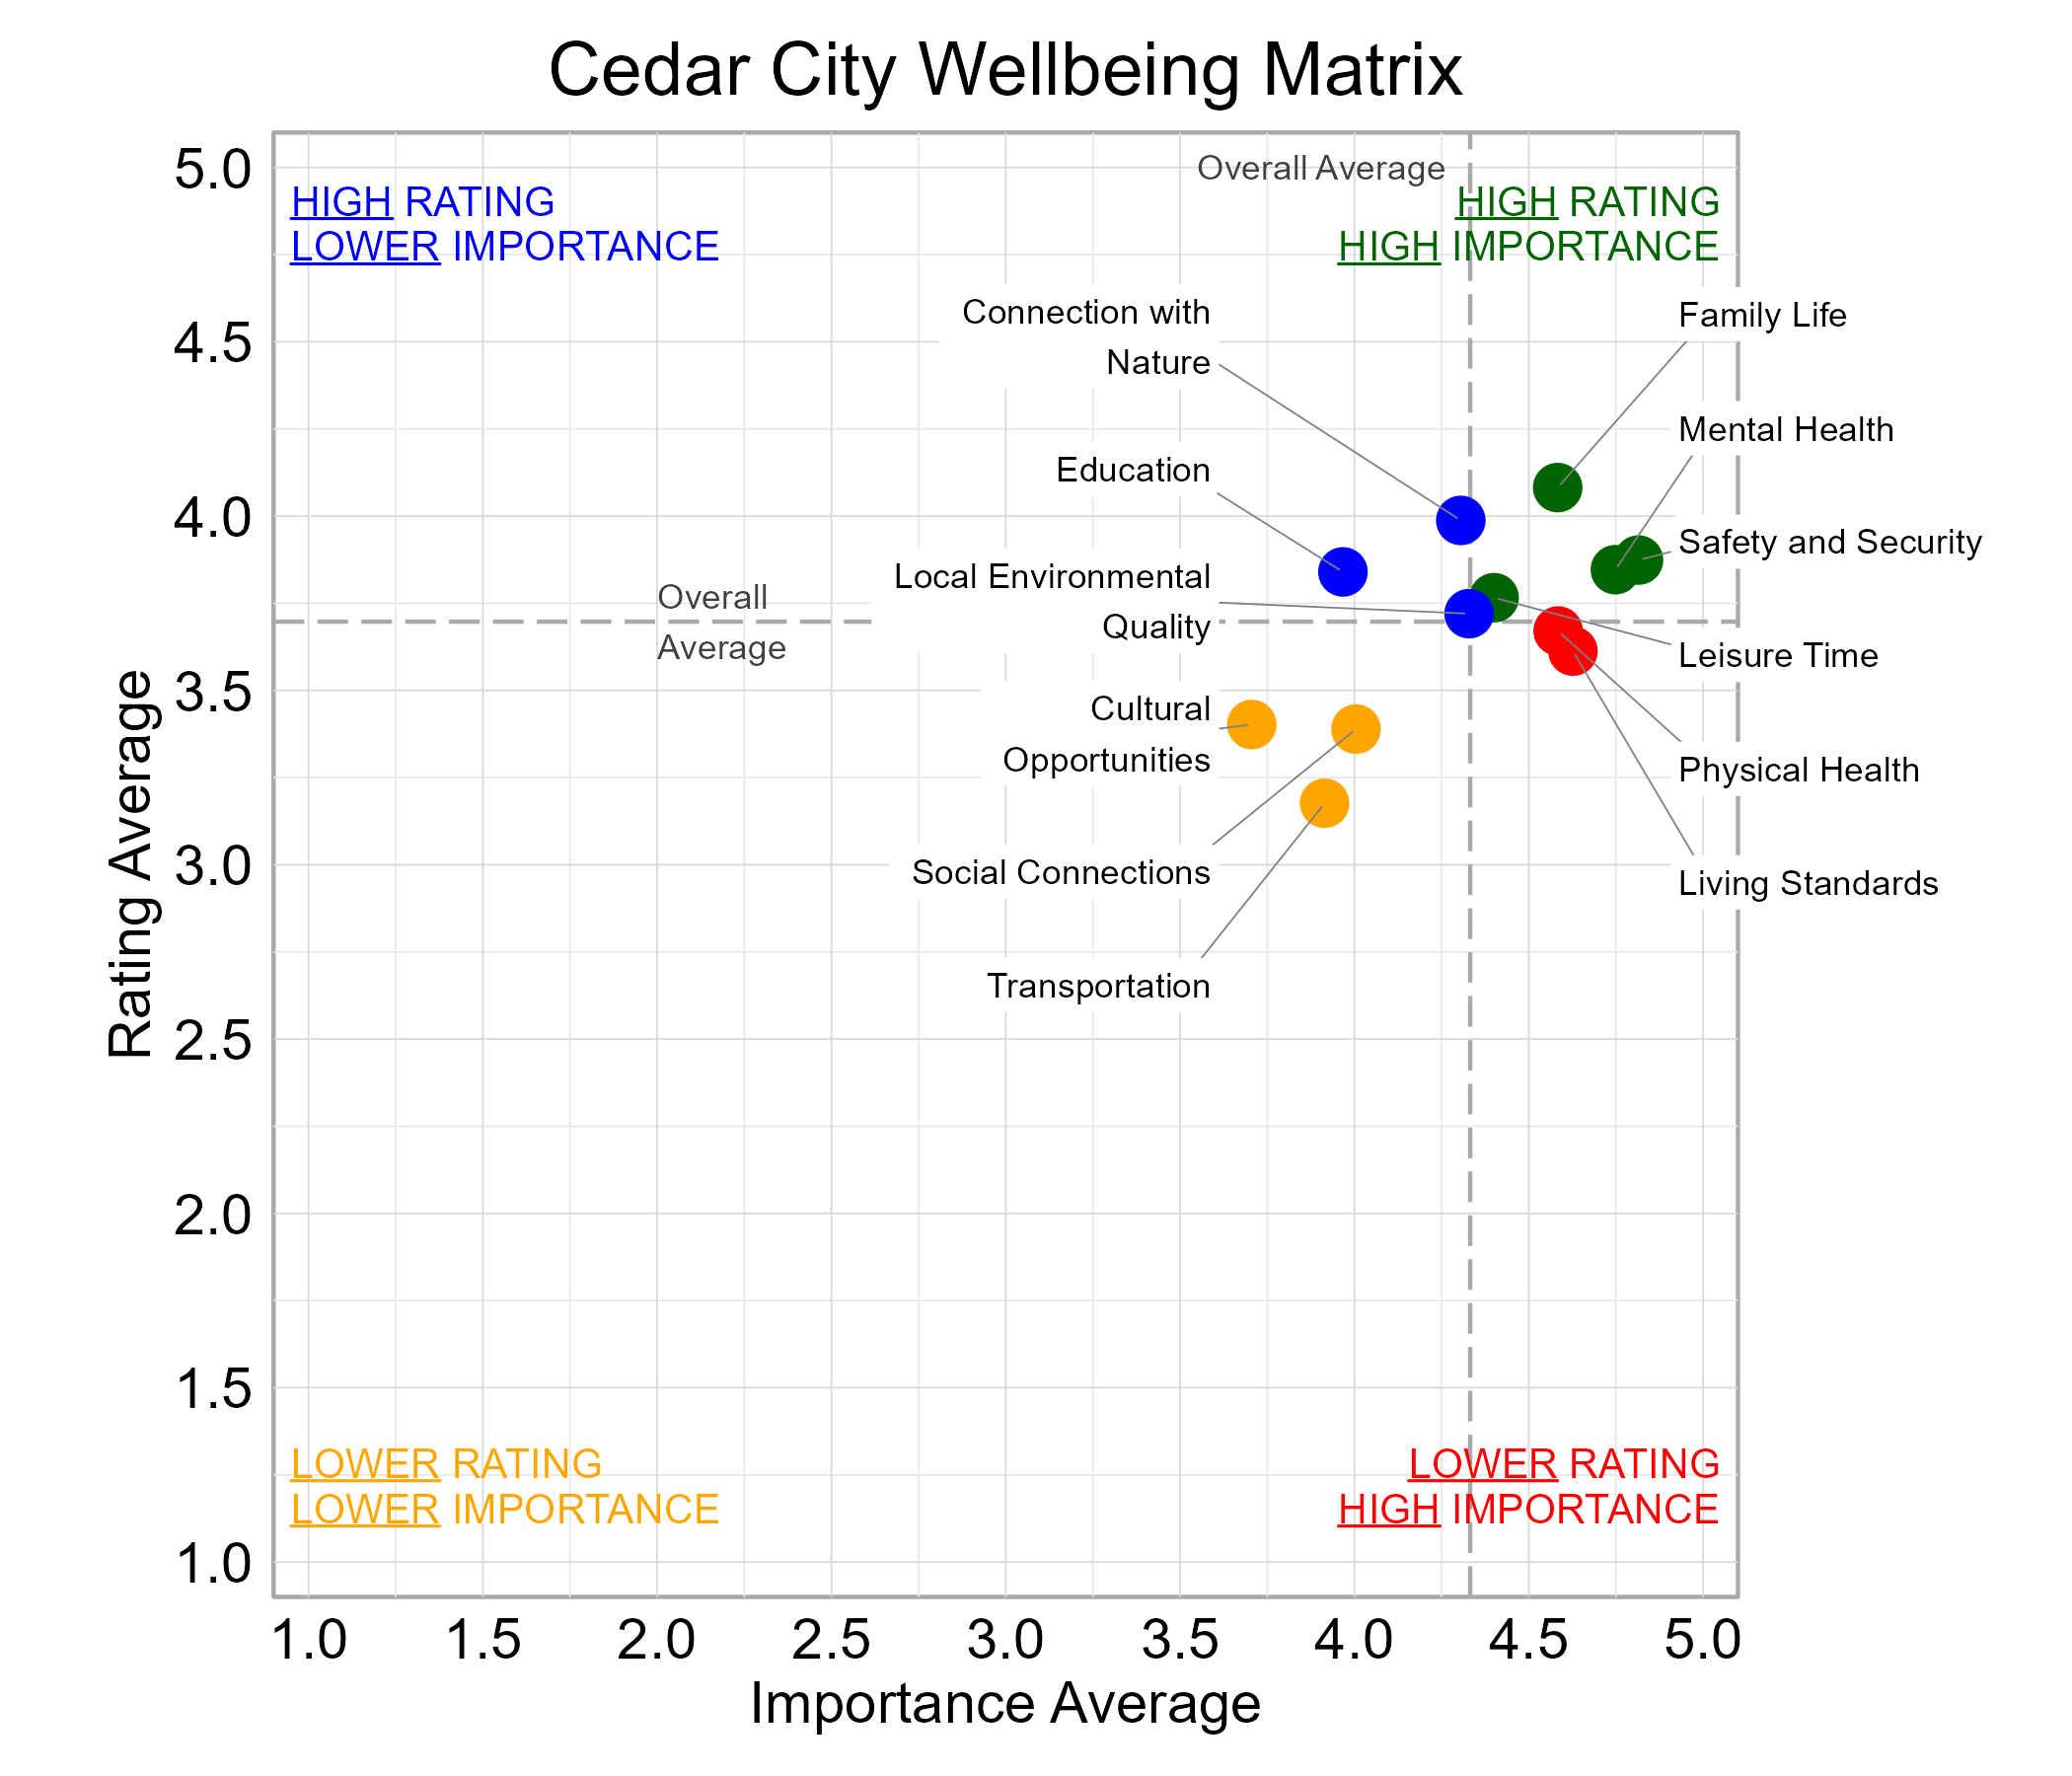
Wellbeing Matrix for Cedar City
The graph below illustrates the relationship between the average rating and the average importance of wellbeing domains for survey respondents from Cedar City. Family Life, Leisure Time, Mental Health, and Safety and Security were highly important and rated above average among the domains. Living Standards and Physical Health fell in the “red zone” of higher importance and lower ratings.
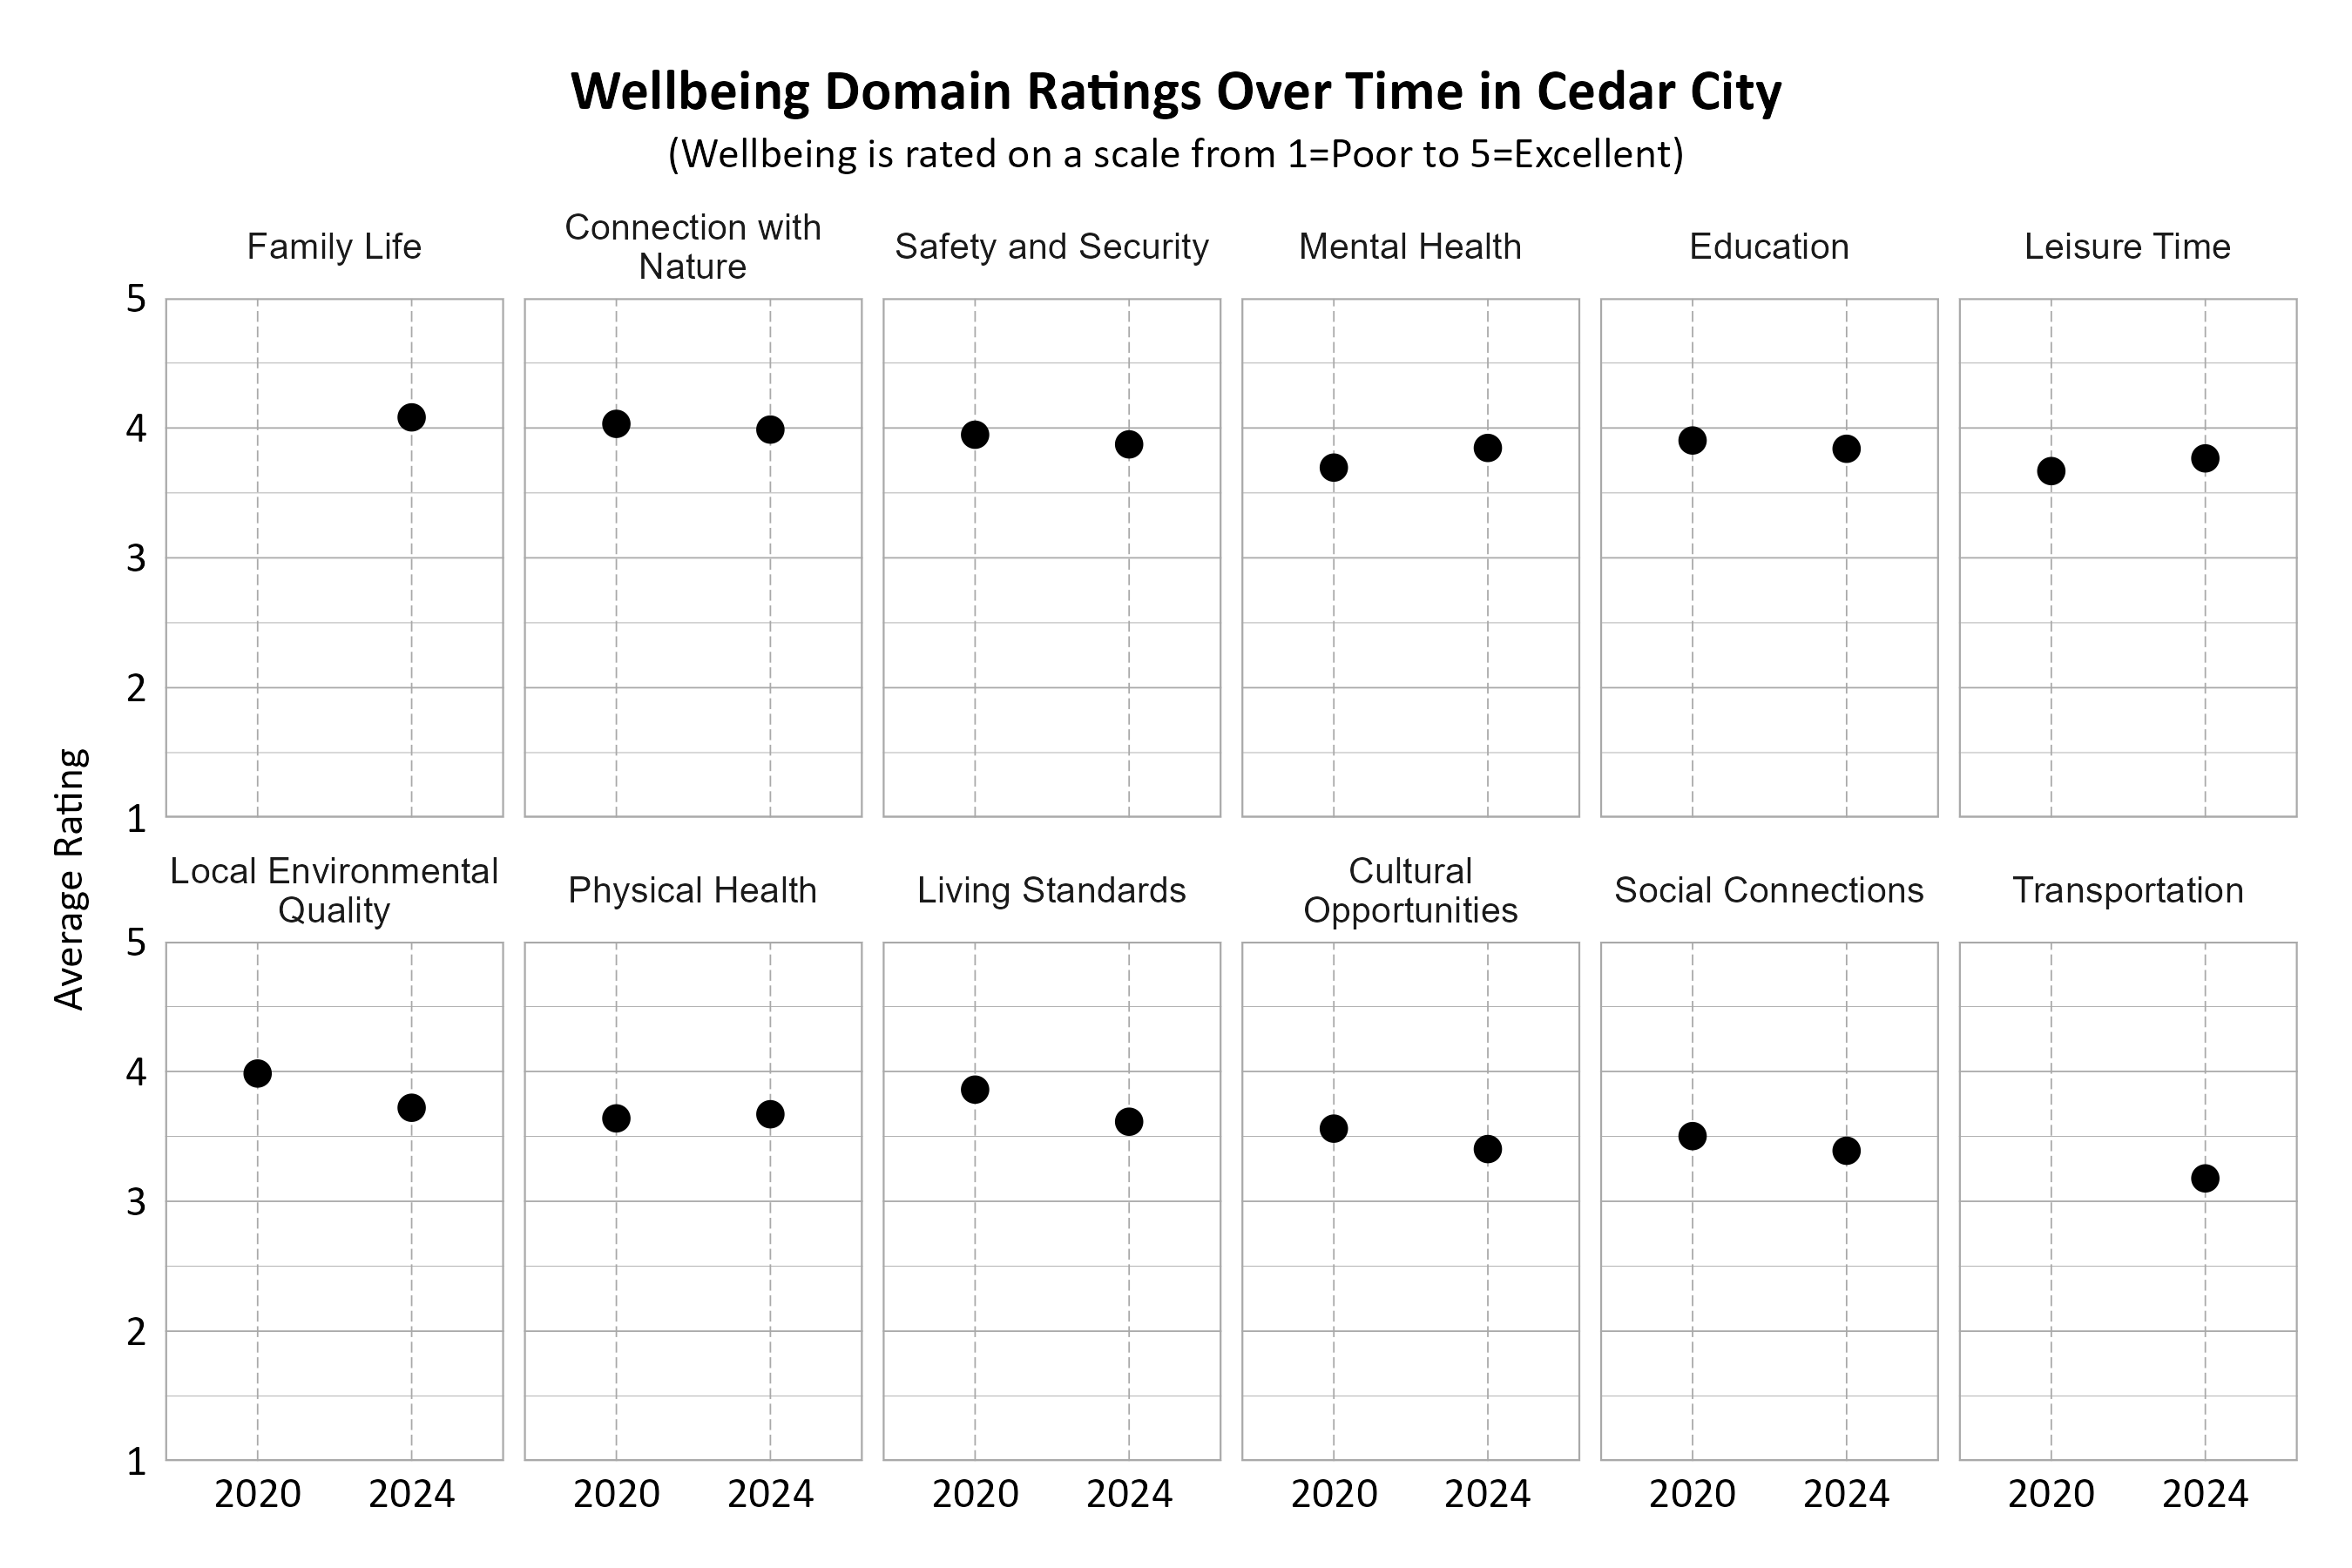
Wellbeing Domains Over Time in Cedar City
The graphs below show how the domains were rated over the years by Cedar City residents. The number of respondents changed over time. Note that the two domains Family Life and Transportation were new categories in the 2024 survey and were not measured in previous years. Mental Health, Leisure Time, and Physical Health improved in their ratings from 2020 to 2024, while the others declined. Connection with Nature and Safety and Security were consistently highly rated in both survey years.
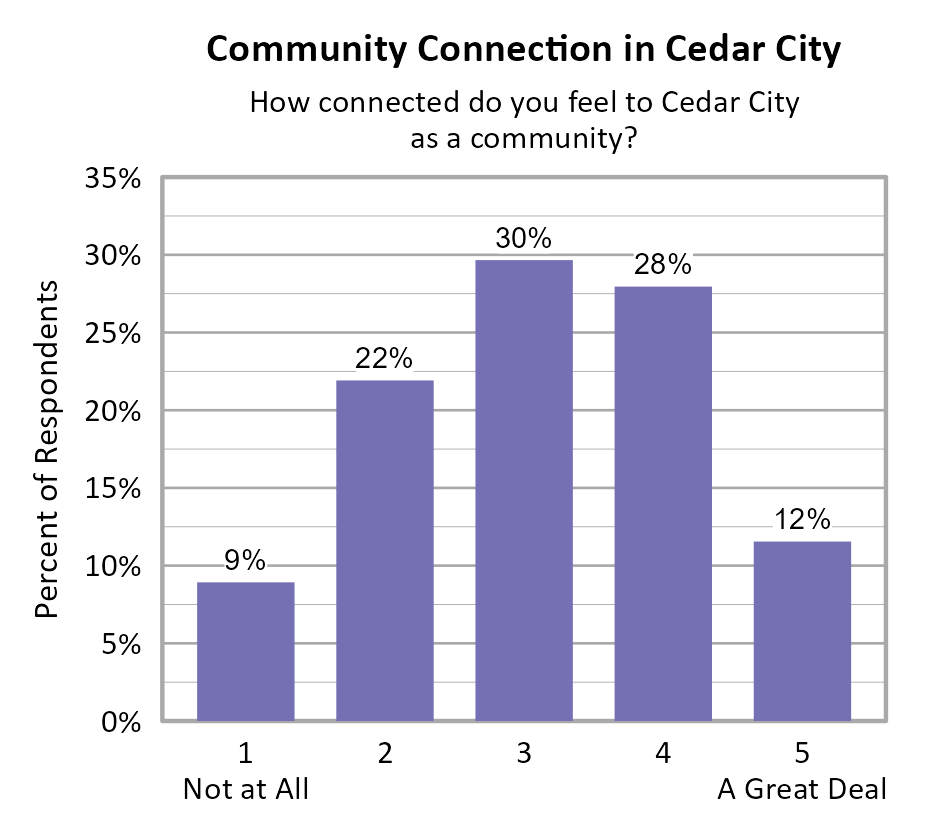
Community Connection in Cedar City
Survey participants were asked about how connected they feel to Cedar City on a 5-point scale from not at all (1) to a great deal (5), and the average score of all respondents was 3.11. ZIP code 84720 had a statistically higher community connection score when compared to ZIP code 84721.
When comparing survey data from Cedar City over the years as shown in the information below, we can see that the average community connection score remained nearly the same between 2020 and 2024.
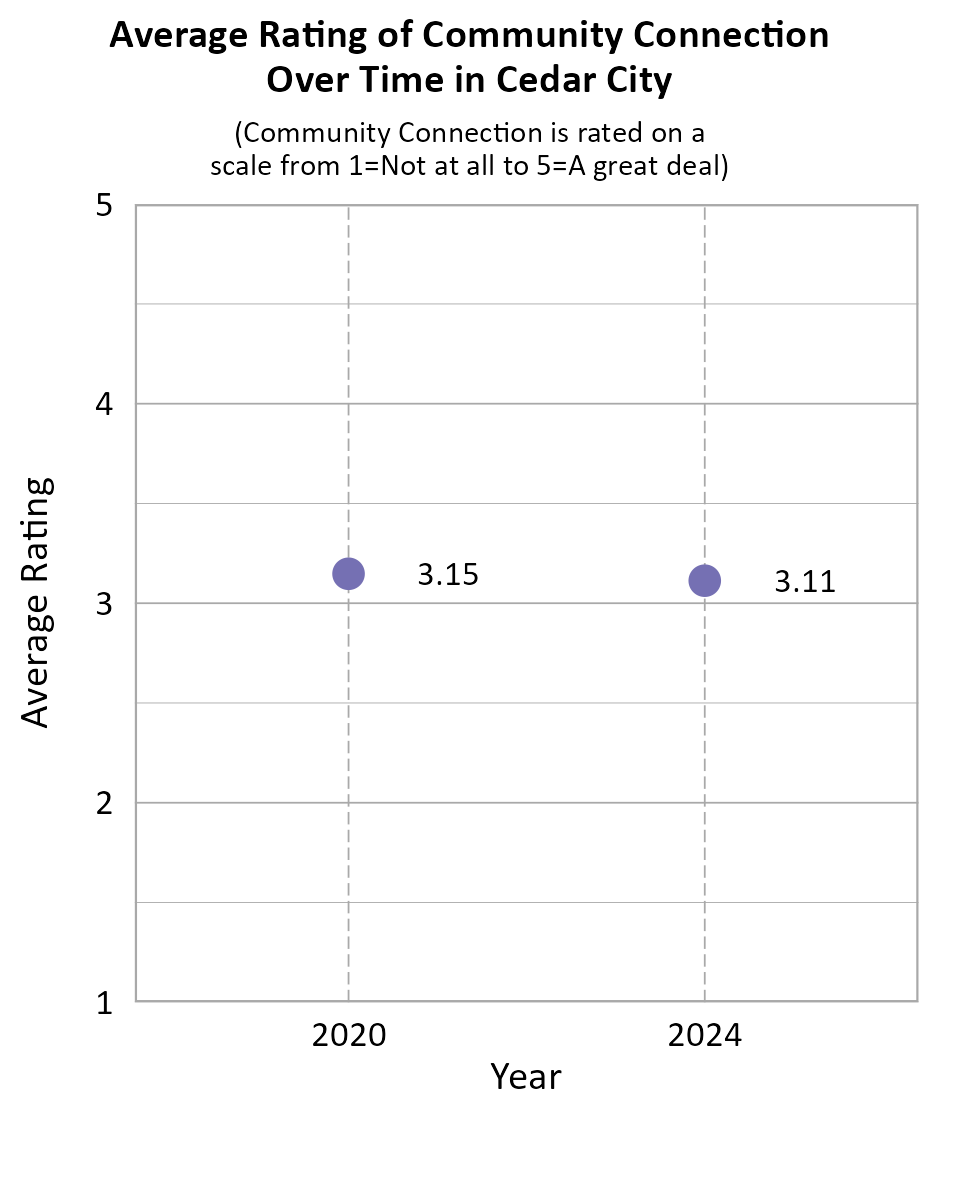
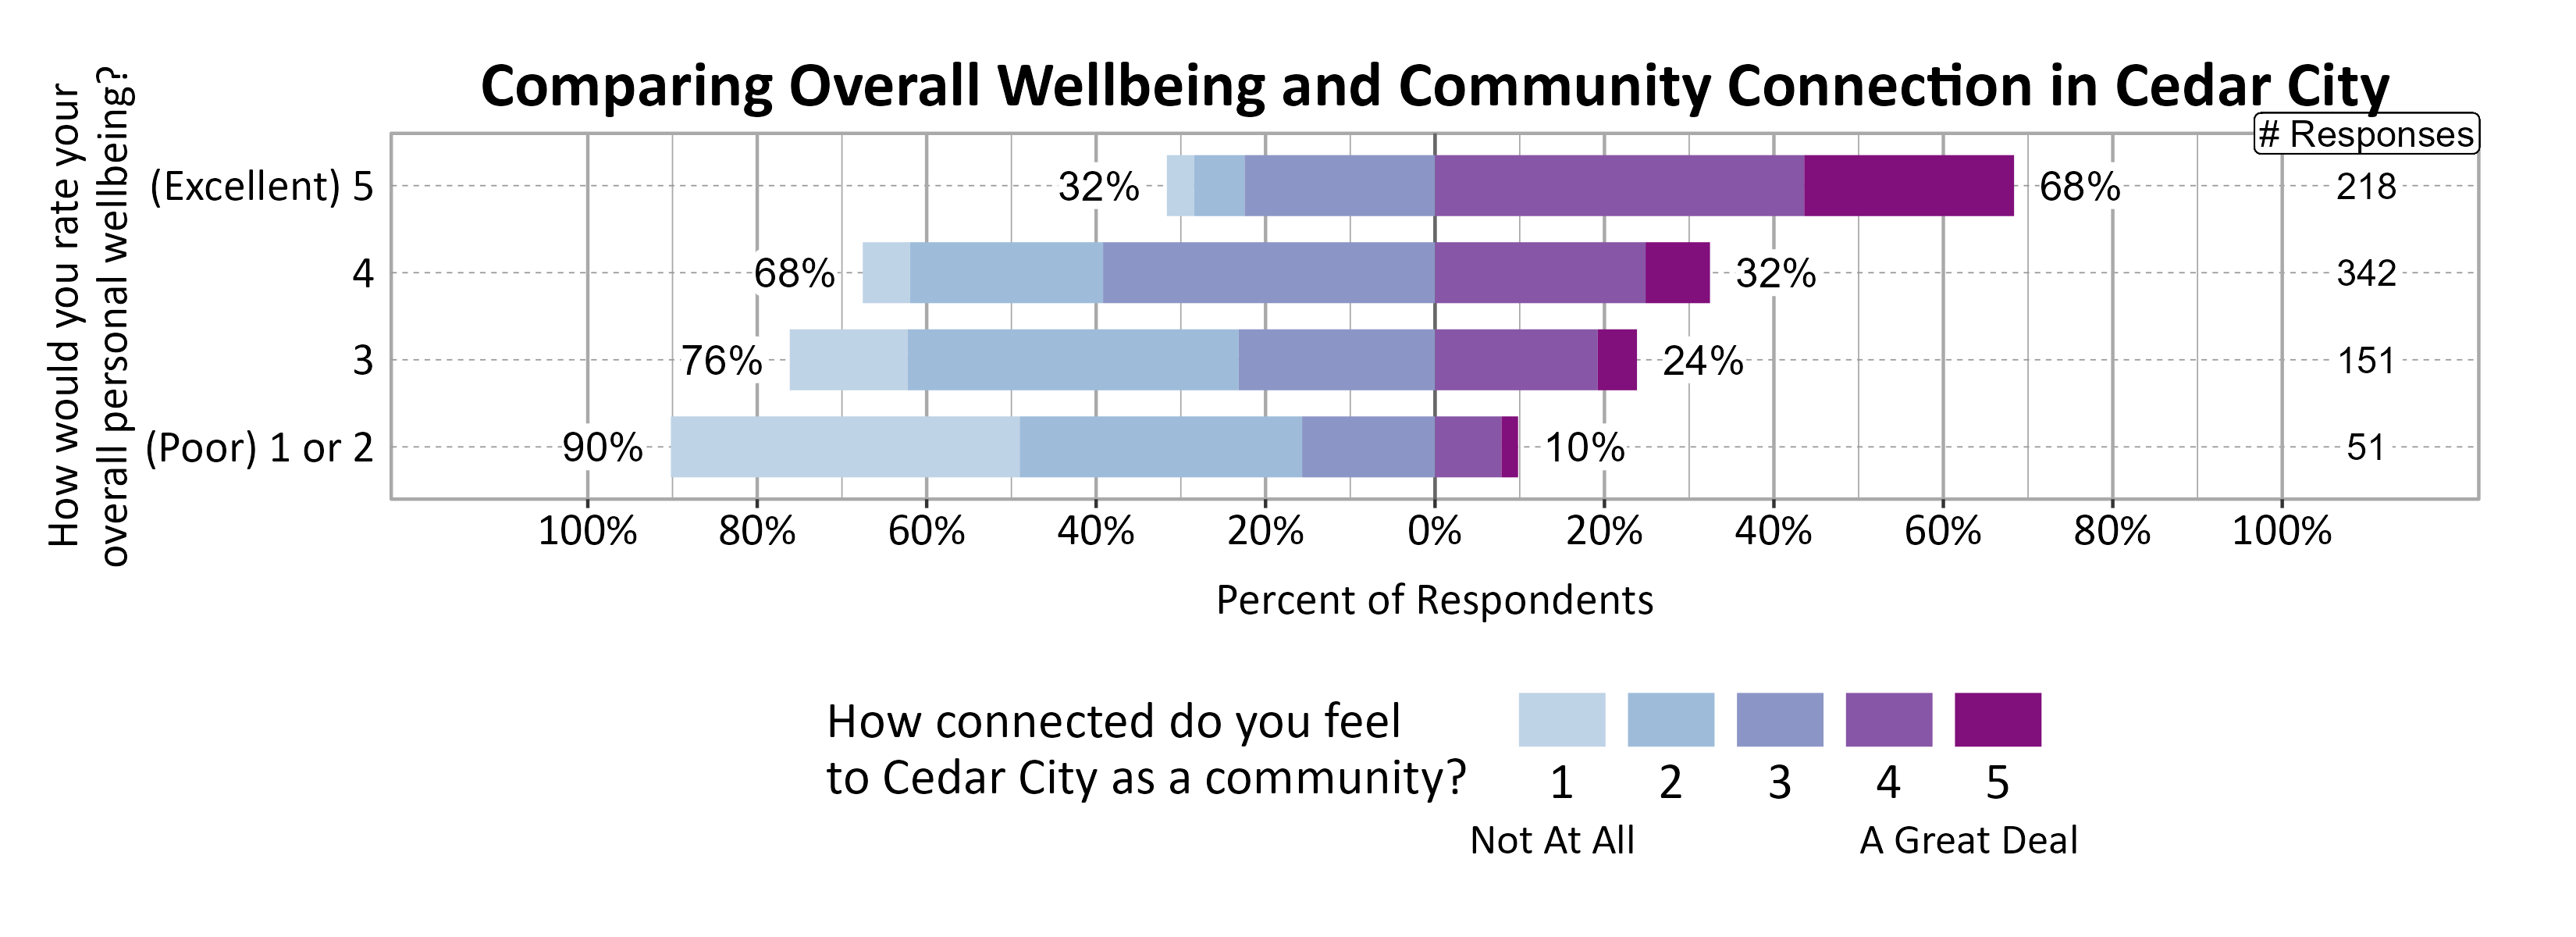
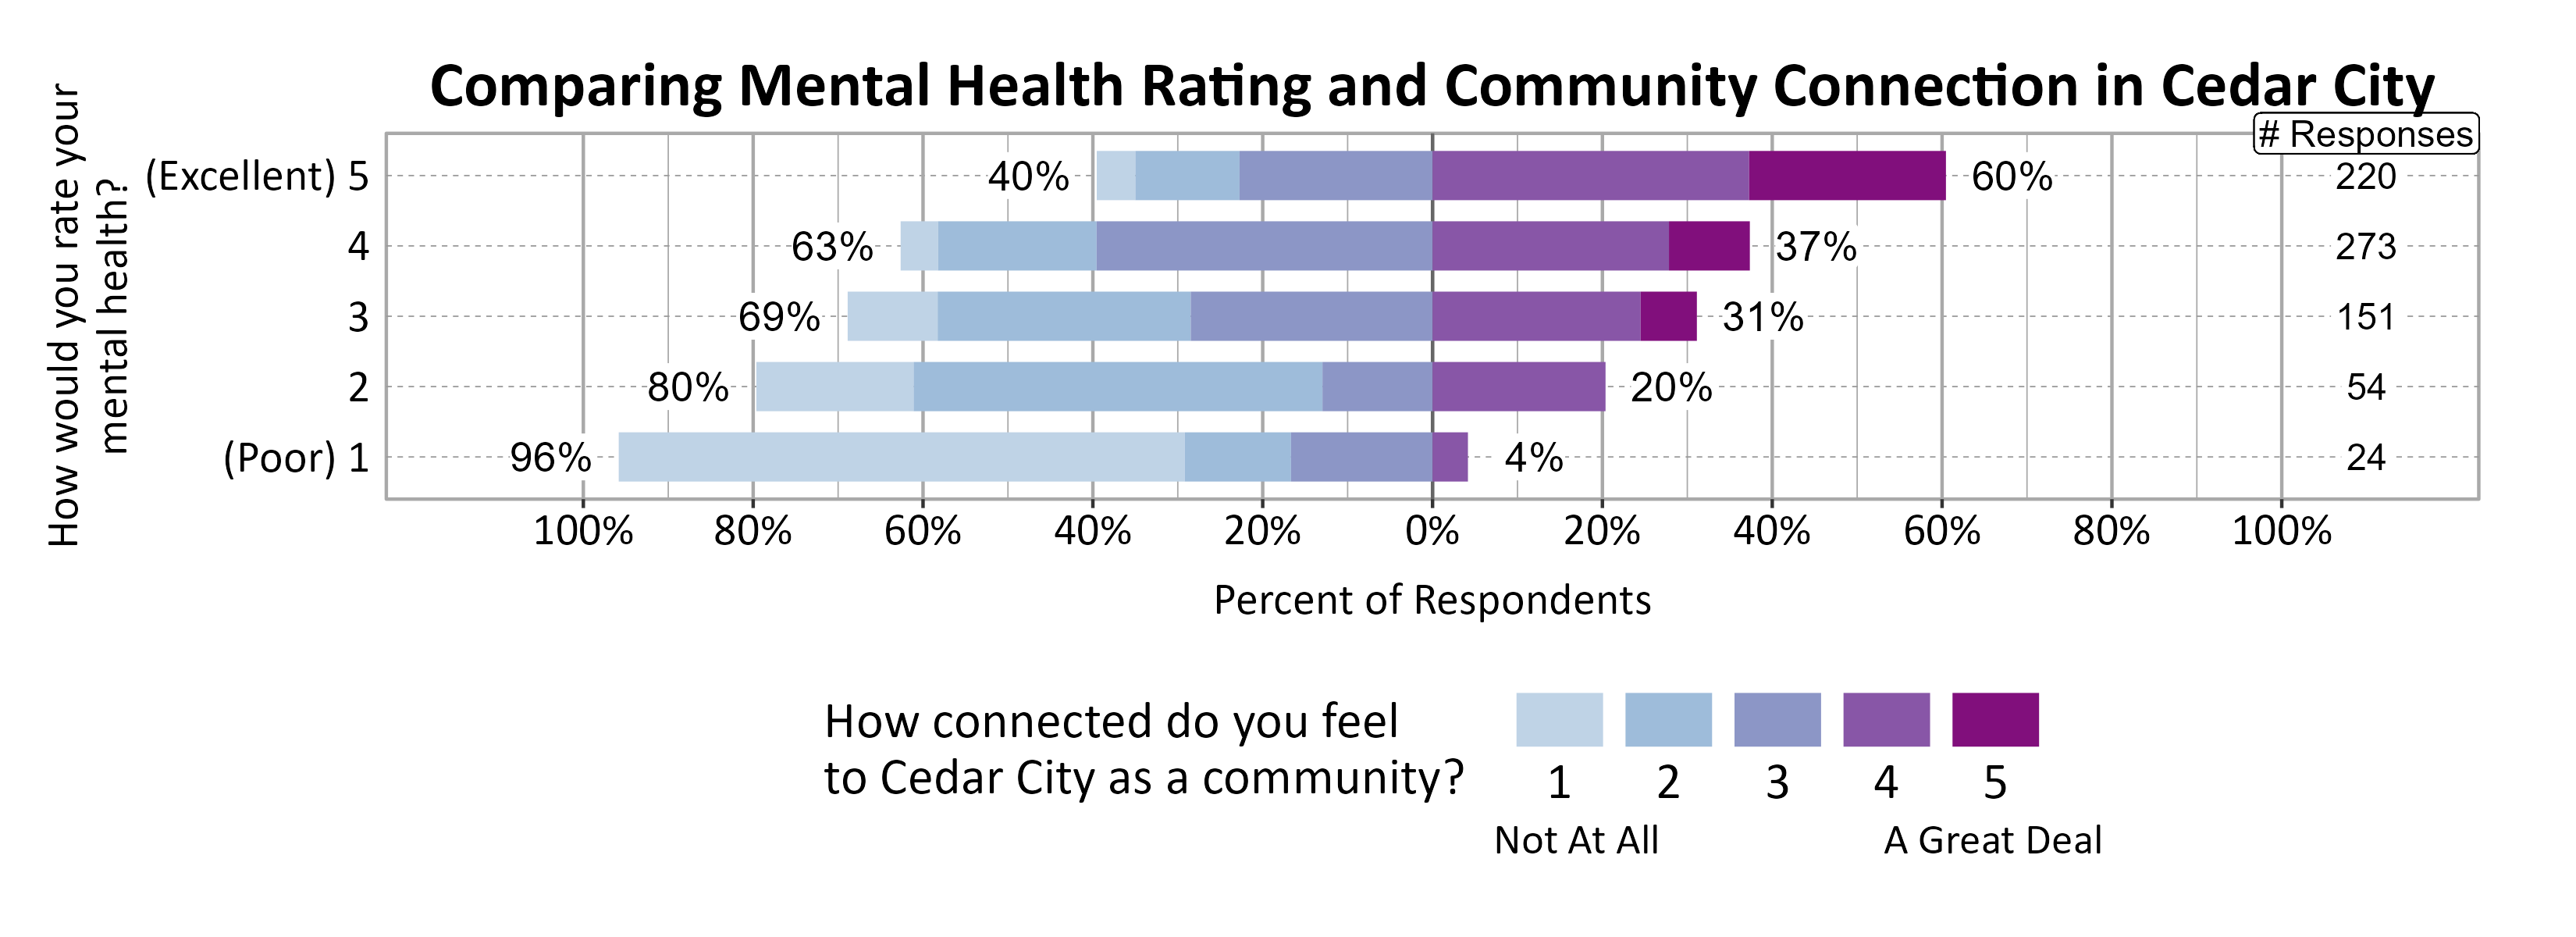
A positive relationship was found between individuals’ community connection and overall personal wellbeing as well as mental health.
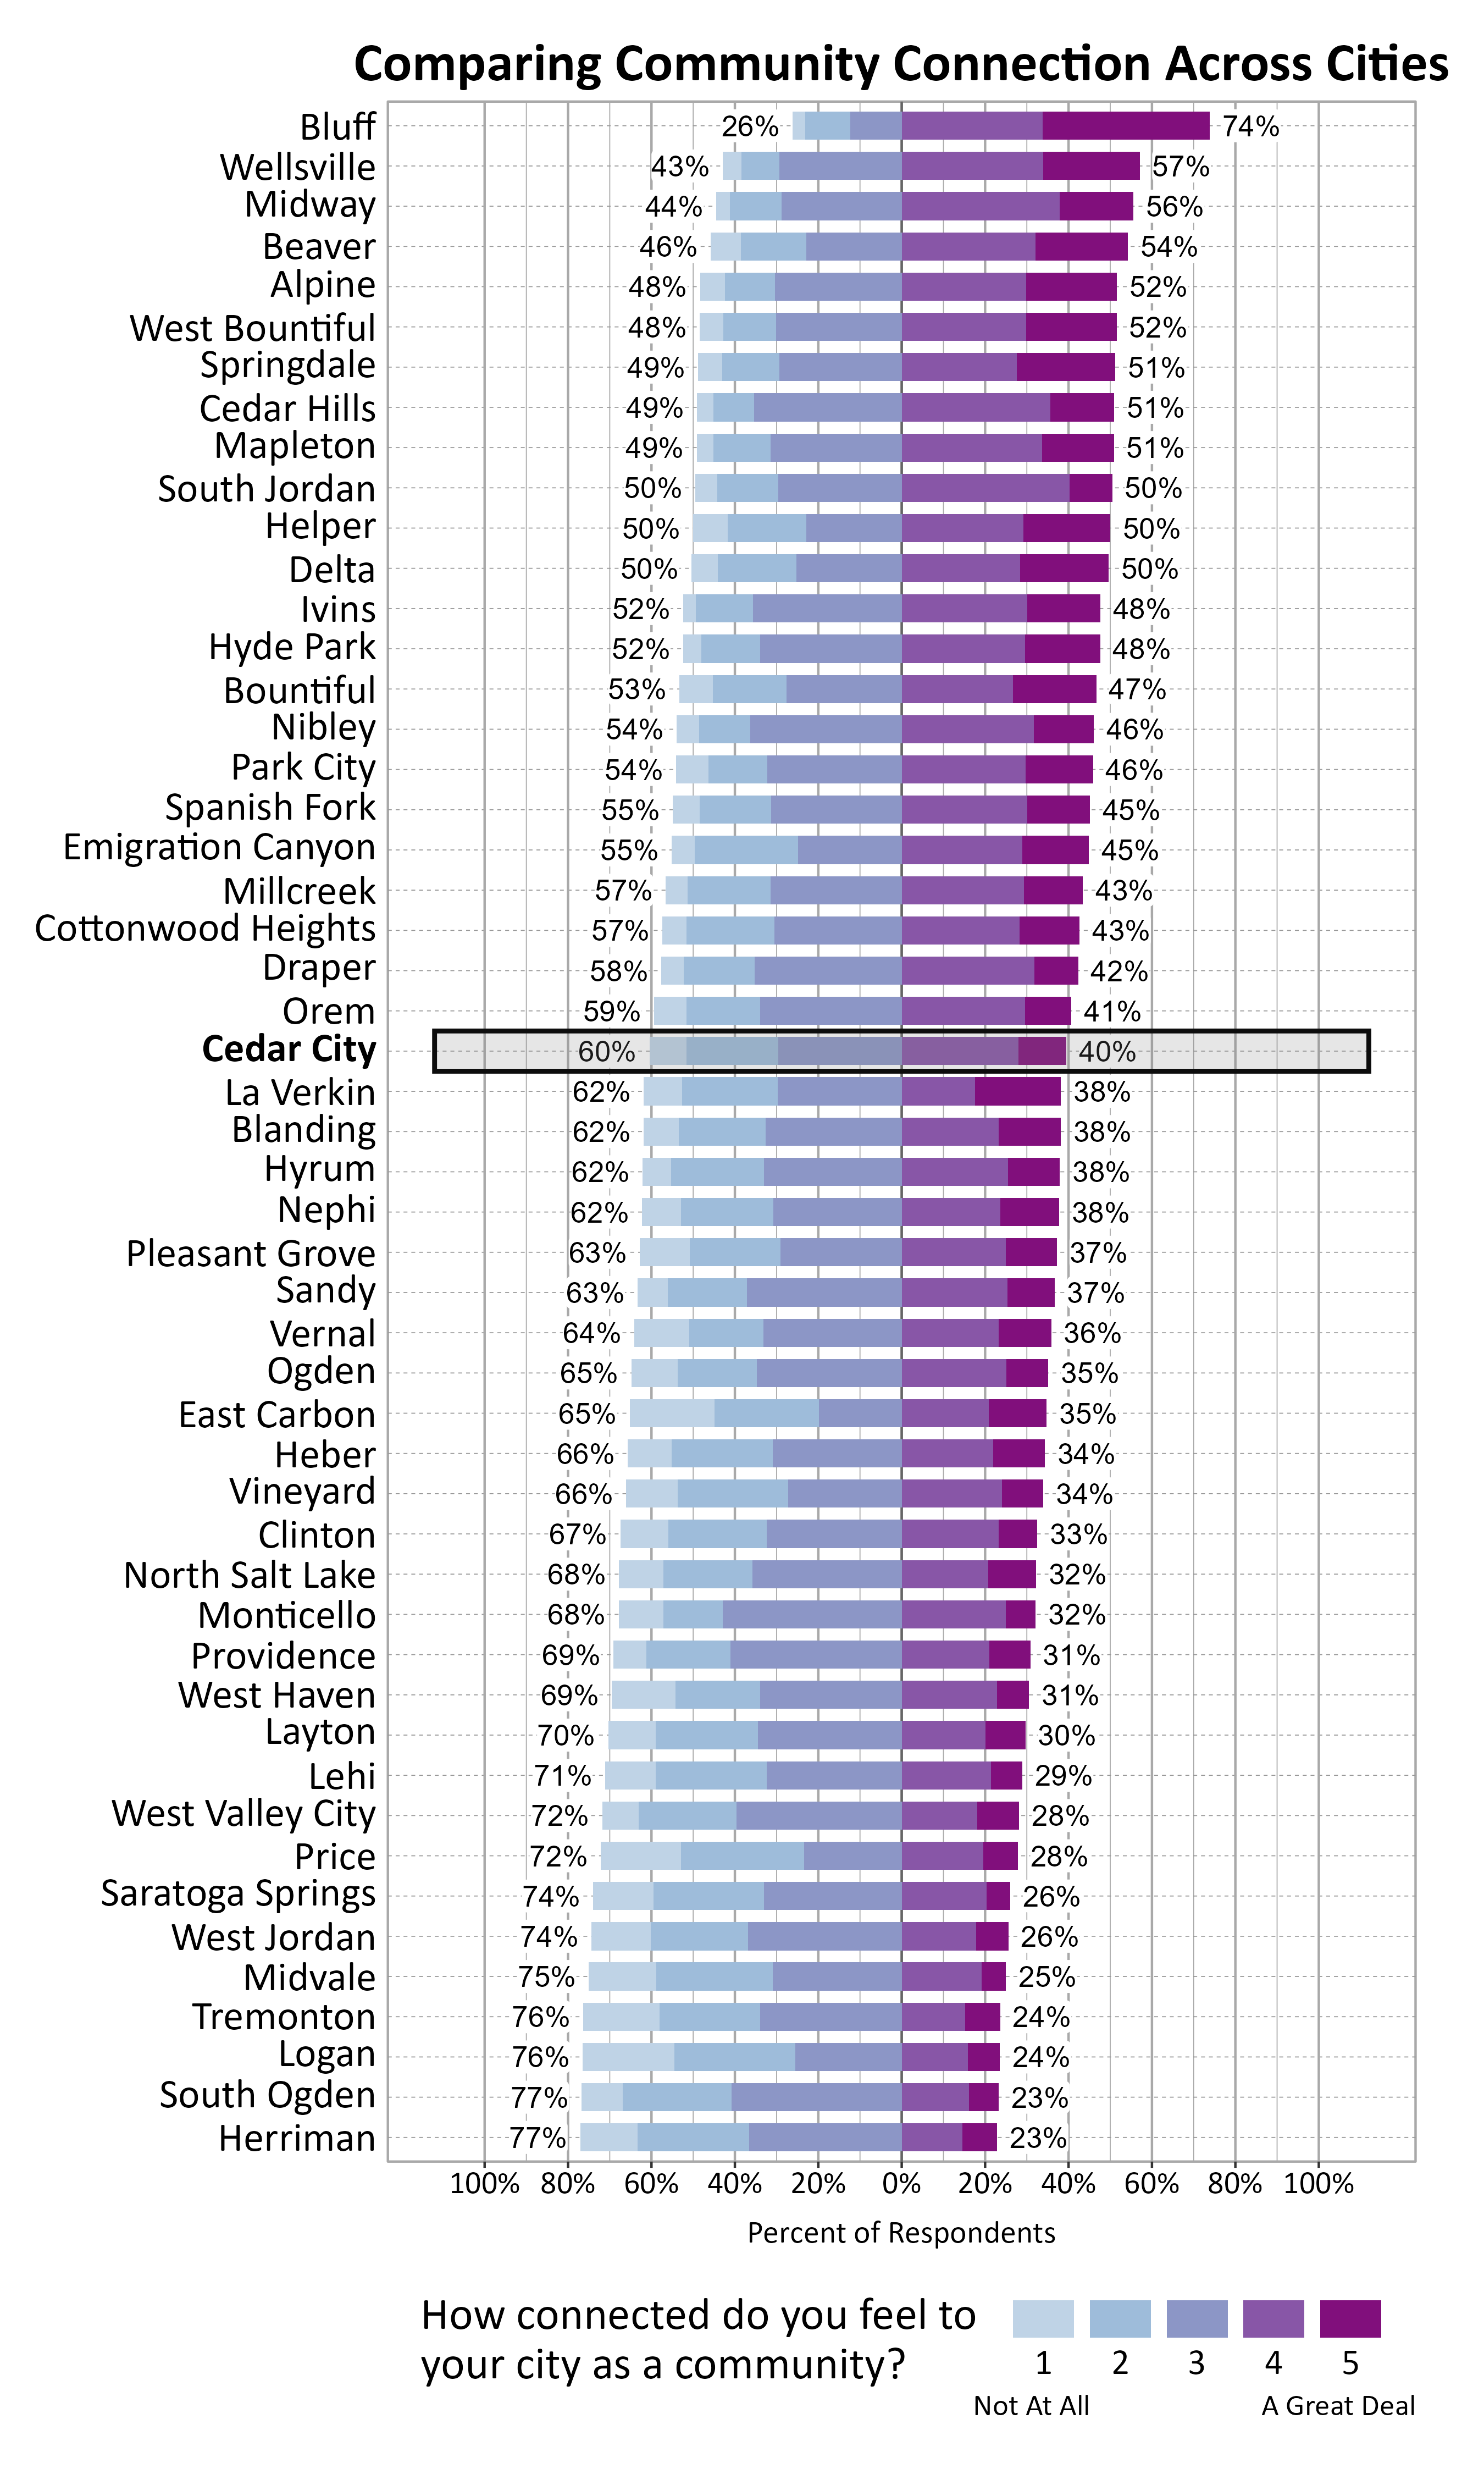
The graph below shows how Wellbeing Project cities and towns compare on feelings of community connection based on the percentage of respondents who answered 4 or a 5 on a 5-point scale from “not at all” to “a great deal” connected to their city or town. Cedar City ranked 24 out of the 51 cities that participated.
Participation in Recreation and Nature-Related Activities
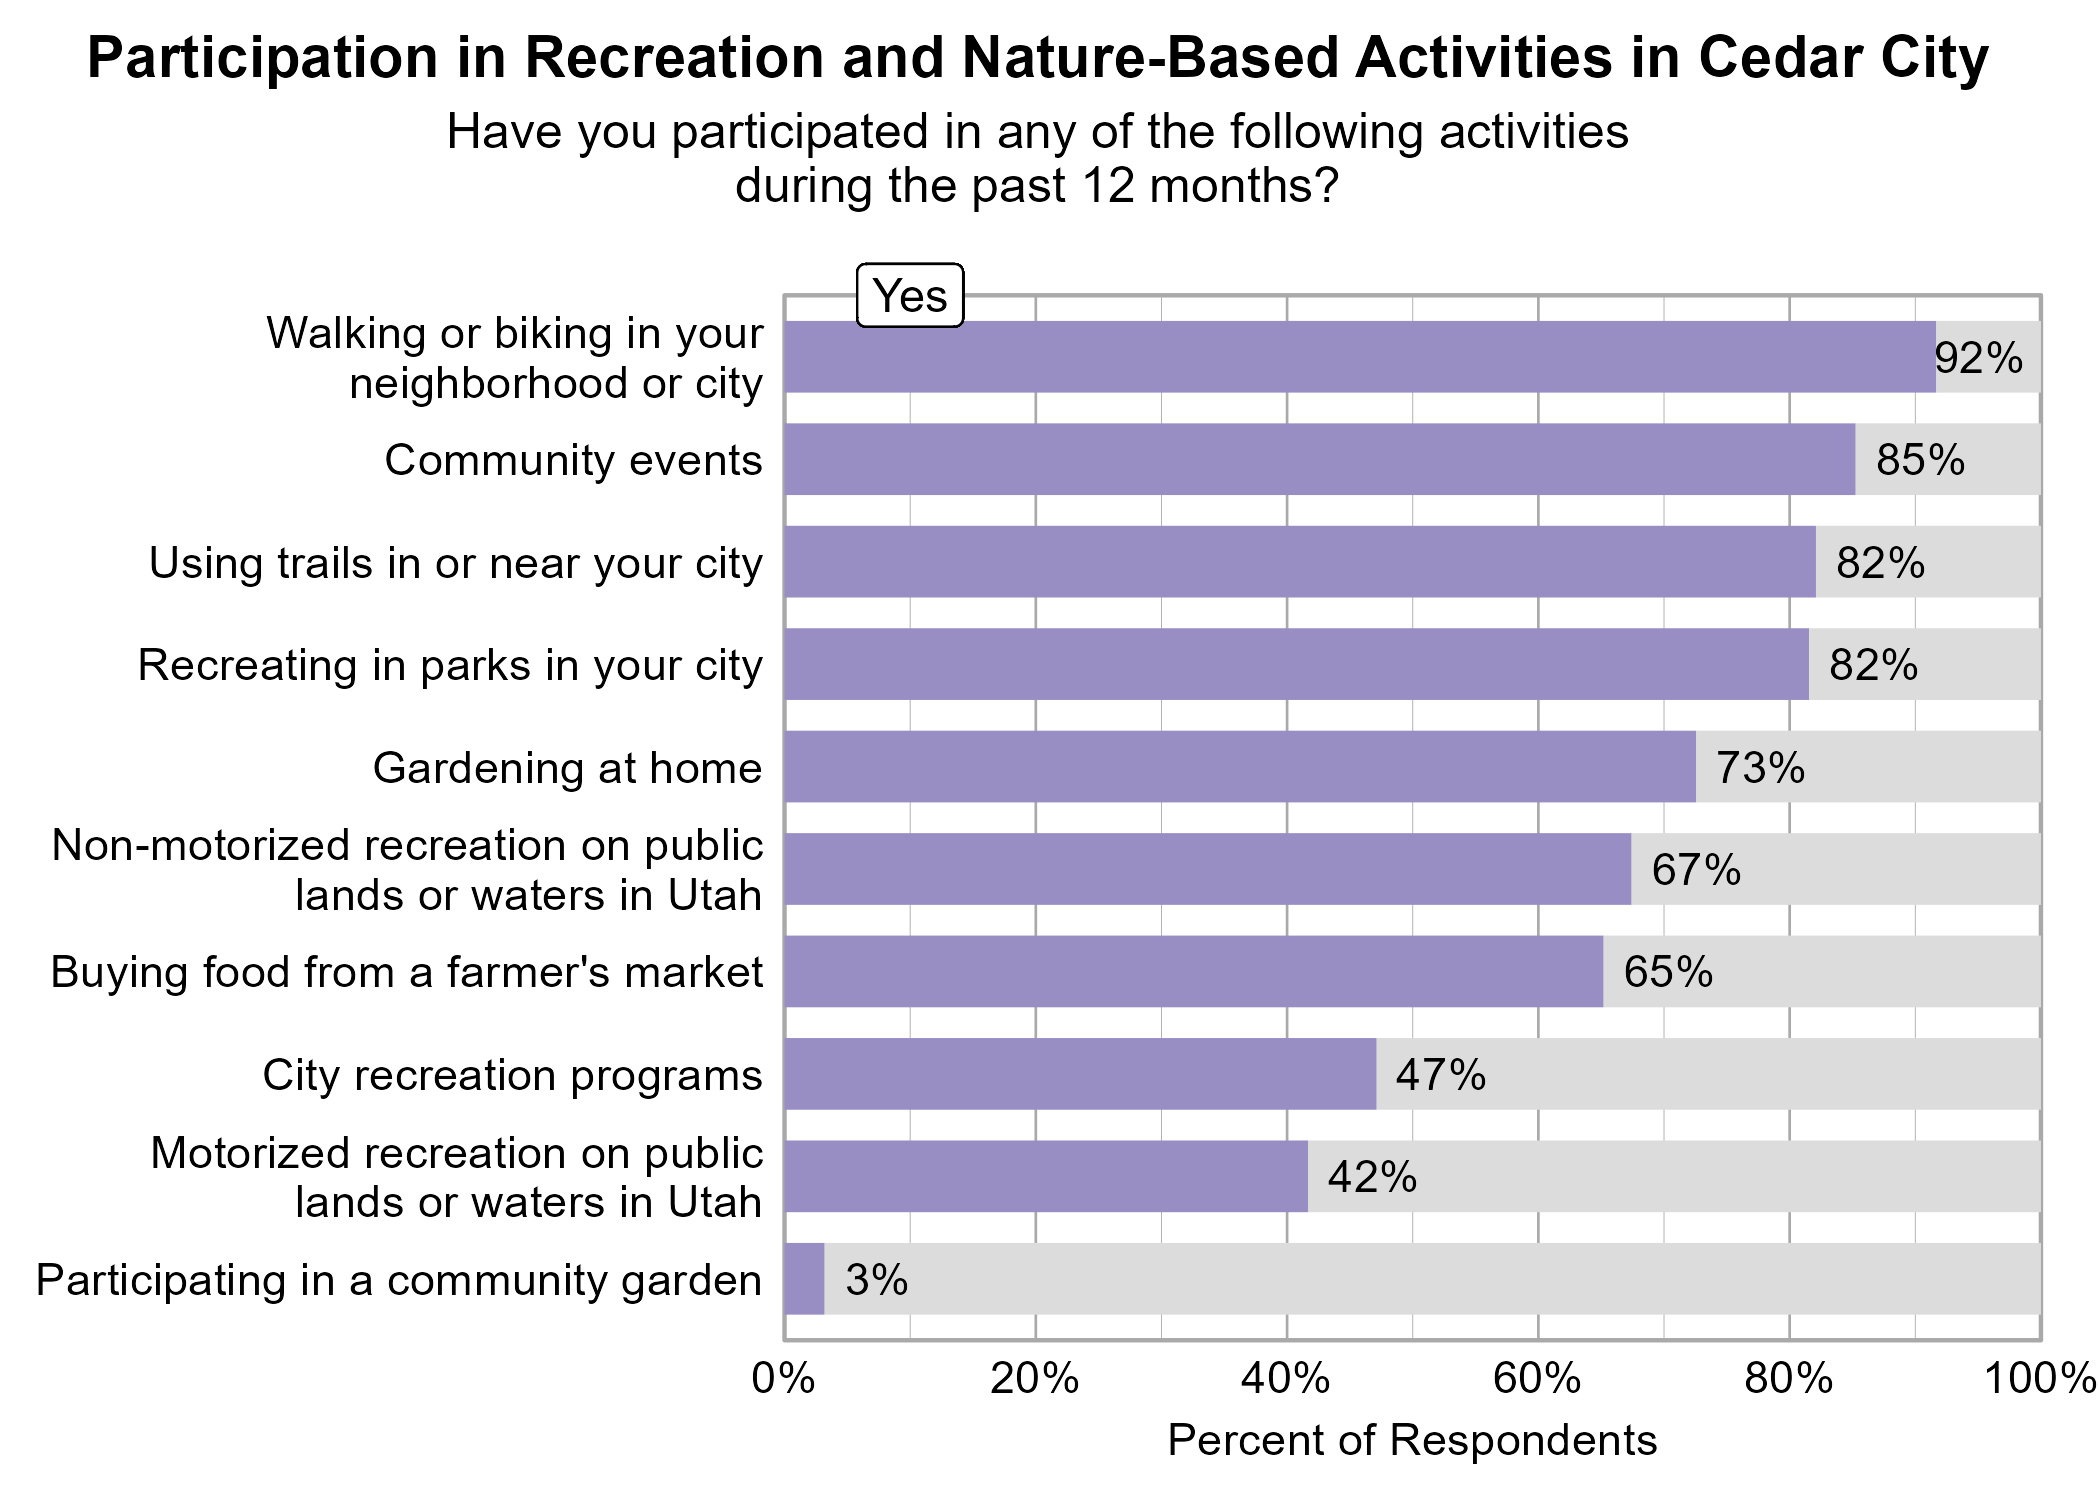
Respondents were asked to indicate whether or not they participated in various activities in the last 12 months. The most popular activities were walking or biking in your neighborhood or city (92%), community events (85%), using trails in or near your city (82%), and recreating in parks in your city (82%).
Buying food from a farmer's market, participating in city recreation programs, gardening at home, motorized recreation on public lands or waters in Utah, using trails in or near your city, and walking or biking in your neighborhood or city were significantly related to higher ratings of personal wellbeing.
Participating in community events, motorized recreation on public lands or waters in Utah, using trails in or near your city, and walking or biking in your neighborhood or city were significantly related to higher ratings of community wellbeing.
Buying food from a farmer's market, participating in city recreation programs, participating in community events, gardening at home, motorized recreation on public lands or waters in Utah, recreating in parks in your city, using trails in or near your city, and walking or biking in your neighborhood or city were significantly related to higher ratings of community connection.
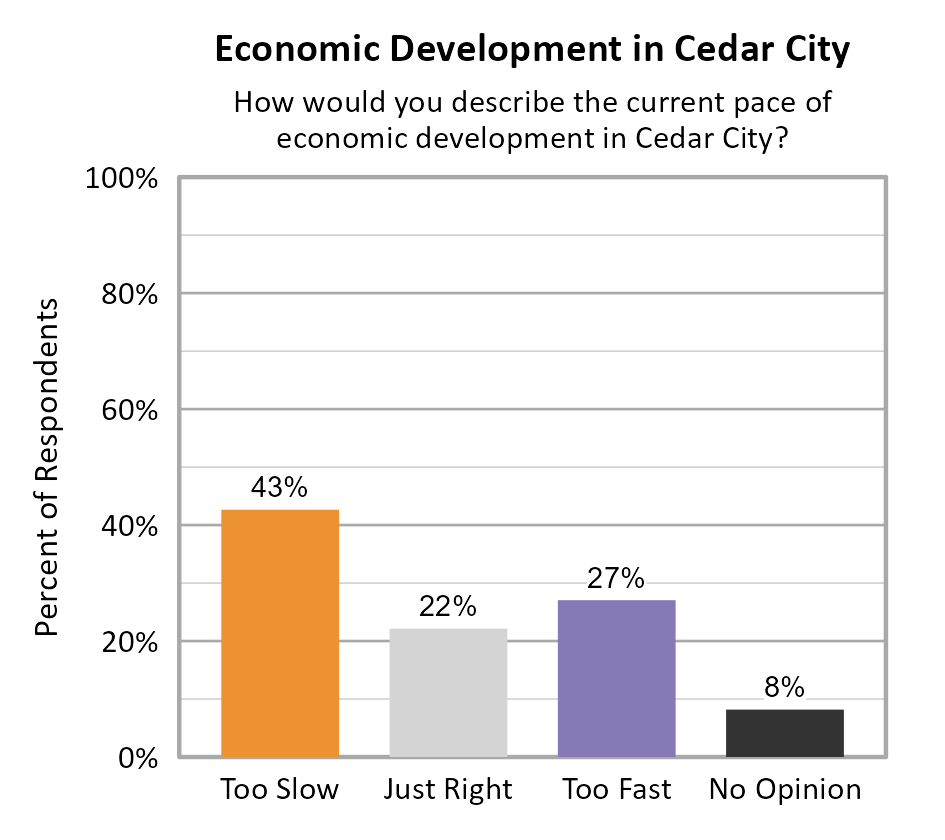
Perspectives on Population Growth and Economic Development
The majority of respondents in Cedar City indicated that they felt the population growth was too fast (80%). For the pace of economic development, the largest proportion of respondents indicated that it was too slow (43%).

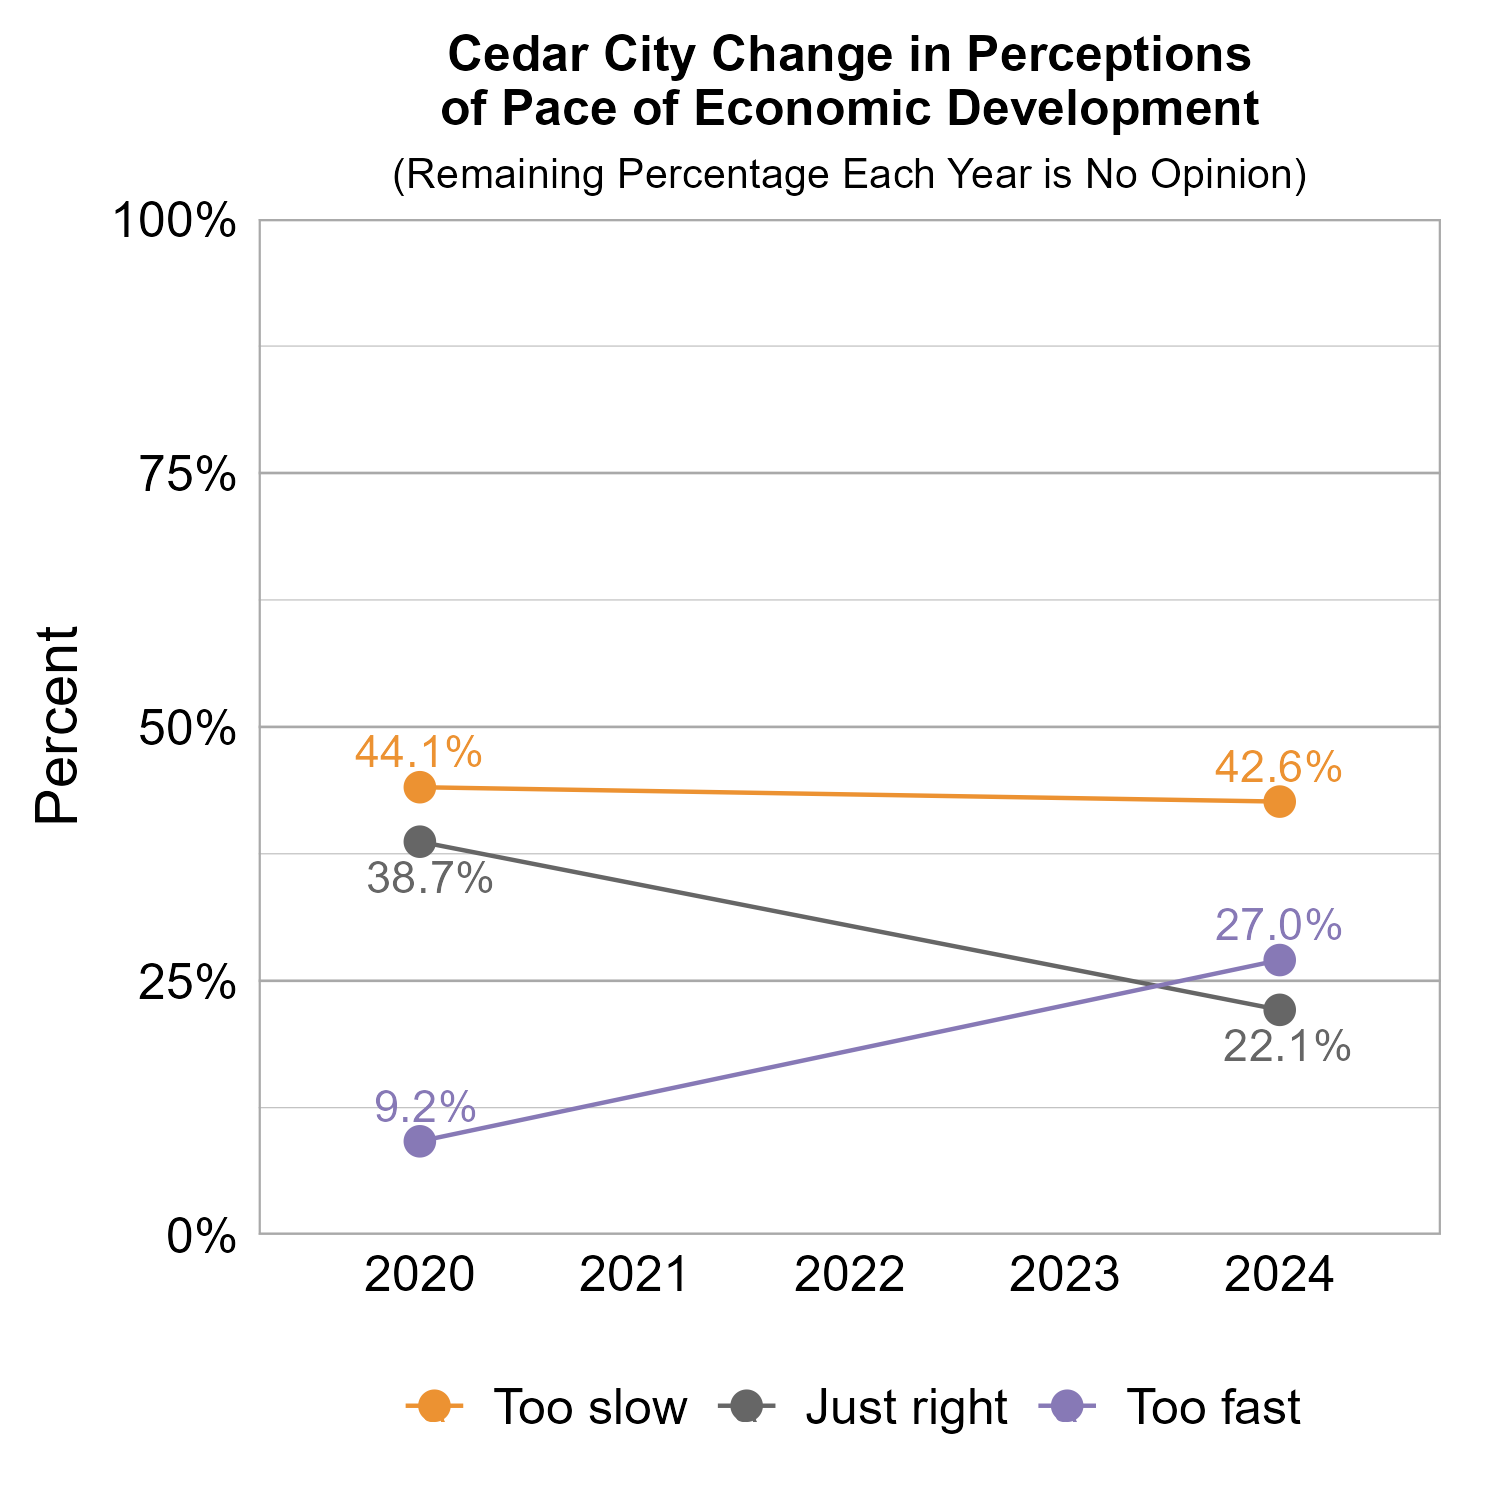
The graphs below show how perceptions of population growth and economic development in Cedar City have varied across recent years of Wellbeing Surveys. Perception that population growth was too fast saw a major increase from 2020 to 2024. Perception that the pace of economic development was too fast also saw a significant increase from 2020 to 2024, but the largest group of respondents still indicated they thought it was too slow for both years.

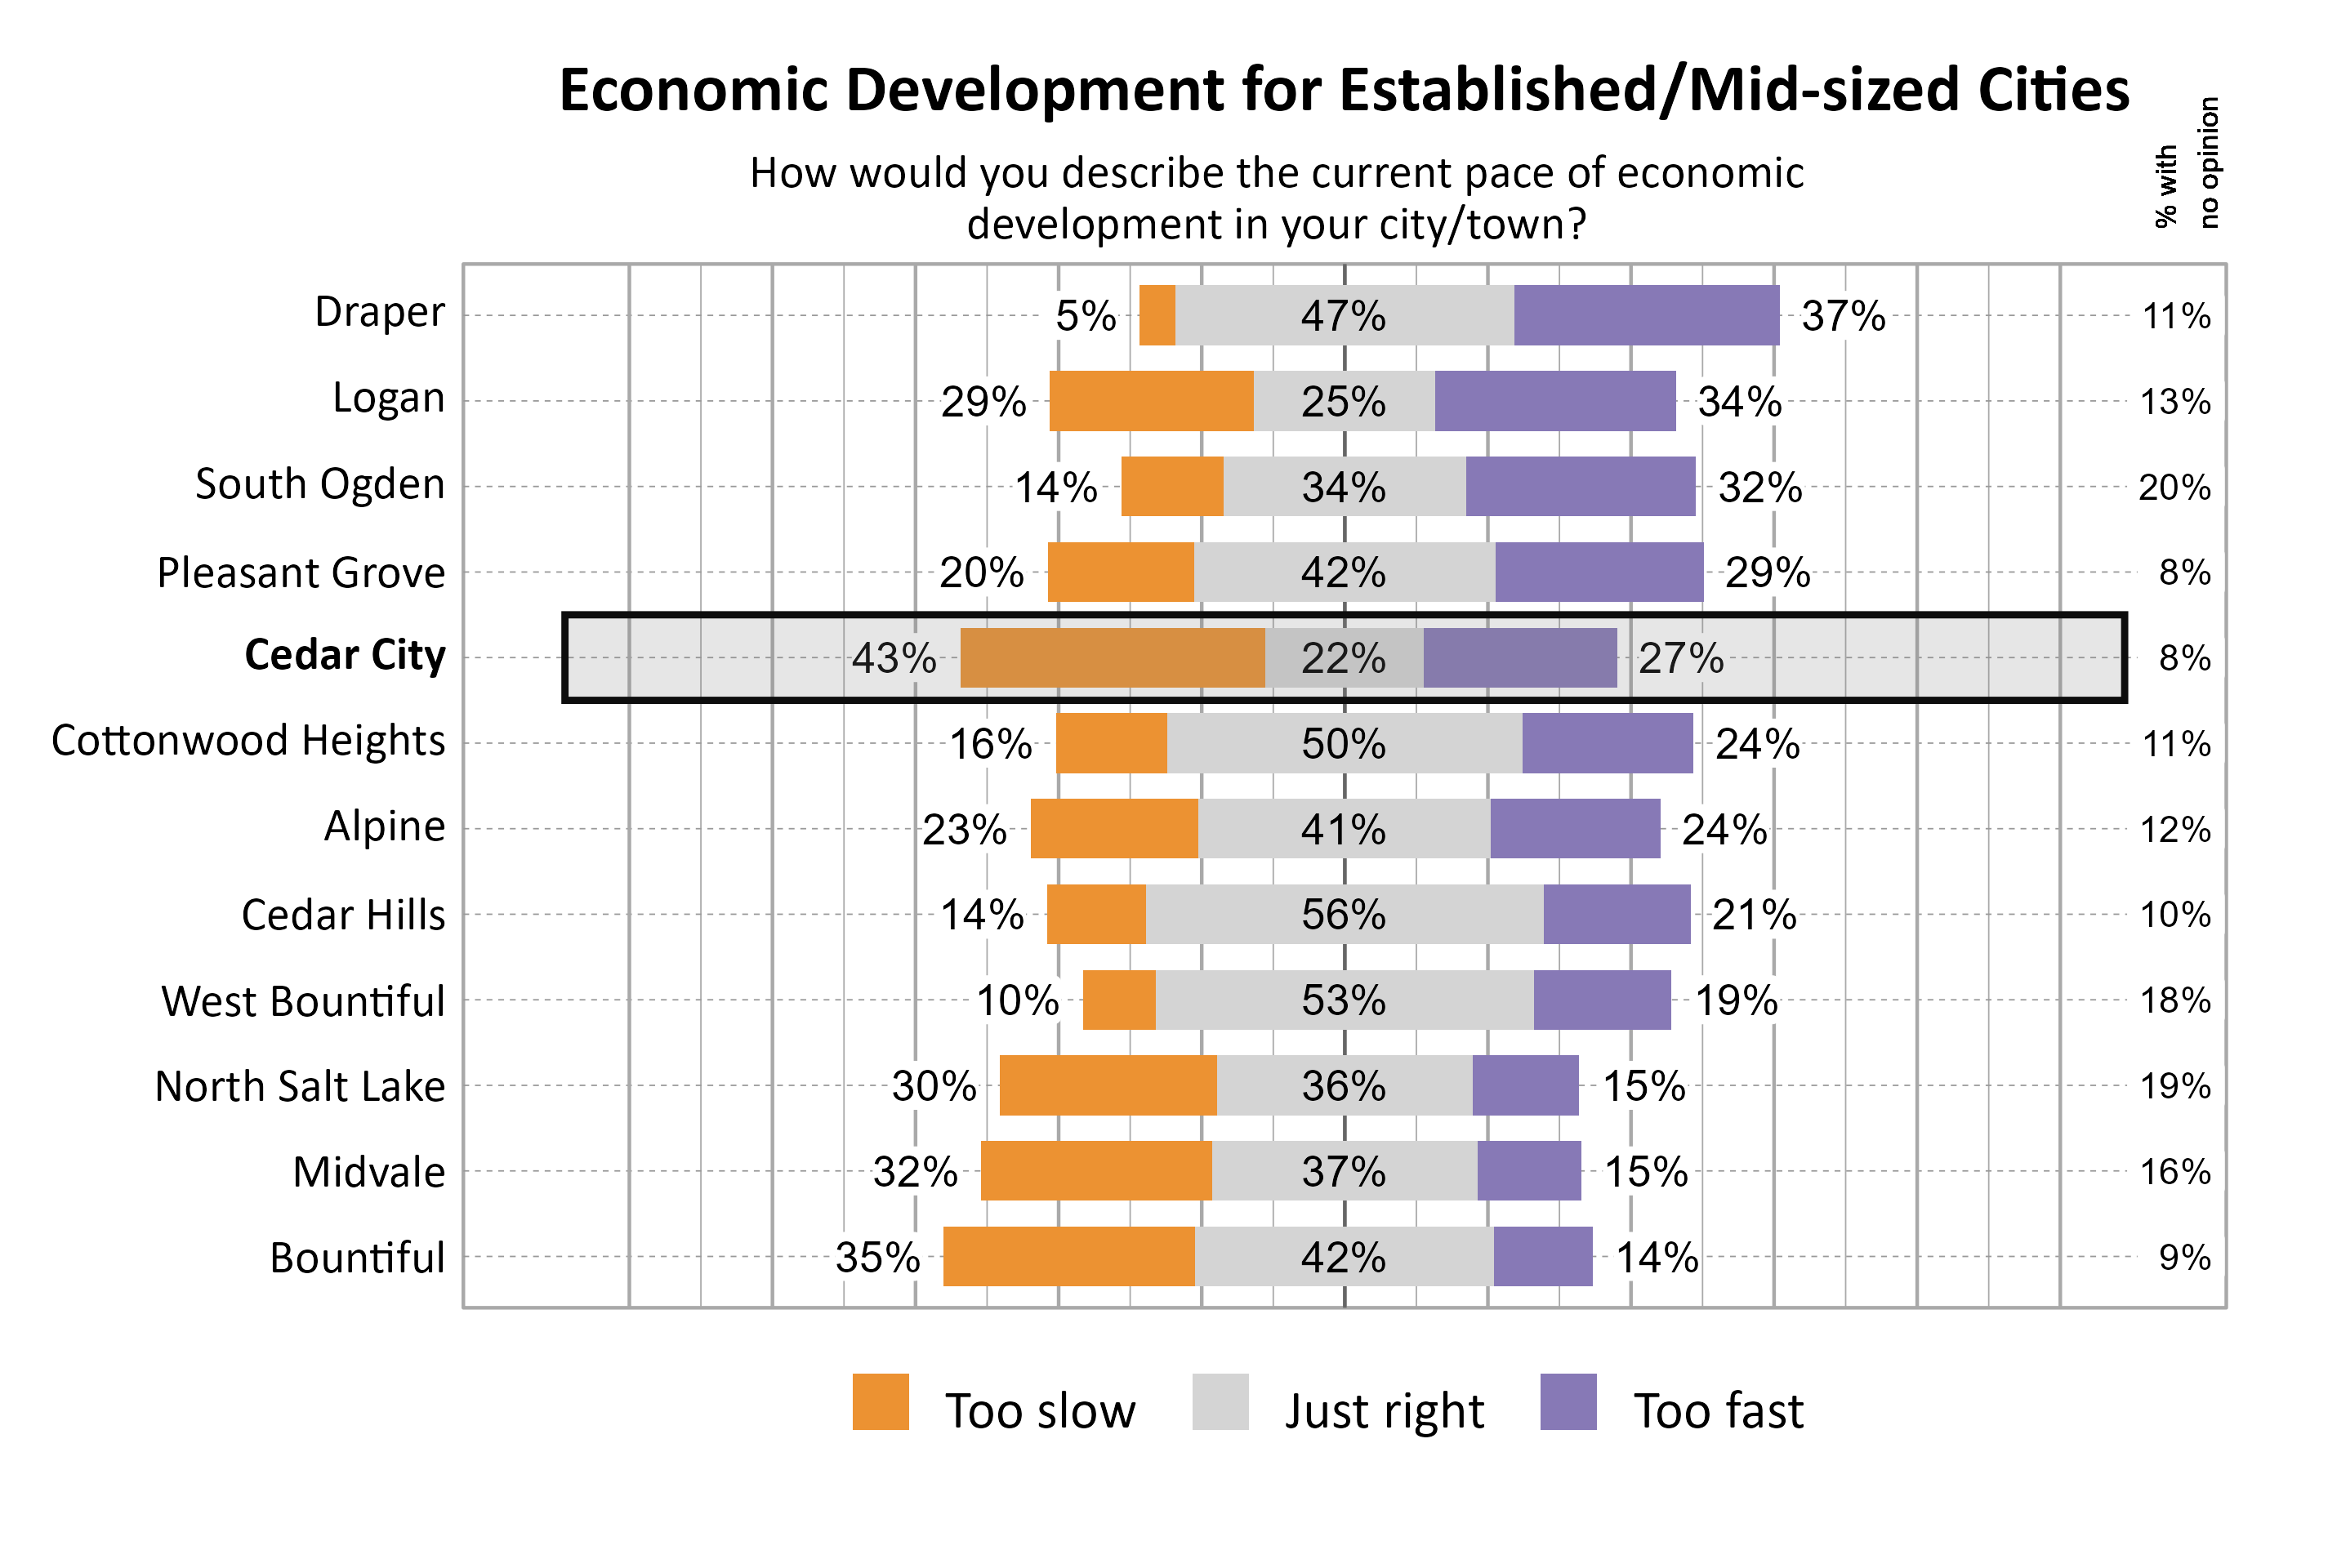
The graphs below show perceptions of population growth and economic development for Cedar City compared to other participating cities and towns in the Established/Mid-sized Cities cluster.

The graph below illustrates how many respondents perceived the pace of economic development as too slow, just right, too fast, or had no opinion, with additional breakdowns for the number of respondents who provided comments.
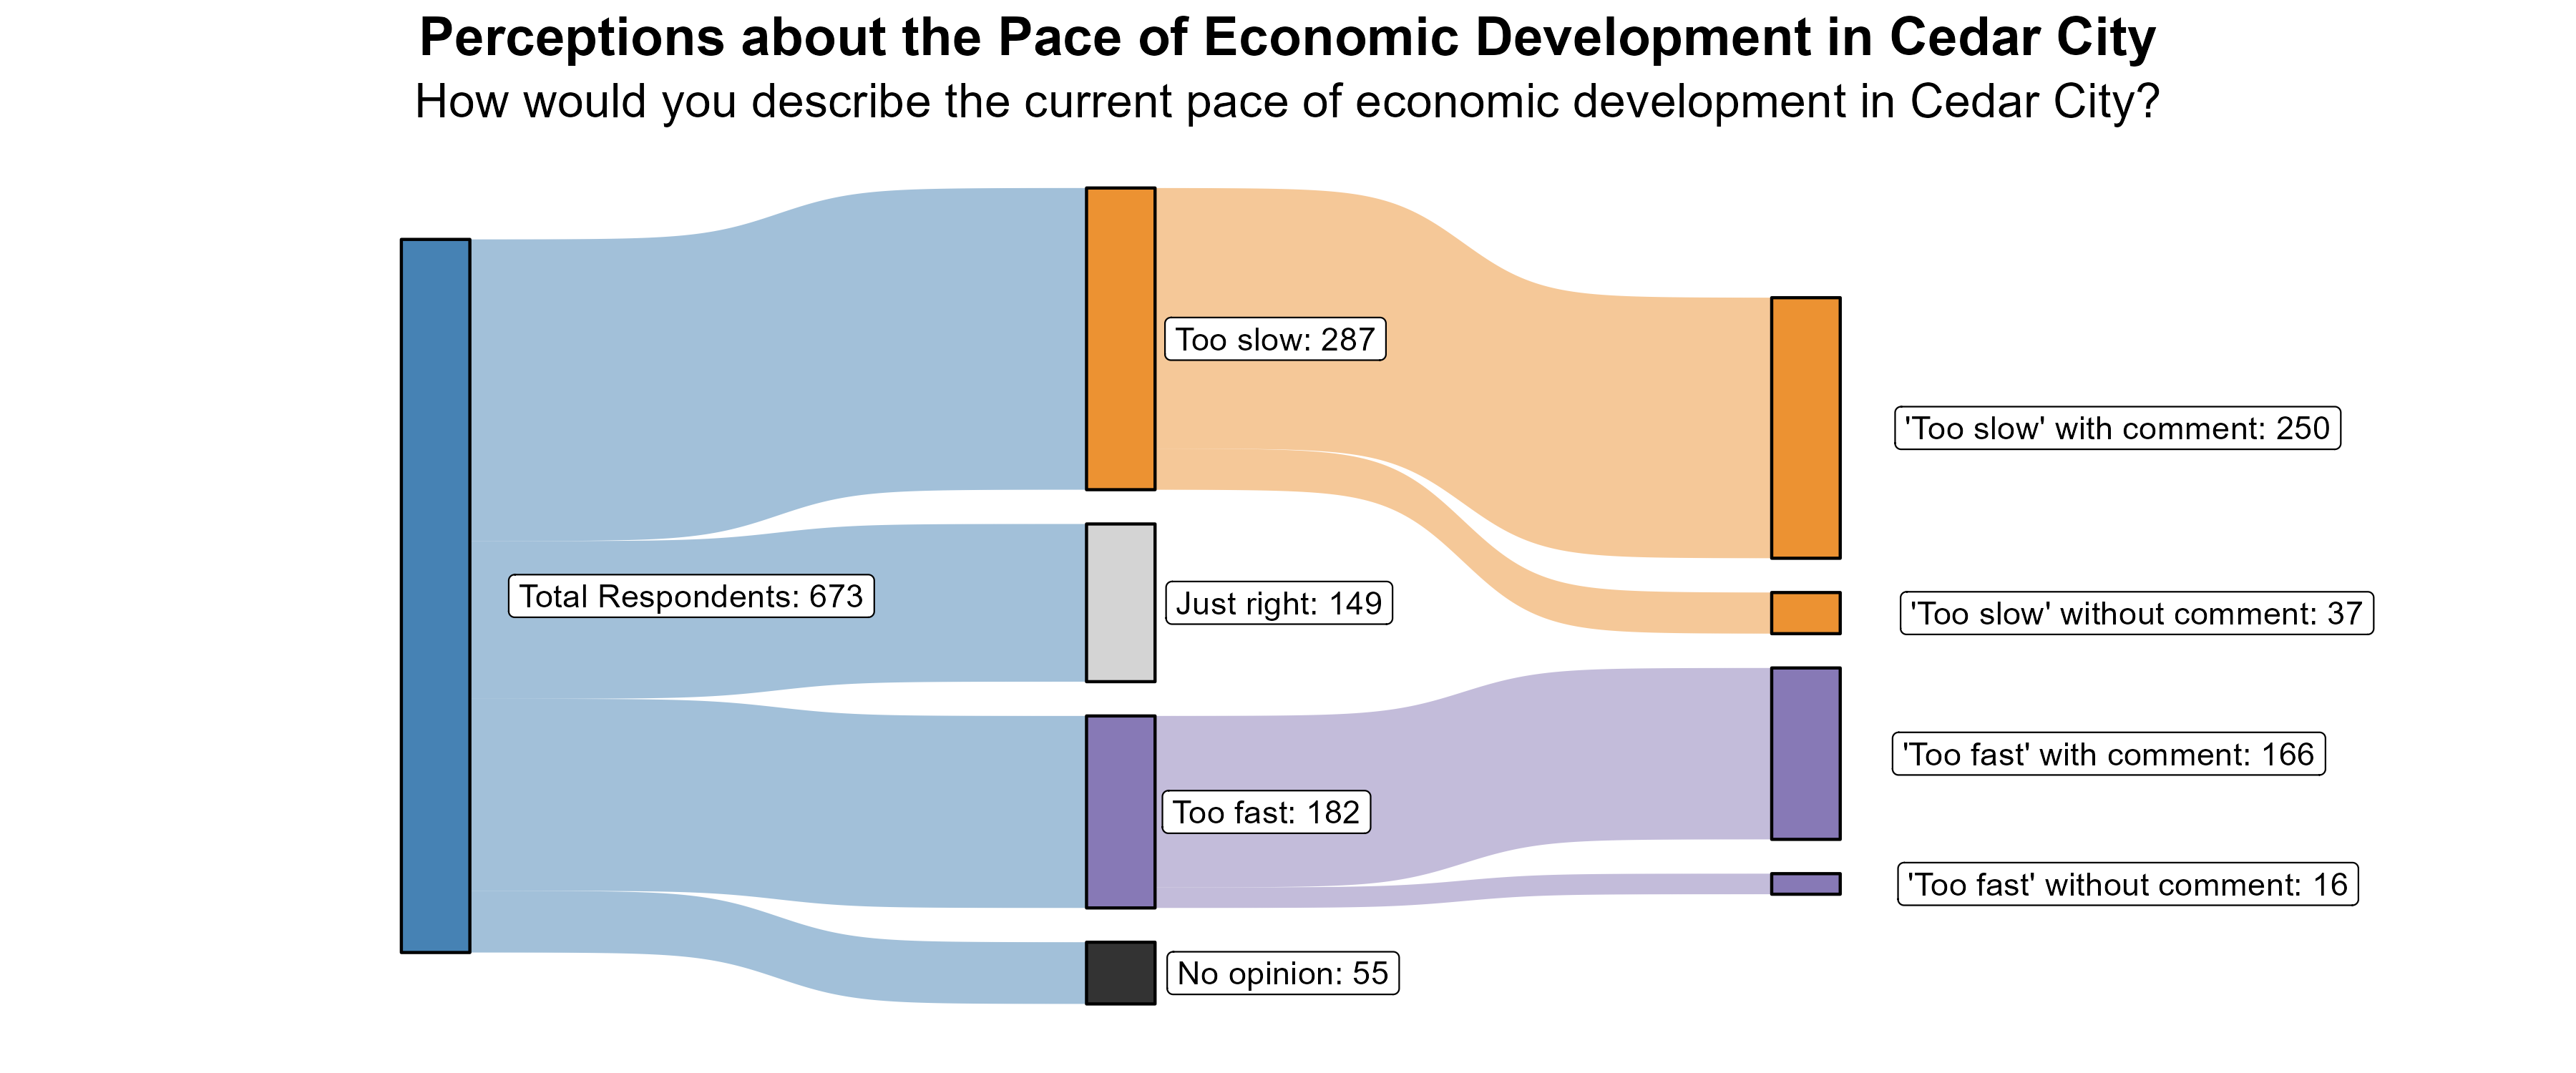
The 43% of respondents who rated the pace of economic growth as “too slow” were further asked what aspects of the local economy they would like to see more of in Cedar City. The need for more and better employment opportunities was a very strong theme as well as a concern about wages not matching the increasing cost of living and of housing. Many also asked for more shopping, dining and entertainment options, especially in the north part of town.
Additionally, the 27% of respondents who rated the pace of economic growth as “too fast” were further asked what aspects of the local economy they feel are growing too quickly in Cedar City. Many comments indicated that development is happening much too fast for the current infrastructure, amenities, water, and other resources. There were also concerns about the rate that housing is going up and feel that it is done with little regard to those who live in Cedar City. There were also comments about development obstructing views, replacing open space, and changing the culture of the town as well as concerns about traffic and crowding. The general attitude was that the growth is happening too quickly for what the city can handle.
Transportation in Cedar City
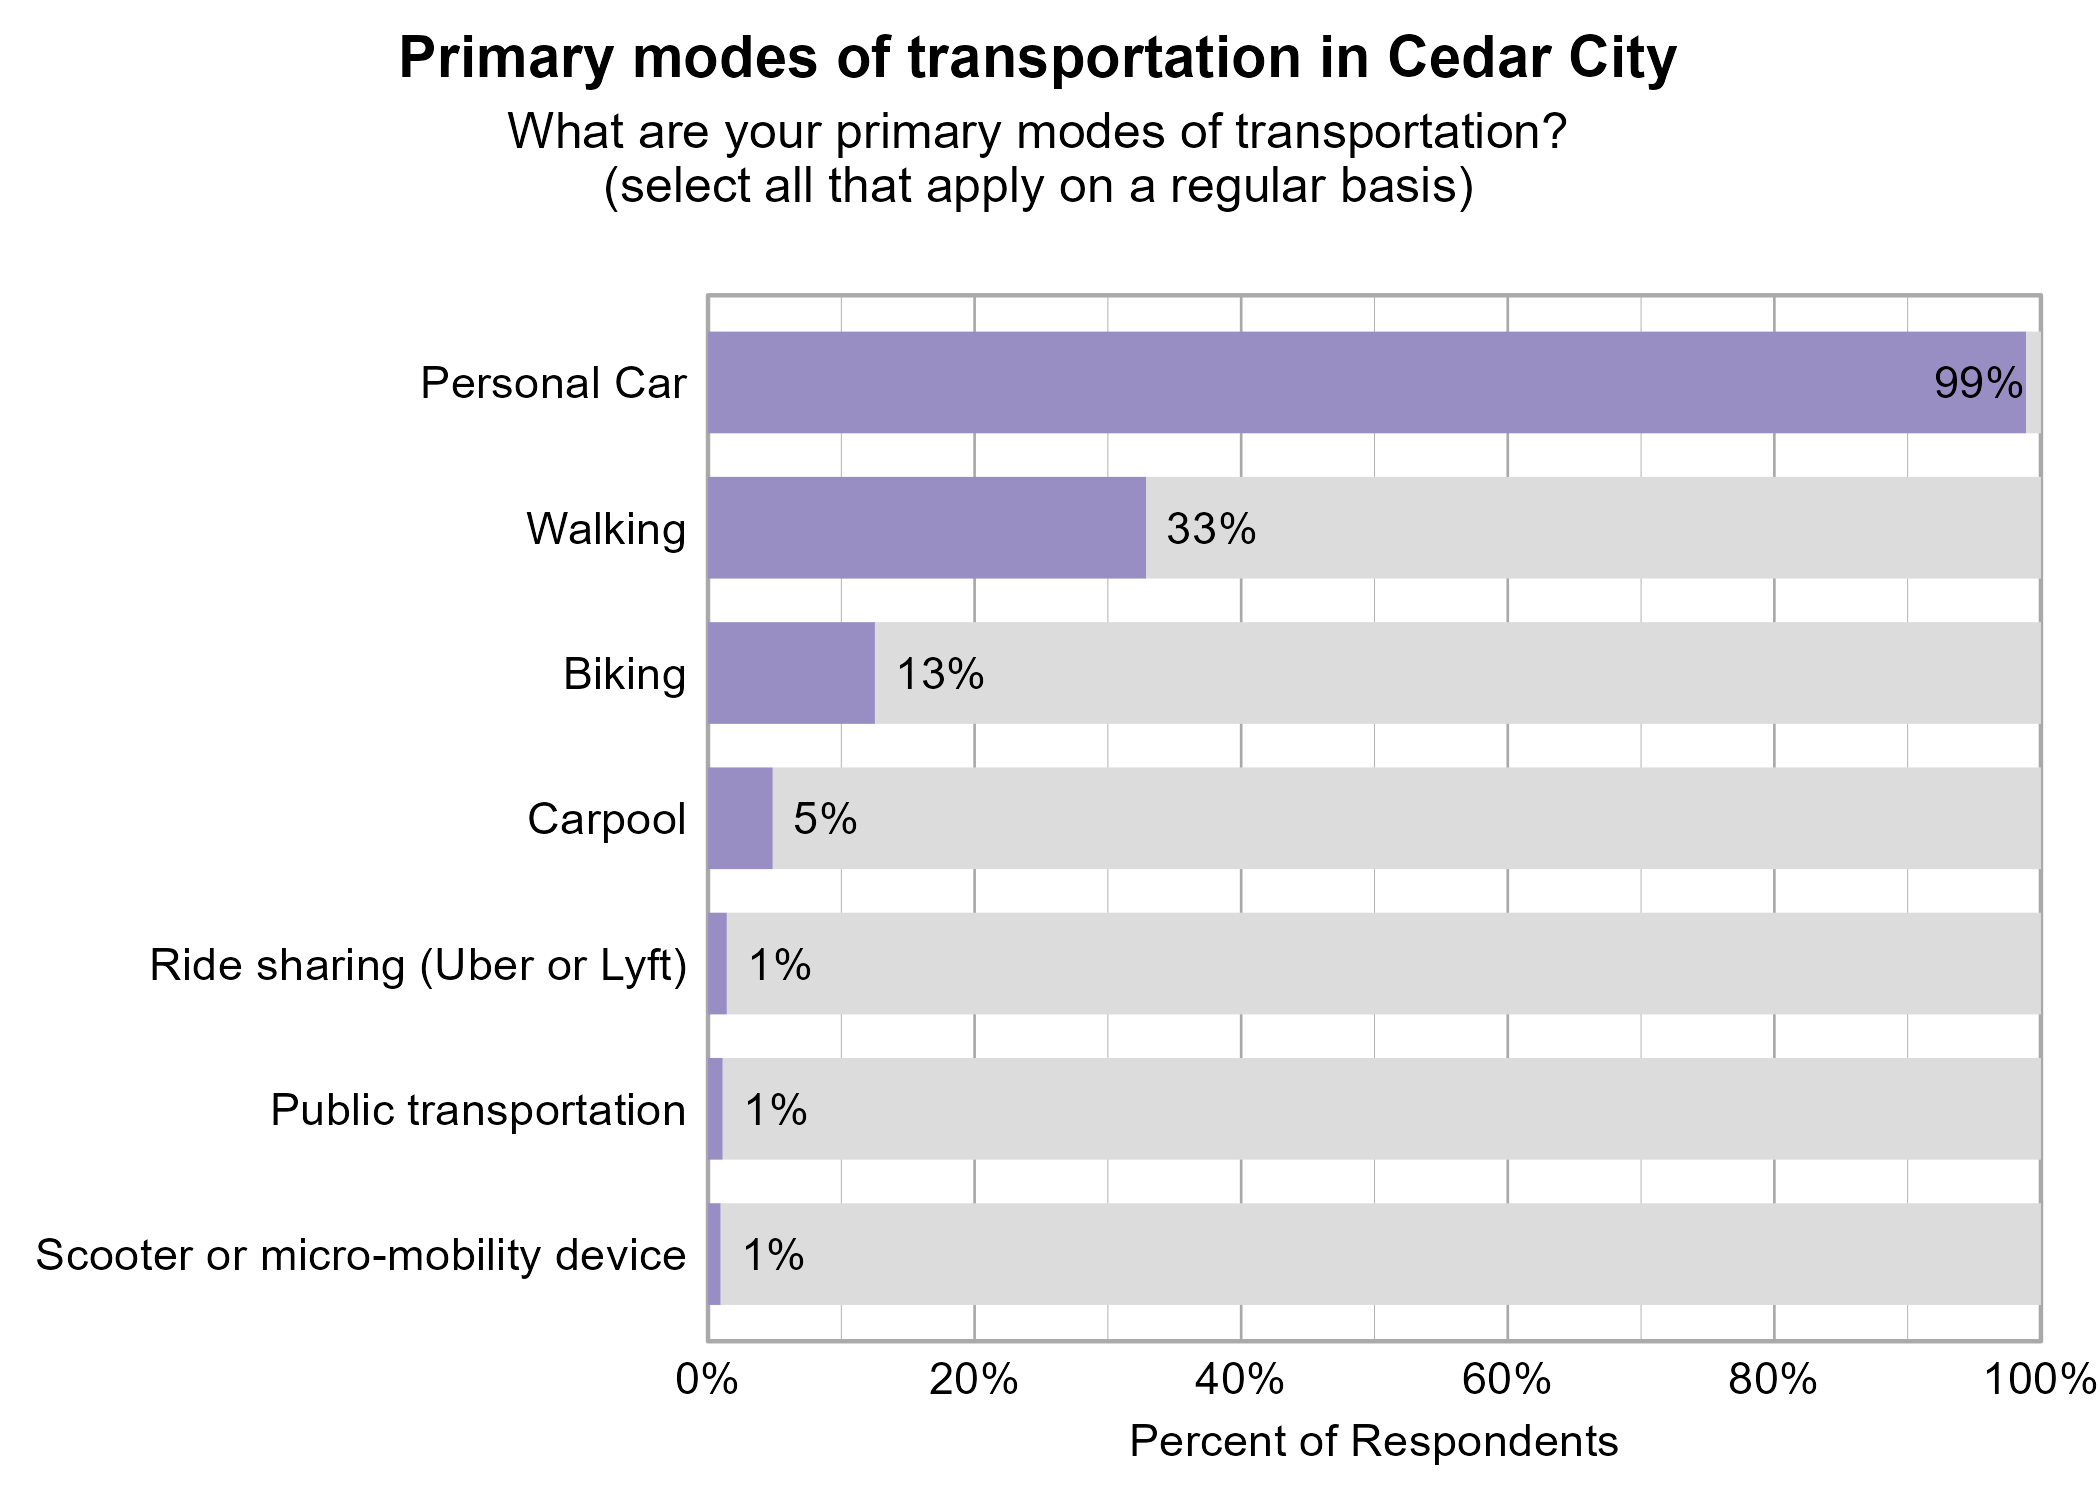
Respondents were asked to indicate all of their primary modes of transportation on a regular basis in Cedar City. The most popular modes of transportation were personal car (99%) and walking (33%).
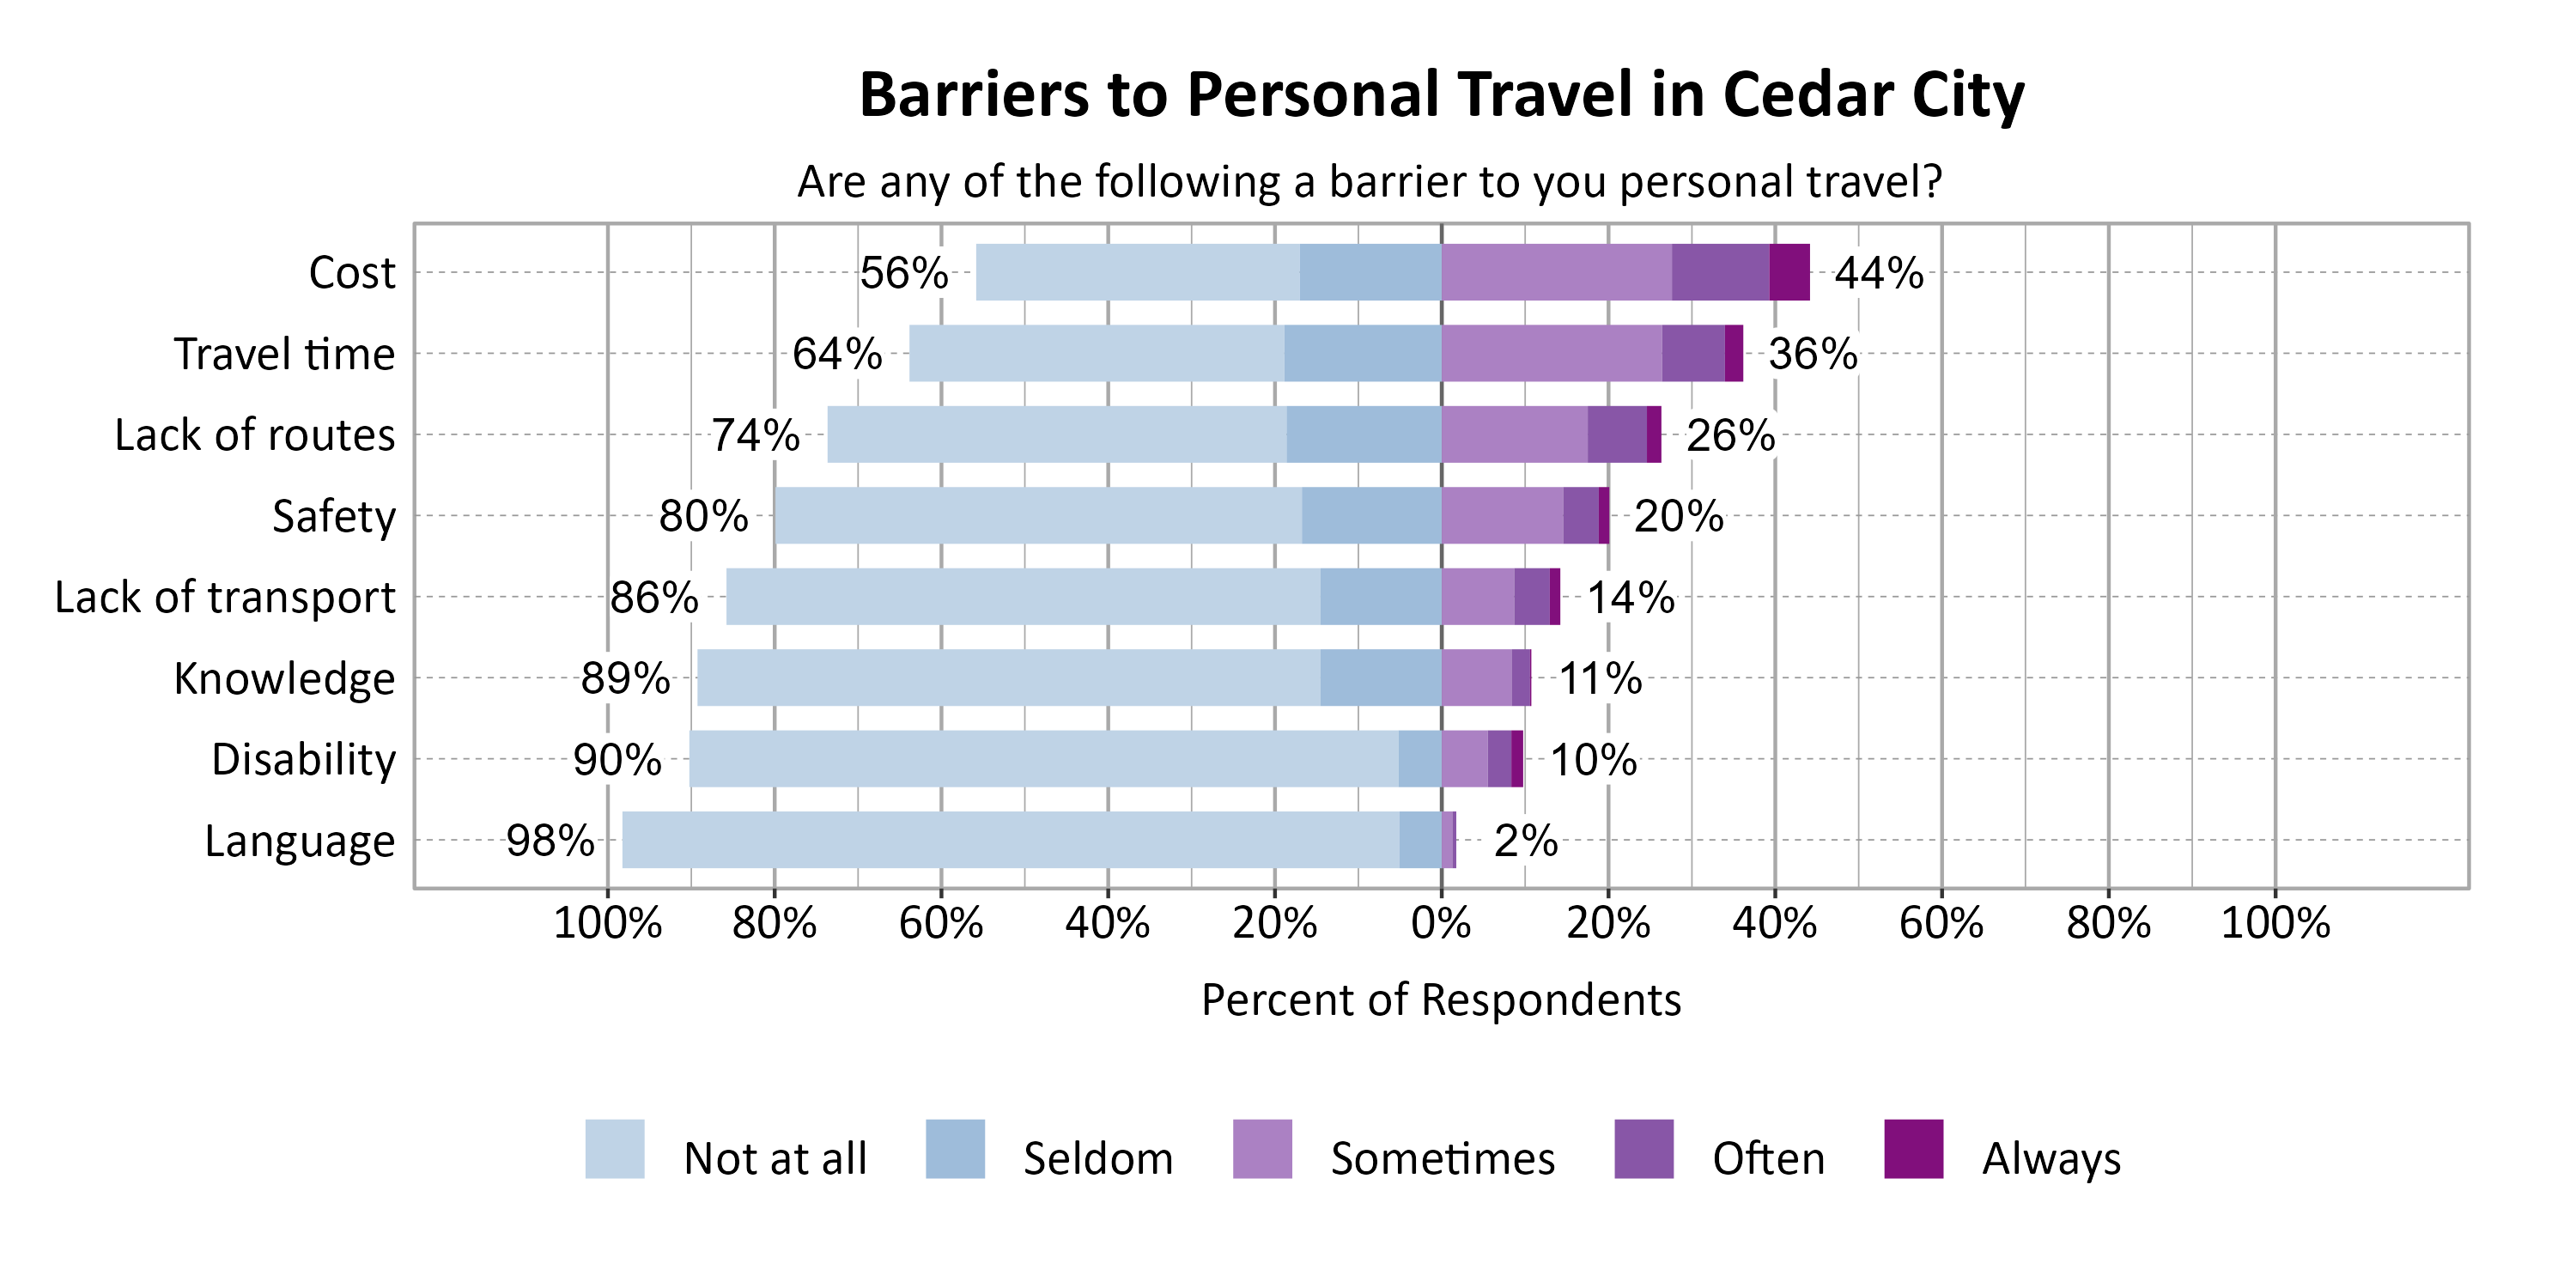
Respondents were asked to indicate the most common barriers to transportation in Cedar City. The most problematic barriers were Cost (44%) and Travel time (36%).
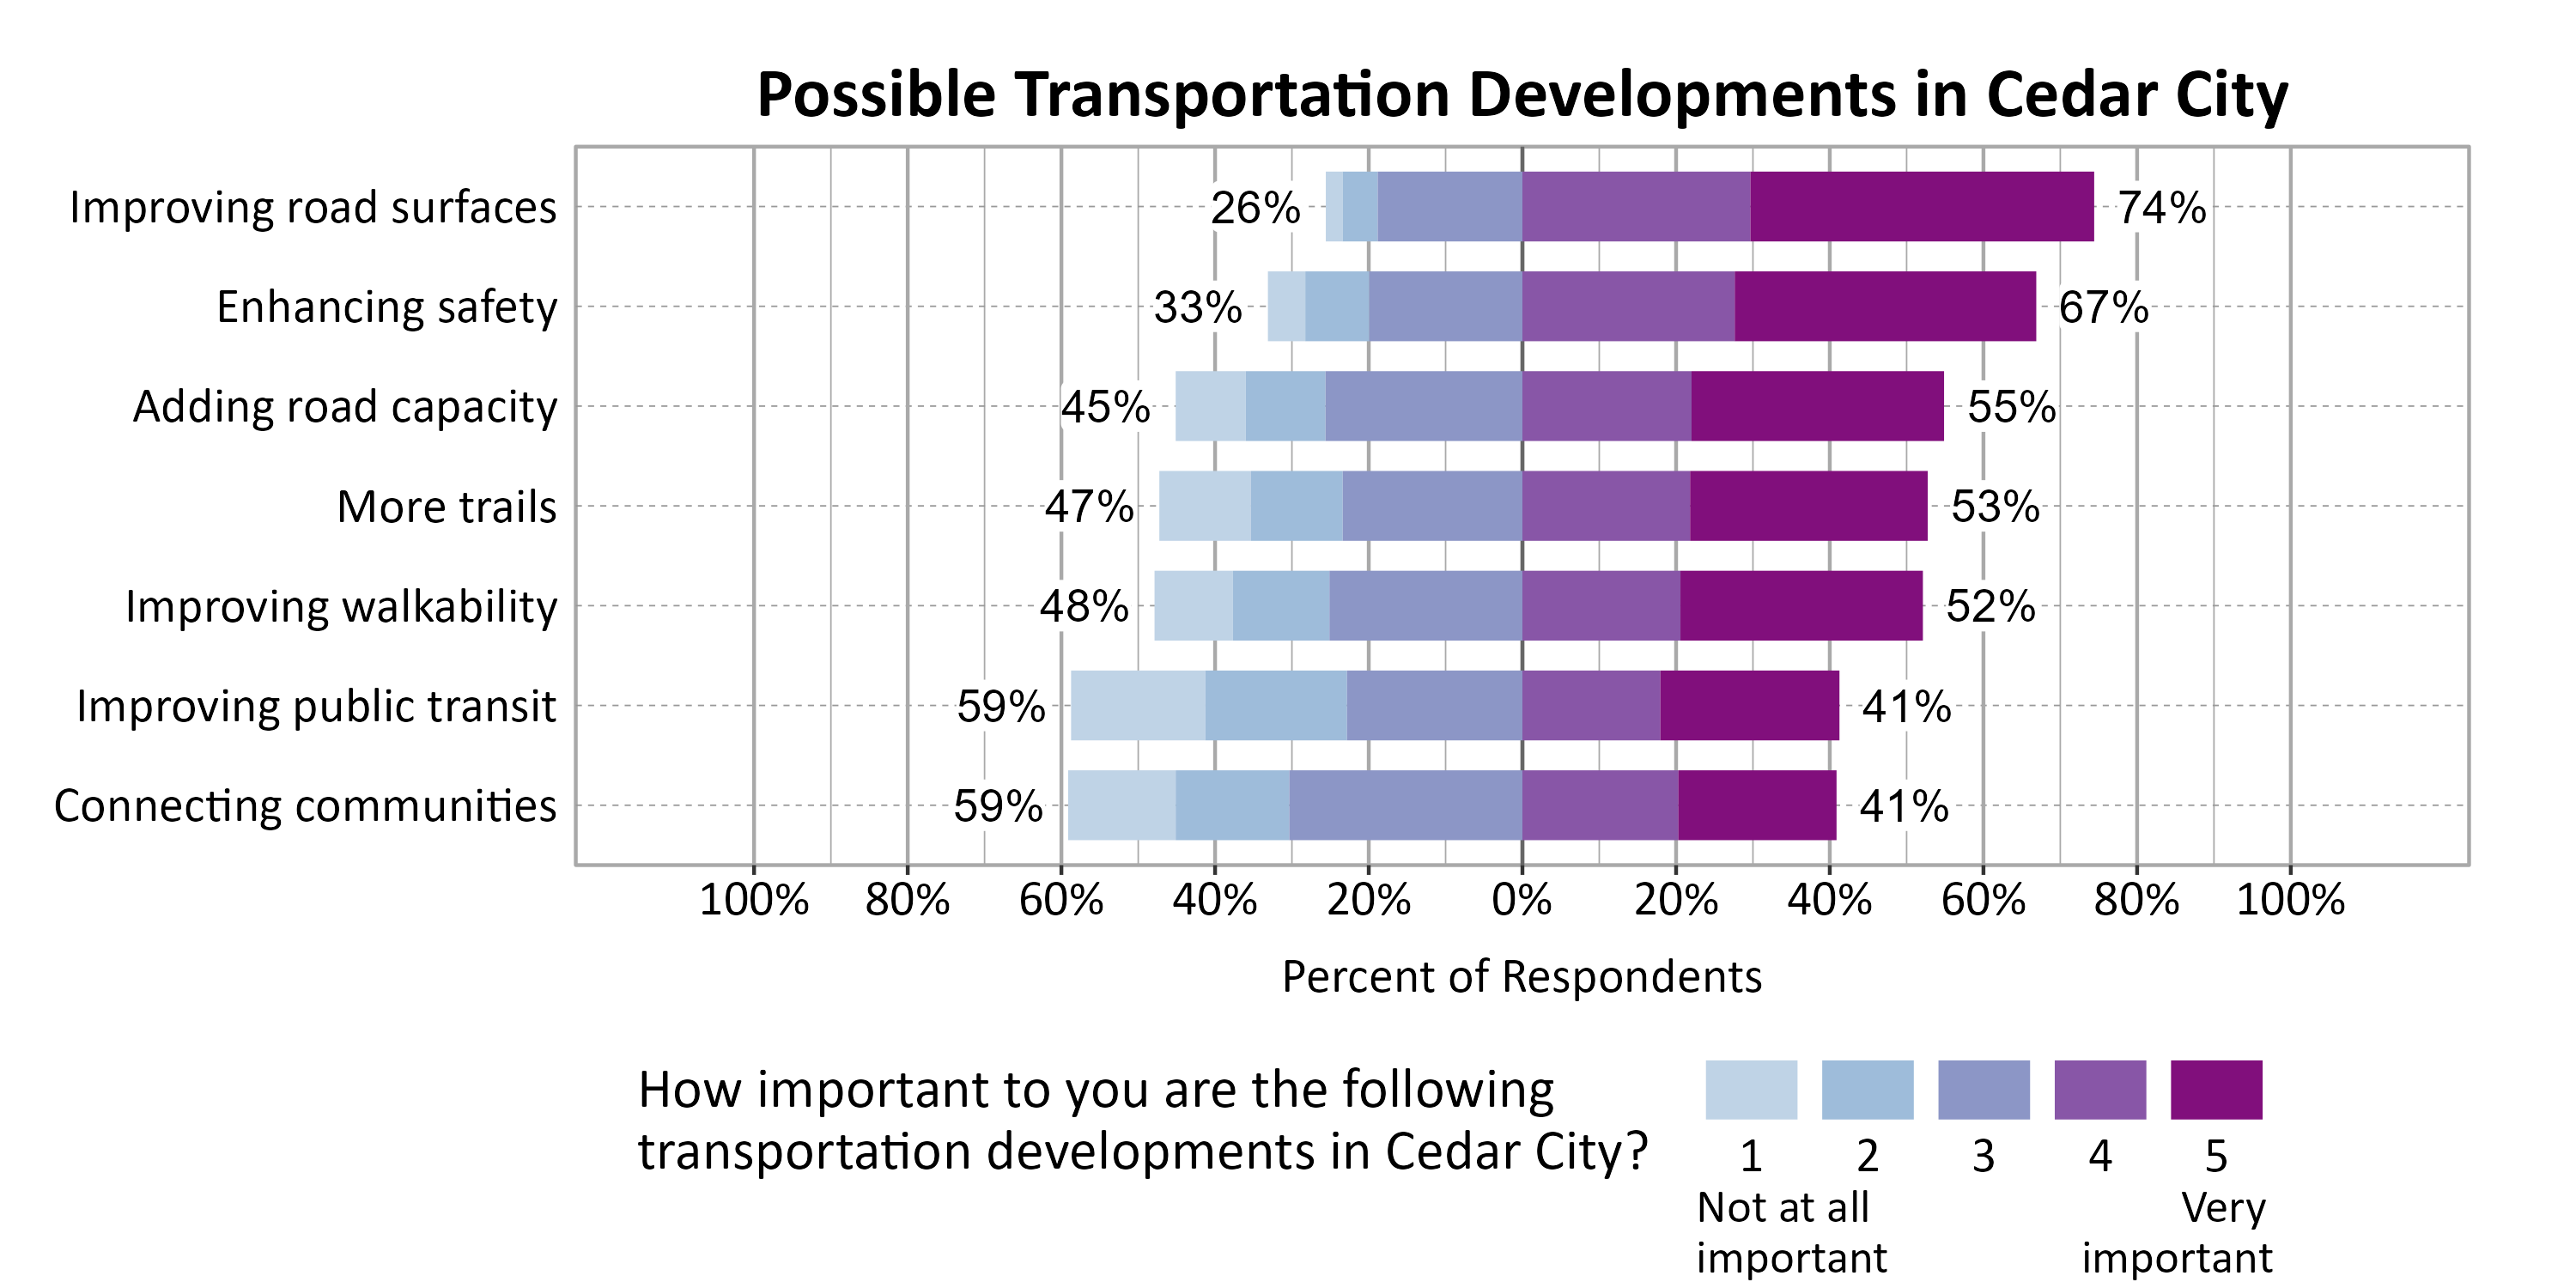
Respondents were asked to indicate the importance of a set of possible transportation developments in Cedar City. The most important development to respondents were Improving road surfaces (74%), Enhancing safety (67%), and Adding road capacity (55%).
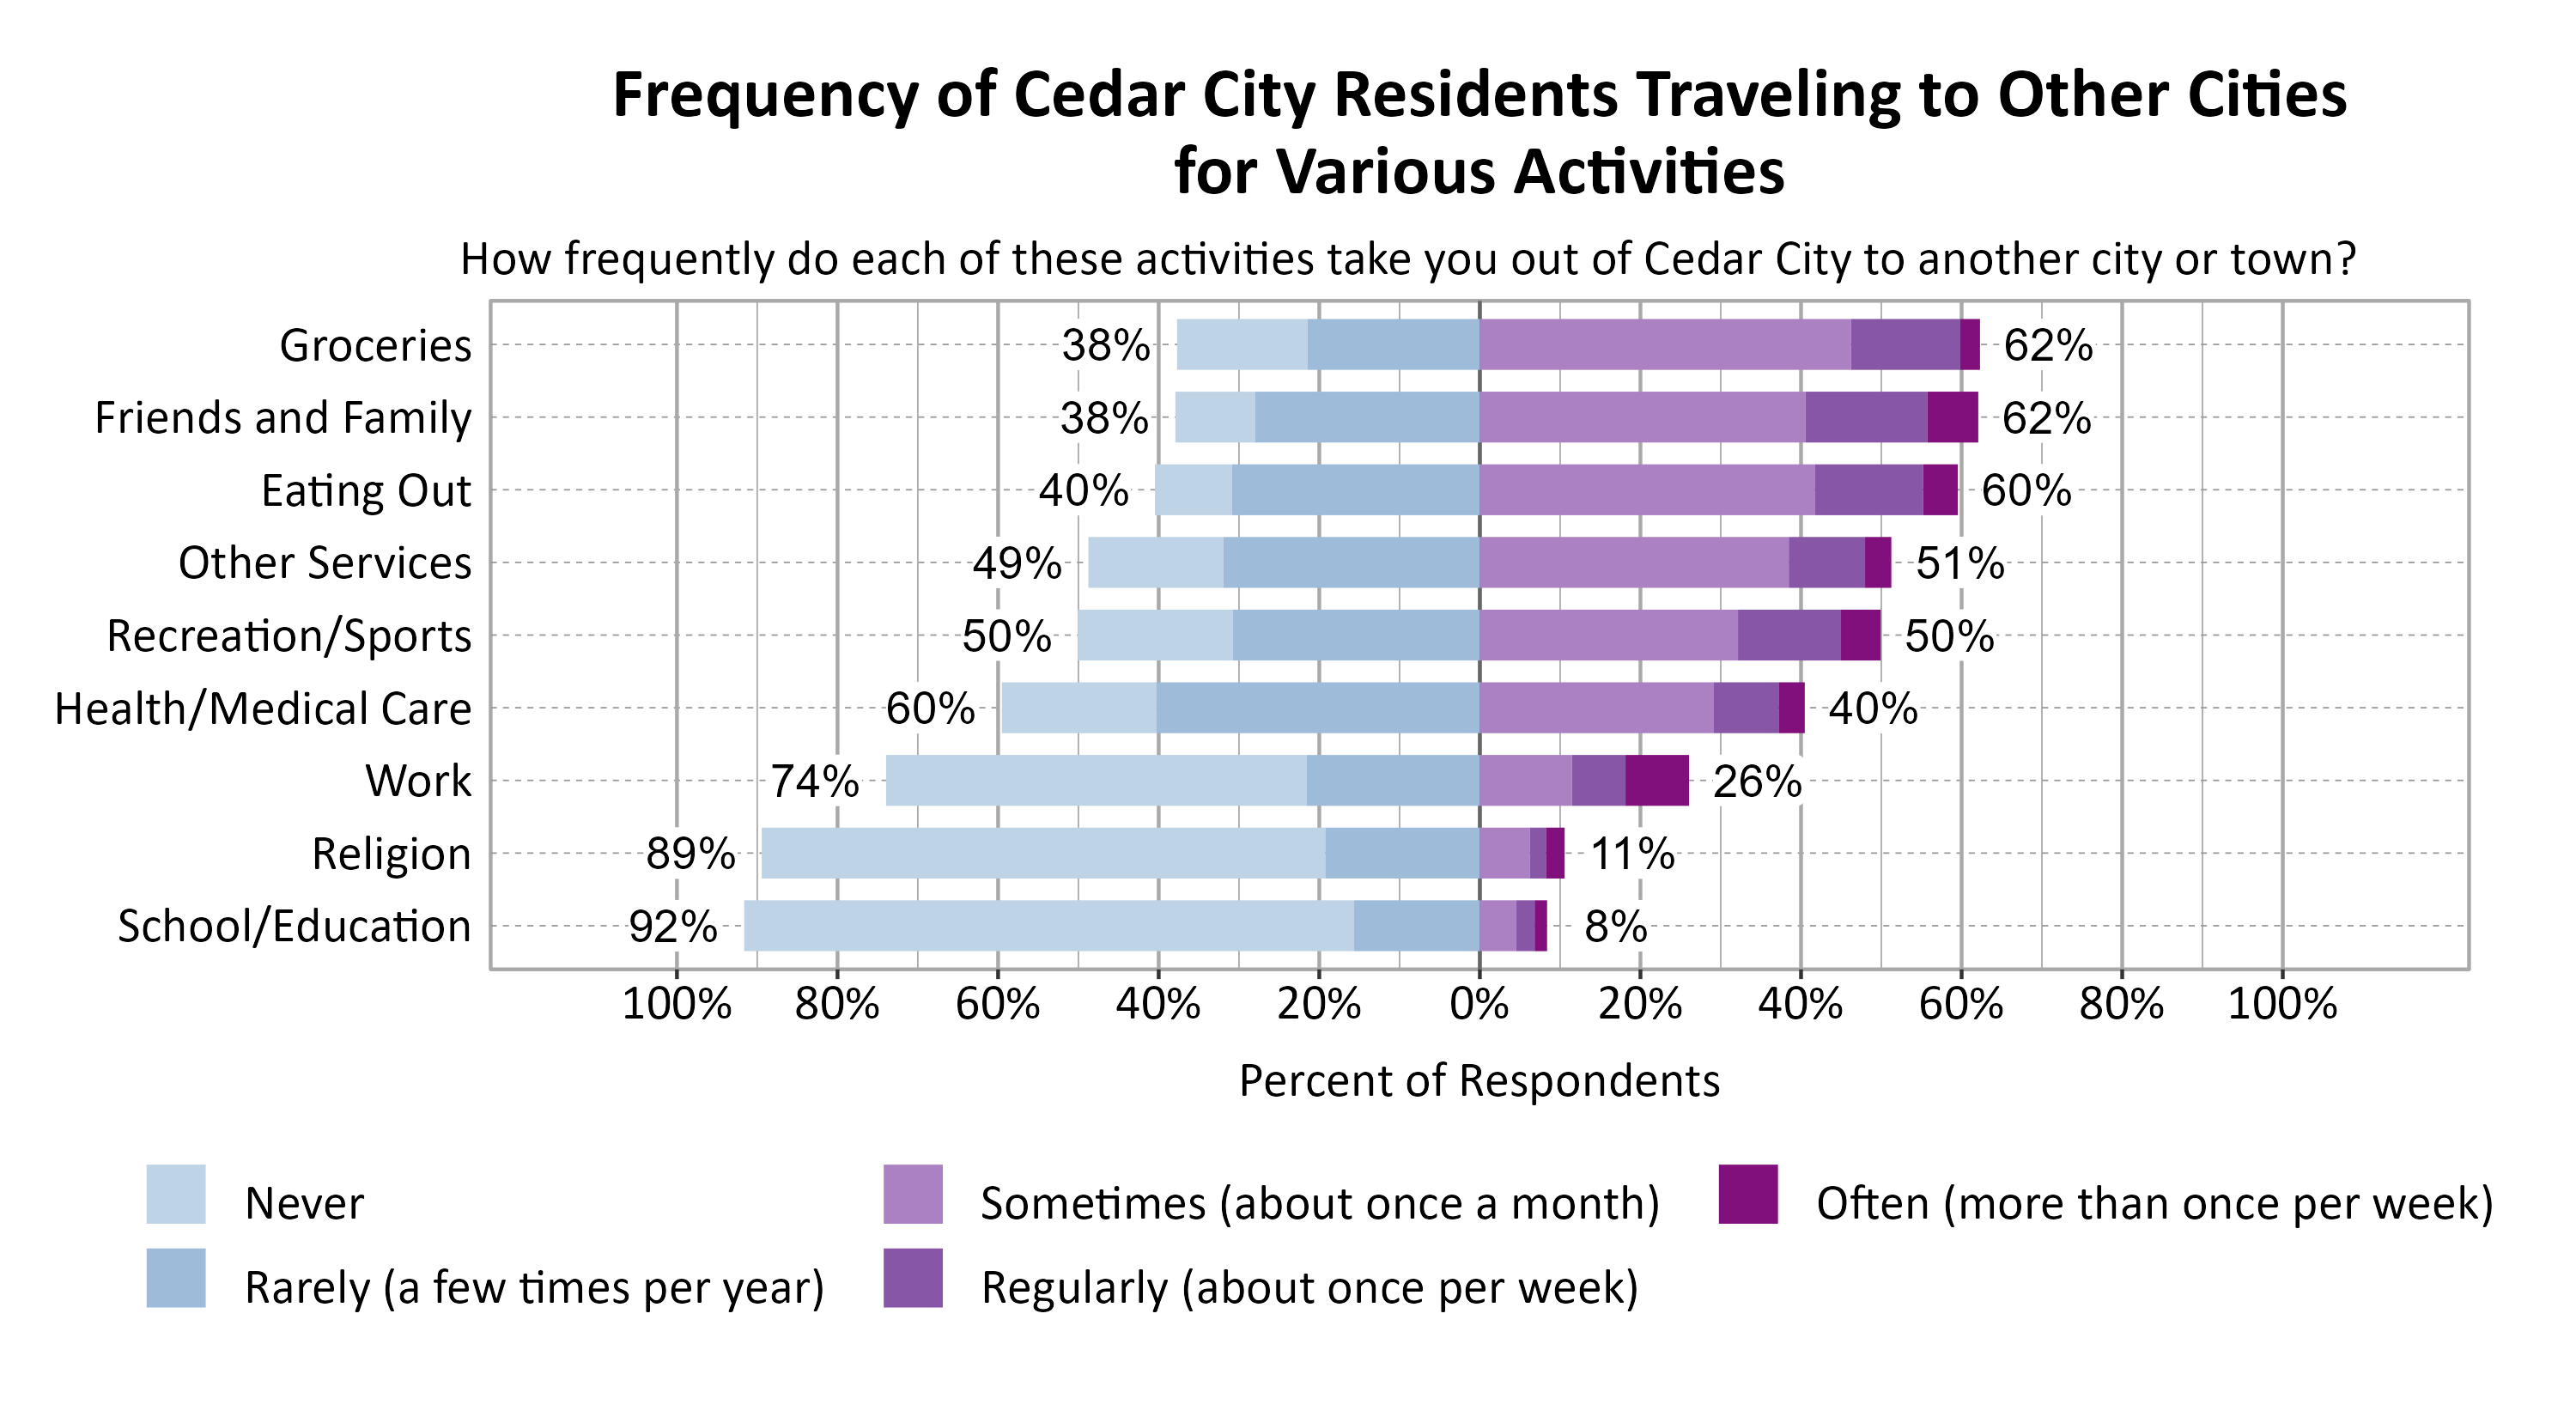
Respondents were asked to indicate how frequently various activities take them out of Cedar City to another city or town. The most commonly indicated reasons for traveling to another city or town at least sometimes or once a month were Groceries (62%), Friends and Family (62%), and Eating Out (60%).
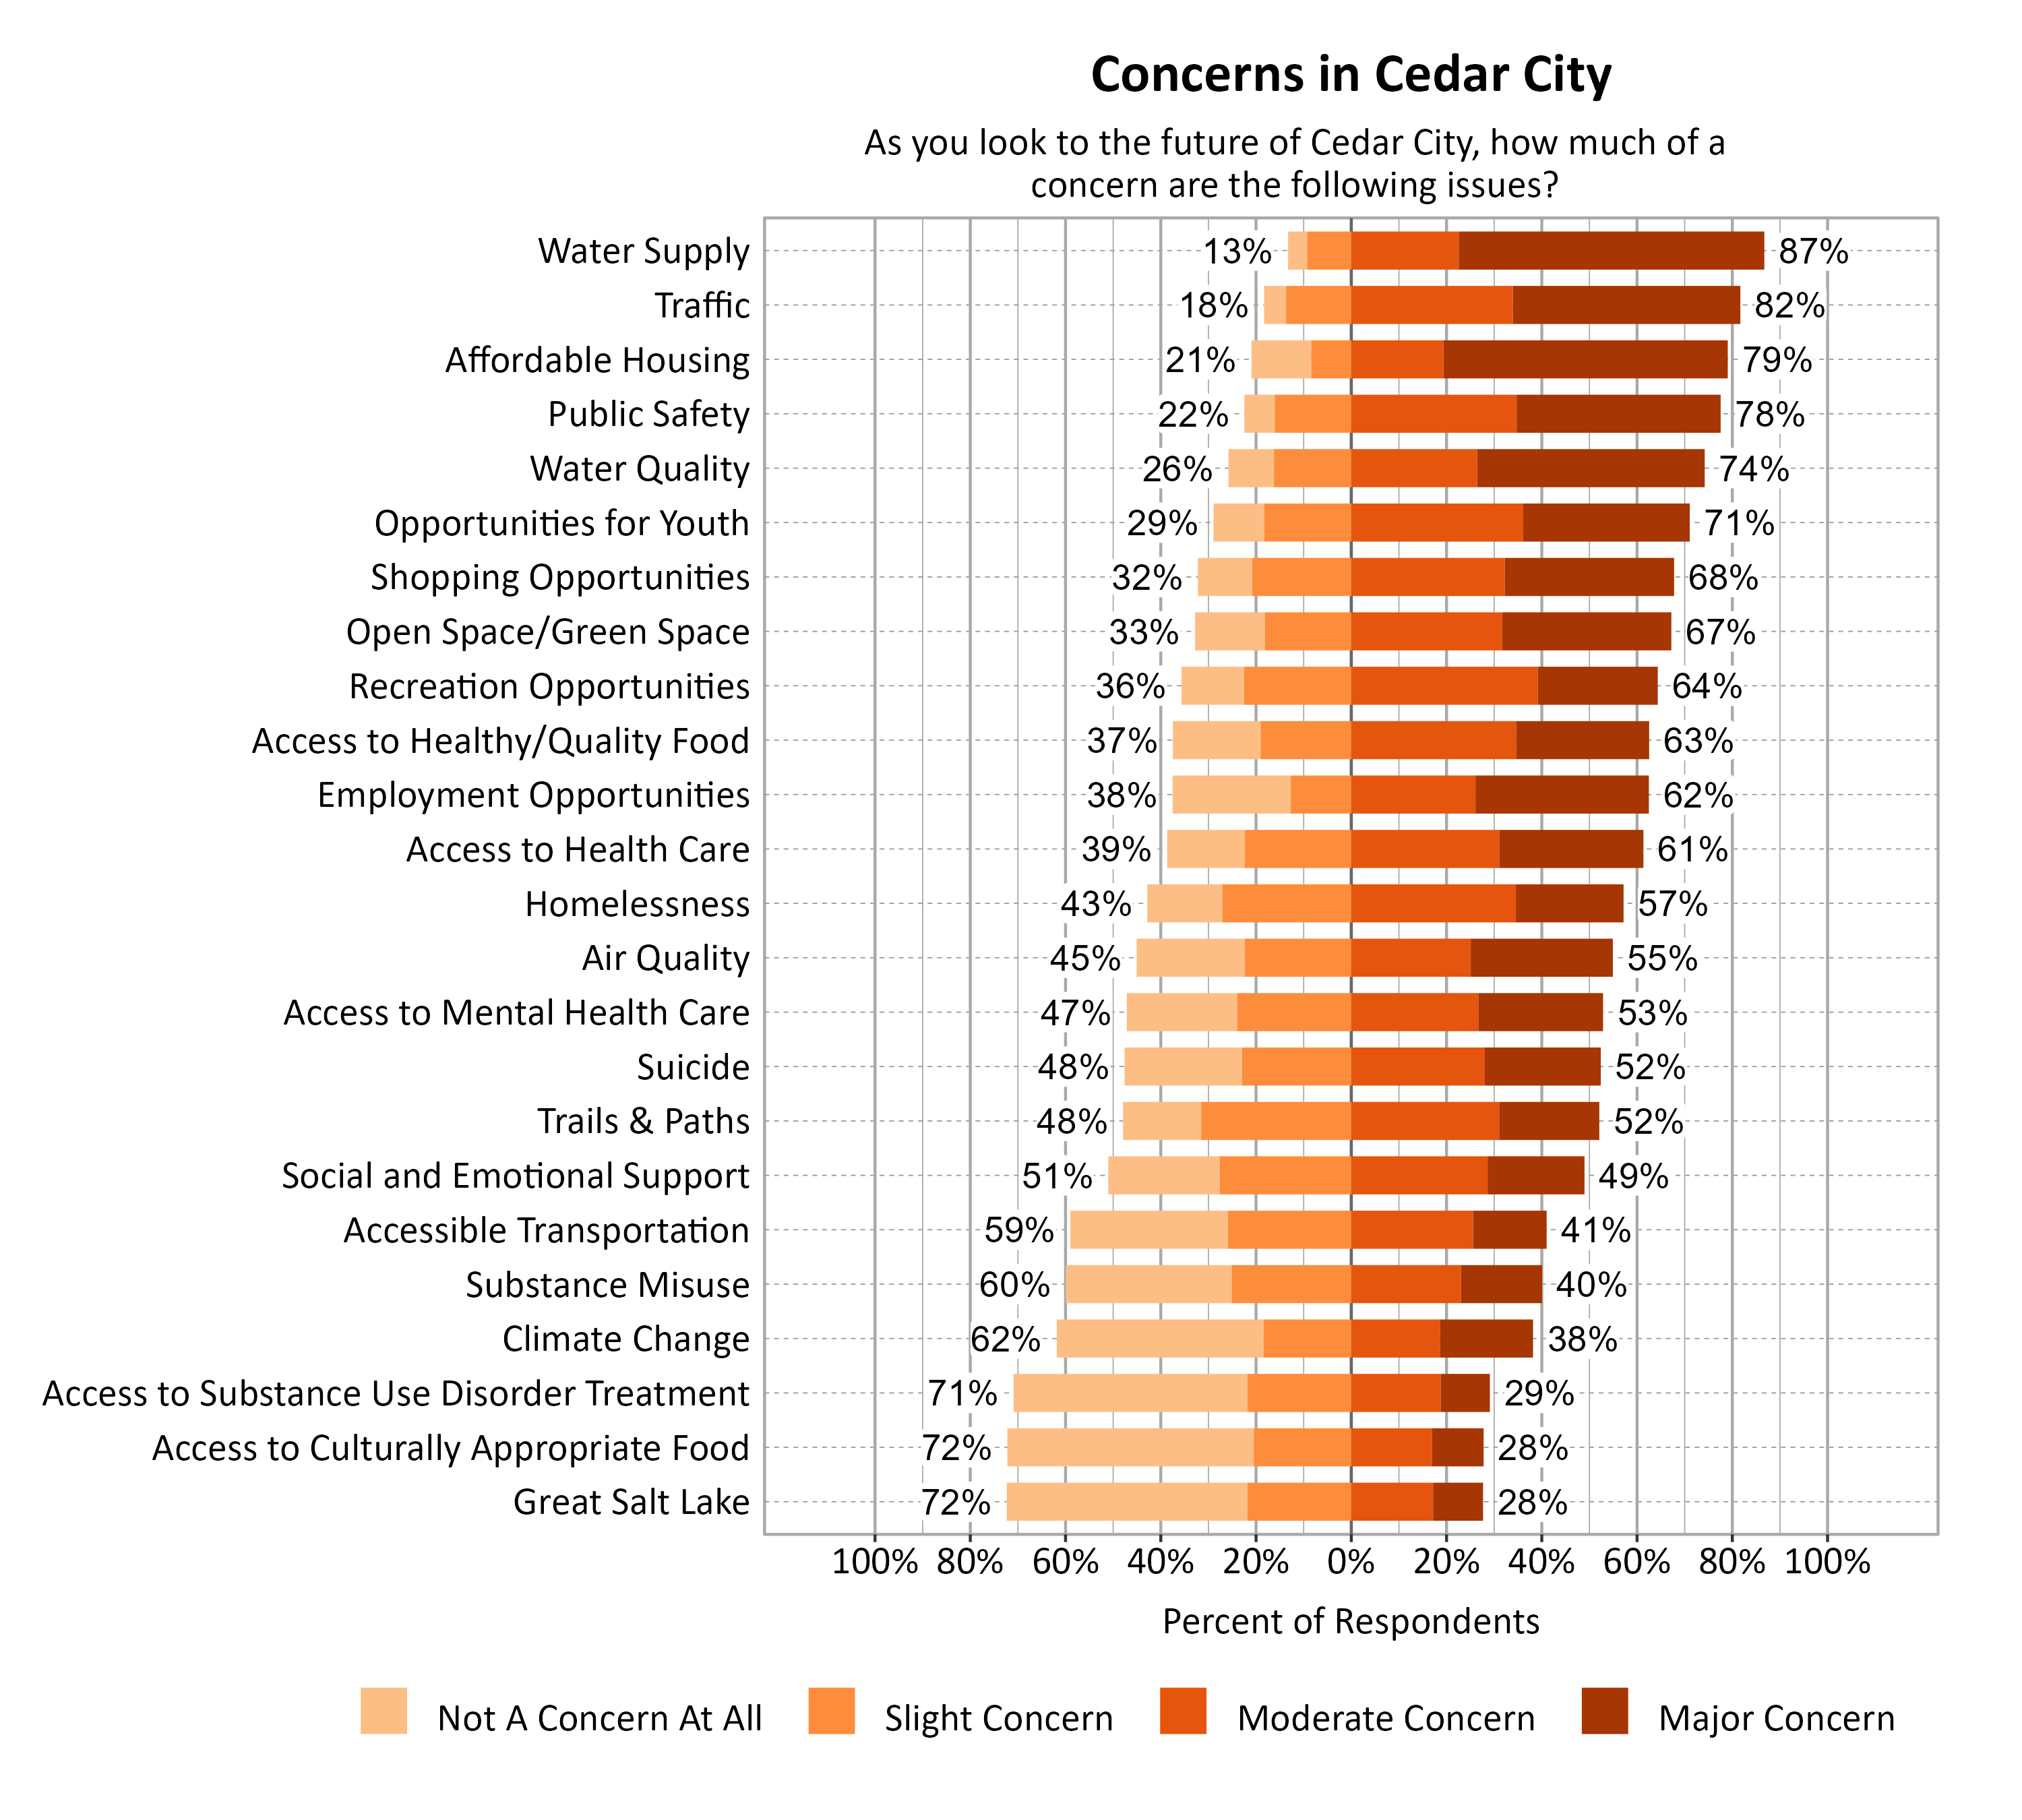
Concerns in Cedar City
Survey respondents indicated the degree to which a number of possible local issues were a concern as they look to the future of Cedar City. Water Supply (87%), Traffic (82%), Affordable Housing (79%), and Public Safety (78%) were the top concerns.
Additional Questions for Cedar City
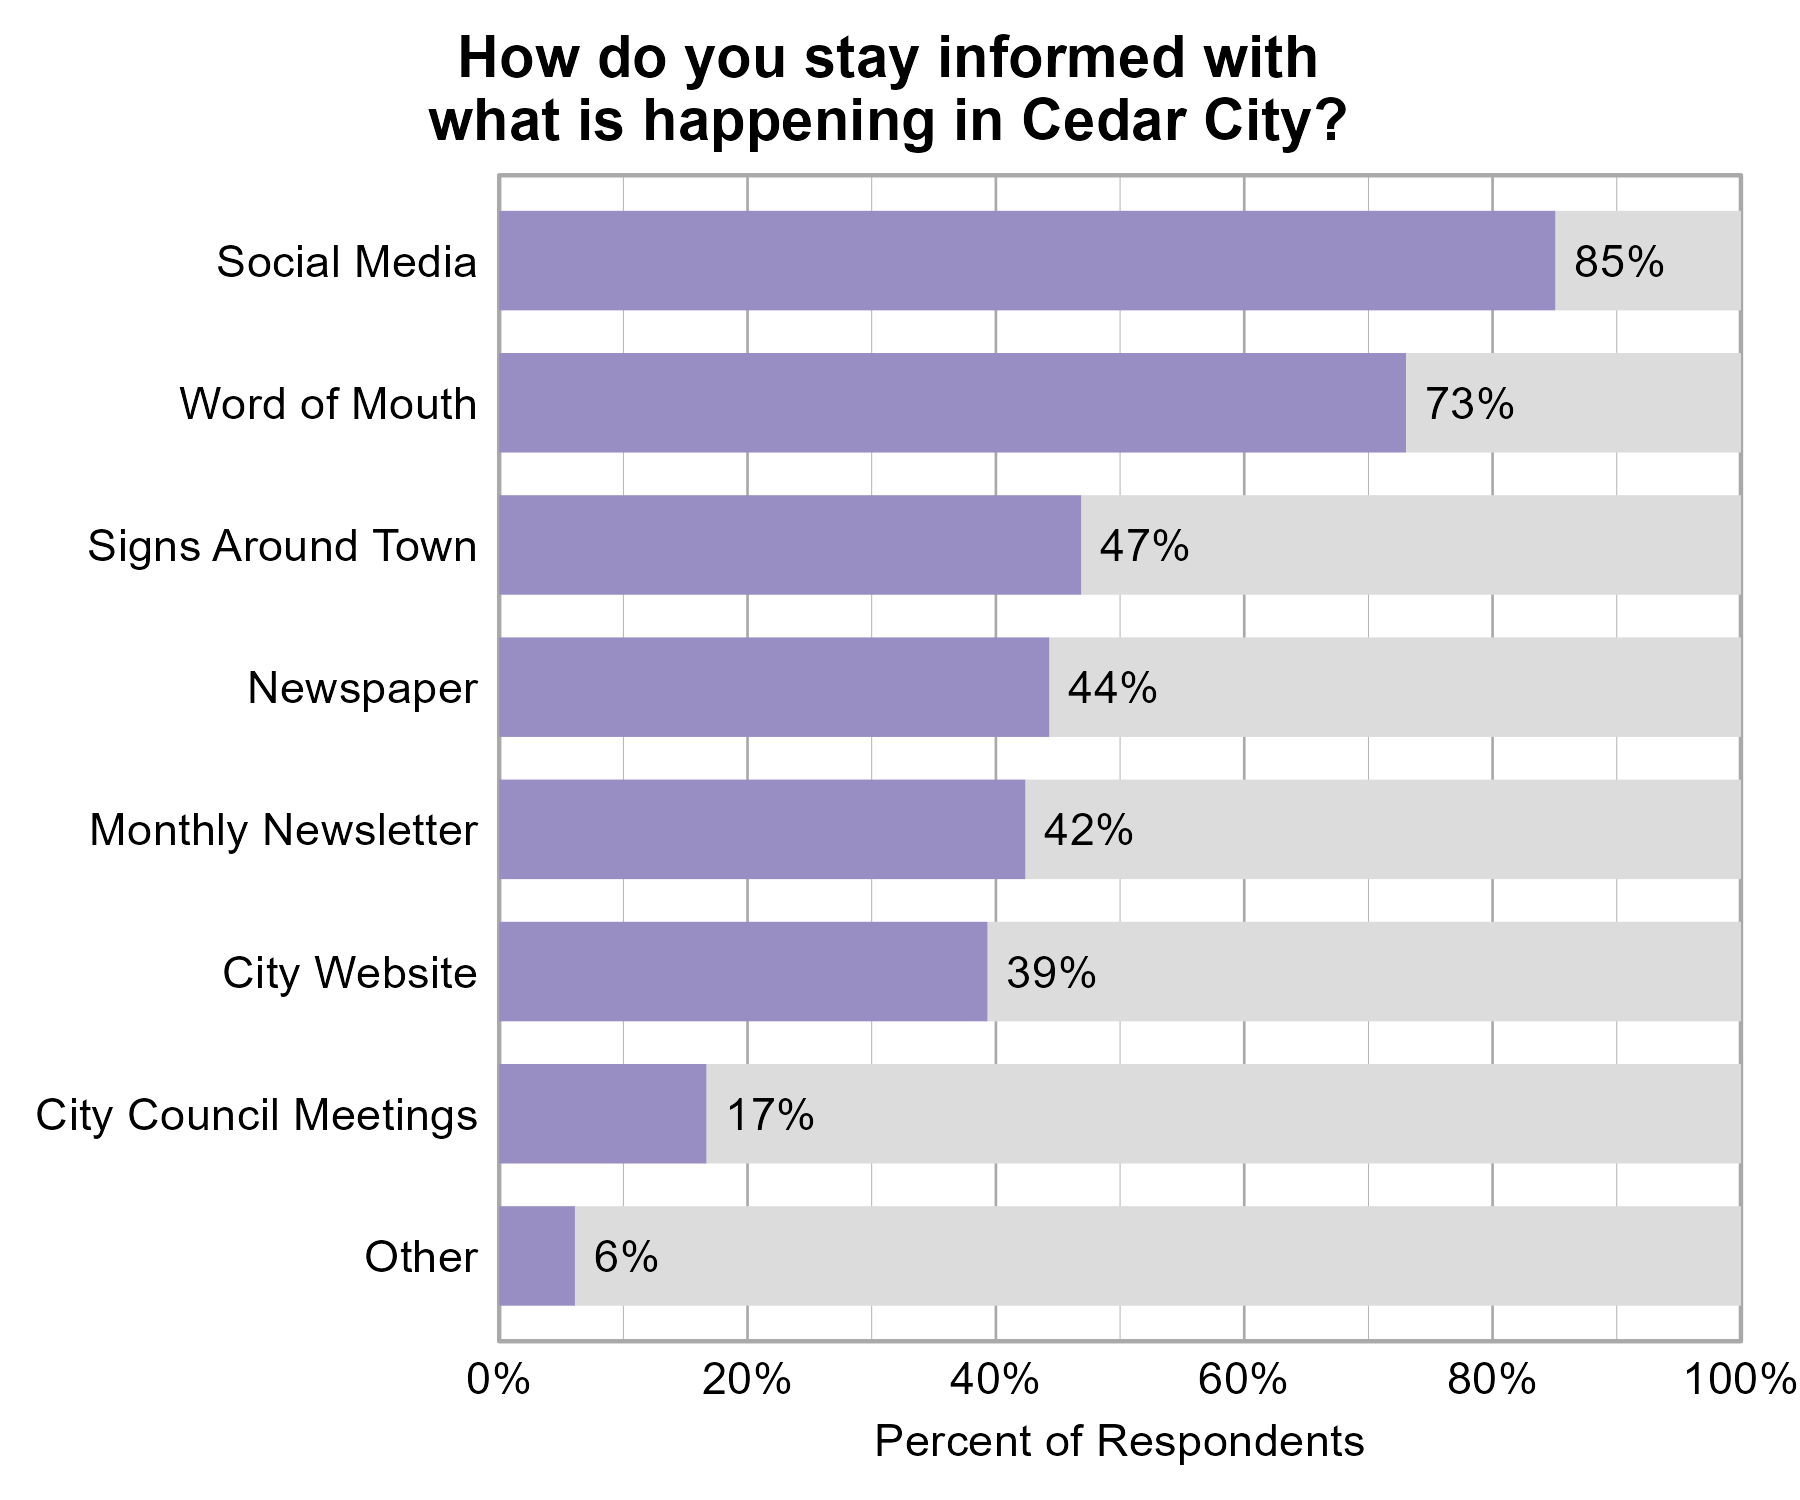
Methods of Communication in Cedar City
Survey participants were also asked a few additional questions from Cedar City government in the survey. When asked about how they stay informed with what is happening in Cedar City, the most common responses were Social Media (85%), and Word of Mouth (73%). Other methods raised by respondents included Iron County Today, work, universities, city meetings, radio, and church.
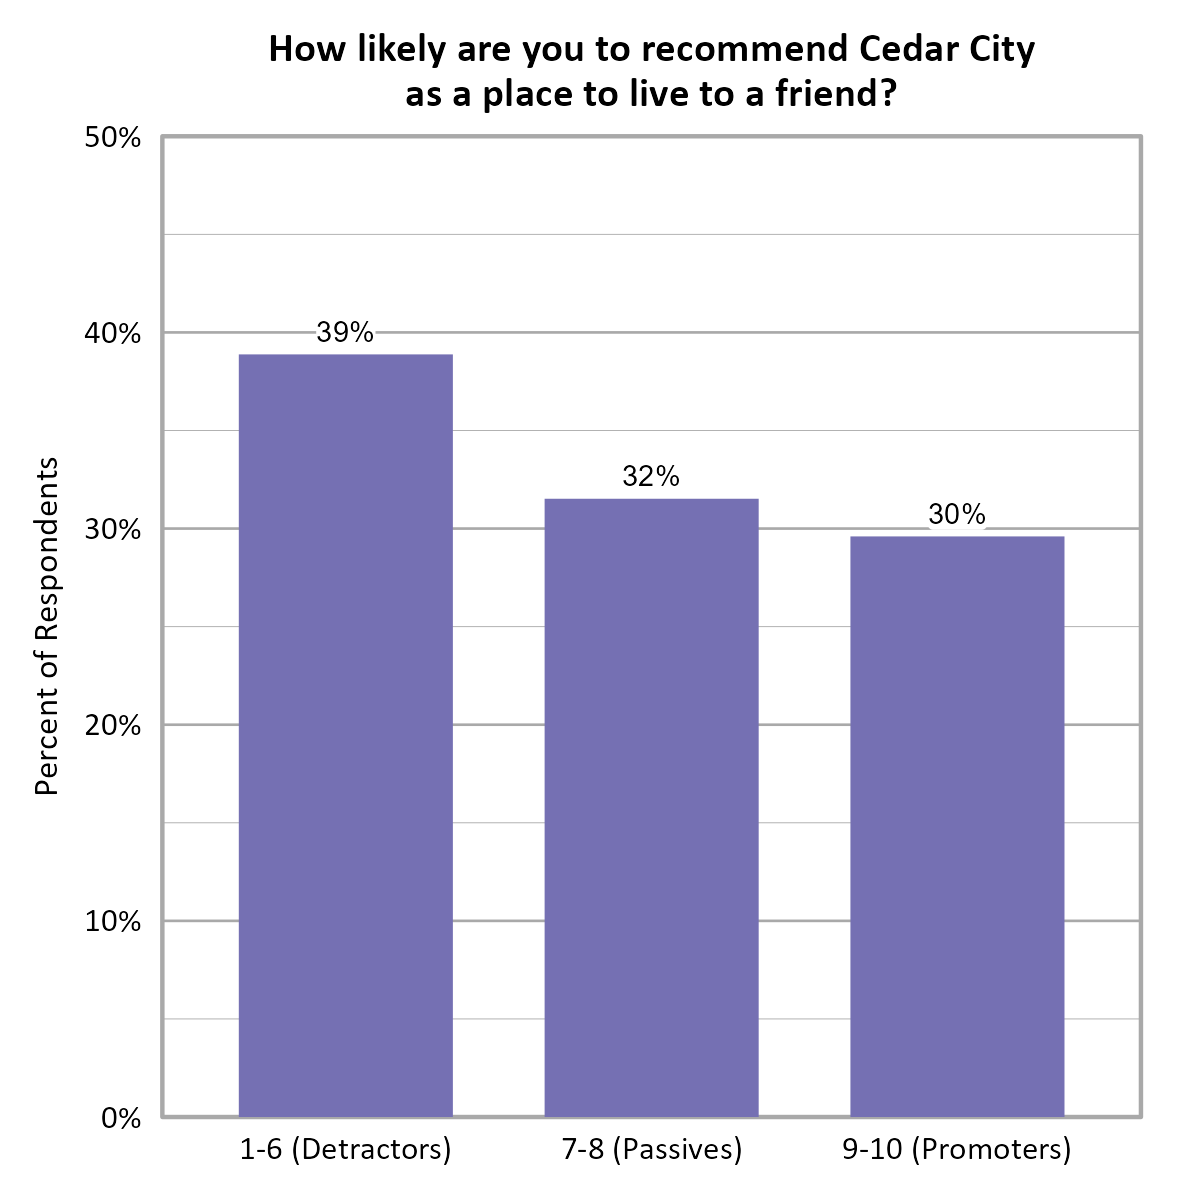
Likelihood to Recommend Cedar City as a Place to Live
Survey participants were asked about how likely they are to recommend Cedar City as a place to live to a friend on a scale from 1 (Not at all likely) to 10 (Extremely likely), which were then grouped according to groups defined by a modified Net Promoter Score where Detractors have scores 1-6, Passives have scores 7-8, and Promoters have scores 9-10. The modified Net Promoter Score (calculated by subtracting the % of Detractors from % of Promoters) for this question is -9.
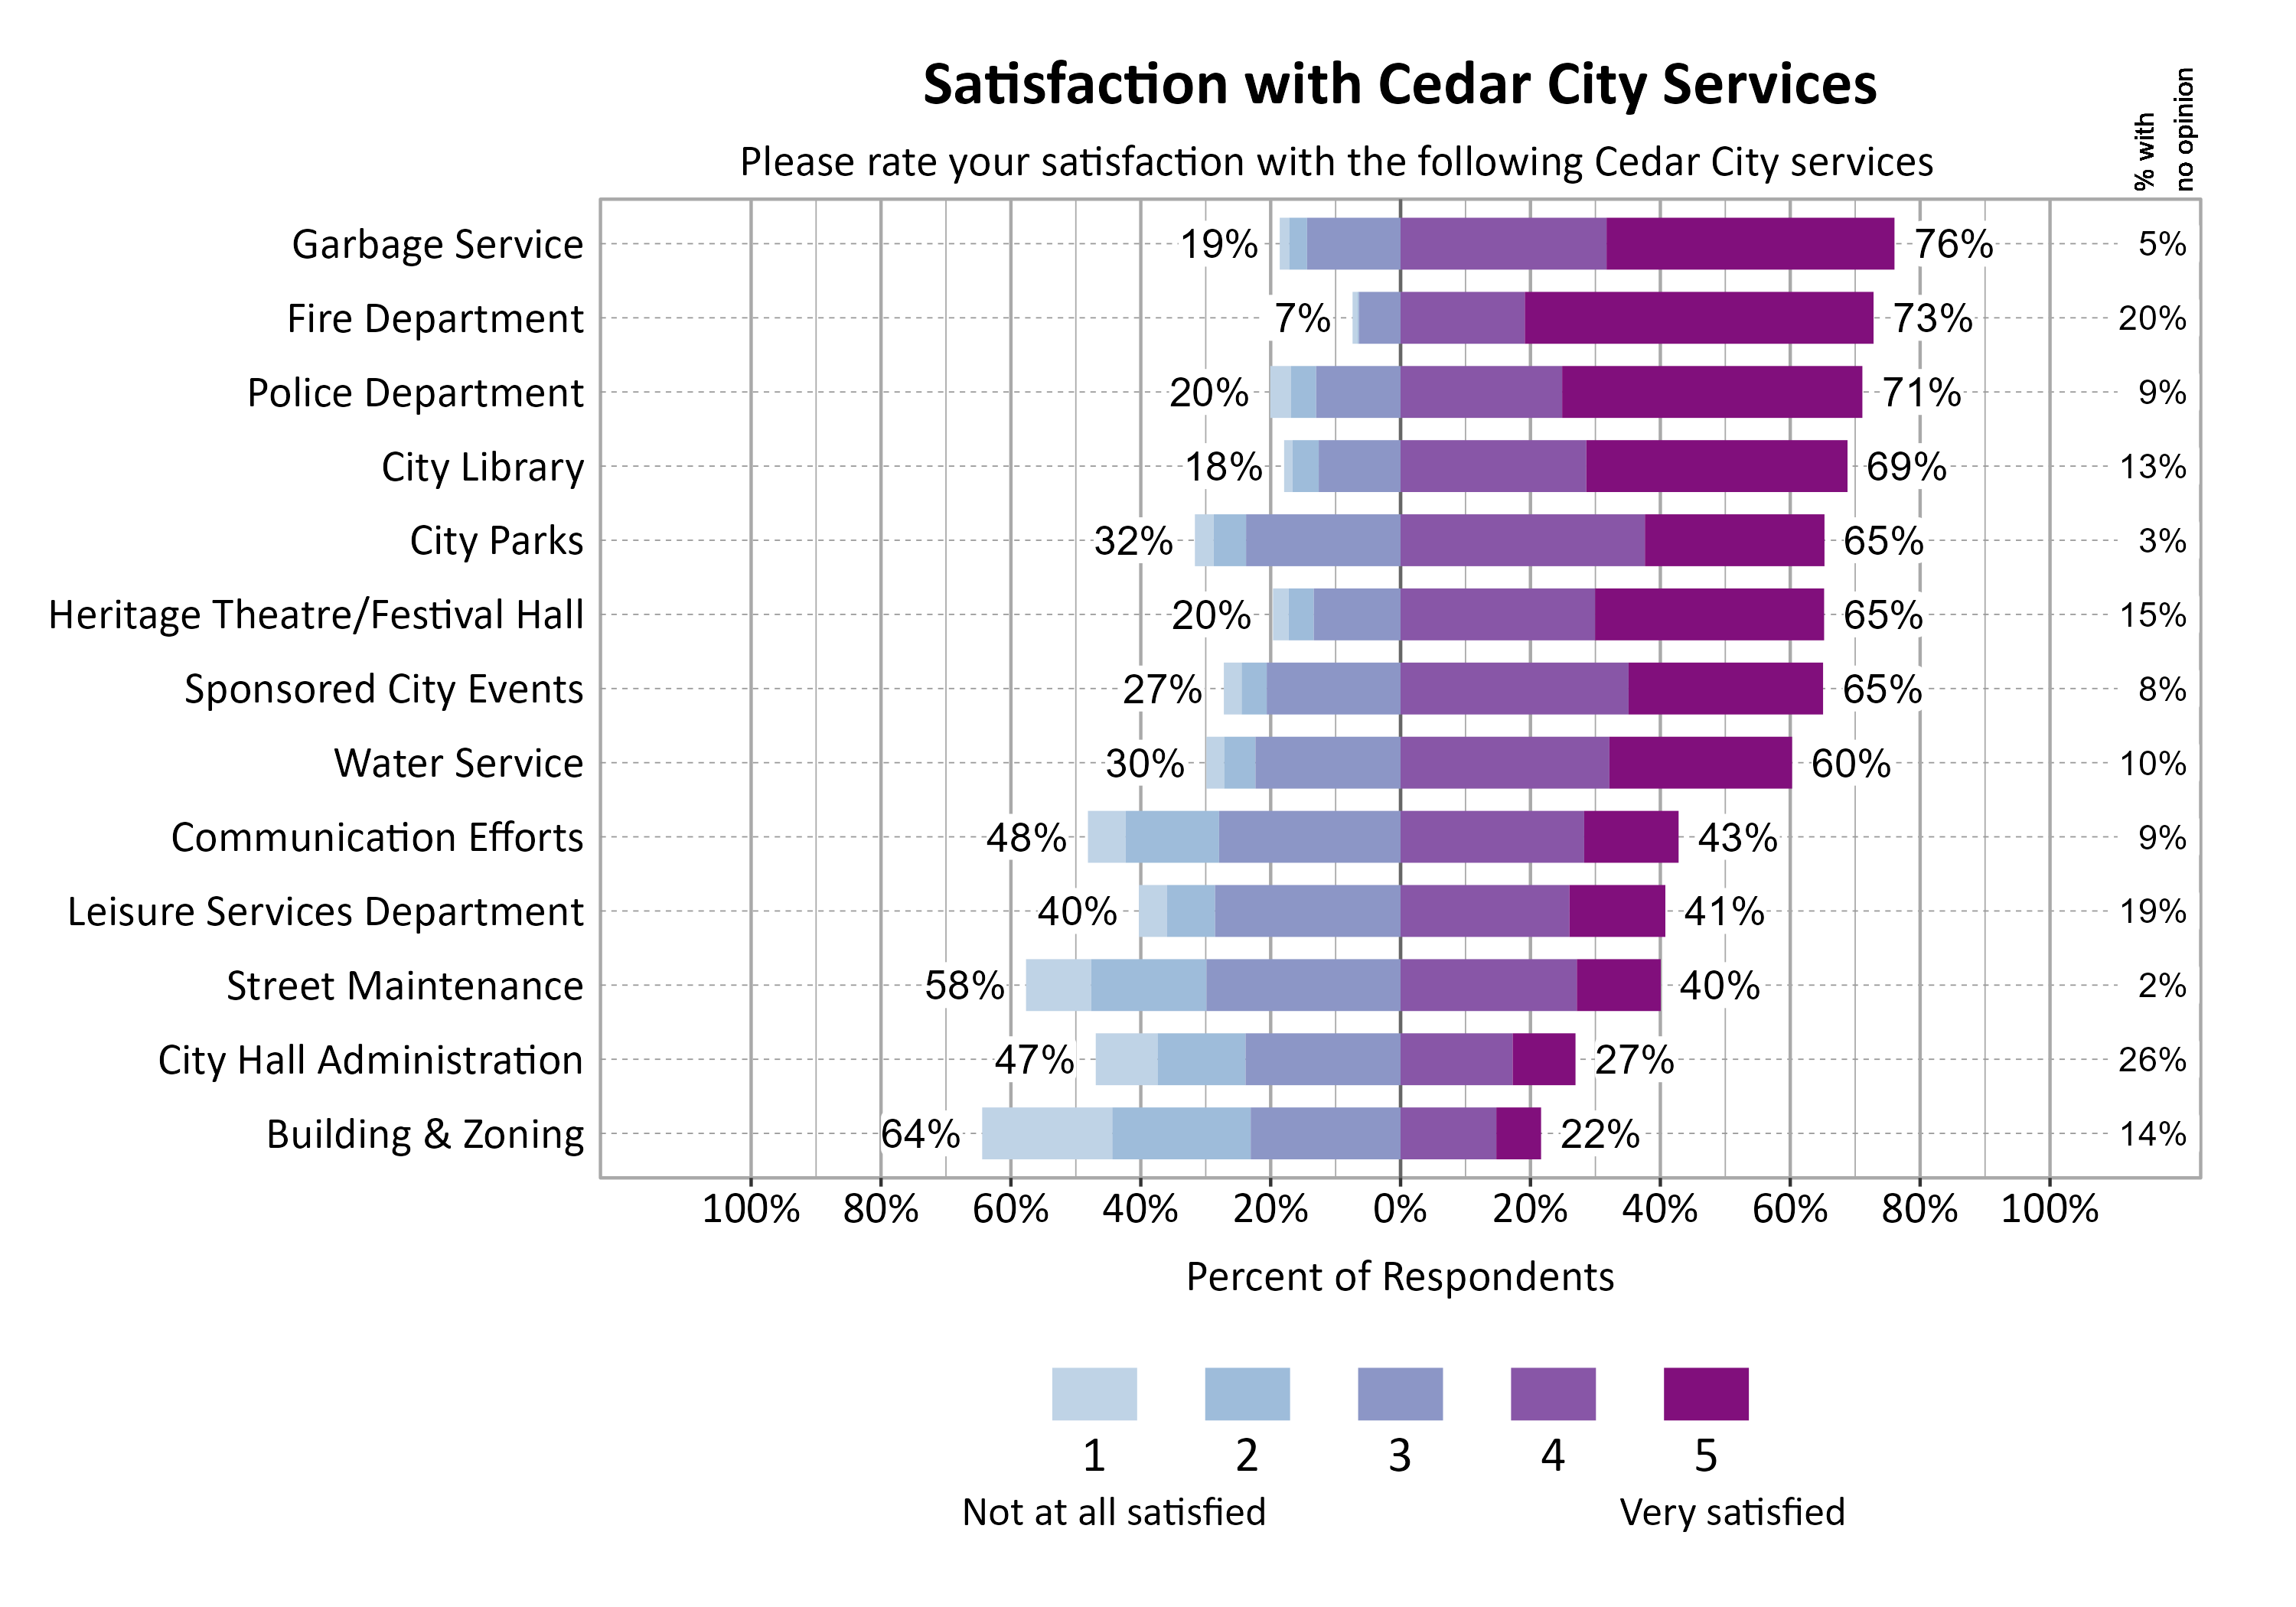
Satisfaction of Cedar City Services
Survey participants were also asked to rate their satisfaction with various Cedar City services on a scale from 1 (Not at all satisfied) to 5 (Very satisfied), with an option to say they had no opinion. The highest rated services with a 4 or 5 were Garbage Service (76%), Fire Department (73%), and the Police Department (71%).
Open Comments
All open comments collected in the survey were shared with city leaders. General observations and themes are shared here.
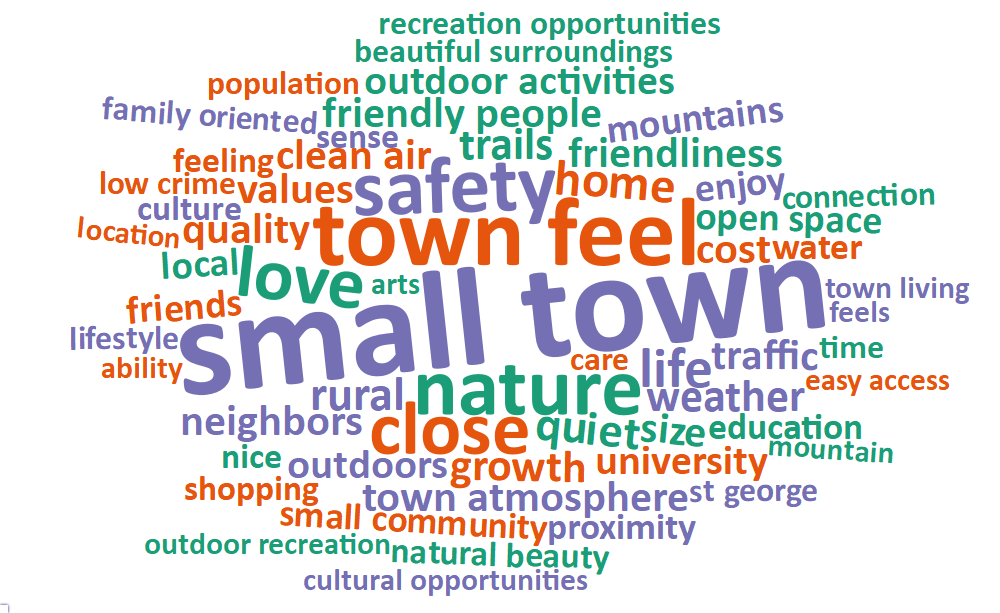
What Respondents Value Most in Cedar City
Survey respondents were asked to comment on what they value most about Cedar City. The most common words and phrases from all city comments are included in the word cloud below. It is possible that negative or unrelated words may appear since these words have been taken out of context, and they may not indicate the respondent’s intended meaning. The most comments indicated value for the small town feel and amenities of Cedar City. Many others indicated value of the people, friendliness and community. Many value the nature, beauty, views, and access to recreational activities.
Local Environmental Quality in Cedar City
The 35% of respondents who rated the Local Environmental Quality domain as 1, 2, or 3 (Poor, Fair, or Moderate) were further asked if there are specific aspects of local environmental quality that they feel are problematic. Trash across Cedar City was a large concern, and dust, litter, and rundown houses and buildings were all noted. Water scarcity and quality were mentioned as well and how new housing developments put current water rights at risk.
Improving Wellbeing in Cedar City
Survey respondents were asked if there is anything that could be done to improve wellbeing in Cedar City. Many respondents felt that slowing or stopping the growth and development of Cedar City would improve their wellbeing. They especially complained about related traffic and transportation issues and urged developers and city planners to plan better and ensure that proper infrastructure is in place before building. Several commenters also expressed concerns about zoning changes and felt that the planning commission has been enacting too many changes to zoning in order to help developers. Some commenters expressed concern about access to limited water resources with continued growth. Several commenters asked for more retail options, especially grocery stores (such as Costco, which was mentioned several times) and more restaurant options.
Additional Comments
Respondents were also asked if they had any additional comments on wellbeing in Cedar City. Most comments addressed growth and development, addressing concerns about increasing population, insufficient infrastructure, and changing town character and values. This question brought up more concerns about growth and development leading to problems with safety due to drugs, graffiti, etc. perceived to be increasing with outsiders. Several comments addressed social issues, such as unfriendliness, political contention, changing social climate. Several comments also addressed government issues, such as working conditions for government workers, political conflict/gridlock, and corruption/selfishness.