Clinton Wellbeing Survey Findings 2024
By Dr. Courtney Flint and Team
![]()
Contact Information
Dr. Courtney Flint
courtney.flint@usu.edu
435-797-8635
Summary
Clinton is one of 51 cities participating in the Utah Wellbeing Survey Project in 2024. This project is designed to assess the wellbeing and local perspectives of city residents and to provide information to city leaders to inform general planning processes. Additional analysis is underway and this report may be updated over time.
We are grateful to all those who took the survey and to our city partners who helped to make this possible. We are grateful to a number of entities for funding: the Utah League of Cities and Towns, USU Extension, USU’s Institute for Land Water and Air, the Wasatch Front Regional Council, Utah Department of Transportation, the Utah Agricultural Experiment Station, and the cities of Alpine, Cedar Hills, Draper, Millcreek, Nephi, North Salt Lake, Ogden, Orem, Pleasant Grove, Providence, Springdale, Tremonton, West Bountiful, and West Valley City.
This report describes findings from the 2024 Clinton survey and comparative information with other project cities. In March and April 2024, Clinton City advertised the survey for residents largely through the city webpage, social media, newsletters, flyers, and email. All city residents age 18+ were encouraged to take the online Qualtrics survey.
How many people responded?
- 461 viable surveys were recorded in this 2024 survey effort.
- The adult population of Clinton was estimated at 15,914, based on the American Community Survey by the U.S. Census. The 461 survey responses in 2024 represent 2.9% of the adult population and have a conservative margin of error of 4.5%.
Survey Respondent Characteristics
| Resident Statistics | |
|---|---|
| Full Time Residents of Clinton | 99.1% |
| Part Time Residents of Clinton | 0.9% |
| Length of Residency — Range | 0.3-85 years |
| Length of Residency — Average | 15.3 years |
| Length of Residency — Median | 10.5 years |
| Length of Residency 5 Years or less | 27.1% |
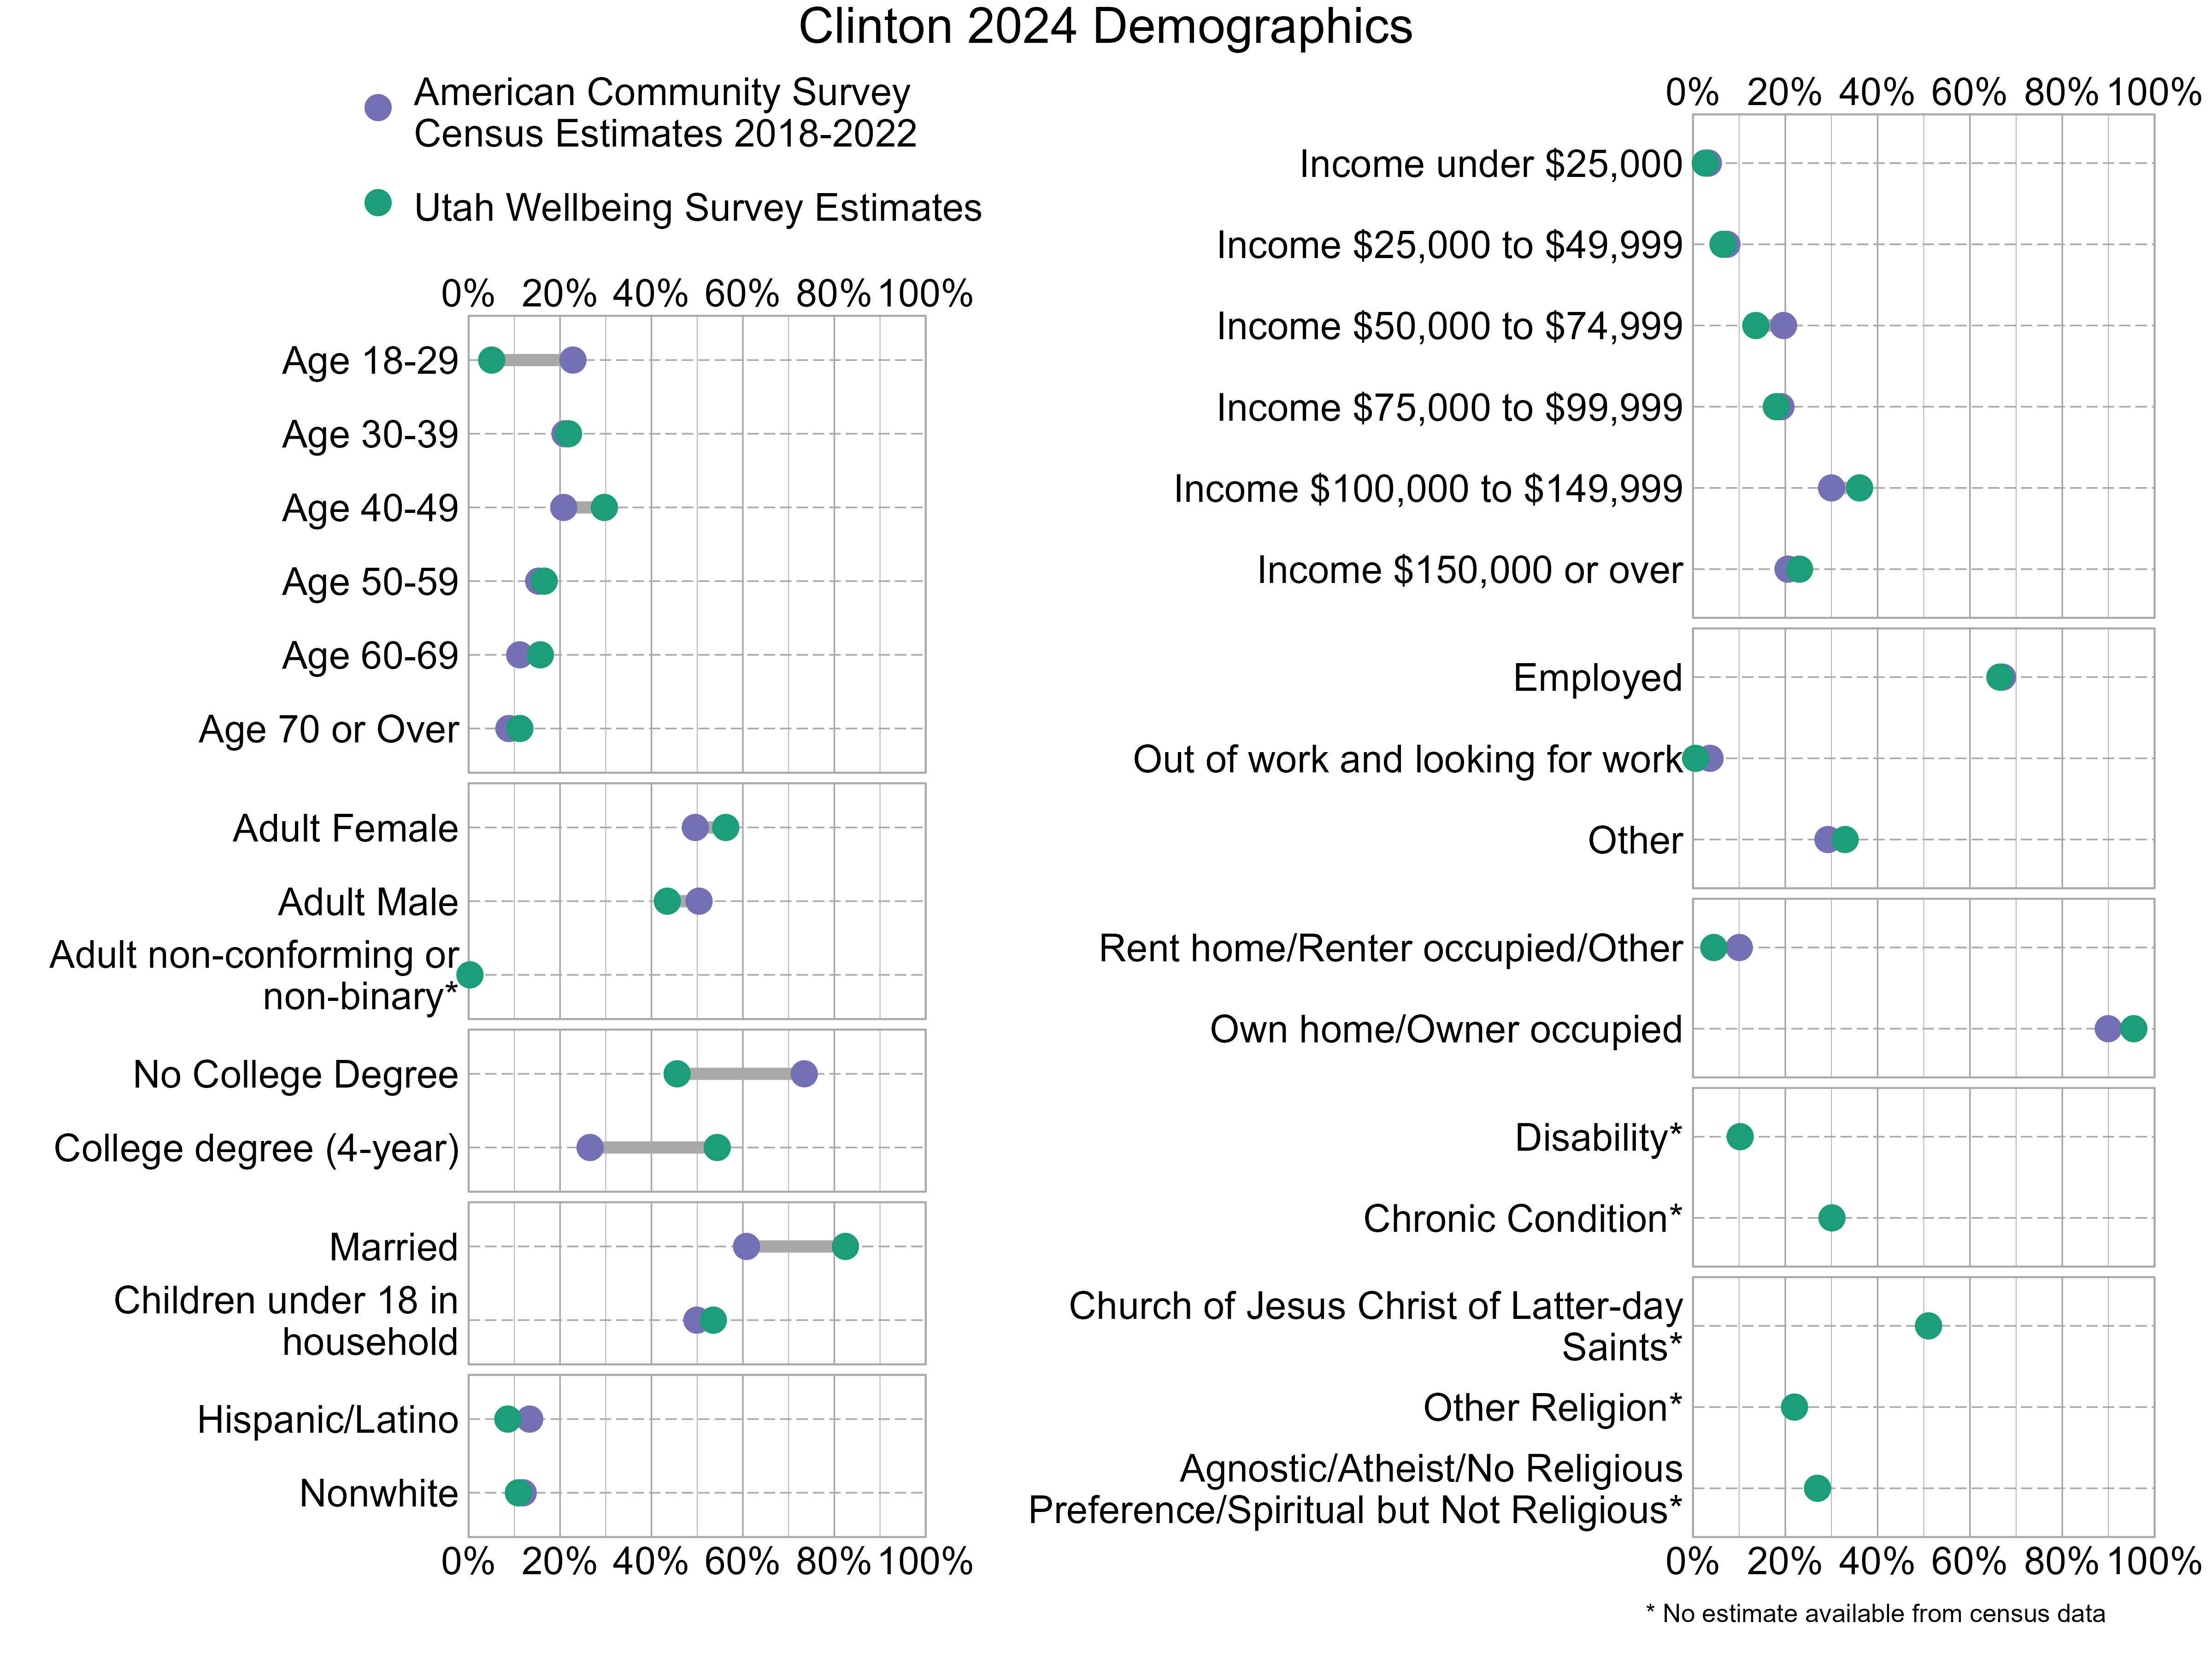
Demographic characteristics of the survey respondents were compared below with U.S. Census information from the 2018-2022 American Community Survey. In the graph below, gray bars indicate differences between the American Community Survey estimates and the Utah Wellbeing Project surveys. The wider the gray bars, the larger the differences. Also note that estimates for religious affiliation, adult non-conforming or non-binary gender, disability, and chronic conditions are unavailable from the census data. There can also be a variable margin of error in the American Community Survey estimates, and caution should be used when comparing estimates. Not all respondents provided demographic information. As the graph shows, 2024 survey respondents were not fully representative of Clinton. People who have at least a 4-year college degree and are married were overrepresented while those who are age 18-29 and do not have a college degree were underrepresented.
Overall Personal Wellbeing and Overall Wellbeing in Clinton
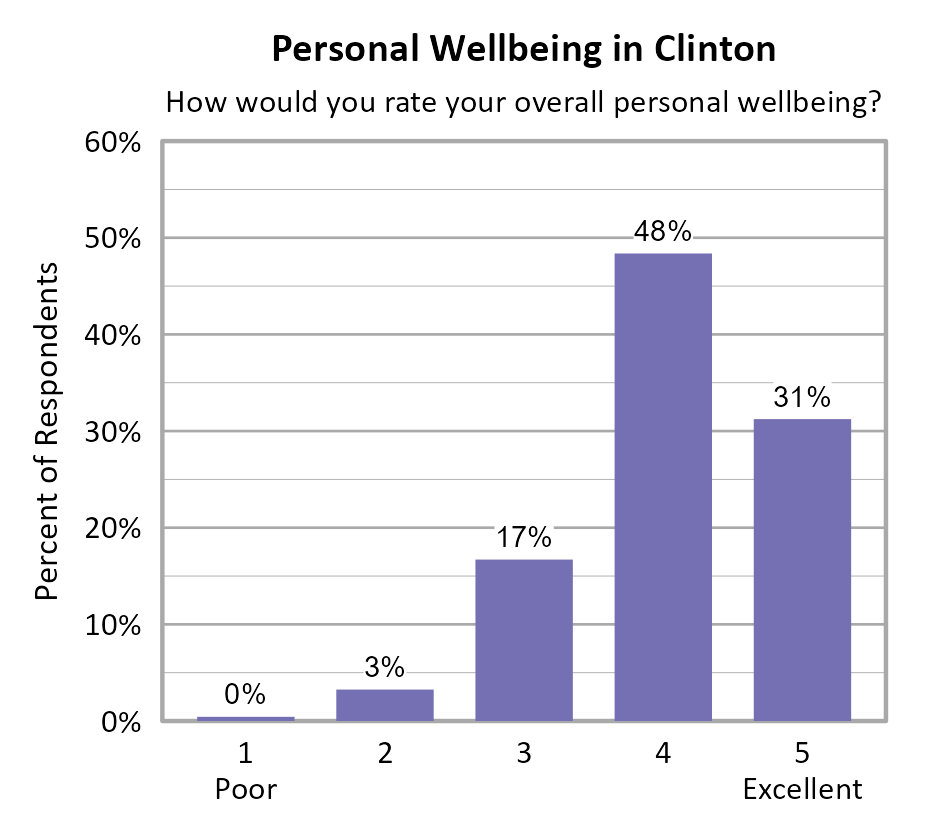
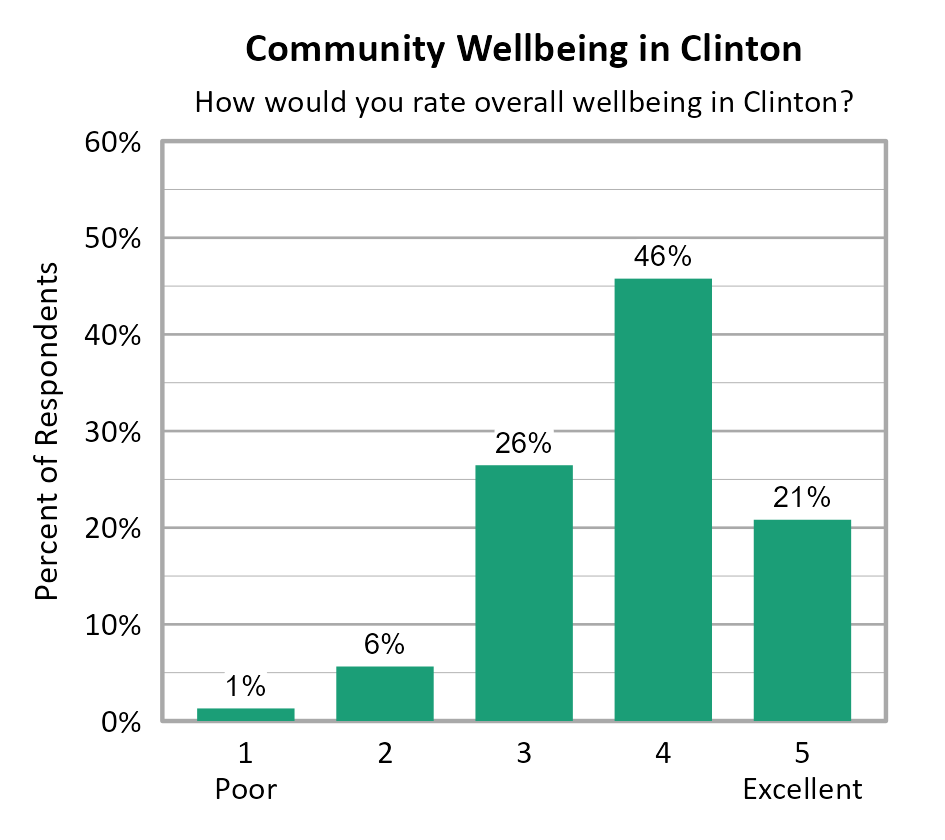
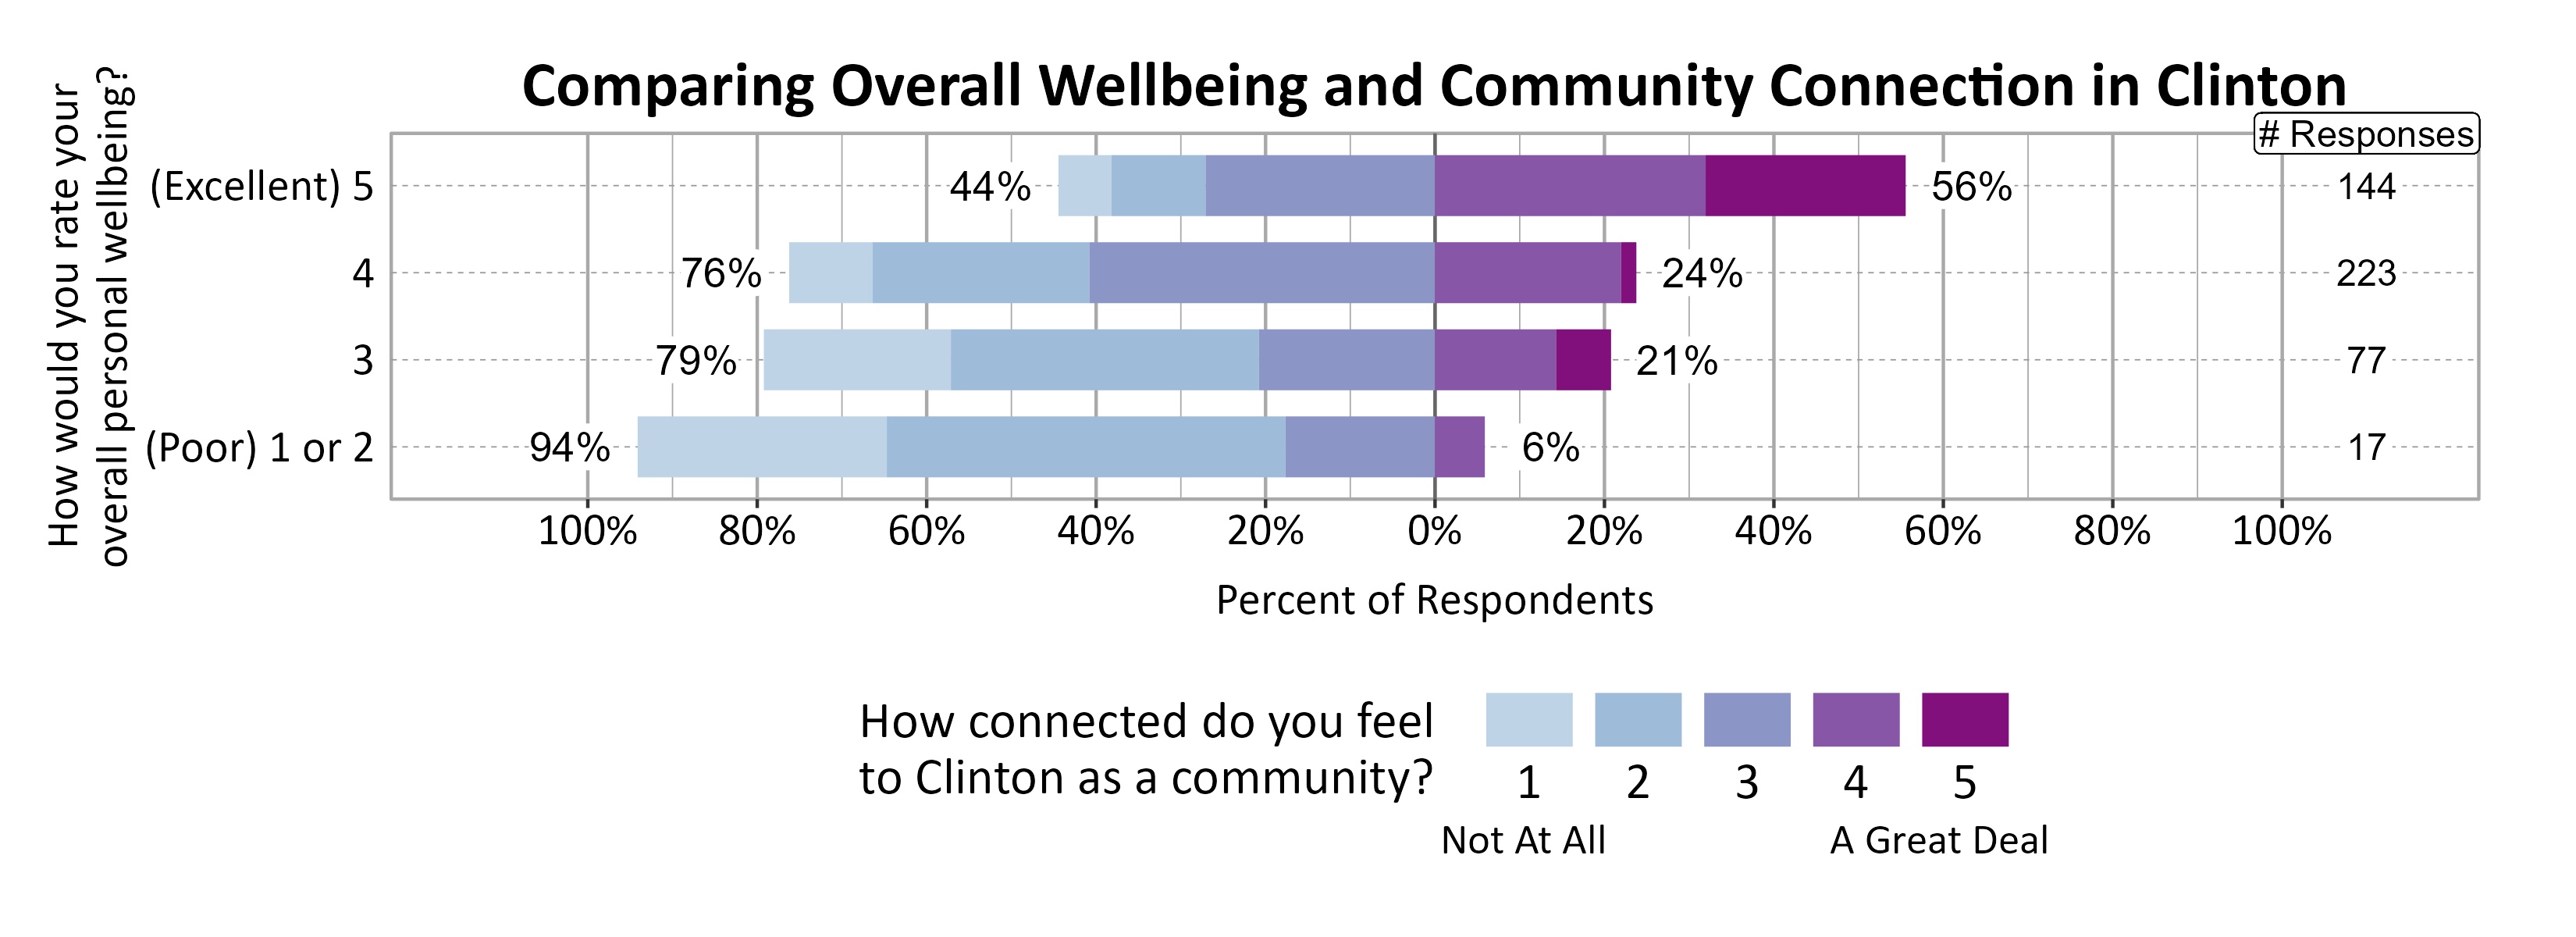
Survey participants were asked about their overall personal wellbeing and overall community wellbeing in Clinton. These wellbeing indicators were both measured on a 5-point scale from poor (1) to excellent (5). The average personal wellbeing score in Clinton was 4.07 with 80% of respondents indicating their wellbeing at a 4 or 5 on the 5-point scale. The average score for community wellbeing in Clinton was 3.79 with 67% of respondents indicating community wellbeing at a 4 or 5 on the 5-point scale.
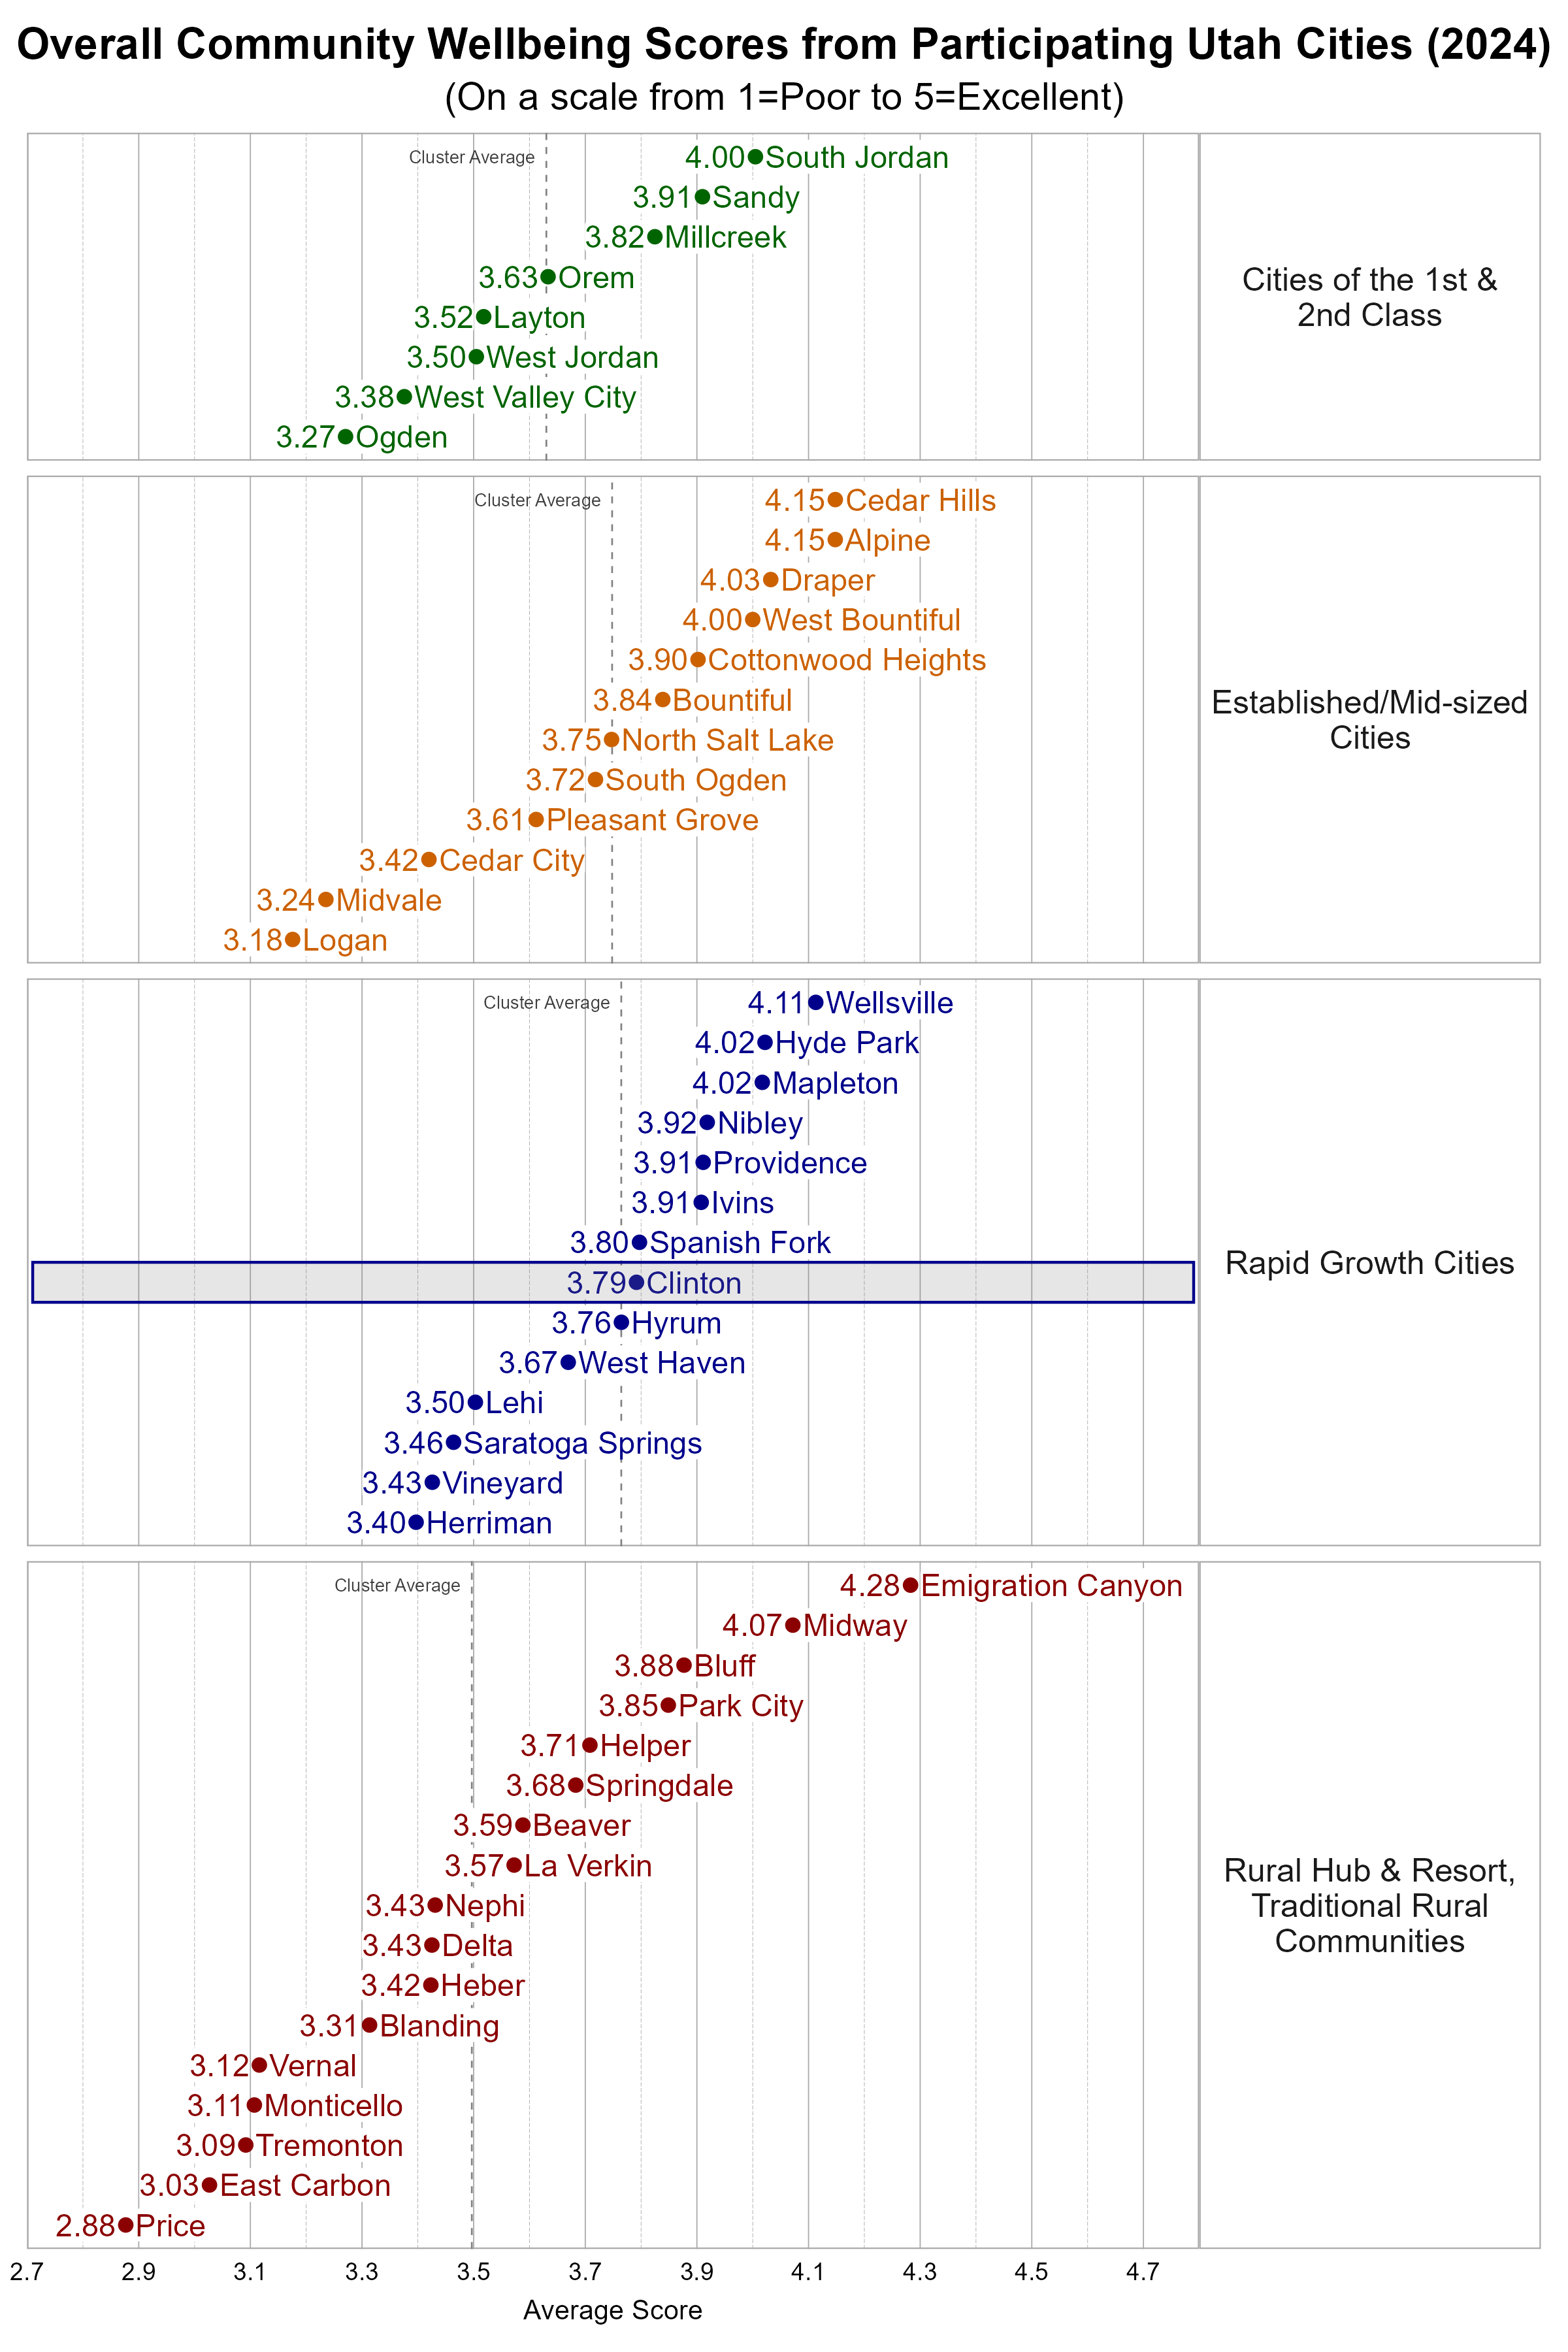
Comparing Wellbeing Across Utah Cities
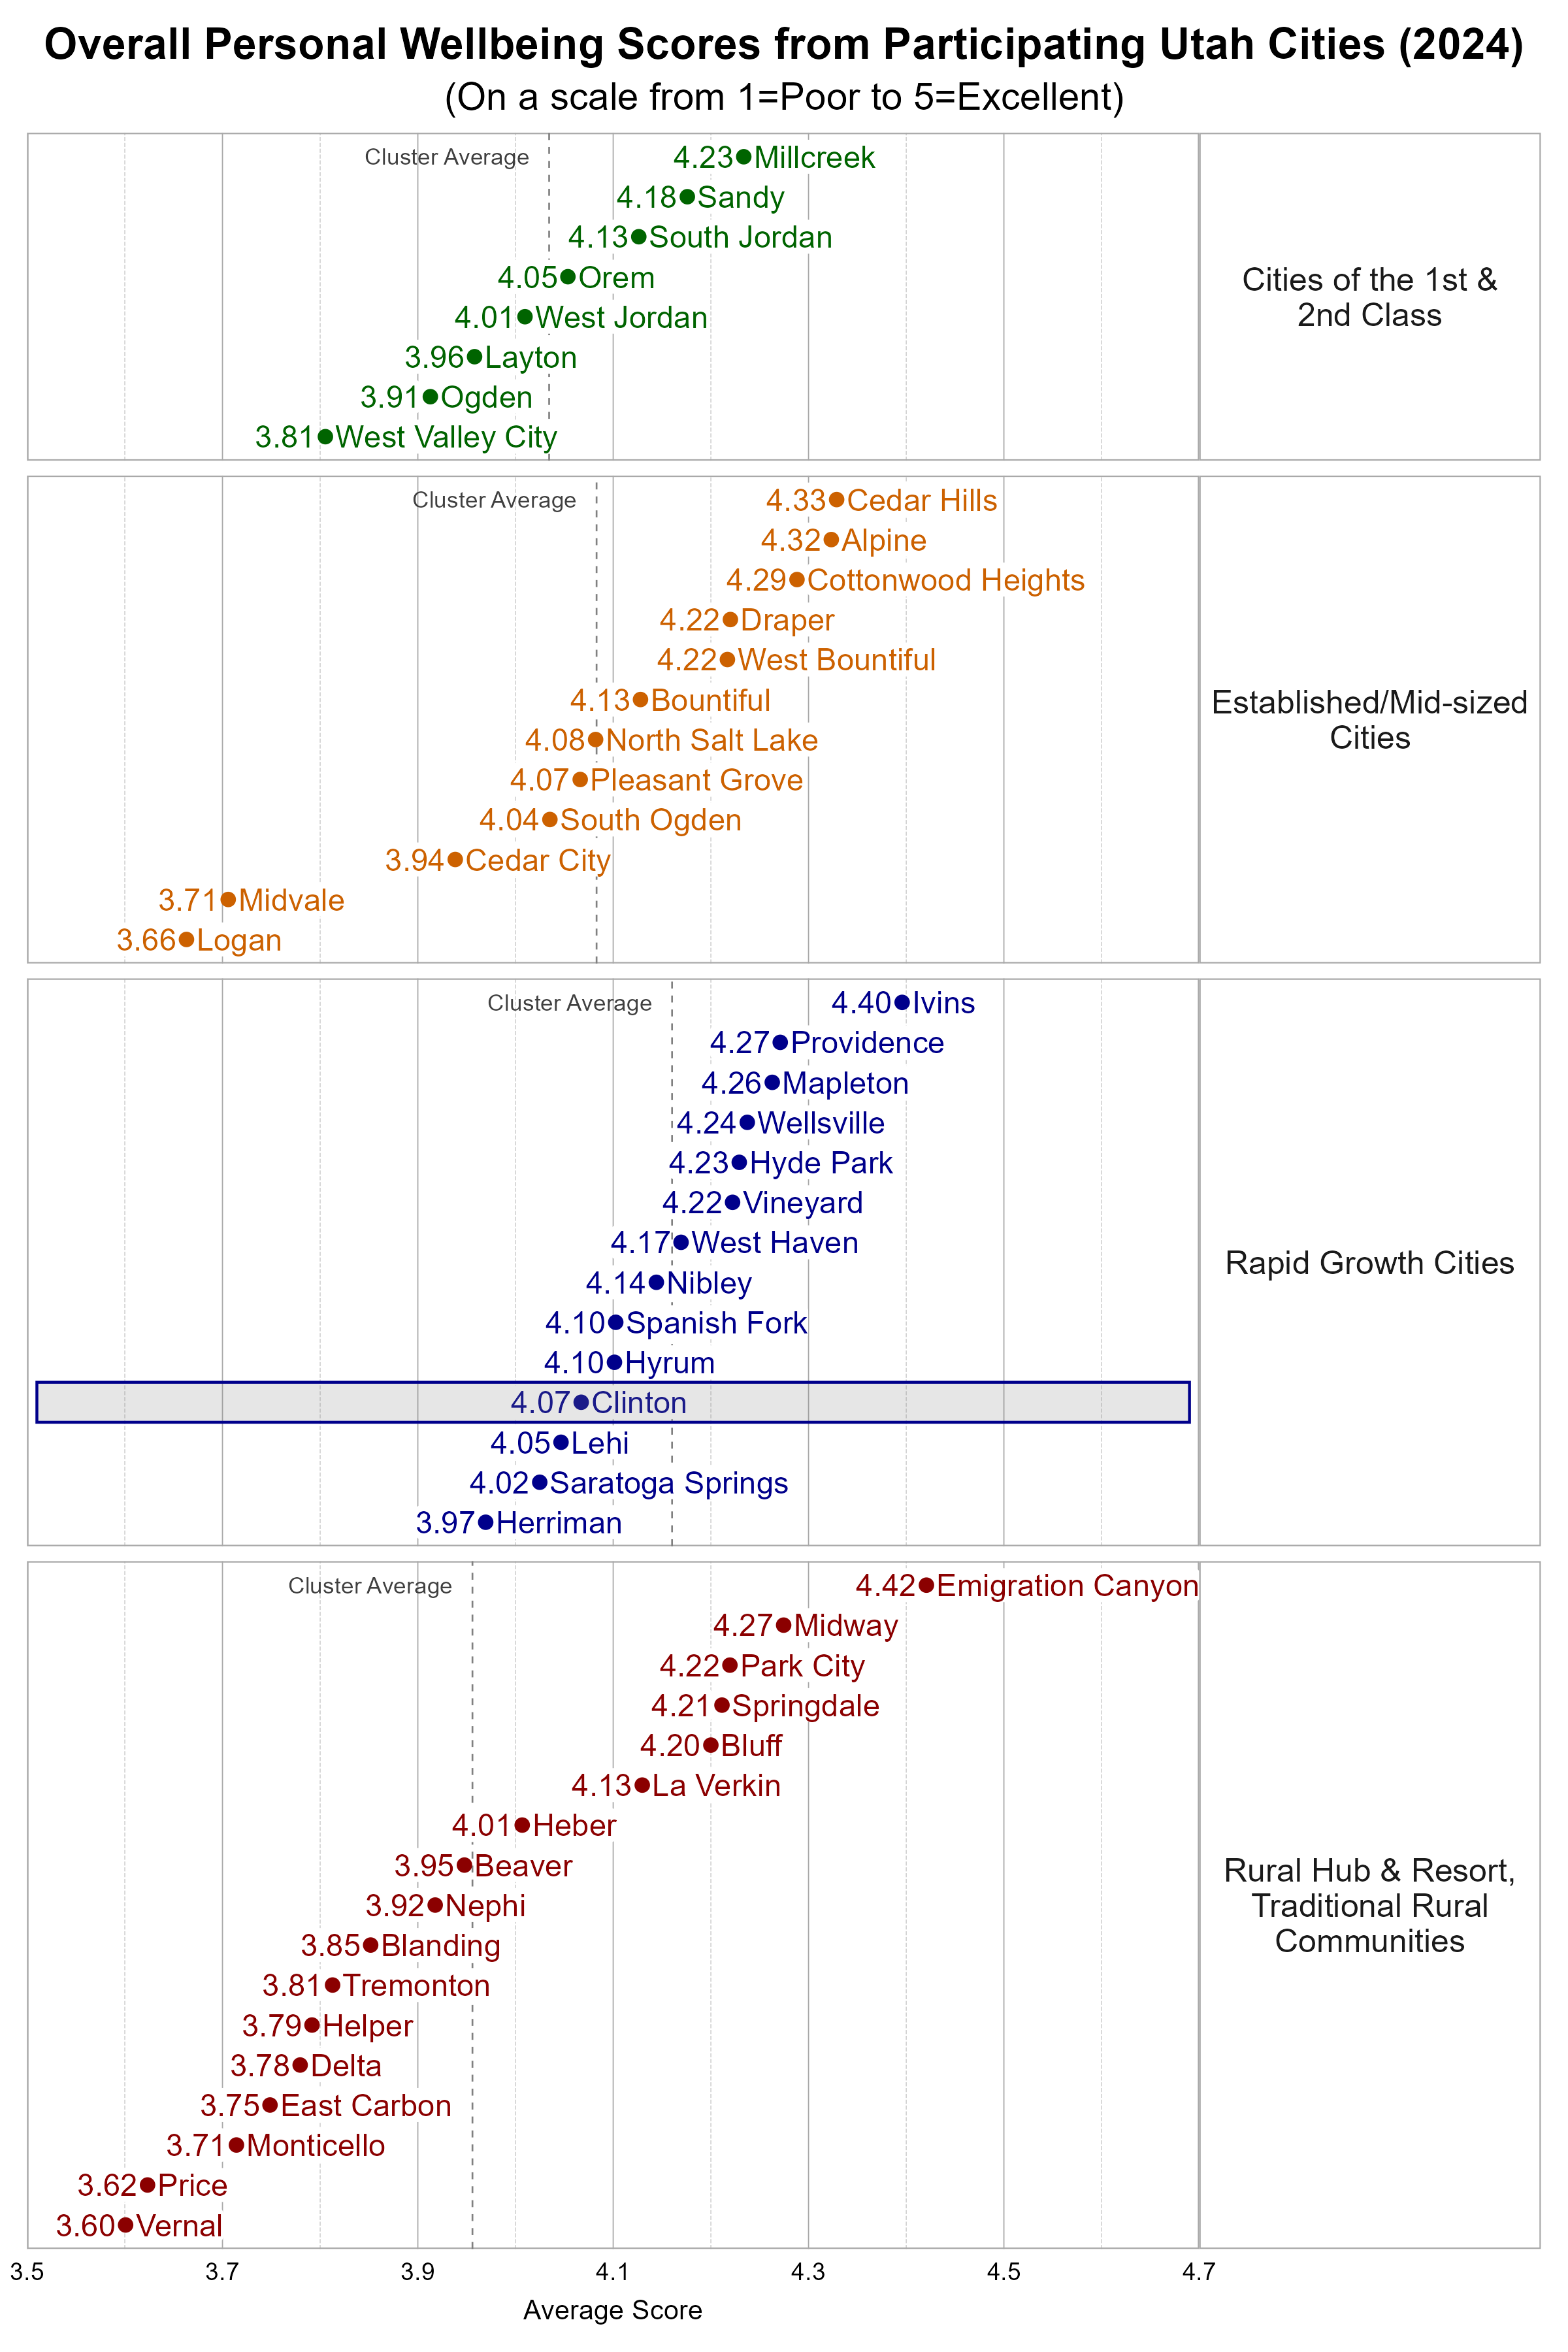
The Utah League of Cities and Towns clusters cities and towns into five different categories based on size and growth rates. We utilize these clusters in our analysis. Clinton is classified as a Rapid Growth City. Some cities may fit within more than one cluster.
Within the Rapid Growth city cluster, Clinton was below the average overall personal wellbeing score and close to the average overall community wellbeing score.
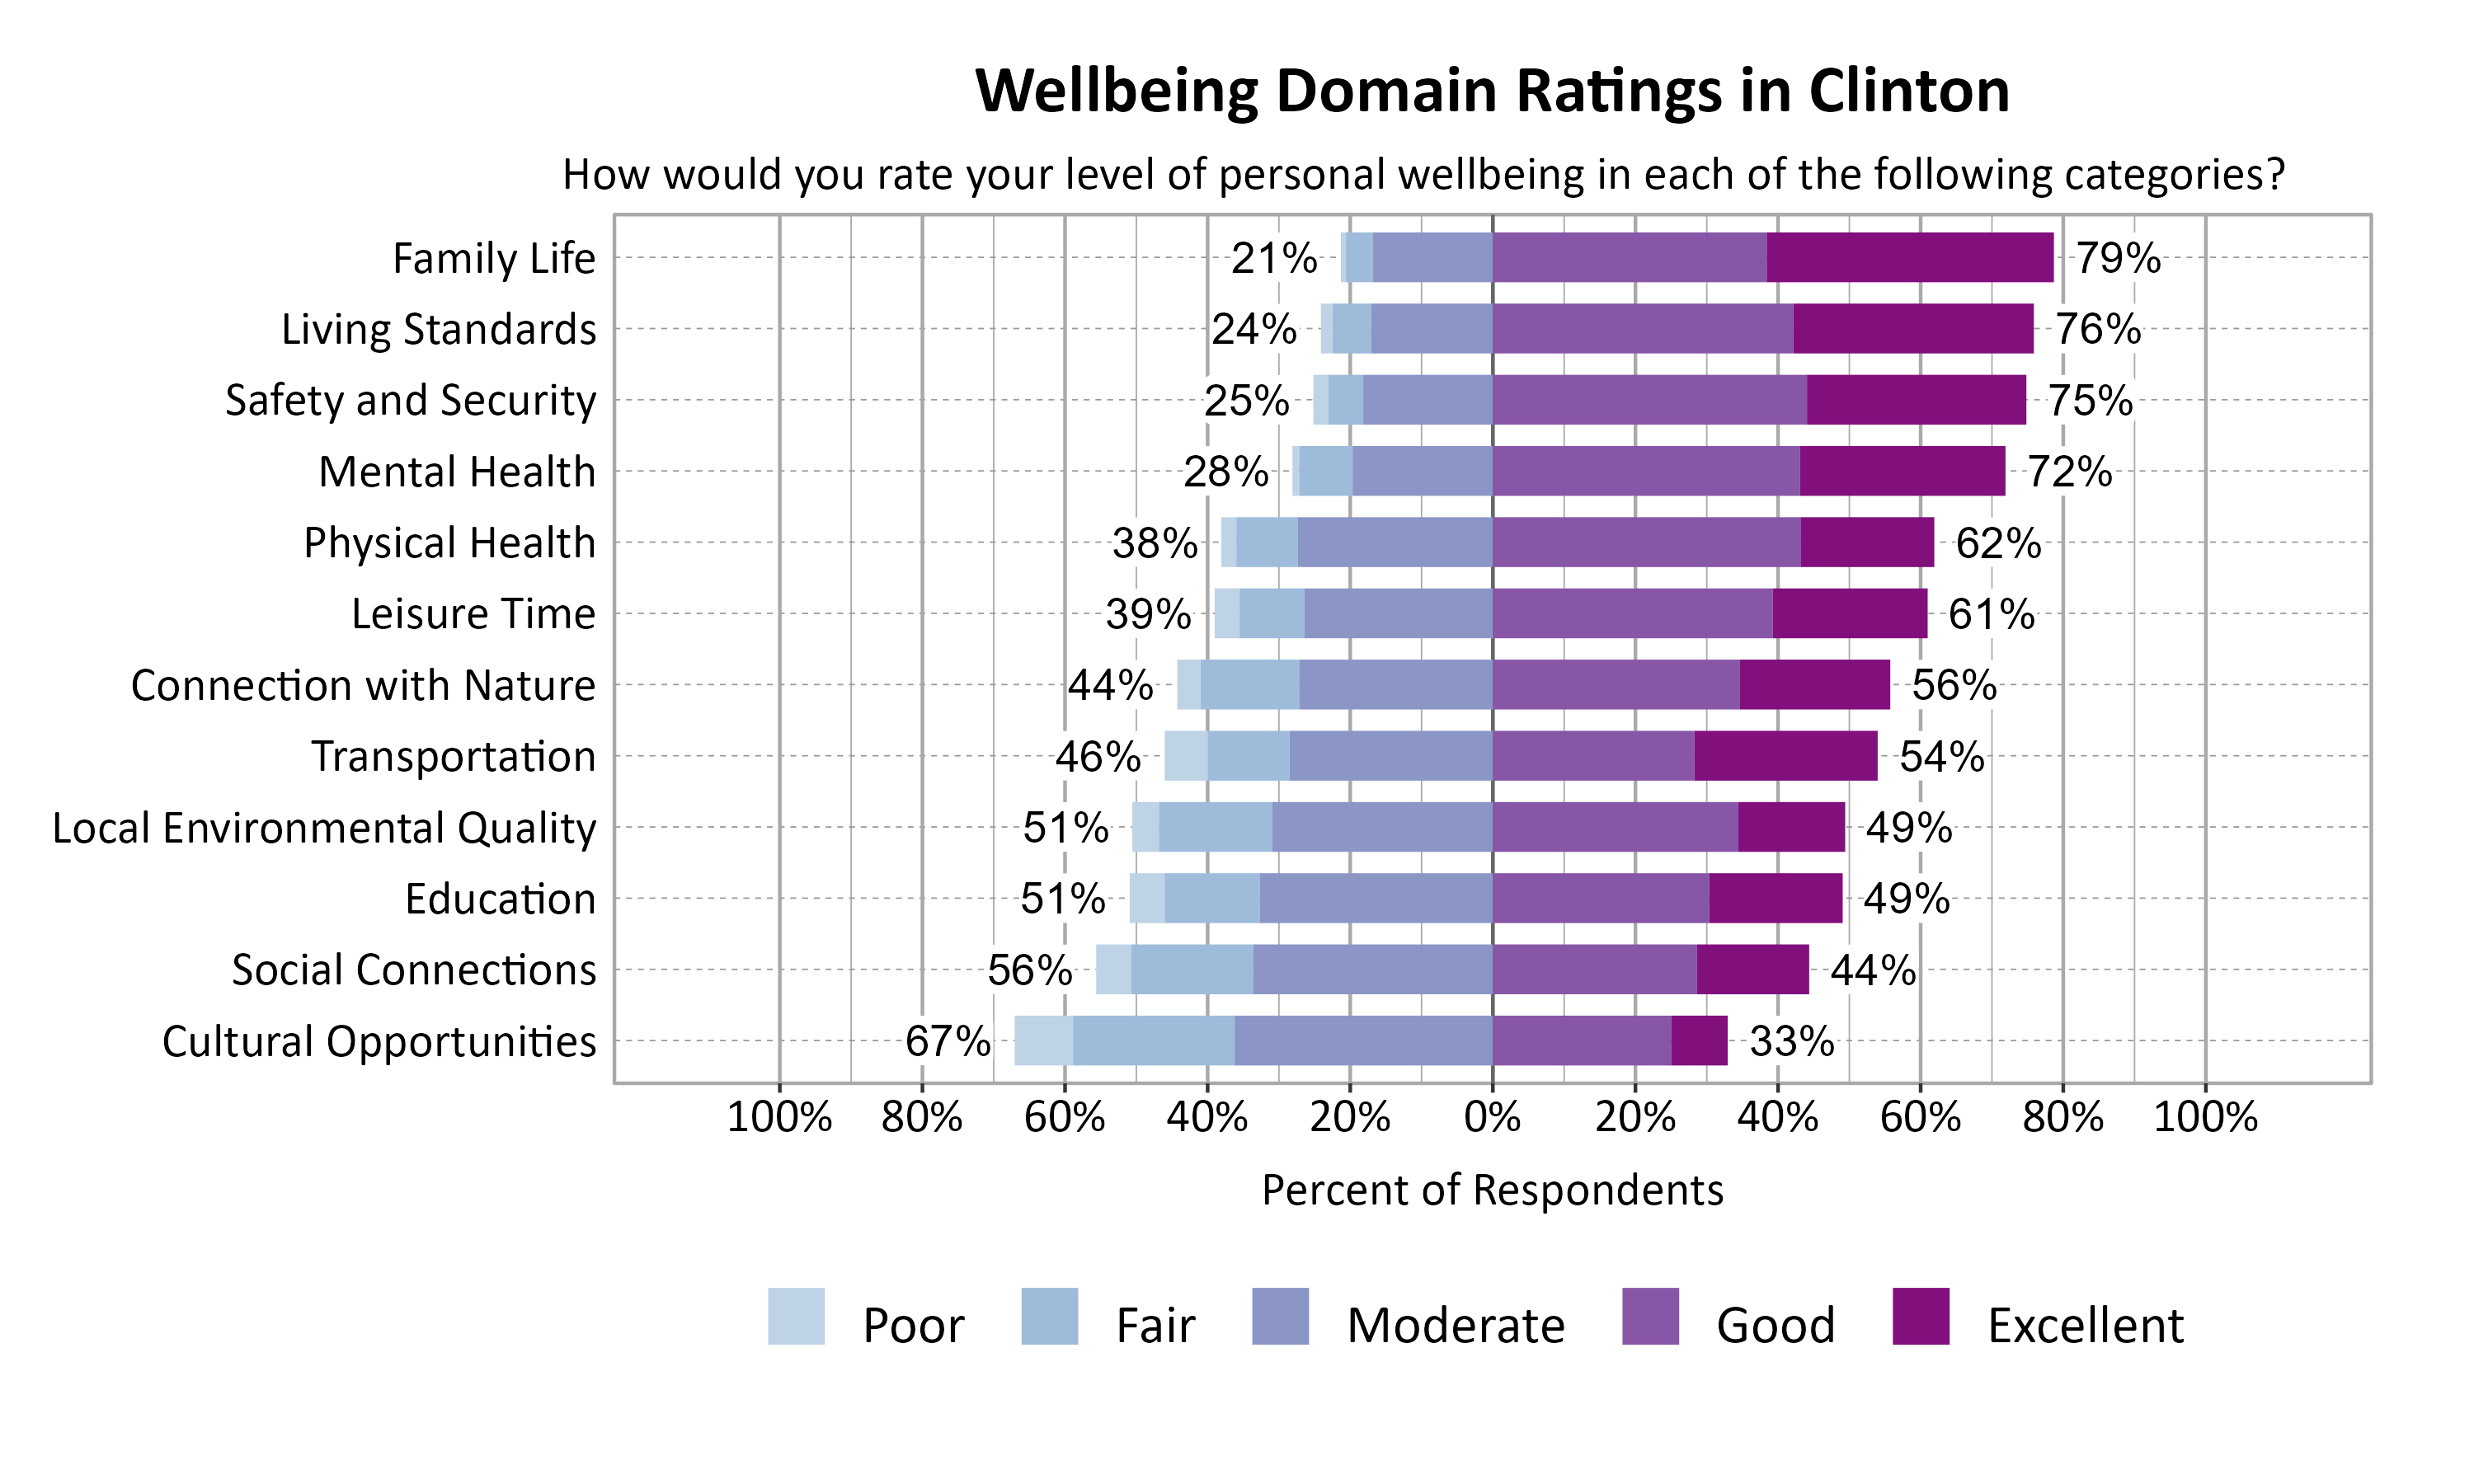
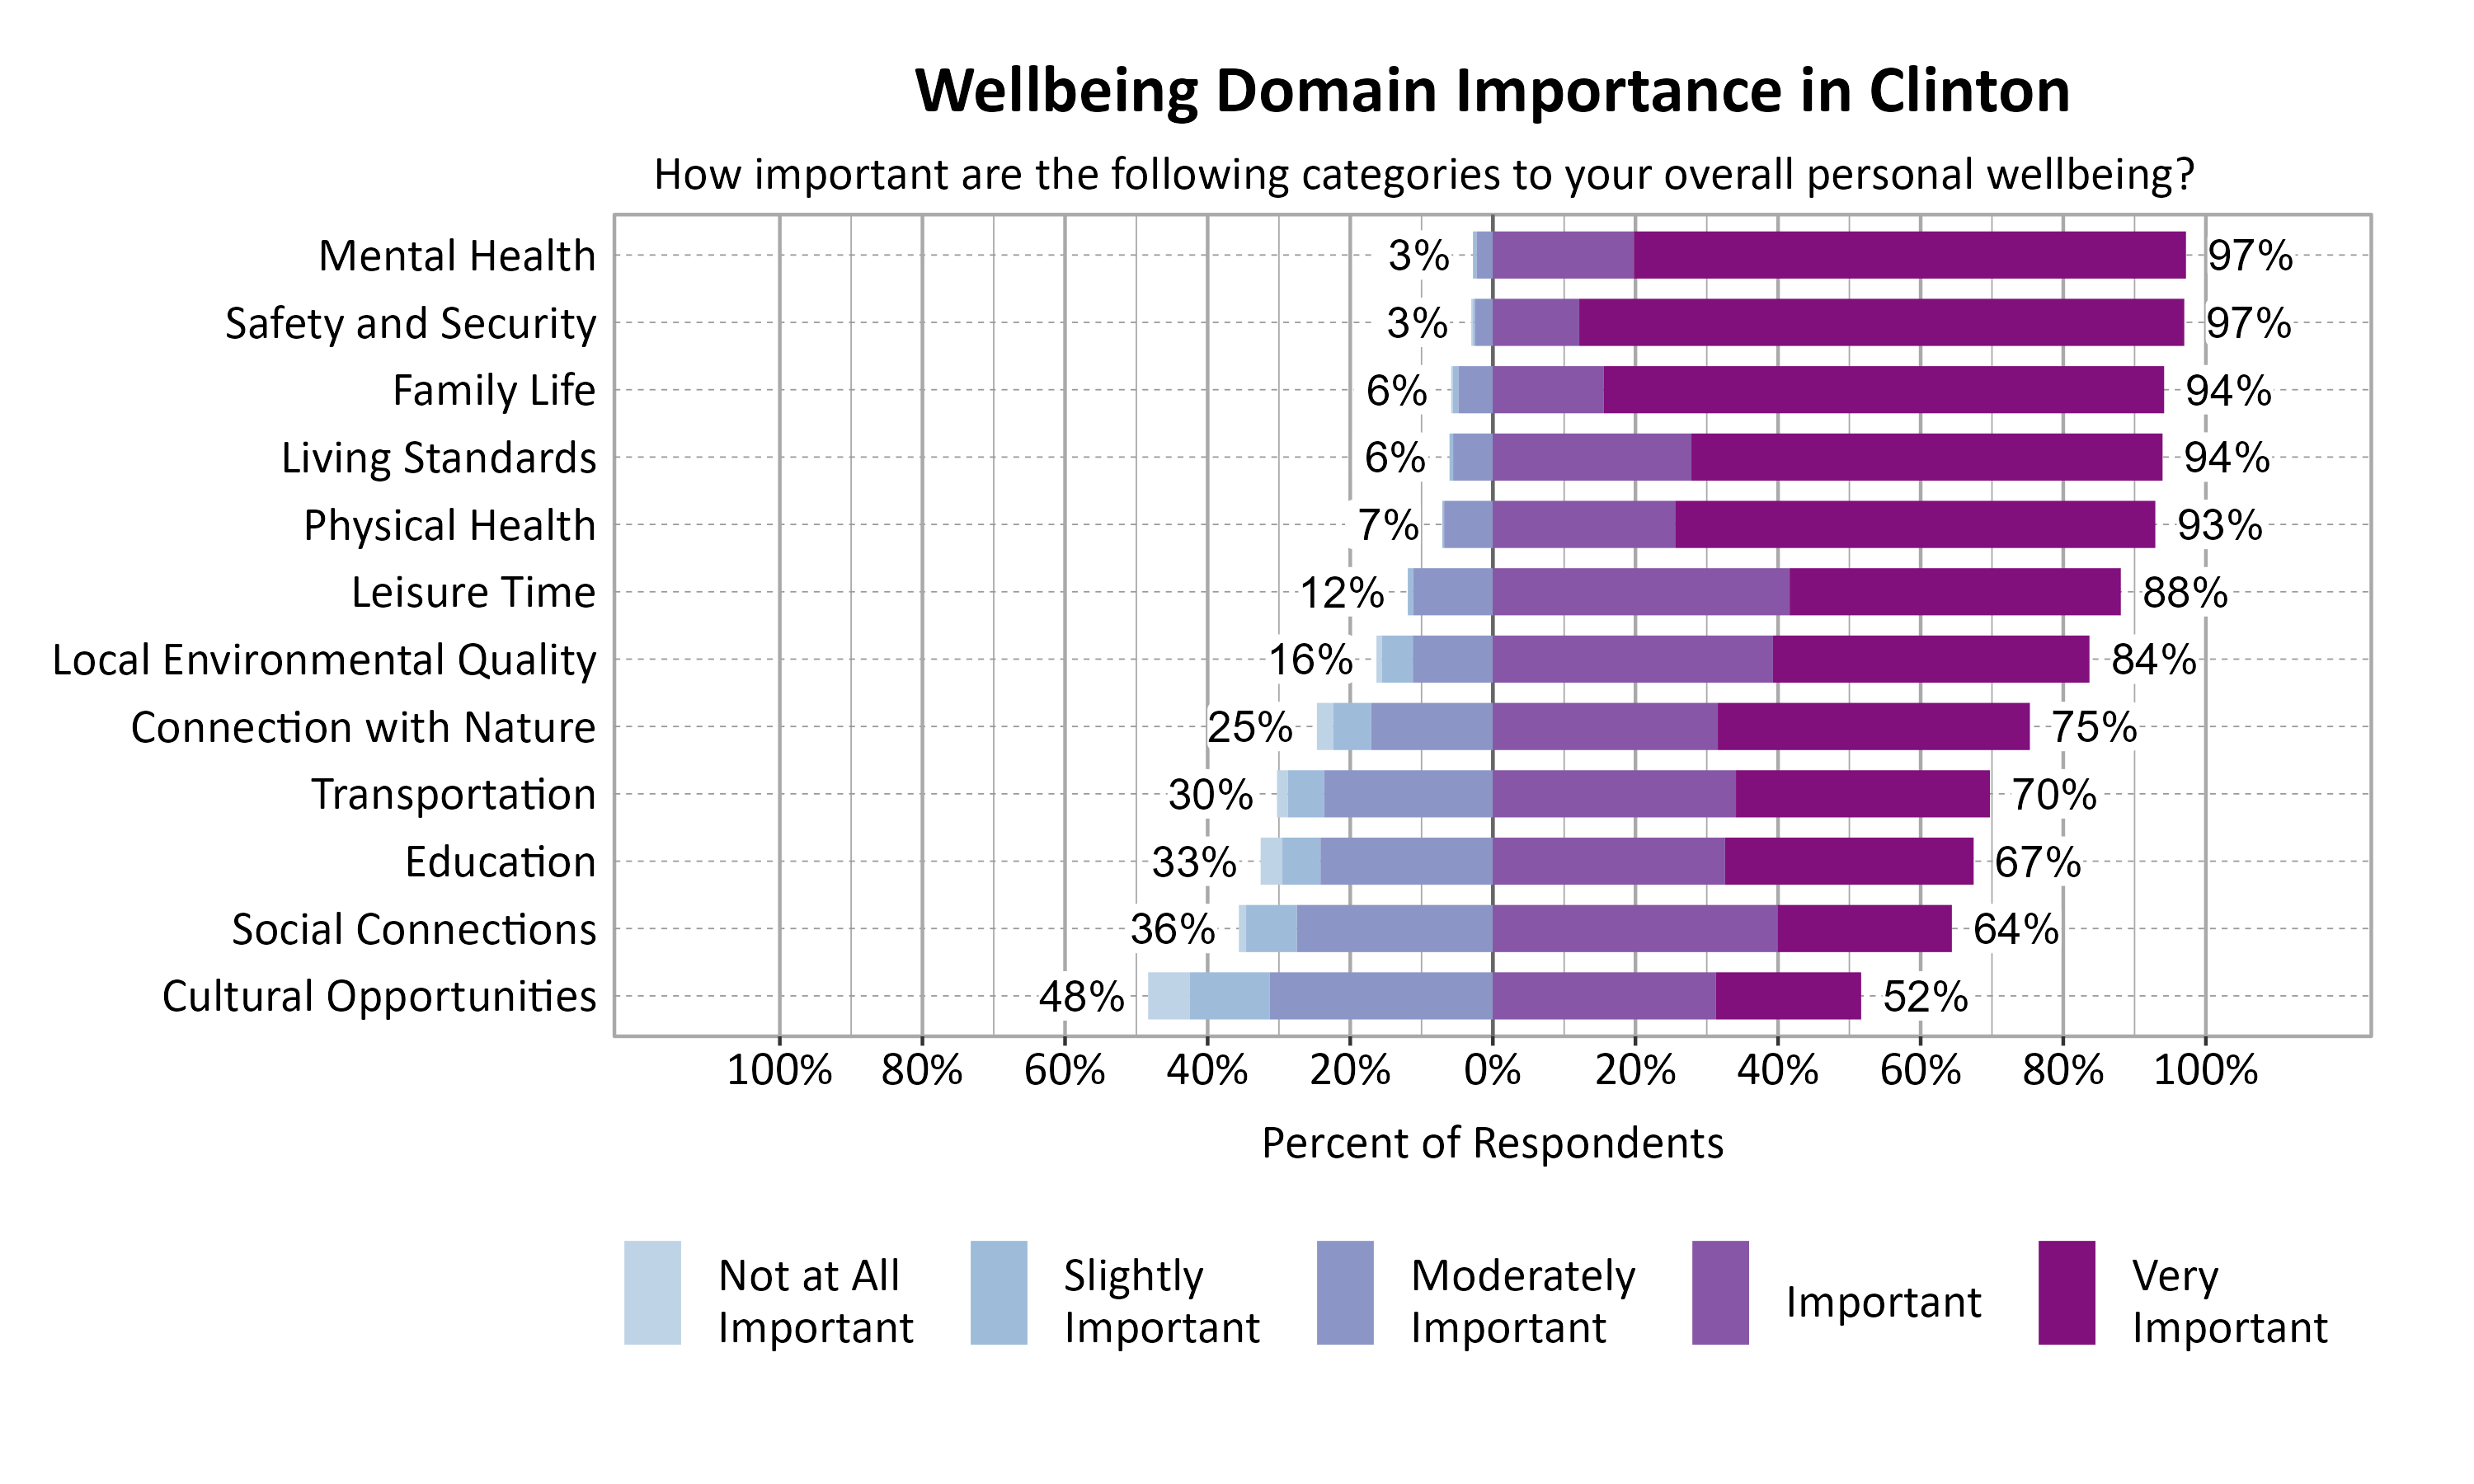
Wellbeing Domains in Clinton
According to national and international entities that track wellbeing, there are a number of common dimensions or domains of wellbeing. Survey respondents rated twelve domains on a 5-point scale from poor to excellent. They were also asked to indicate the importance of each domain to their overall personal wellbeing on a 5-point scale from not at all important to very important. The highest rated wellbeing domains for respondents in Clinton were Family Life (79%), Living Standards (76%), and Safety and Security (75%). The most important wellbeing domains were Mental Health (97%), Safety and Security (97%), Family Life (94%), Living Standards (94%), and Physical Health (93%).
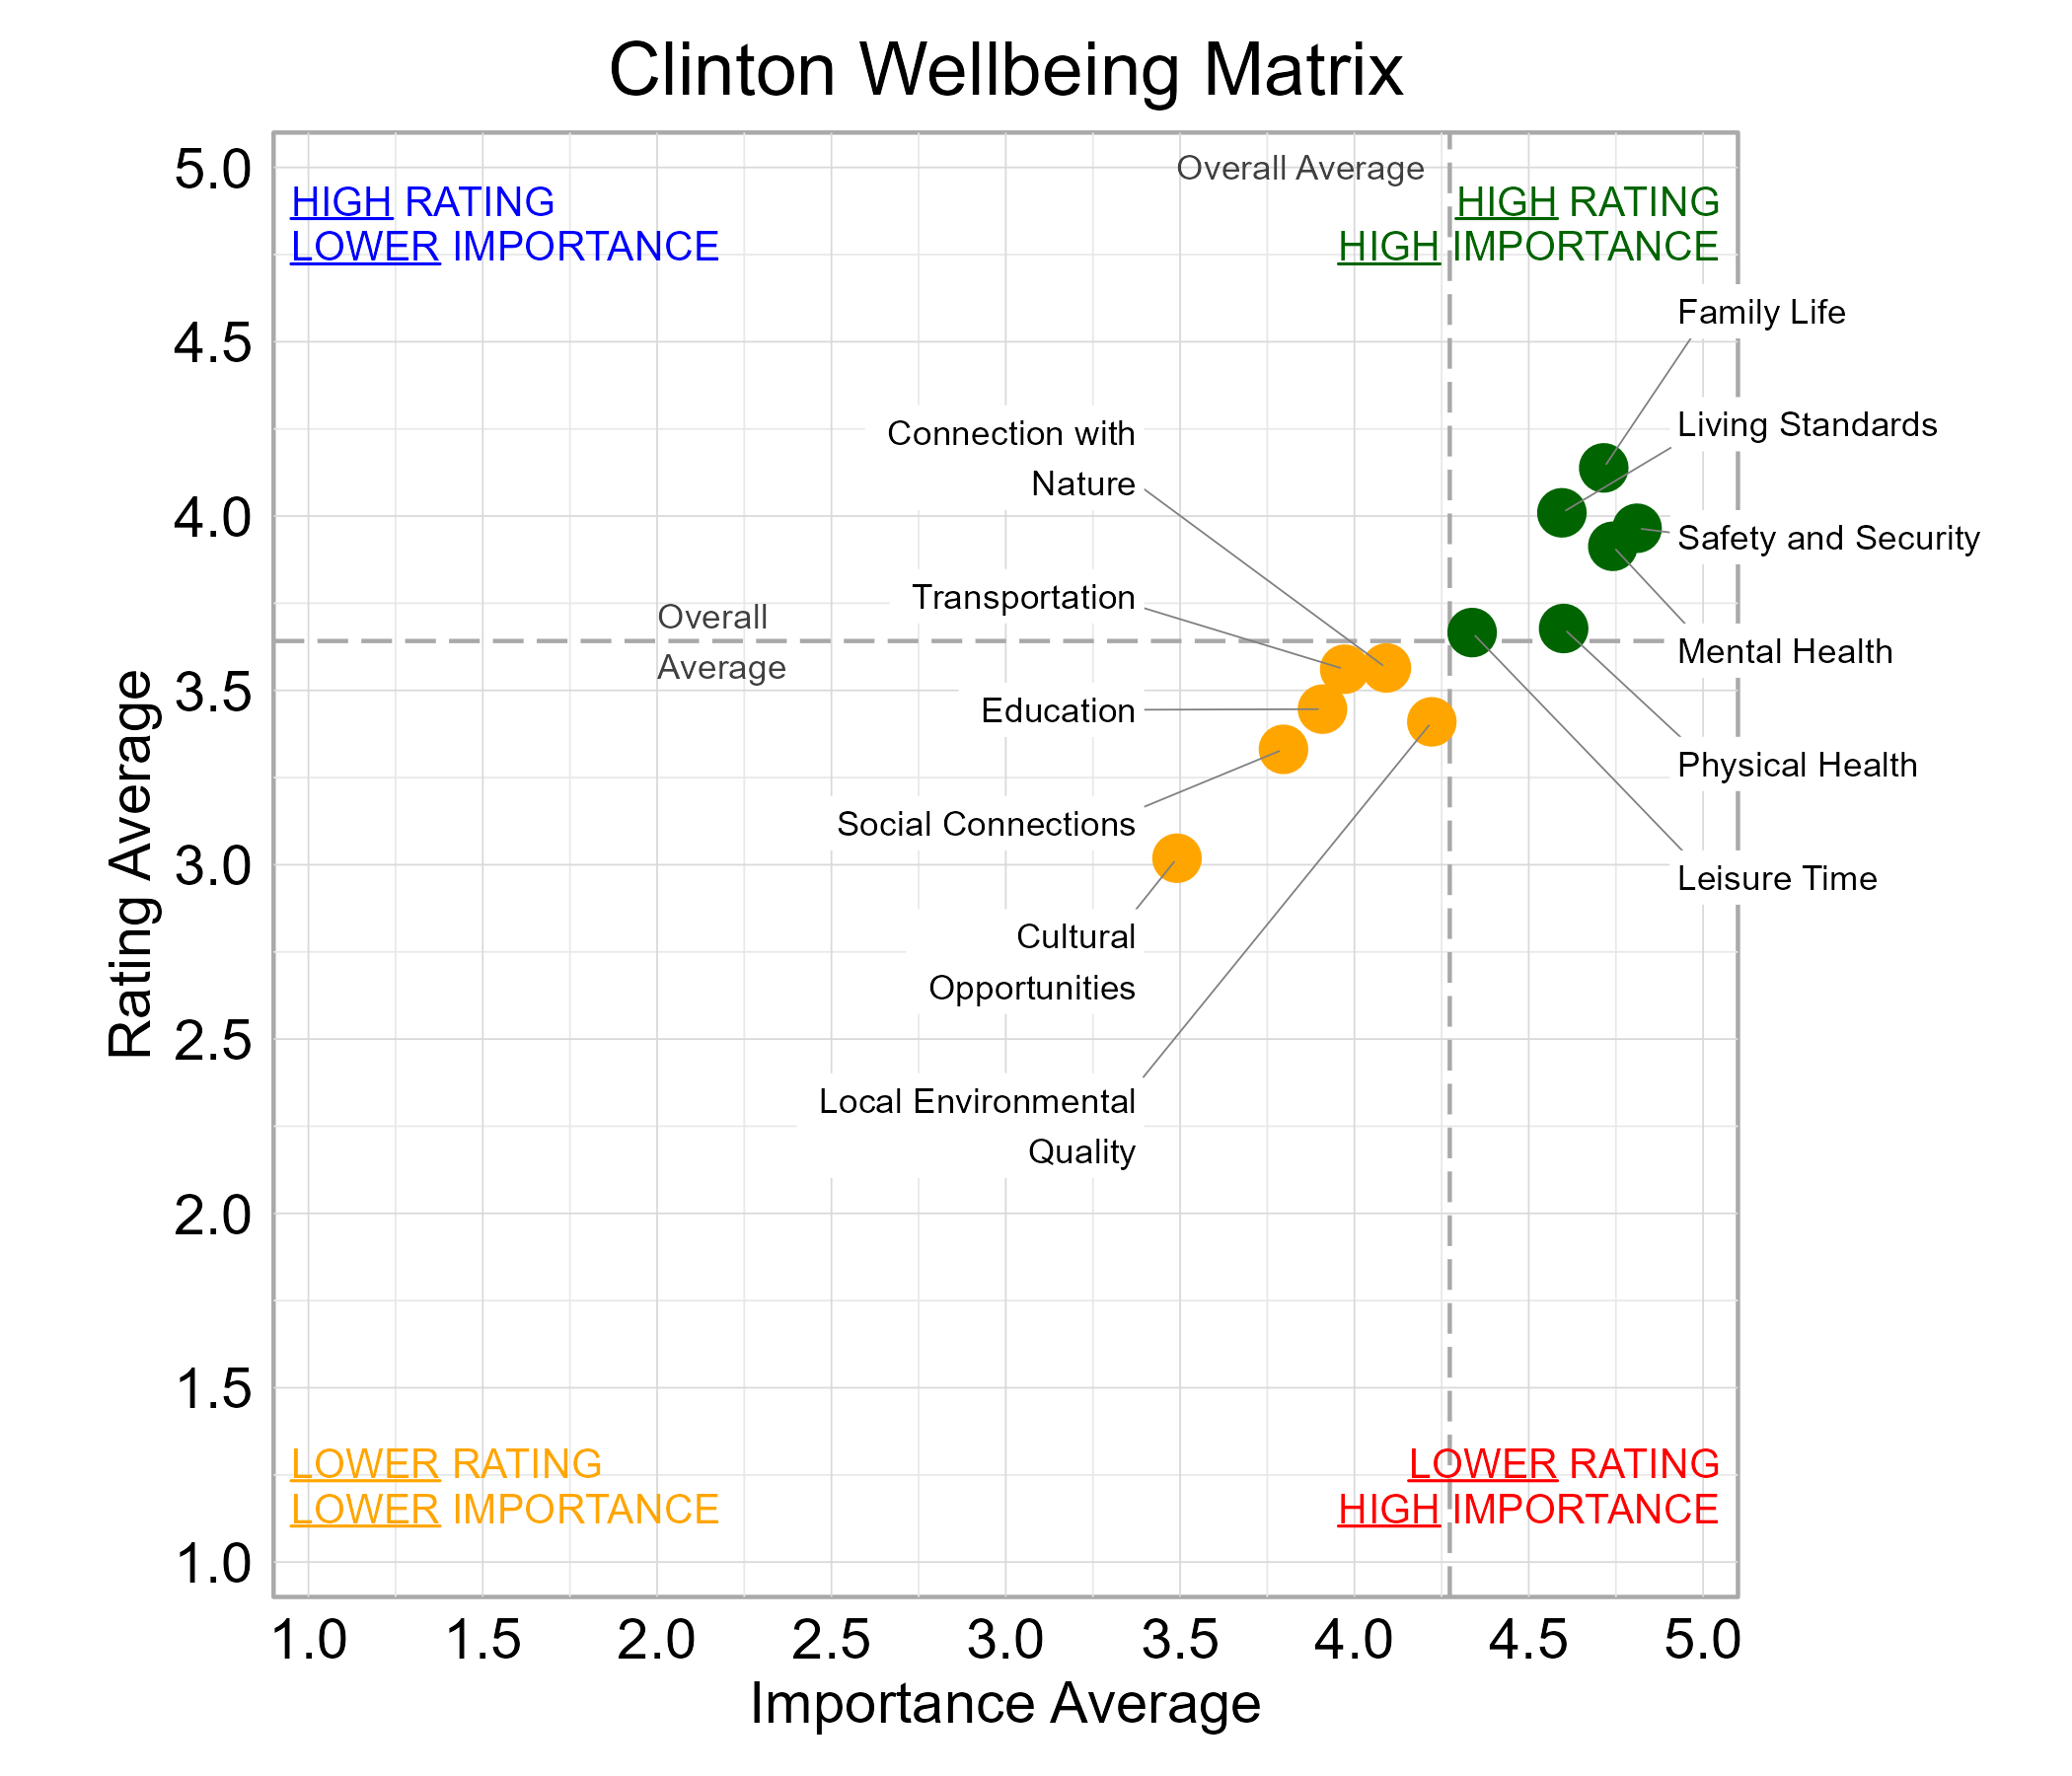
Wellbeing Matrix for Clinton
The graph below illustrates the relationship between the average rating and the average importance of wellbeing domains for survey respondents from Clinton. Family Life, Leisure Time, Living Standards, Mental Health, Physical Health, and Safety and Security were highly important and rated above average among the domains. No Domains fell in the “red zone” of higher importance and lower ratings.
Community Connection in Clinton
Survey participants were asked about how connected they feel to Clinton on a 5-point scale from not at all (1) to a great deal (5), and the average score of all respondents was 2.95.
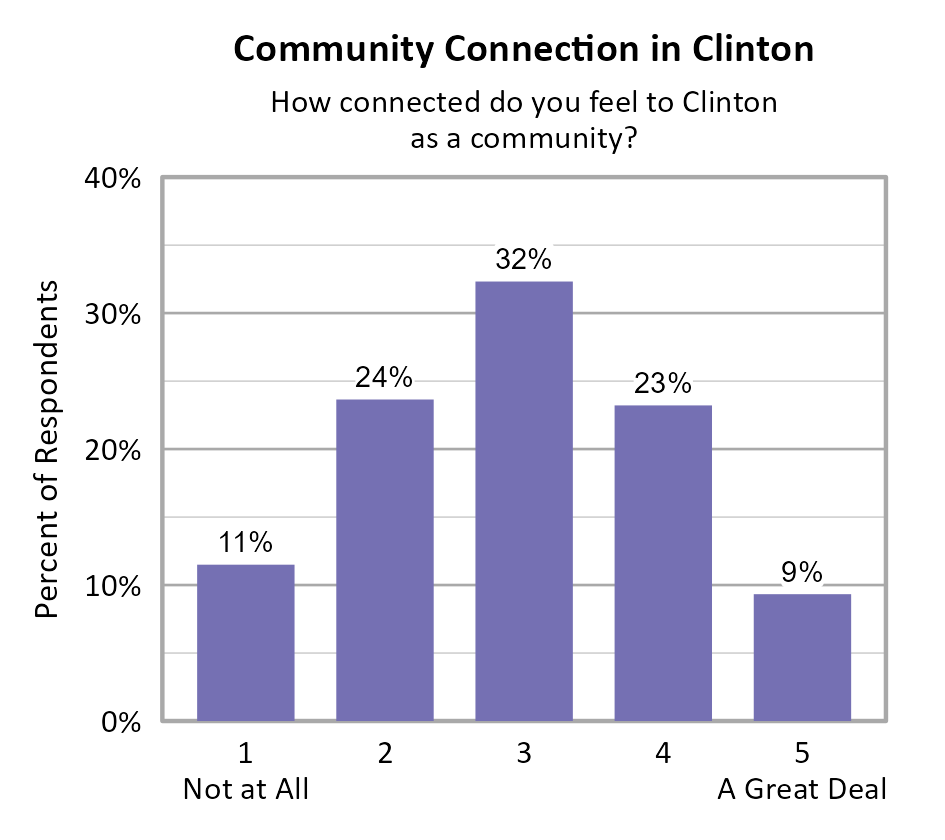
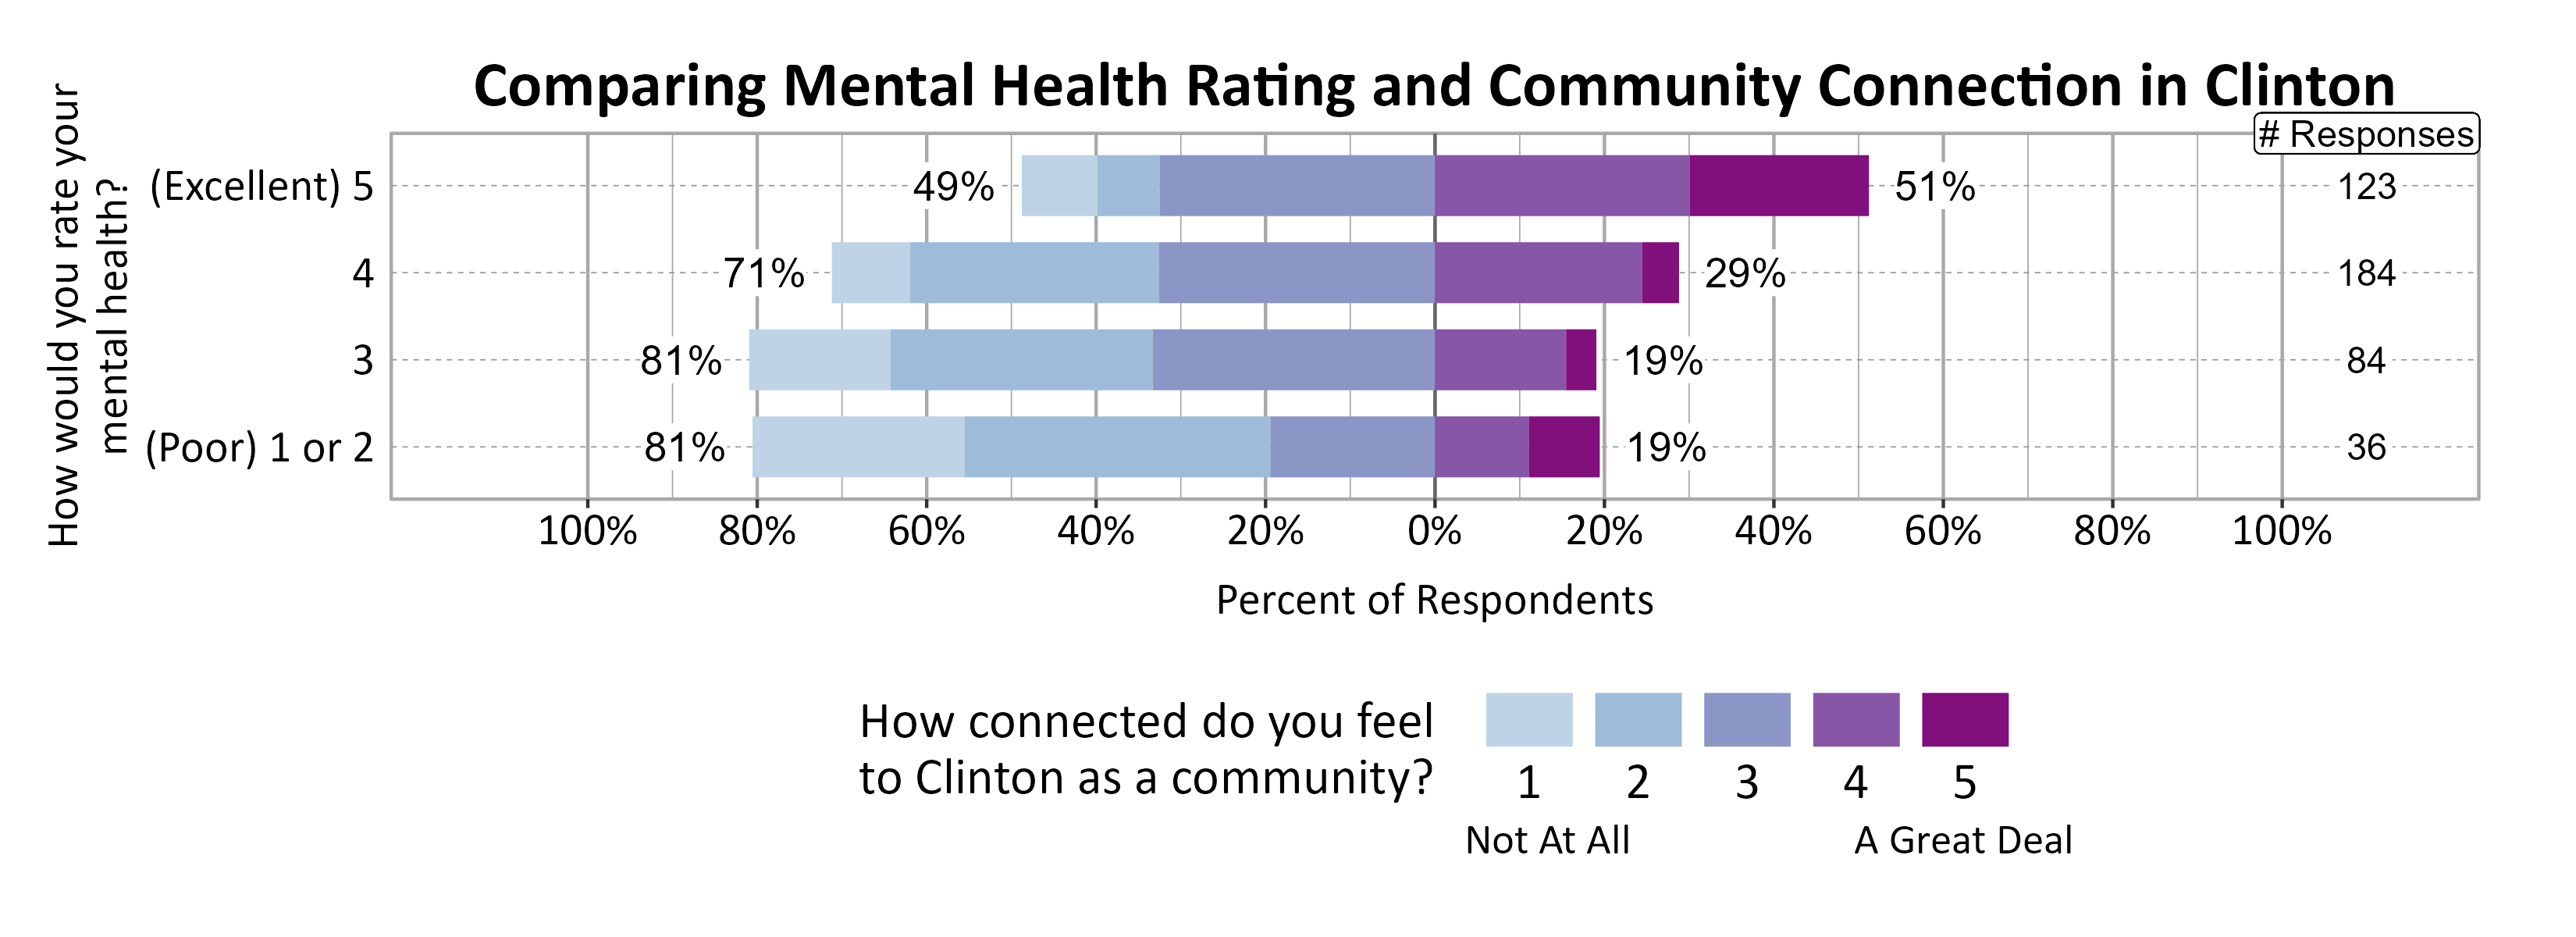
A positive relationship was found between individuals’ community connection and overall personal wellbeing, and to some extent between community connection and mental health.
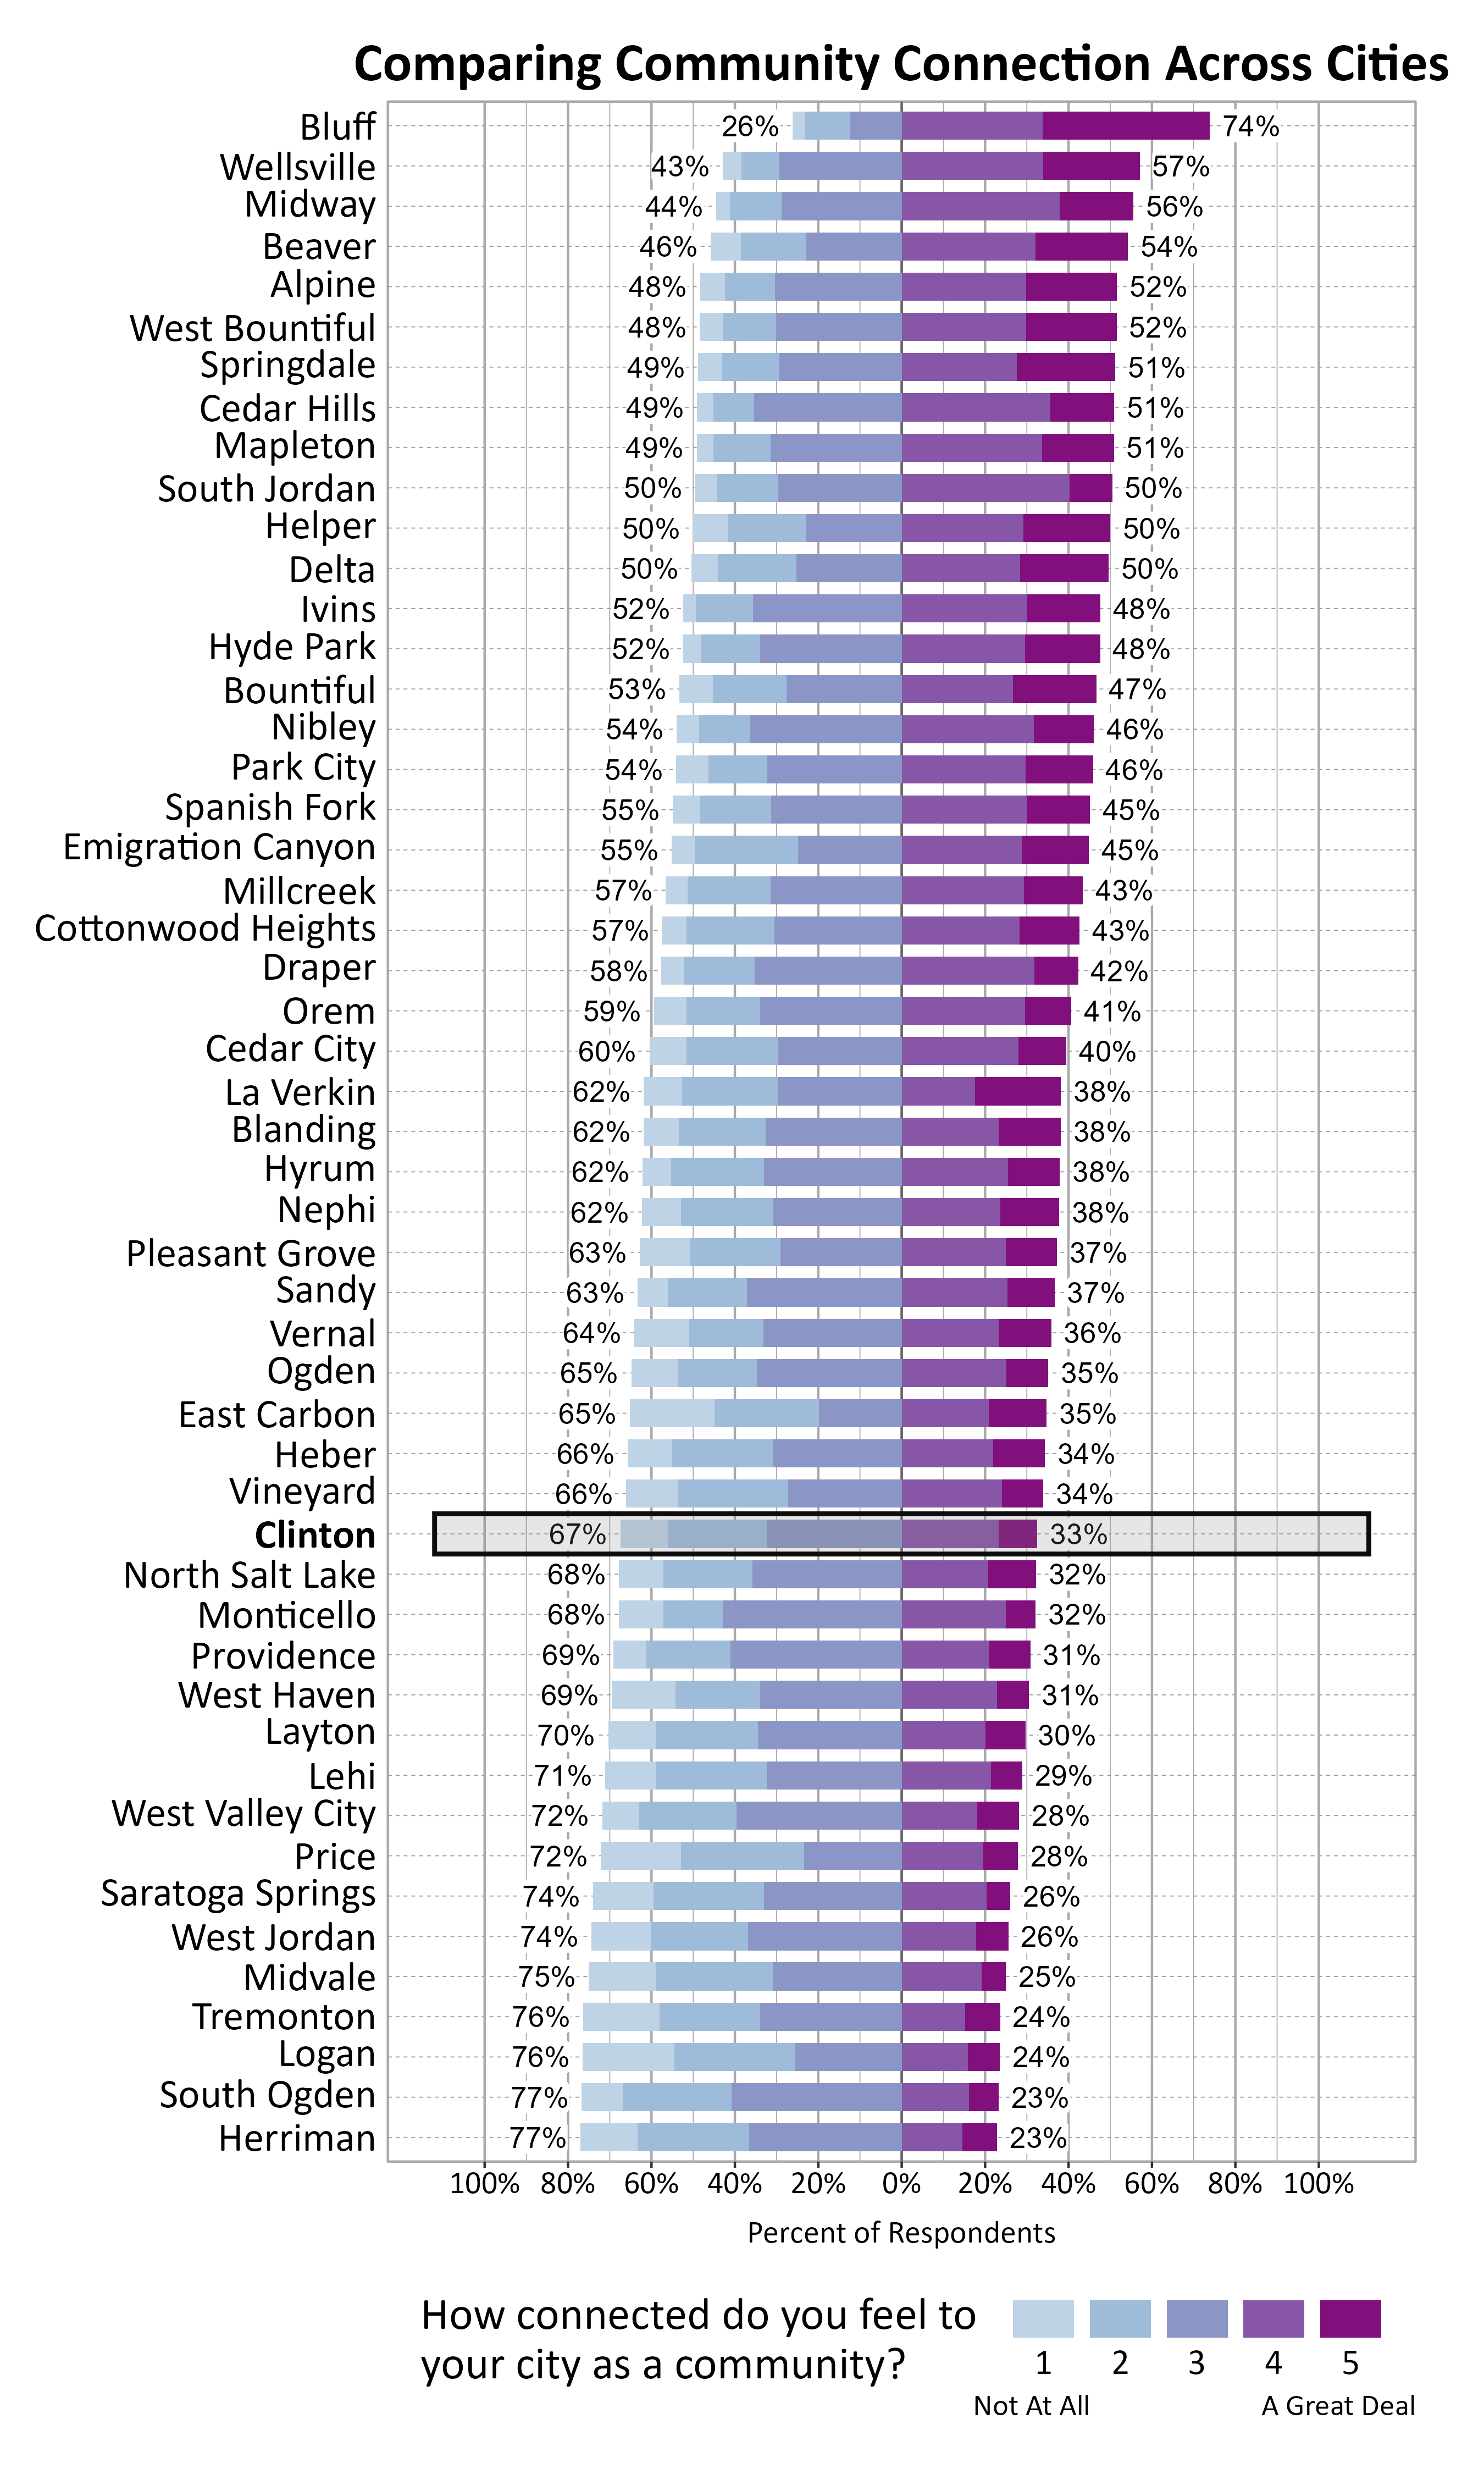
The graph below shows how Wellbeing Project cities and towns compare on feelings of community connection based on the percentage of respondents who answered 4 or a 5 on a 5-point scale from “not at all” to “a great deal” connected to their city or town. Clinton ranked 36 out of the 51 cities that participated.
Participation in Recreation and Nature-Related Activities
Respondents were asked to indicate whether or not they participated in various activities in the last 12 months. The most popular activities were walking or biking in your neighborhood or city (90%), gardening at home (84%), recreating in parks in your city (75%), and using trails in or near your city (74%).
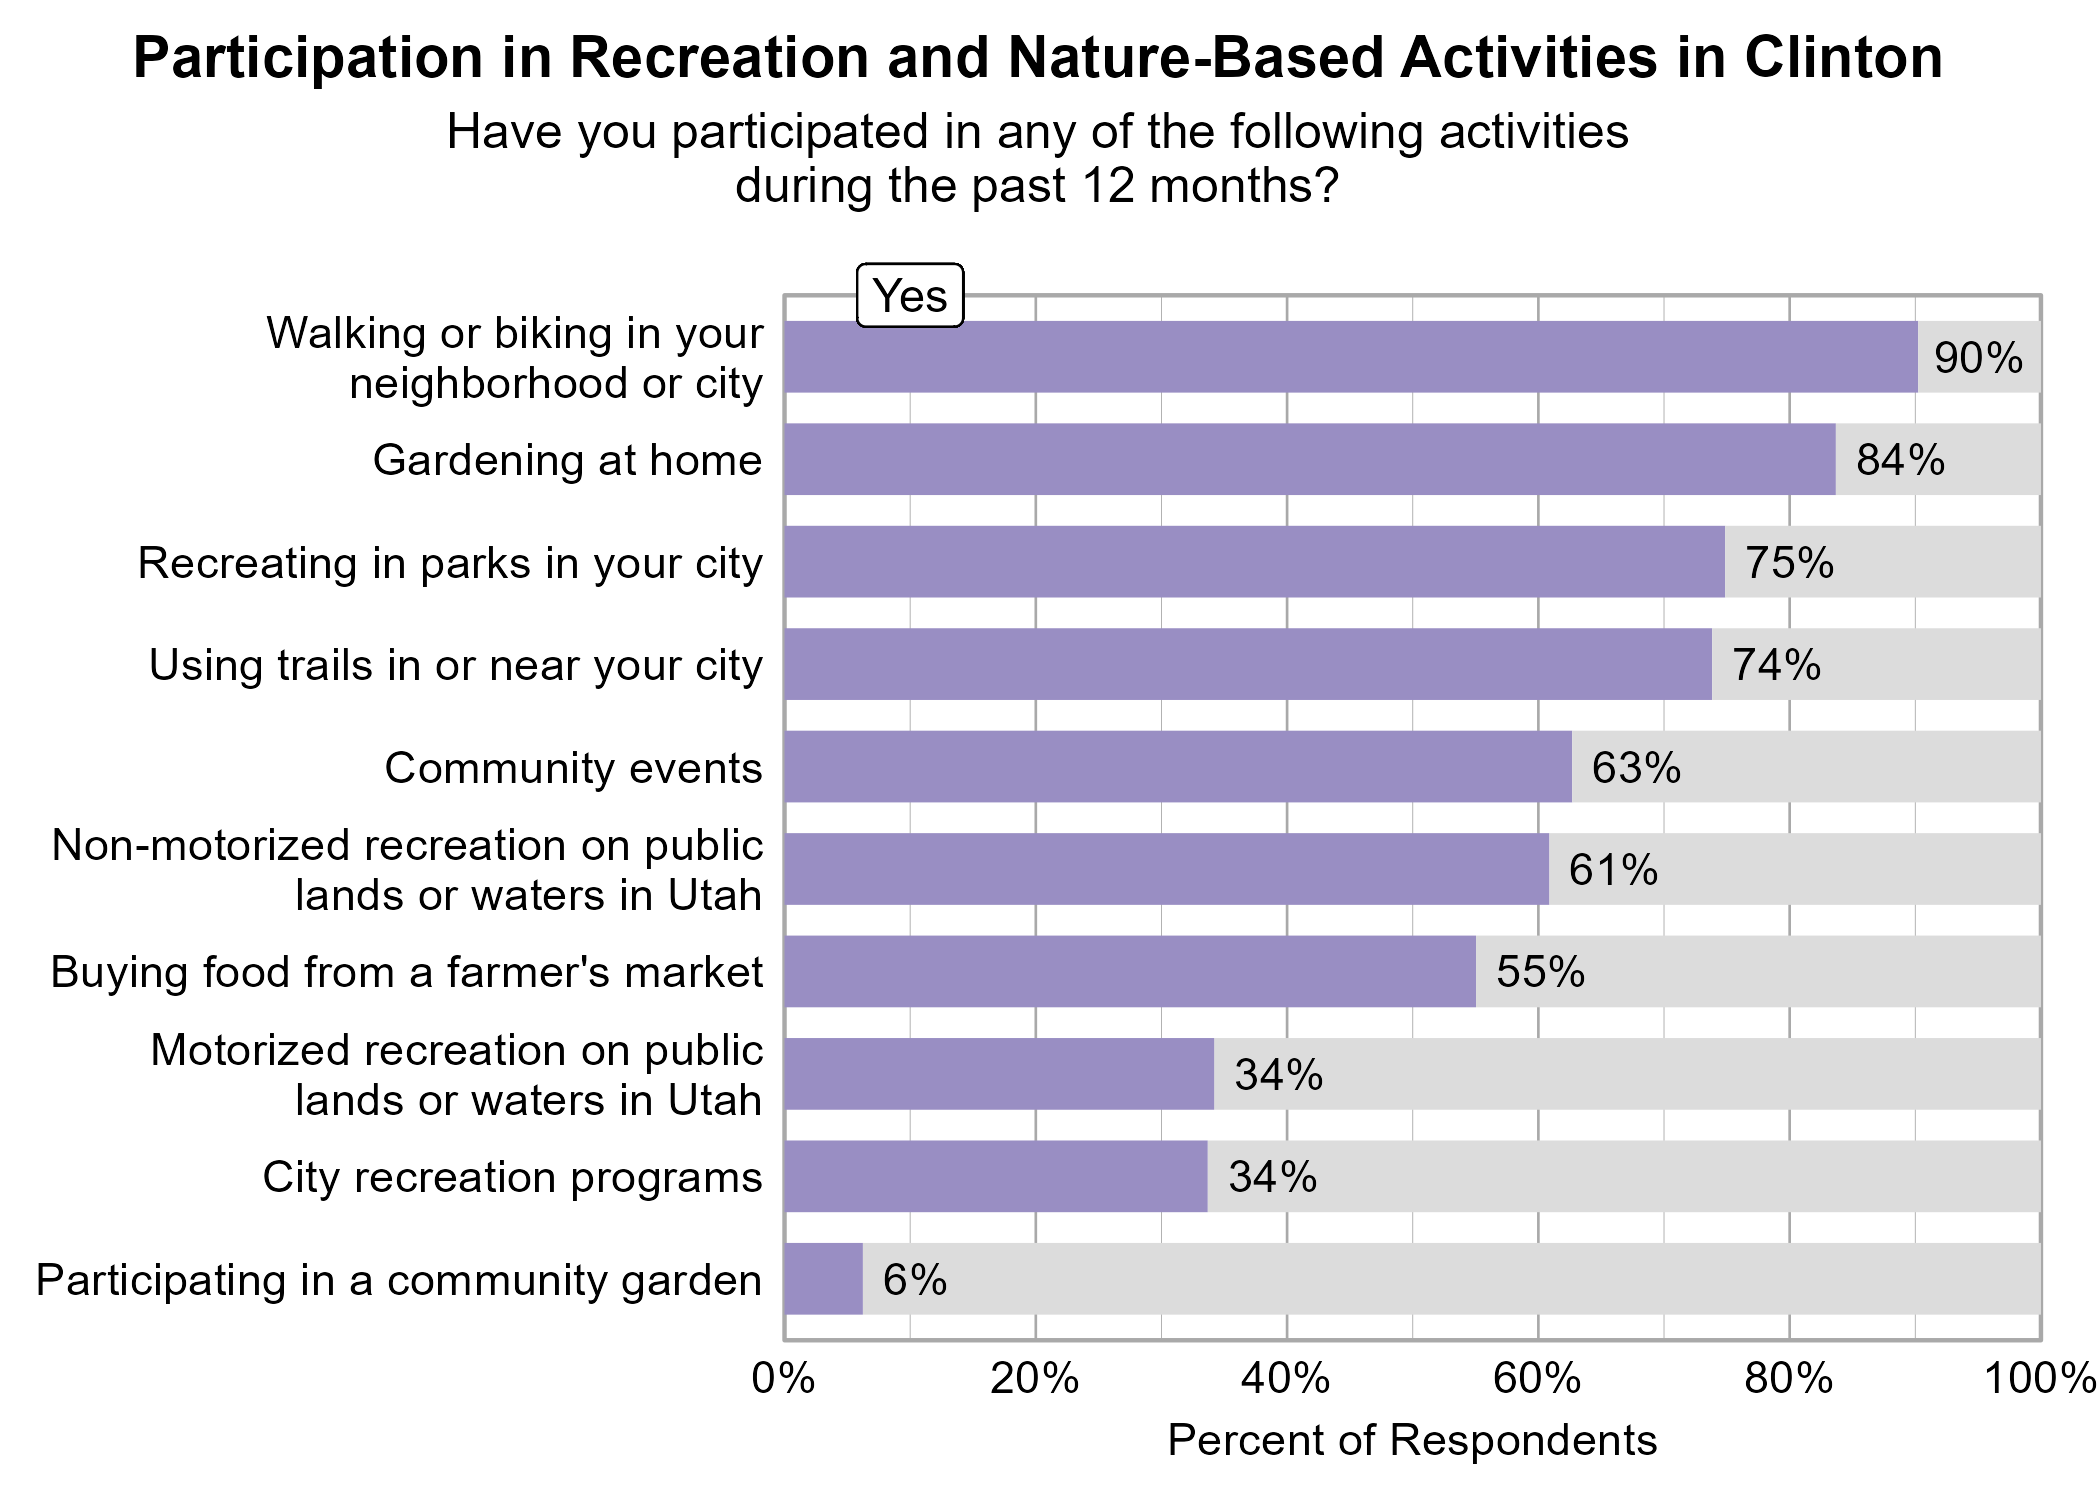
Motorized recreation on public lands or waters in Utah, non-motorized recreation on public lands or waters in Utah, and recreating in parks in your city were significantly related to higher ratings of personal wellbeing.
Recreating in parks in your city was significantly related to higher ratings of community wellbeing.
Participating in city recreation programs, participating in community events, recreating in parks in your city, and walking or biking in your neighborhood or city were significantly related to higher ratings of community connection.
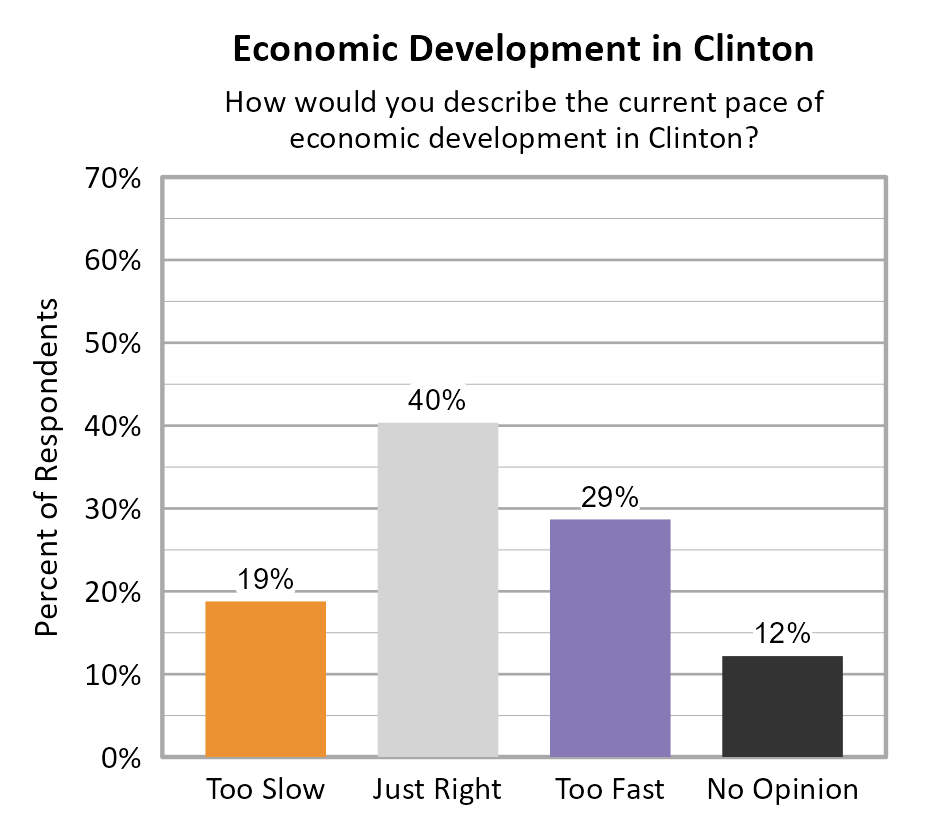
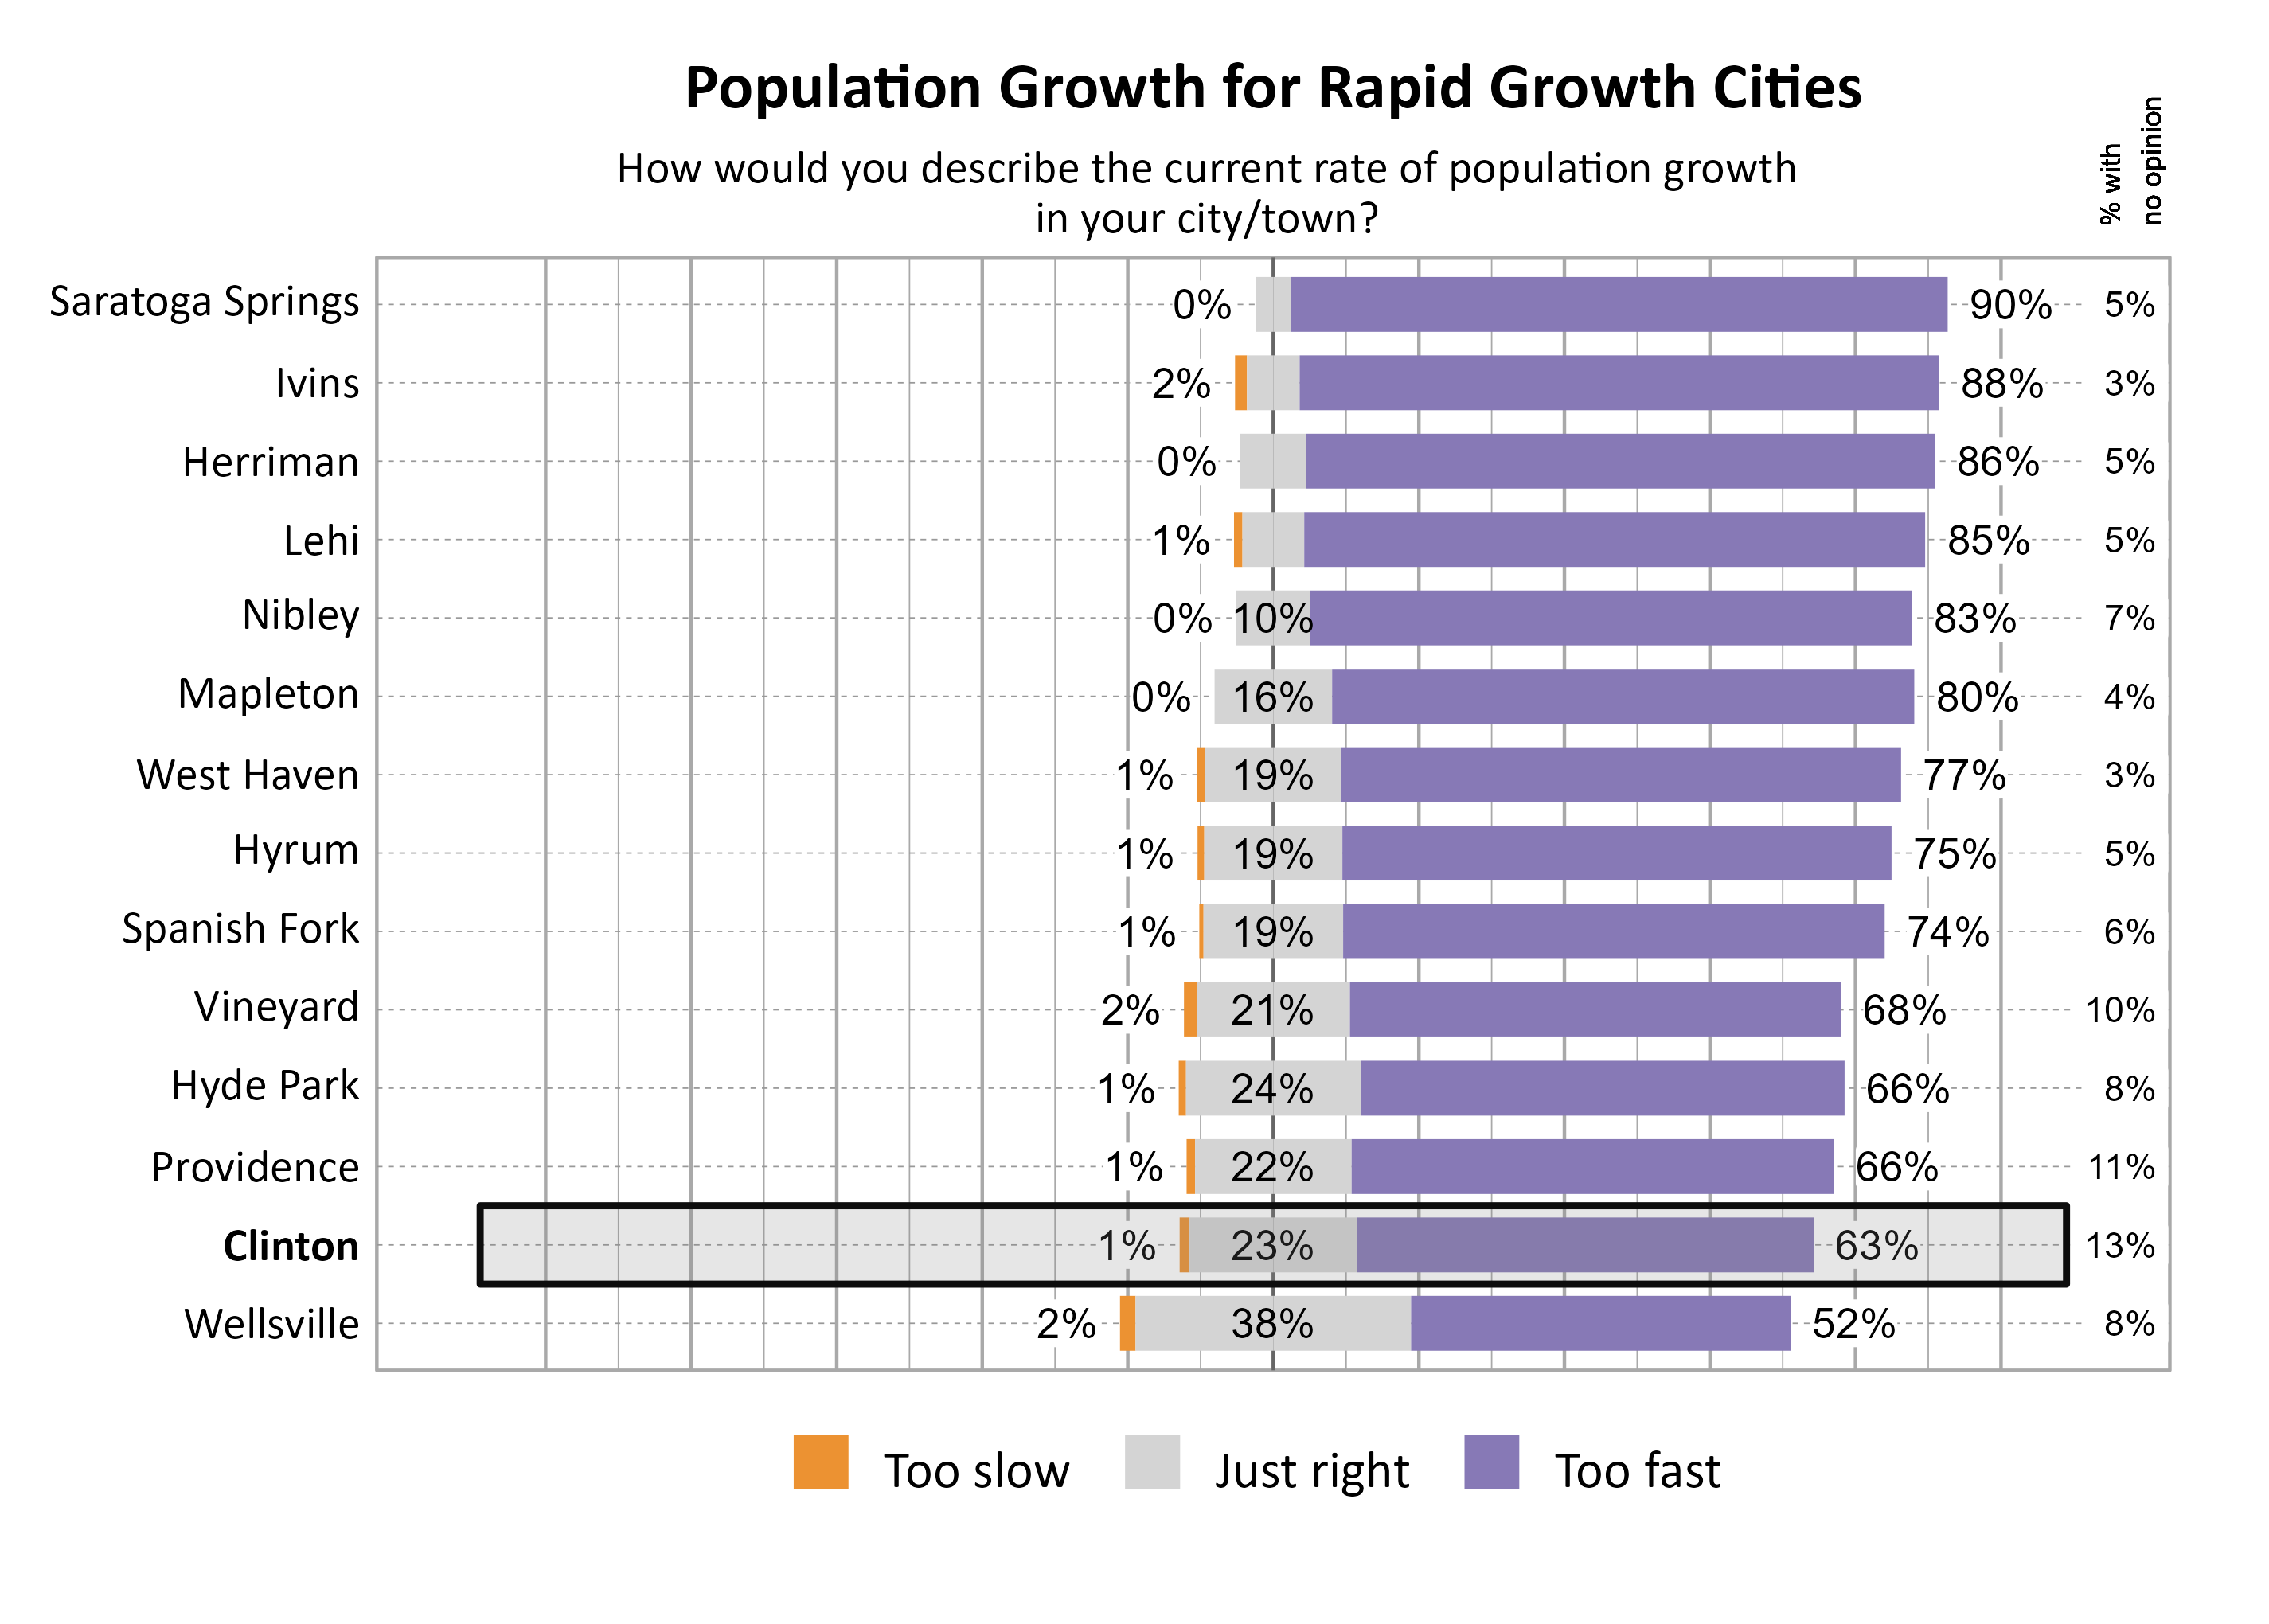
Perspectives on Population Growth and Economic Development
The majority of respondents in Clinton indicated that they felt the population growth was too fast (63%). For the pace of economic development, the largest proportion of respondents indicated that it was just right (40%).
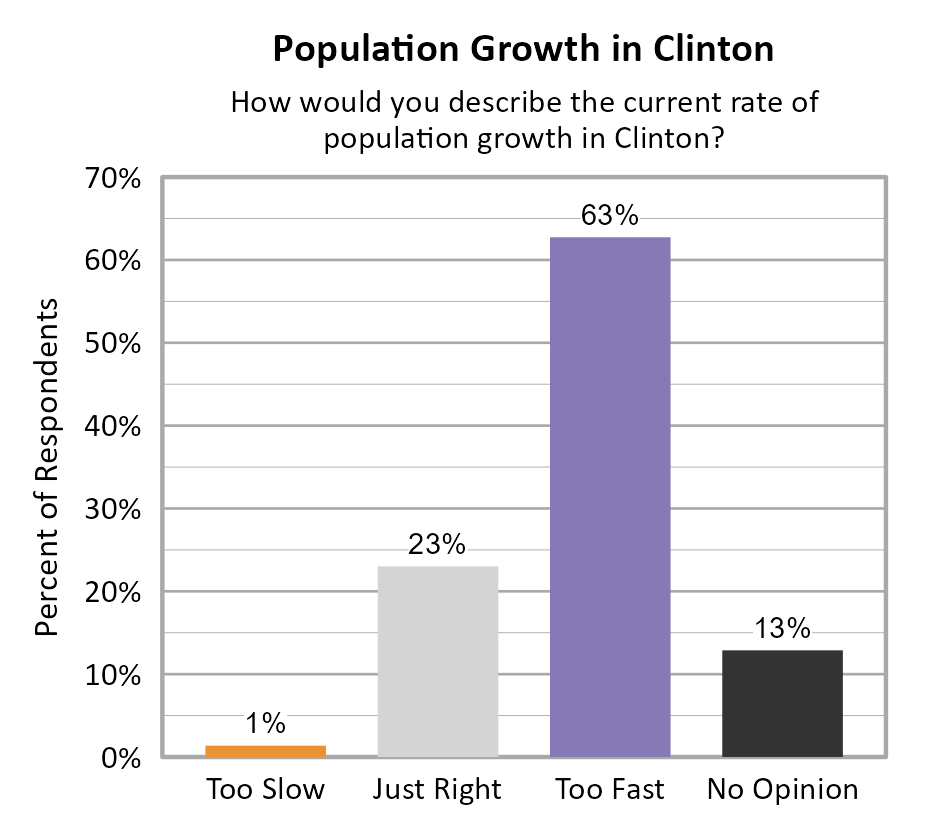
The graphs below show perceptions of population growth and economic development for Clinton compared to other participating cities and towns in the Rapid Growth Cities cluster.
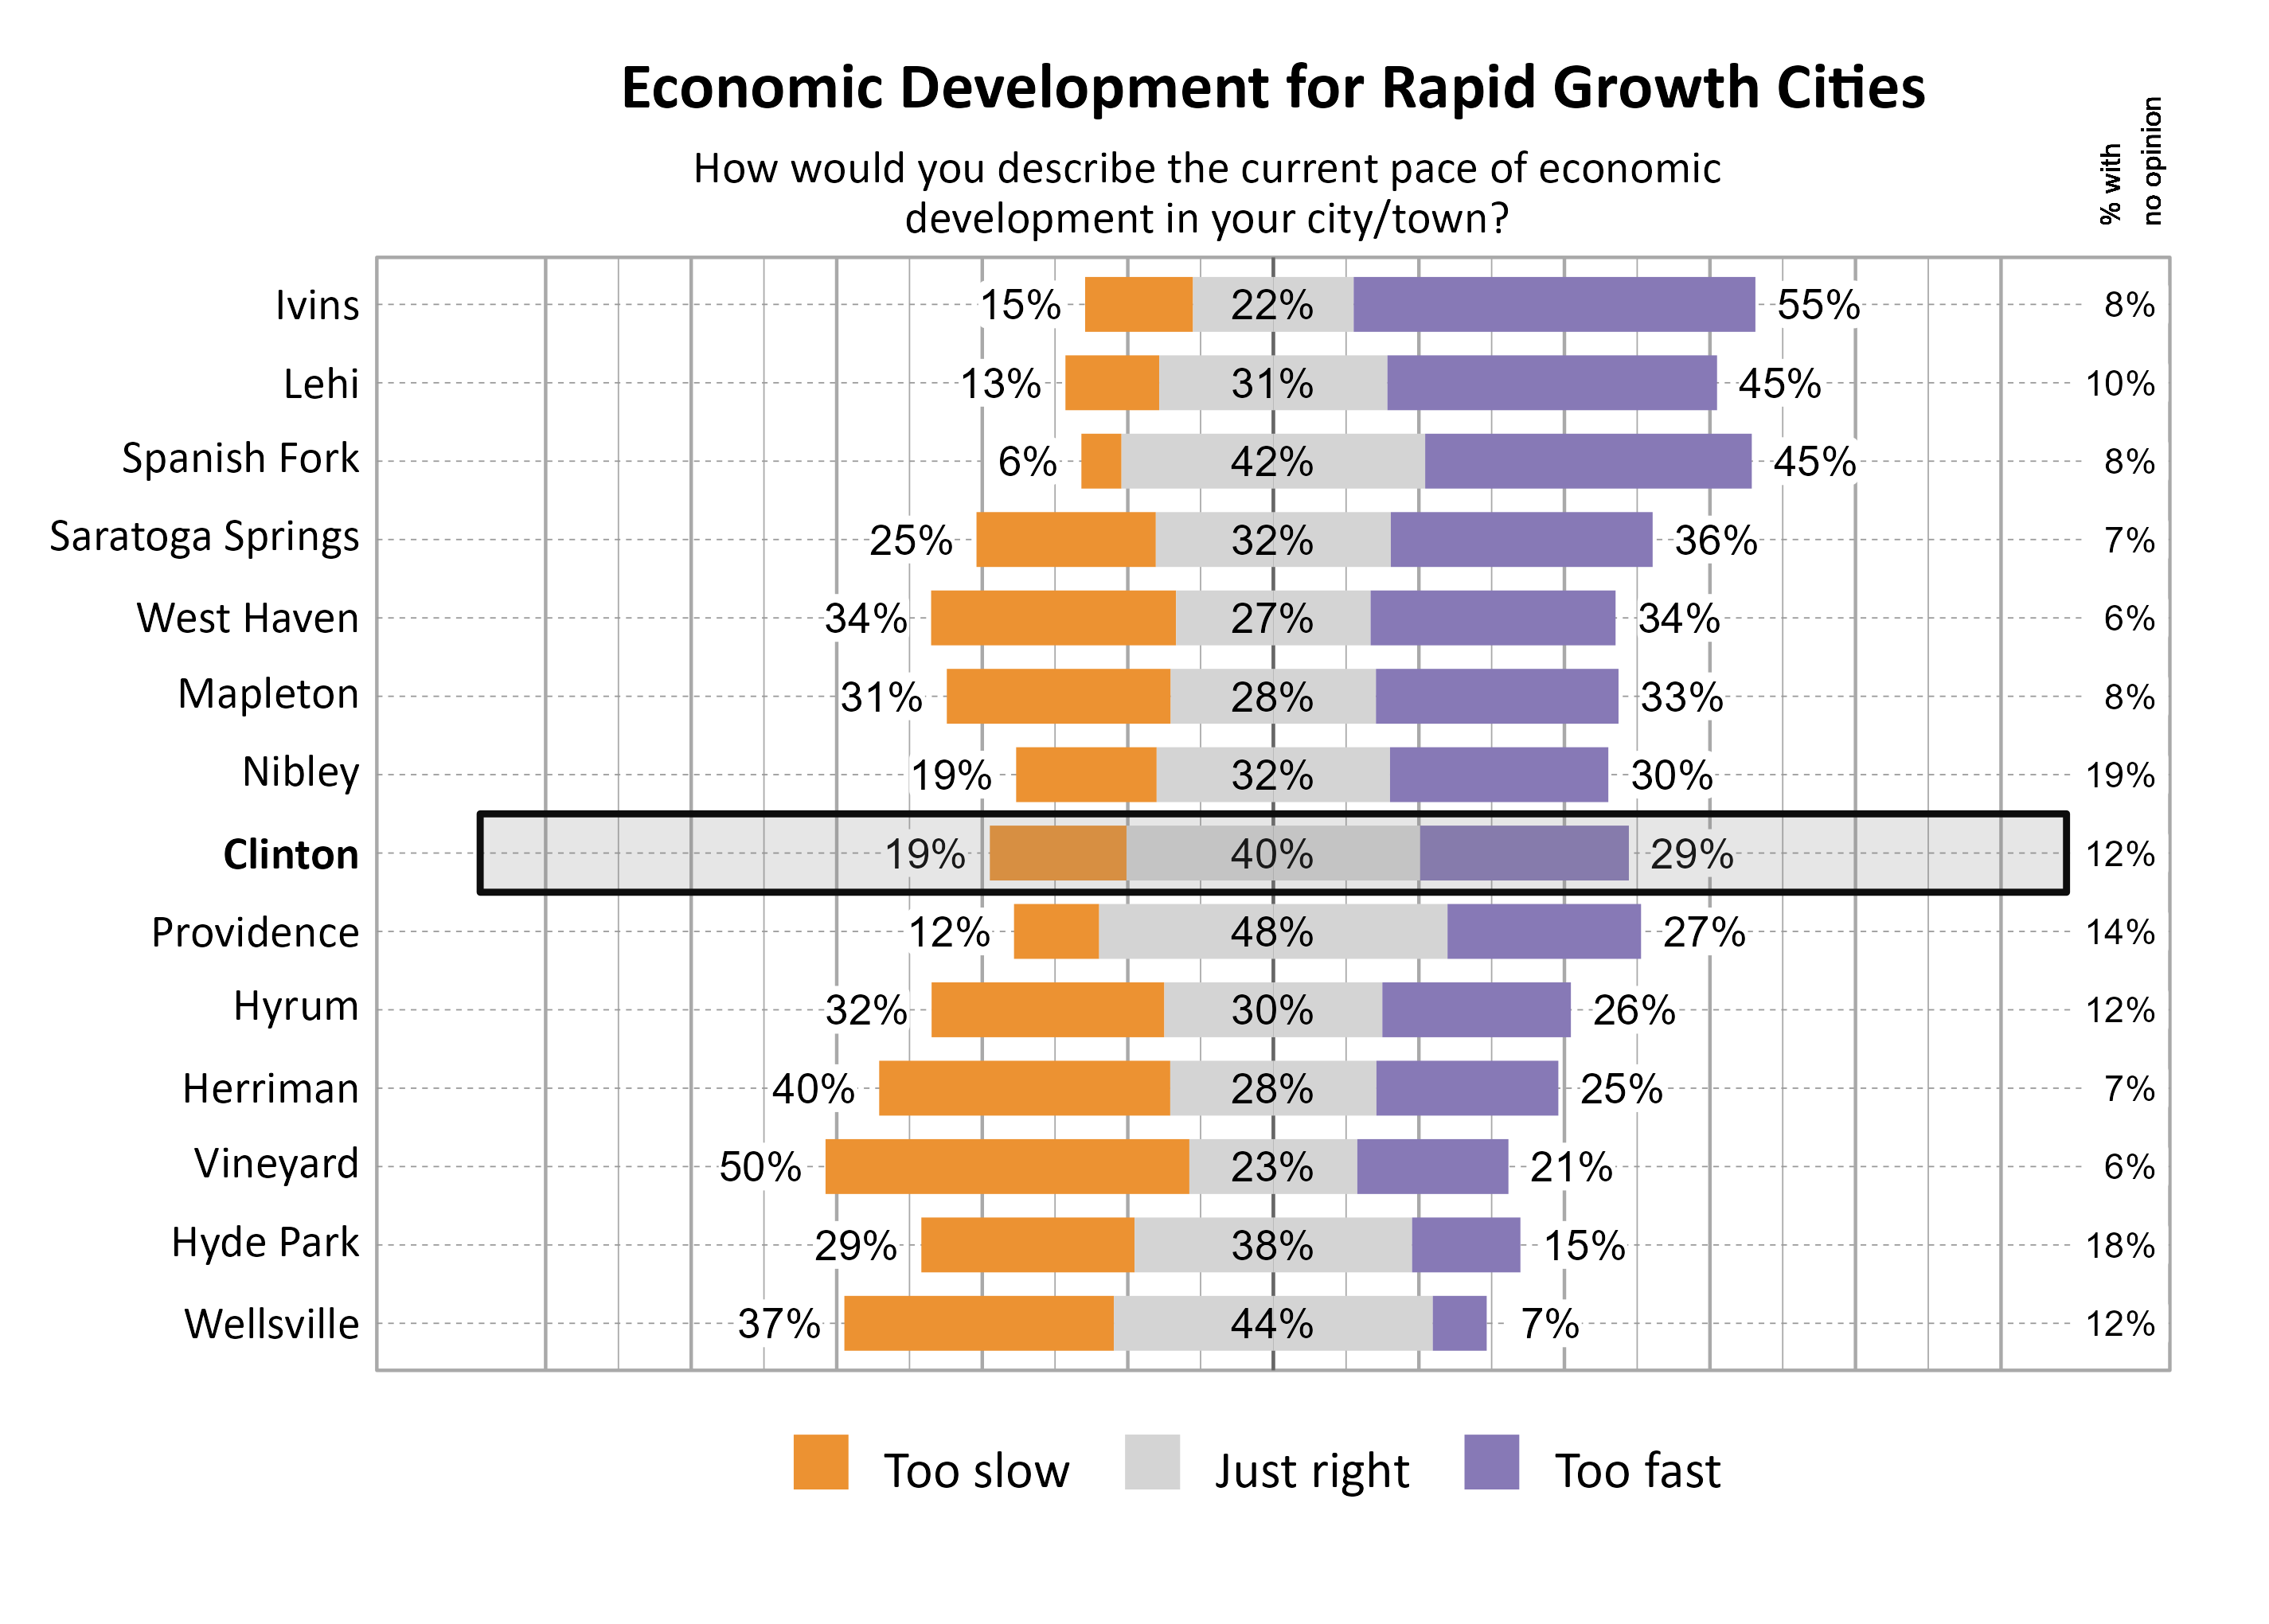
The graph below illustrates how many respondents perceived the pace of economic development as too slow, just right, too fast, or had no opinion, with additional breakdowns for the number of respondents who provided comments.
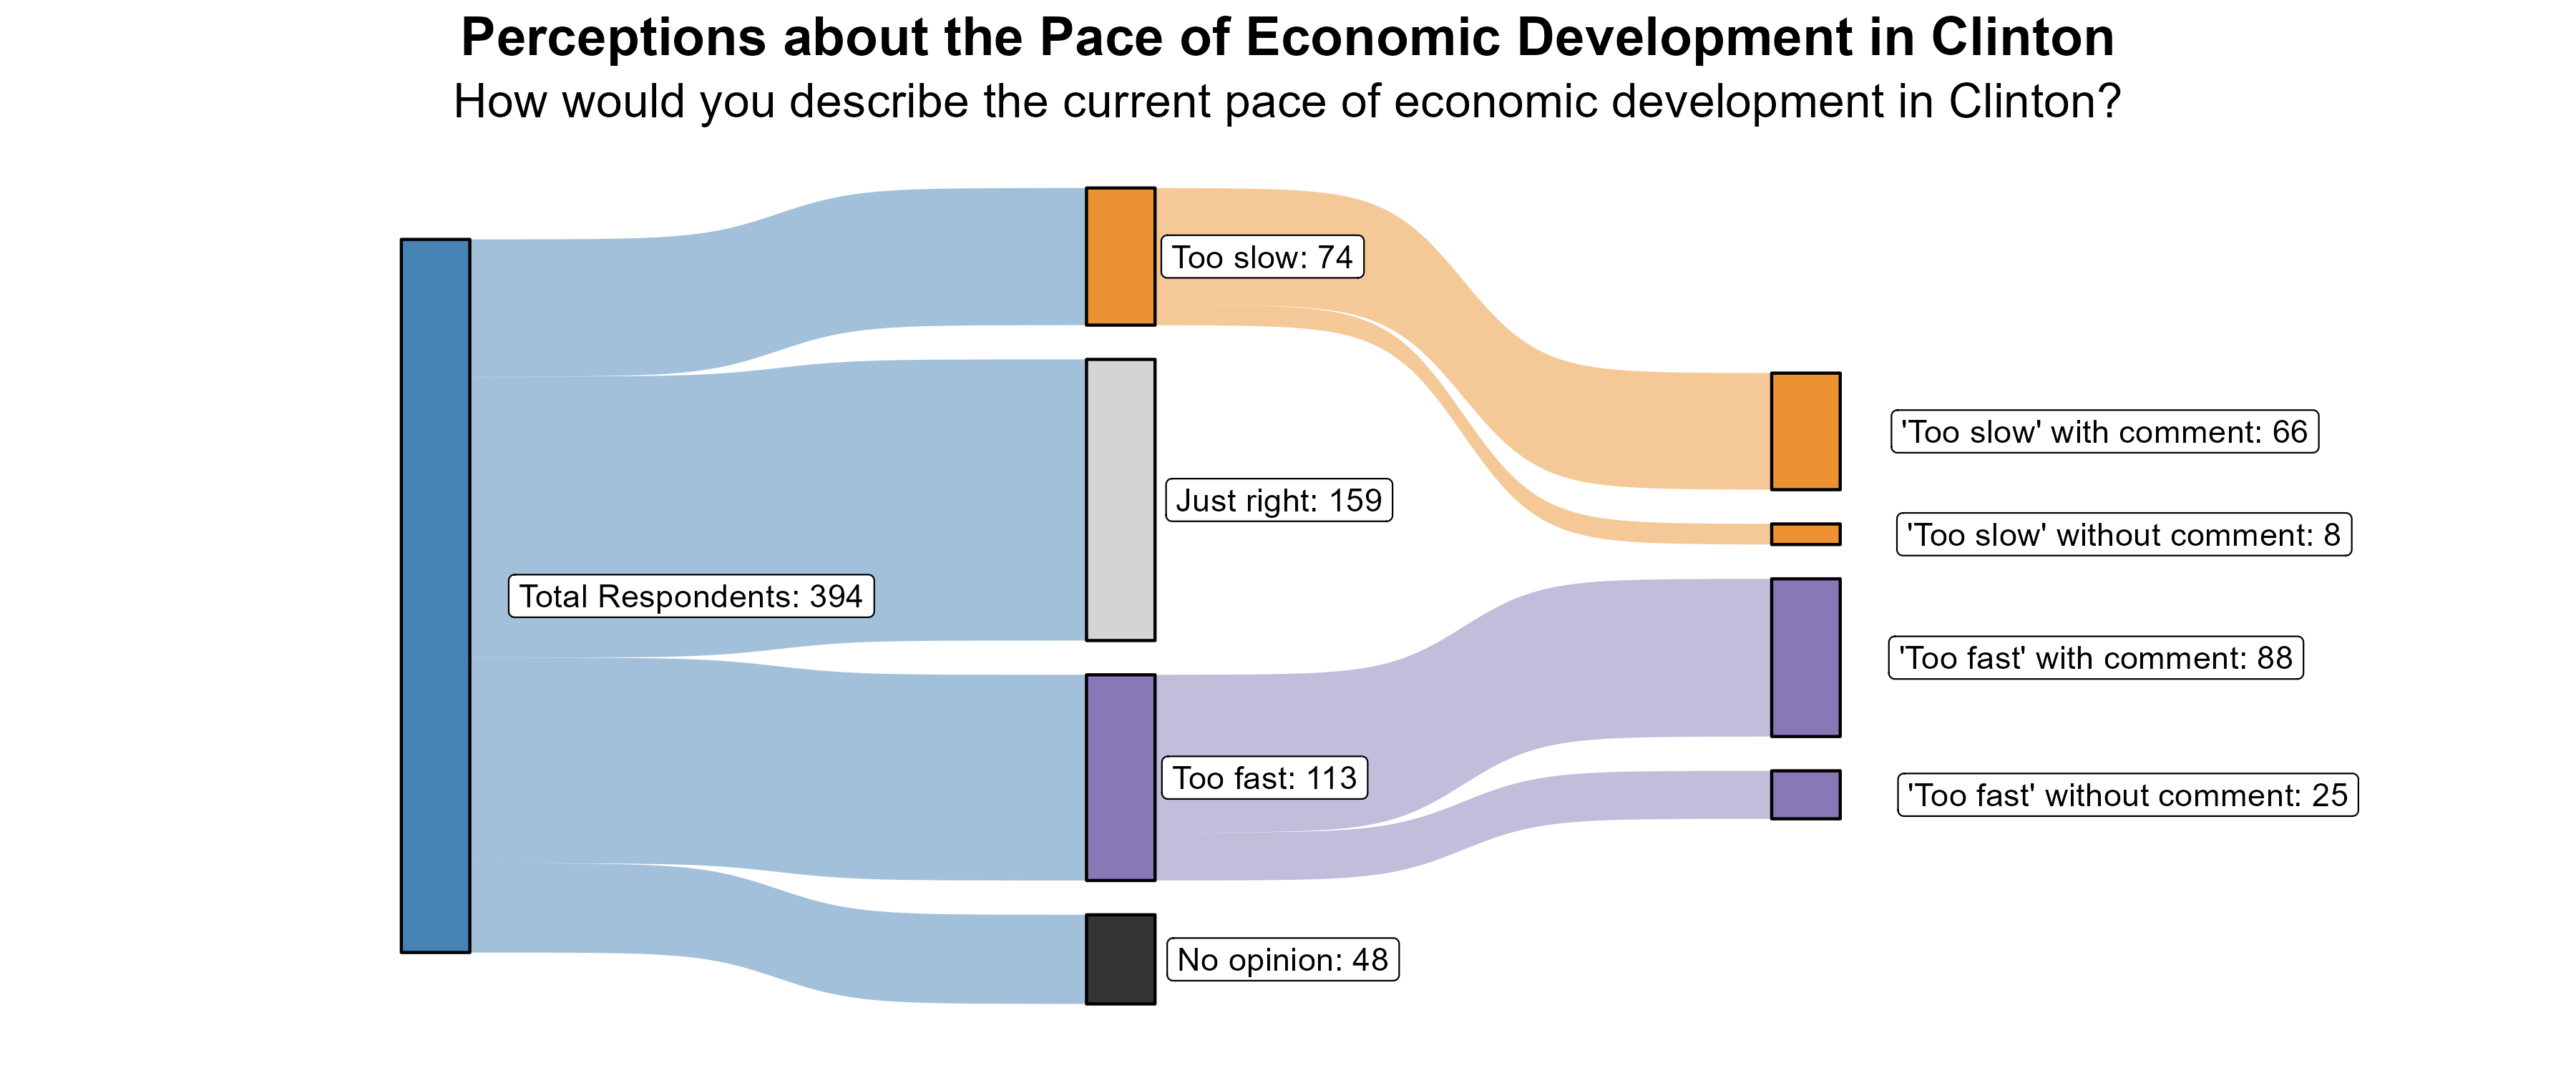
The 19% of respondents who rated the pace of economic growth as “too slow” were further asked what aspects of the local economy they would like to see more of in Clinton. The strongest theme was the desire for more retail business, particularly restaurants, but also shopping. There were also comments from some who desire more amenities and services beyond businesses, particularly related to recreation. There were concerns about having the infrastructure to support growth and concerns about traffic.
Additionally, the 29% of respondents who rated the pace of economic growth as “too fast” were further asked what aspects of the local economy they feel are growing too quickly in Clinton. Comments largely focused on too many houses being built, particularly apartments. Some commented on having too many restaurants and businesses. There were comments about excessive traffic and congestion and some concerns about the loss of green space and open space. A number of people mentioned changes in the town’s character, particularly losing its small town feel, and a lack of planning for the growth Clinton has experienced.
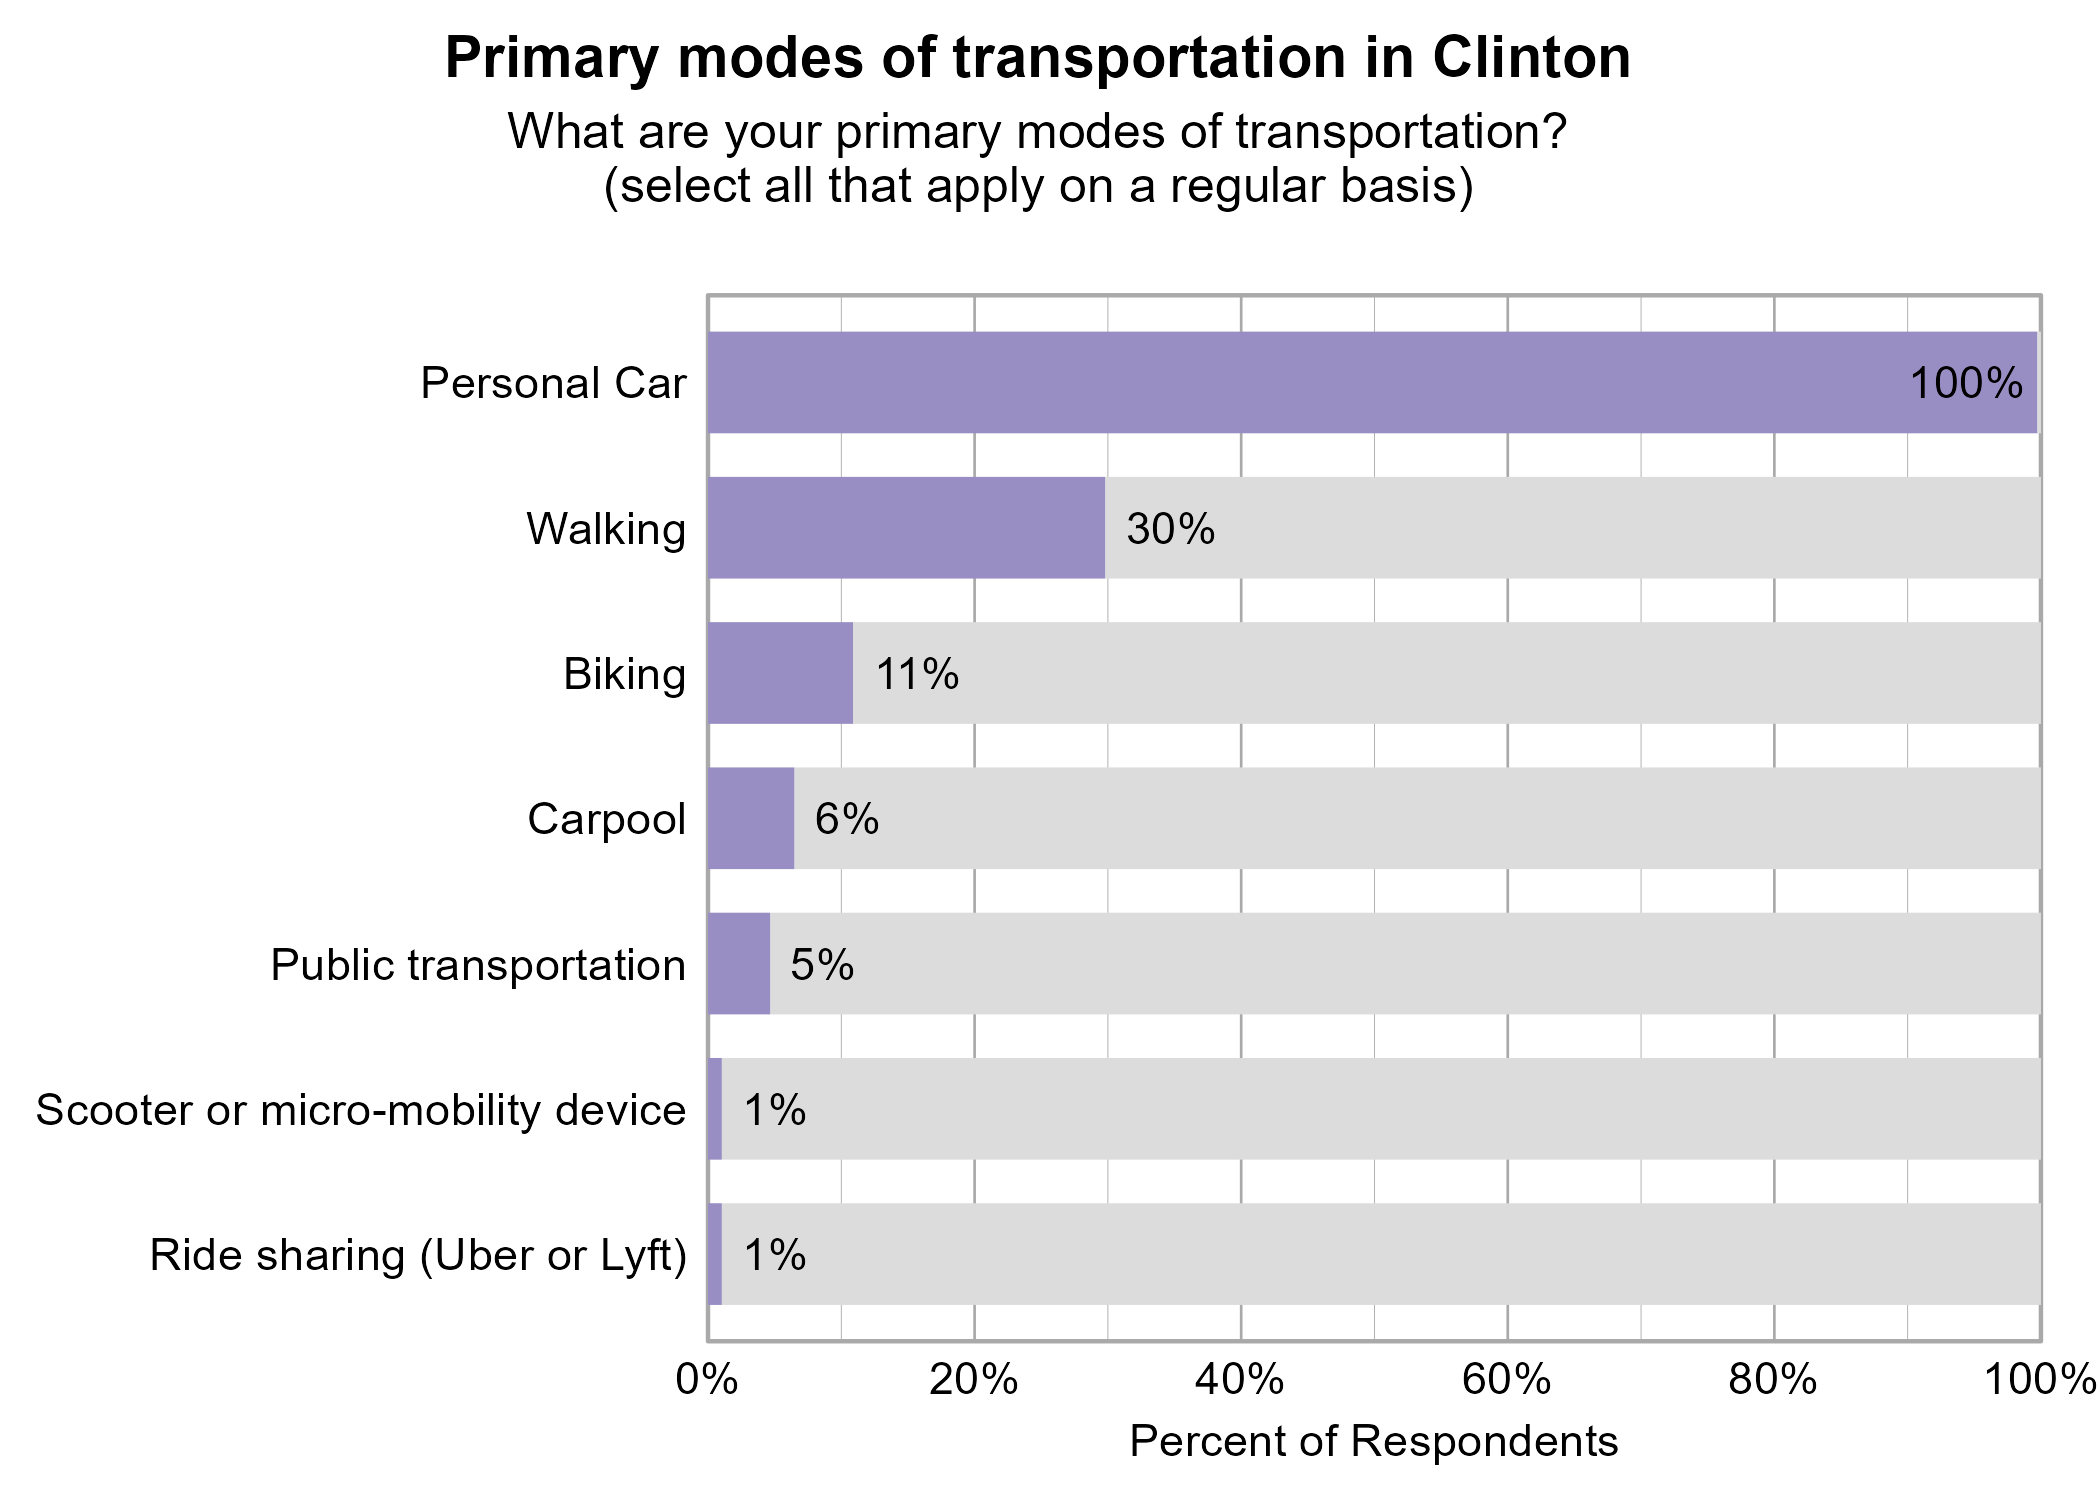
Transportation in Clinton
Respondents were asked to indicate all of their primary modes of transportation on a regular basis in Clinton. The most popular modes of transportation were personal car (100%) and walking (30%).
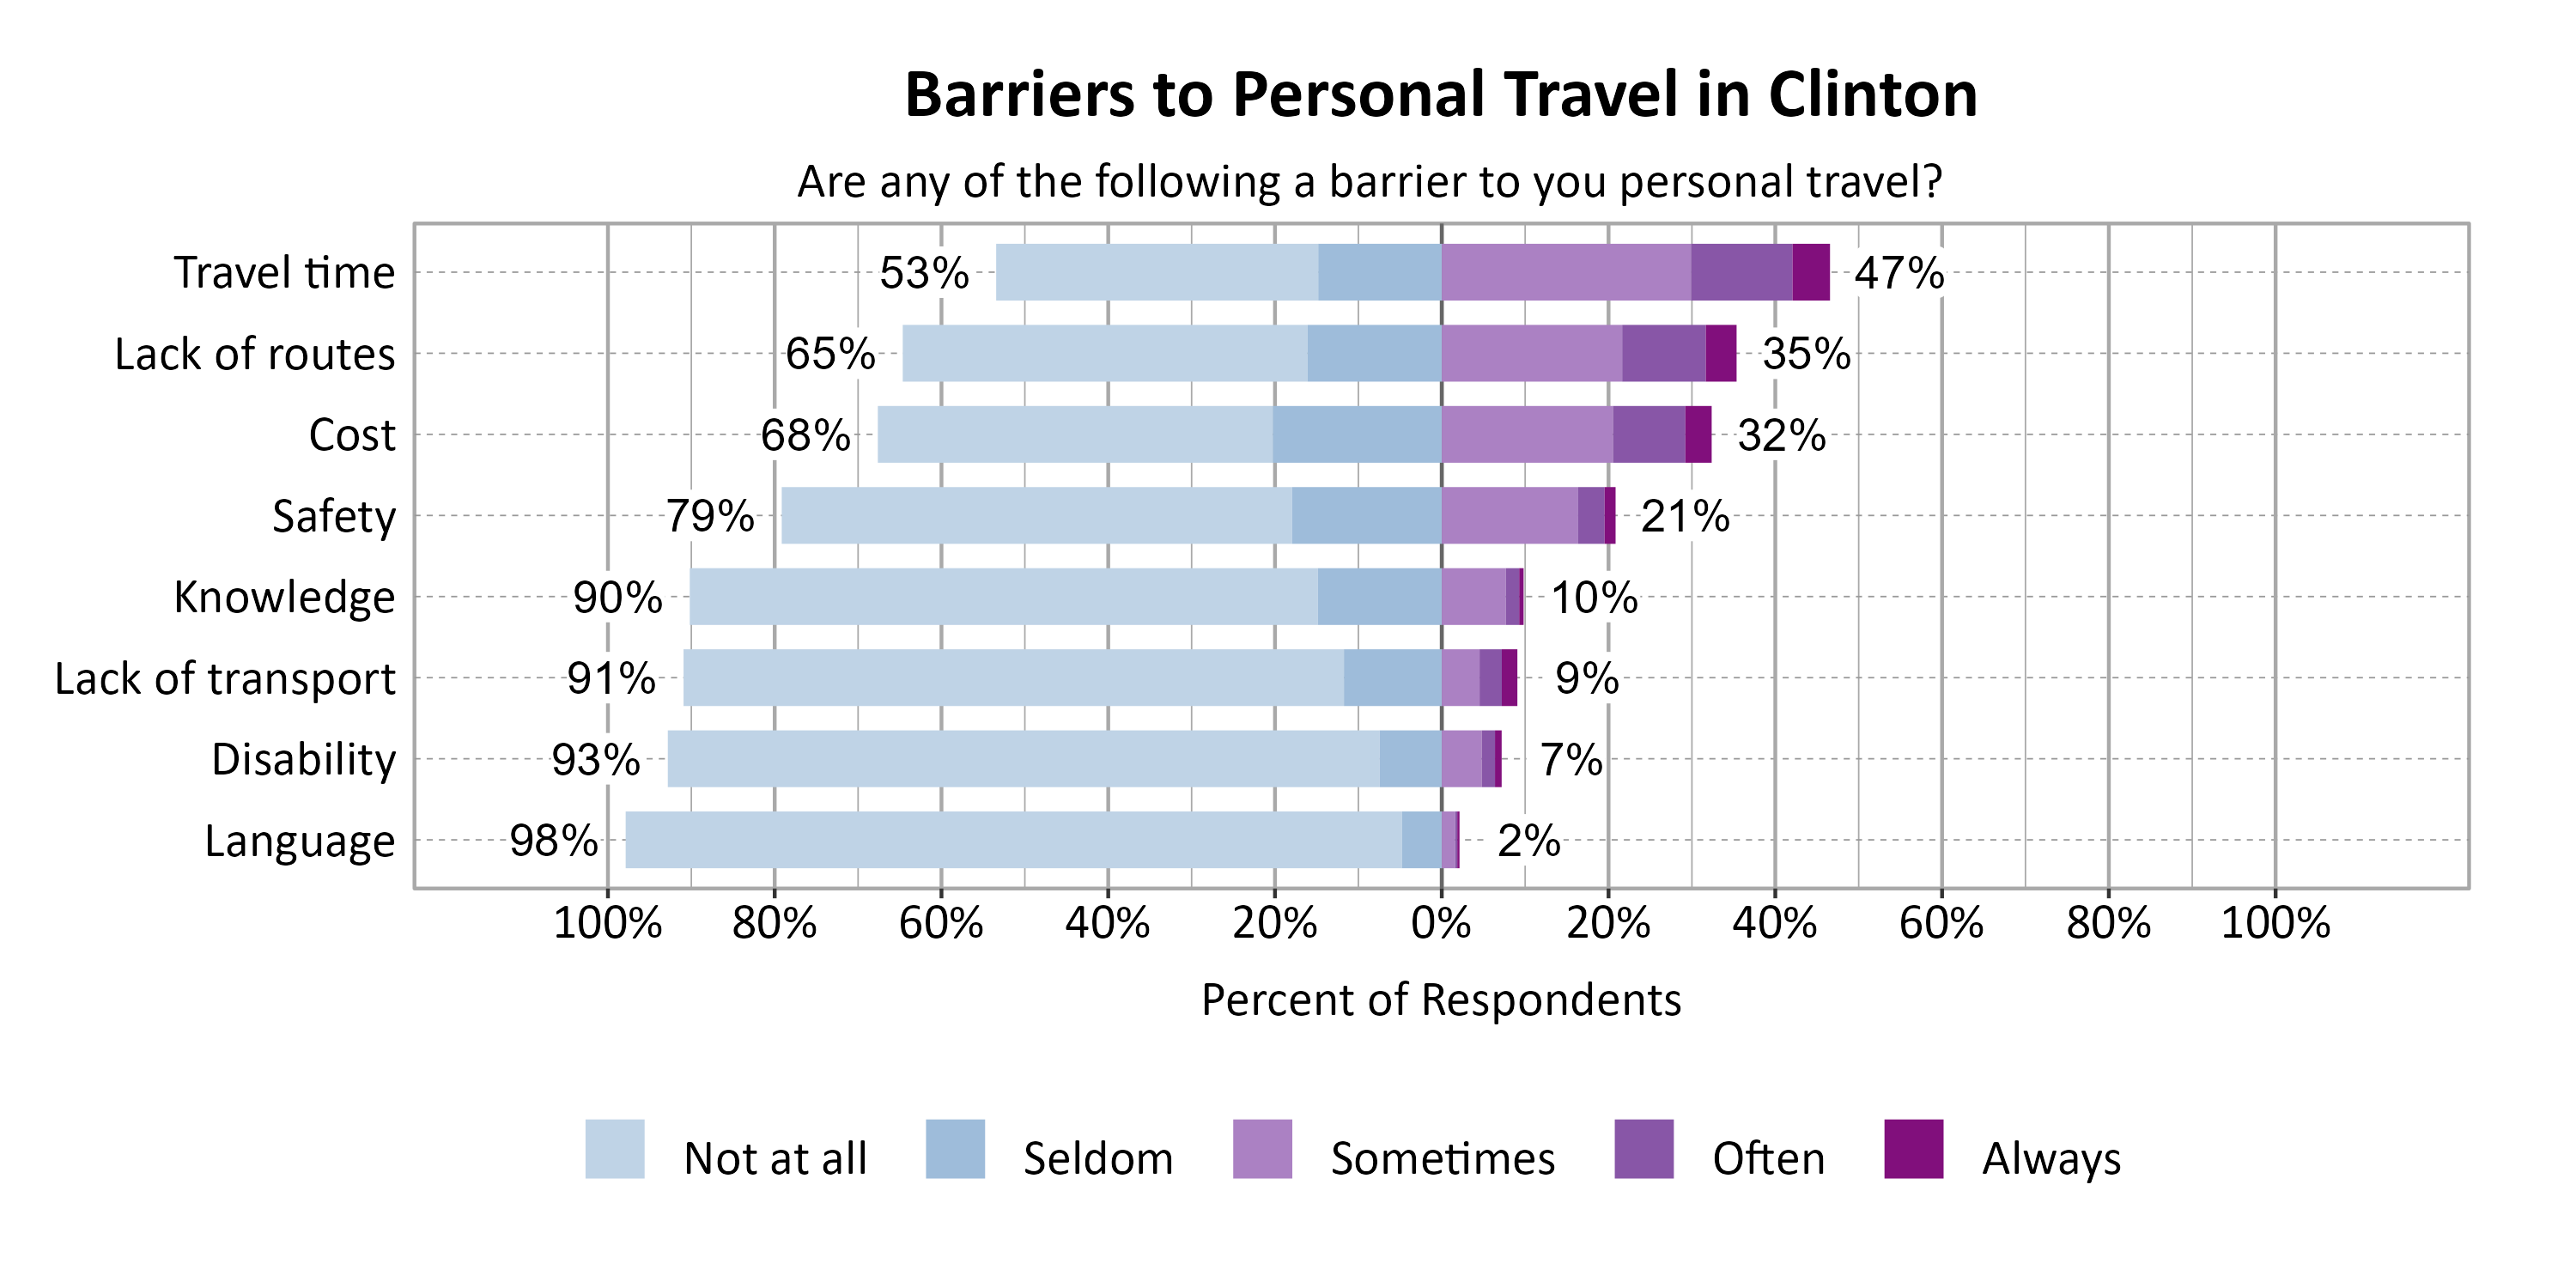
Respondents were asked to indicate the most common barriers to transportation in Clinton. The most problematic barriers were Travel time (47%) and Lack of routes (35%).
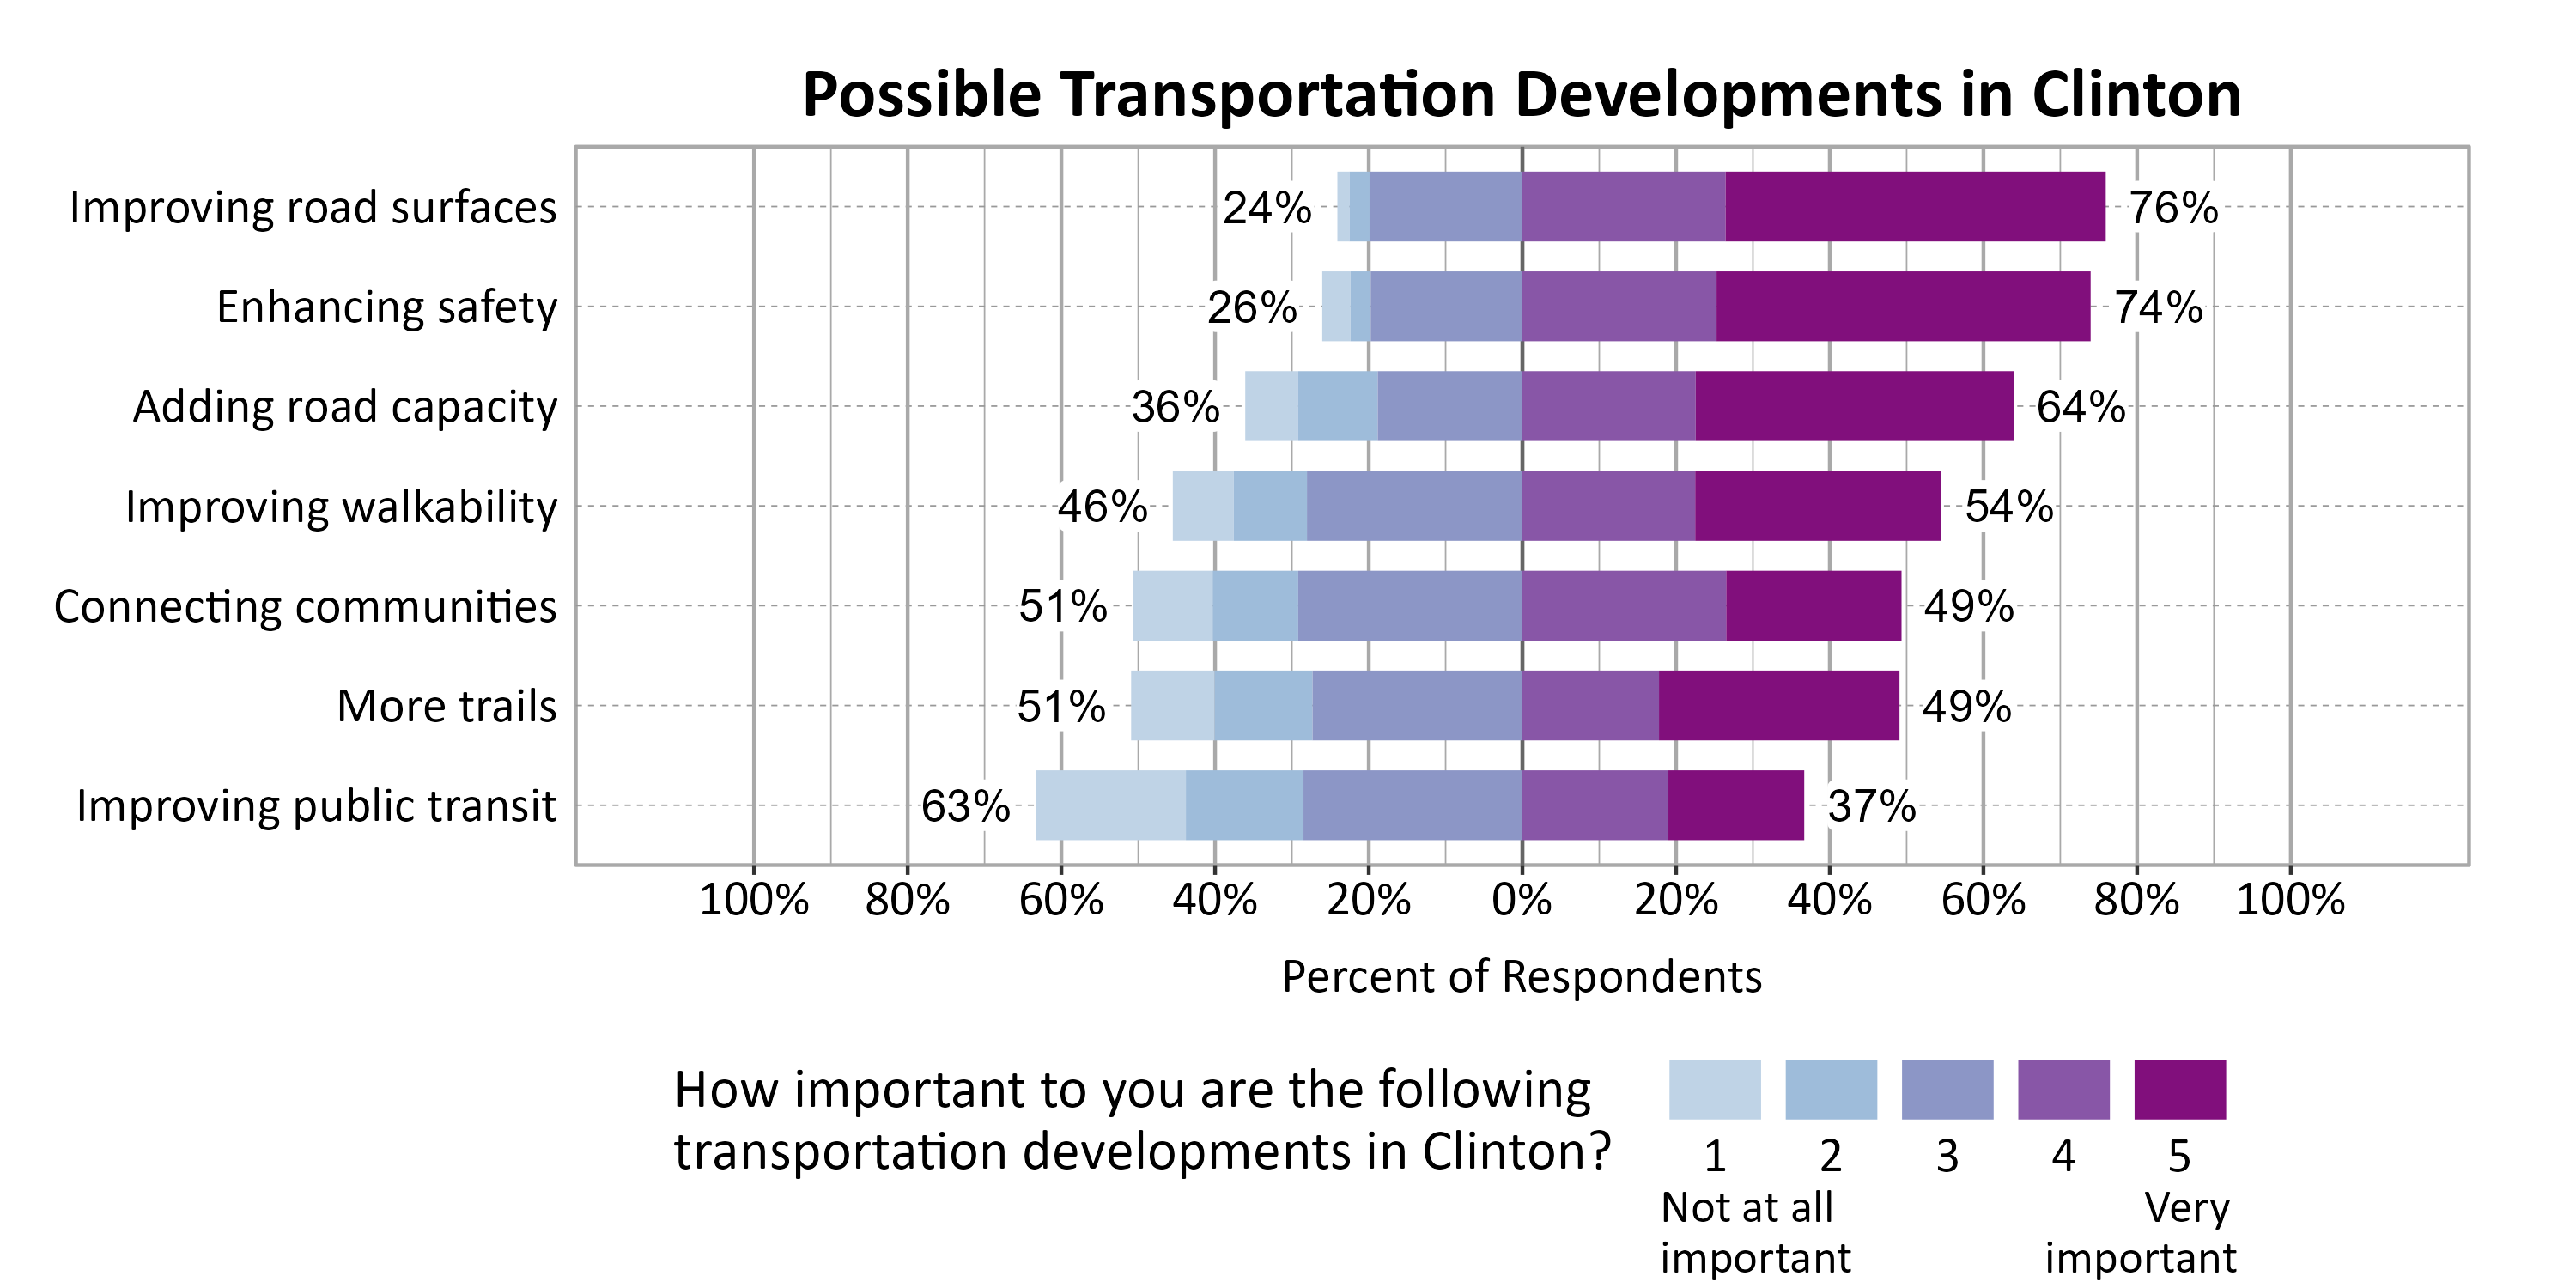
Respondents were asked to indicate the importance of a set of possible transportation developments in Clinton. The most important development to respondents were Improving road surfaces (76%), Enhancing safety (74%), and Adding road capacity (64%).
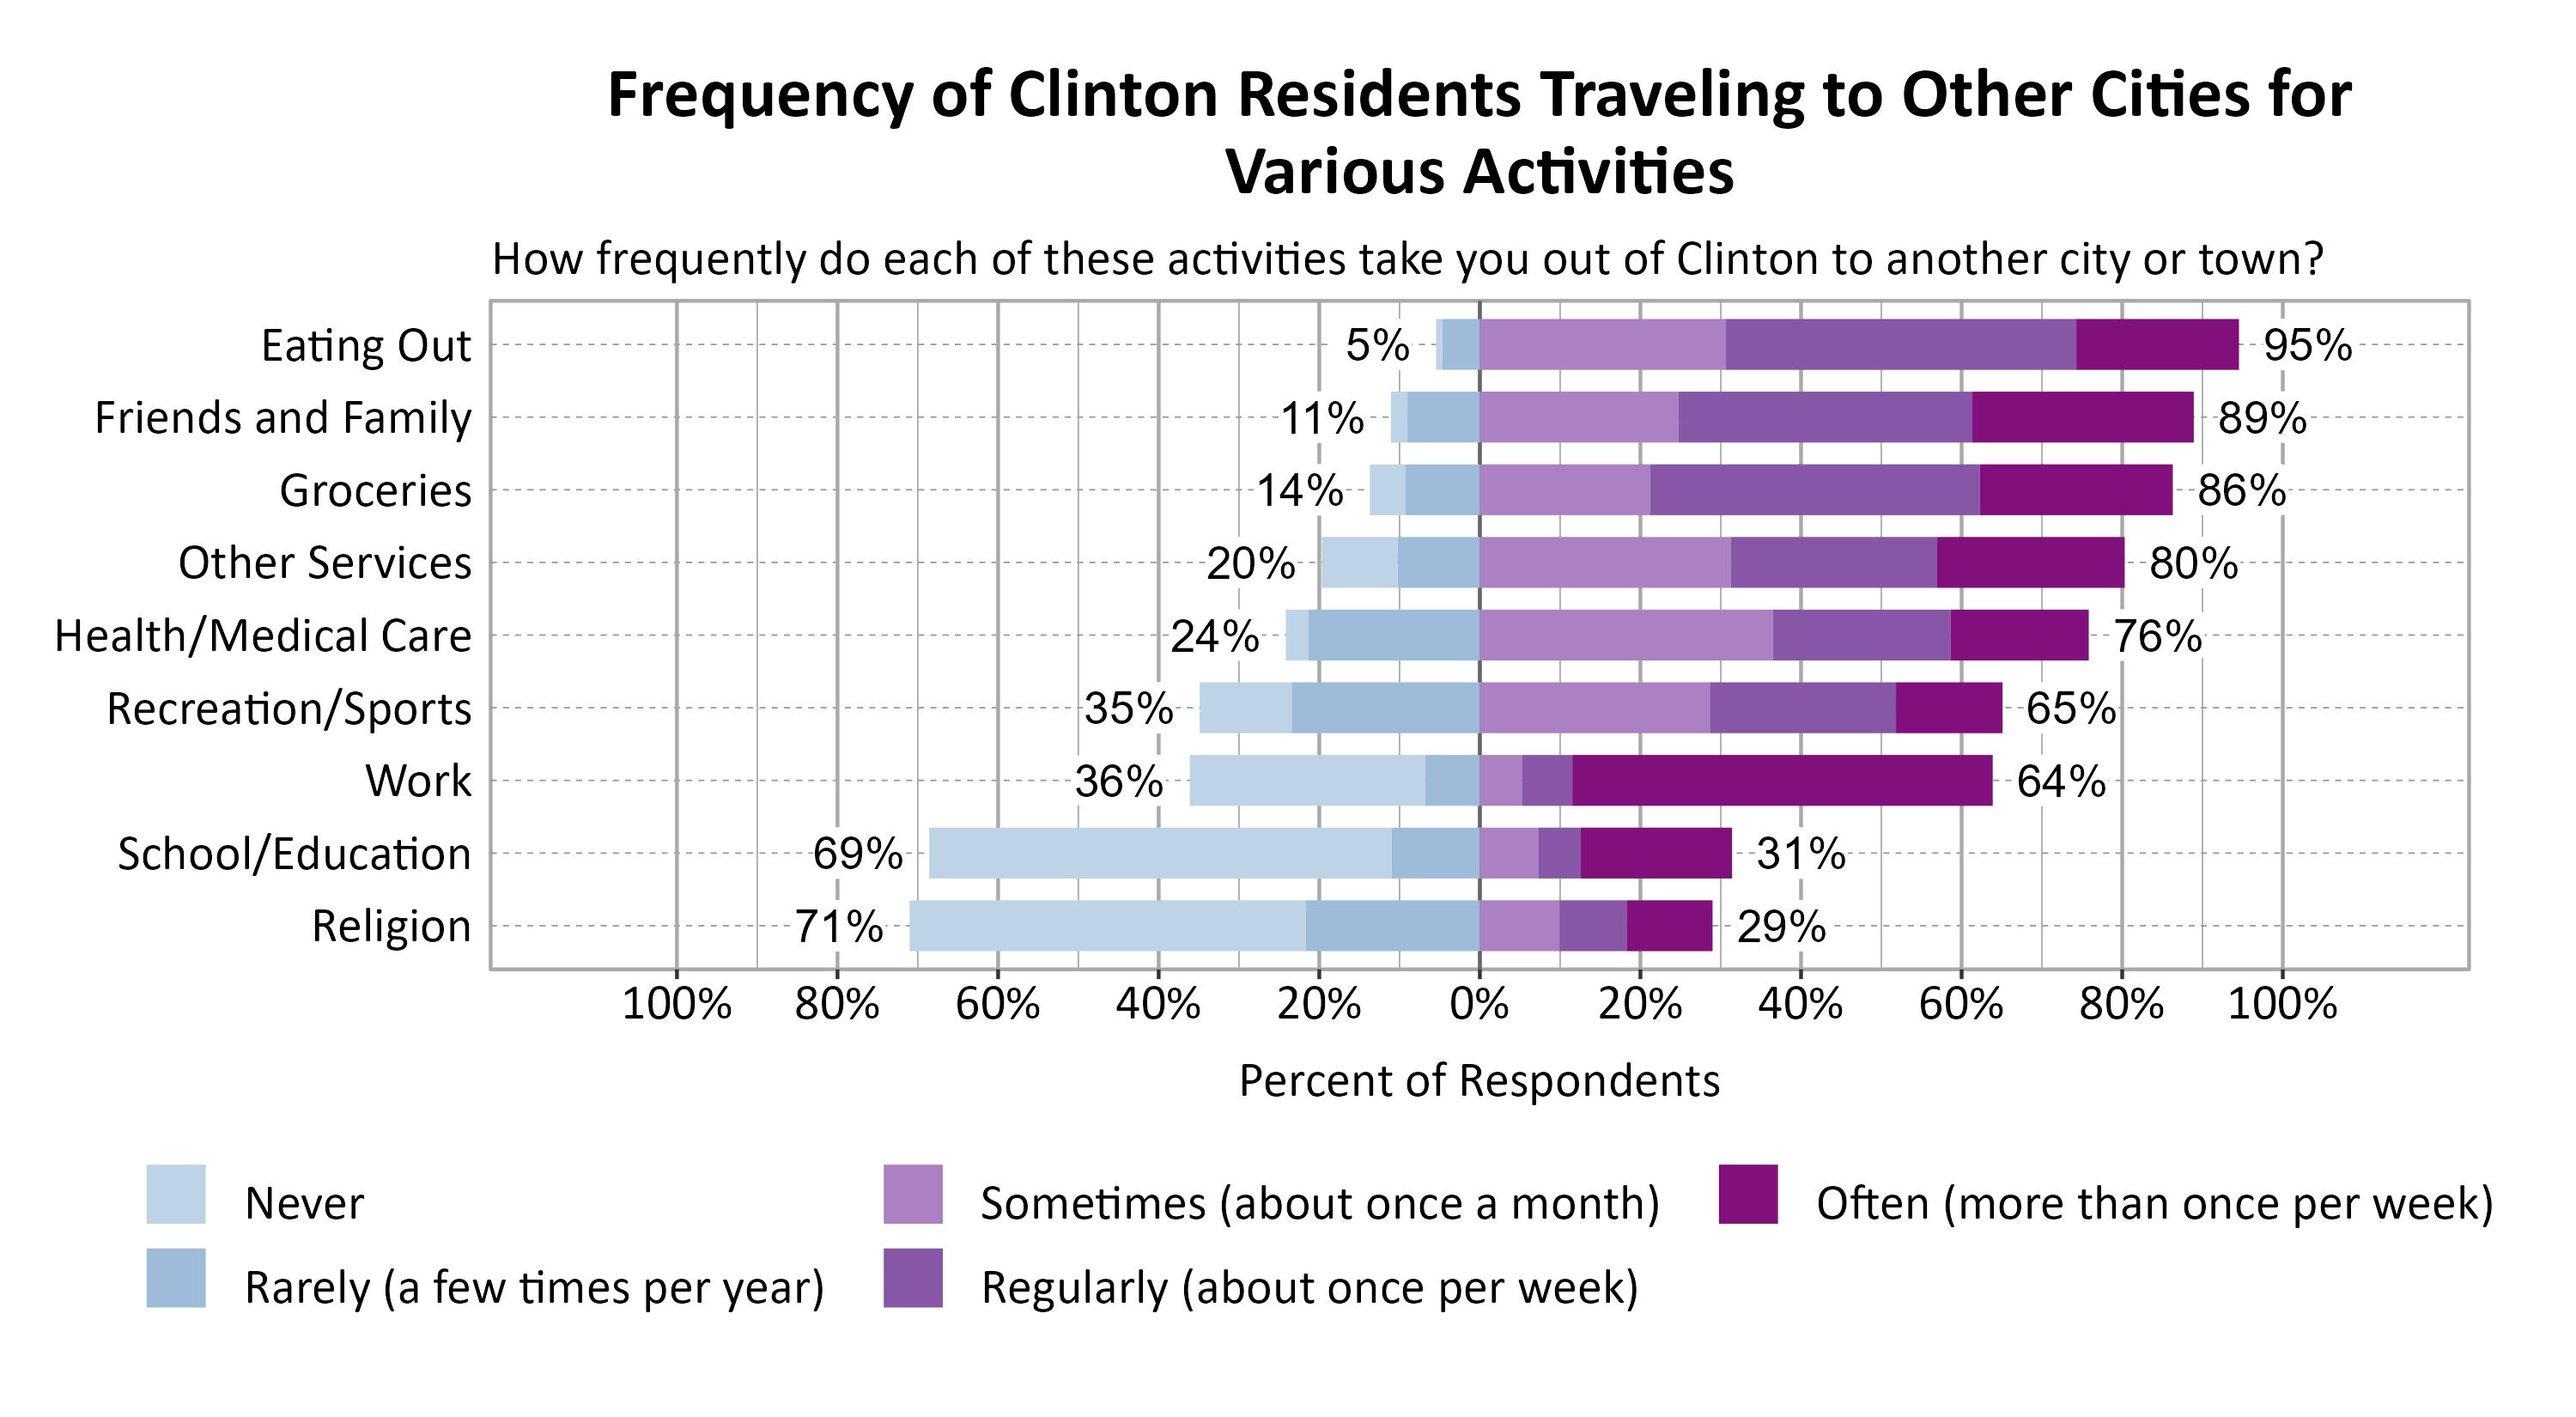
Respondents were asked to indicate how frequently various activities take them out of Clinton to another city or town. The most commonly indicated reasons for traveling to another city or town at least sometimes or once a month were Eating Out (95%), Friends and Family (89%), and Groceries (86%).
Concerns in Clinton
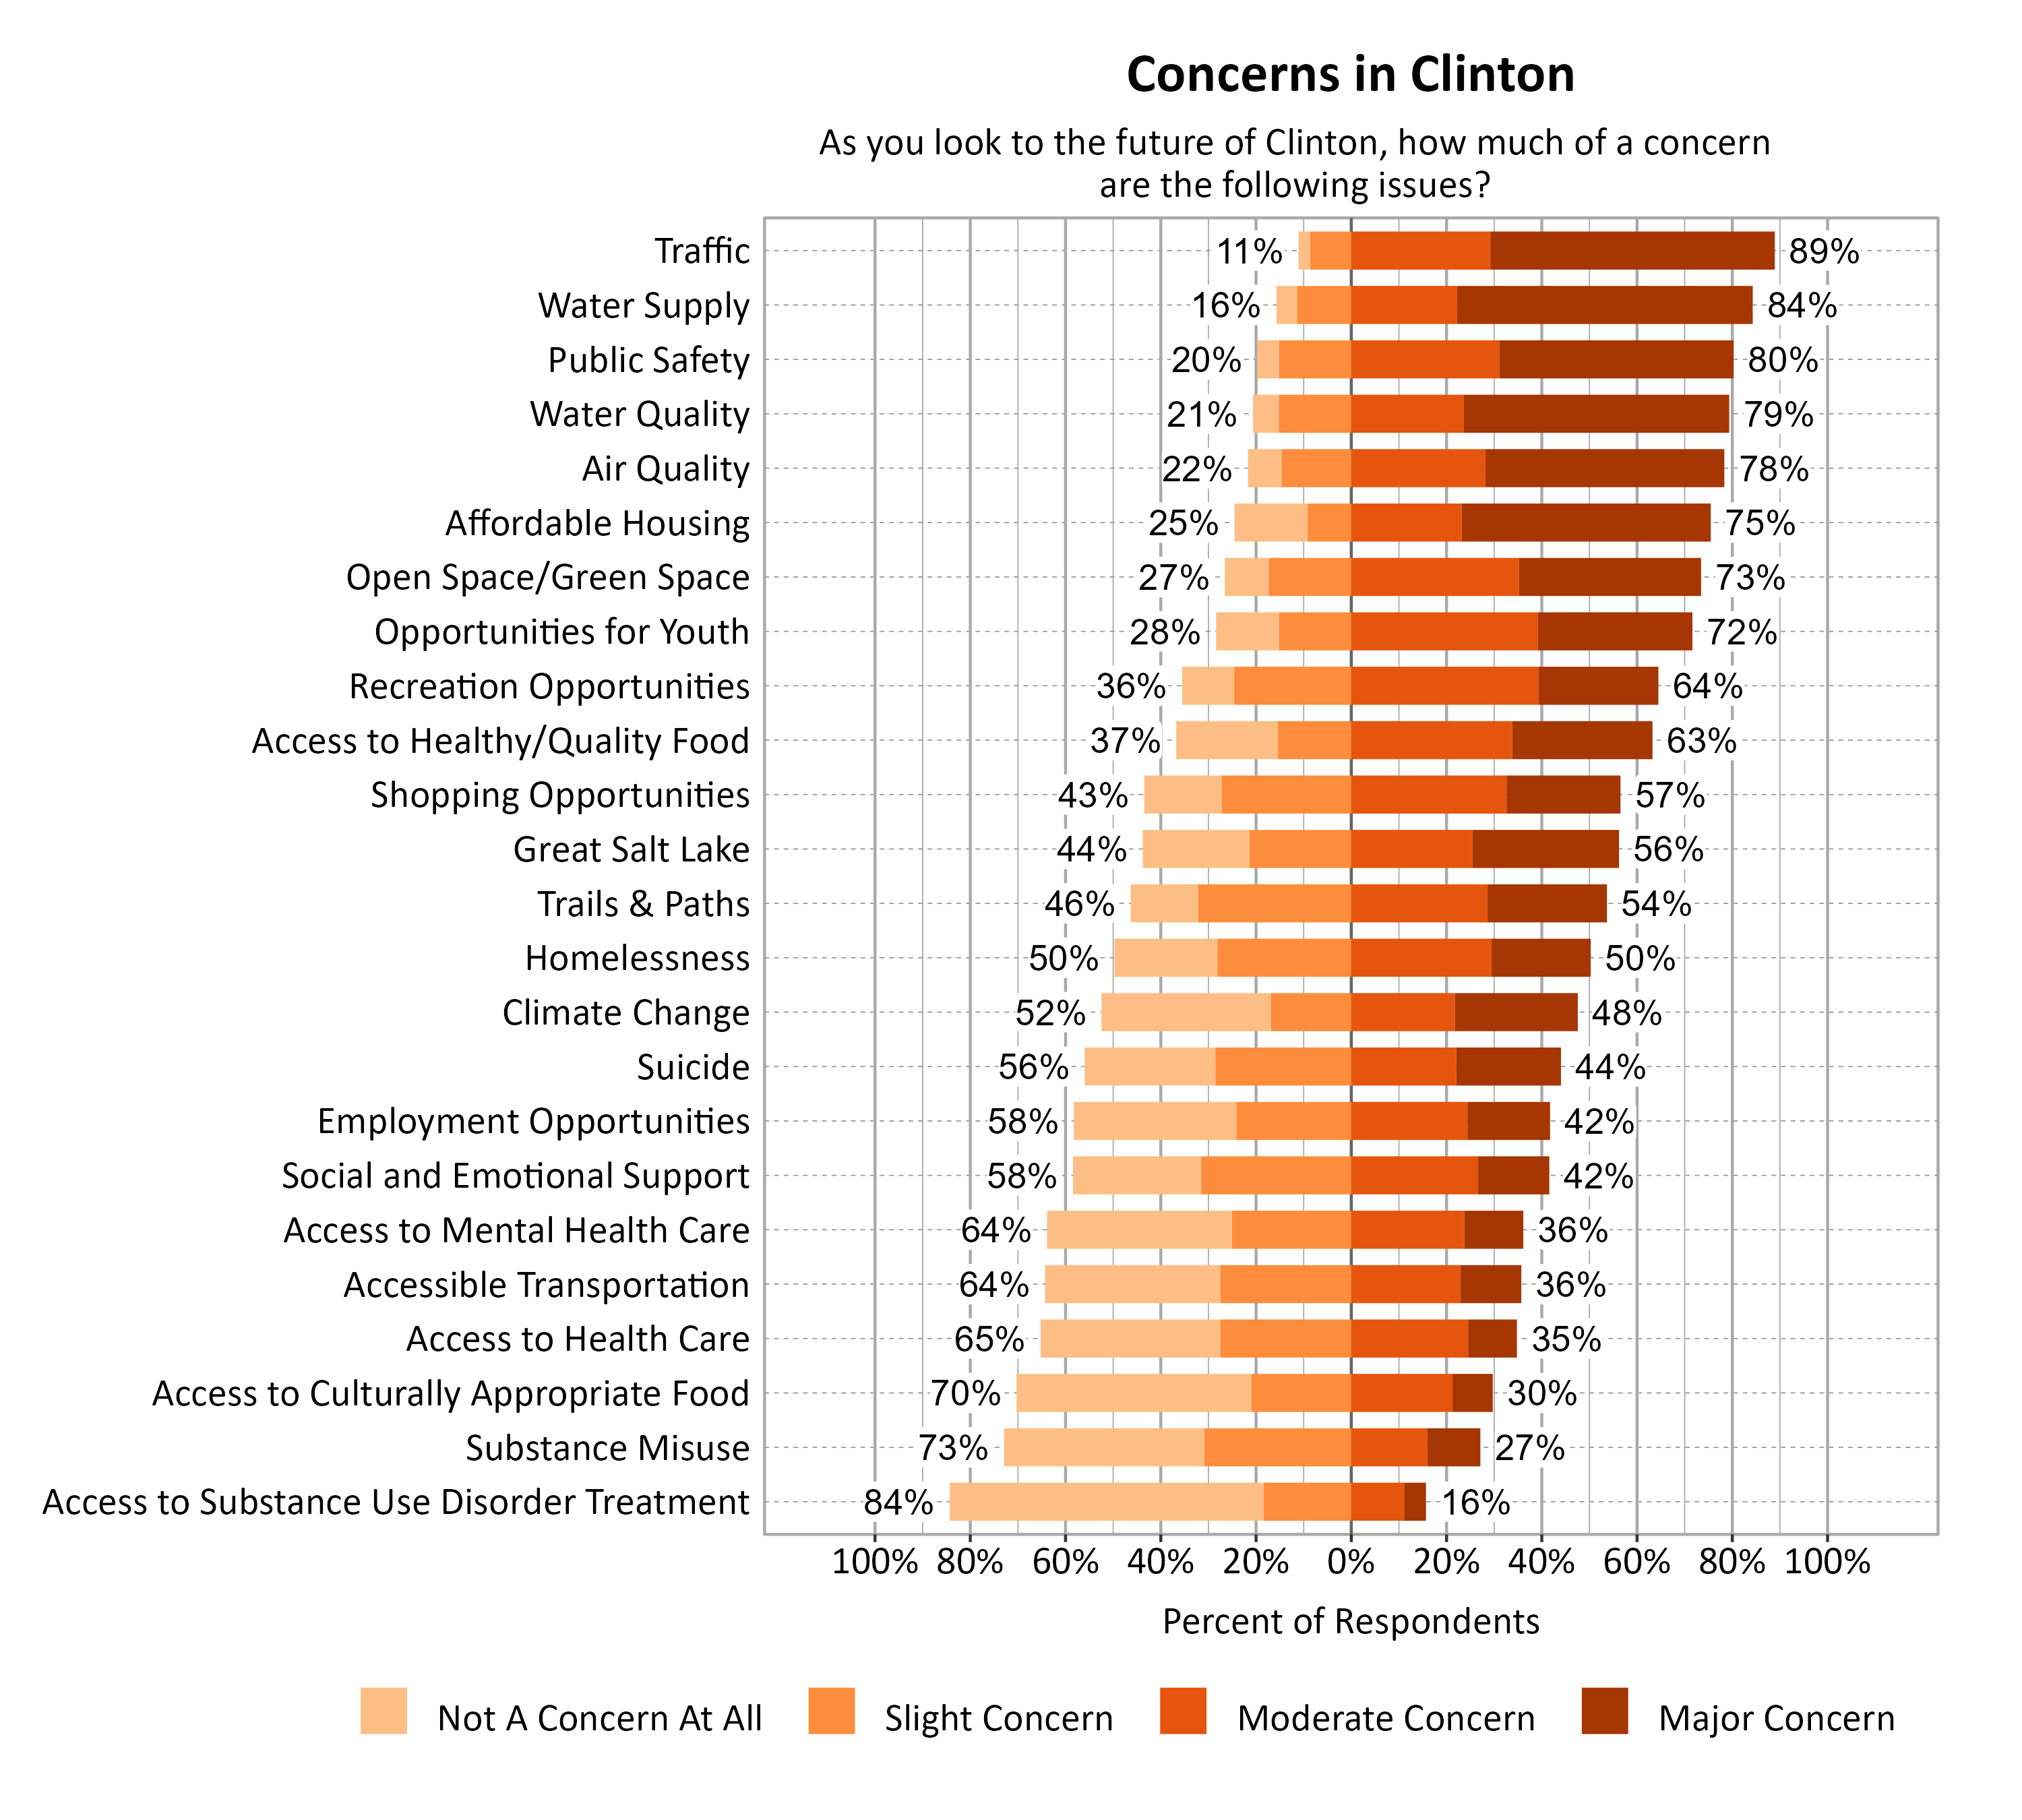
Survey respondents indicated the degree to which a number of possible local issues were a concern as they look to the future of Clinton. Traffic (89%), Water Supply (84%), Public Safety (80%), and Water Quality (79%) were the top concerns.
Additional Questions for Clinton
Housing
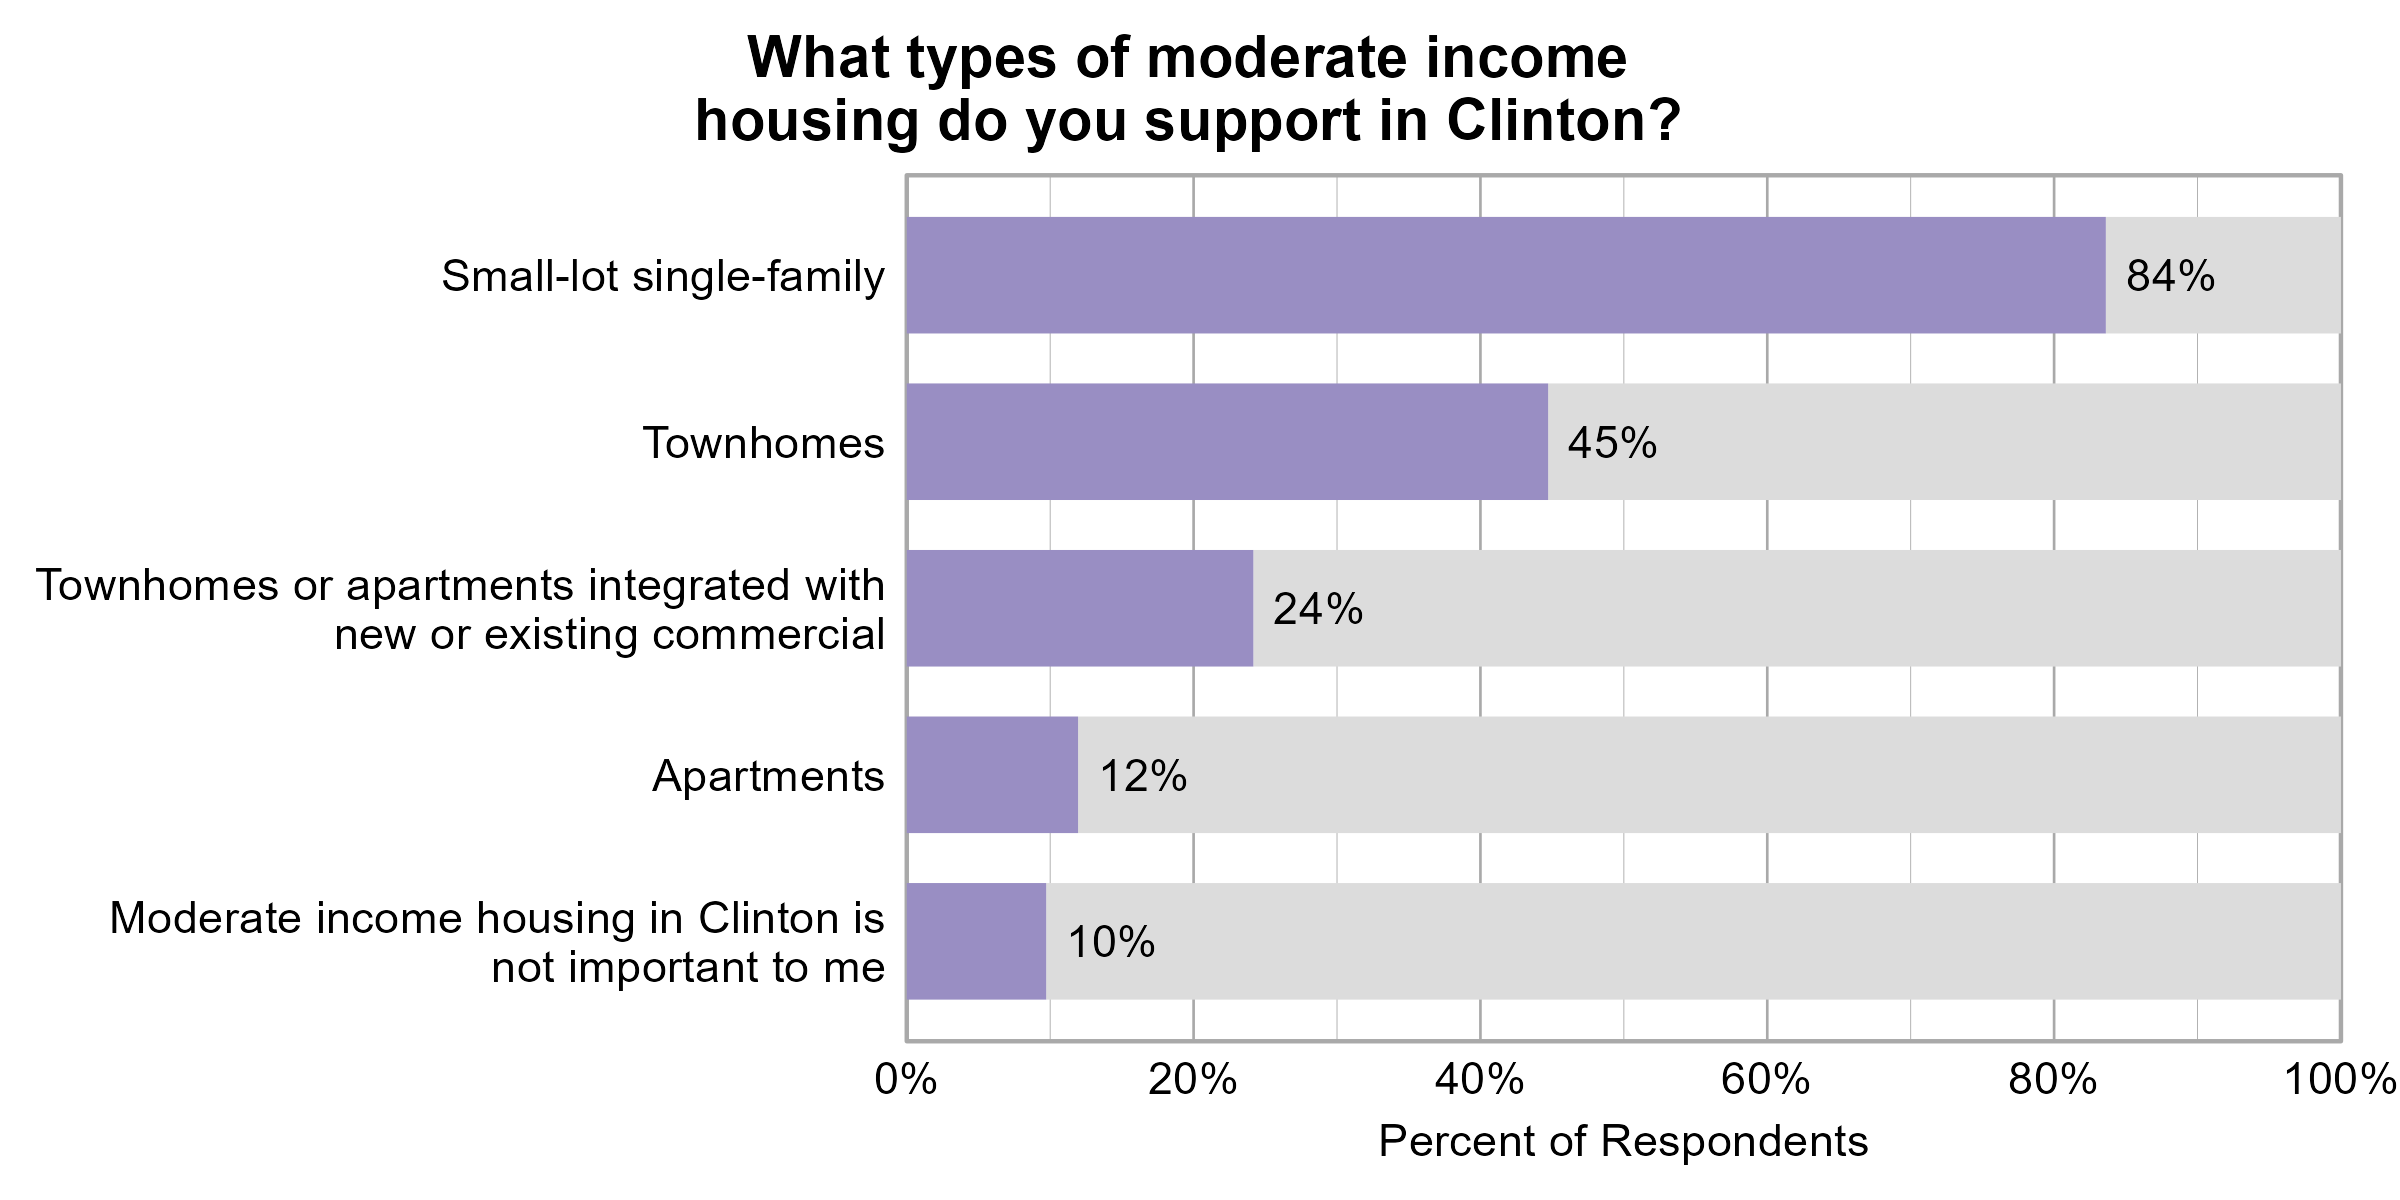
Survey participants were asked about what types of moderate income housing they supported in Clinton and were allowed to indicate any/all housing types that they support. The most supported housing type was a Single-lot single-family (84%) followed by Townhomes (45%).
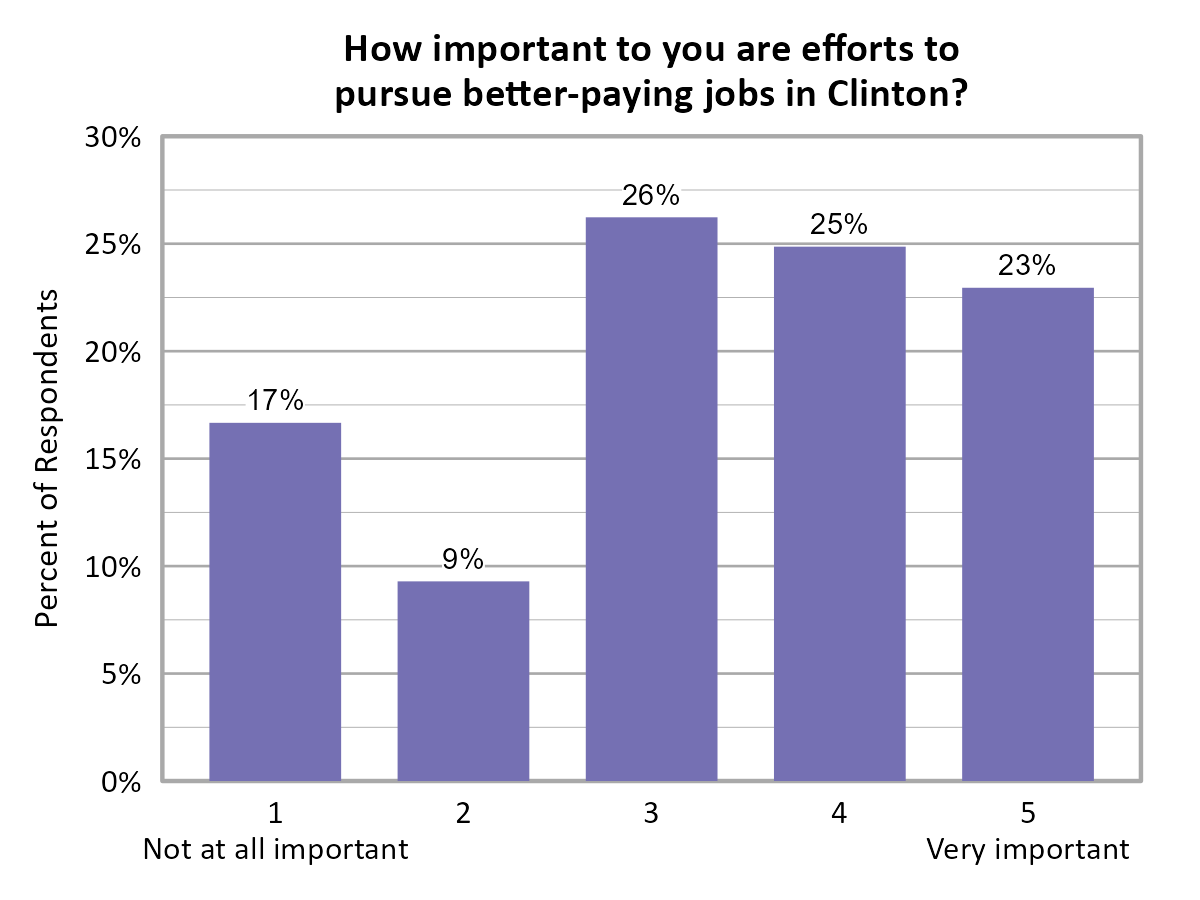
Better-paying Jobs in Clinton
Survey participants were asked about the importance of efforts to pursue better-paying jobs in Clinton, and the results are shown in the graph below. The majority of respondents indicated a 3, 4, or 5.
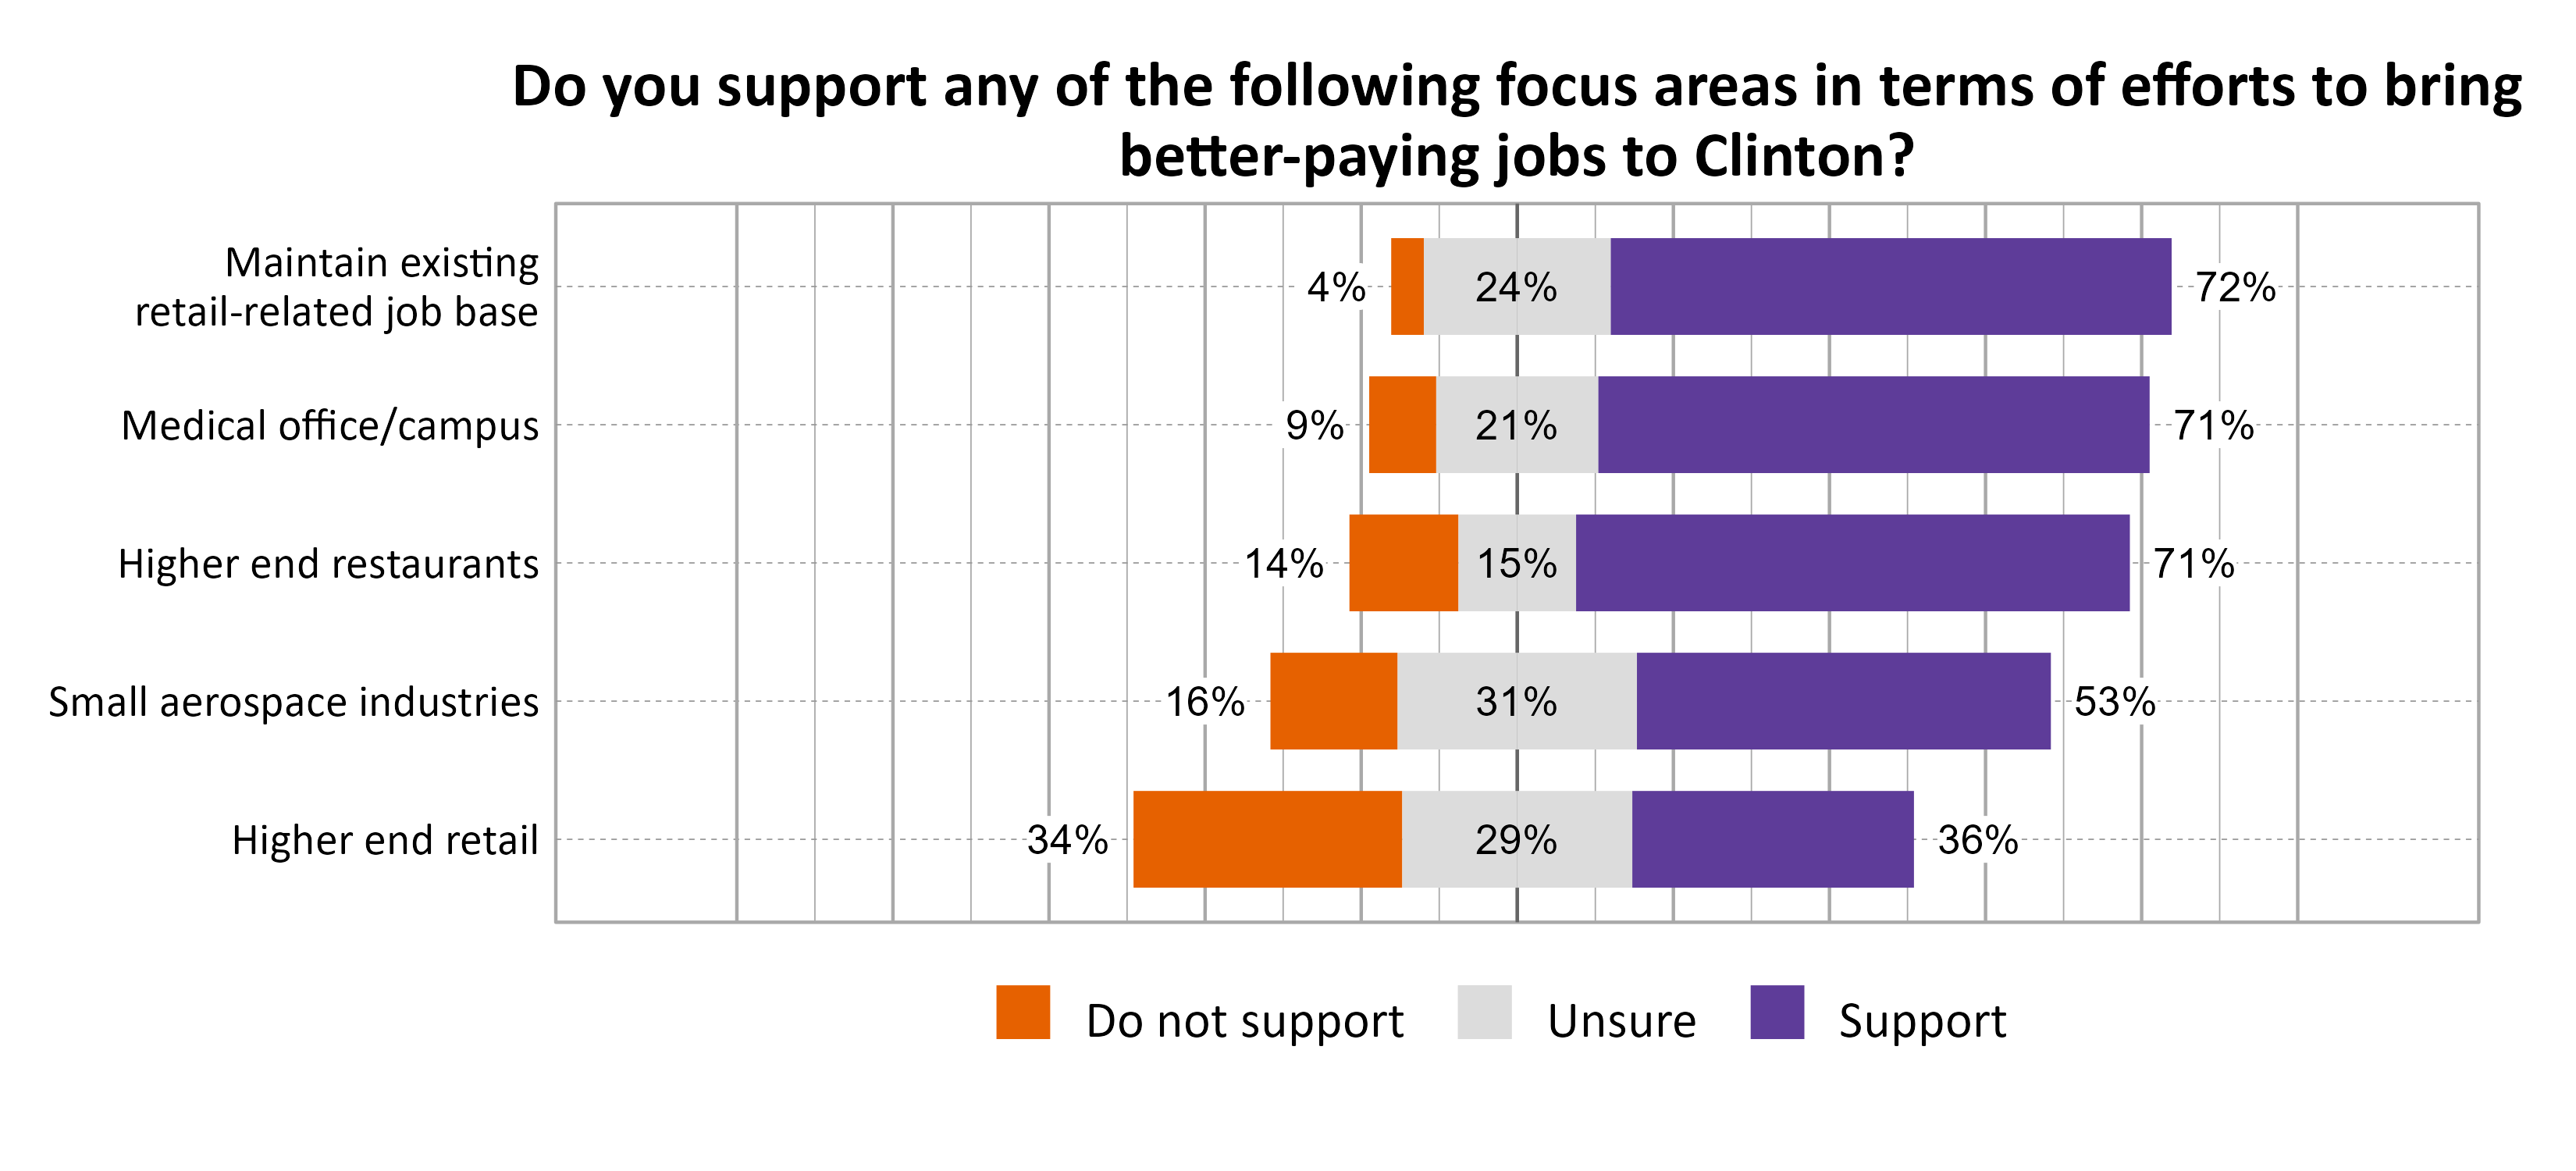
Participants were also asked about what type of focus areas they supported to bring better-paying jobs to Clinton. The most supported answers were Maintain existing retail-related job base (72%), Higher end restaurants (71%), and Medical office/campus (71%).
Economic Development in Clinton
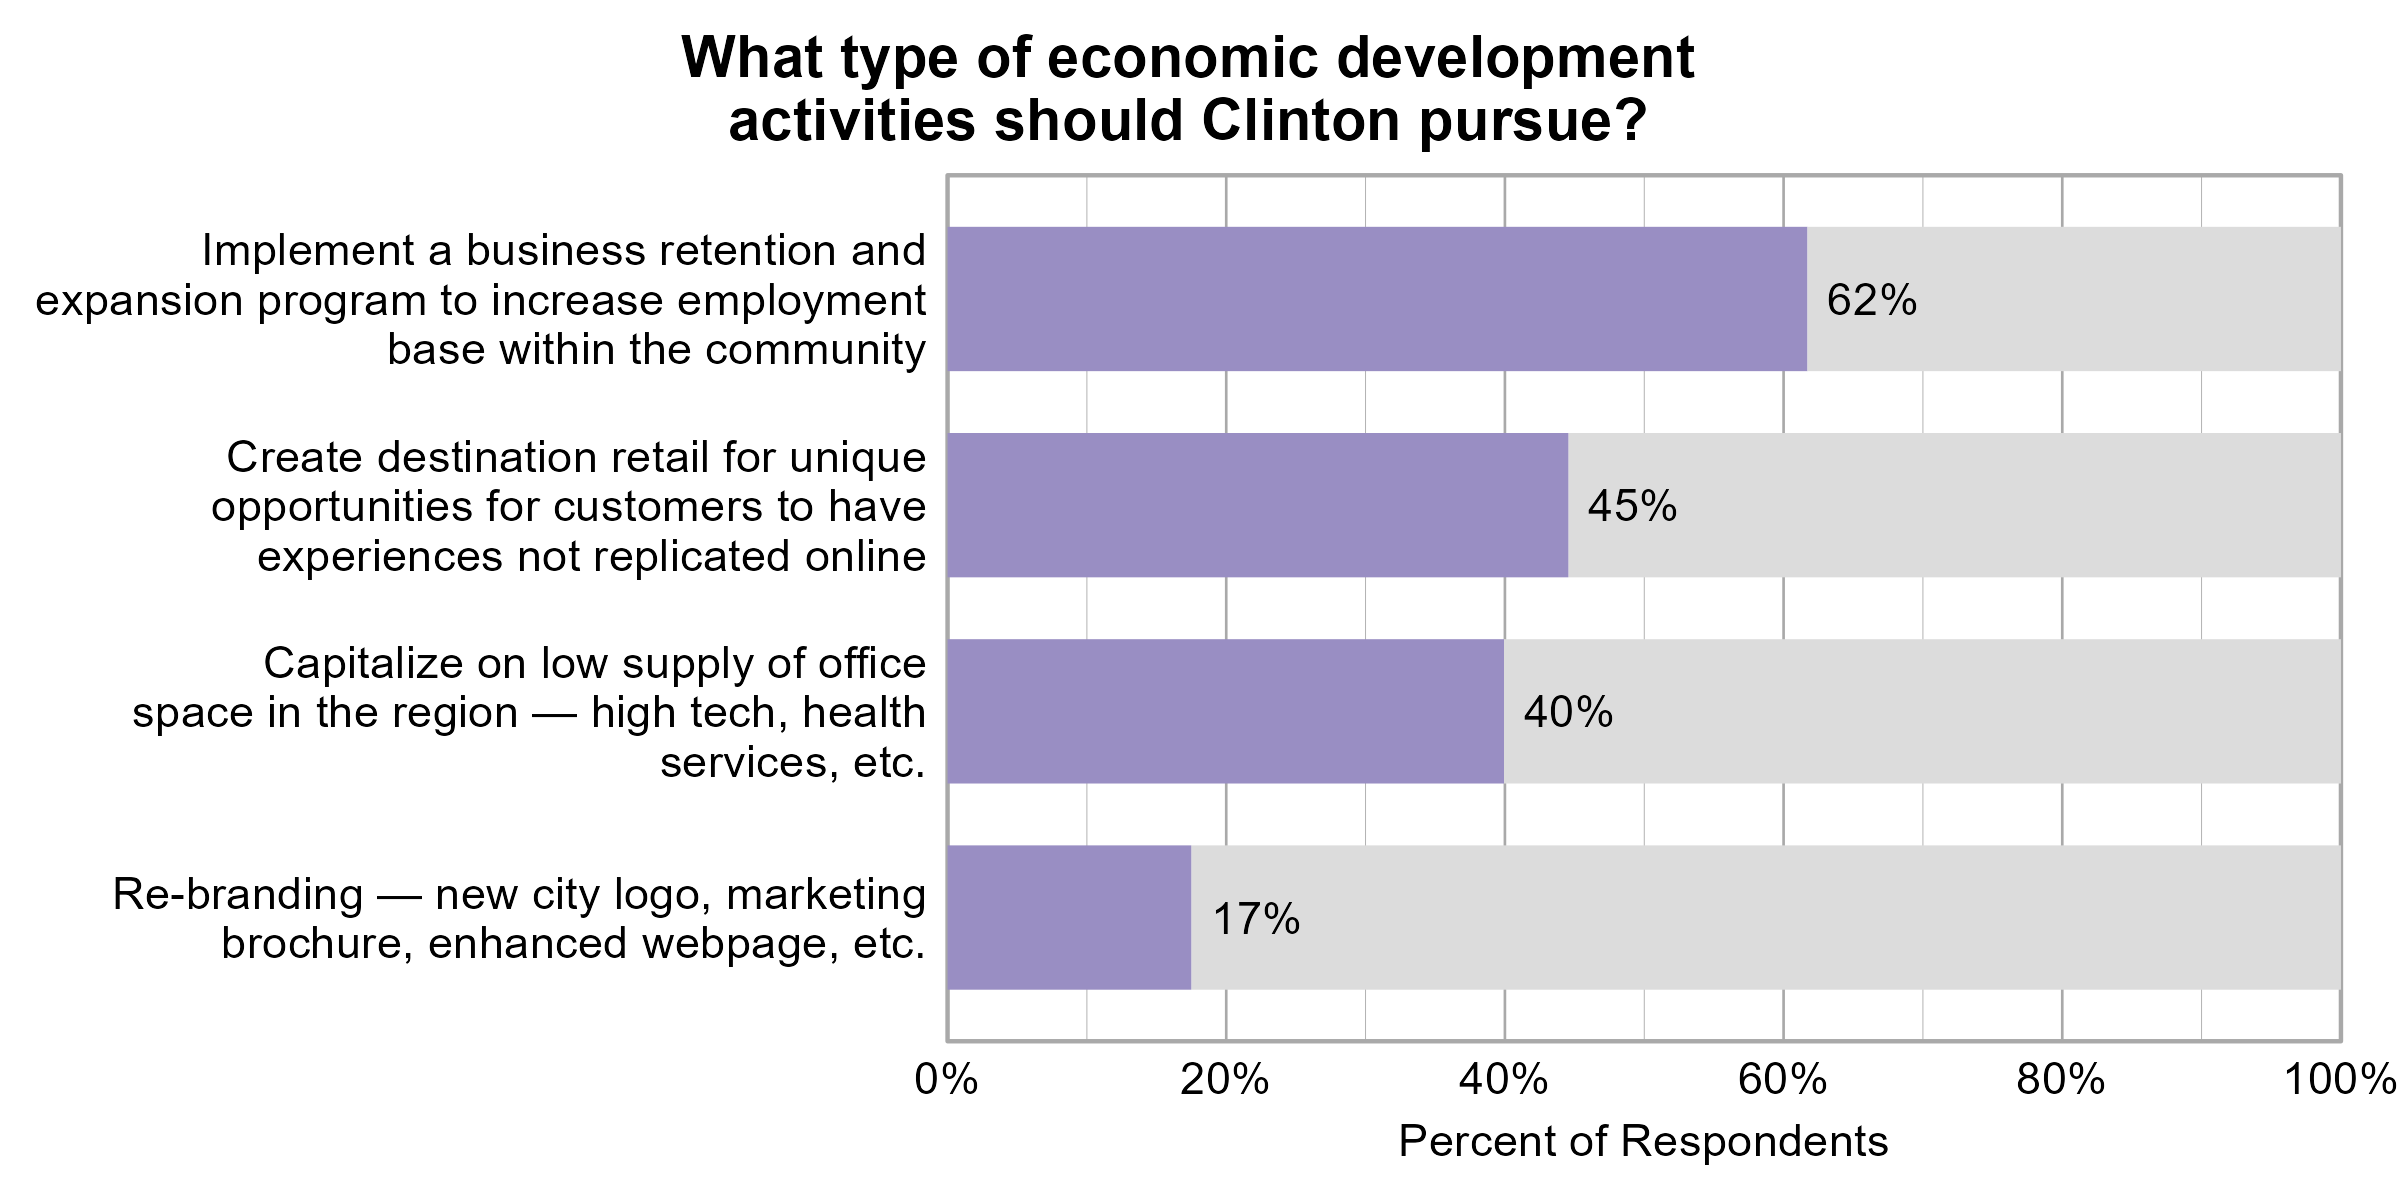
Survey participants were also asked about what type of economic development activities Clinton should pursue. The most supported activity was to implement a business retention and expansion program to increase employment base within the community (62%).
Clinton’s Community Identity
An additional question asked respondents what unique characteristics relate to Clinton’s identity. Responses were both positive and negative. On the positive side, comments emphasized the small town feel of Clinton and it’s safe, friendly, family-oriented atmosphere. People mentioned being able to get everything needed in Clinton or nearby. On the other hand, some said there wasn’t anything unique about Clinton or that its unique identity had been lost or threatened by rapid growth. There were additional responses as detailed in the table below.
| Positive Responses | # | Negative Responses | # |
|---|---|---|---|
| Small Town or Small Town Feel | 49 | None, nothing unique | 23 |
| Family, Children Oriented | 21 | It’s been lost or become just like other places | 19 |
| City has what we need or it’s nearby, accessible | 20 | Concern about losing character with growth, changing too fast | 13 |
| Friendly, Caring, People Help each other, close-knit, community oriented | 16 | No Opinion or Don’t Know | 9 |
| Safe, low crime | 16 | Don’t want high density, low income housing | 5 |
| Bedroom community | 9 | Poorly kept houses and property | 4 |
| Peaceful, Quiet | 8 | Want more restaurants | 4 |
| Open areas and parks, green spaces, trails | 8 | Need trails, protect open space, losing open space | 3 |
| Right size - not too big or too small, has grown responsibly, small but near urban | 8 | Need to allow alcohol in restaurants, want liquor store | 3 |
| Single family homes, not a lot of apartments, large lots | 8 | Feeling sad or disappointed about Clinton | 3 |
| Love Clinton | 7 | Too few activities | 3 |
| Farming Community | 6 | Poor rec dept | 2 |
| Suburban | 5 | Not diverse | 2 |
| Love rec program, sporting activities, parks | 5 | Tax increase | 2 |
| Trying to continue a small community atmosphere but trying to attract more people, trying to catch up | 5 | People need to clean up after dogs, limit dogs | 2 |
| Good Mayor, Great Leadership | 4 | No jr high or high school | 1 |
| Clean | 4 | Traffic | 1 |
| Comfortable, nice community | 4 | Failing businesses | 1 |
| Police Care, Love first responders | 3 | Divide between classes | 1 |
| Good community events | 3 | Negative about government | 1 |
| Close to air force base | 3 | Lame | 1 |
| Accessible, walkable | 3 | Need small businesses | 1 |
| Balance of businesses and homes | 2 | Need safer roads | 1 |
| Shopping opportunities | 2 | City at disadvantage due to lack of access to I-15 | 1 |
| Higher middle class | 2 | Trying to catch up to other places near by | 1 |
| Not crowded | 2 | Cost of sewer is high | 1 |
| Good, very good | 2 | Fire dept understaffed | 1 |
| Slower paced than city life | 2 | Hard to break into city organization and culture | 1 |
| Flowers that used to hang along main dirt roads | 2 | Need to protect community the way it is | 1 |
| Connected to Roots | 1 | Too many churches | 1 |
| Traffic not too bad | 1 | Keep industry out | 1 |
| No people living on the streets | 1 | Keep retail and commercial properties away from residential homes | 1 |
| Attracting people and business | 1 | Shopping is not unique | 1 |
| Affordable | 1 | Negative about digging same roads | 1 |
| Good schools | 1 | Keep it boring | 1 |
| Love that it’s away from interstate | 1 | Would like a hospital | 1 |
| Has a good place for seniors to gather | 1 | Would like pickleball courts | 1 |
| Hidden gem | 1 | Lack of industrial base | 1 |
| HAFB doesn’t allow Clinton to grow tax base to improve services provided by other cities | 1 |
Open Comments
All open comments collected in the survey were shared with city leaders. General observations and themes are shared here.
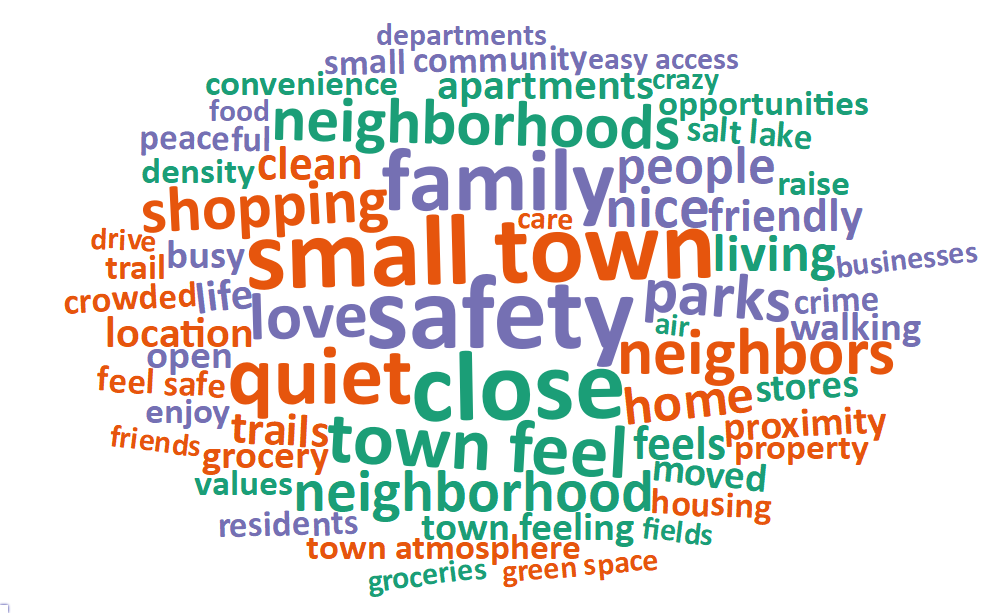
What Respondents Value Most in Clinton
Survey respondents were asked to comment on what they value most about Clinton. The most common words and phrases from all city comments are included in the word cloud below. It is possible that negative or unrelated words may appear since these words have been taken out of context, and they may not indicate the respondent’s intended meaning. Safety was mentioned by many as being of value to many in Clinton. The small town feel as well as the community in Clinton were also mentioned by many. The location of Clinton was also mentioned by many, specifically bringing up access to other communities, stores and businesses, and the freeway.
Local Environmental Quality in Clinton
The 51% of respondents who rated the Local Environmental Quality domain as 1, 2, or 3 (Poor, Fair, or Moderate) were further asked if there are specific aspects of local environmental quality that they feel are problematic. Air quality in Clinton was a major concern due to inversions and dust. The lack of green space and trees in Clinton was also a concern. Road construction, traffic, and a lack of alternate modes of transportation were also mentioned.
Improving Wellbeing in Clinton
Survey respondents were asked if there is anything that could be done to improve wellbeing in Clinton. Transportation was brought up often, mentioning not only needed road and traffic safety but also citing that road conditions need to be improved. People also mentioned wanting more recreation and other local opportunities and activities for people of all ages.
Additional Comments
Respondents were also asked if they had any additional comments on wellbeing in Clinton. City government themes arose with this question, some stating their support and appreciation for the current city employees and mayor, while others wanted more enforcement of city codes by the government which also reflects themes about wanting the city image to be improved.