Draper Wellbeing Survey Findings 2024
By Dr. Courtney Flint and Team
![]()
Contact Information
Dr. Courtney Flint
courtney.flint@usu.edu
435-797-8635
Summary
Draper is one of 51 cities participating in the Utah Wellbeing Survey Project in 2024. This project is designed to assess the wellbeing and local perspectives of city residents and to provide information to city leaders to inform general planning processes. Additional analysis is underway and this report may be updated over time.
We are grateful to all those who took the survey and to our city partners who helped to make this possible. We are grateful to a number of entities for funding: the Utah League of Cities and Towns, USU Extension, USU’s Institute for Land Water and Air, the Wasatch Front Regional Council, Utah Department of Transportation, the Utah Agricultural Experiment Station, and the cities of Alpine, Cedar Hills, Draper, Millcreek, Nephi, North Salt Lake, Ogden, Orem, Pleasant Grove, Providence, Springdale, Tremonton, West Bountiful, and West Valley City.
This report describes findings from the 2024 Draper survey and comparative information with other project cities. In April and May 2024, Draper City advertised the survey for residents largely through newsletters, Notify Draper, and social media. All city residents age 18+ were encouraged to take the online Qualtrics survey.
How many people responded?
- 650 viable surveys were recorded in this 2024 survey effort.
- The Draper 2022 survey had 888 responses and the Draper 2021 survey had 375 responses and the Draper 2020 survey had 355 responses.
- The adult population of Draper was estimated at 35,381, based on the American Community Survey by the U.S. Census. The 650 survey responses in 2024 represent 1.8% of the adult population and have a conservative margin of error of 3.81%.
Survey Respondent Characteristics
| Resident Statistics | |
|---|---|
| Full Time Residents of Draper | 98.6% |
| Part Time Residents of Draper | 1.4% |
| Length of Residency — Range | 1-75 years |
| Length of Residency — Average | 13.4 years |
| Length of Residency — Median | 11 years |
| Length of Residency 5 Years or less | 26.7% |
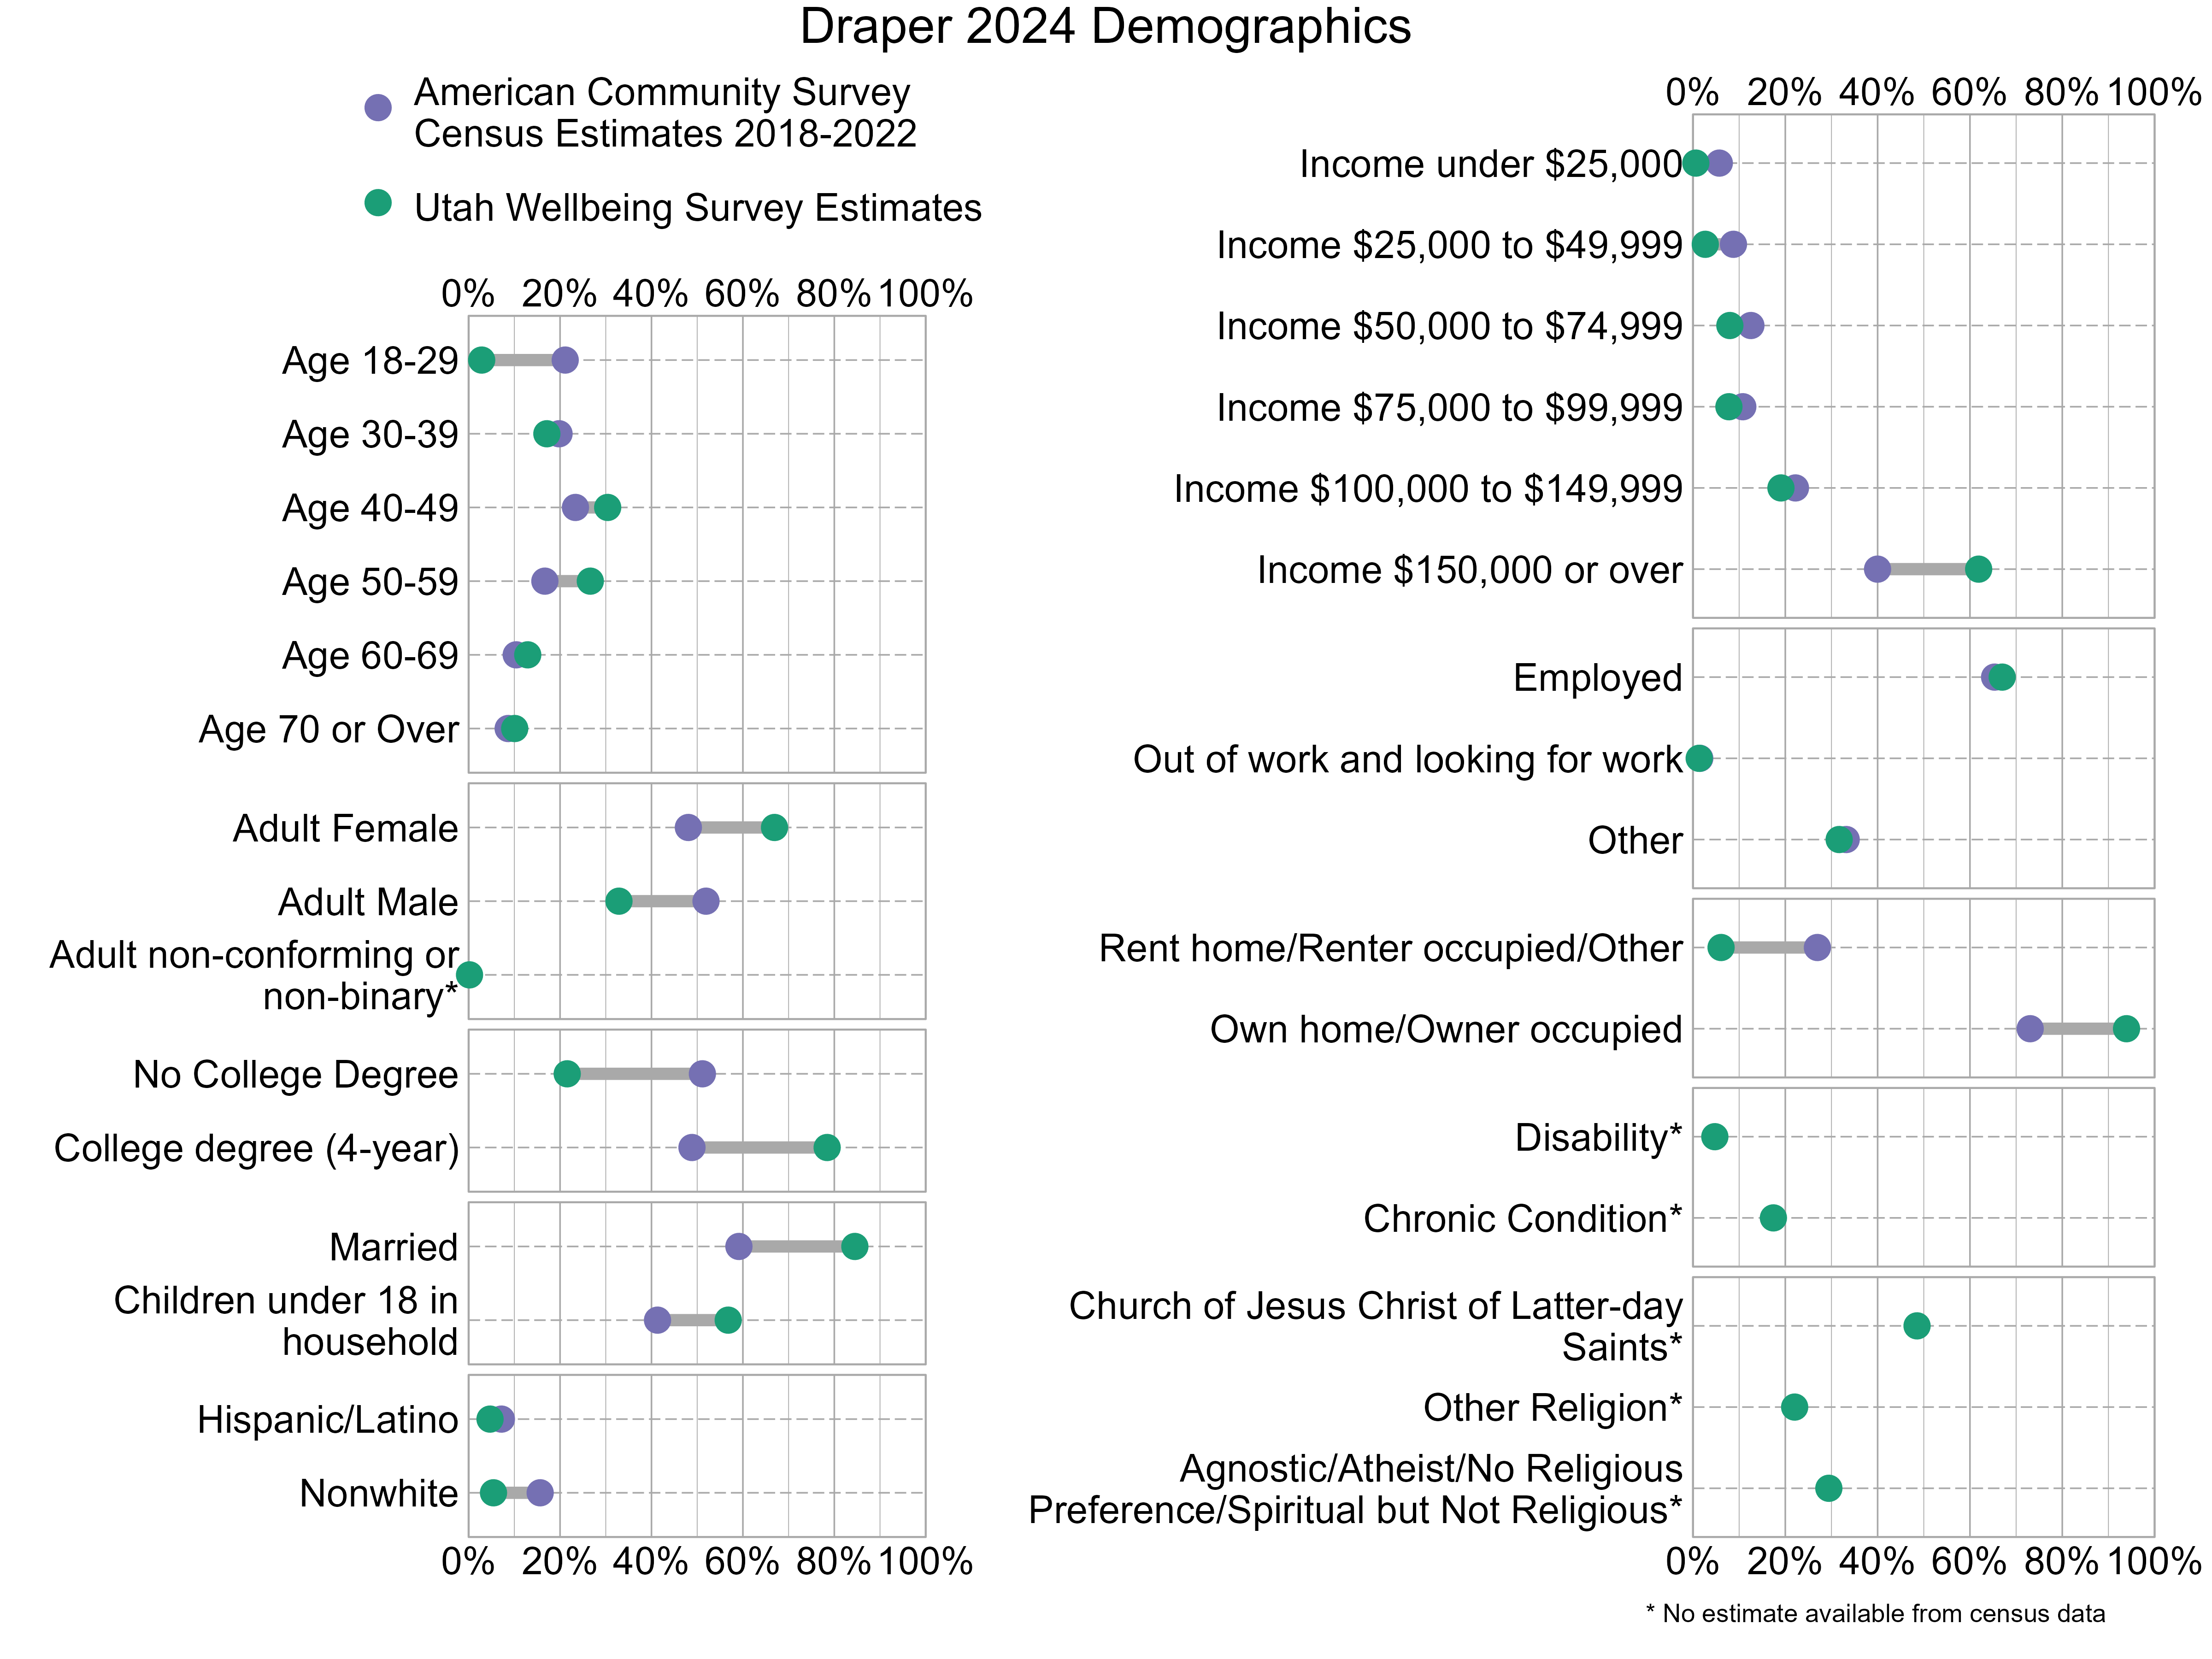
Demographic characteristics of the survey respondents were compared below with U.S. Census information from the 2018-2022 American Community Survey. In the graph below, gray bars indicate differences between the American Community Survey estimates and the Utah Wellbeing Project surveys. The wider the gray bars, the larger the differences. Also note that estimates for religious affiliation, adult non-conforming or non-binary gender, disability, and chronic conditions are unavailable from the census data. There can also be a variable margin of error in the American Community Survey estimates, and caution should be used when comparing estimates. Not all respondents provided demographic information. As the graph shows, 2024 survey respondents were not fully representative of Draper. People who are adult females, have at least a 4-year college degree, have an income $150,000 or over, are married, have children under 18 in their household, and own their homes were overrepresented while those who are age 18-29, are adult males, do not have a college degree, and are renters were underrepresented.
Overall Personal Wellbeing and Overall Wellbeing in Draper
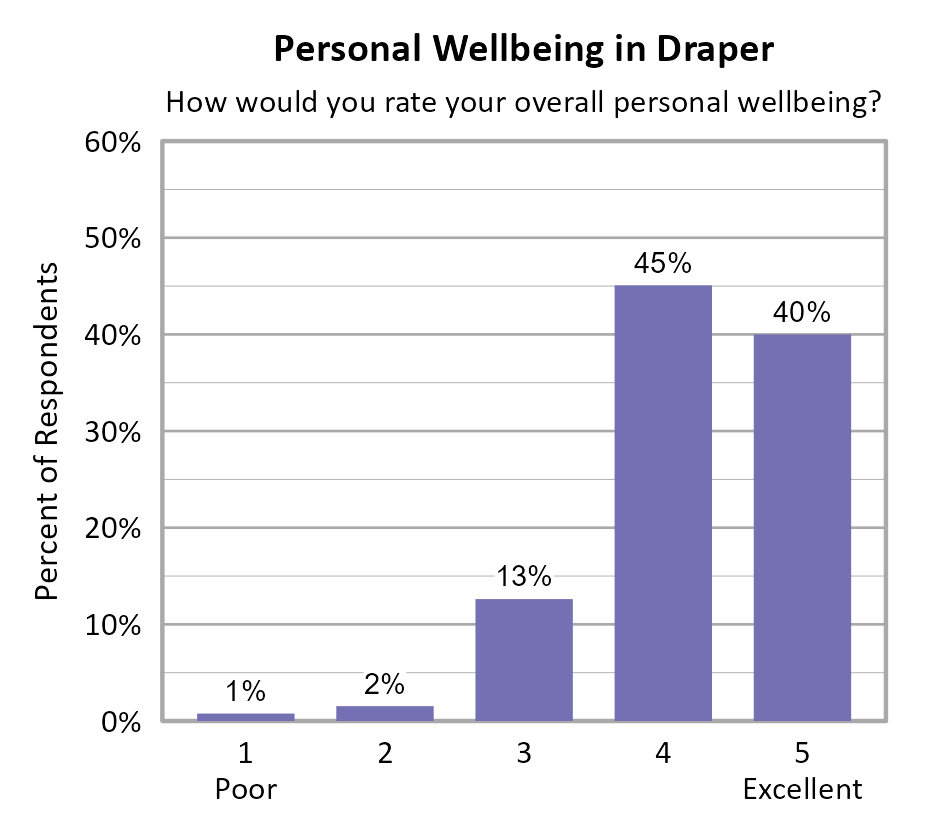
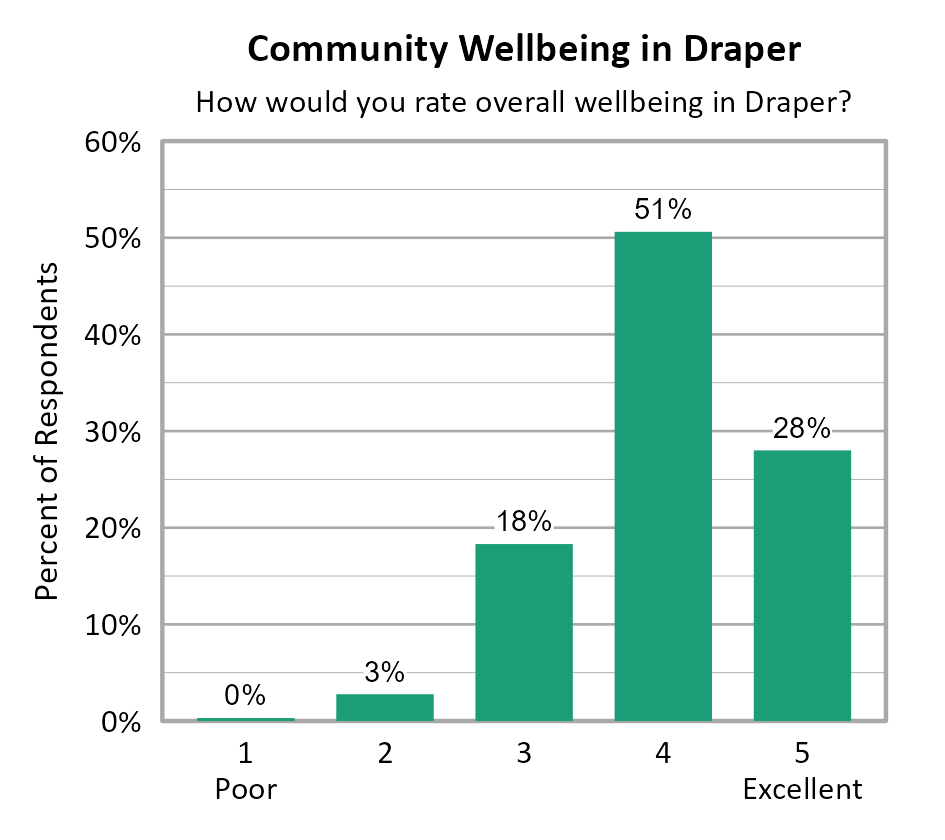
Survey participants were asked about their overall personal wellbeing and overall community wellbeing in Draper. These wellbeing indicators were both measured on a 5-point scale from poor (1) to excellent (5). The average personal wellbeing score in Draper was 4.22 with 85% of respondents indicating their wellbeing at a 4 or 5 on the 5-point scale. The average score for community wellbeing in Draper was 4.03 with 79% of respondents indicating community wellbeing at a 4 or 5 on the 5-point scale.
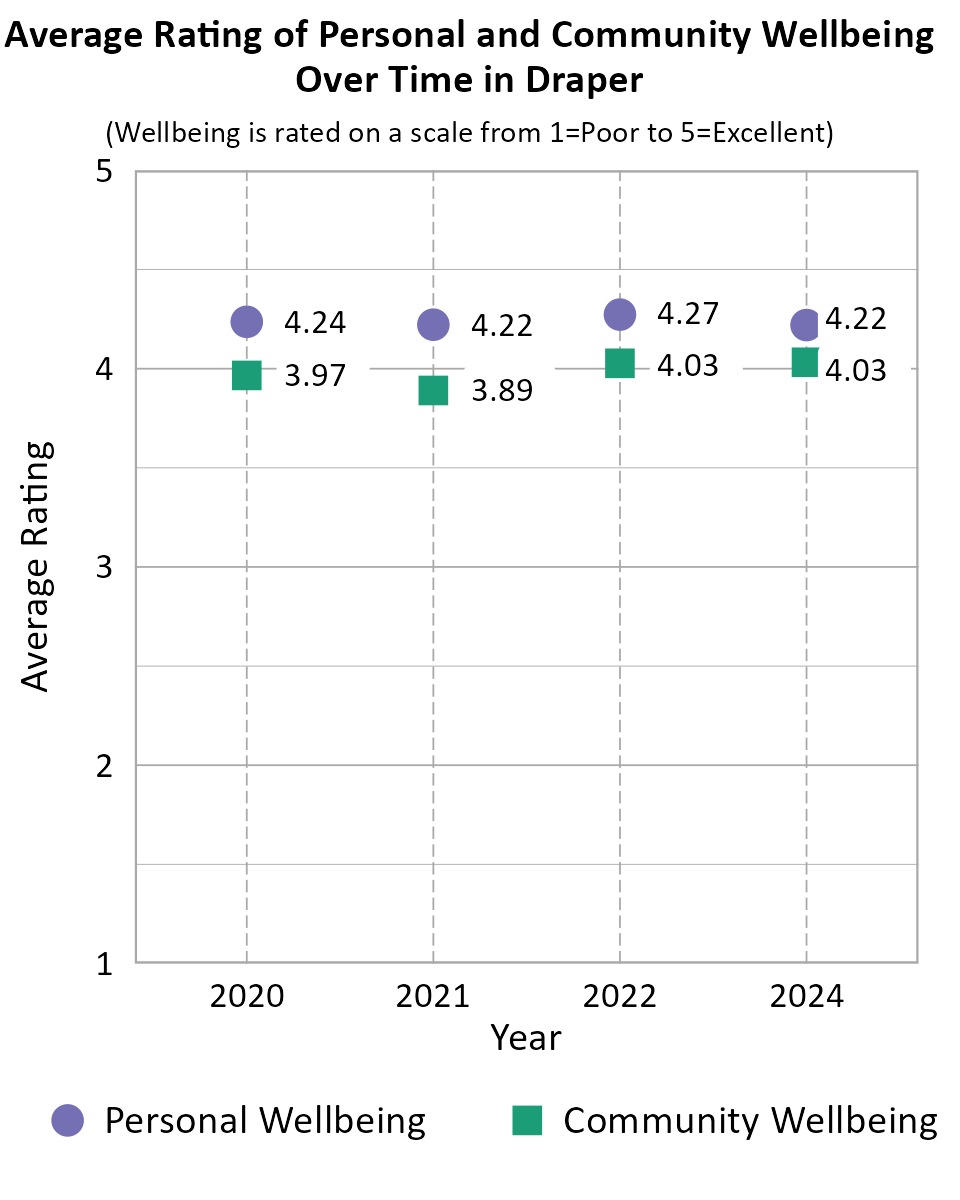
When comparing survey data from Draper over the years as shown in the information below, we can see that the average personal wellbeing score has remained fairly consistent across the survey years. The average community wellbeing score declined between 2020 and 2021, and improved between 2021 and 2022, and remained nearly the same between 2022 and 2024. Note that the number of respondents differed between years, there is no tracking of individuals from one year to the next, and the low end of the scale was "Poor" in 2024 but "Very Poor" in prior years which may account for differences in scores over time.
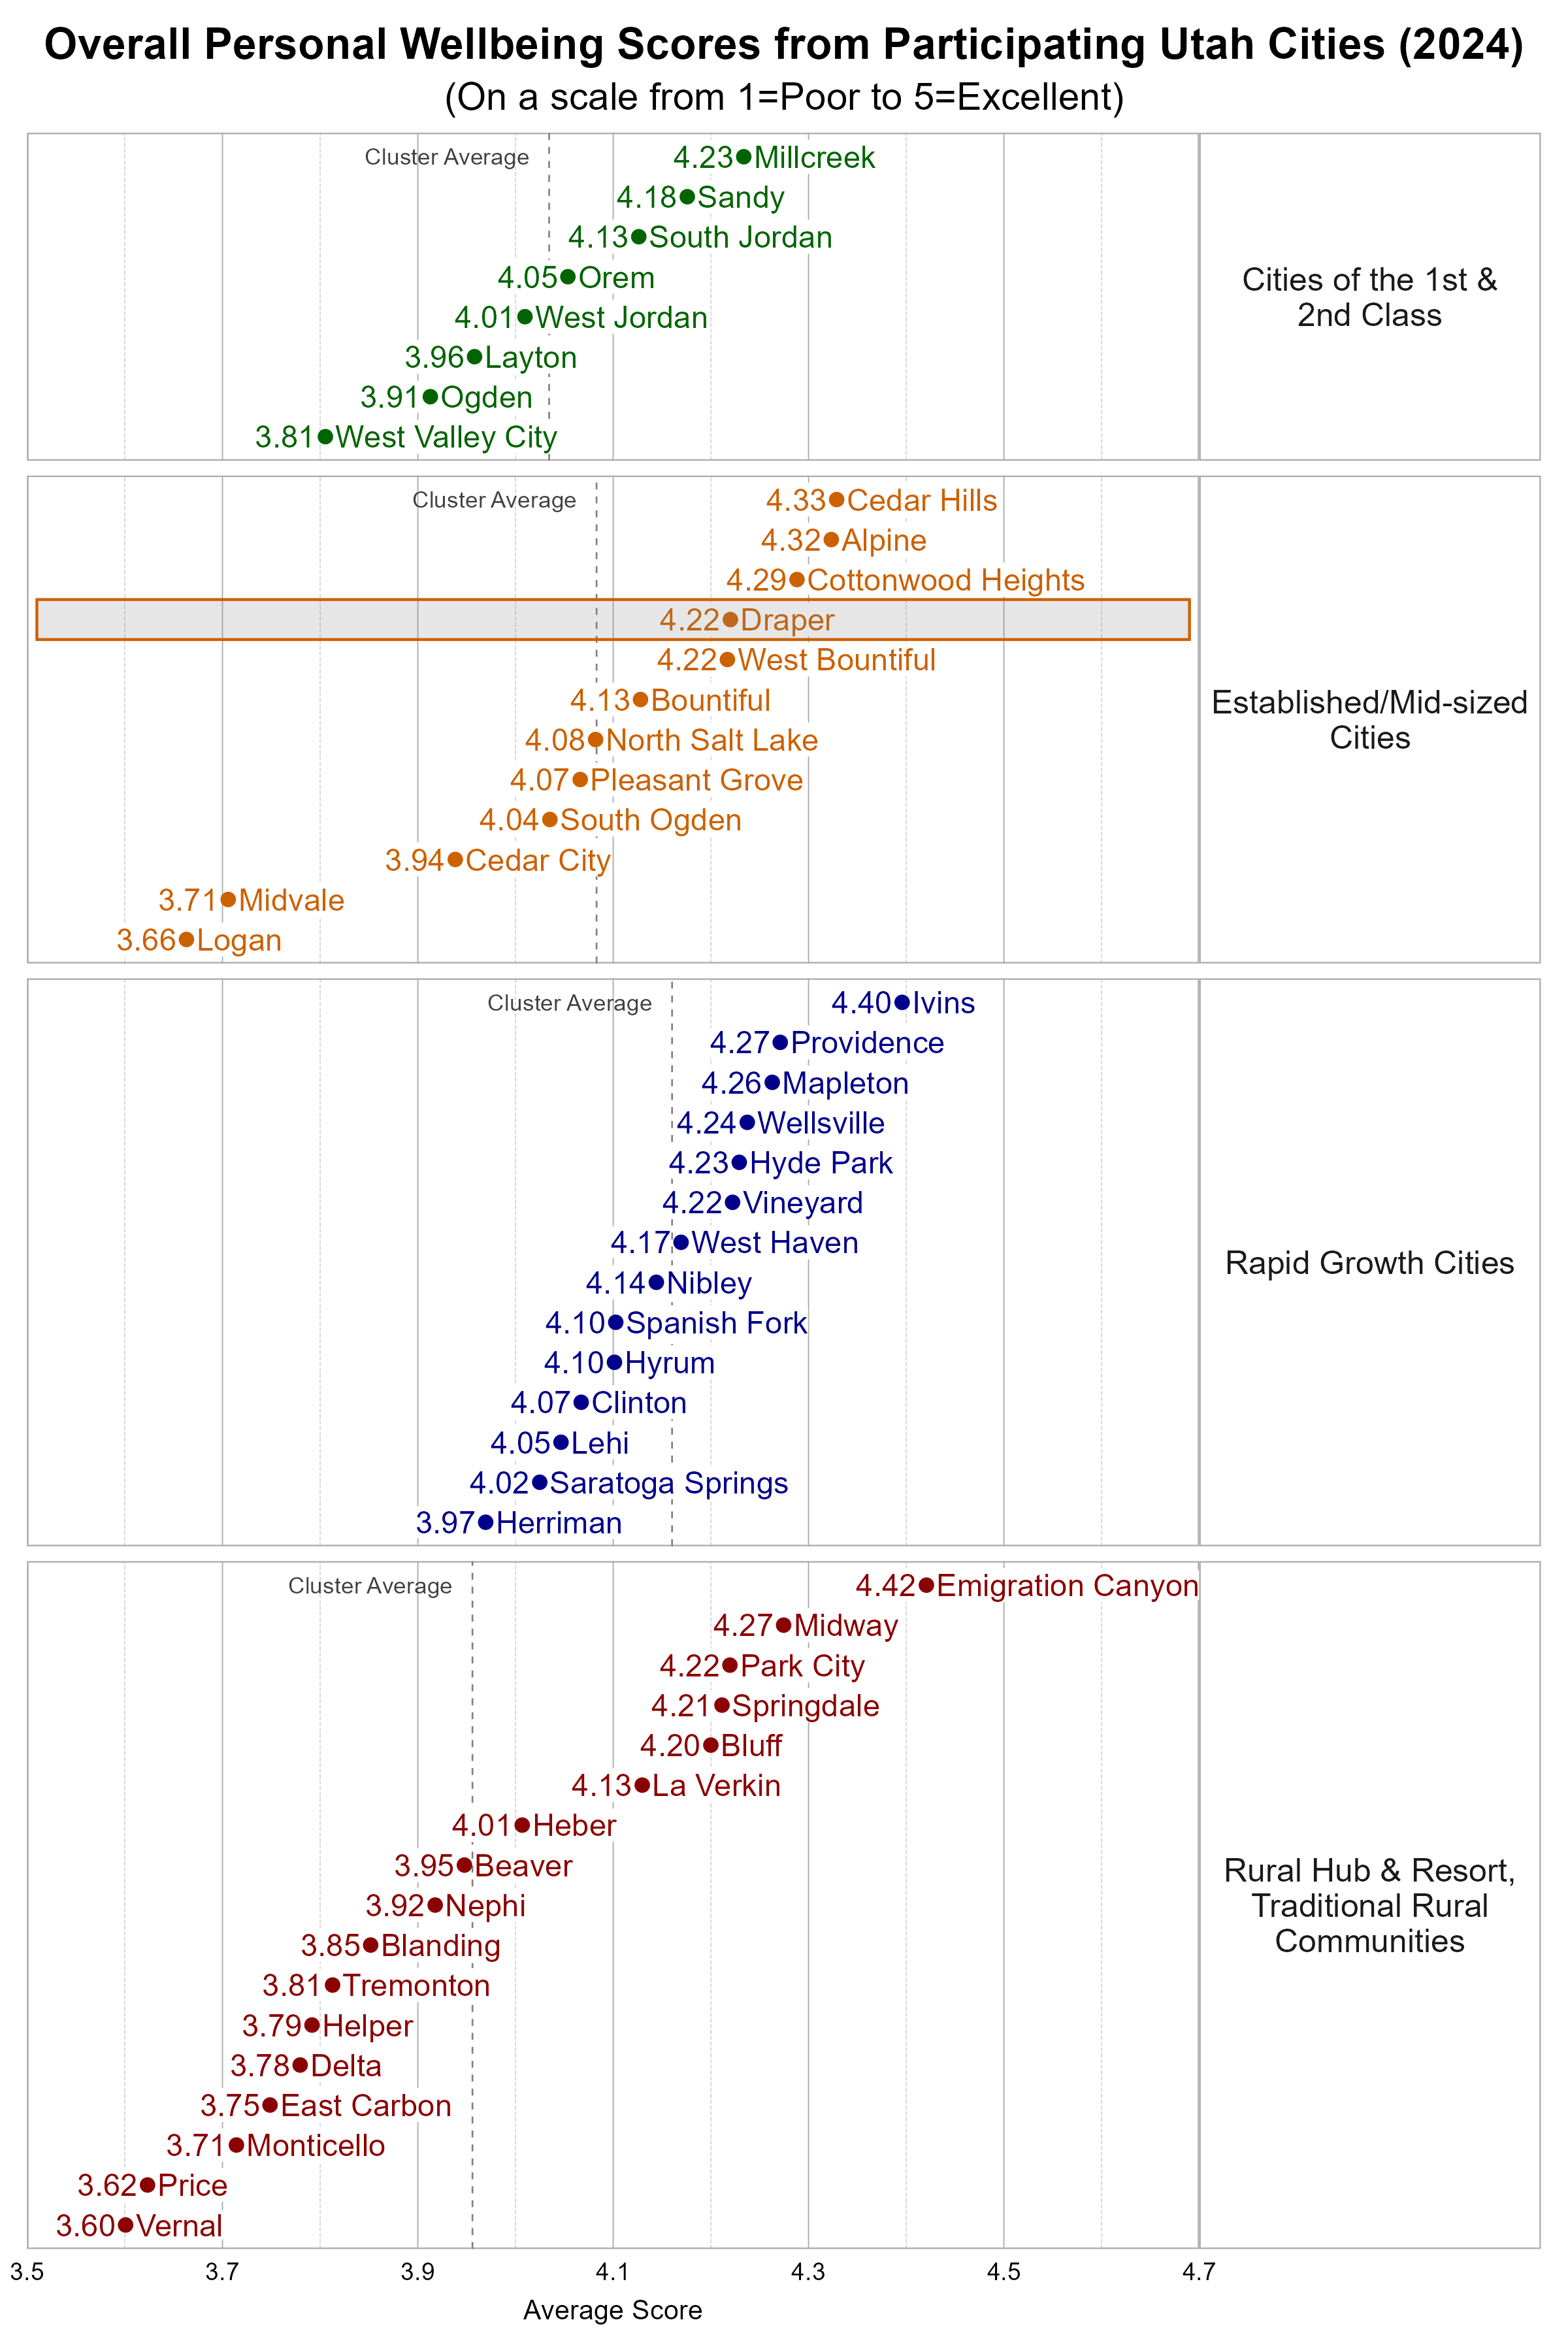
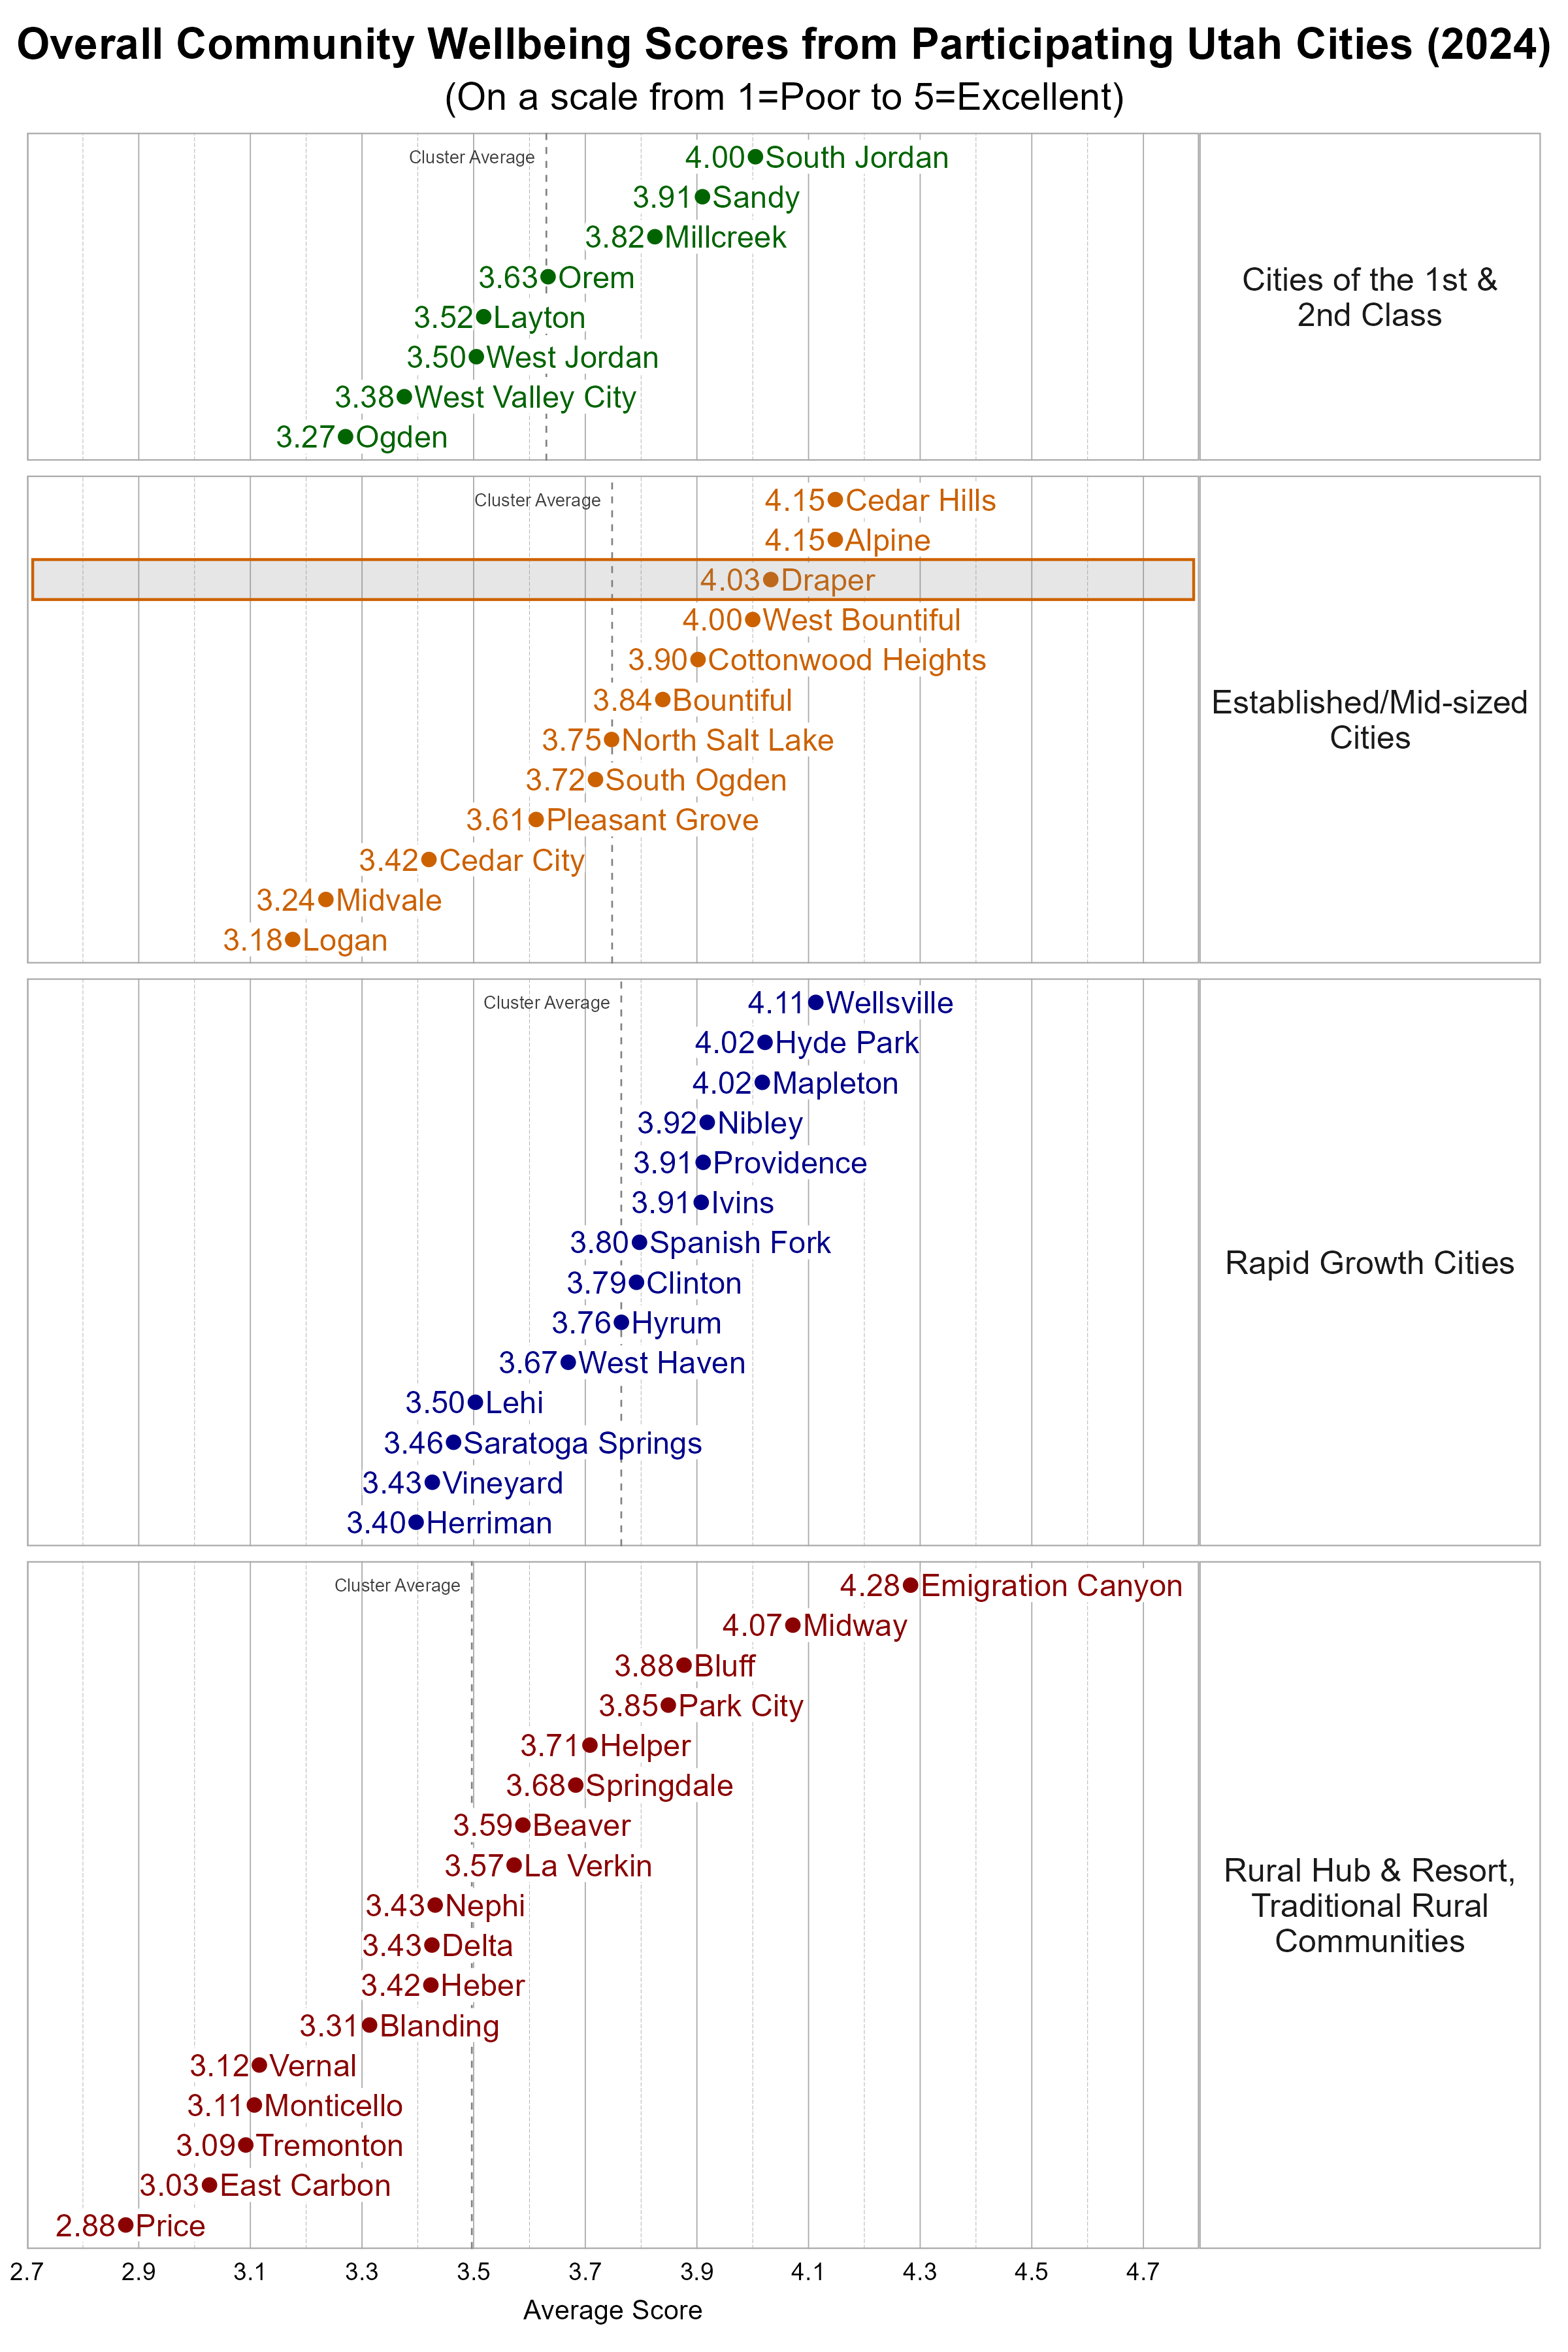
Comparing Wellbeing Across Utah Cities
The Utah League of Cities and Towns clusters cities and towns into five different categories based on size and growth rates. We utilize these clusters in our analysis. Draper is classified as an Established/Mid-sized City. Some cities may fit within more than one cluster.
Within the more Urban city cluster, Draper was above the average overall personal wellbeing score and well above the average overall community wellbeing score.
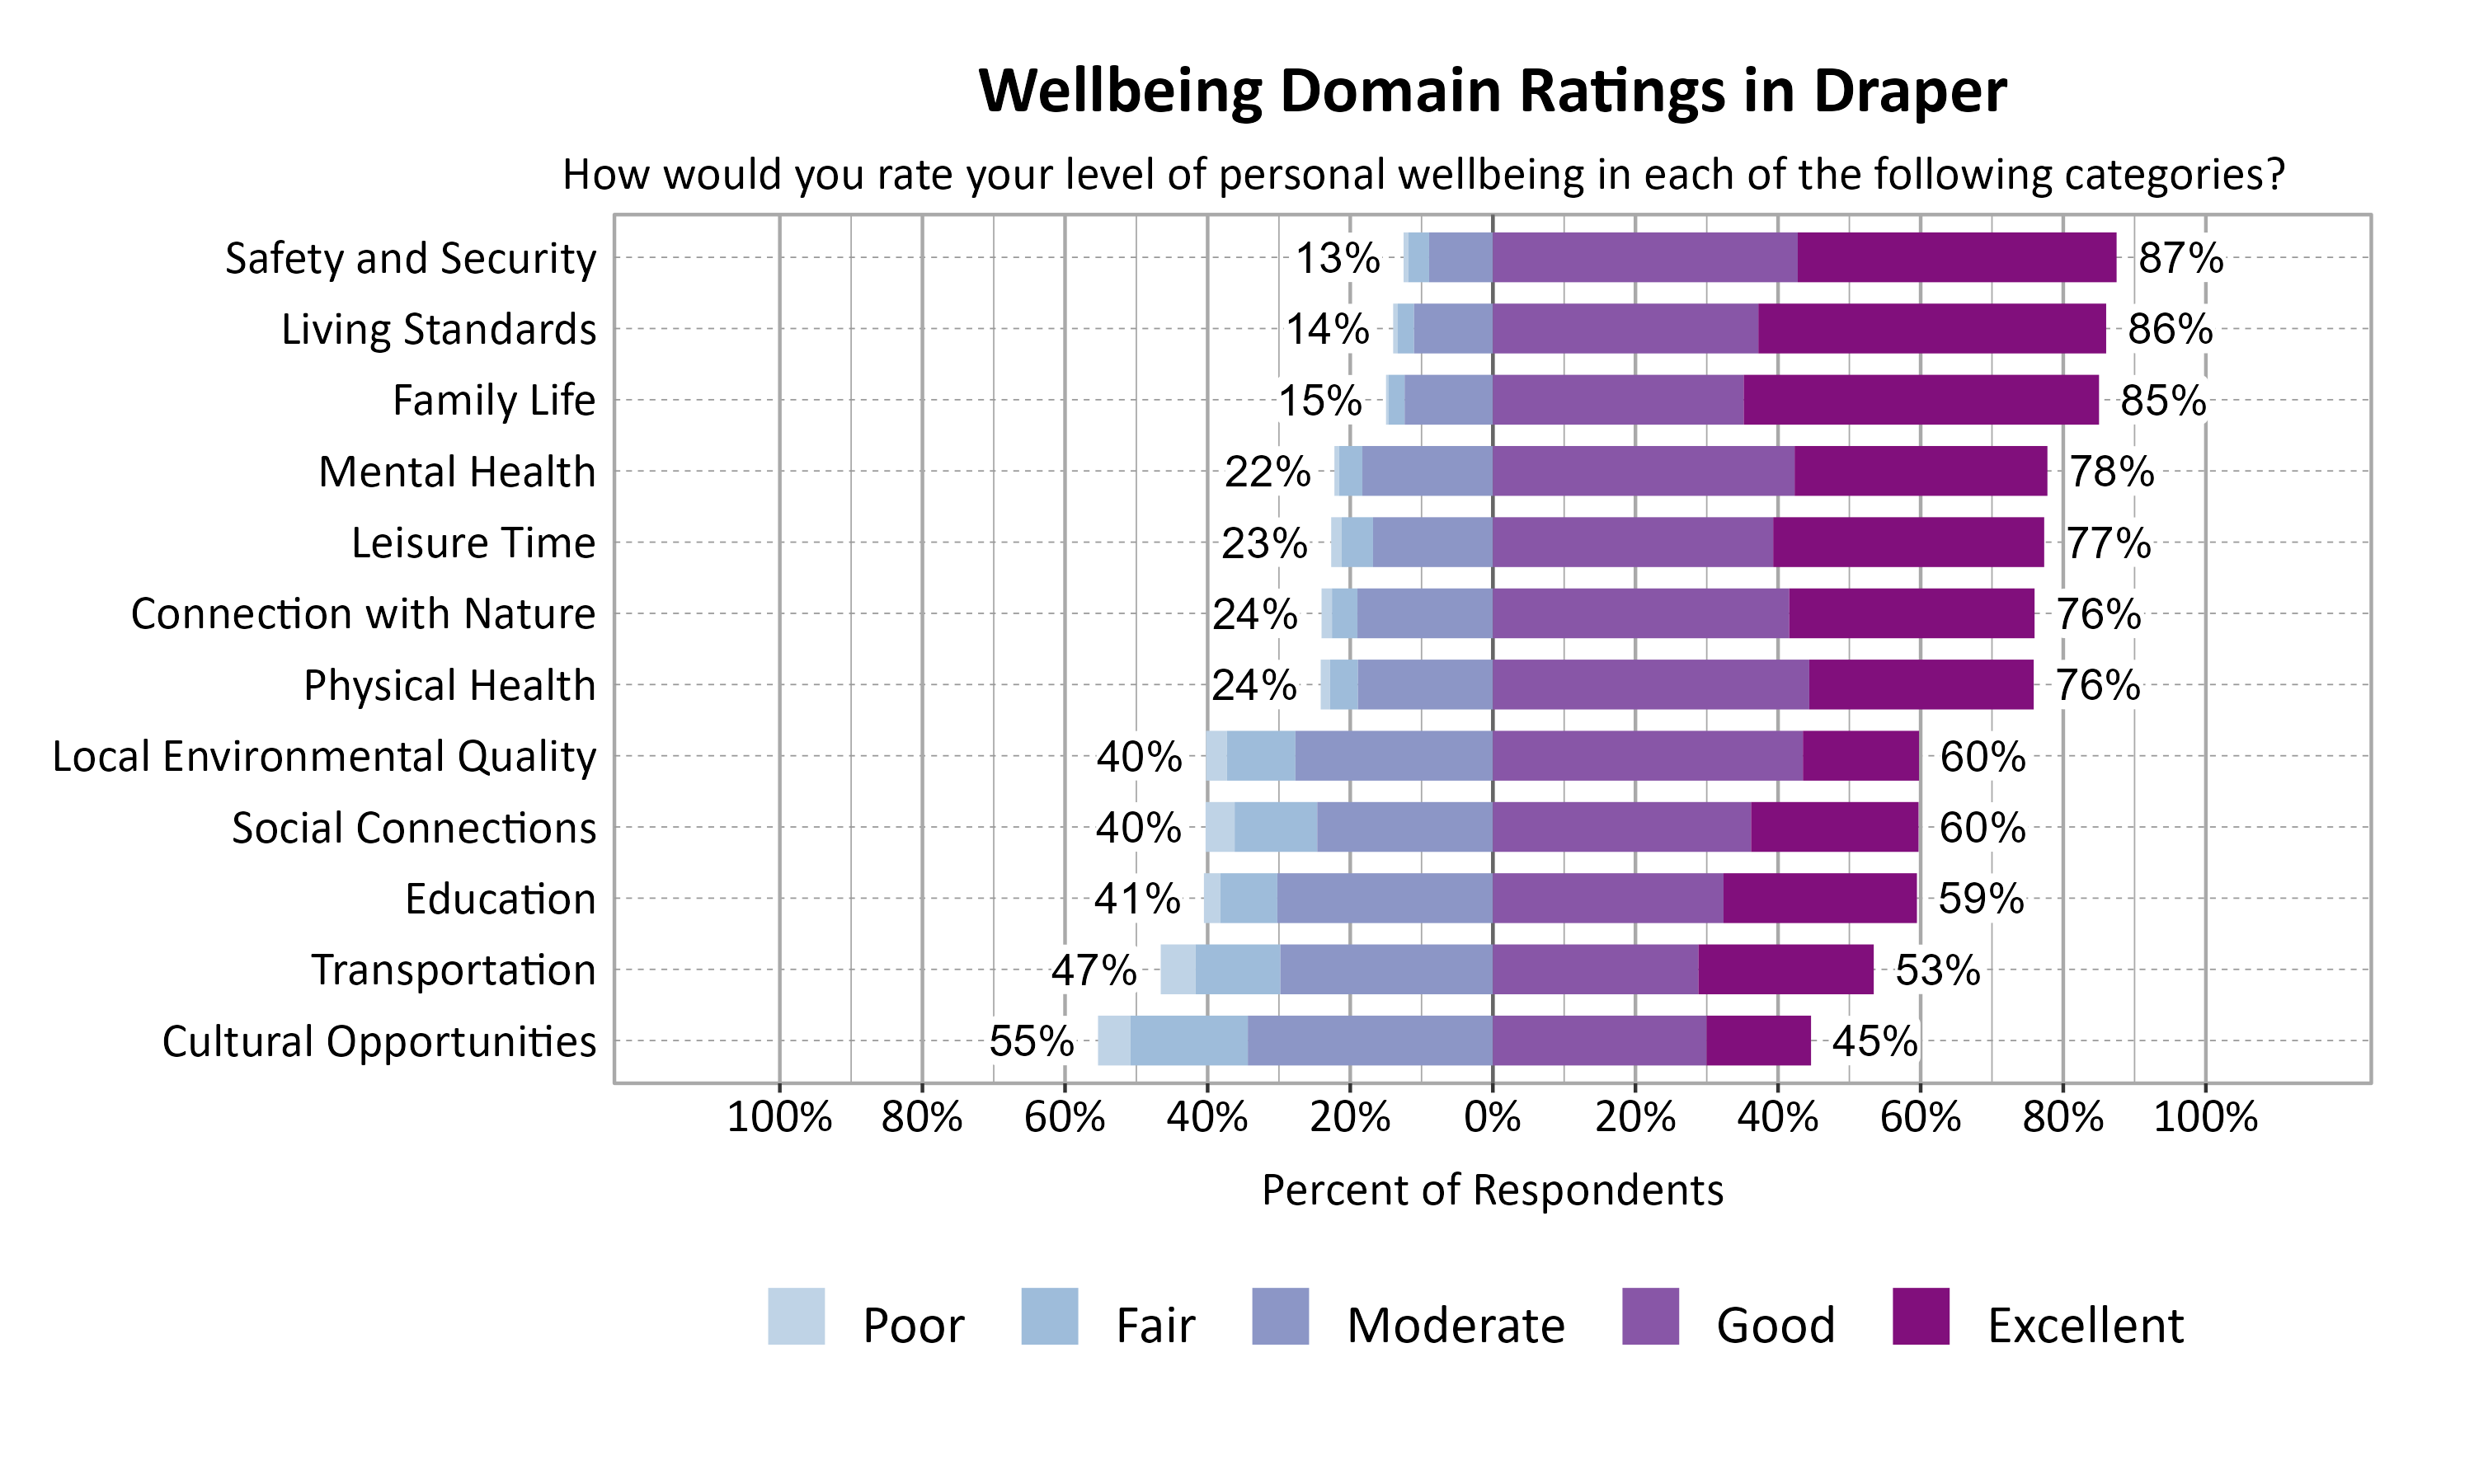
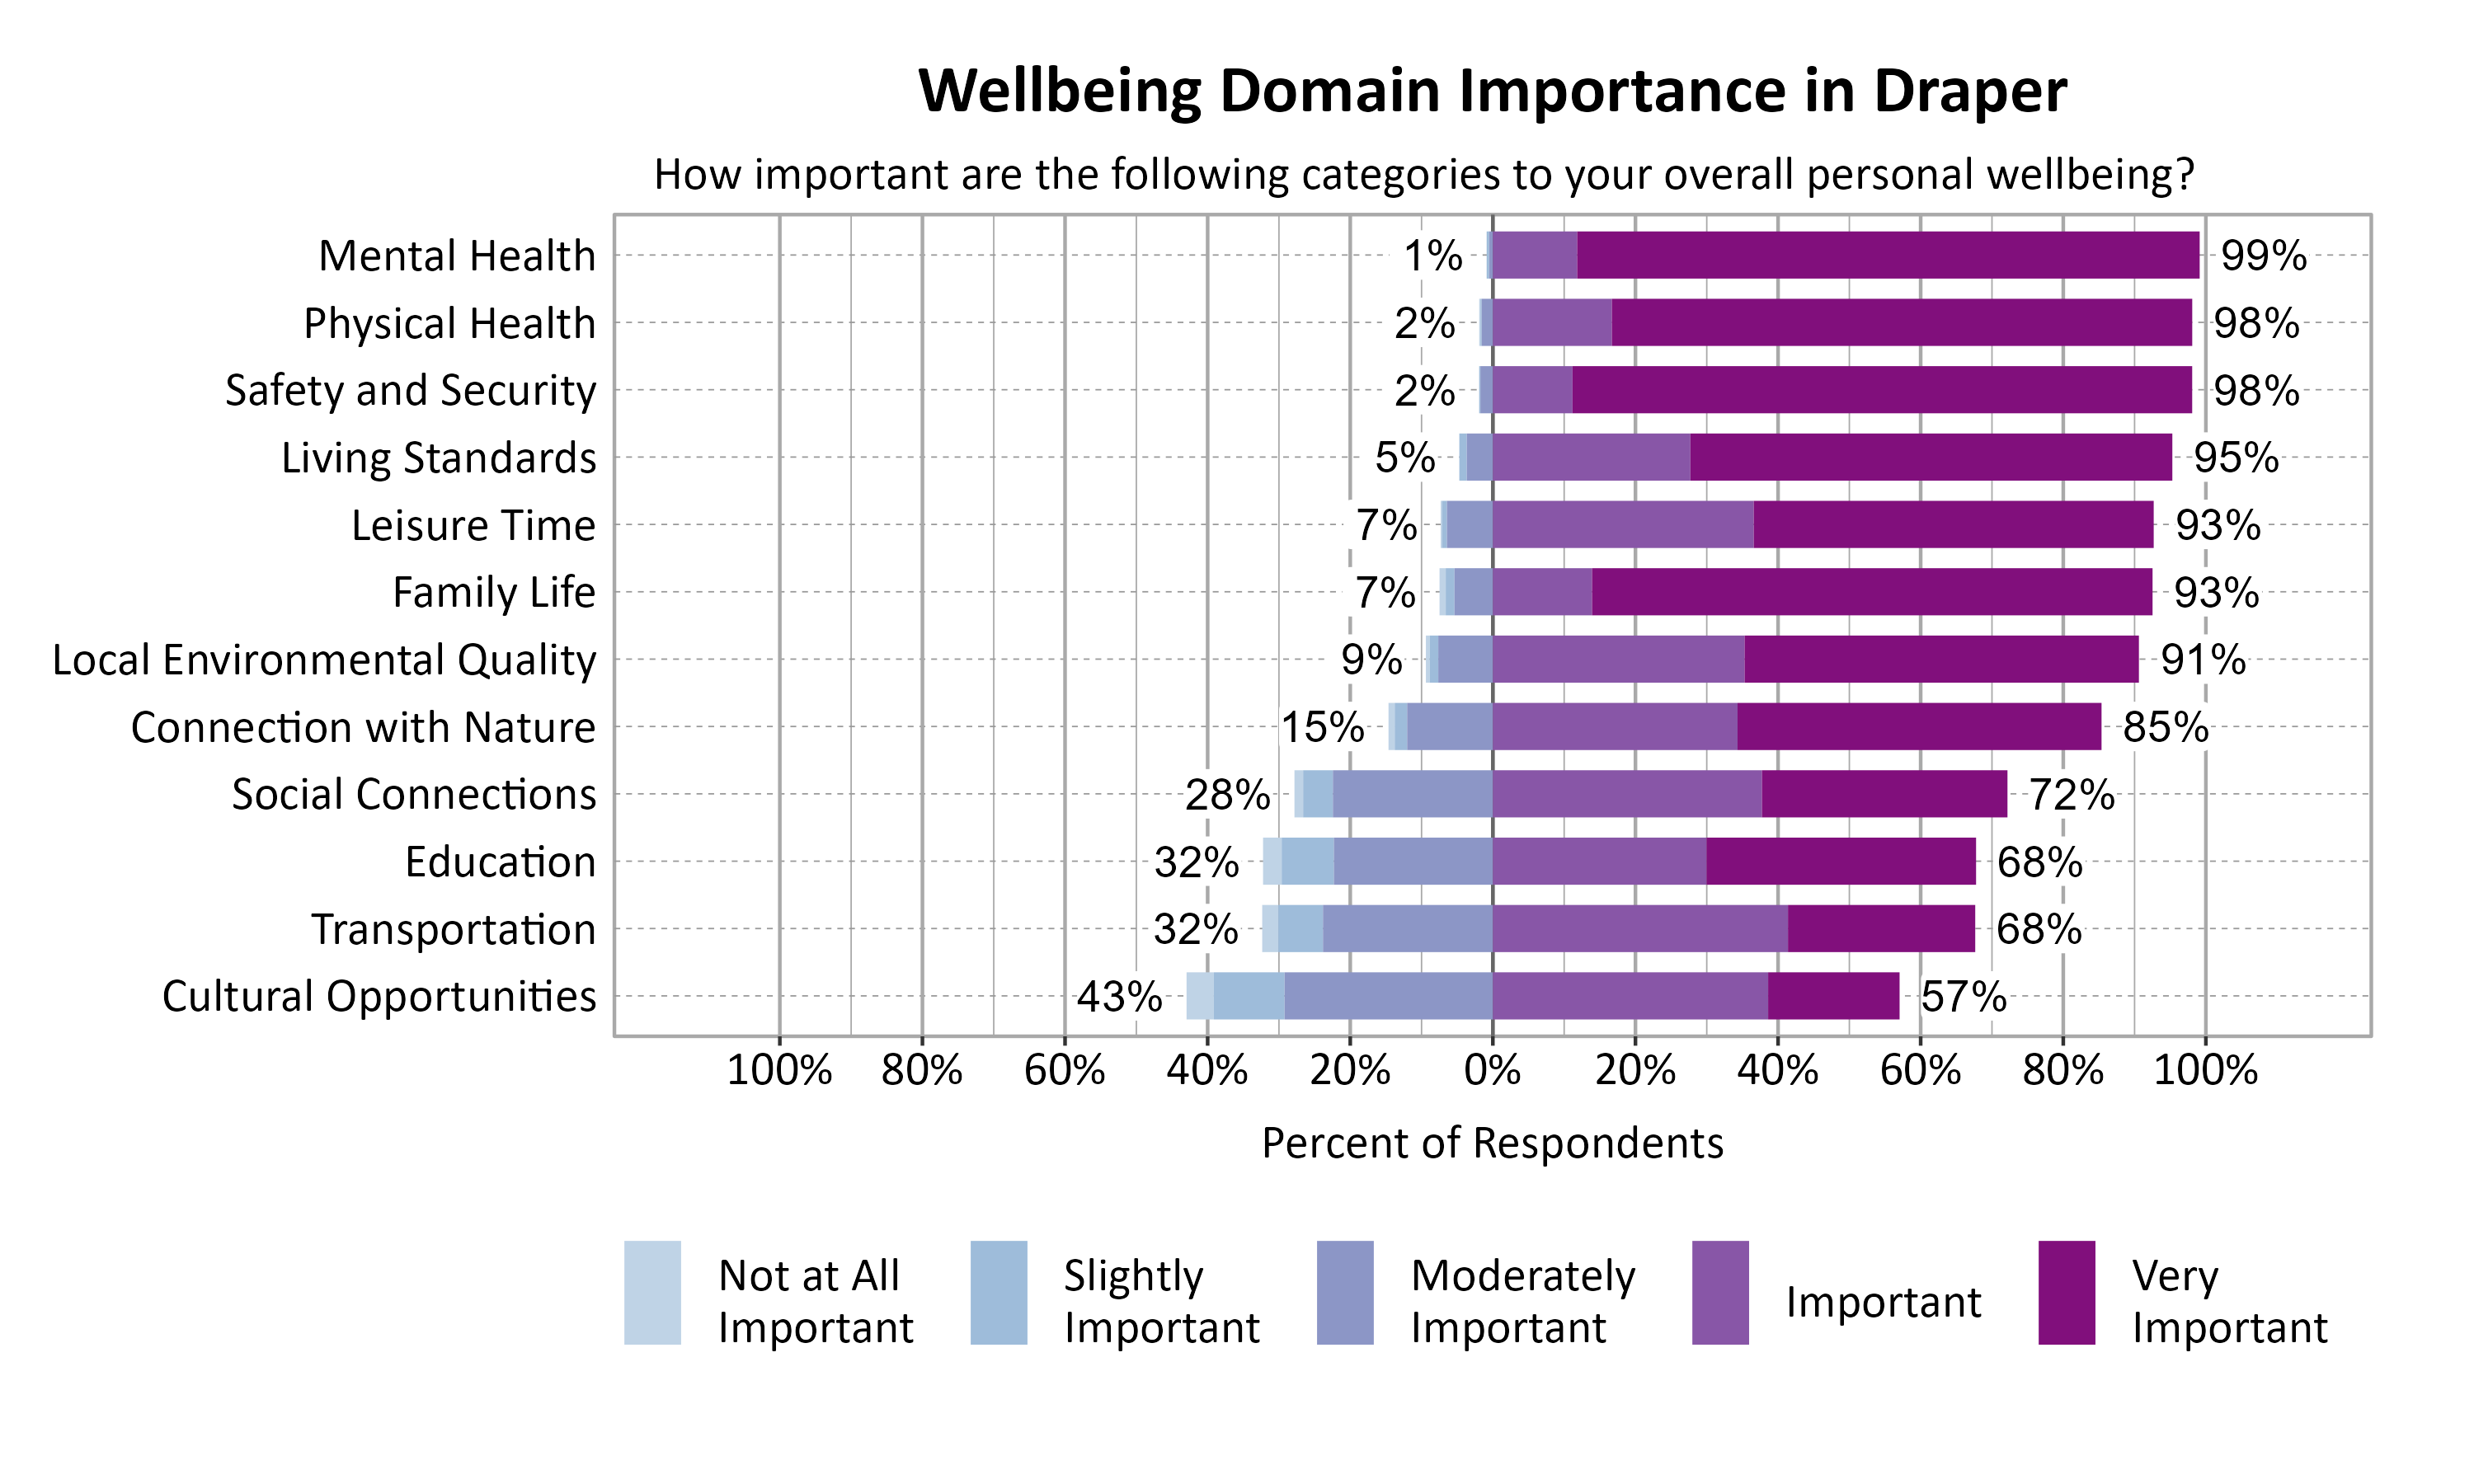
Wellbeing Domains in Draper
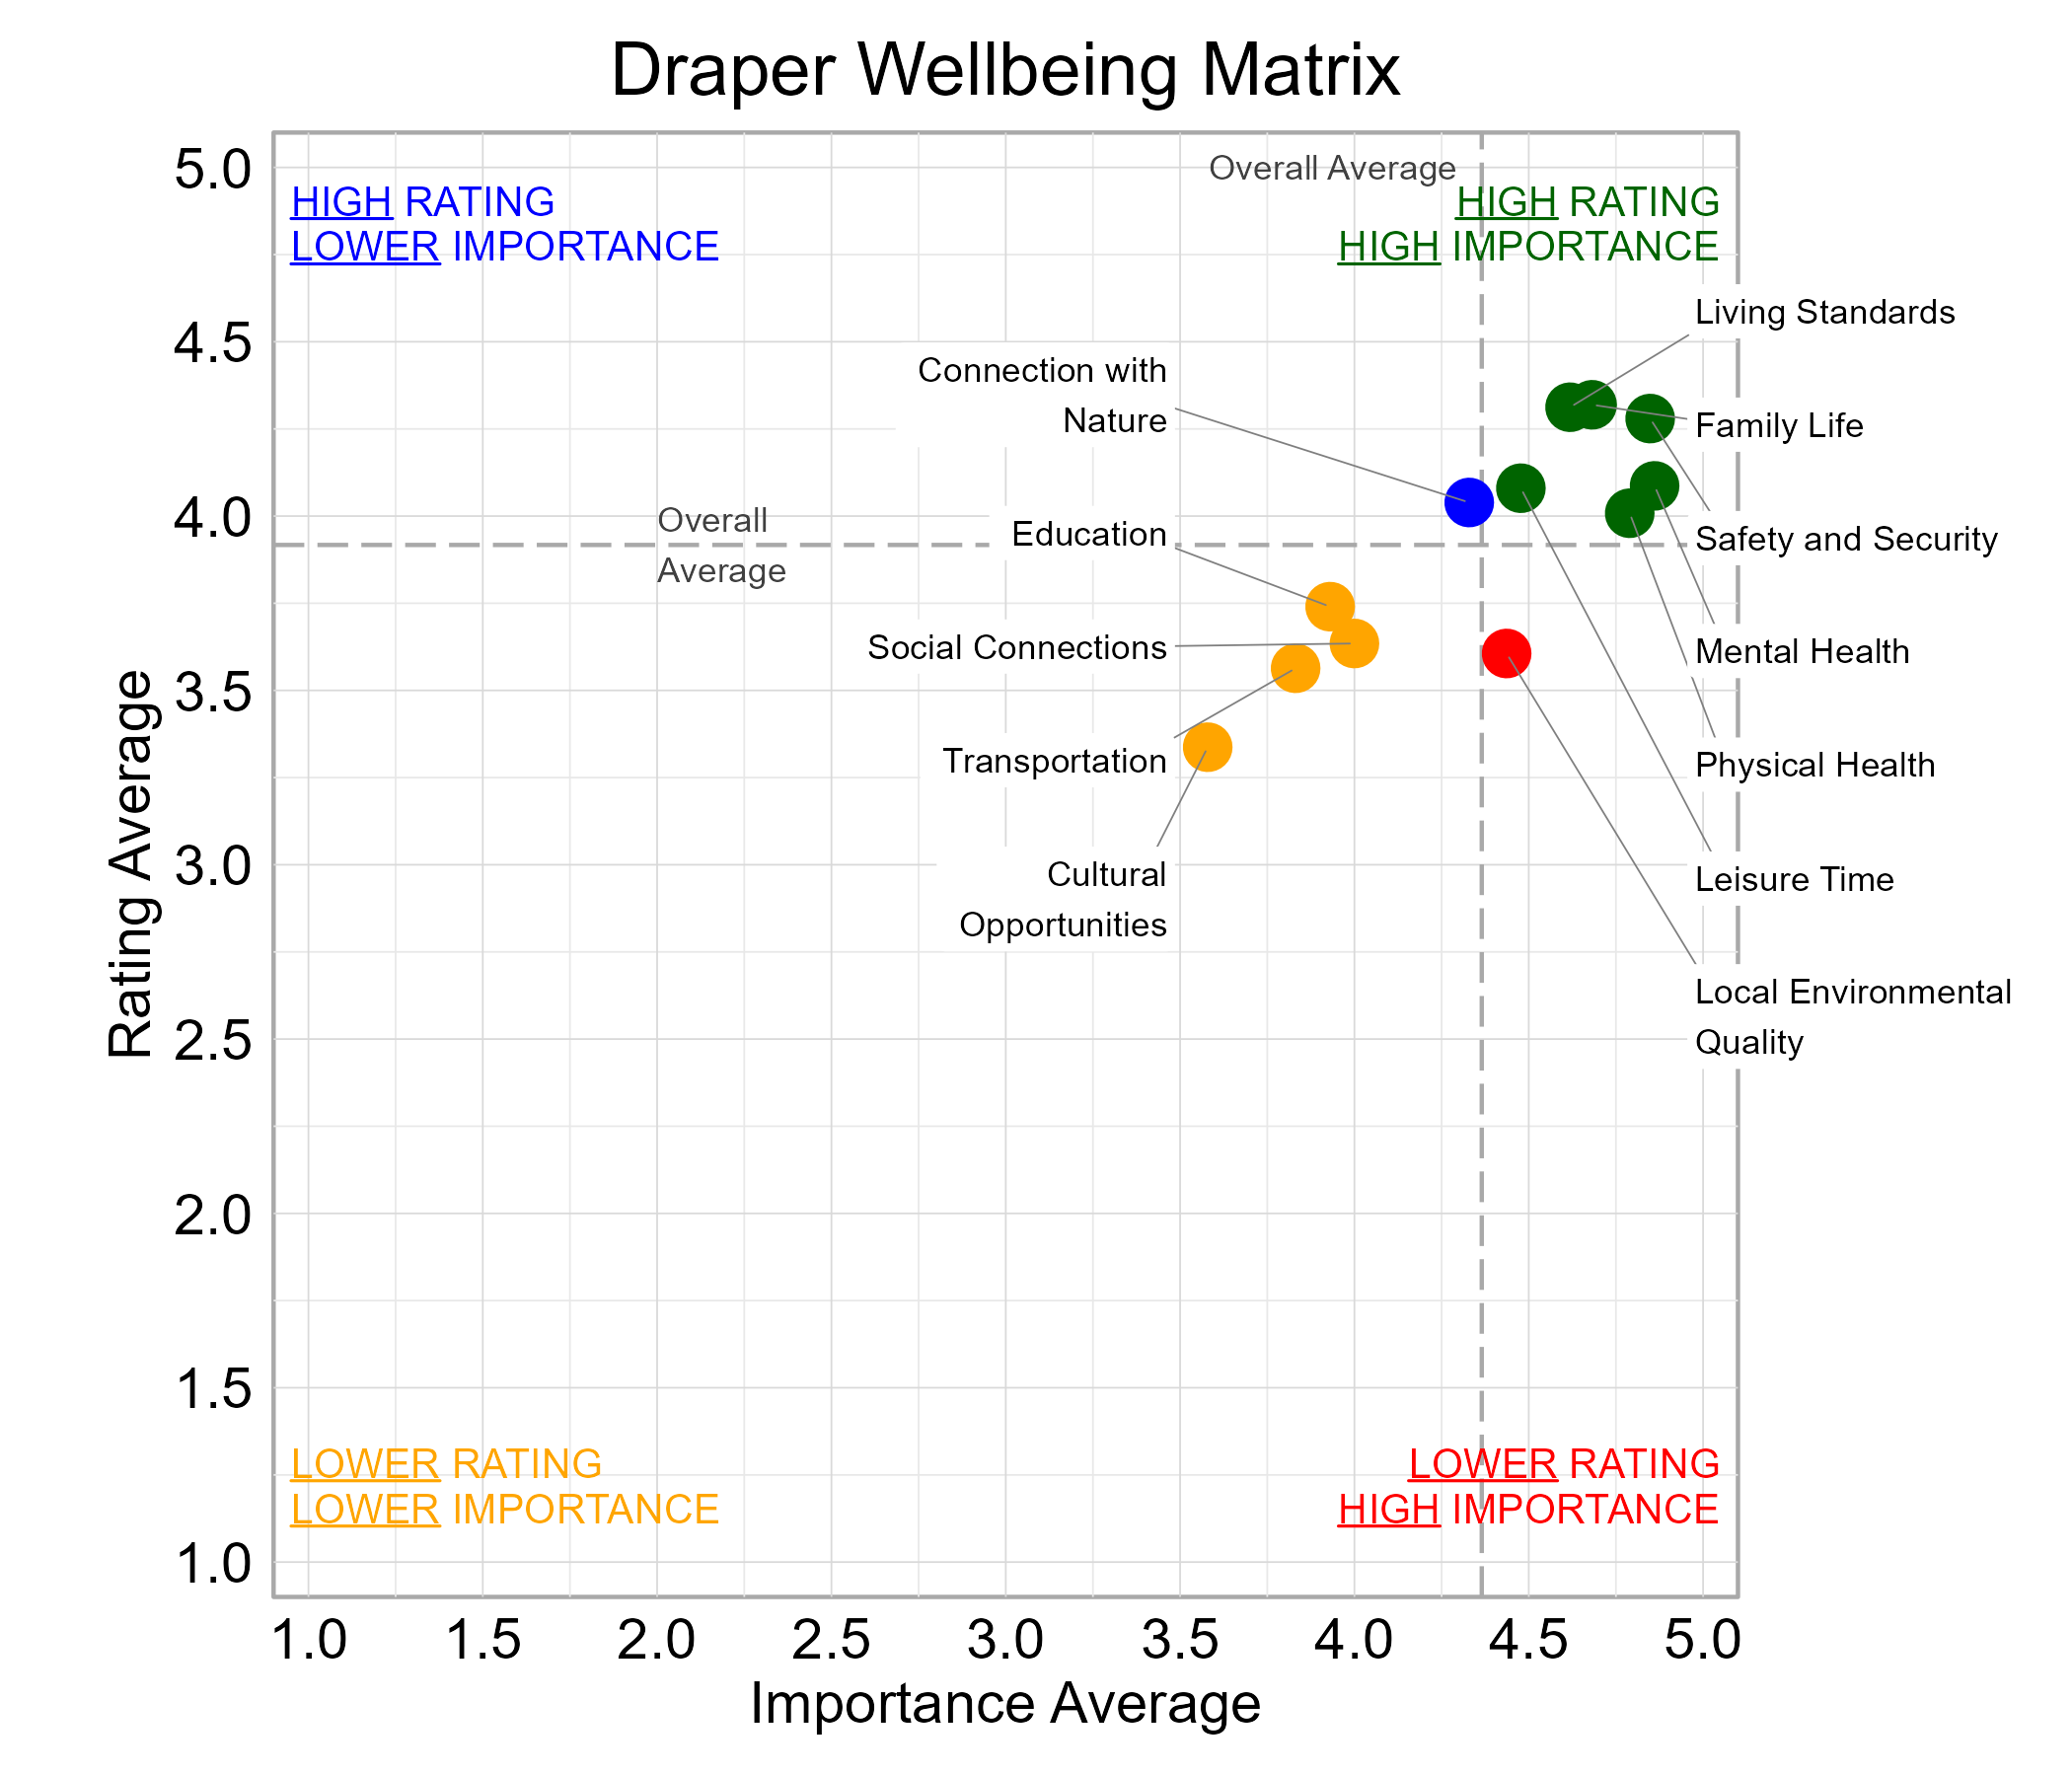
According to national and international entities that track wellbeing, there are a number of common dimensions or domains of wellbeing. Survey respondents rated twelve domains on a 5-point scale from poor to excellent. They were also asked to indicate the importance of each domain to their overall personal wellbeing on a 5-point scale from not at all important to very important. The highest rated wellbeing domains for respondents in Draper were Safety and Security (87%), Living Standards (86%), and Family Life (85%). The most important wellbeing domains were Mental Health (99%), Physical Health (98%), and Safety and Security (98%).
Wellbeing Matrix for Draper
The graph below illustrates the relationship between the average rating and the average importance of wellbeing domains for survey respondents from Draper. Family Life, Leisure Time, Living Standards, Mental Health, Physical Health, and Safety and Security were highly important and rated above average among the domains. Local Environmental Quality fell in the “red zone” of higher importance and lower ratings.
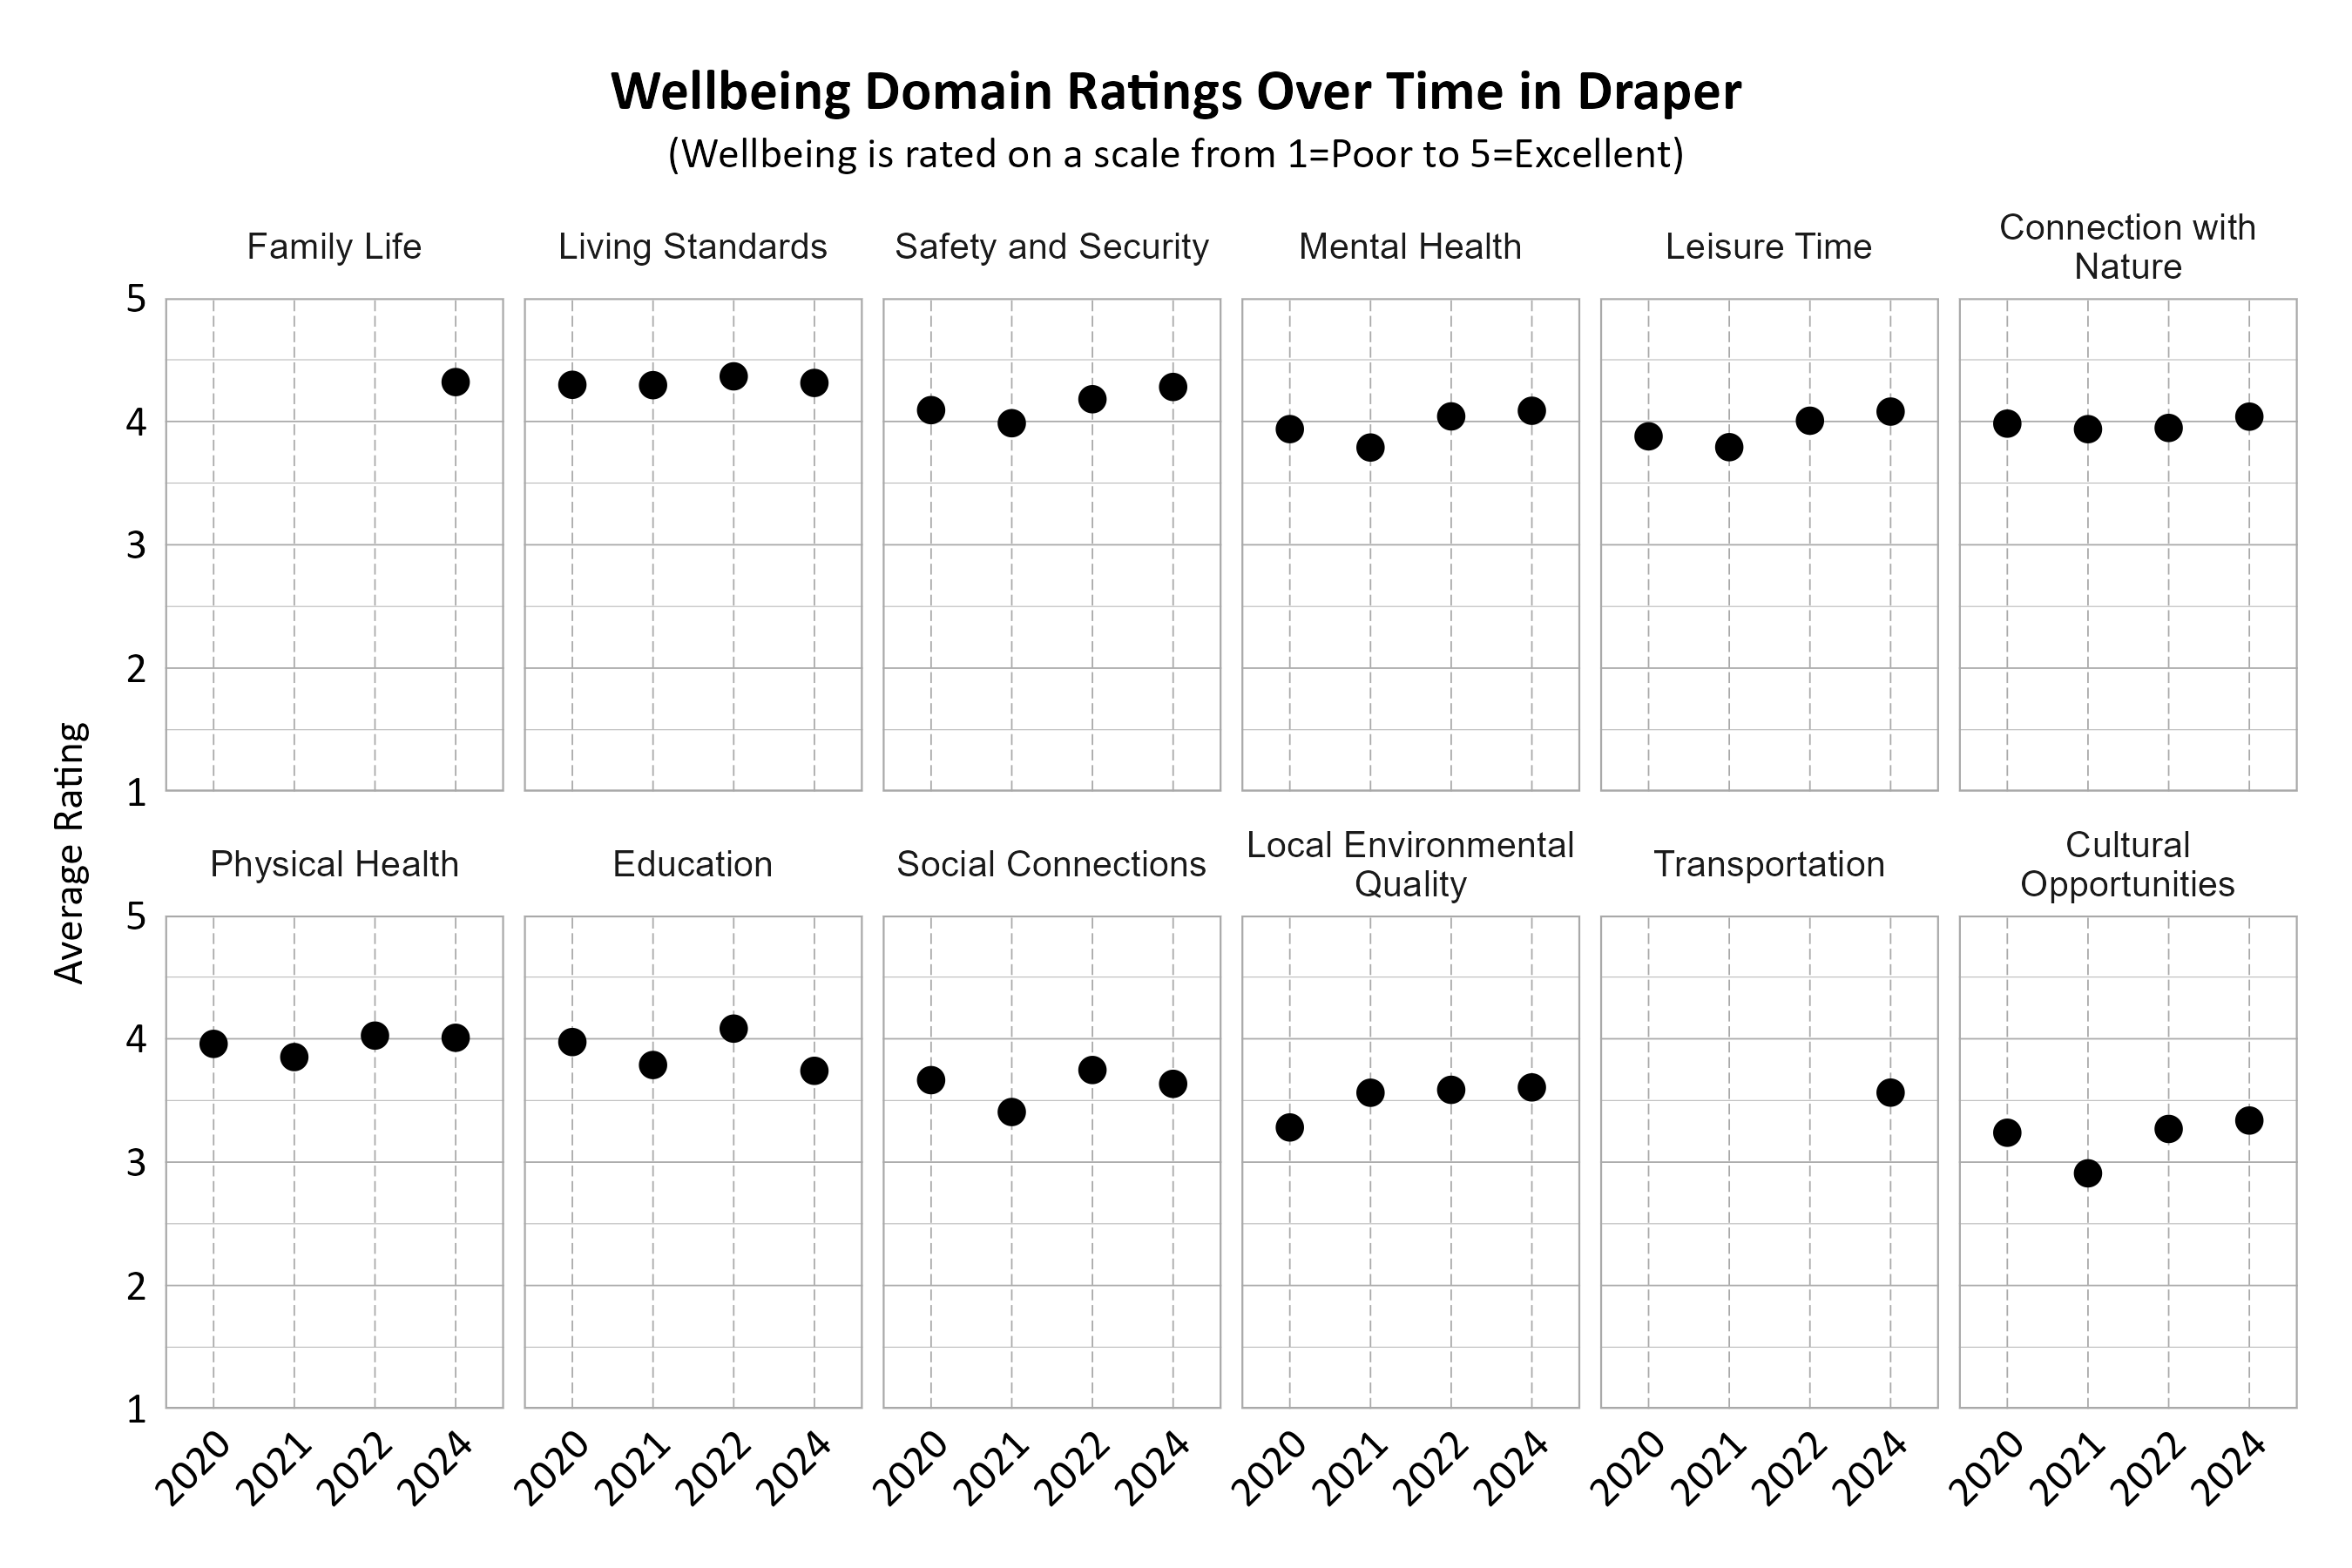
Wellbeing Domains Over Time in Draper
The graphs below show how the domains were rated over the years by Draper residents. The number of respondents changed over time. Note that the two domains Family Life and Transportation were new categories in the 2024 survey and were not measured in previous years. Most domains increased in ratings from 2022 to 2024, except for Education which noticeably declined. Living Standards and Safety and Security were consistently highly rated over the survey years.
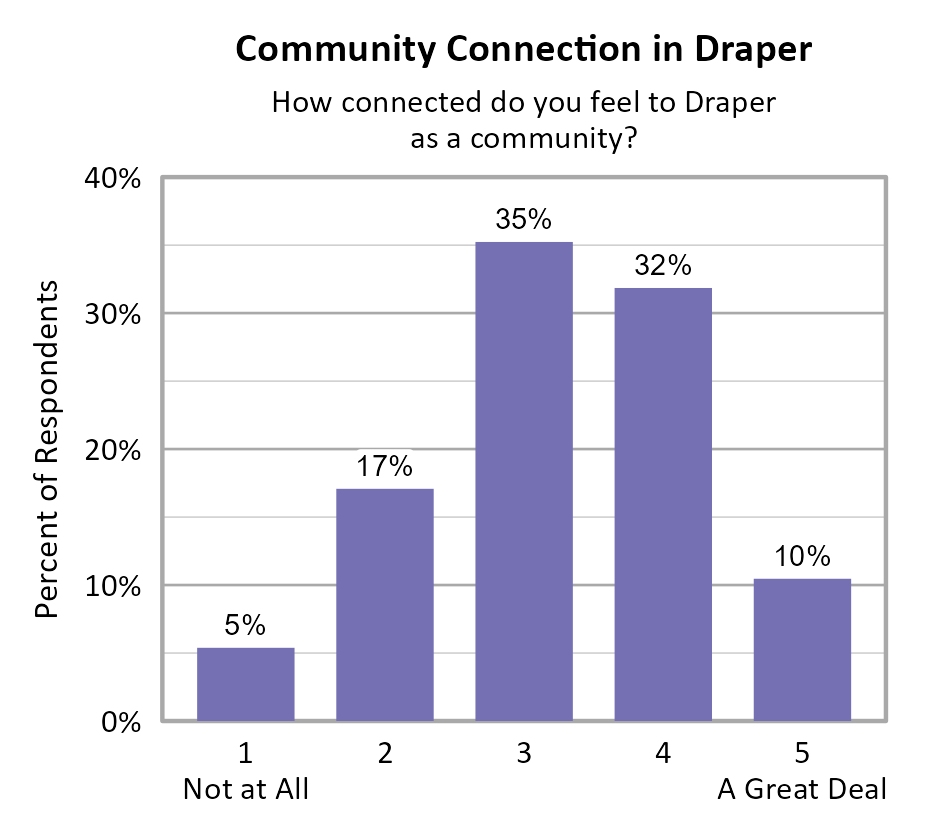
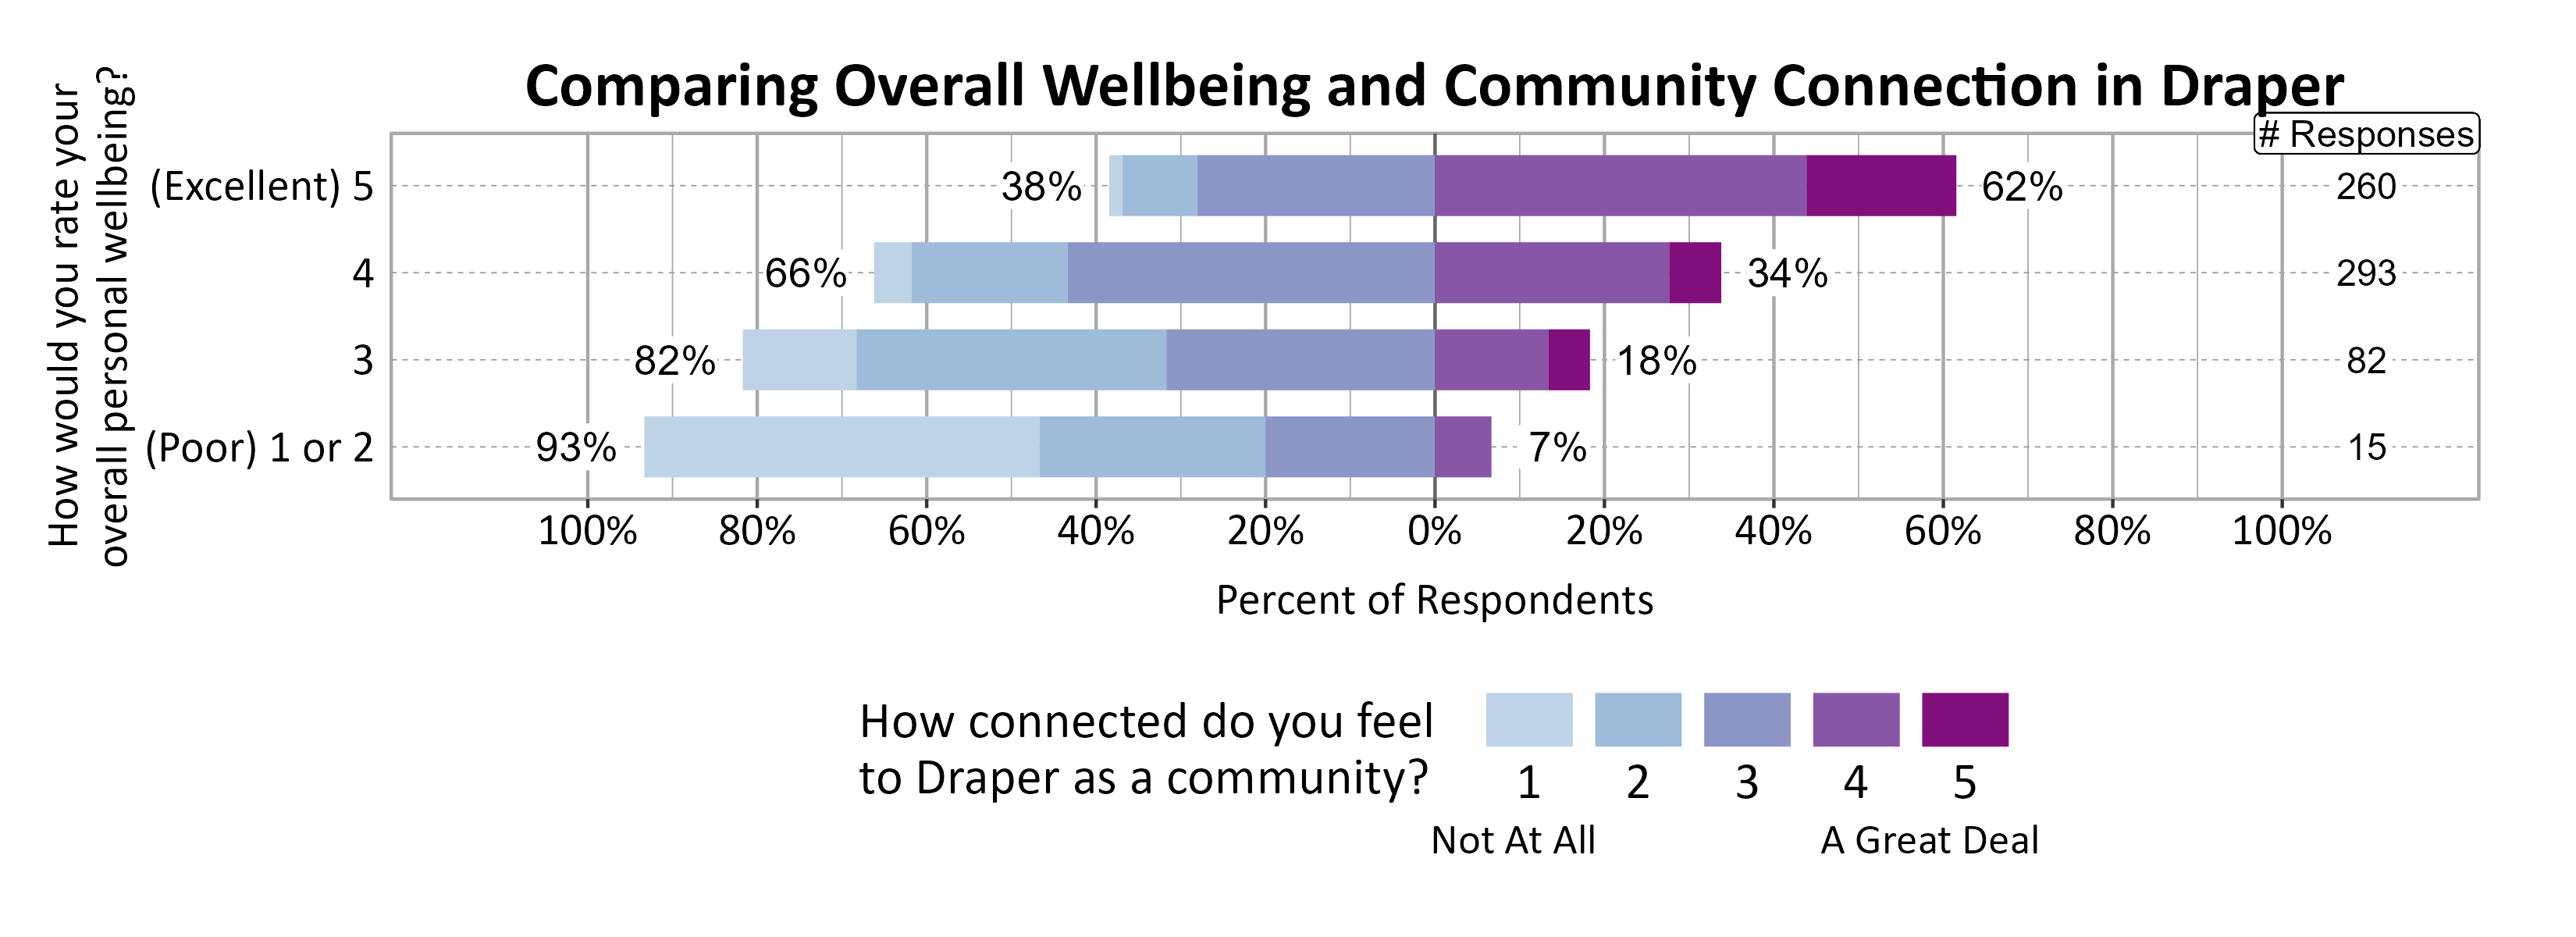
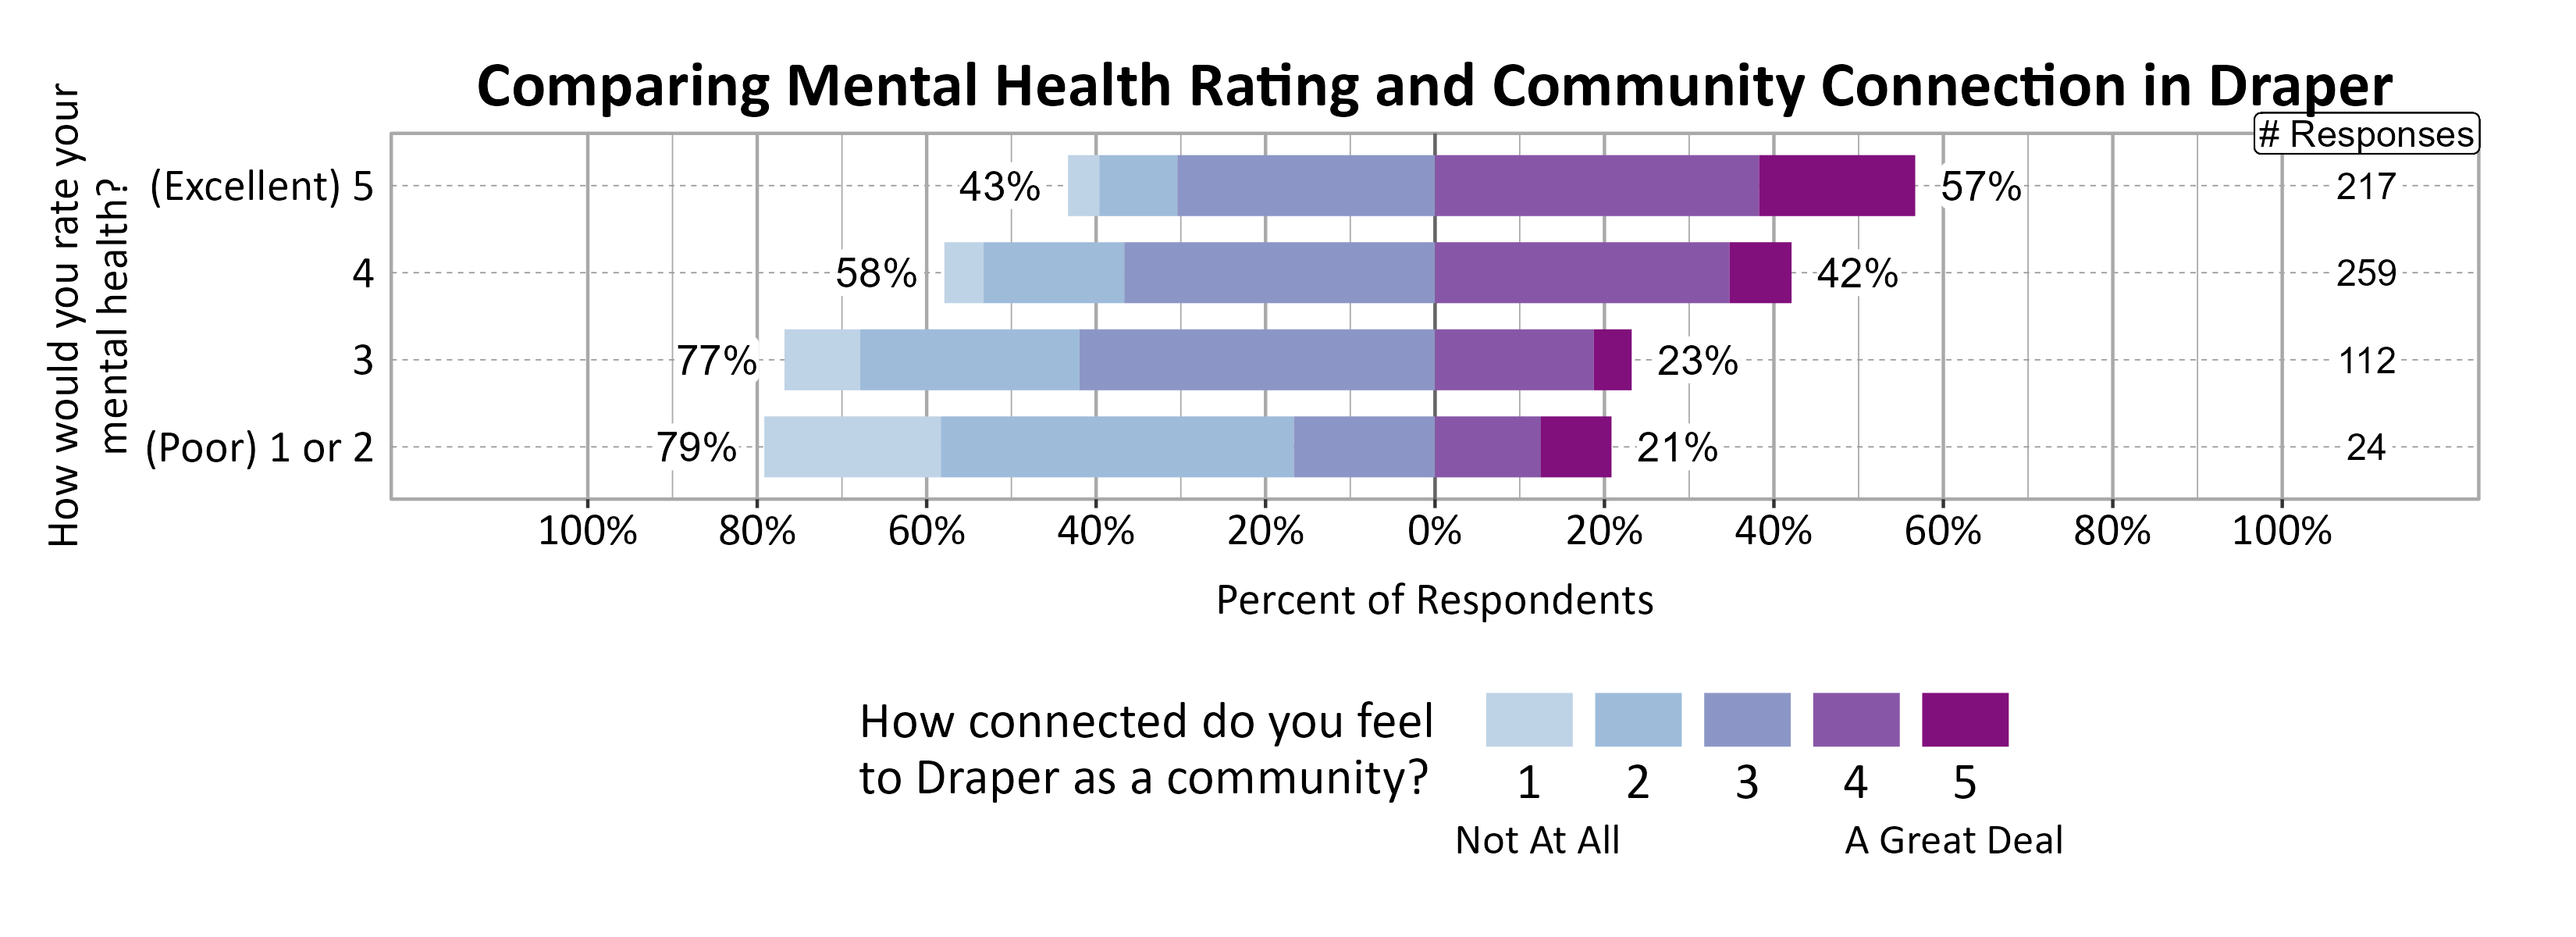
Community Connection in Draper
Survey participants were asked about how connected they feel to Draper on a 5-point scale from not at all (1) to a great deal (5), and the average score of all respondents was 3.25.
When comparing survey data from Draper over the years as shown in the information below, we can see that the average community connection score has slowly increased over the survey years.
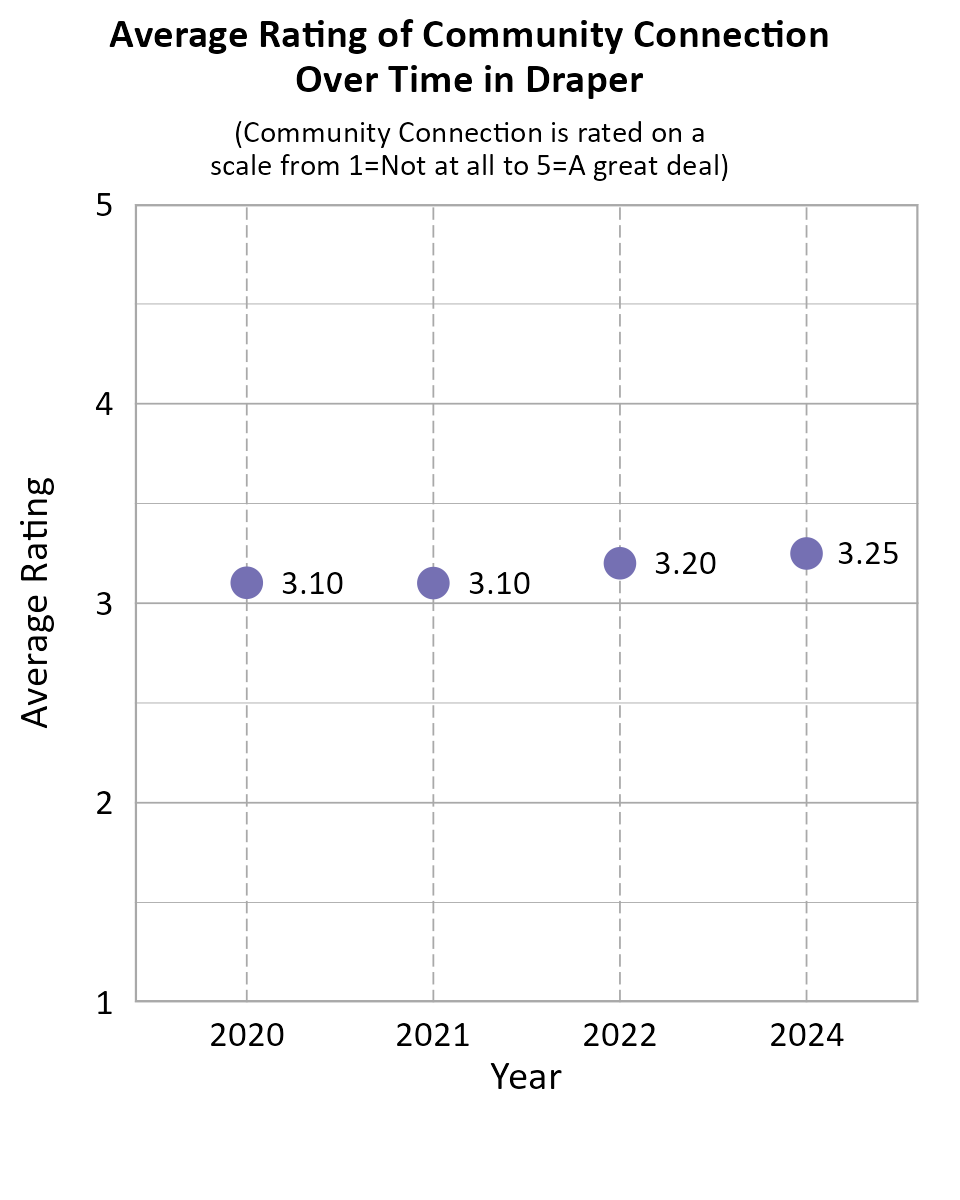
A positive relationship was found between individuals’ community connection and overall personal wellbeing as well as mental health.
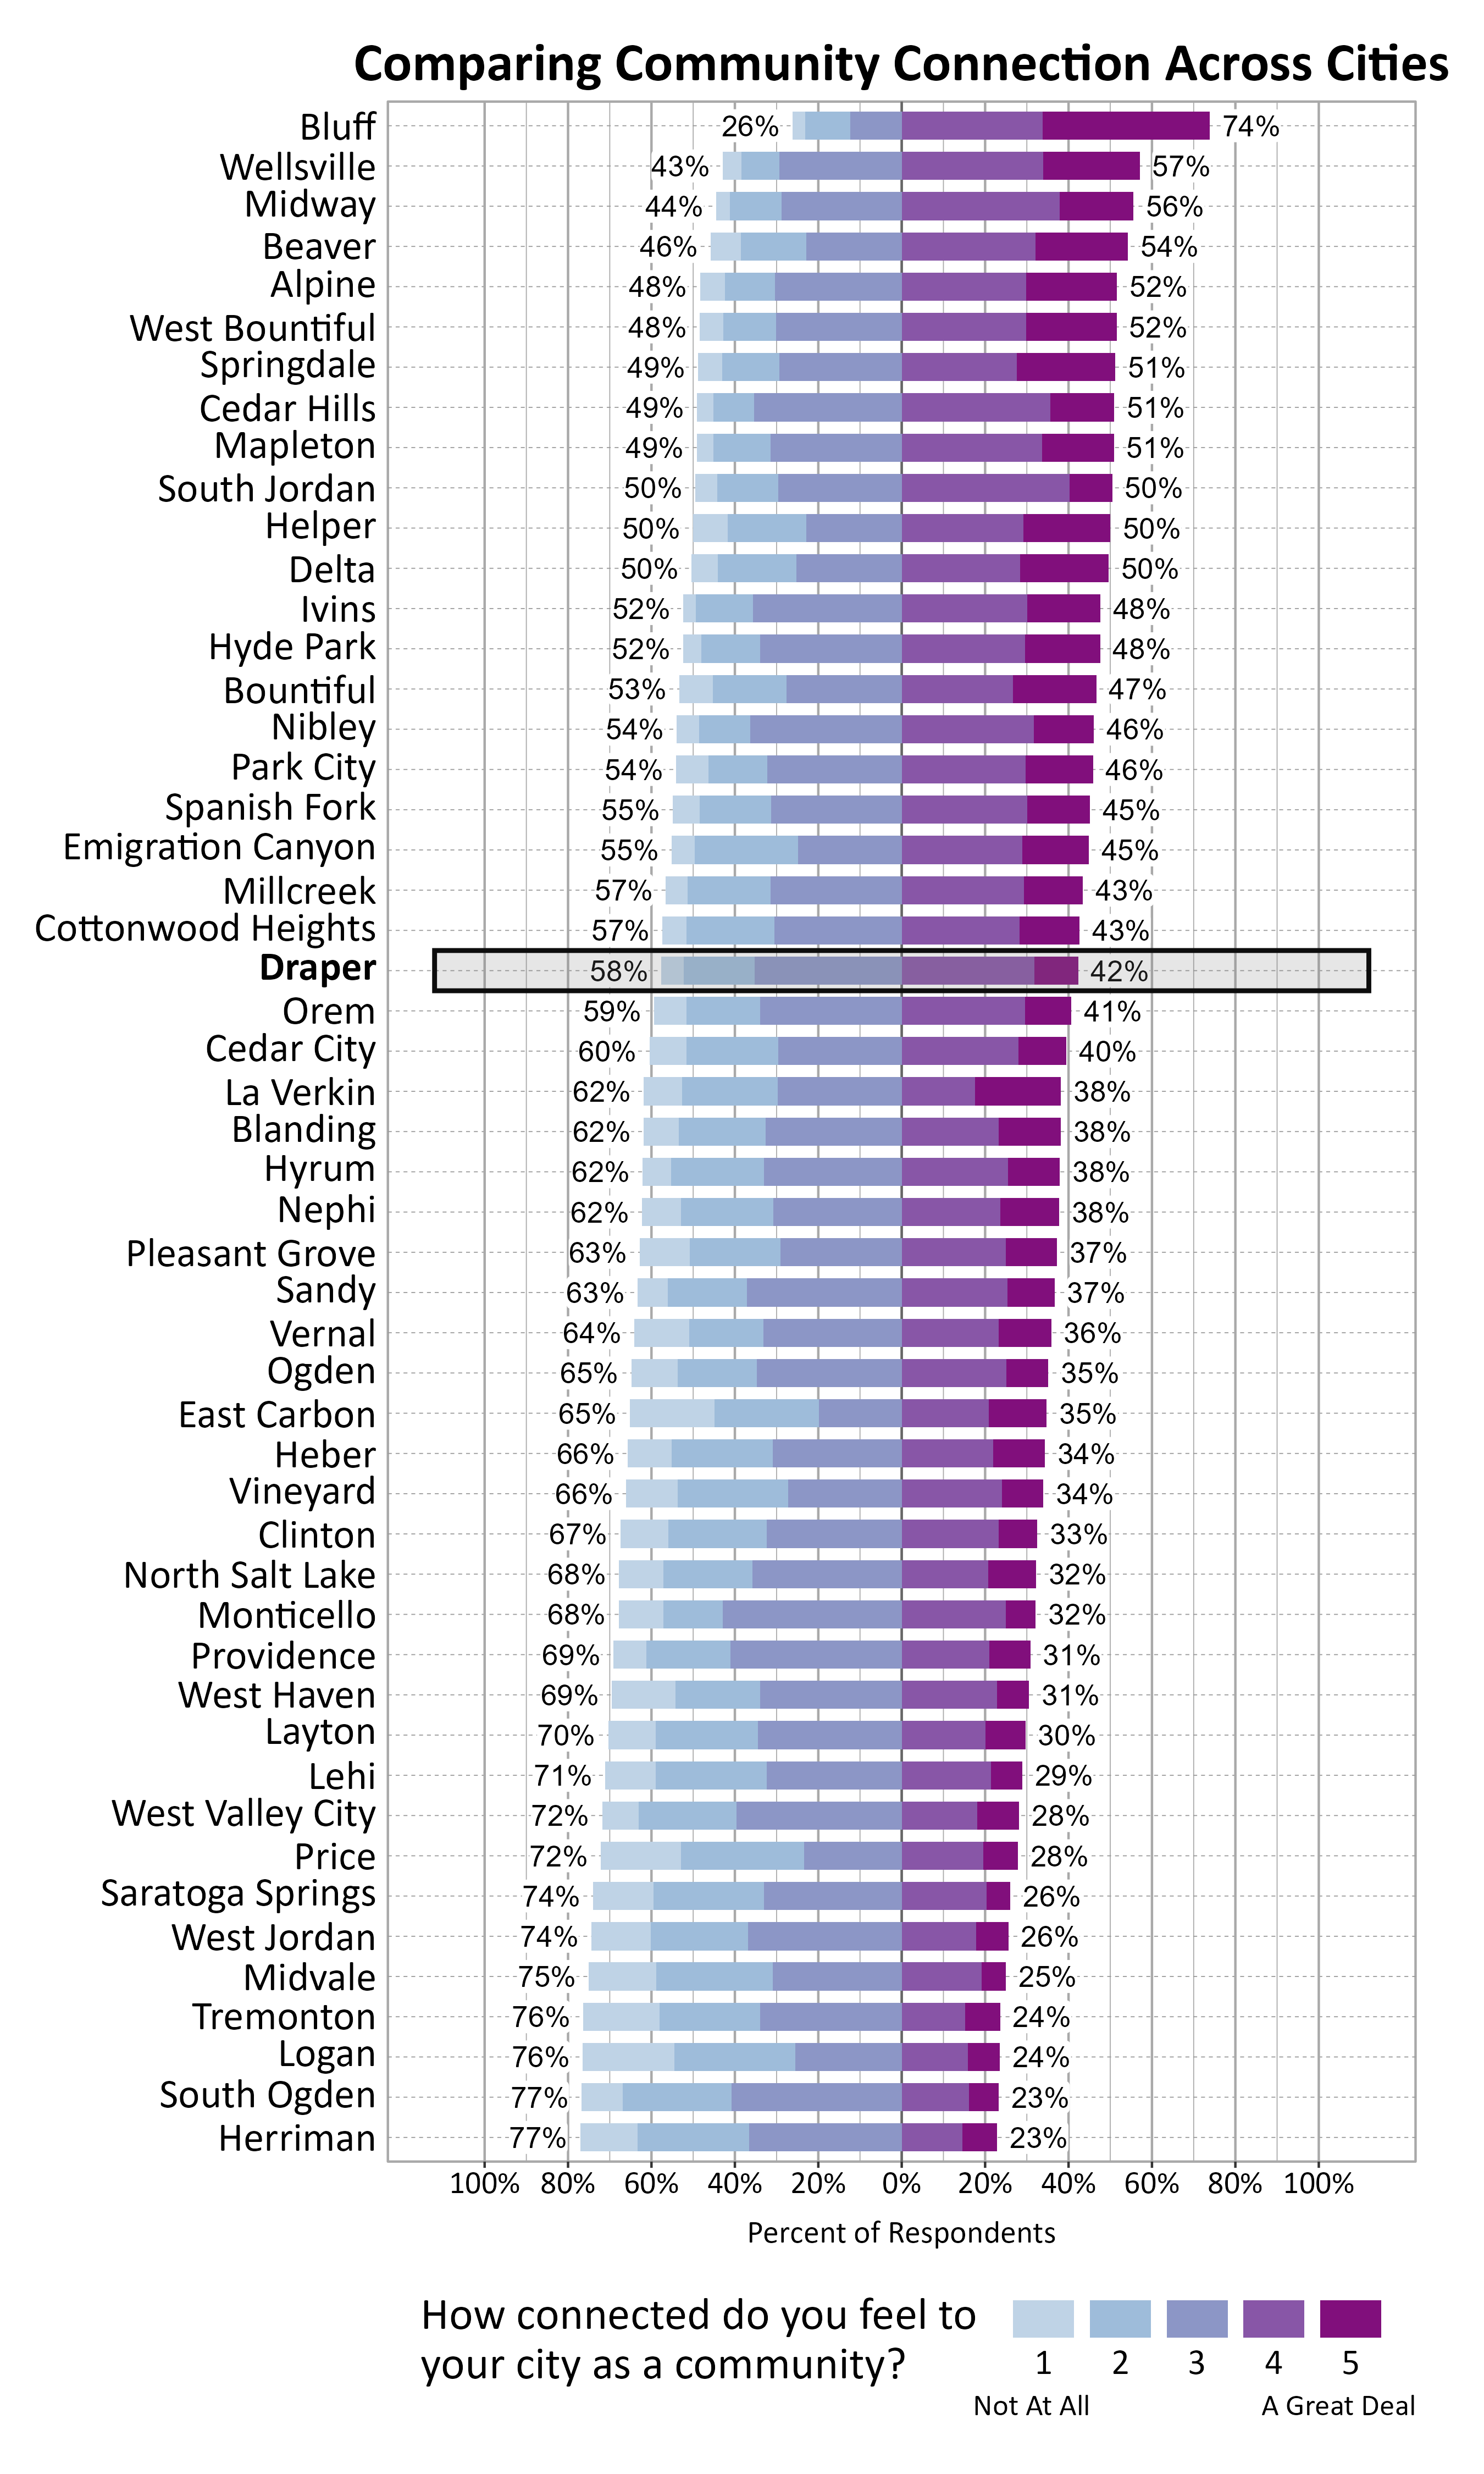
The graph below shows how Wellbeing Project cities and towns compare on feelings of community connection based on the percentage of respondents who answered 4 or a 5 on a 5-point scale from “not at all” to “a great deal” connected to their city or town. Draper ranked 22 out of the 51 cities that participated.
Participation in Recreation and Nature-Related Activities
Respondents were asked to indicate whether or not they participated in various activities in the last 12 months. The most popular activities were walking or biking in your neighborhood or city (97%), using trails in or near your city (90%), and recreating in parks in your city (90%).
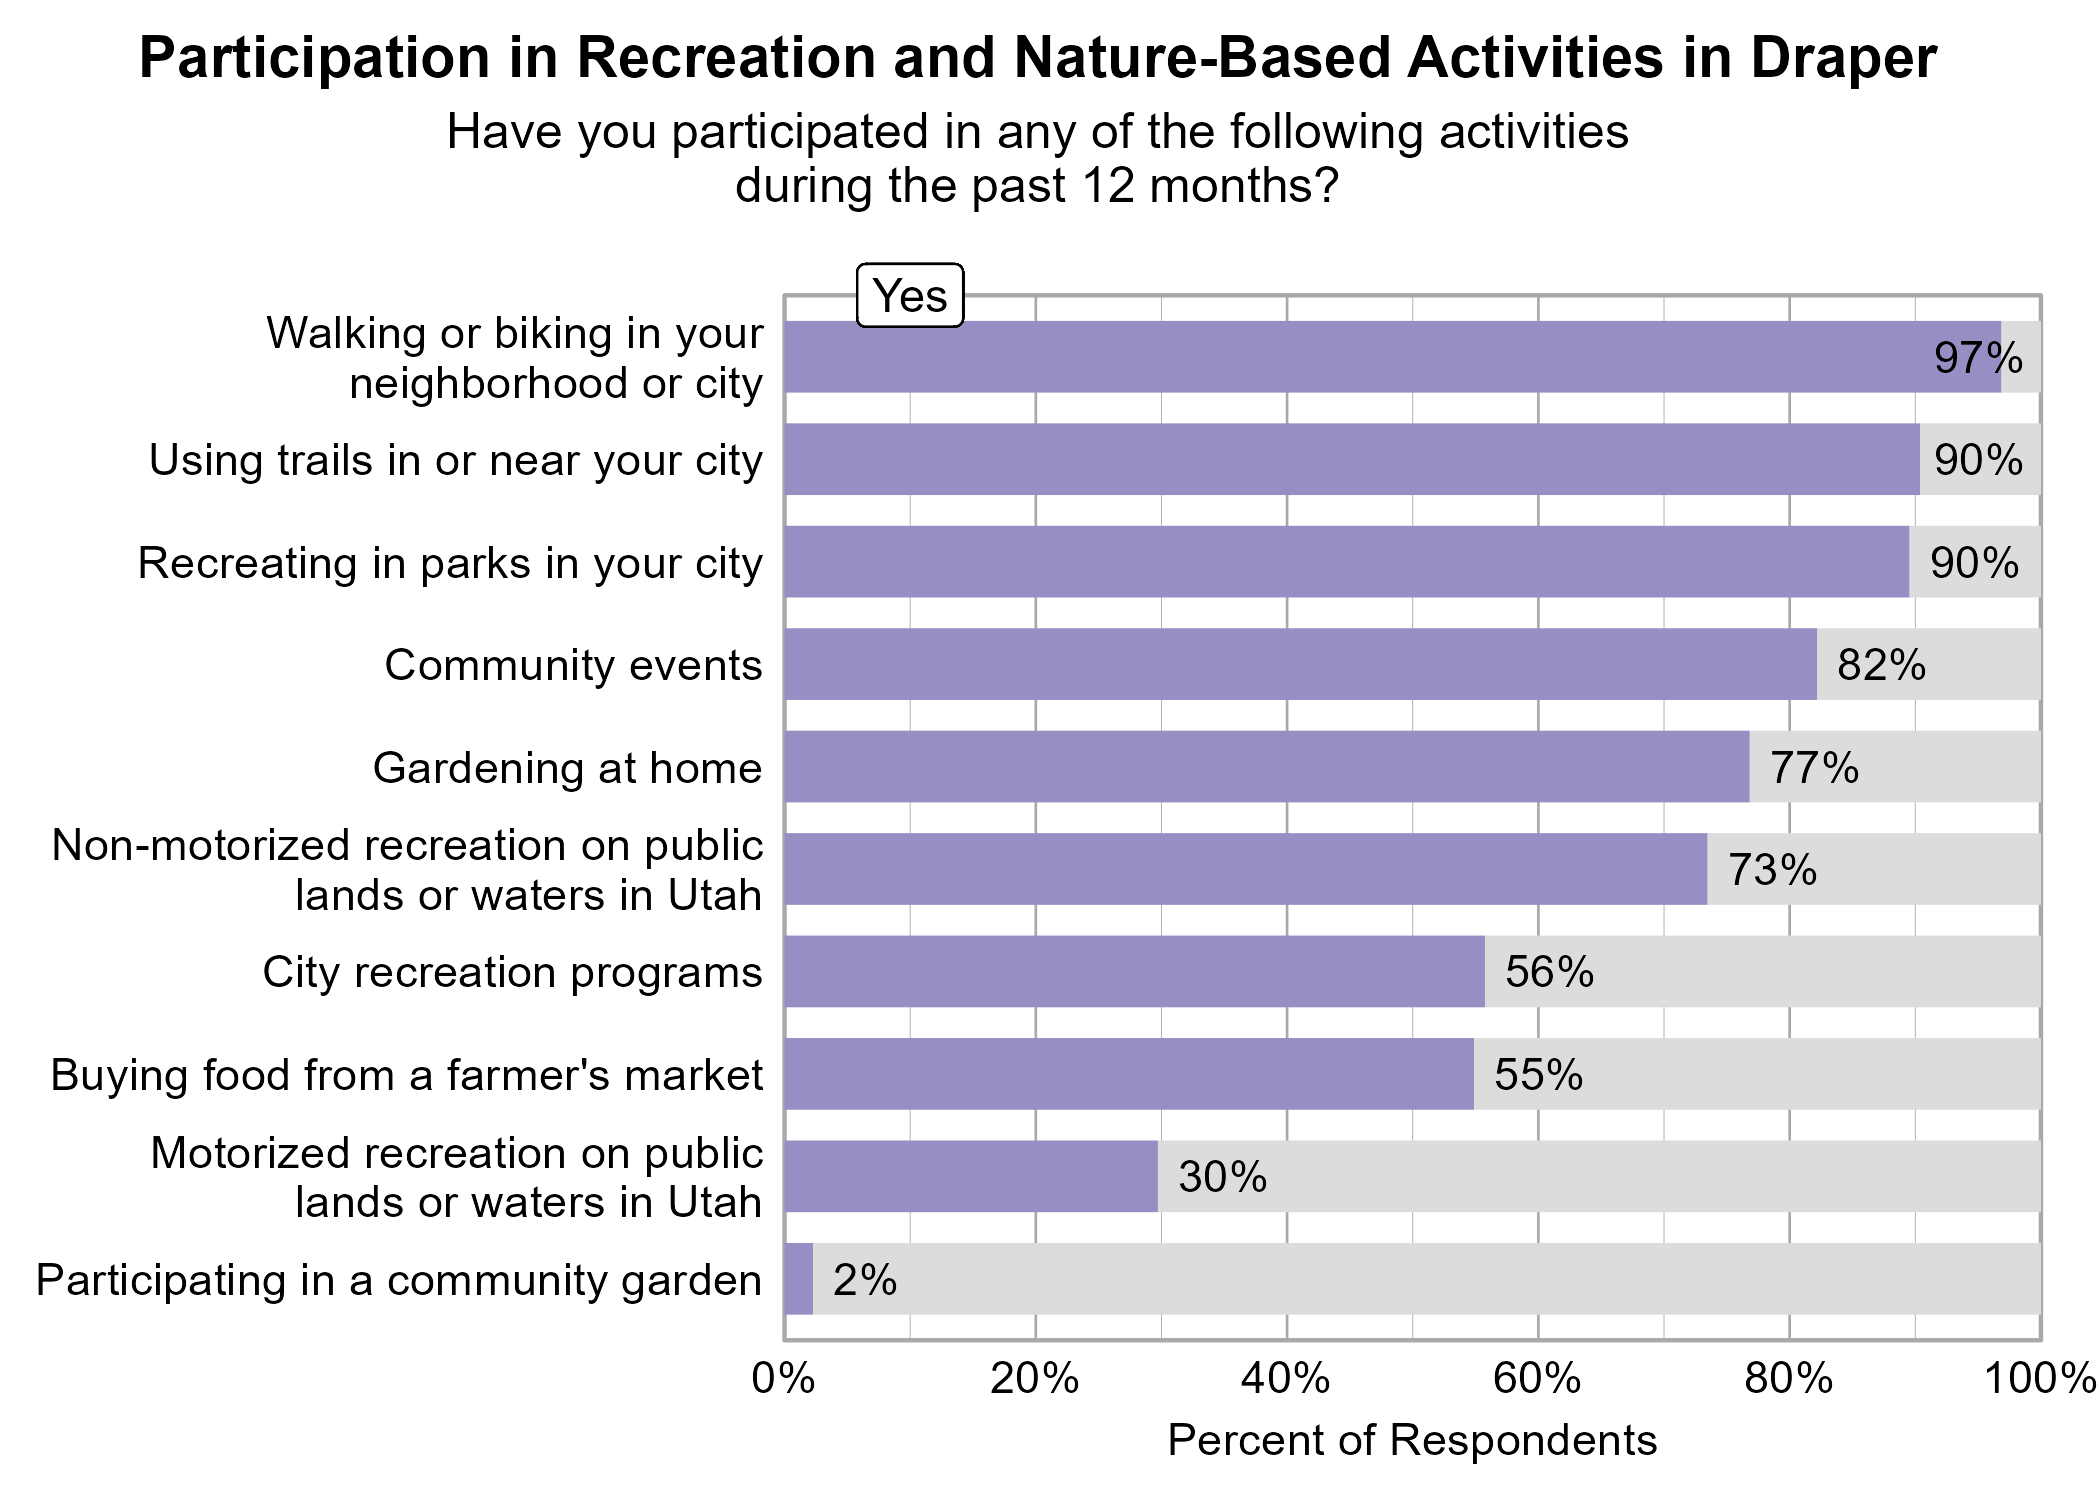
Participating in community events, gardening at home, non-motorized recreation on public lands or waters in Utah, and using trails in or near your city were significantly related to higher ratings of personal wellbeing.
Participating in community events and using trails in or near your city were significantly related to higher ratings of community wellbeing.
Participating in city recreation programs, participating in community events, gardening at home, and recreating in parks in your city were significantly related to higher ratings of community connection.
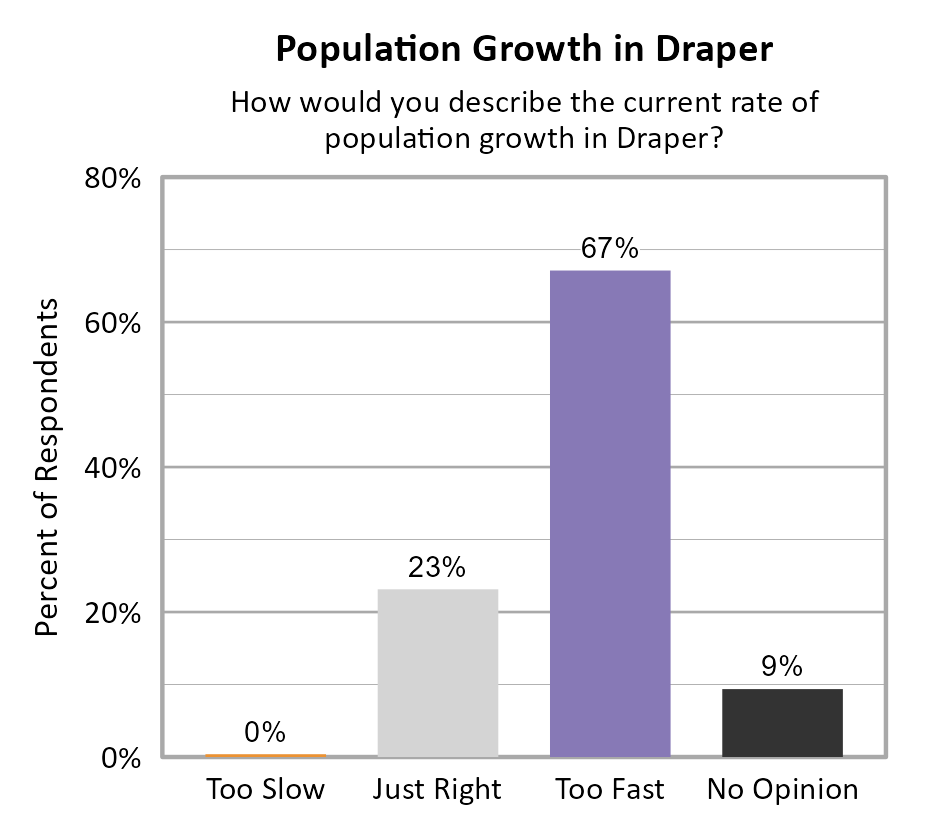
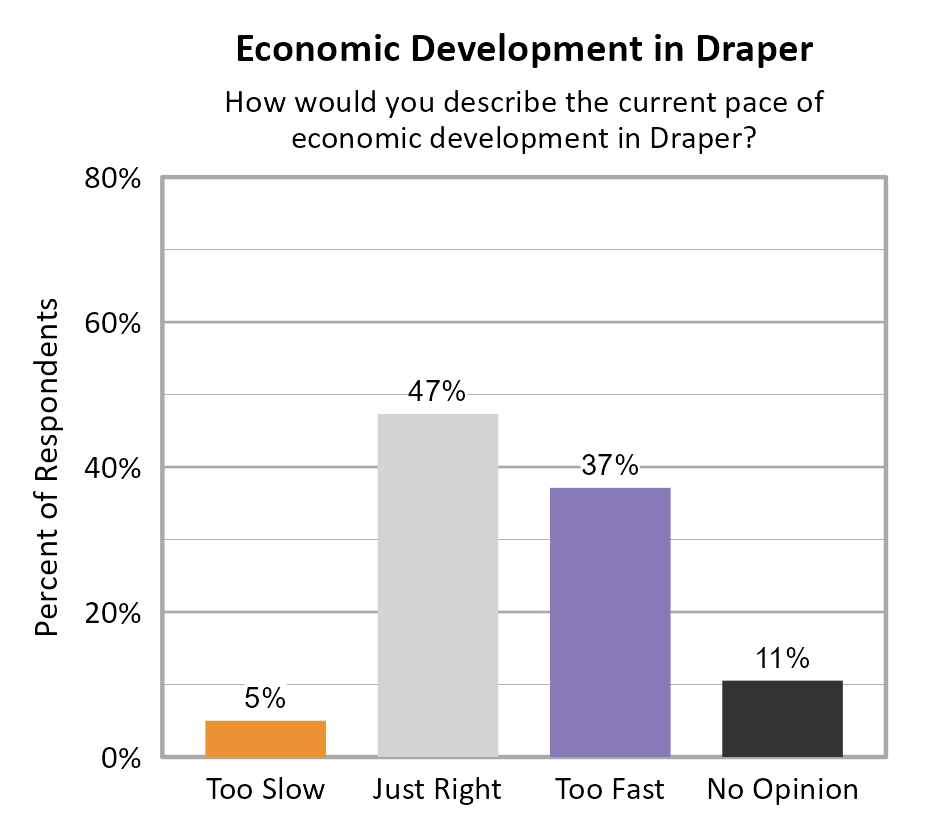
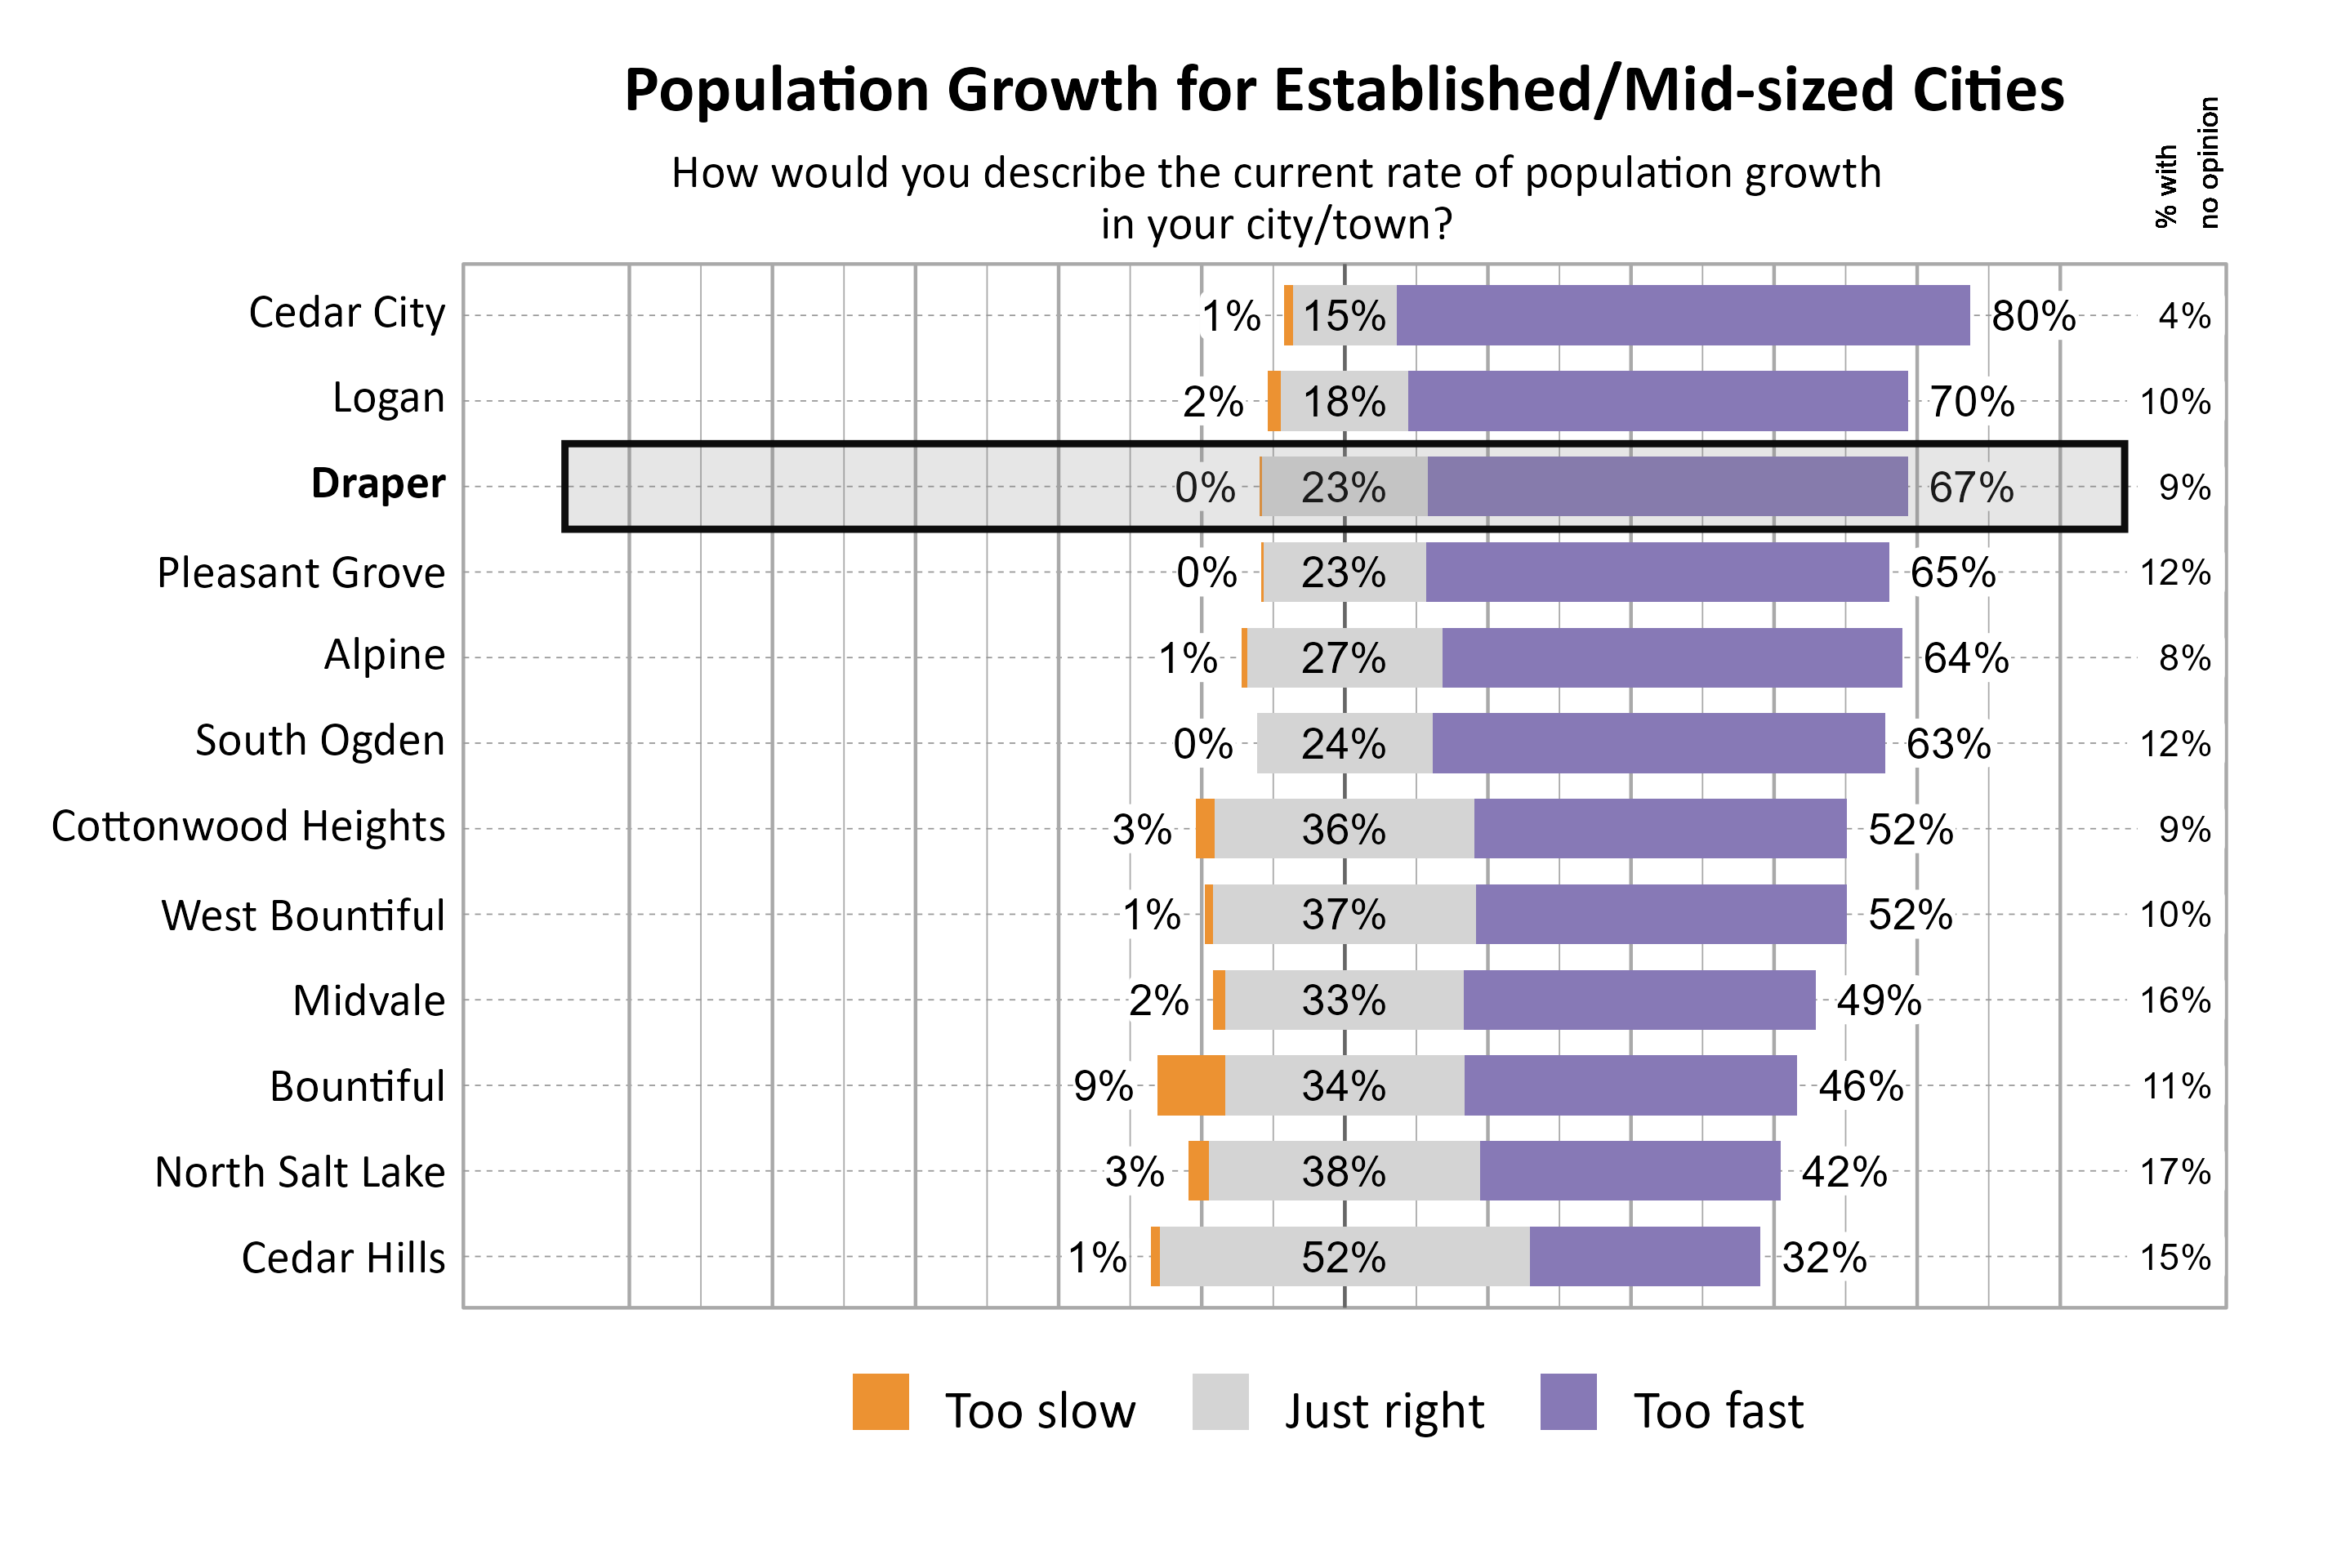
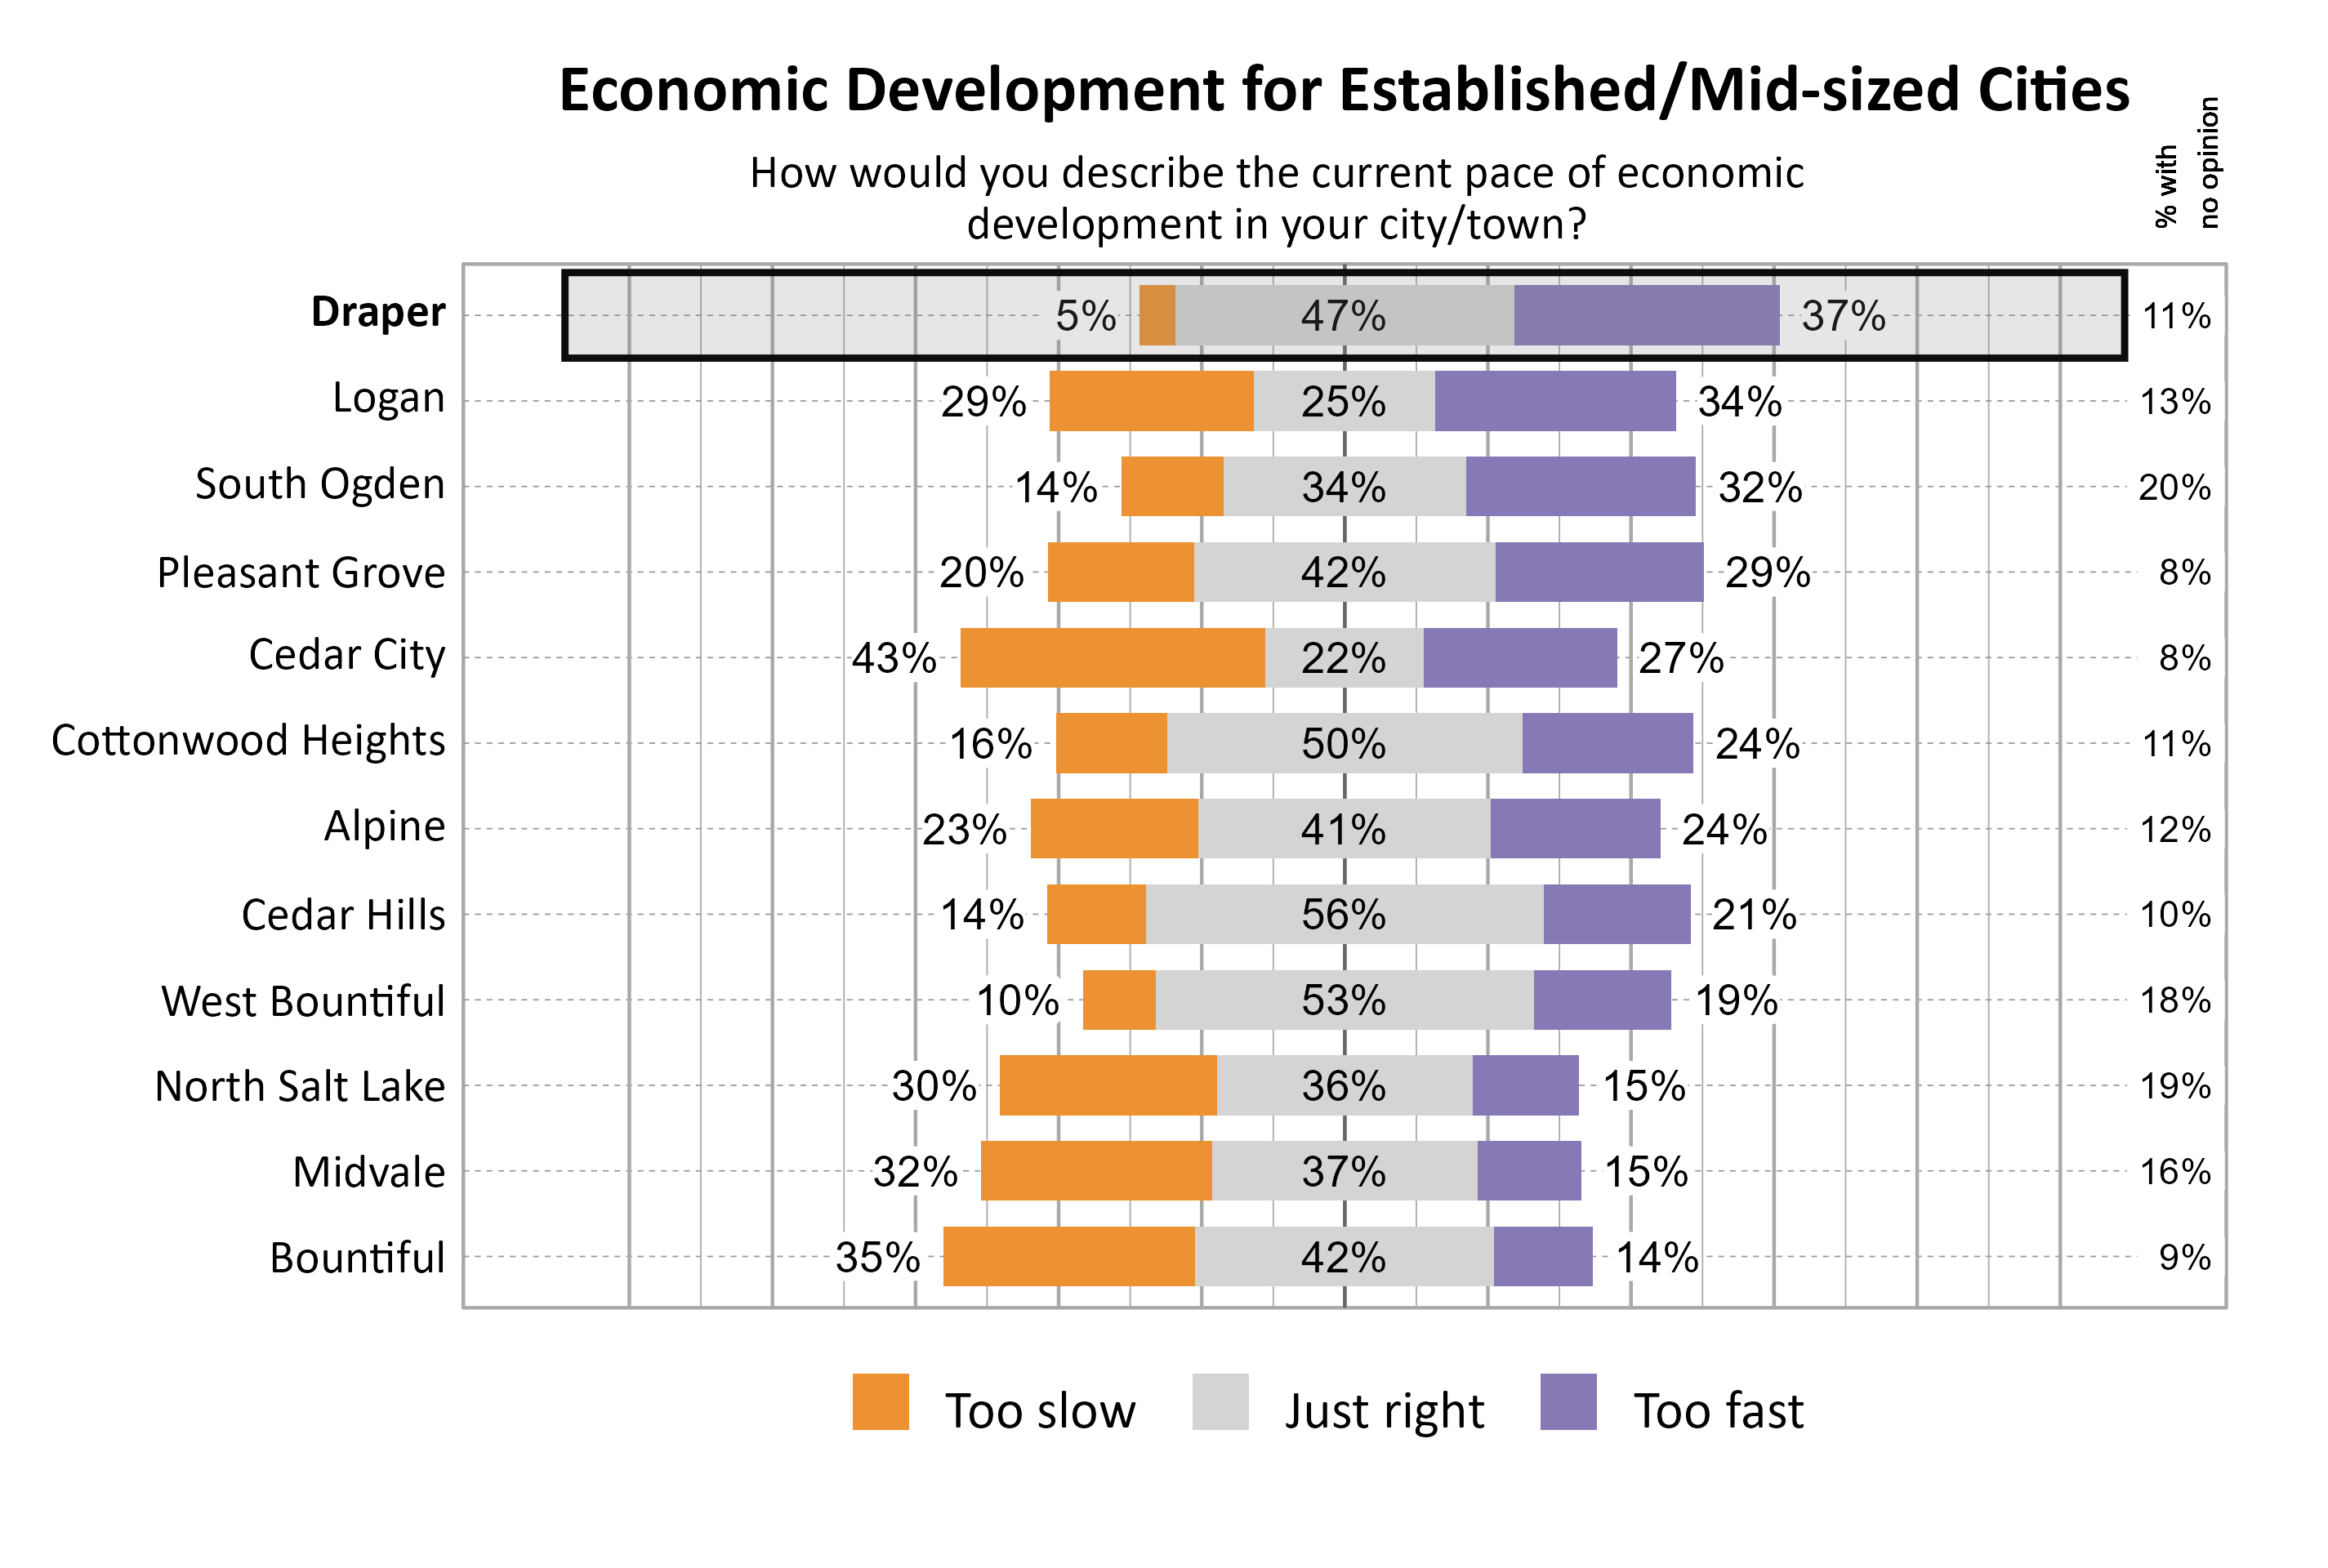
Perspectives on Population Growth and Economic Development
The majority of respondents in Draper indicated that they felt the population growth was too fast (67%). For the pace of economic development, the largest proportion of respondents indicated that it was just right (47%).
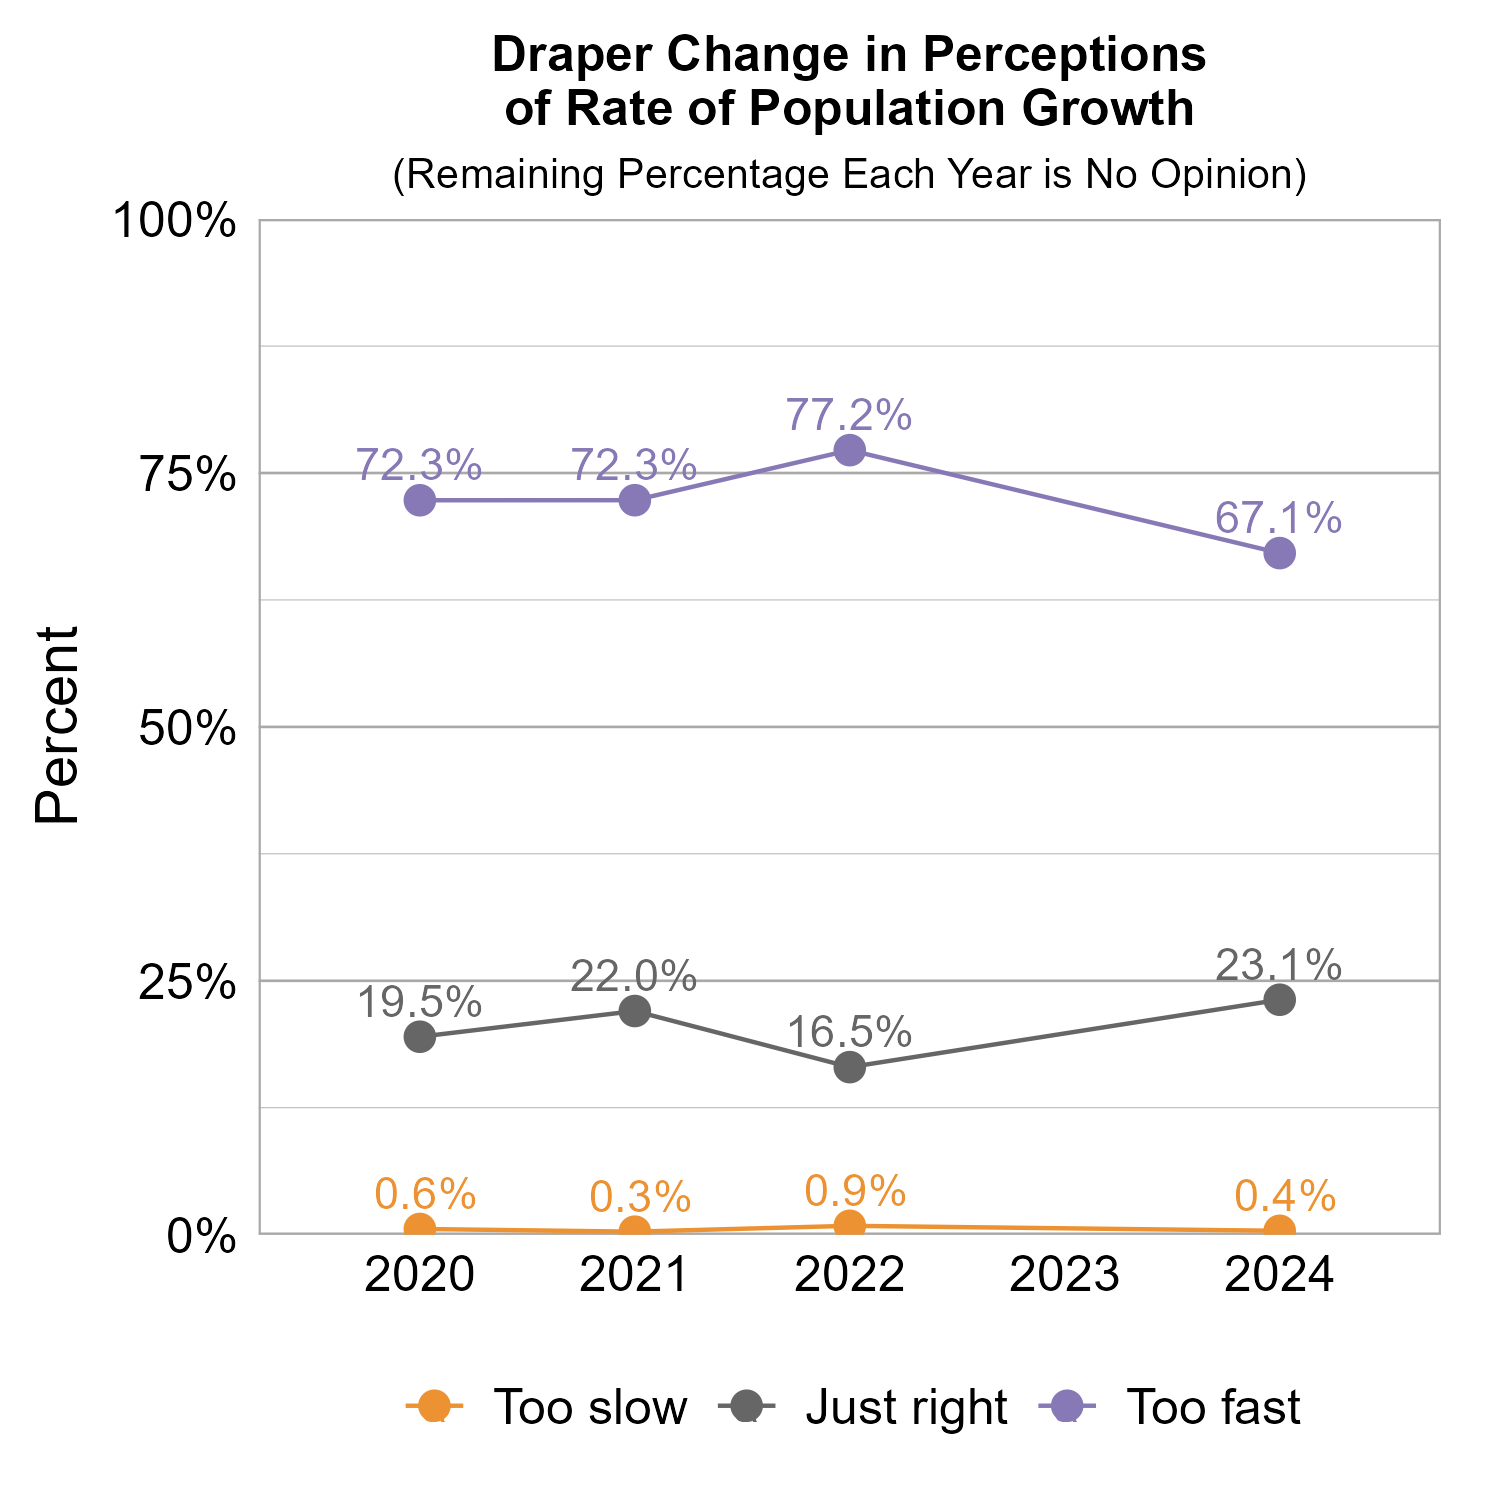
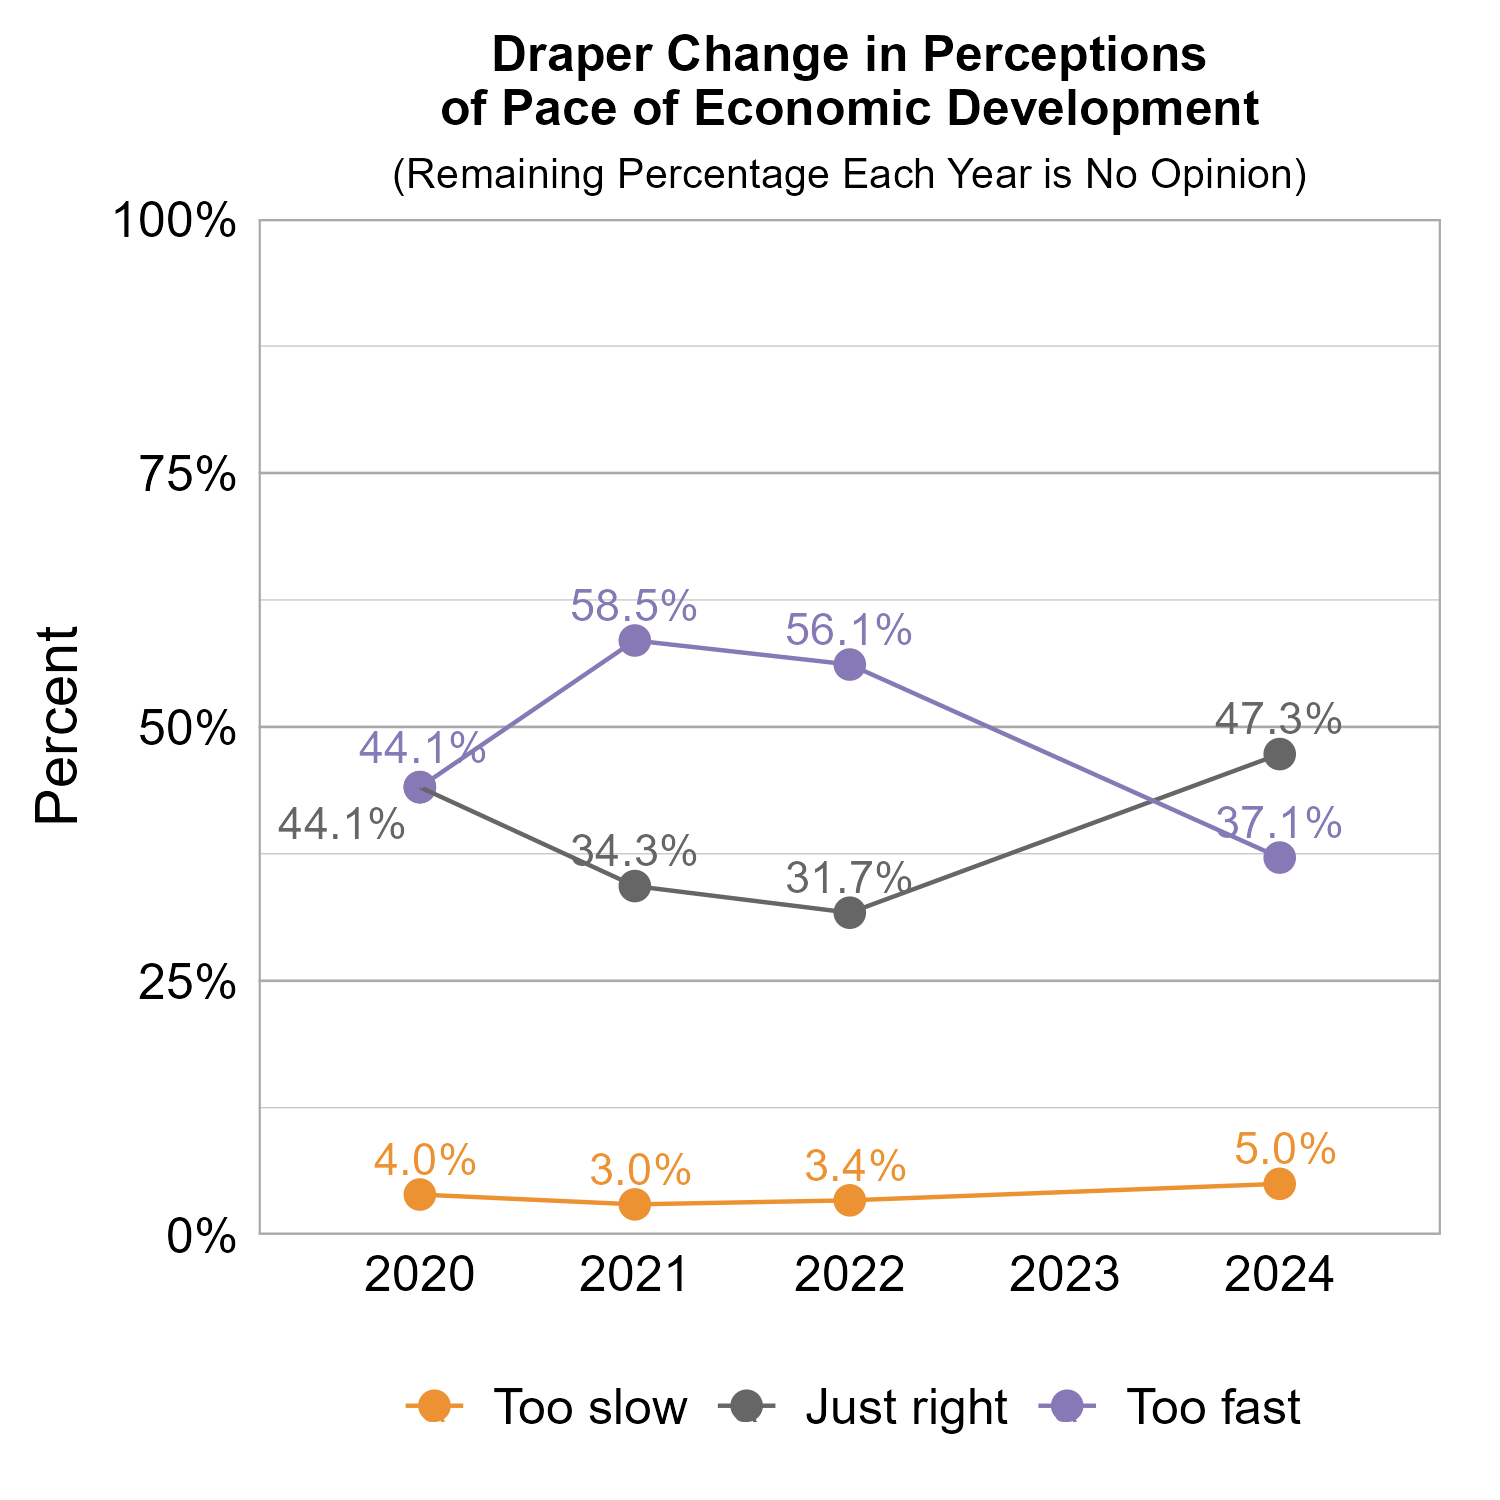
The graphs below show how perceptions of population growth and economic development in Draper have varied across recent years of Wellbeing Surveys. Perception that the rate of population growth is too fast has consistently remained high across the survey years, with a slight decrease from 2022 to 2024. Perception that the pace of economic development is too fast declined from 2022 to 2024, while perception that it was just right became the largest proportion of respondents.
The graphs below show perceptions of population growth and economic development for Draper compared to other participating cities and towns in the Established/Mid-sized Cities cluster.
The graph below illustrates how many respondents perceived the pace of economic development as too slow, just right, too fast, or had no opinion, with additional breakdowns for the number of respondents who provided comments.
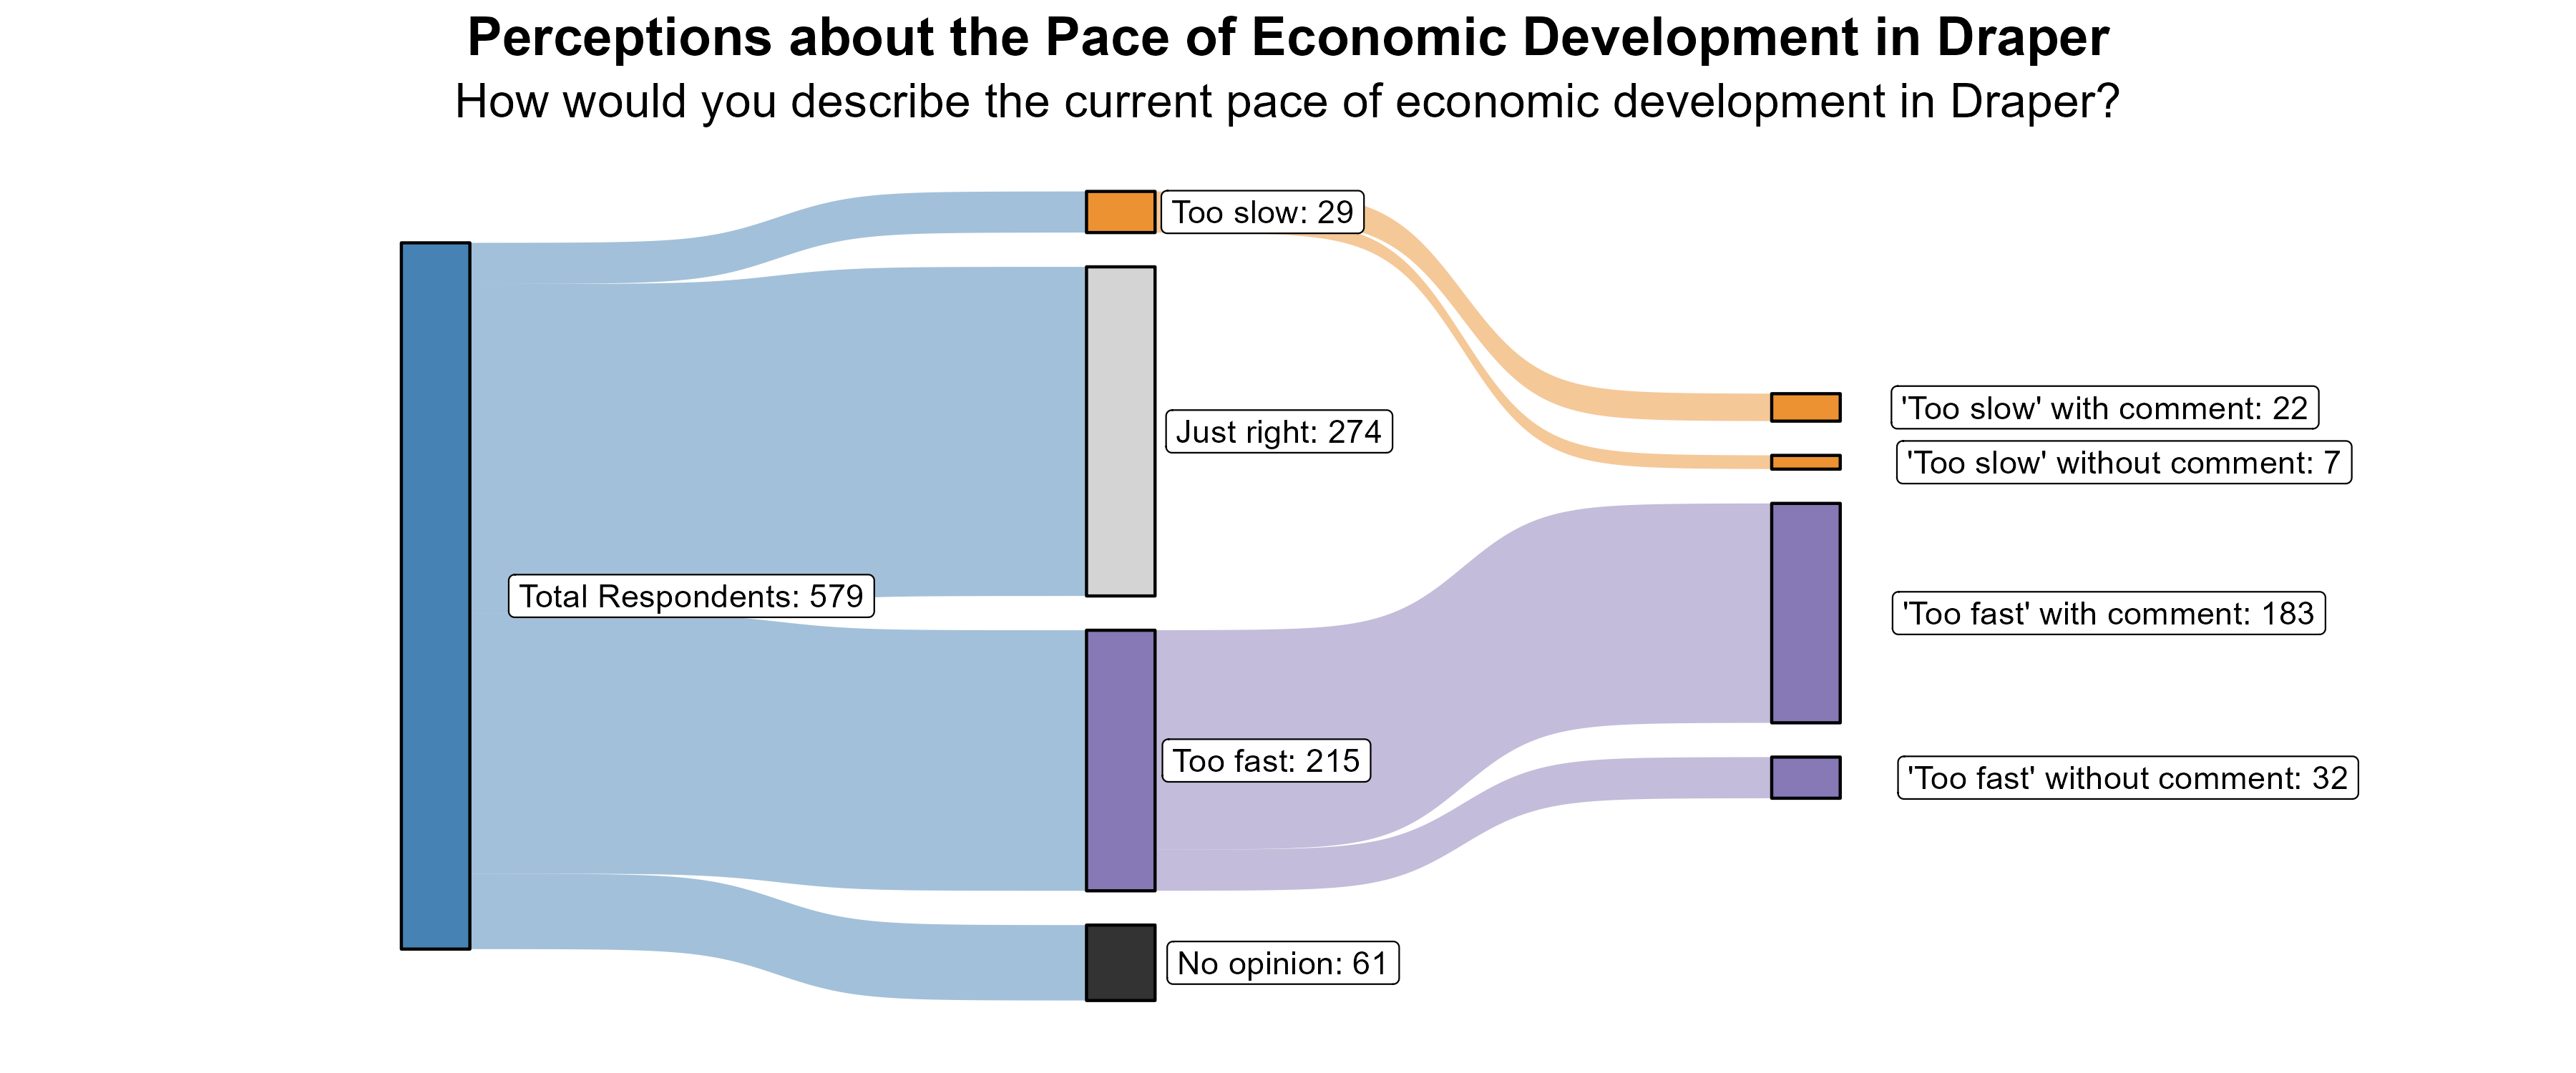
The 5% of respondents who rated the pace of economic growth as “too slow” were further asked what aspects of the local economy they would like to see more of in Draper. Many of the comments included requests for more retail, restaurants, and entertainment. There were also many respondents asking for better transportation infrastructure, both for cars and for alternative transportation.
Additionally, the 37% of respondents who rated the pace of economic growth as “too fast” were further asked what aspects of the local economy they feel are growing too quickly in Draper. A large theme in the comments was that of traffic and lagging infrastructure. People were very concerned about the strain growth has put on transportation and feel there is a lack of proper planning. There were many comments made about housing, both on the side of too much being built and not enough. Similarly, many respondents mentioned too many large office buildings being built. Respondents were also concerned about the loss of fields and green space.
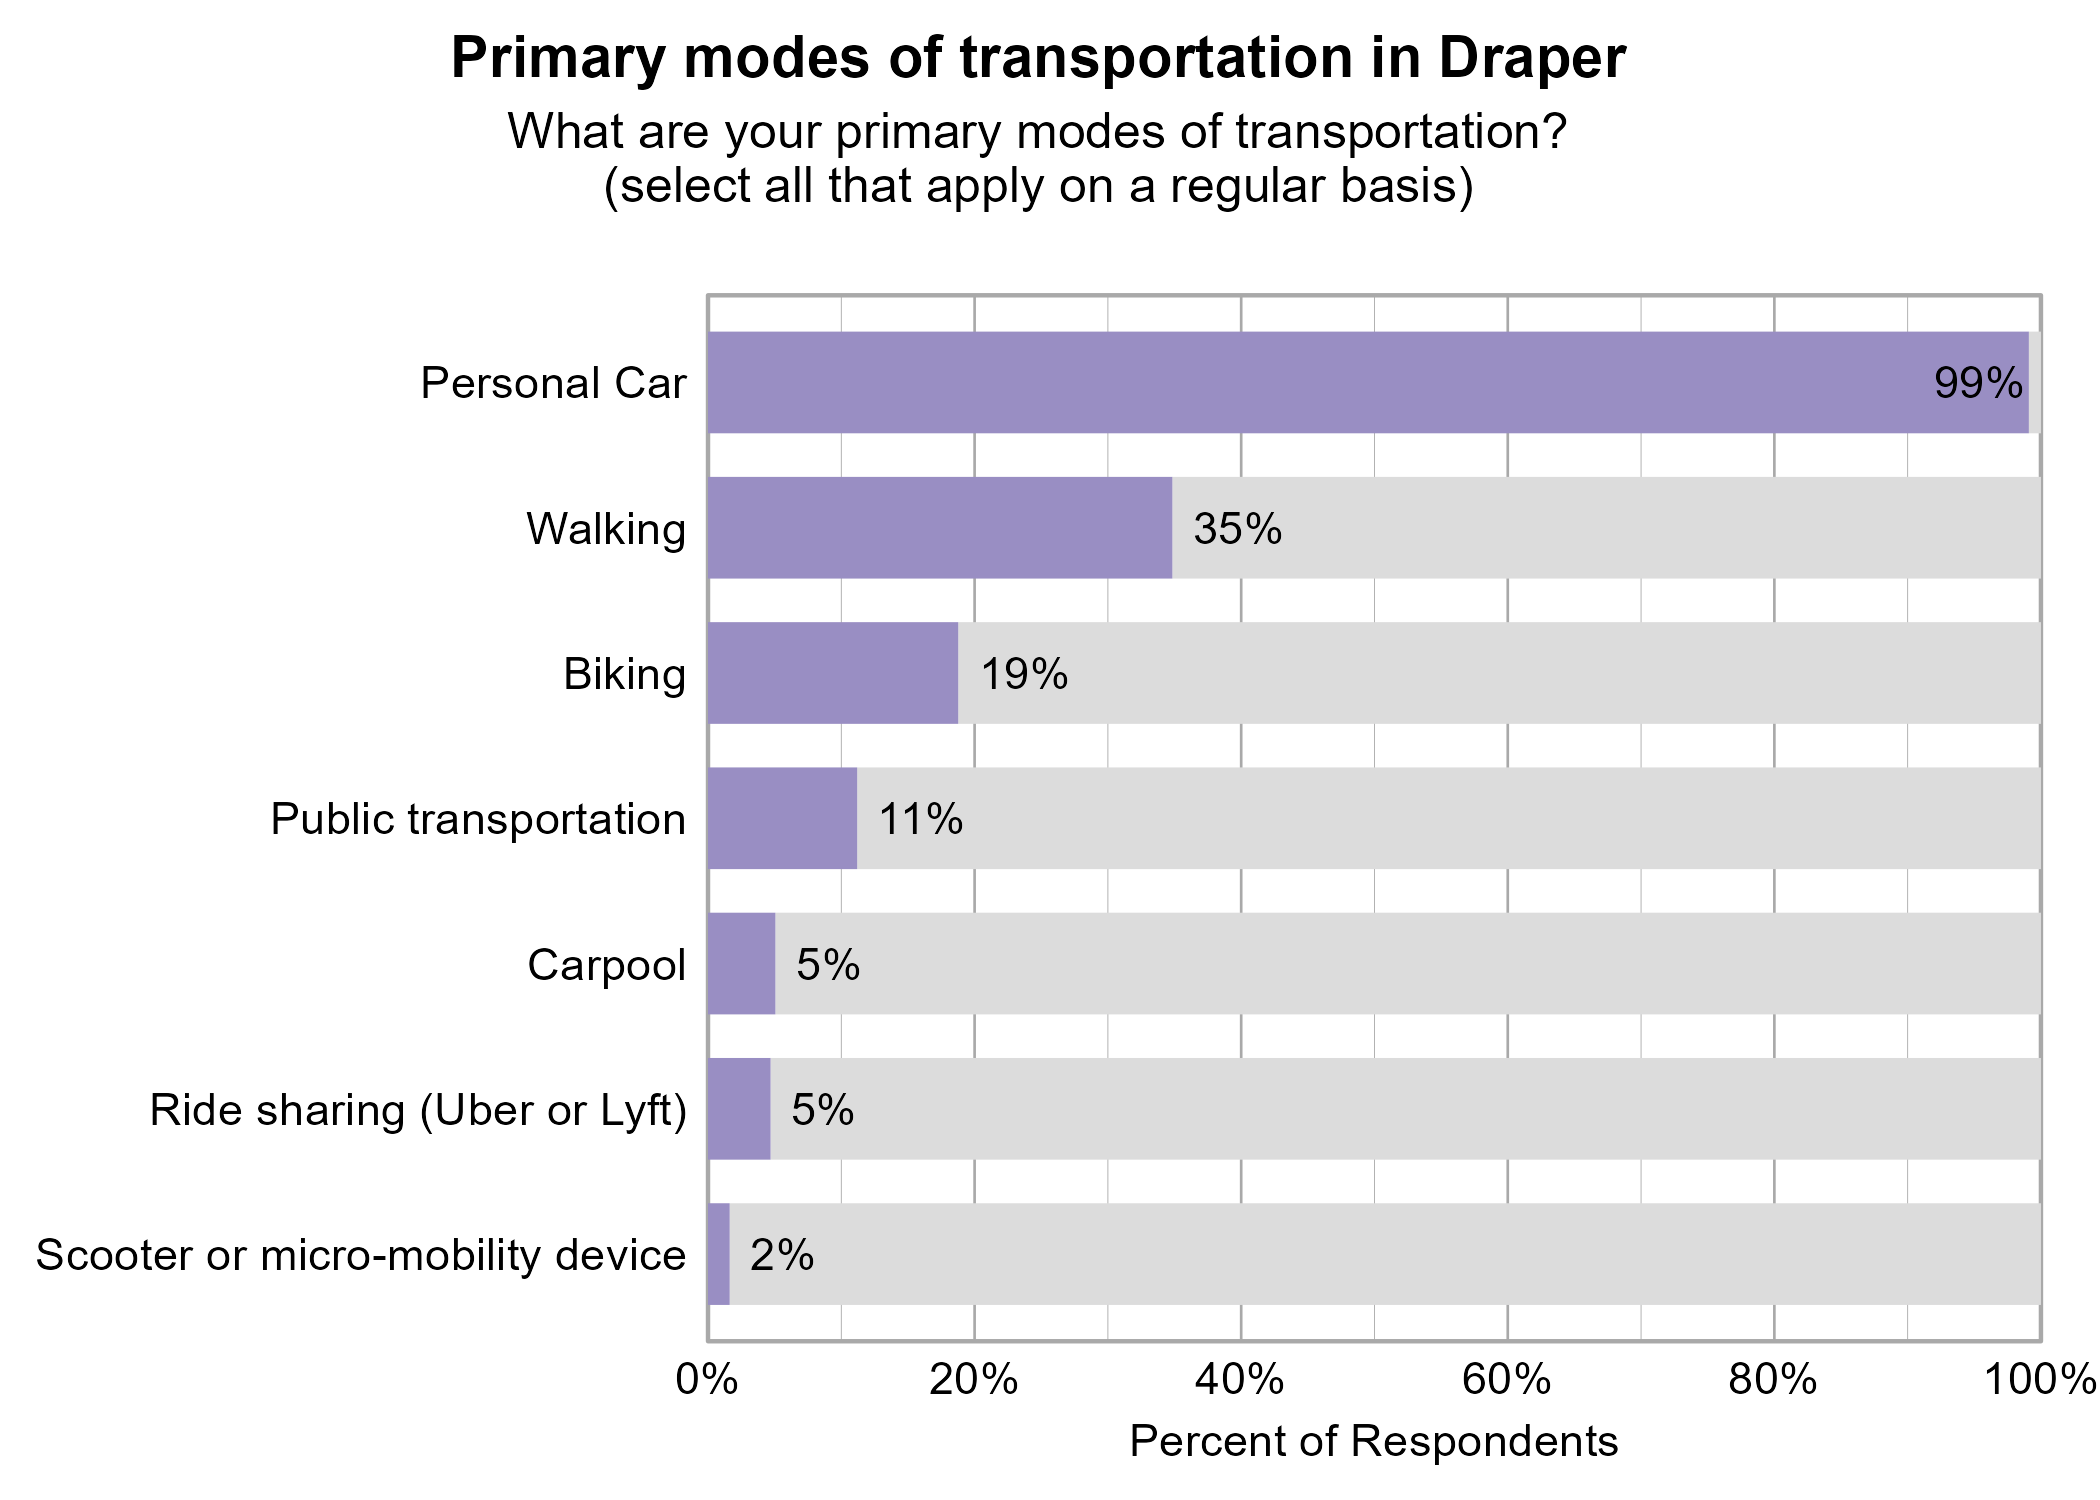
Transportation in Draper
Respondents were asked to indicate all of their primary modes of transportation on a regular basis in Draper. The most popular modes of transportation were personal car (99%) and walking (35%).
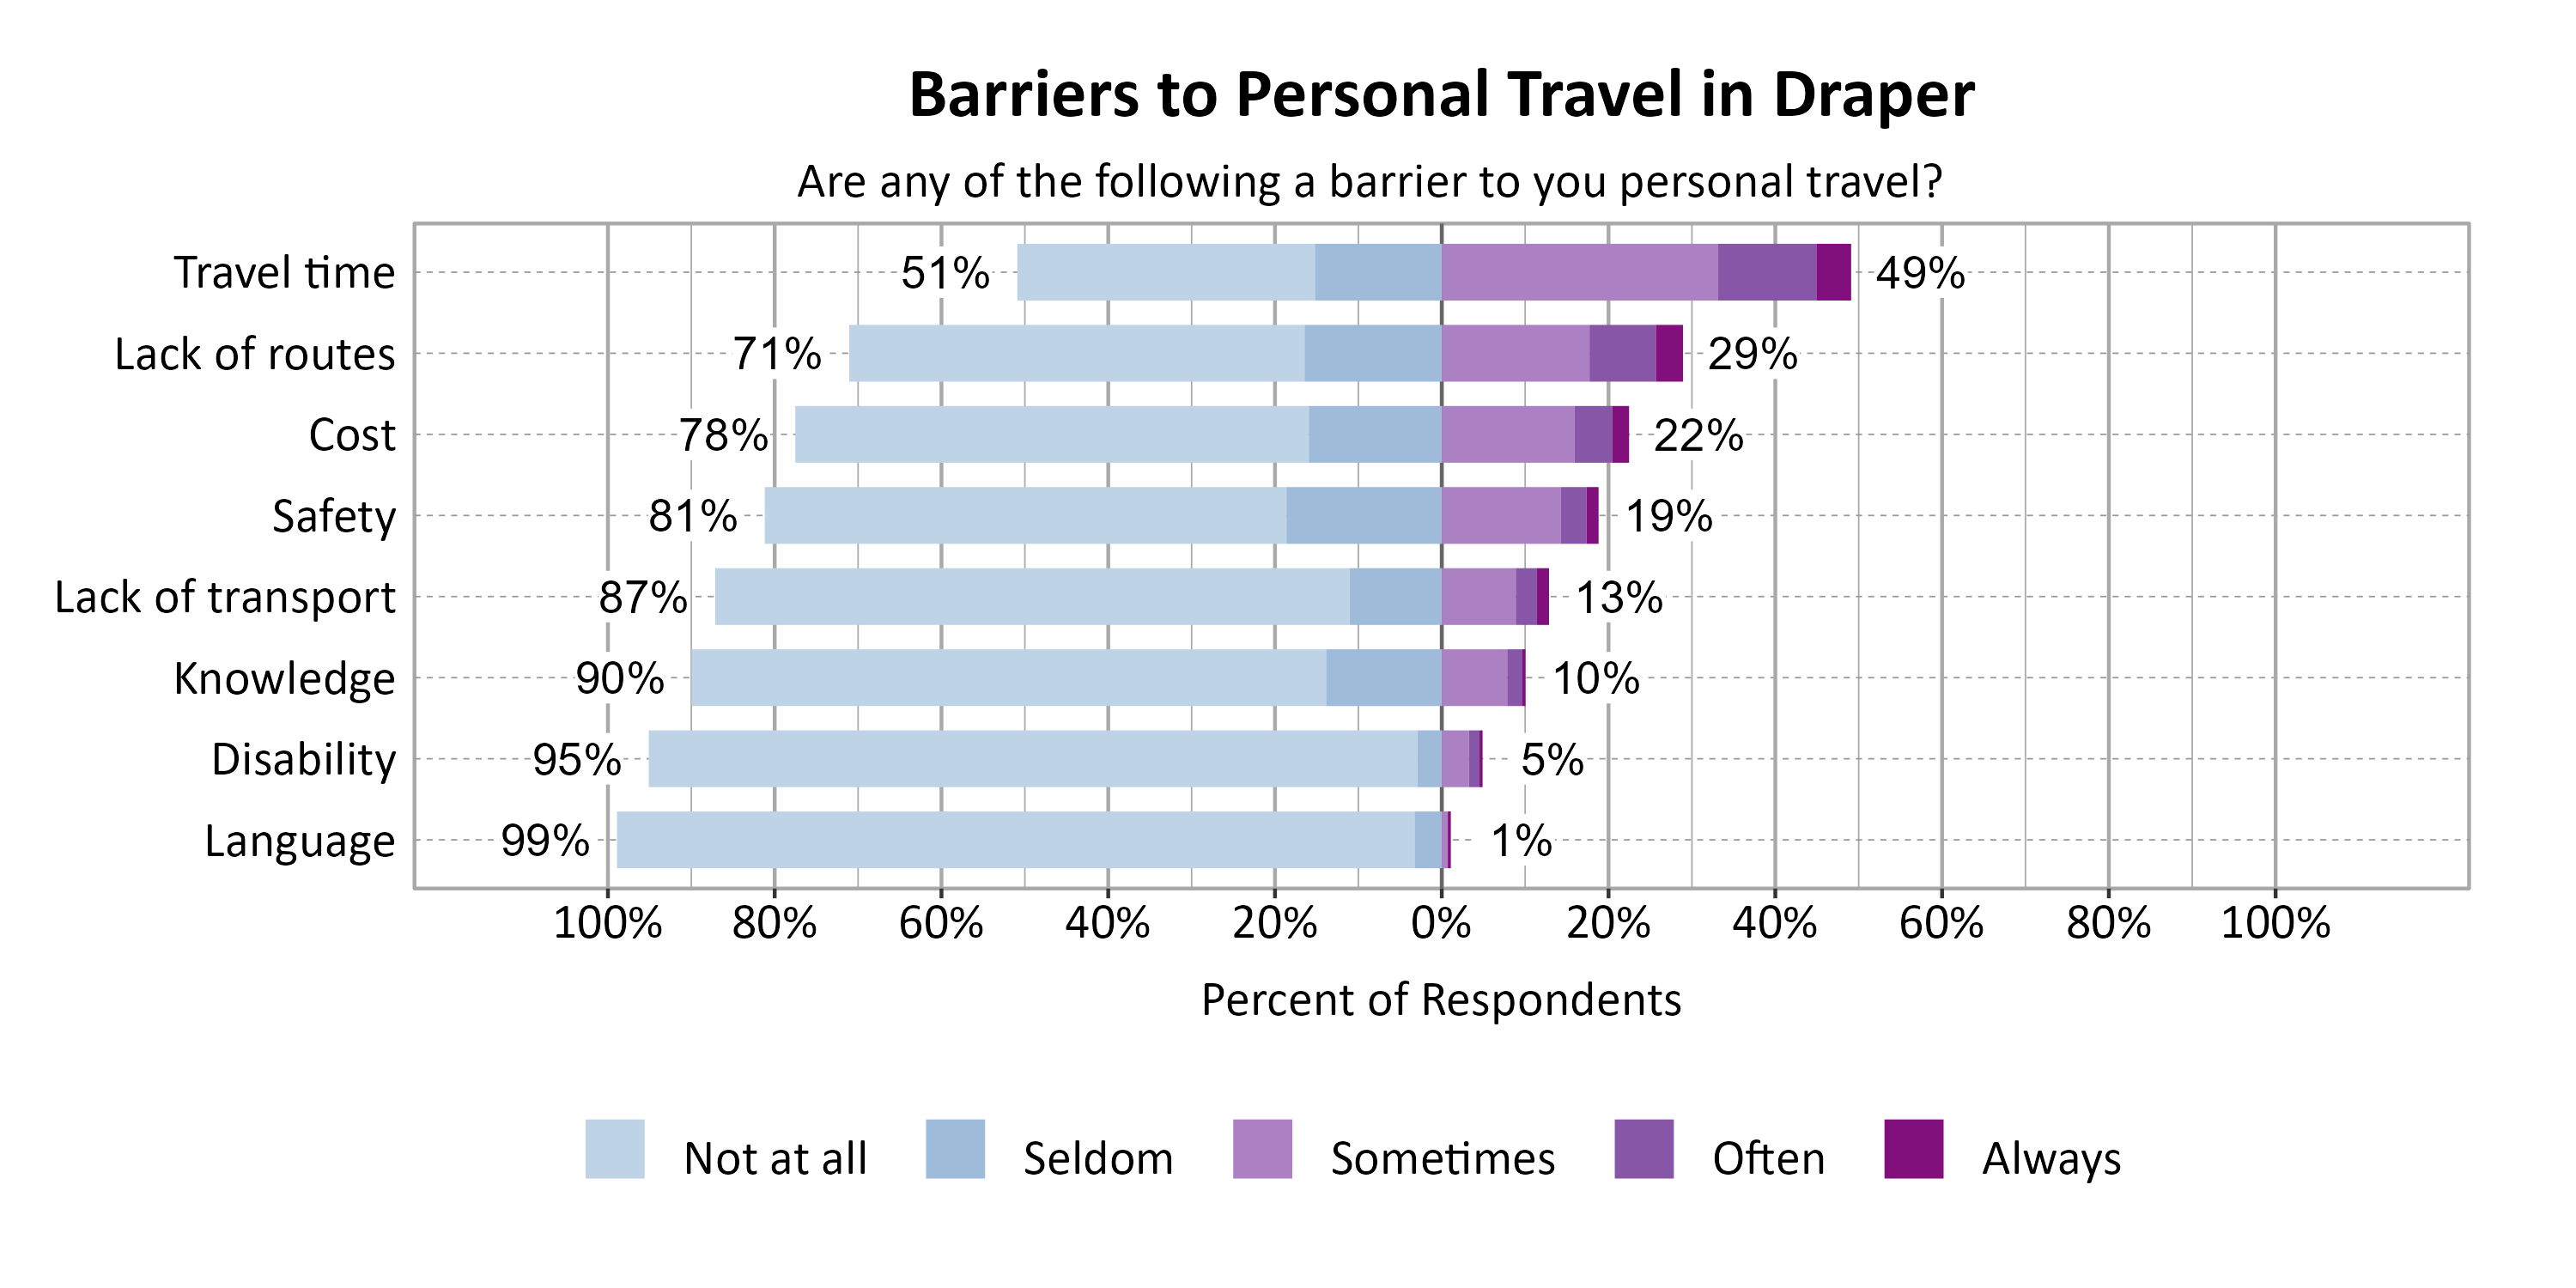
Respondents were asked to indicate the most common barriers to transportation in Draper. The most problematic barriers were Travel time (49%) and Lack of routes (29%).
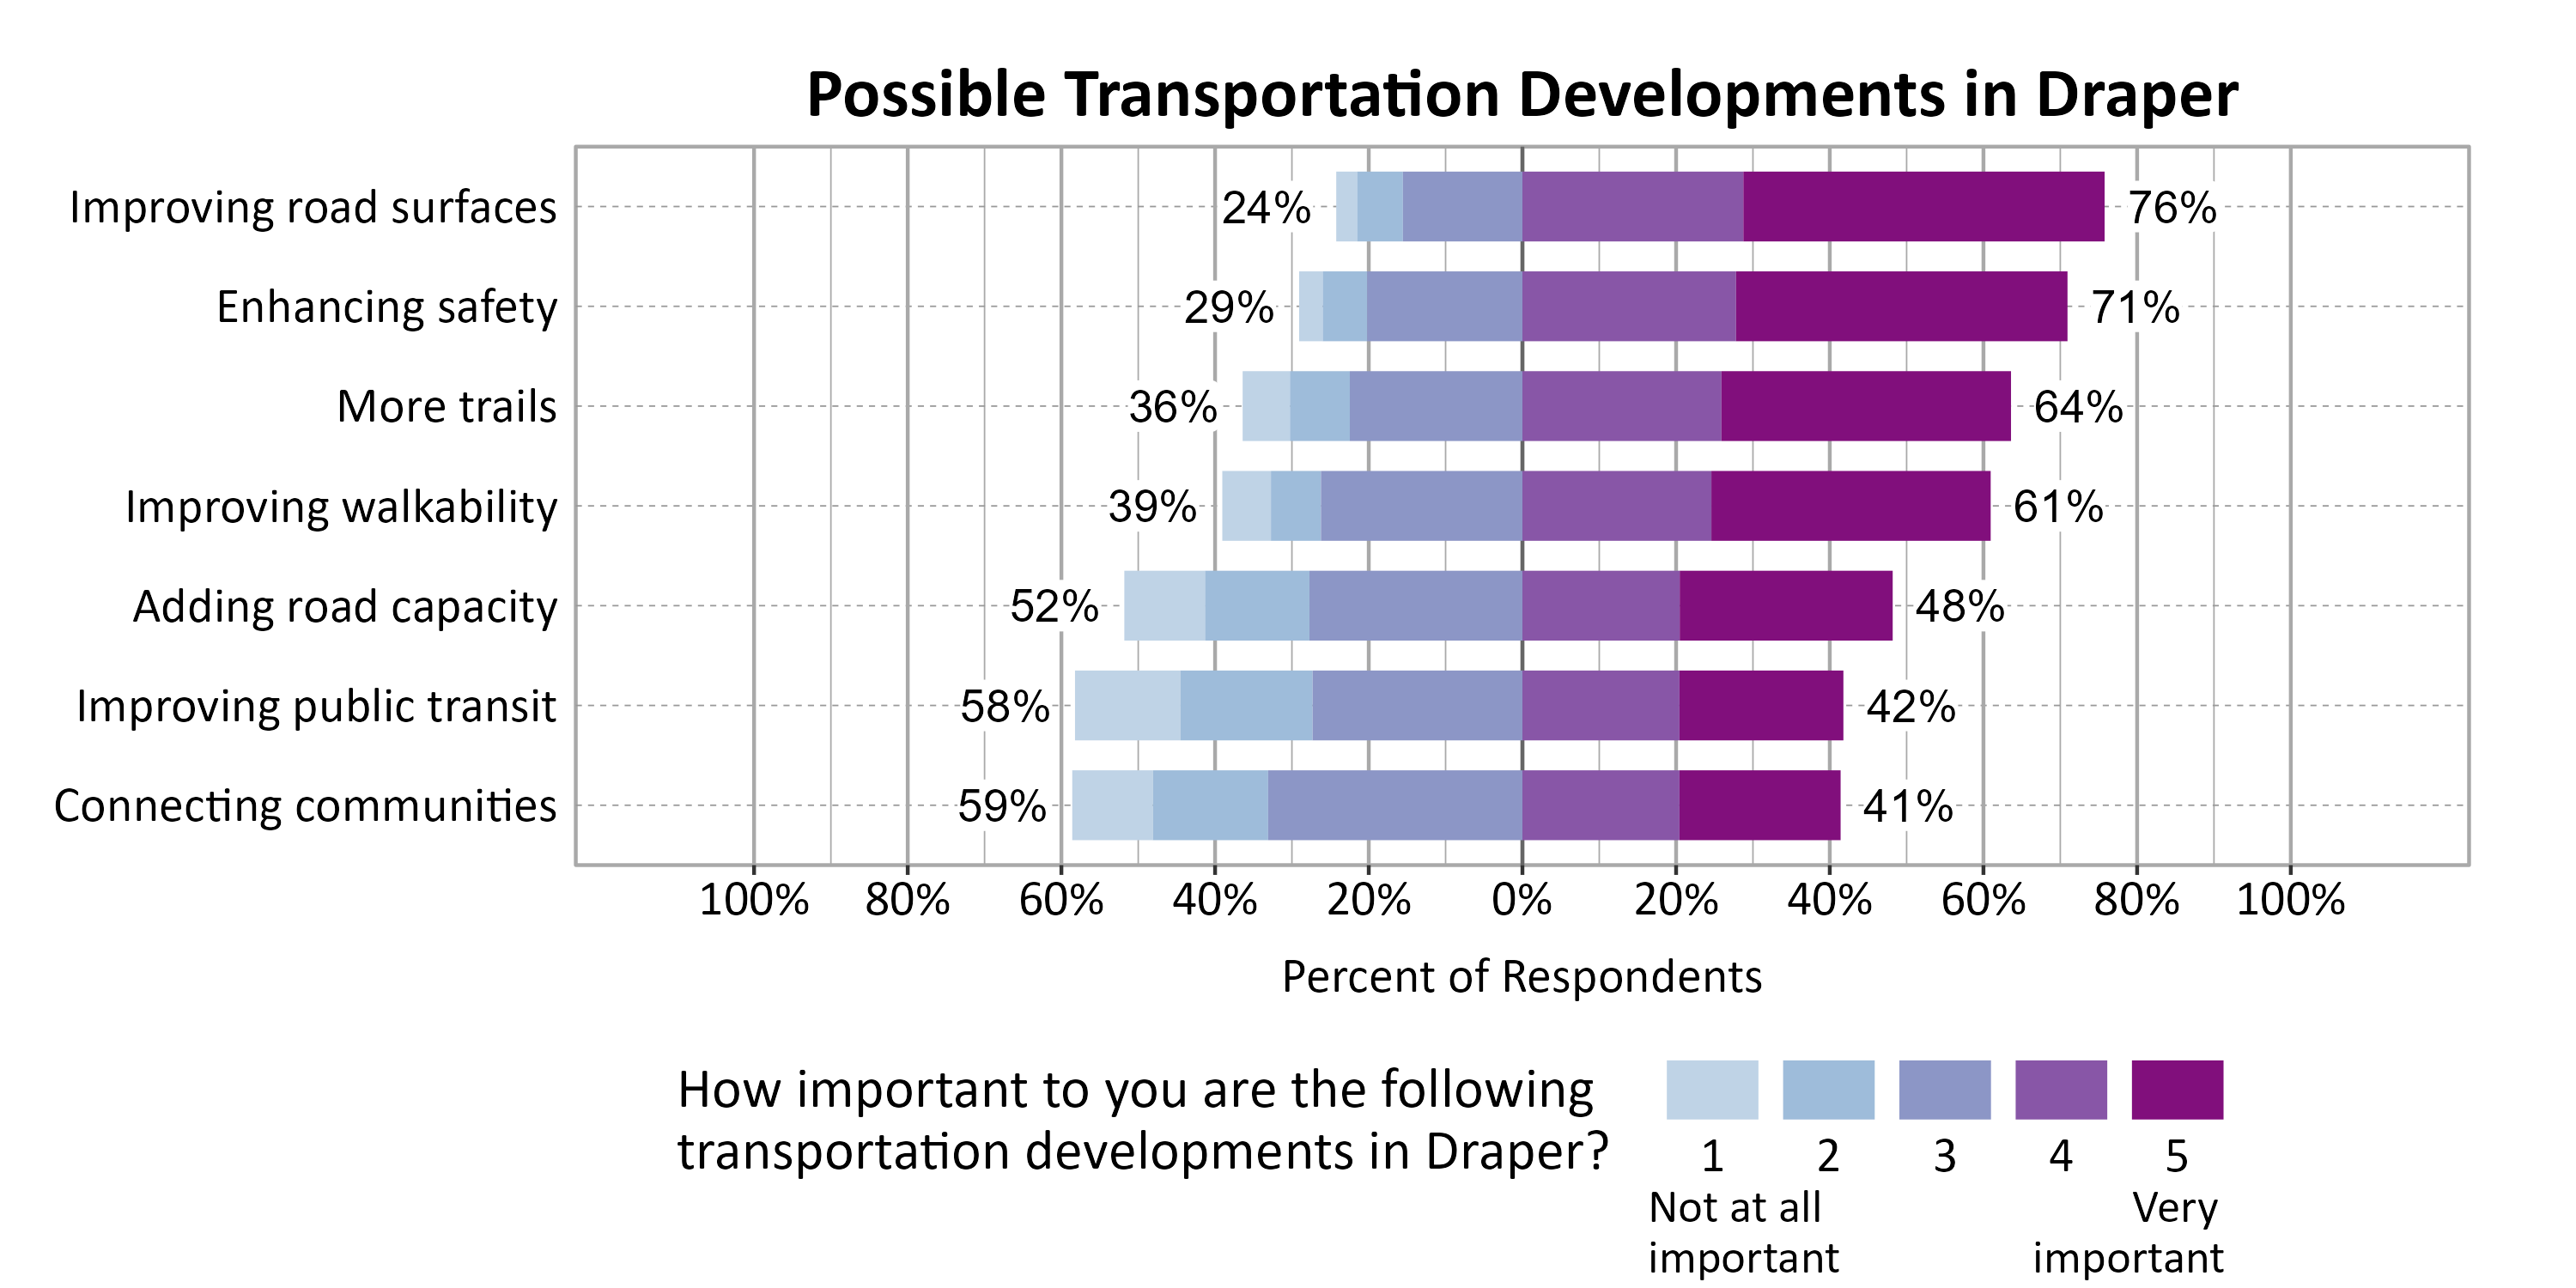
Respondents were asked to indicate the importance of a set of possible transportation developments in Draper. The most important development to respondents were Improving road surfaces (76%), Enhancing safety (71%), and More trails (64%).
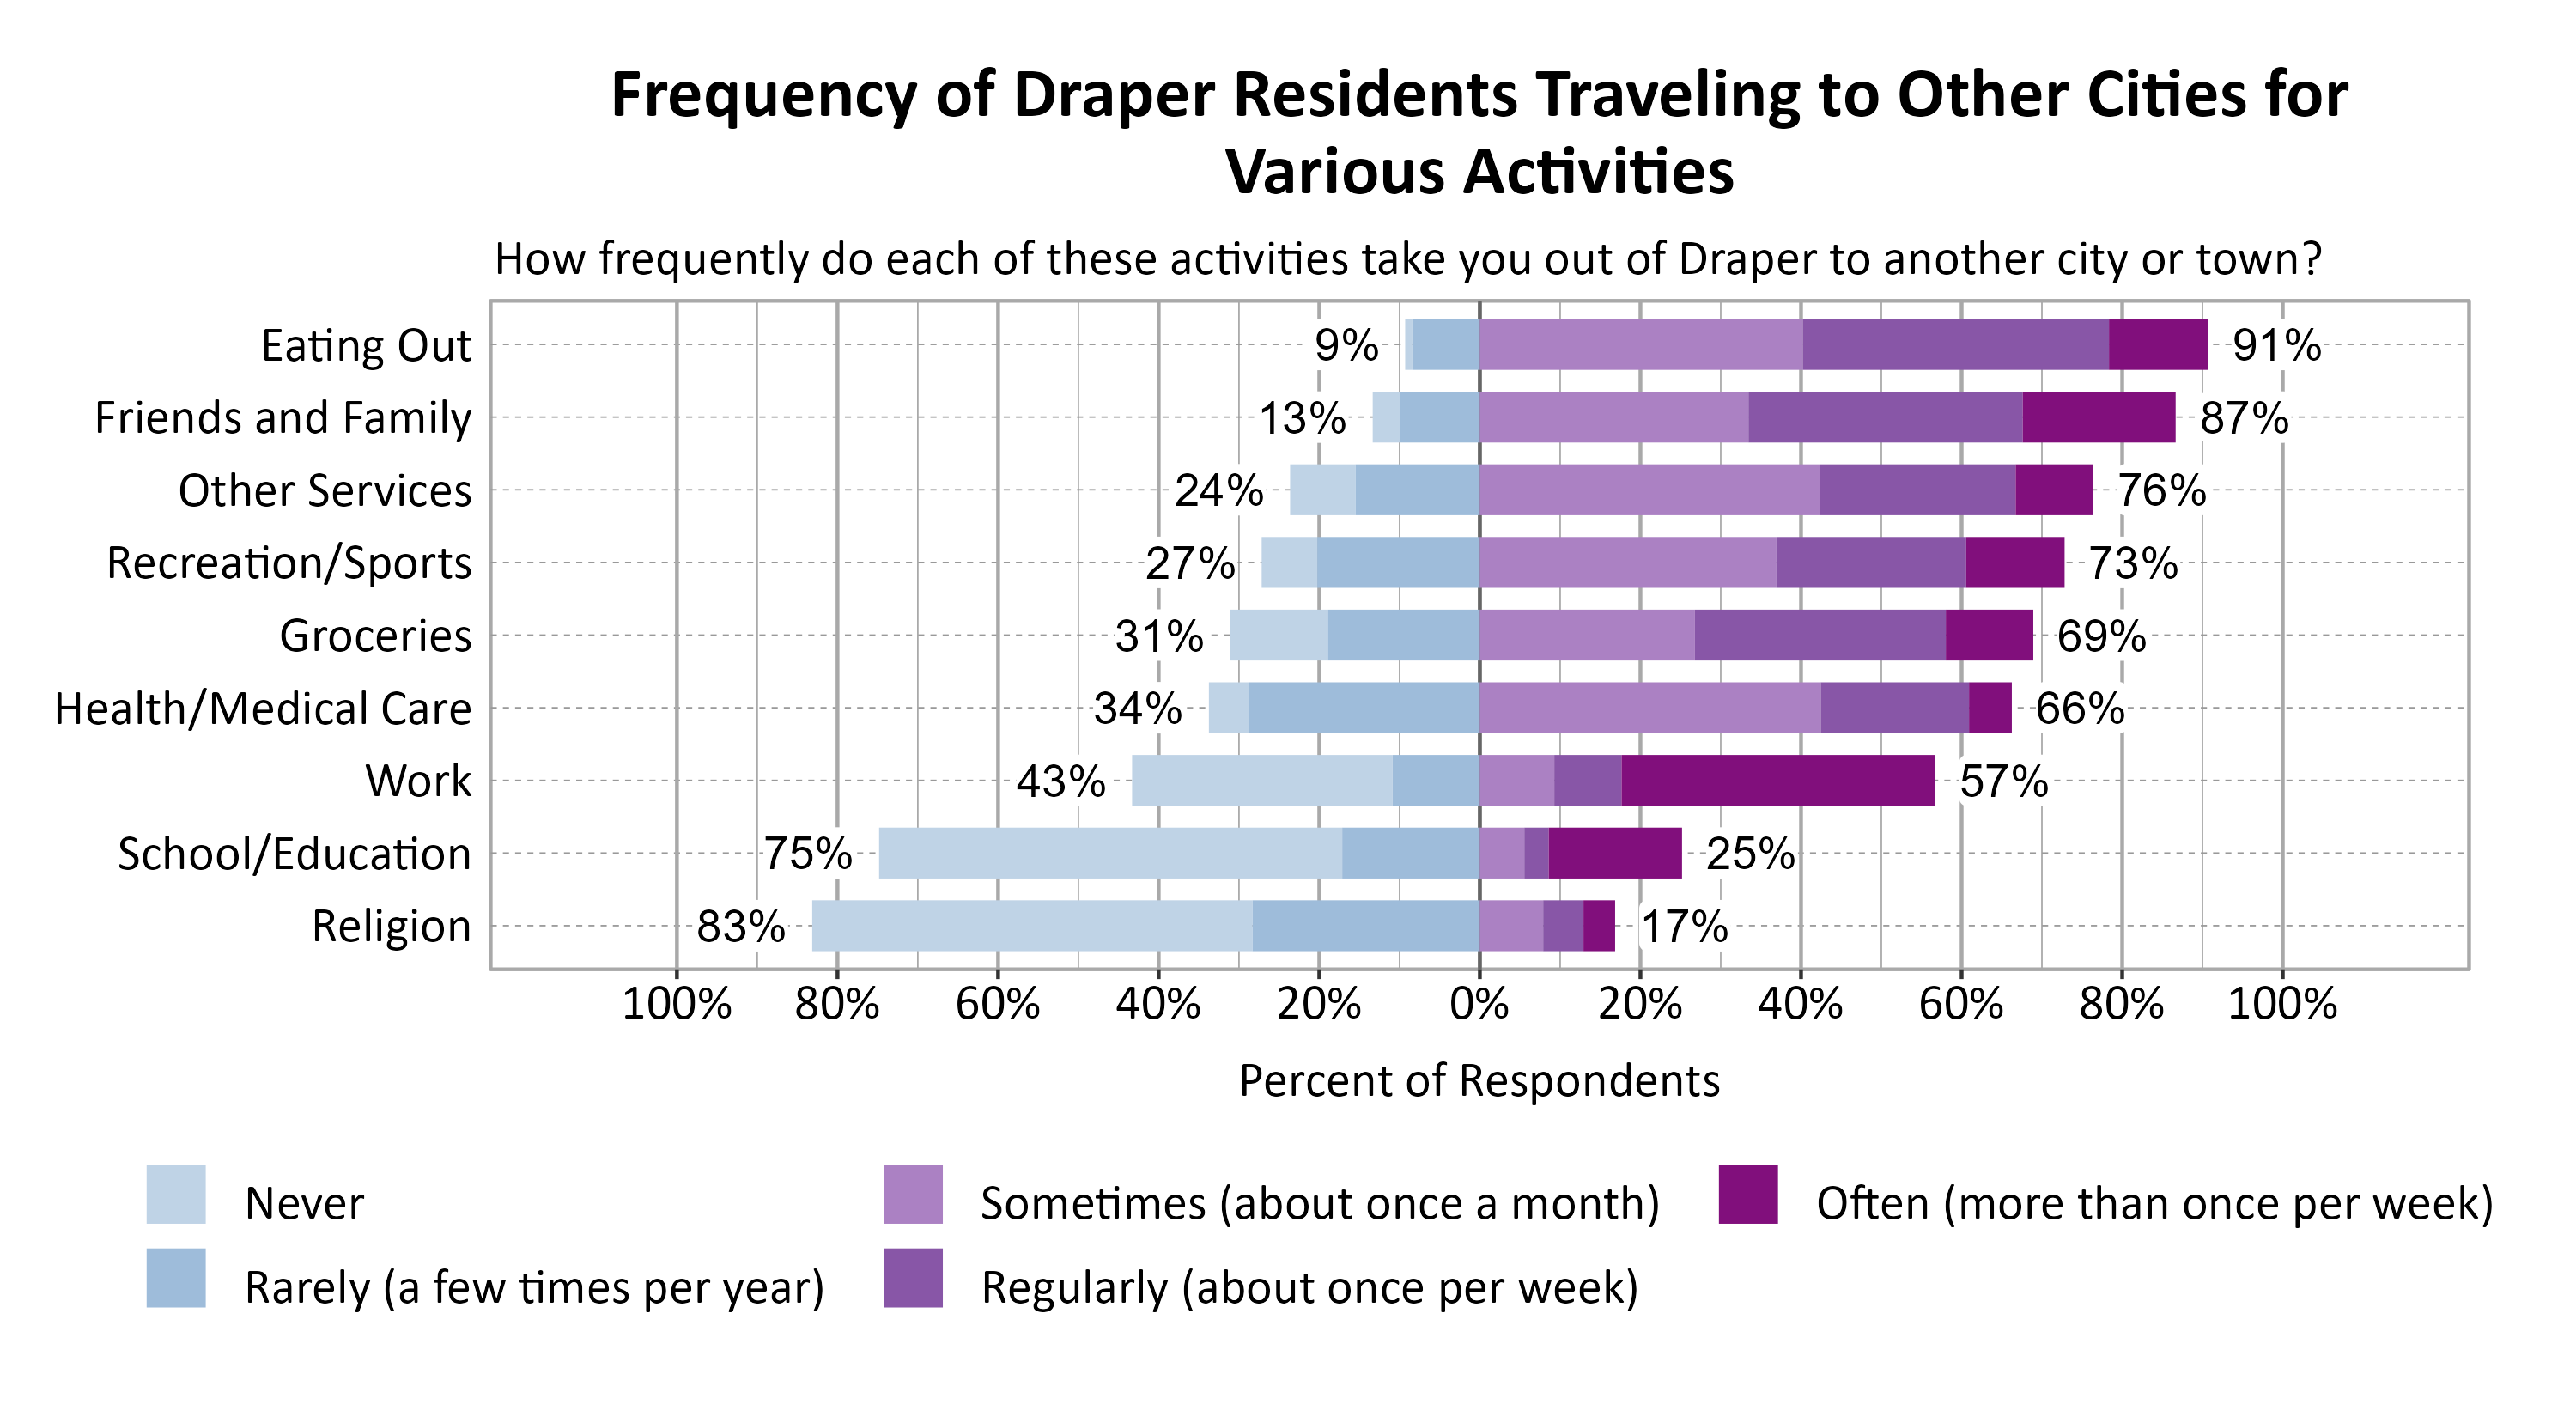
Respondents were asked to indicate how frequently various activities take them out of Draper to another city or town. The most commonly indicated reasons for traveling to another city or town at least sometimes or once a month were Eating Out (91%), Friends and Family (87%), and Other Services (76%).
Concerns in Draper
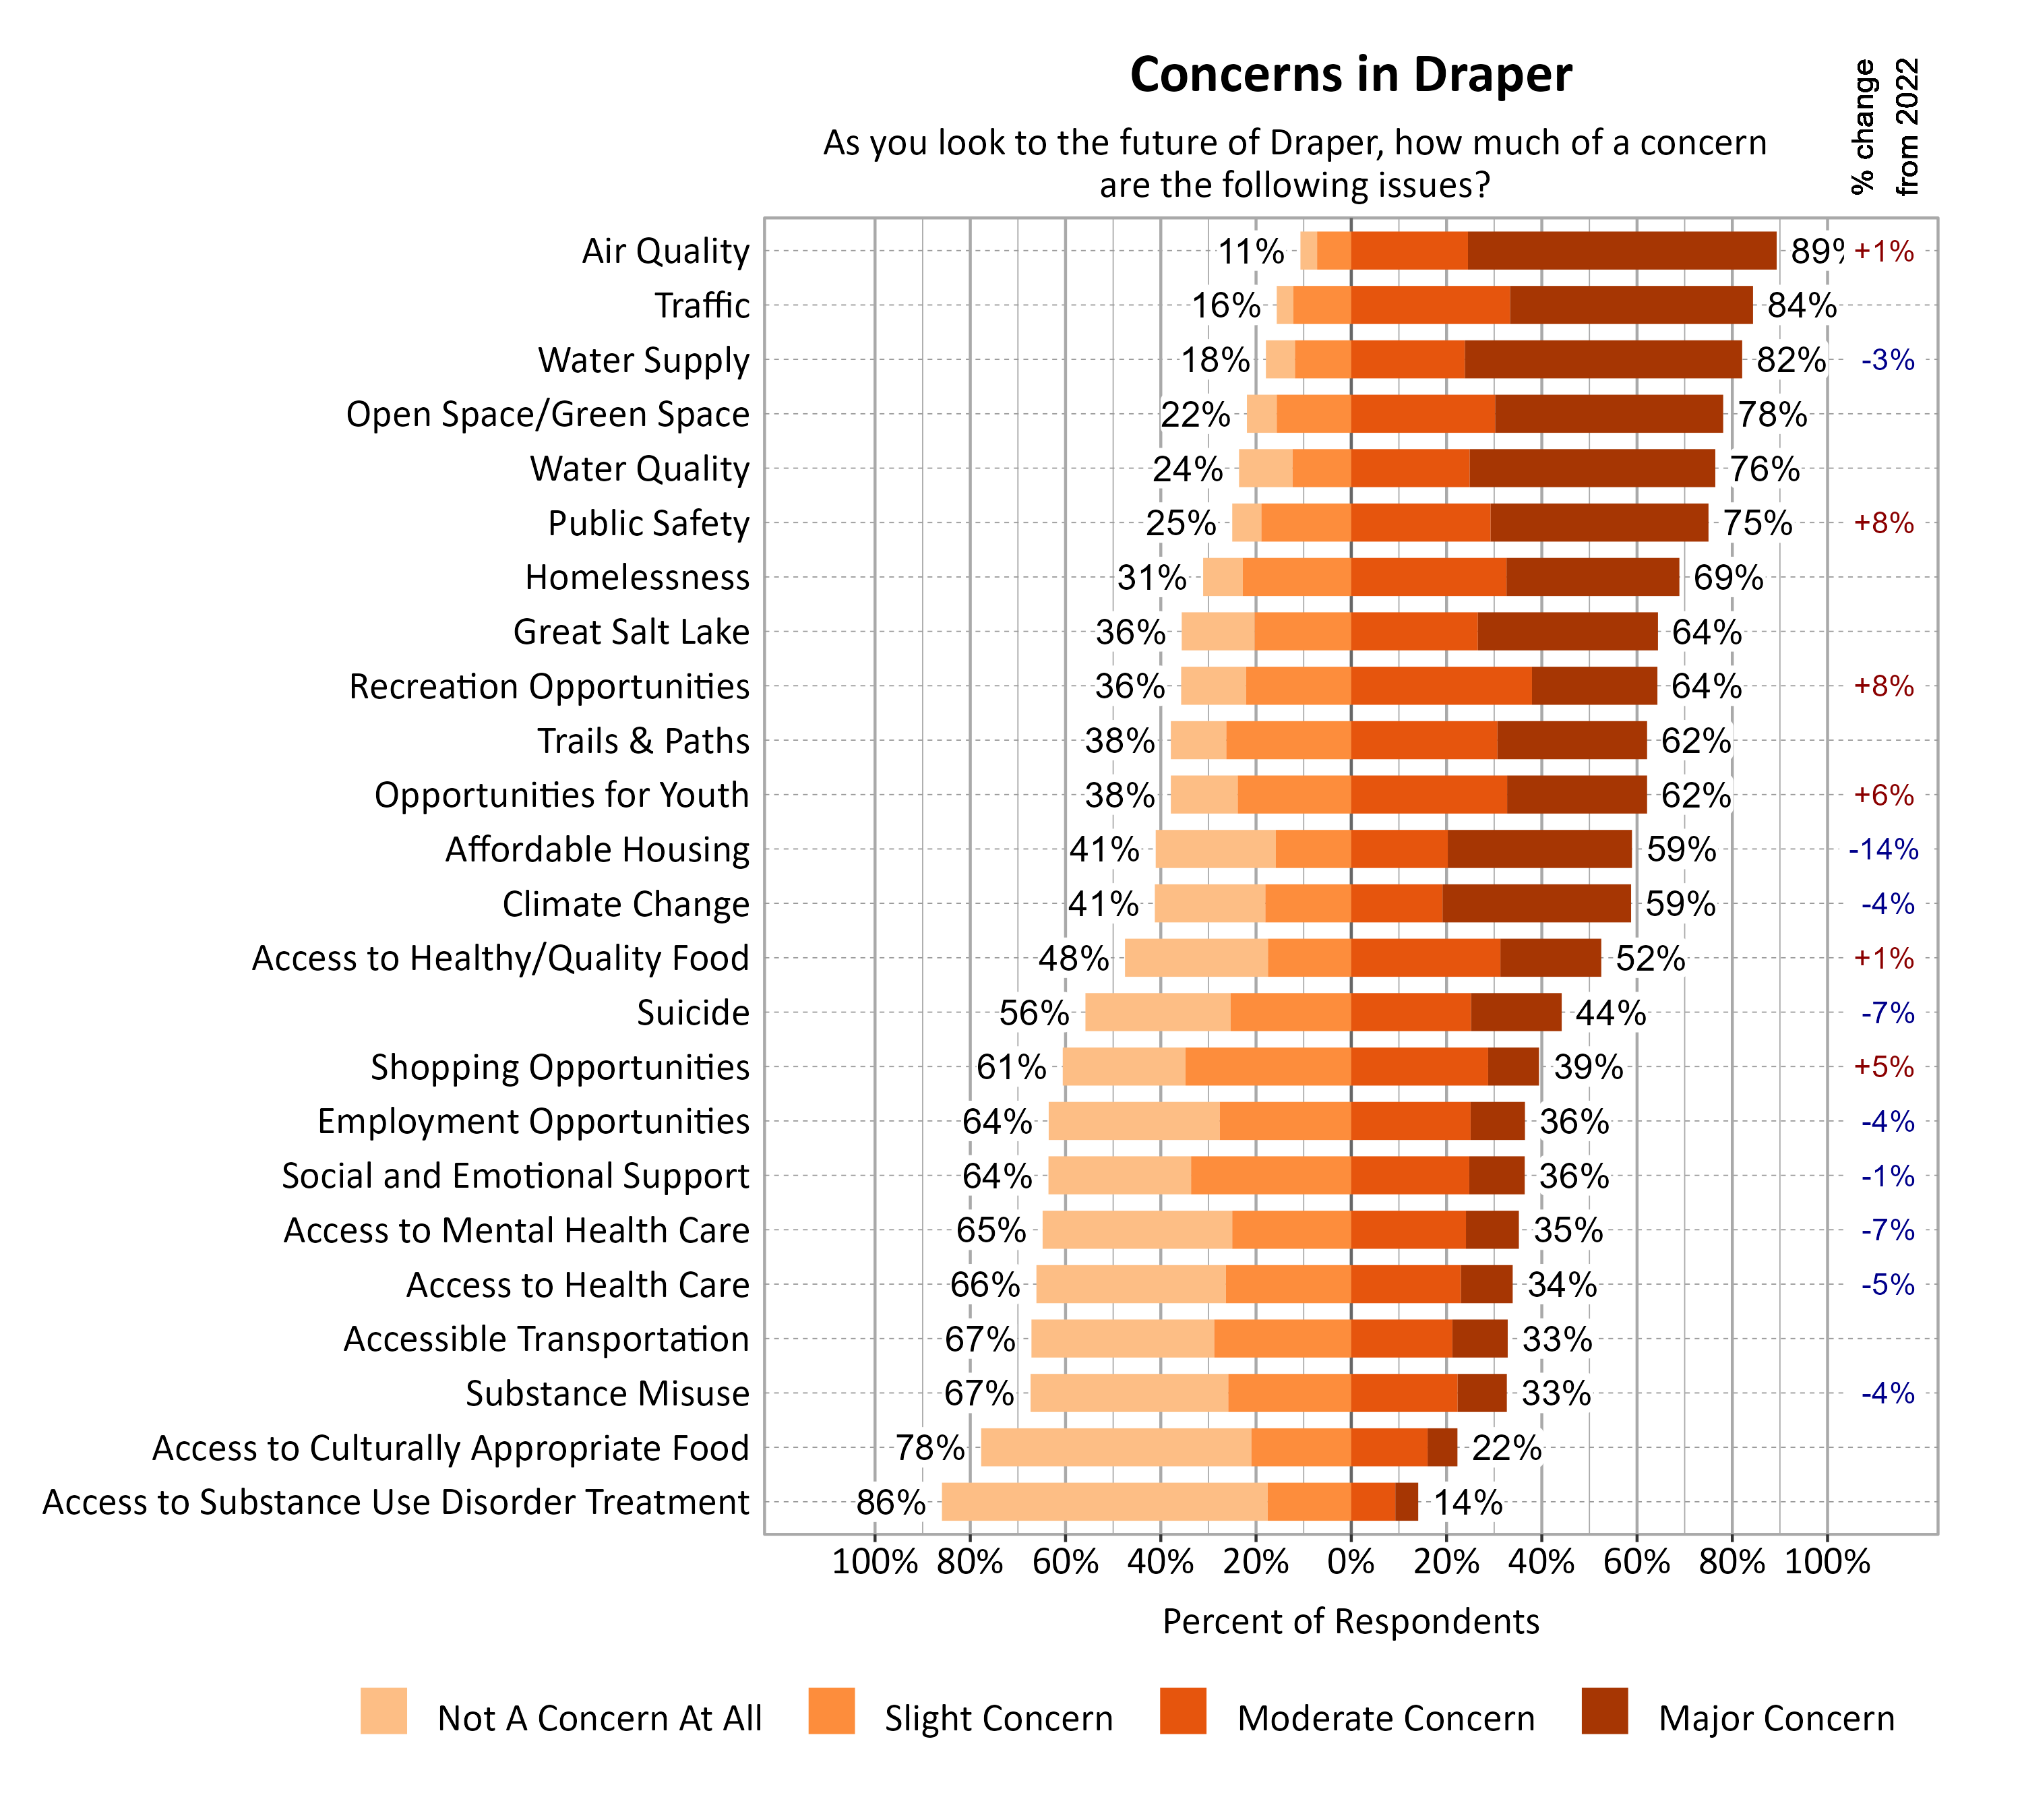
Survey respondents indicated the degree to which a number of possible local issues were a concern as they look to the future of Draper. Air Quality (89%), Traffic (84%), and Water Supply (82%) were the top concerns. Since 2022, moderate or major concern about affordable housing (-14%) notably decreased.
Open Comments
All open comments collected in the survey were shared with city leaders. General observations and themes are shared here.
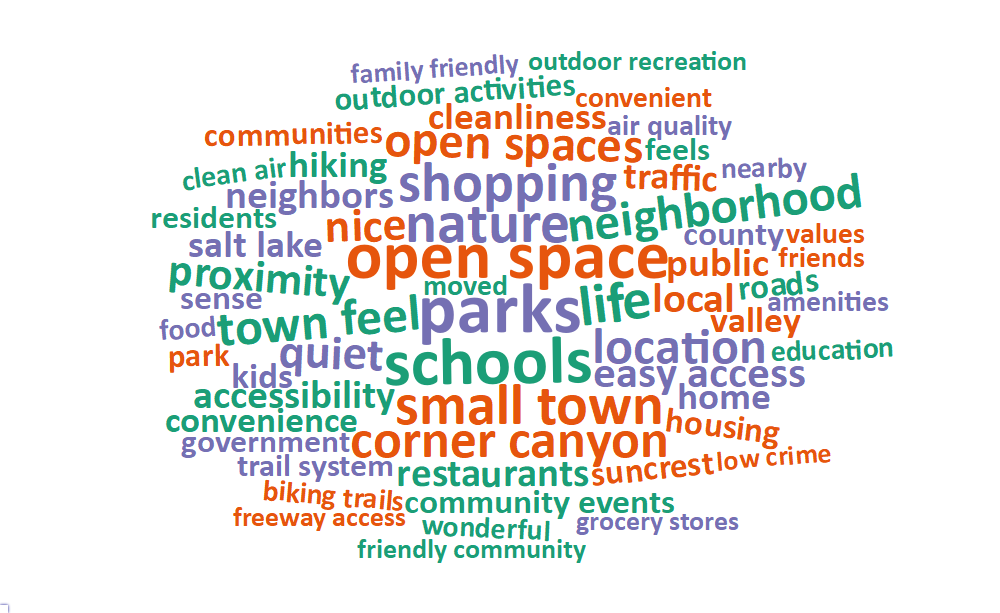
What Respondents Value Most in Draper
Survey respondents were asked to comment on what they value most about Draper. The most common words and phrases from all city comments are included in the word cloud below. It is possible that negative or unrelated words may appear since these words have been taken out of context, and they may not indicate the respondent’s intended meaning. Comments indicated that Draper residents highly value its community-oriented atmosphere. The comments emphasized safety, cleanliness, and accessibility to outdoor recreation such as trails and parks. The small-town feel was also valued as well as the beautiful views and close-knit neighborhood. The city’s location is valued for its convenient access to shopping, dining, and essential services while maintaining a serene environment with open spaces and low crime rates.
Local Environmental Quality in Draper
The 40% of respondents who rated the Local Environmental Quality domain as 1, 2, or 3 (Poor, Fair, or Moderate) were further asked if there are specific aspects of local environmental quality that they feel are problematic. Comments suggested that air quality in Draper is a major concern, particularly due to dust, inversions, the Great Salt Lake, and car emissions. The Geneva gravel pit was also a major concern with dust making the area seem dirty and frustrating residents. There was also a discussion around the expansion of Geneva as a point of tension. Growth was a common denominator for most of the issues listed. Water and green space were also notable concerns, but less prevalent.
Improving Wellbeing in Draper
Survey respondents were asked if there is anything that could be done to improve wellbeing in Draper. Many expressed frustration with the rapid expansion of high-density housing, which they believe is exacerbating traffic issues and diminishing the area’s small-town feel. The high cost of living and housing affordability were significant concerns, with some noting that it has become difficult for even middle-income families to buy homes in Draper. There was a call for more diverse amenities, including better restaurants, grocery stores, and recreational opportunities like trails and community centers. Environmental issues such as air quality and the impact of the expanding gravel pit were also major concerns. Many respondents indicated that they want to see better maintenance of roads and infrastructure, along with improved public transportation options. There was a strong desire for more cultural diversity and representation, as well as a need for affordable housing and better integration of different community areas like Suncrest. Traffic safety and the enforcement of laws were highlighted, with suggestions for better bike lanes and pedestrian safety measures.
Additional Comments
Respondents were also asked if they had any additional comments on wellbeing in Draper. Many respondents expressed that they loved living in Draper and its quality of life. Residents value the quiet and safety of Draper but expressed concerns about over-development, traffic issues, and road quality. Many appreciated community events and outdoor opportunities but emphasized the need for better infrastructure, more diverse cultural activities, and improved services like mental health support and affordable housing options. Some expressed frustration with noise, traffic violations, and lack of inclusivity, particularly concerning religious and cultural diversity.