Herriman Wellbeing Survey Findings 2024
By Dr. Courtney Flint and Team
![]()
Contact Information
Dr. Courtney Flint
courtney.flint@usu.edu
435-797-8635
Summary
Herriman is one of 51 cities participating in the Utah Wellbeing Survey Project in 2024. This project is designed to assess the wellbeing and local perspectives of city residents and to provide information to city leaders to inform general planning processes. Additional analysis is underway and this report may be updated over time.
We are grateful to all those who took the survey and to our city partners who helped to make this possible. We are grateful to a number of entities for funding: the Utah League of Cities and Towns, USU Extension, USU’s Institute for Land Water and Air, the Wasatch Front Regional Council, Utah Department of Transportation, the Utah Agricultural Experiment Station, and the cities of Alpine, Cedar Hills, Draper, Millcreek, Nephi, North Salt Lake, Ogden, Orem, Pleasant Grove, Providence, Springdale, Tremonton, West Bountiful, and West Valley City.
This report describes findings from the 2024 Herriman survey and comparative information with other project cities. In April and May 2024, Herriman City advertised the survey for residents largely through newsletters. All city residents age 18+ were encouraged to take the online Qualtrics survey.
How many people responded?
- 131 viable surveys were recorded in this 2024 survey effort.
- The Herriman 2022 survey had 136 responses and the Herriman 2021 survey had 231 responses and the Herriman 2020 survey had 375 responses.
- The adult population of Herriman was estimated at 35,051, based on the American Community Survey by the U.S. Census. The 131 survey responses in 2024 represent 0.4% of the adult population and have a conservative margin of error of 8.55%.
Survey Respondent Characteristics
| Resident Statistics | |
|---|---|
| Full Time Residents of Herriman | 98.5% |
| Part Time Residents of Herriman | 1.5% |
| Length of Residency — Range | 0.1-45 years |
| Length of Residency — Average | 9.9 years |
| Length of Residency — Median | 8 years |
| Length of Residency 5 Years or less | 37.4% |
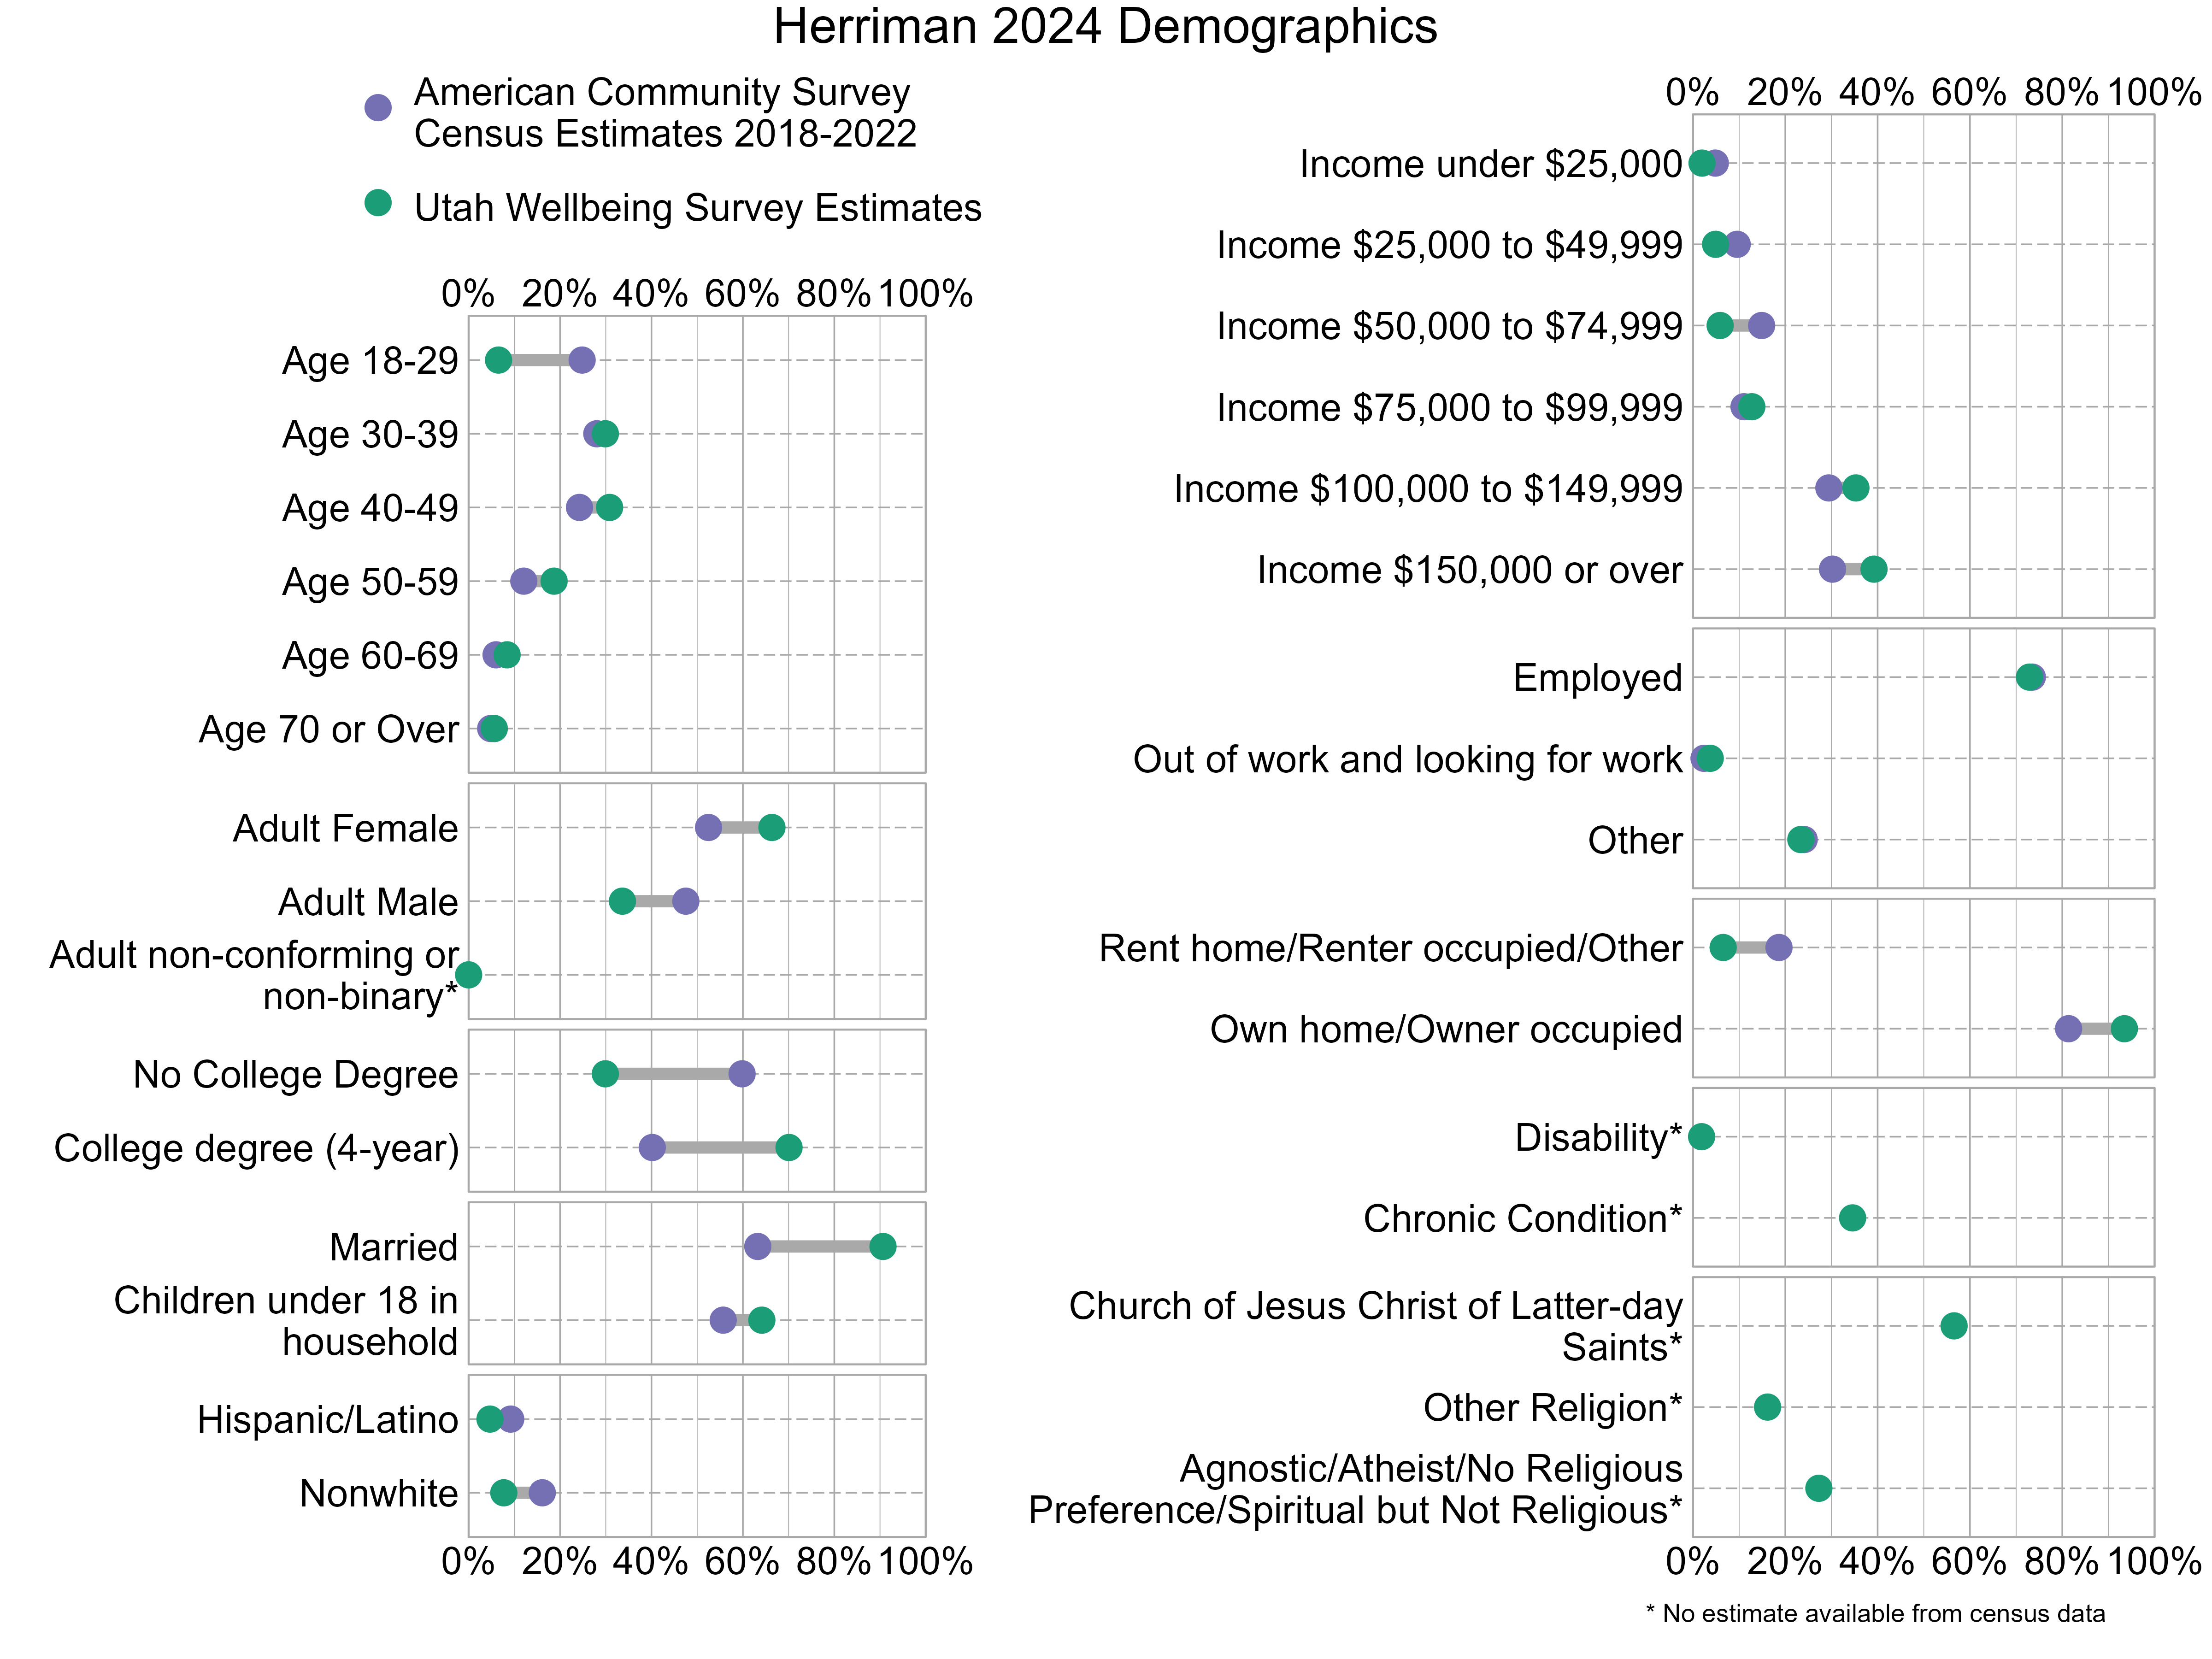
Demographic characteristics of the survey respondents were compared below with U.S. Census information from the 2018-2022 American Community Survey. In the graph below, gray bars indicate differences between the American Community Survey estimates and the Utah Wellbeing Project surveys. The wider the gray bars, the larger the differences. Also note that estimates for religious affiliation, adult non-conforming or non-binary gender, disability, and chronic conditions are unavailable from the census data. There can also be a variable margin of error in the American Community Survey estimates, and caution should be used when comparing estimates. Not all respondents provided demographic information. As the graph shows, 2024 survey respondents were not fully representative of Herriman. People who have at least a 4-year college degree and are married were overrepresented while those who are age 18-29 and do not have a college degree were underrepresented.
Overall Personal Wellbeing and Overall Wellbeing in Herriman
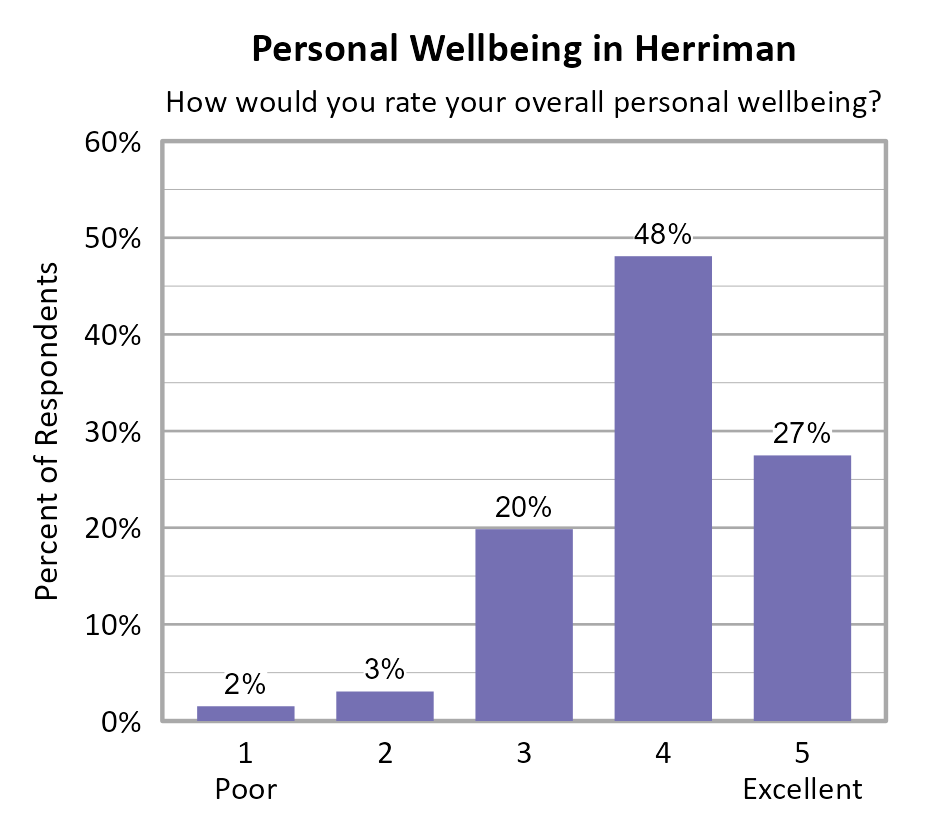
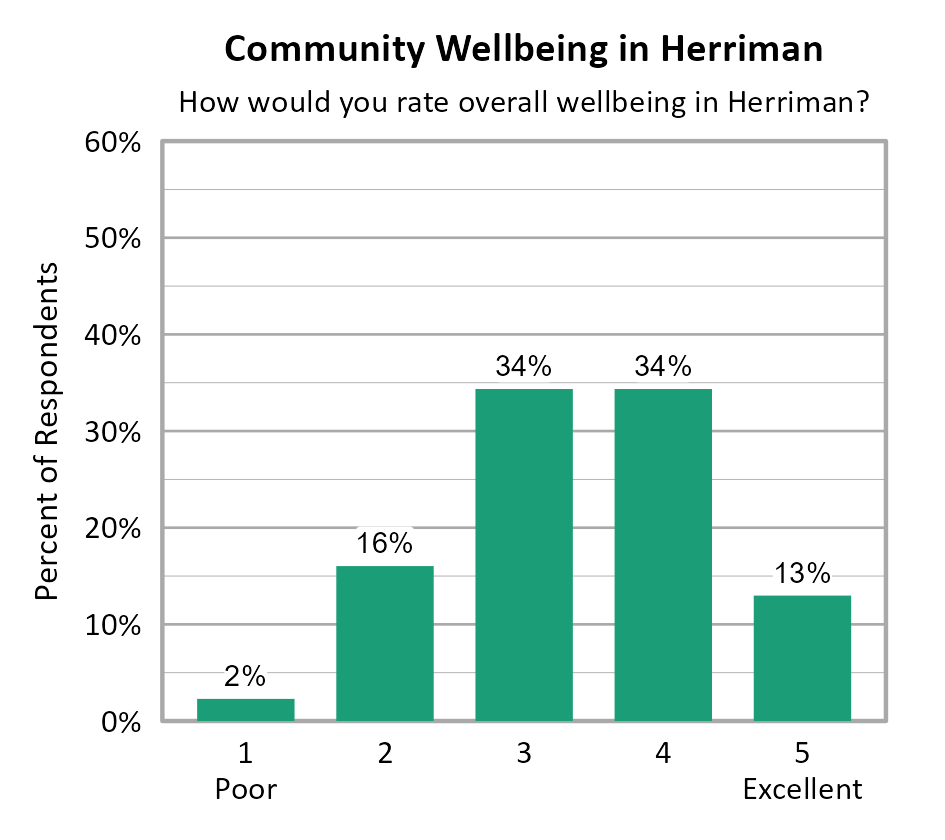
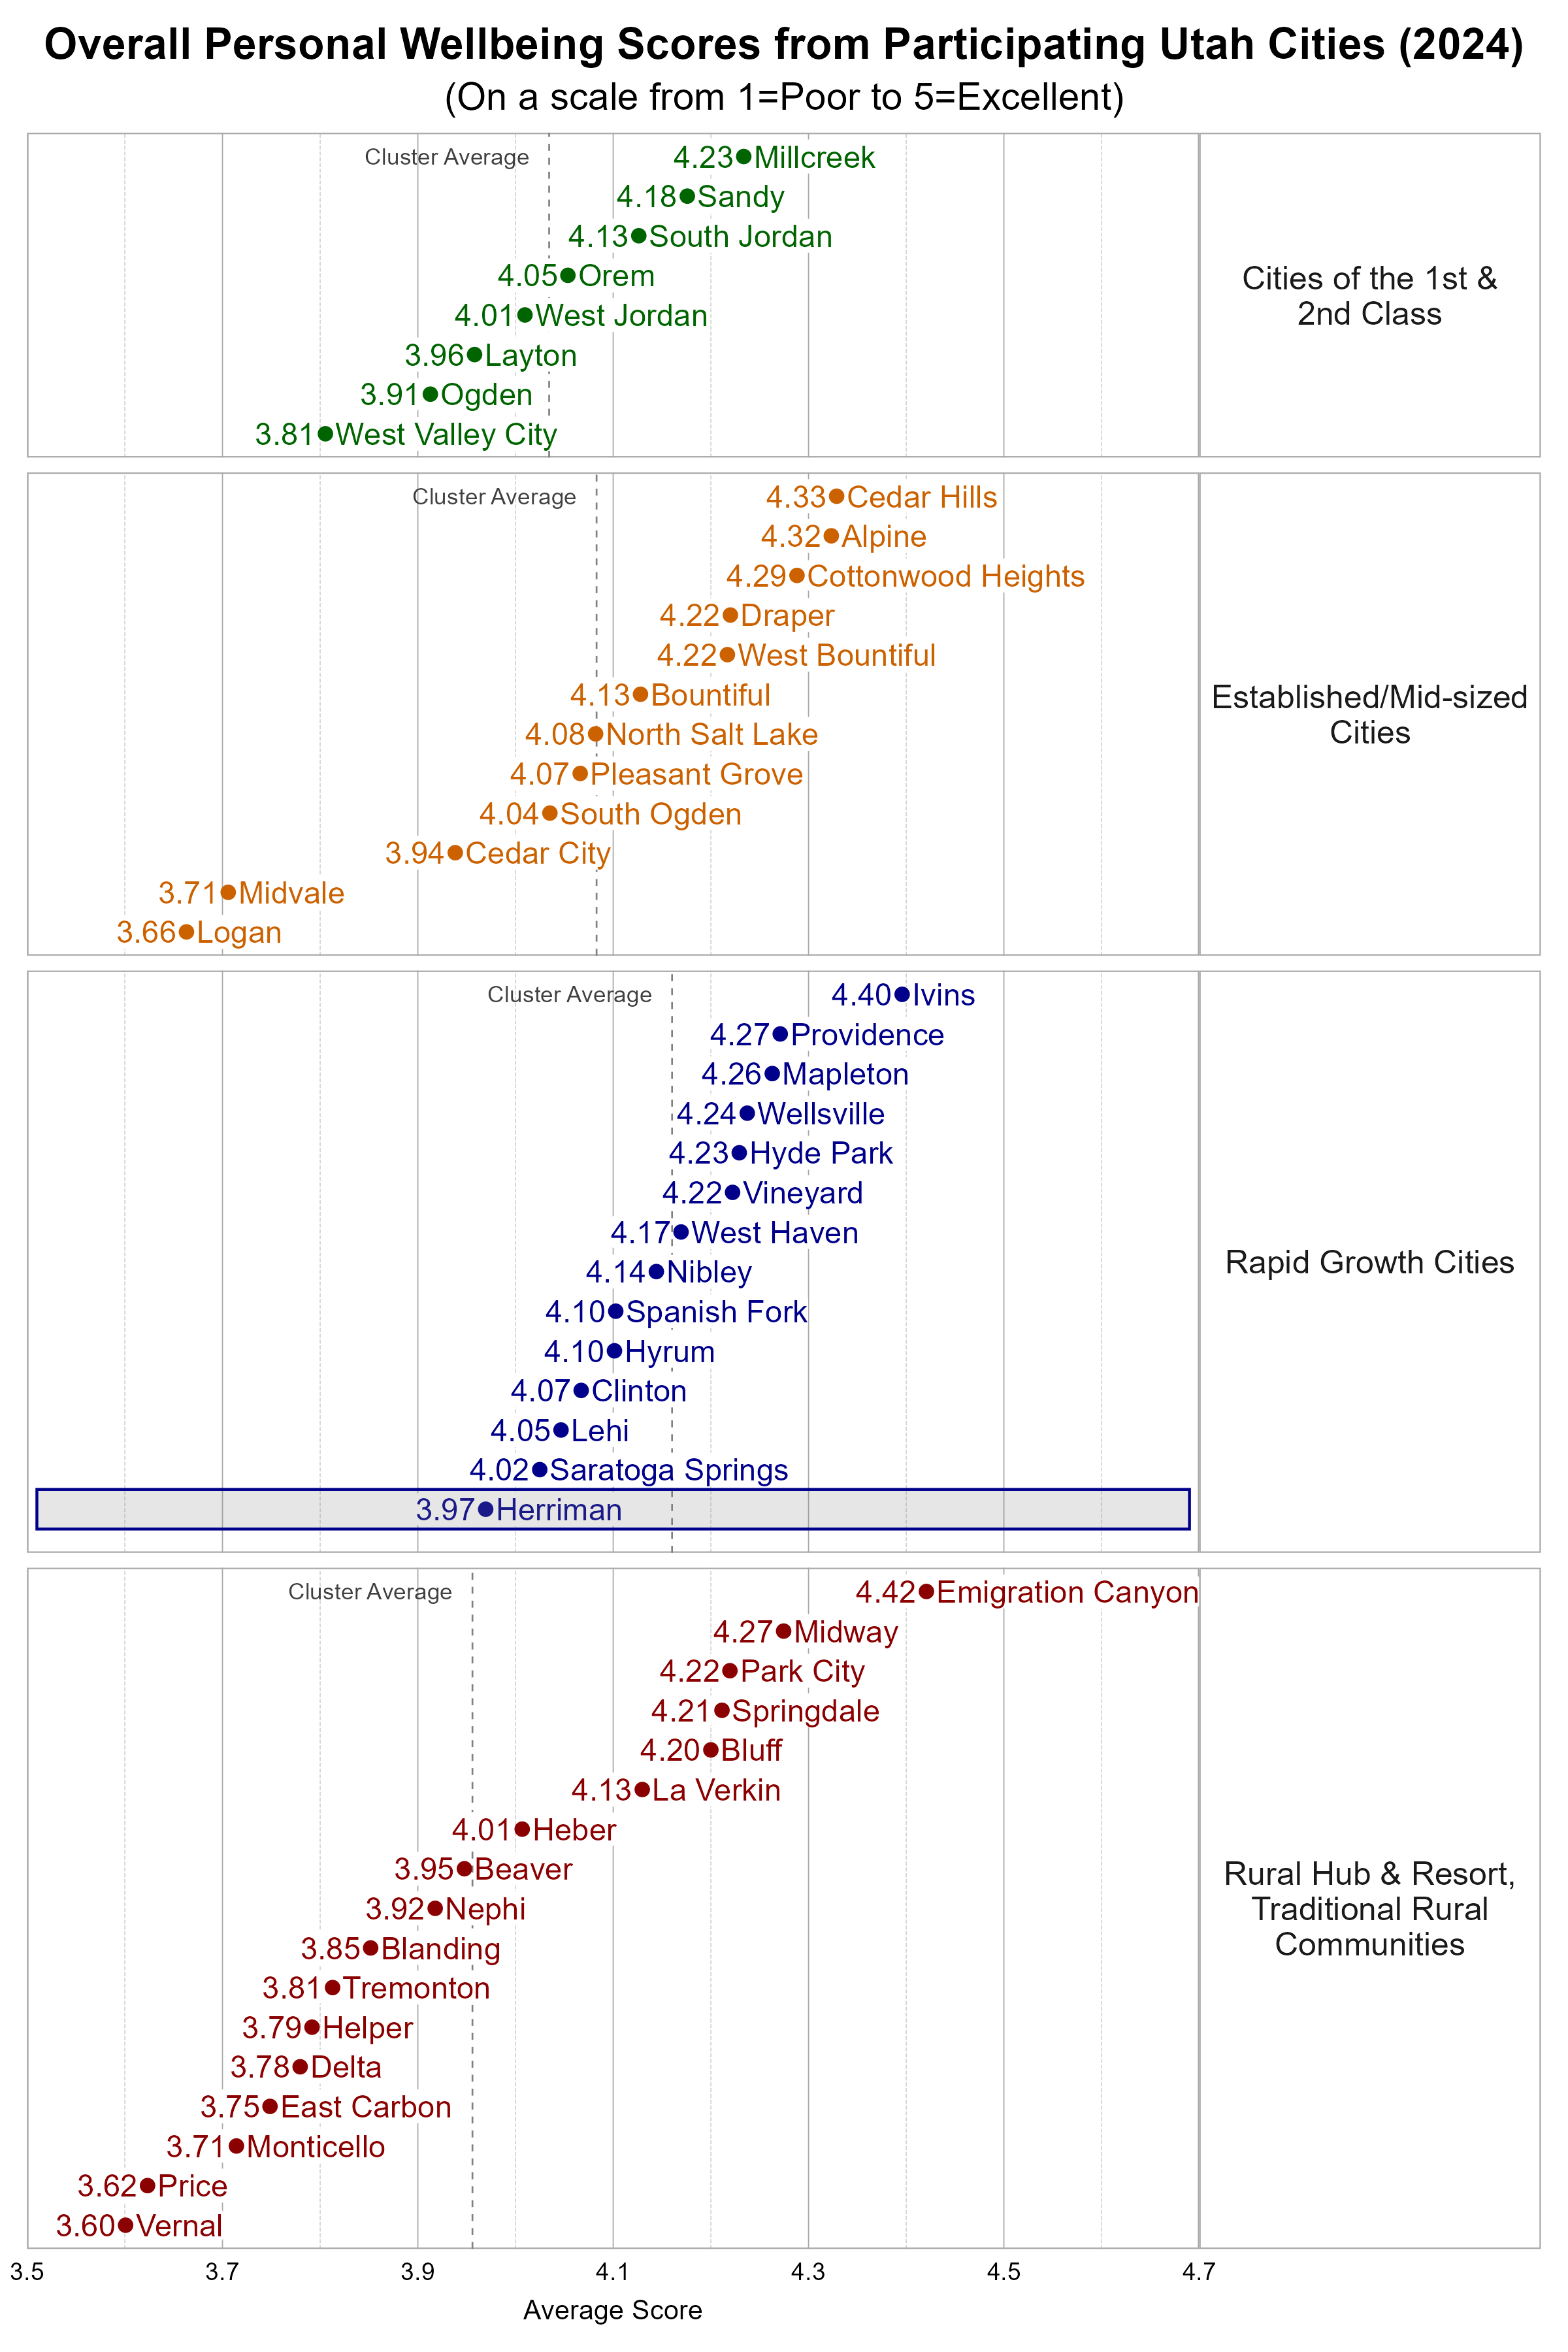
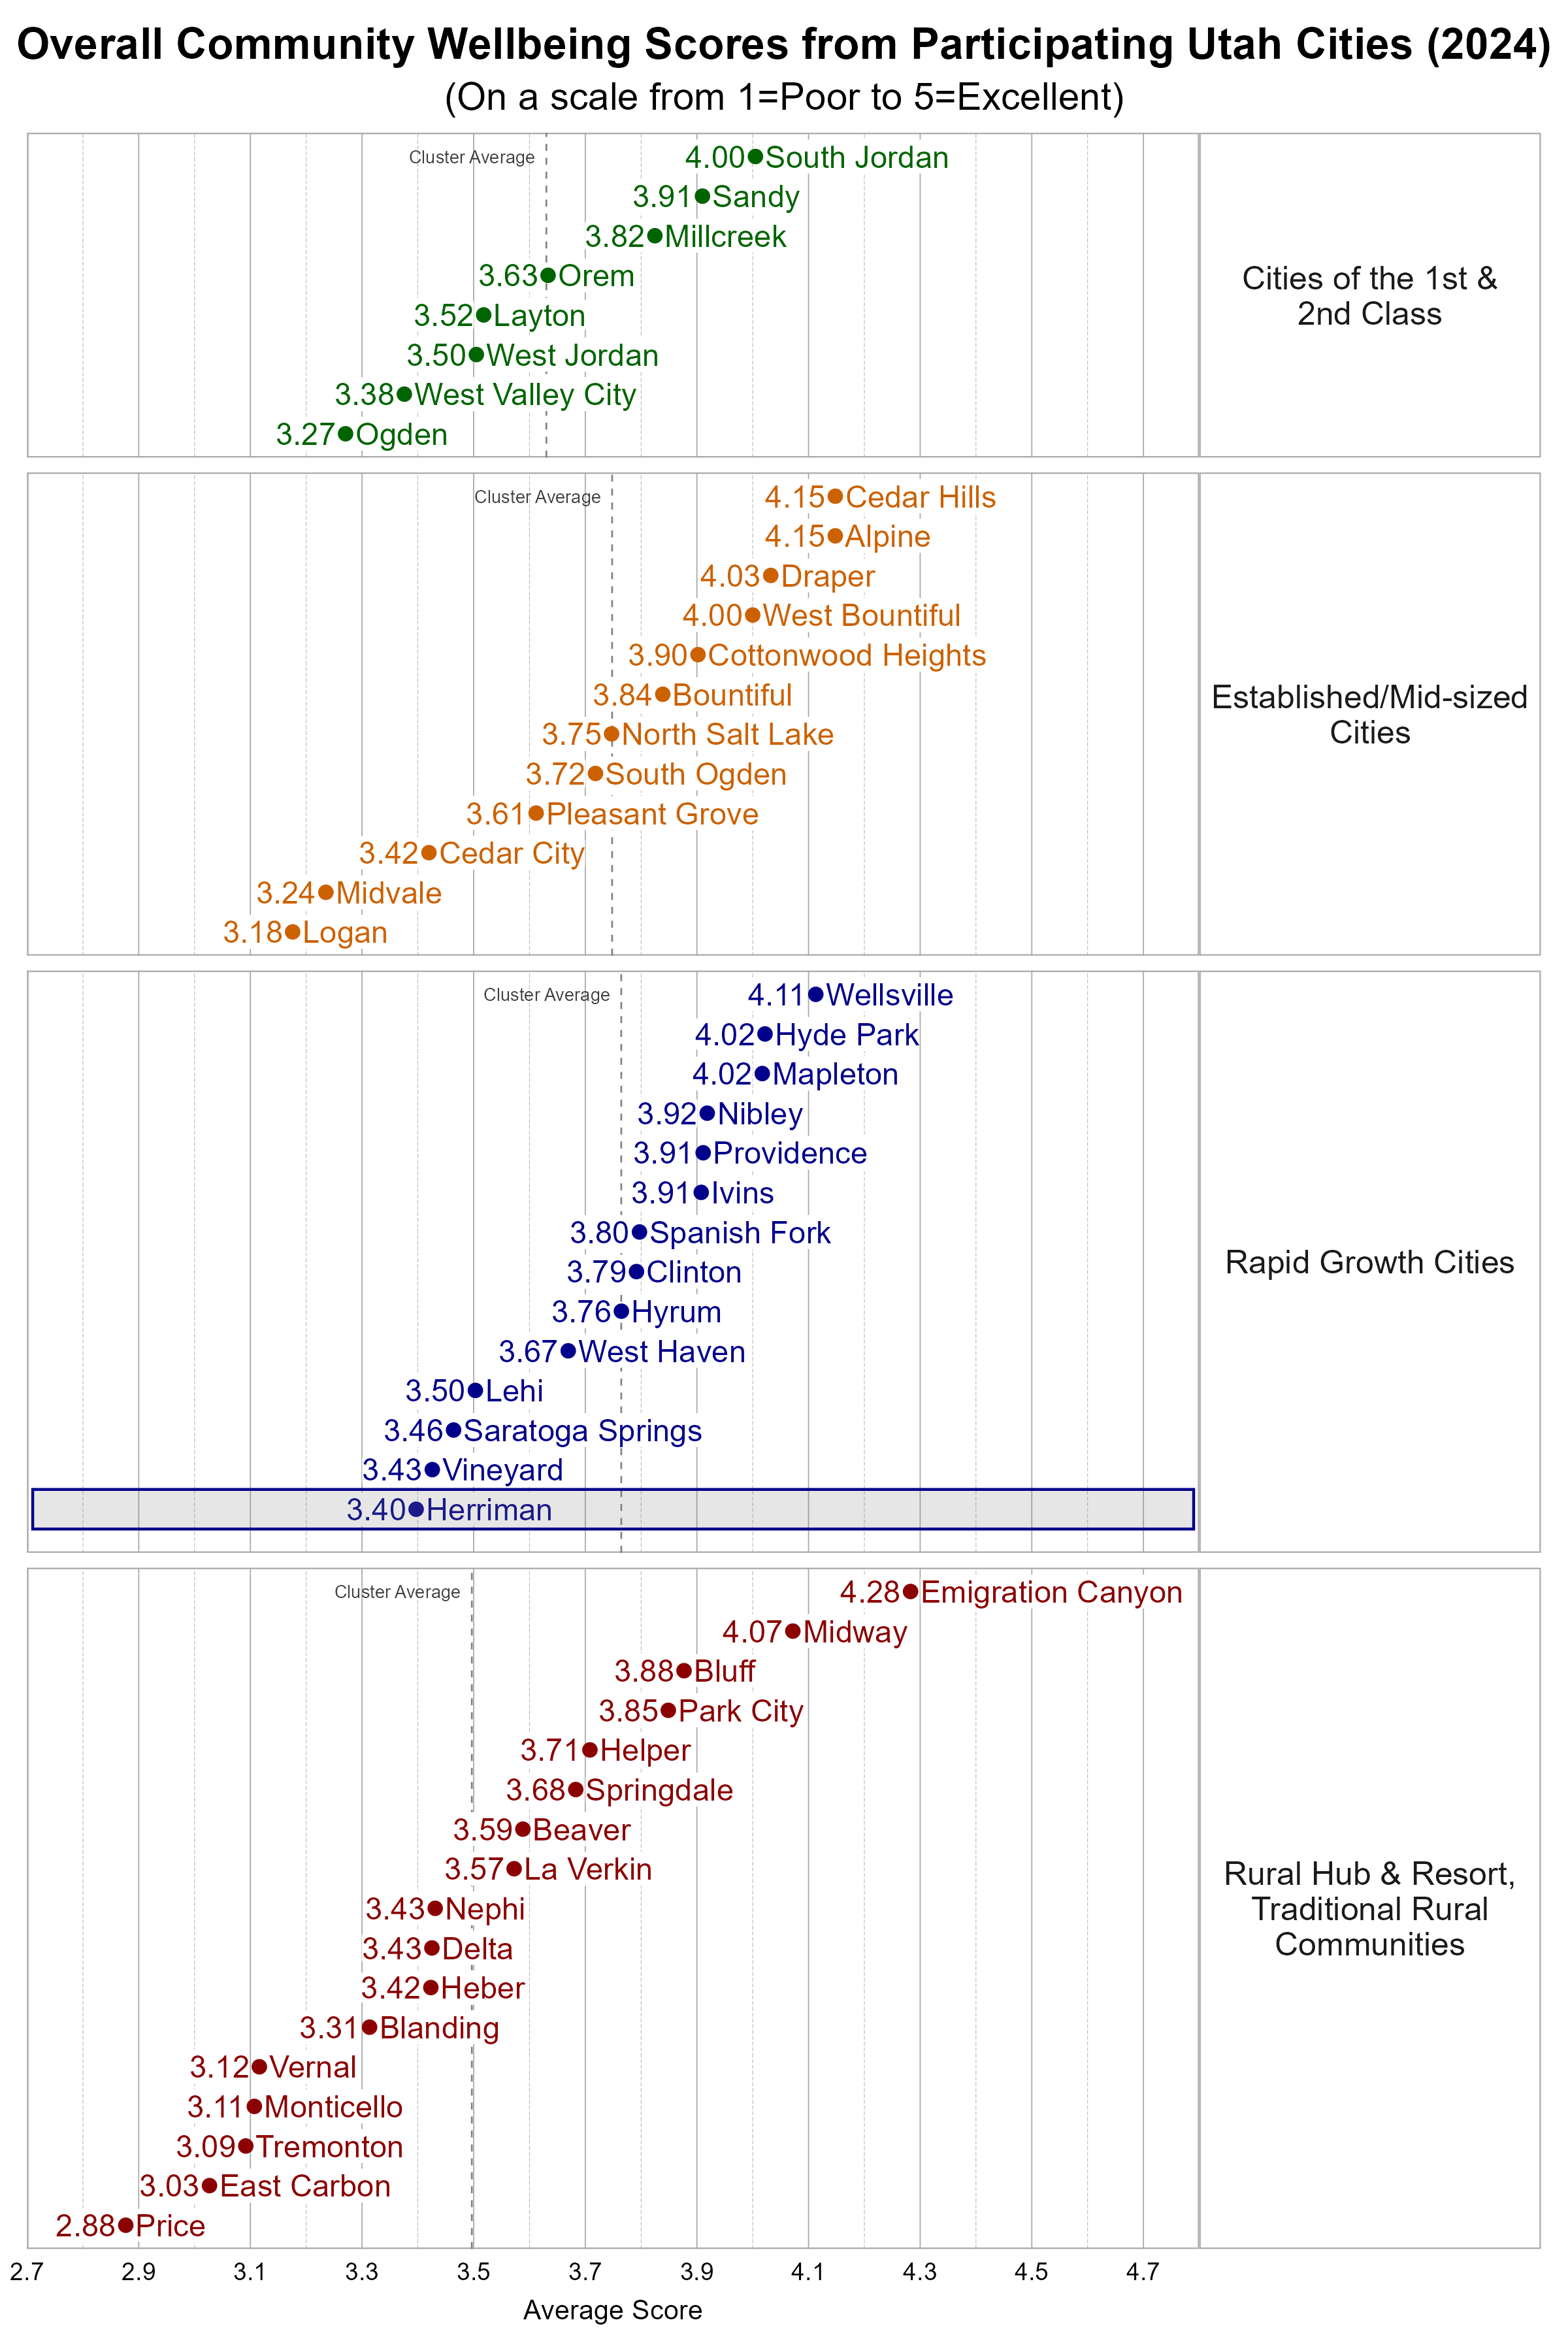
Survey participants were asked about their overall personal wellbeing and overall community wellbeing in Herriman. These wellbeing indicators were both measured on a 5-point scale from poor (1) to excellent (5). The average personal wellbeing score in Herriman was 3.97 with 76% of respondents indicating their wellbeing at a 4 or 5 on the 5-point scale. The average score for community wellbeing in Herriman was 3.40 with 47% of respondents indicating community wellbeing at a 4 or 5 on the 5-point scale.
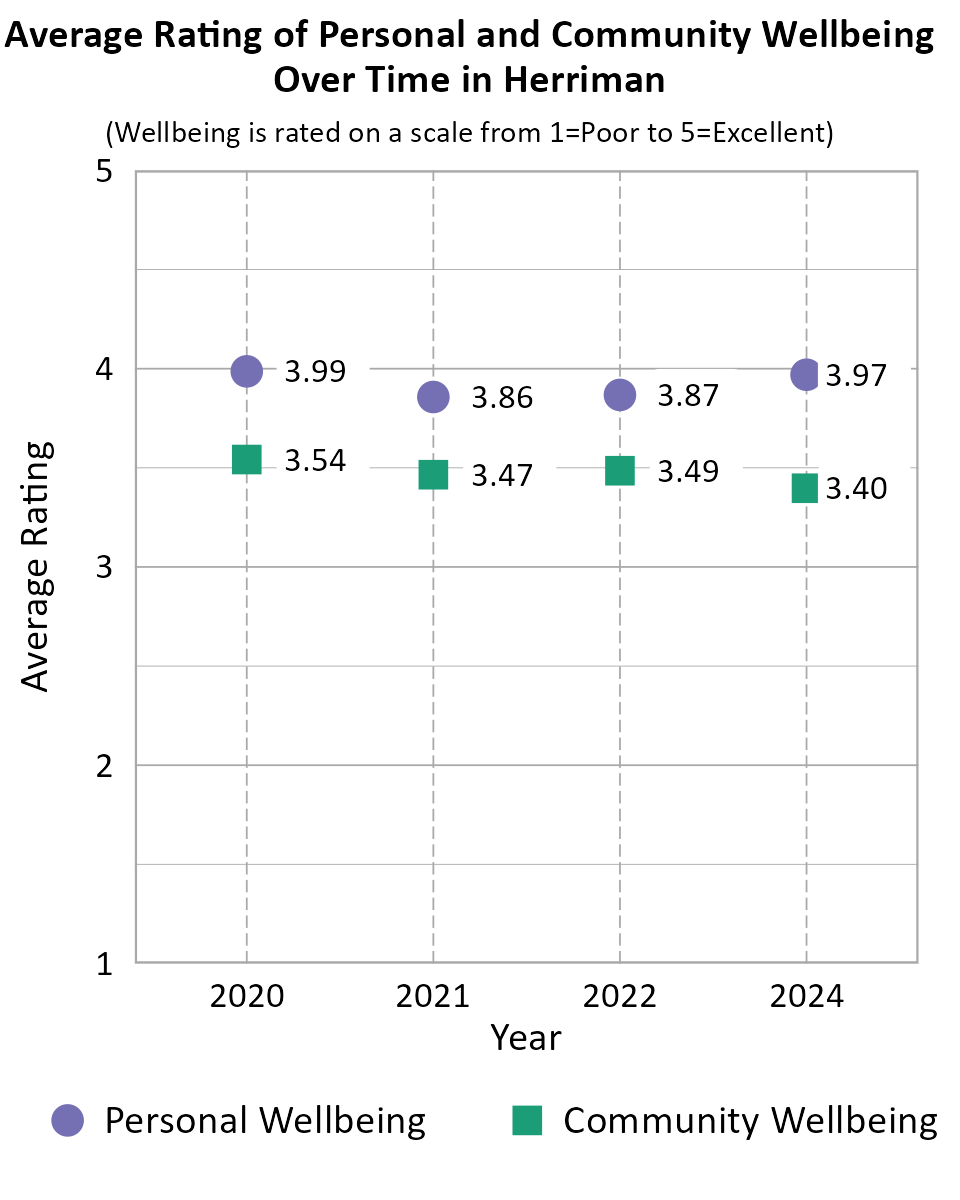
When comparing survey data from Herriman over the years as shown in the information below, we can see that the average personal wellbeing score declined between 2020 and 2021, and remained nearly the same between 2021 and 2022, and improved between 2022 and 2024. The average community wellbeing score declined between 2020 and 2021, and remained nearly the same between 2021 and 2022, and declined between 2022 and 2024. Note that the number of respondents differed between years, there is no tracking of individuals from one year to the next, and the low end of the scale was "Poor" in 2024 but "Very Poor" in prior years which may account for differences in scores over time.
Comparing Wellbeing Across Utah Cities
The Utah League of Cities and Towns clusters cities and towns into five different categories based on size and growth rates. We utilize these clusters in our analysis. Herriman is classified as a Rapid Growth City. Some cities may fit within more than one cluster.
Within the Rapid Growth city cluster, Herriman was below the average overall personal wellbeing score and below the average overall community wellbeing score.
Wellbeing Domains in Herriman
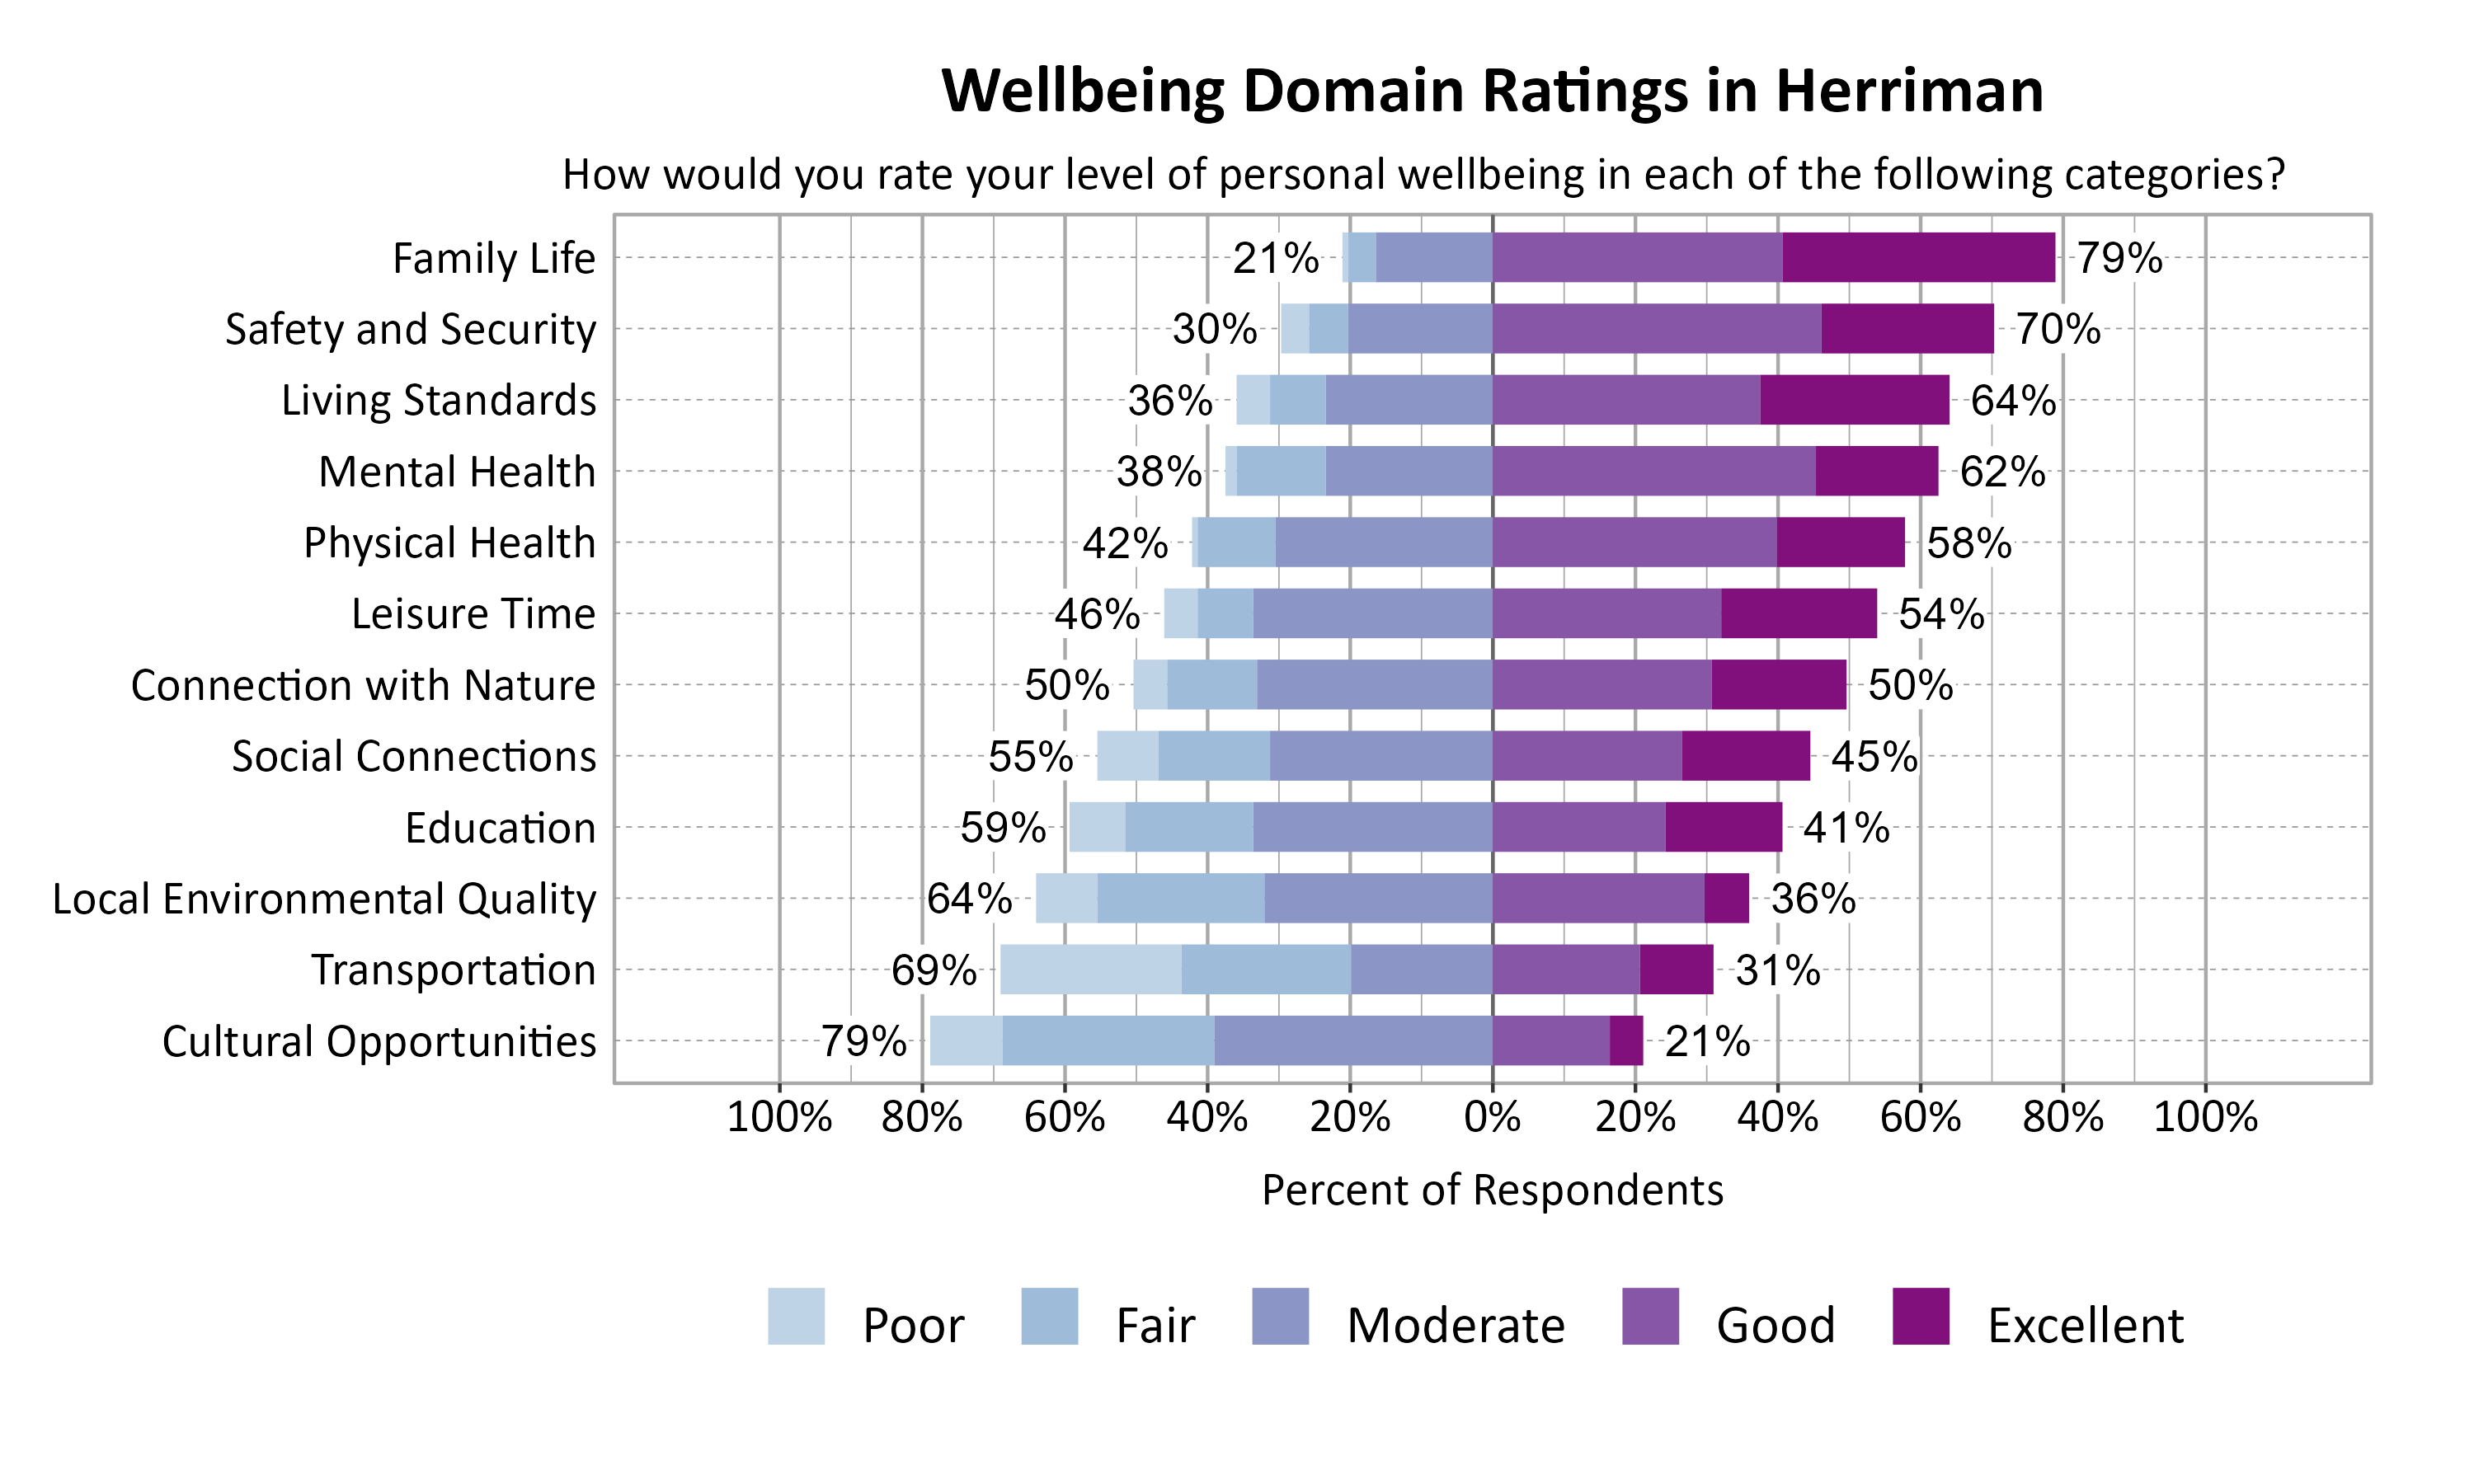
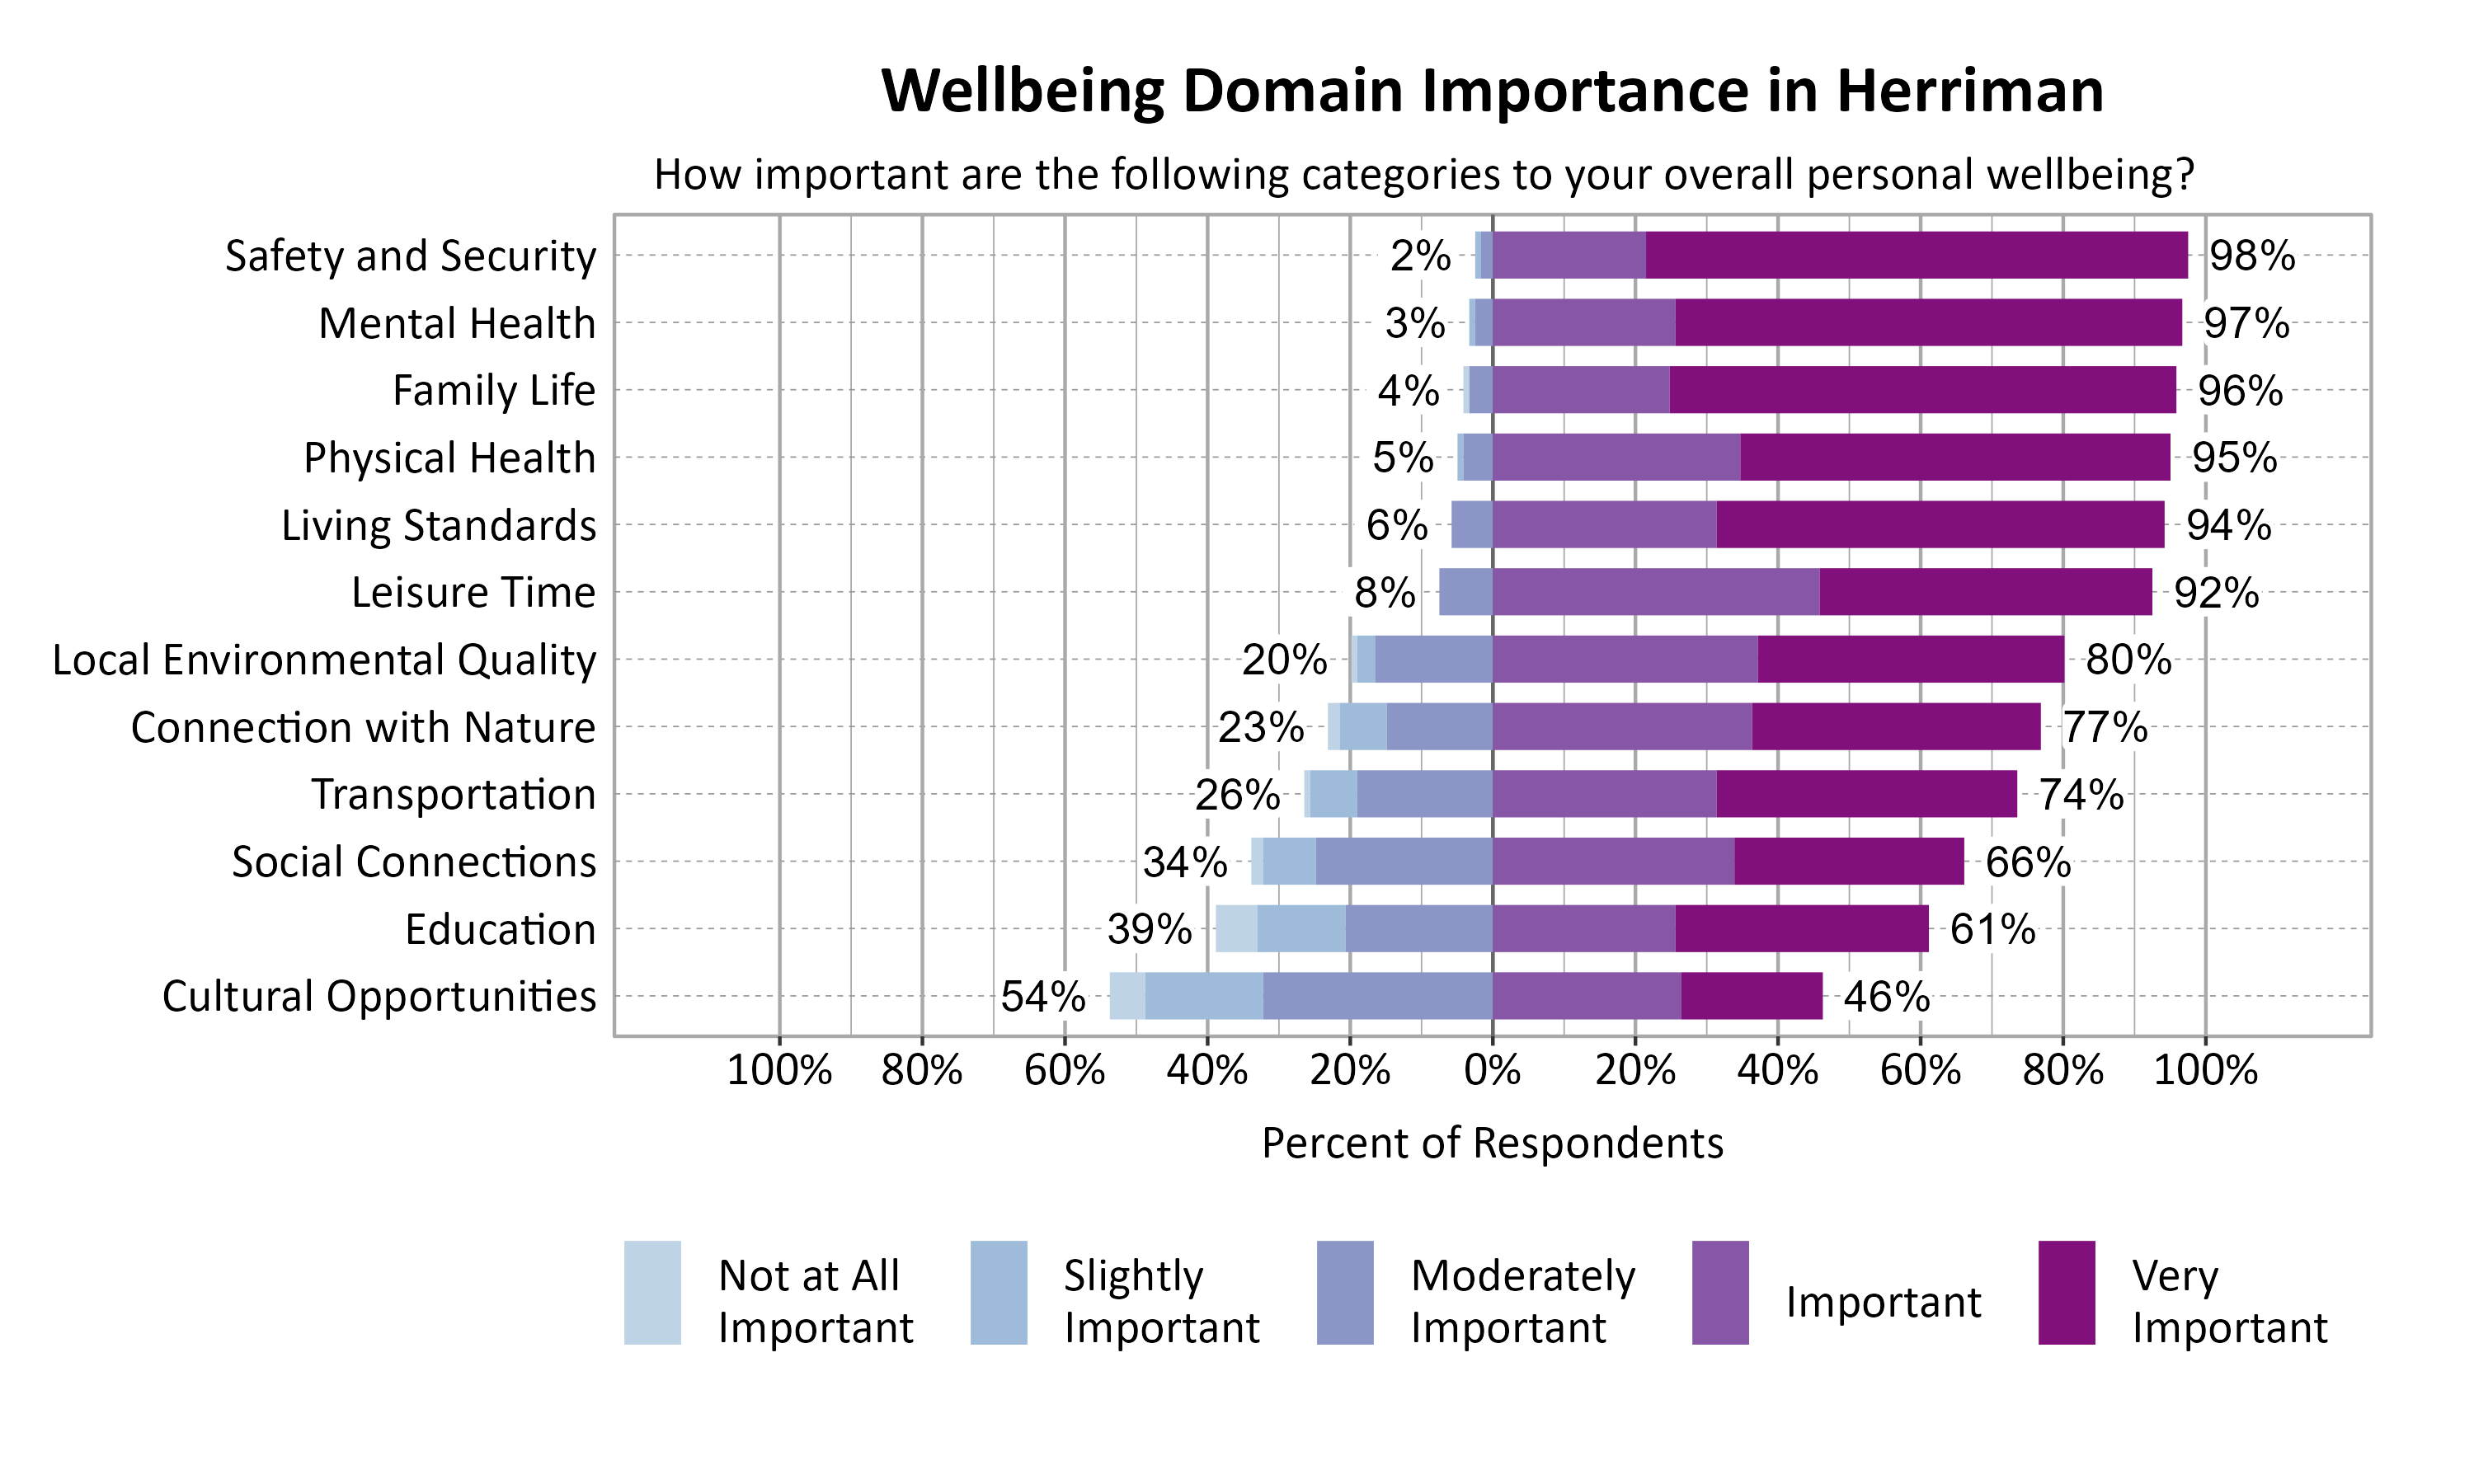
According to national and international entities that track wellbeing, there are a number of common dimensions or domains of wellbeing. Survey respondents rated twelve domains on a 5-point scale from poor to excellent. They were also asked to indicate the importance of each domain to their overall personal wellbeing on a 5-point scale from not at all important to very important. The highest rated wellbeing domains for respondents in Herriman were Family Life (79%), Safety and Security (70%), and Living Standards (64%). The most important wellbeing domains were Safety and Security (98%), Mental Health (97%), Family Life (96%), and Physical Health (95%).
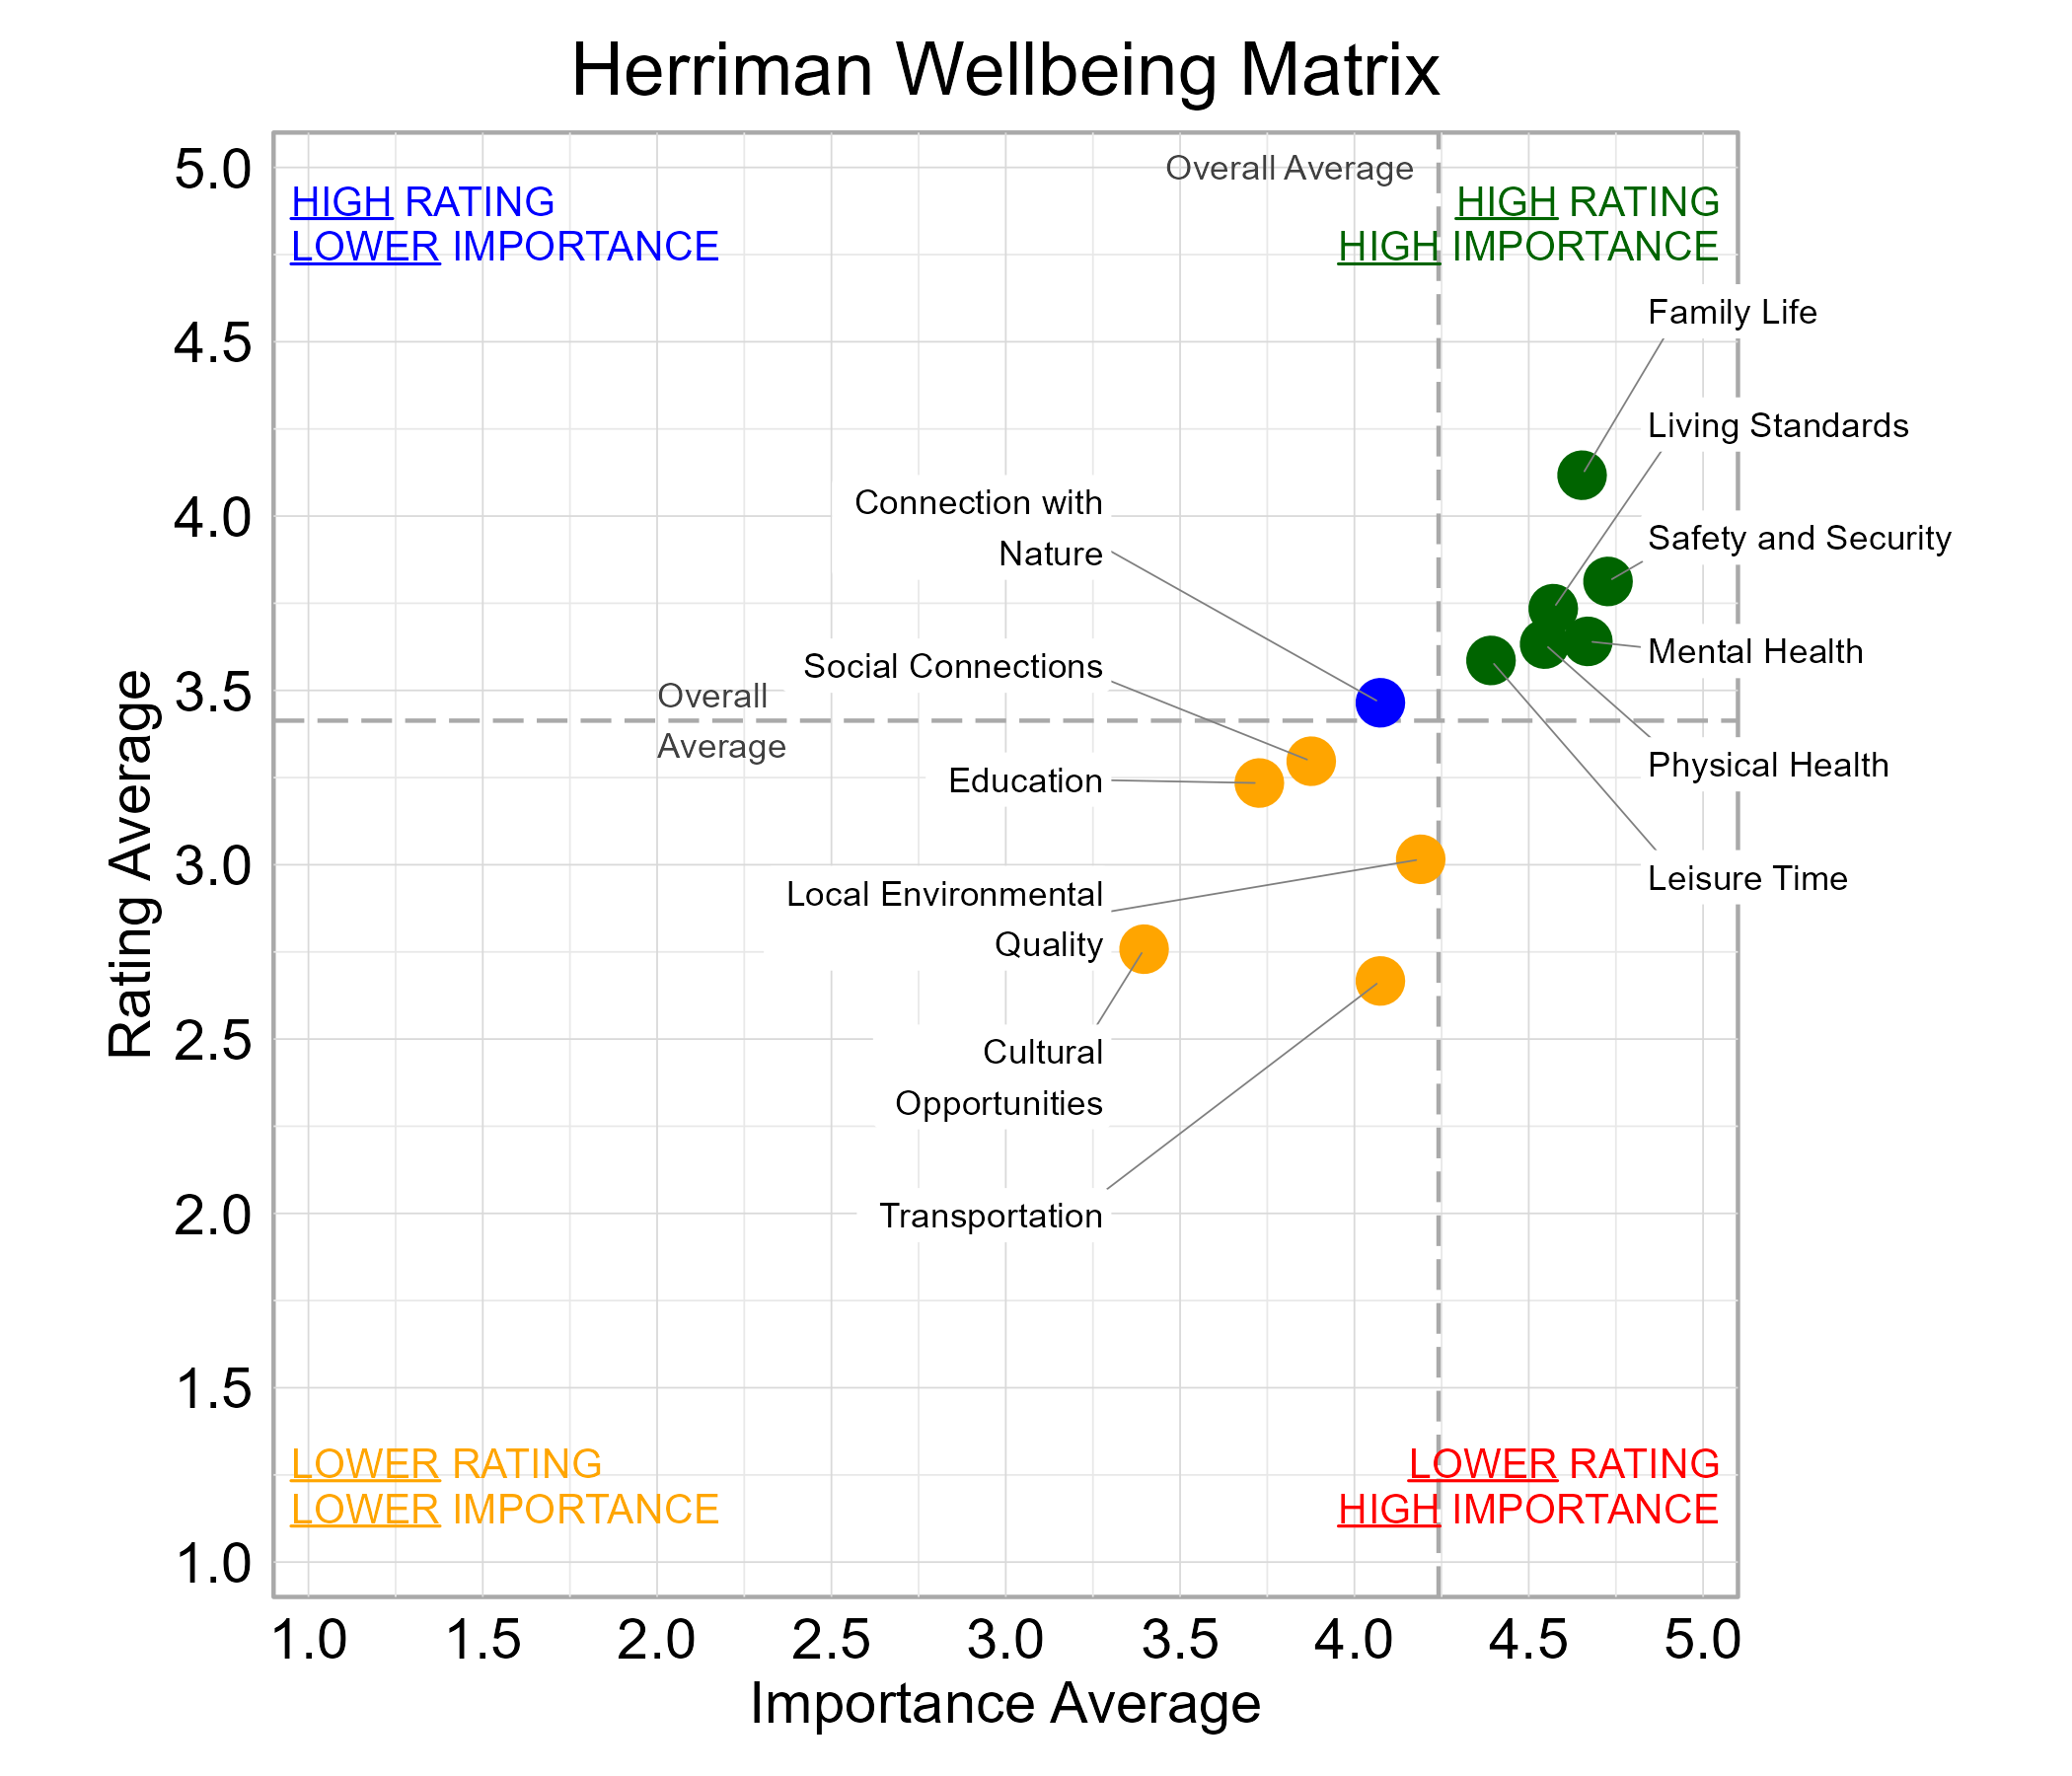
Wellbeing Matrix for Herriman
The graph below illustrates the relationship between the average rating and the average importance of wellbeing domains for survey respondents from Herriman. Family Life, Leisure Time, Living Standards, Mental Health, Physical Health, and Safety and Security were highly important and rated above average among the domains. No Domains fell in the “red zone” of higher importance and lower ratings.
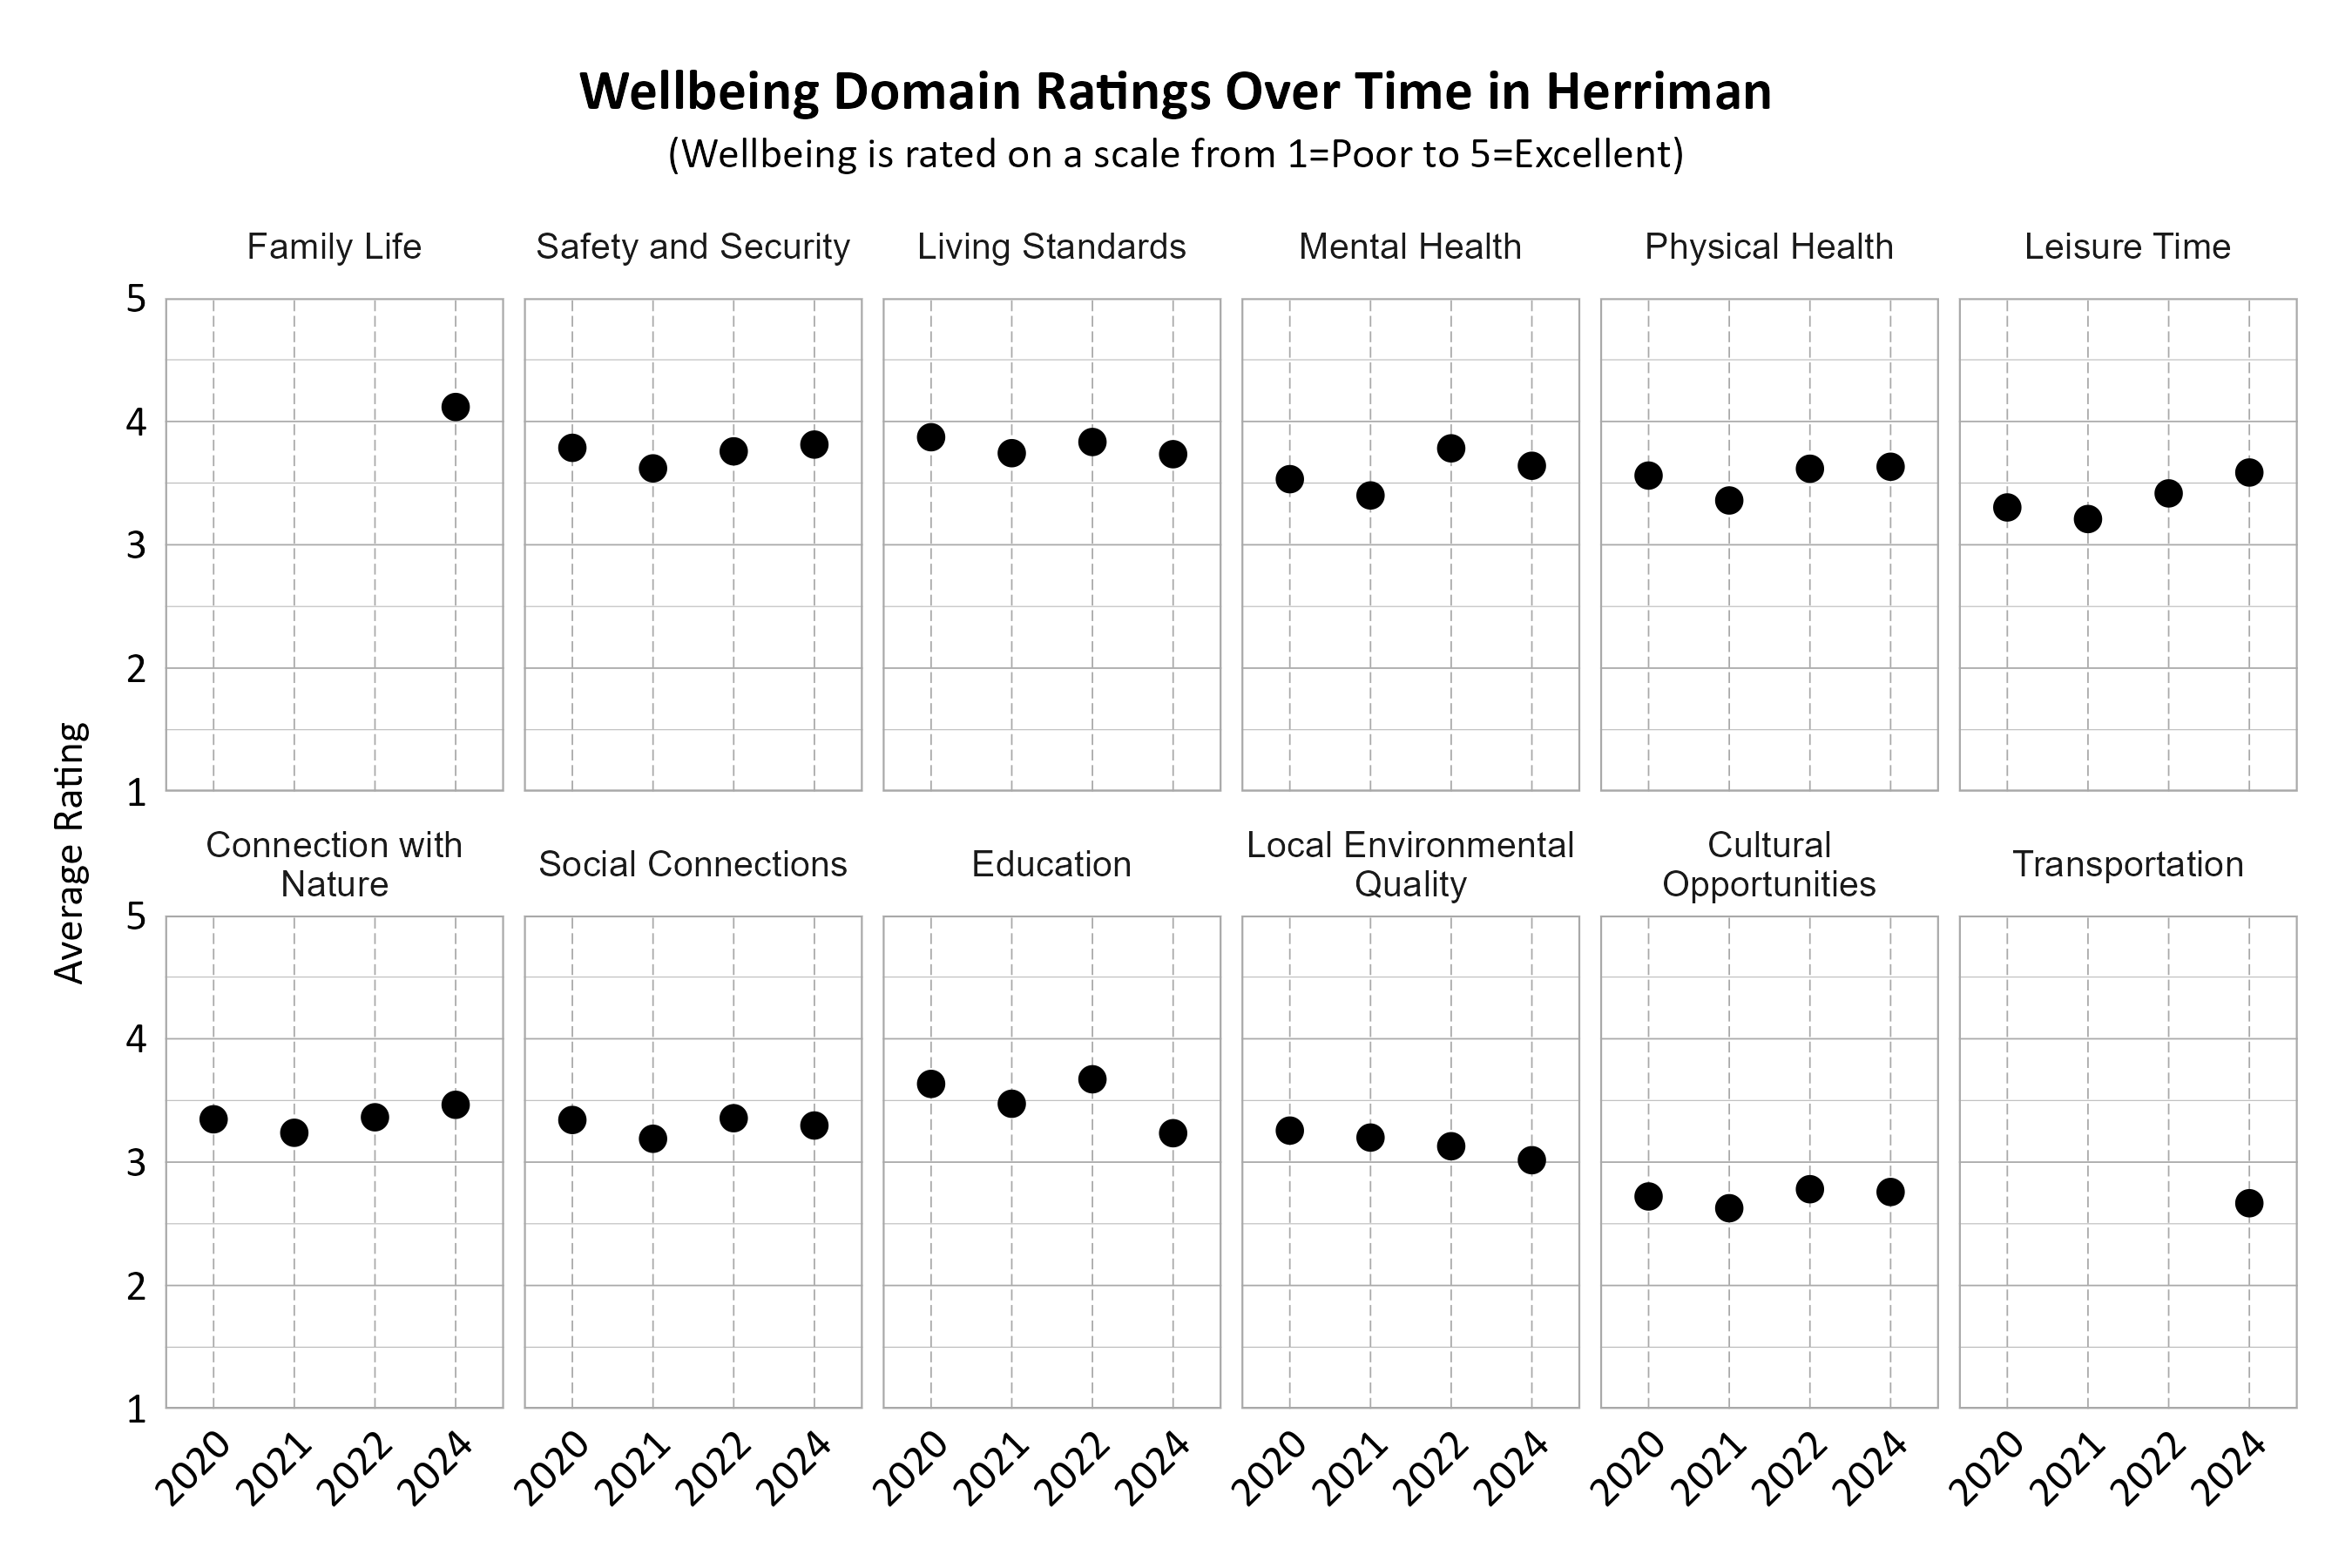
Wellbeing Domains Over Time in Herriman
The graphs below show how the domains were rated over the years by Herriman residents. The number of respondents changed over time. Note that the two domains Family Life and Transportation were new categories in the 2024 survey and were not measured in previous years. Most domains maintained fairly consistent ratings over the survey years. Safety and Security and Living Standards were consistently among the highest rated domains in each survey year, while Cultural Opportunities was among the lowest.
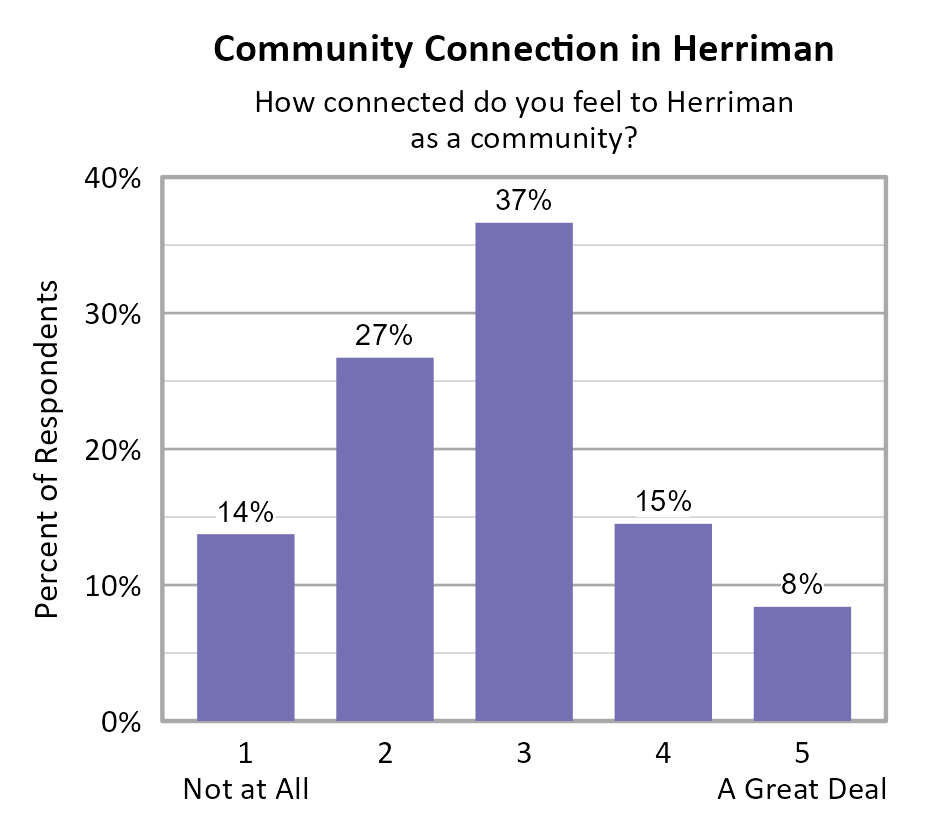
Community Connection in Herriman
Survey participants were asked about how connected they feel to Herriman on a 5-point scale from not at all (1) to a great deal (5), and the average score of all respondents was 2.77.
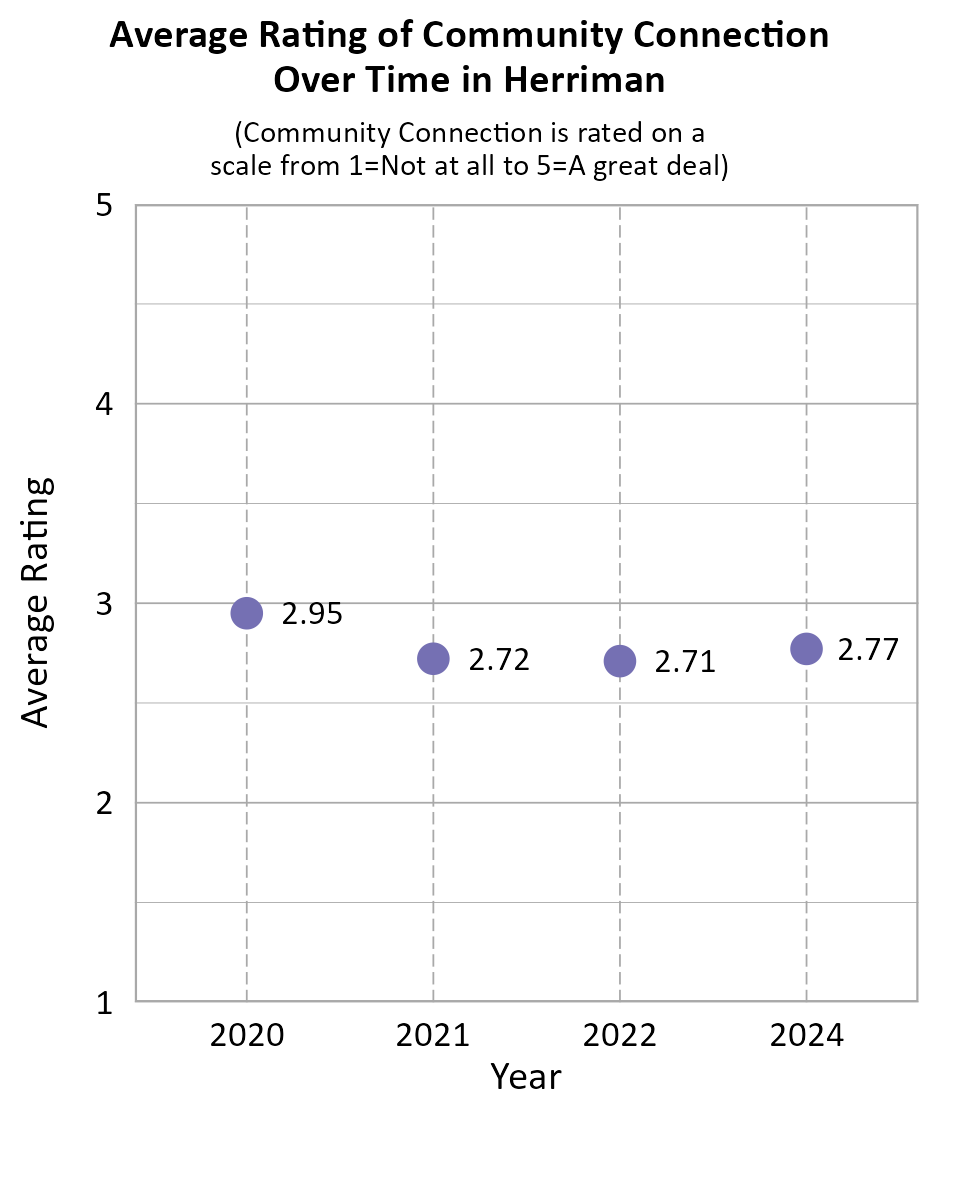
When comparing survey data from Herriman over the years as shown in the information below, we can see that the average community connection score declined between 2020 and 2021, and remained nearly the same between 2021 and 2022, and improved slightly between 2022 and 2024.
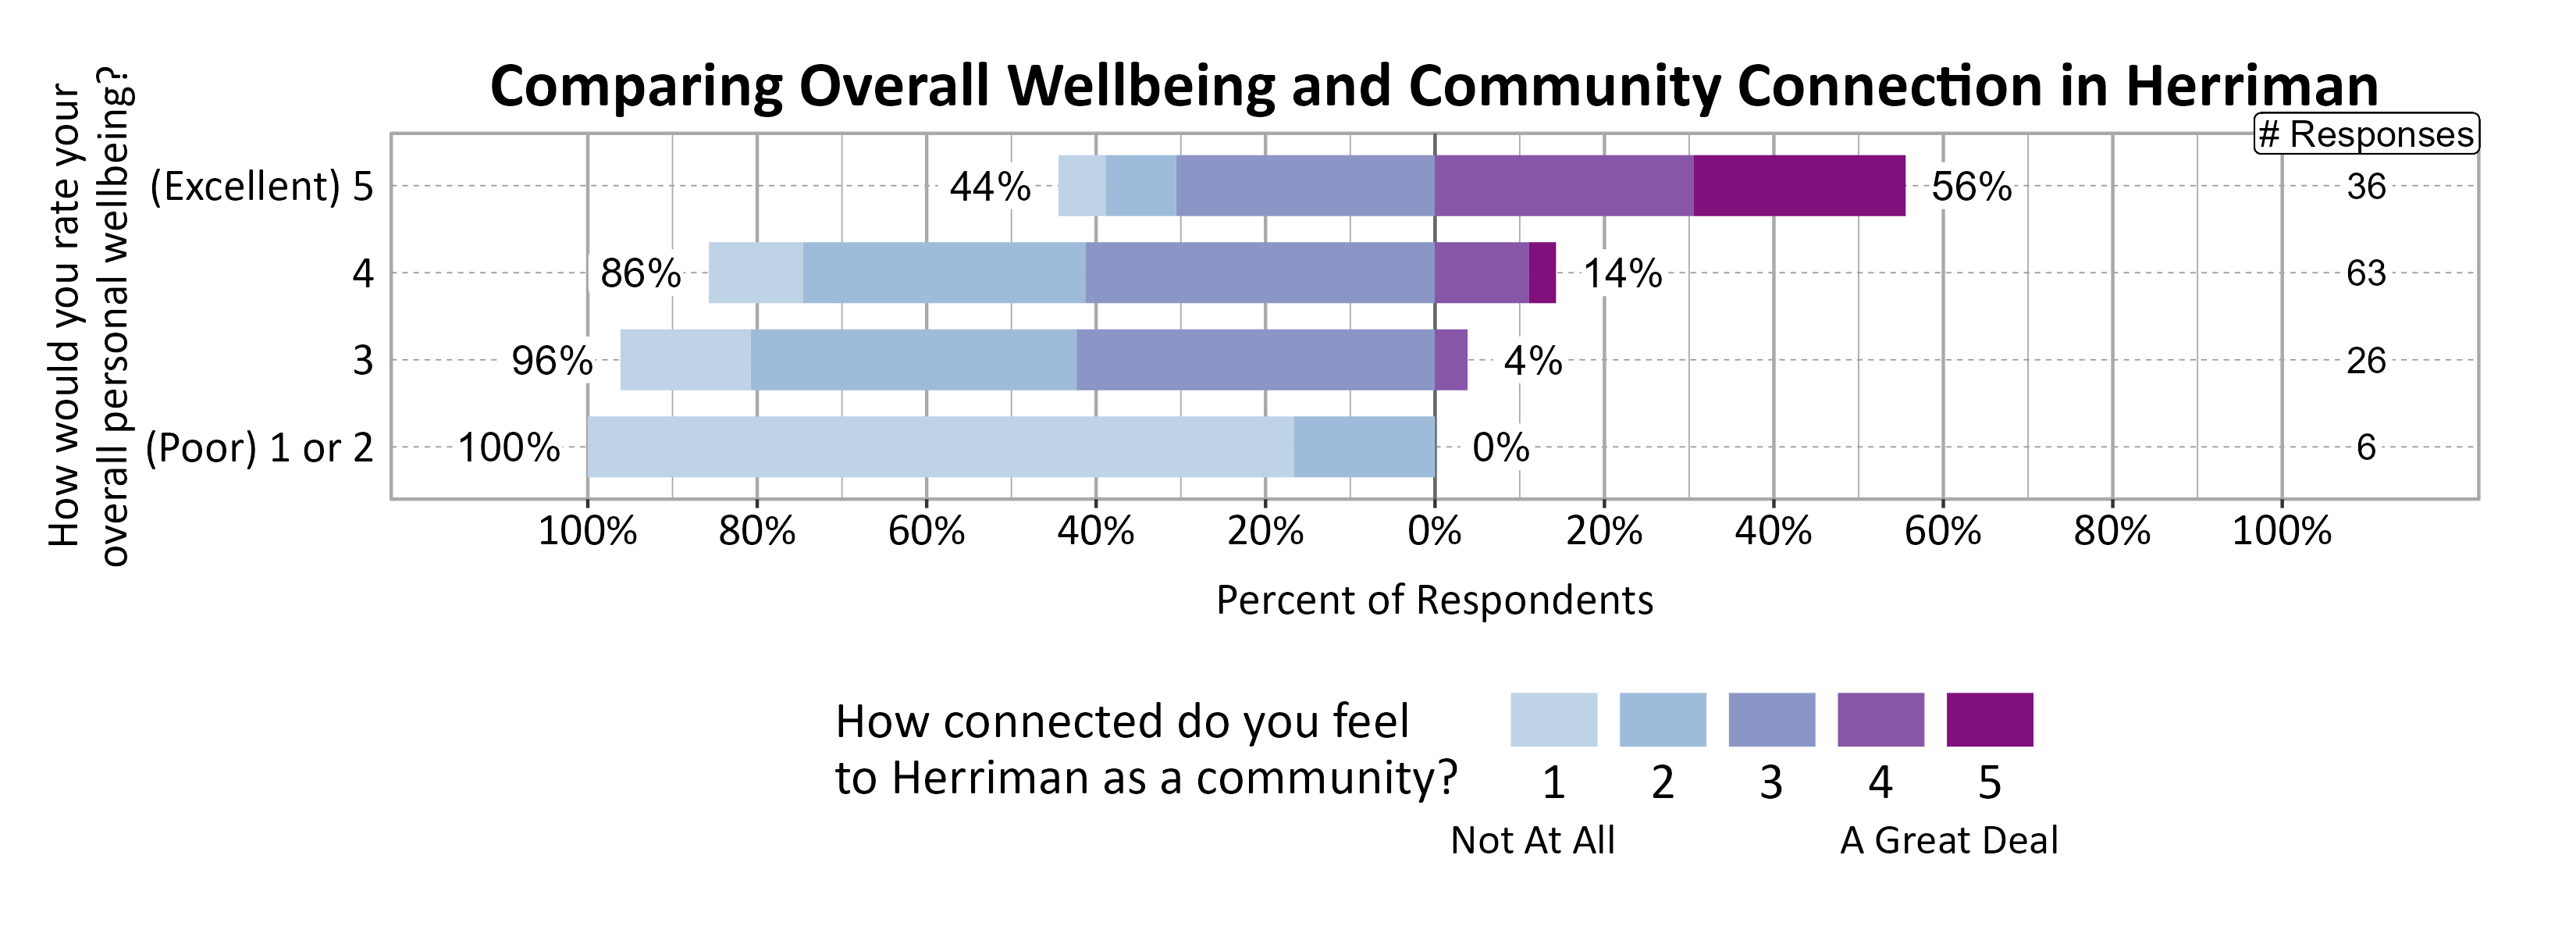
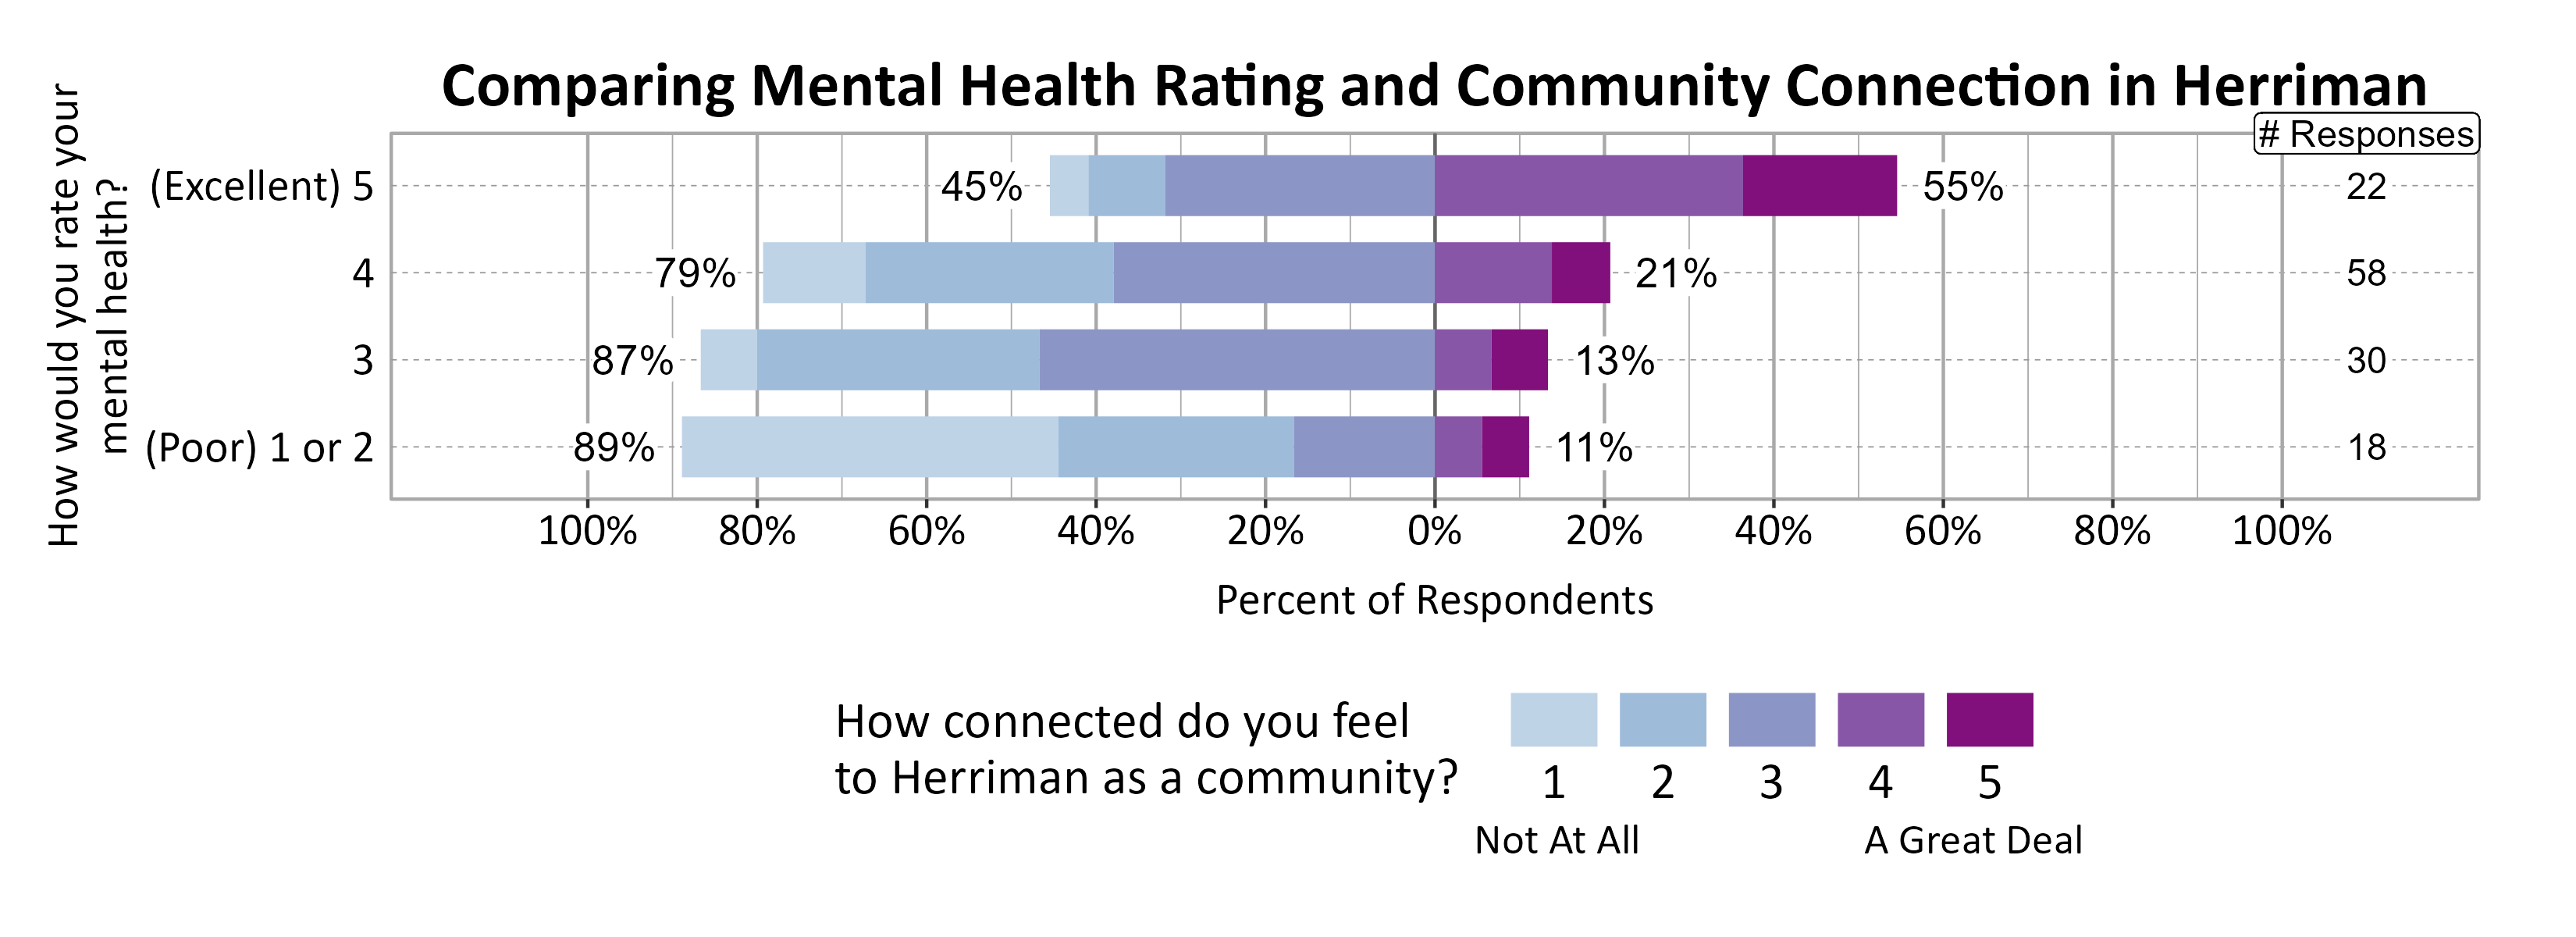
A positive relationship was found between individuals’ community connection and overall personal wellbeing as well as mental health.
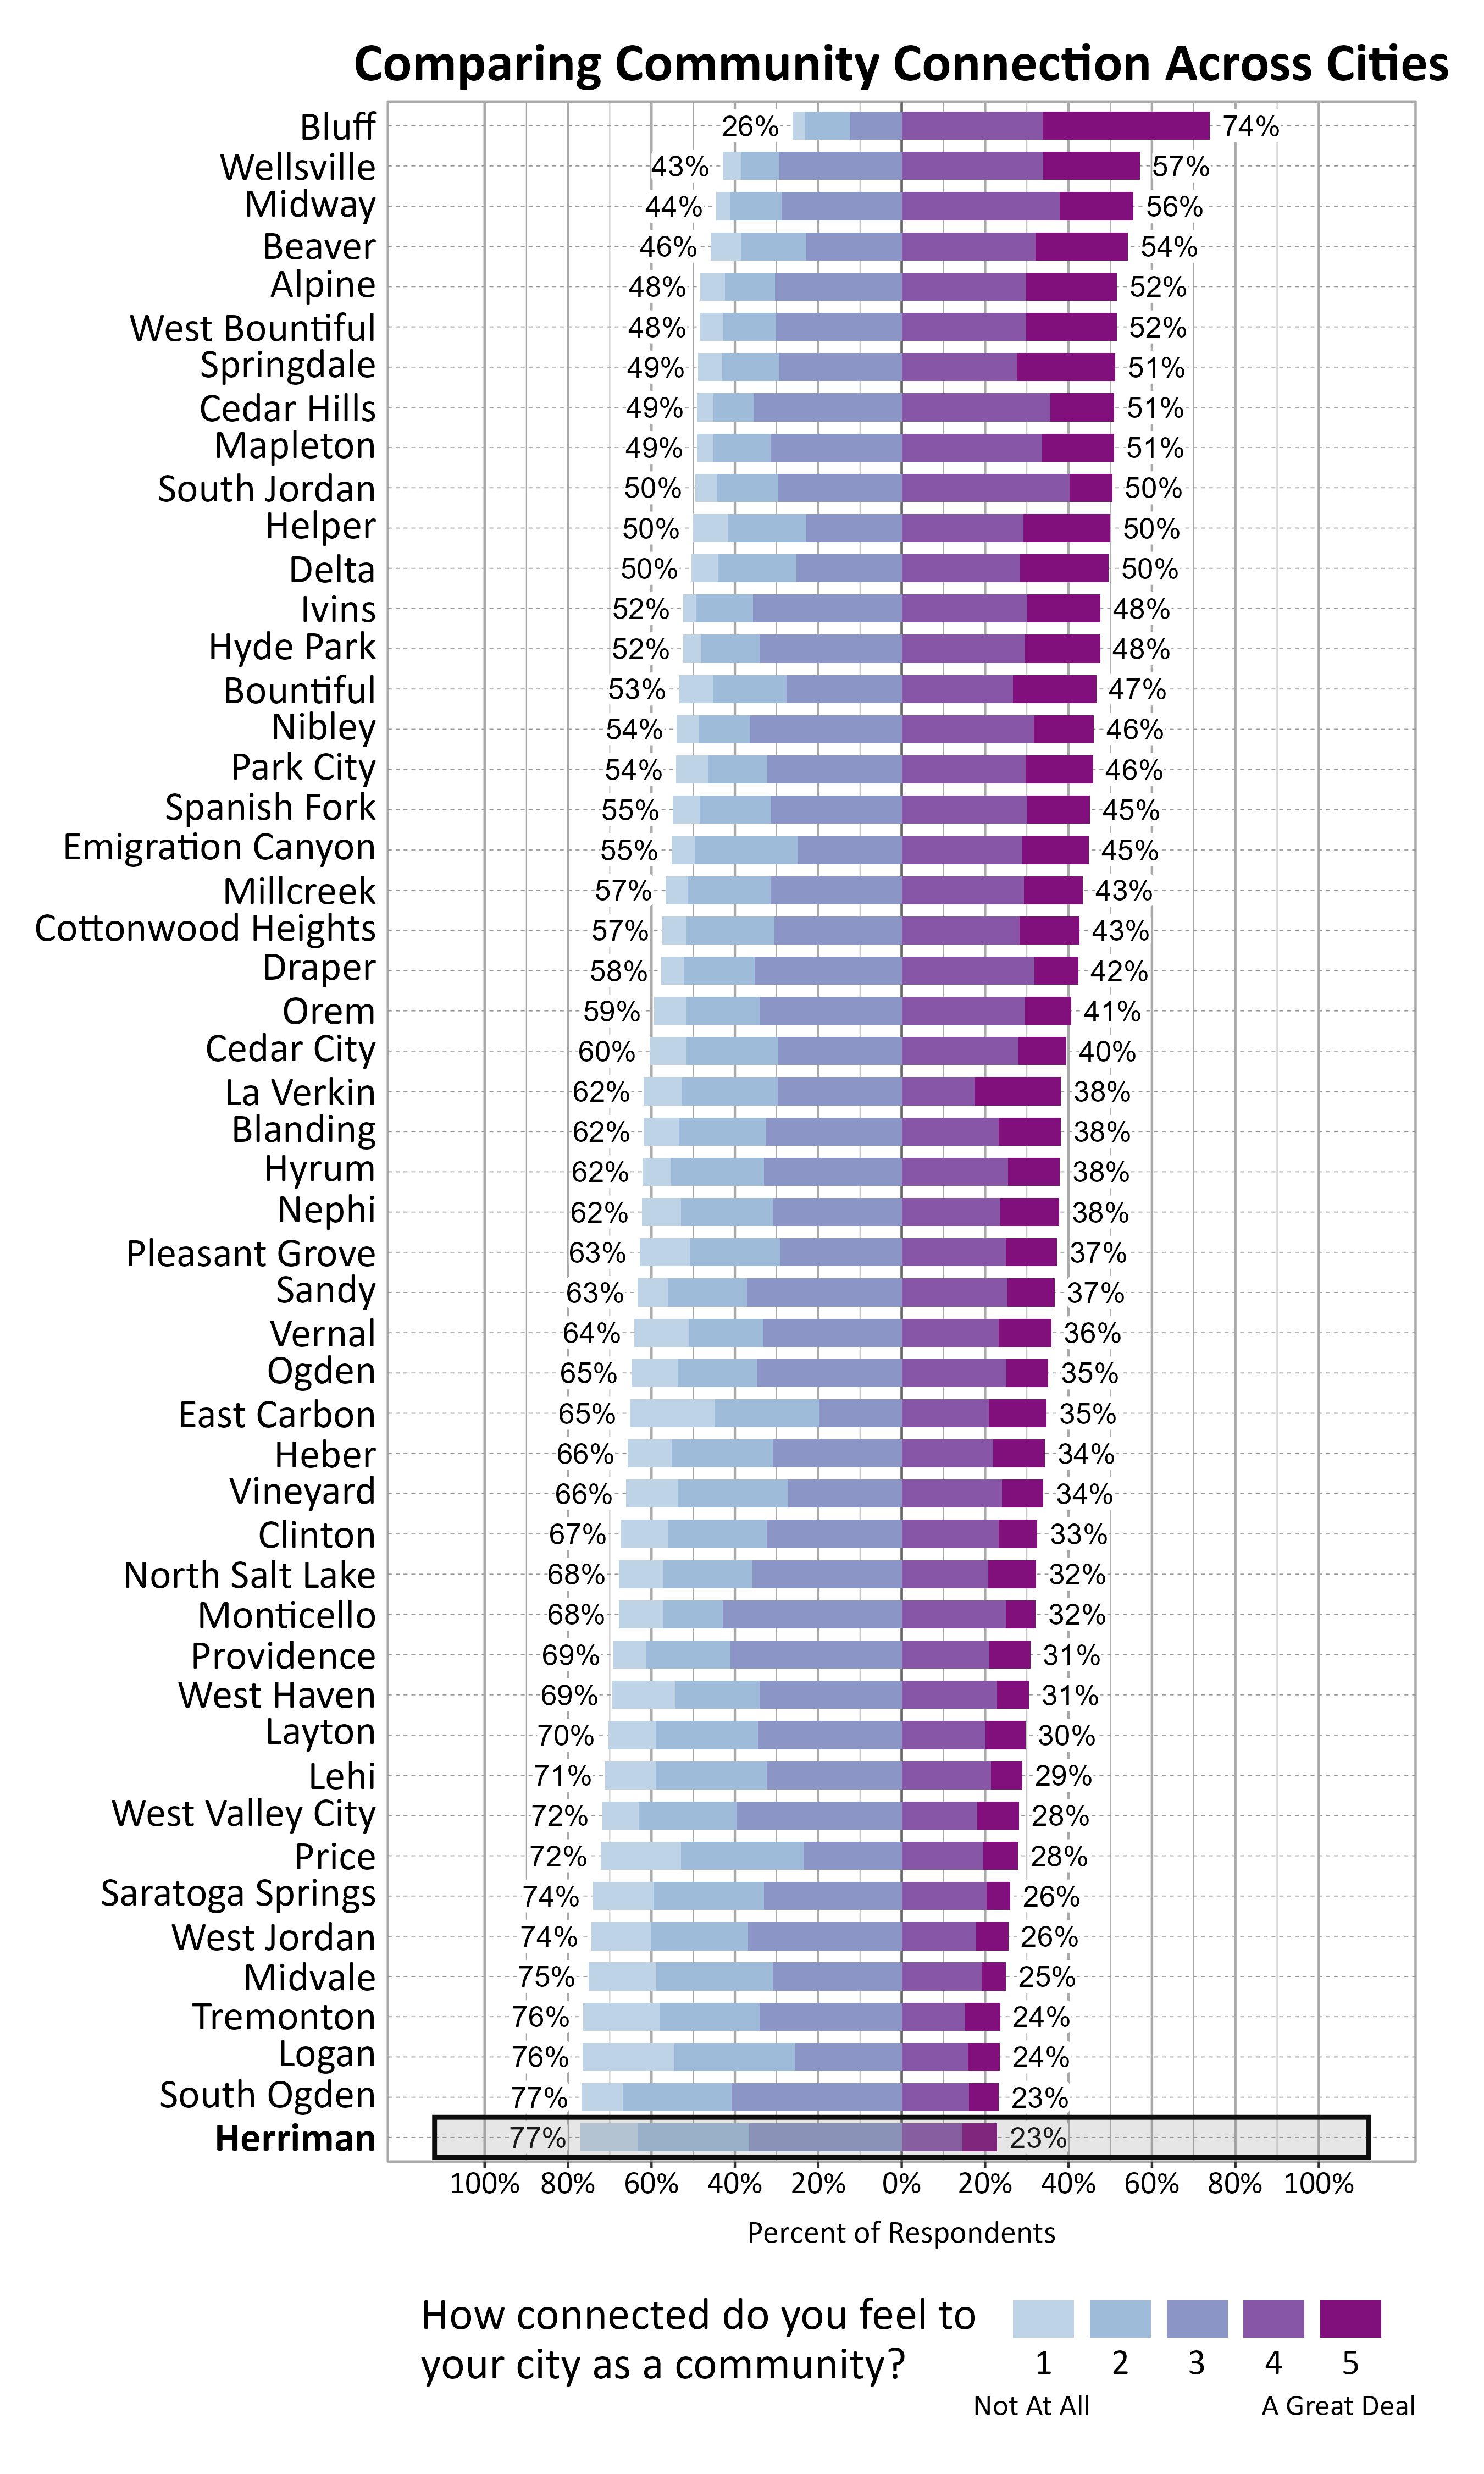
The graph below shows how Wellbeing Project cities and towns compare on feelings of community connection based on the percentage of respondents who answered 4 or a 5 on a 5-point scale from “not at all” to “a great deal” connected to their city or town. Herriman ranked 51 out of the 51 cities that participated.
Participation in Recreation and Nature-Related Activities
Respondents were asked to indicate whether or not they participated in various activities in the last 12 months. The most popular activities were walking or biking in your neighborhood or city (94%), recreating in parks in your city (80%), gardening at home (75%), and using trails in or near your city (74%).
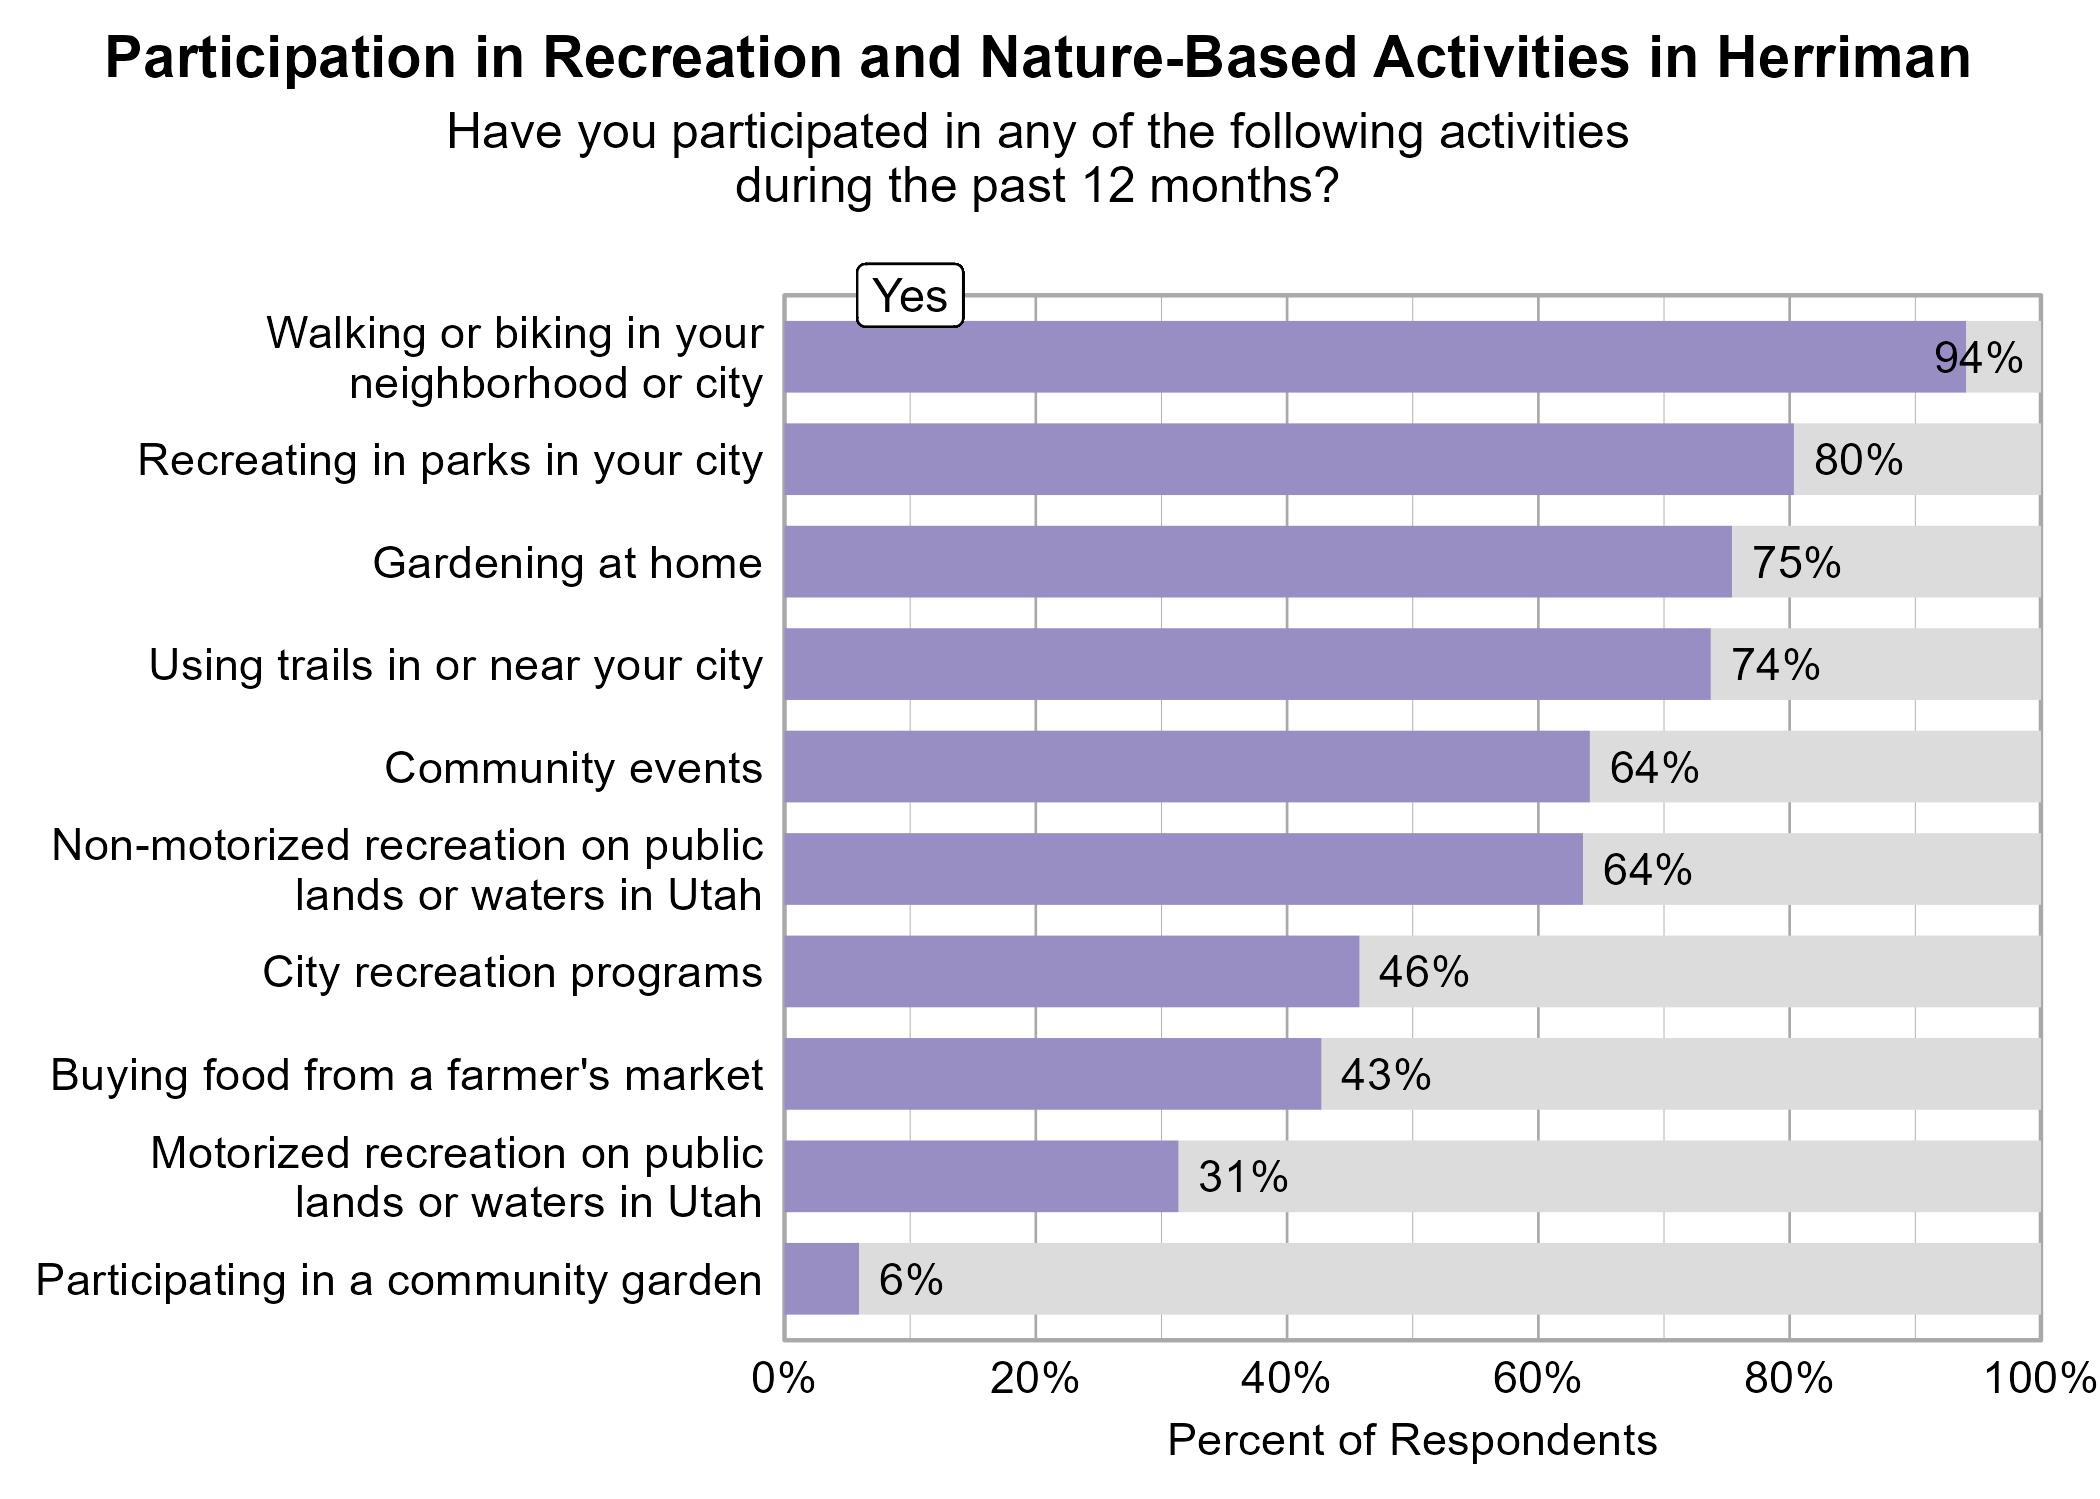
Non-motorized recreation on public lands or waters in Utah was significantly related to higher ratings of personal wellbeing.
None of the recreation activities above were significantly related to higher ratings of community wellbeing.
Participating in city recreation programs, participating in community events, and non-motorized recreation on public lands or waters in Utah were significantly related to higher ratings of community connection.
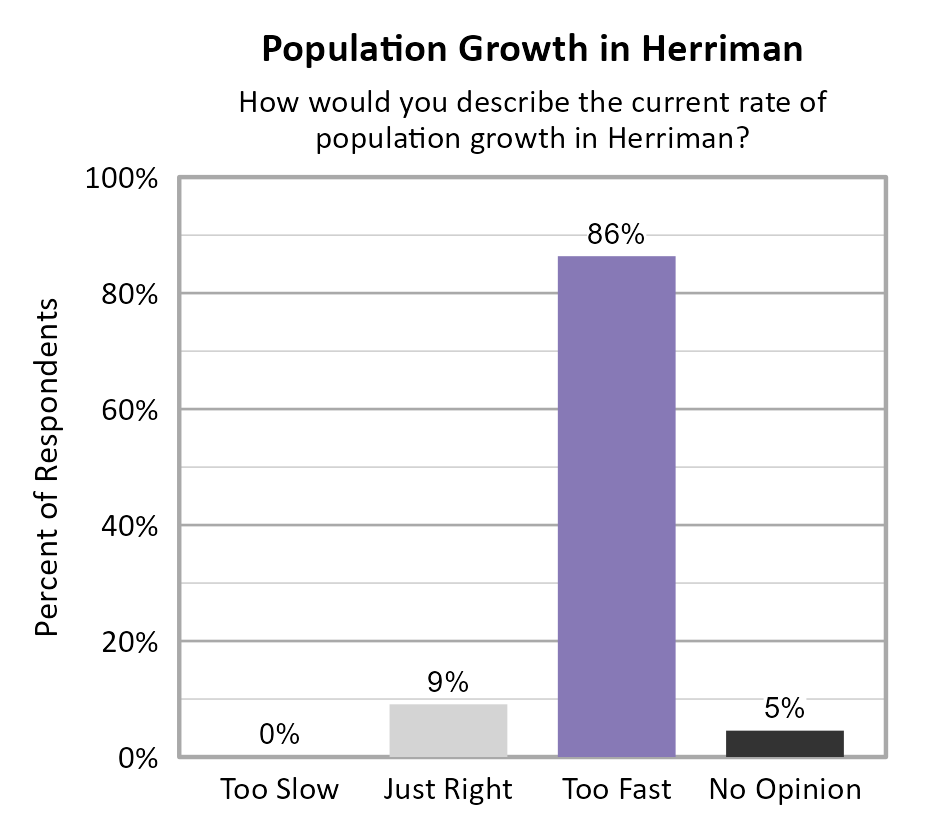
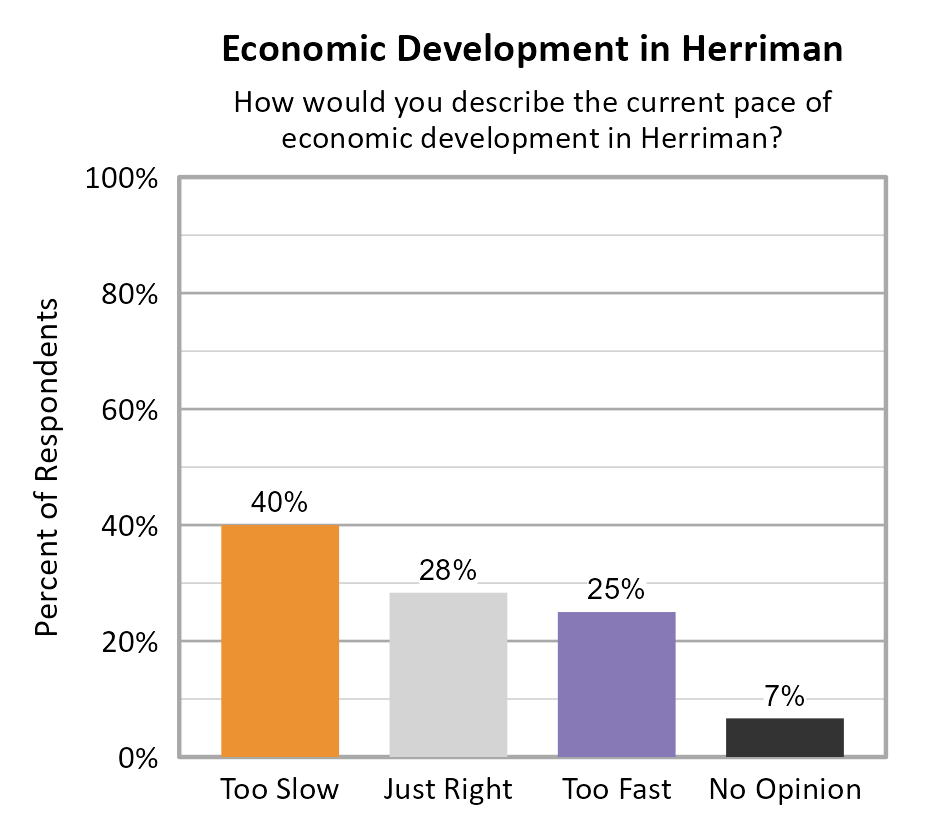
Perspectives on Population Growth and Economic Development
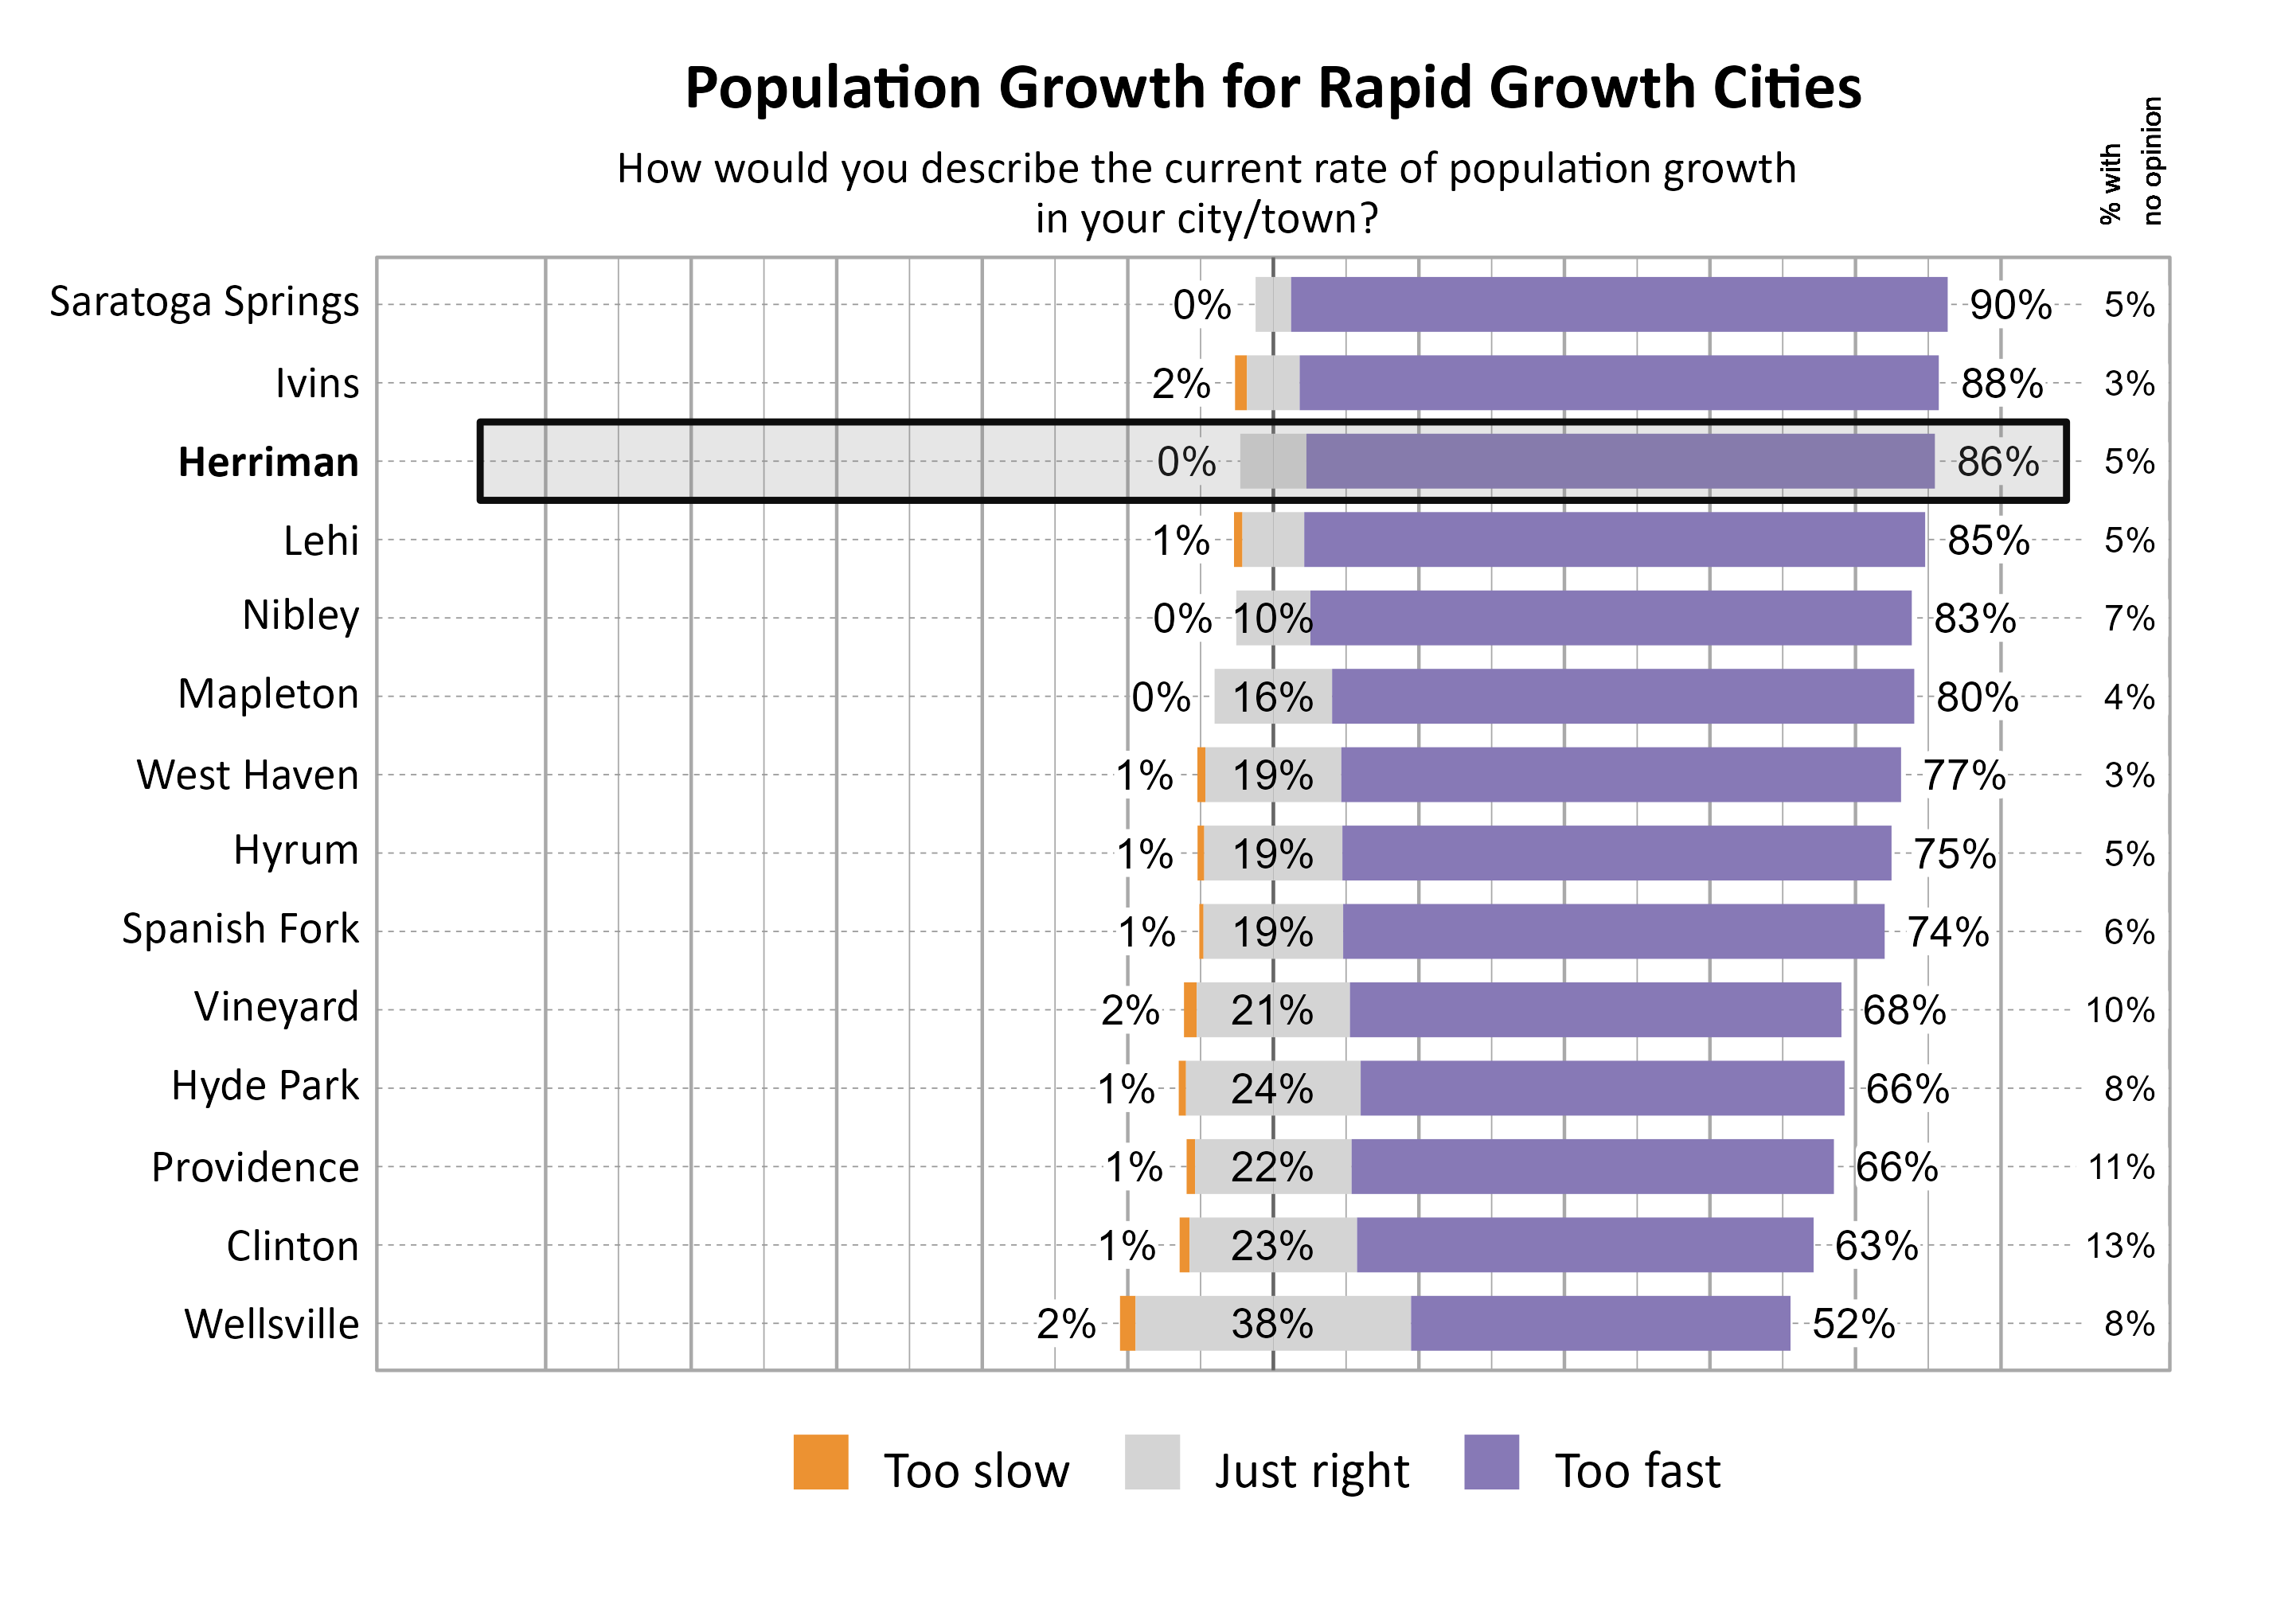
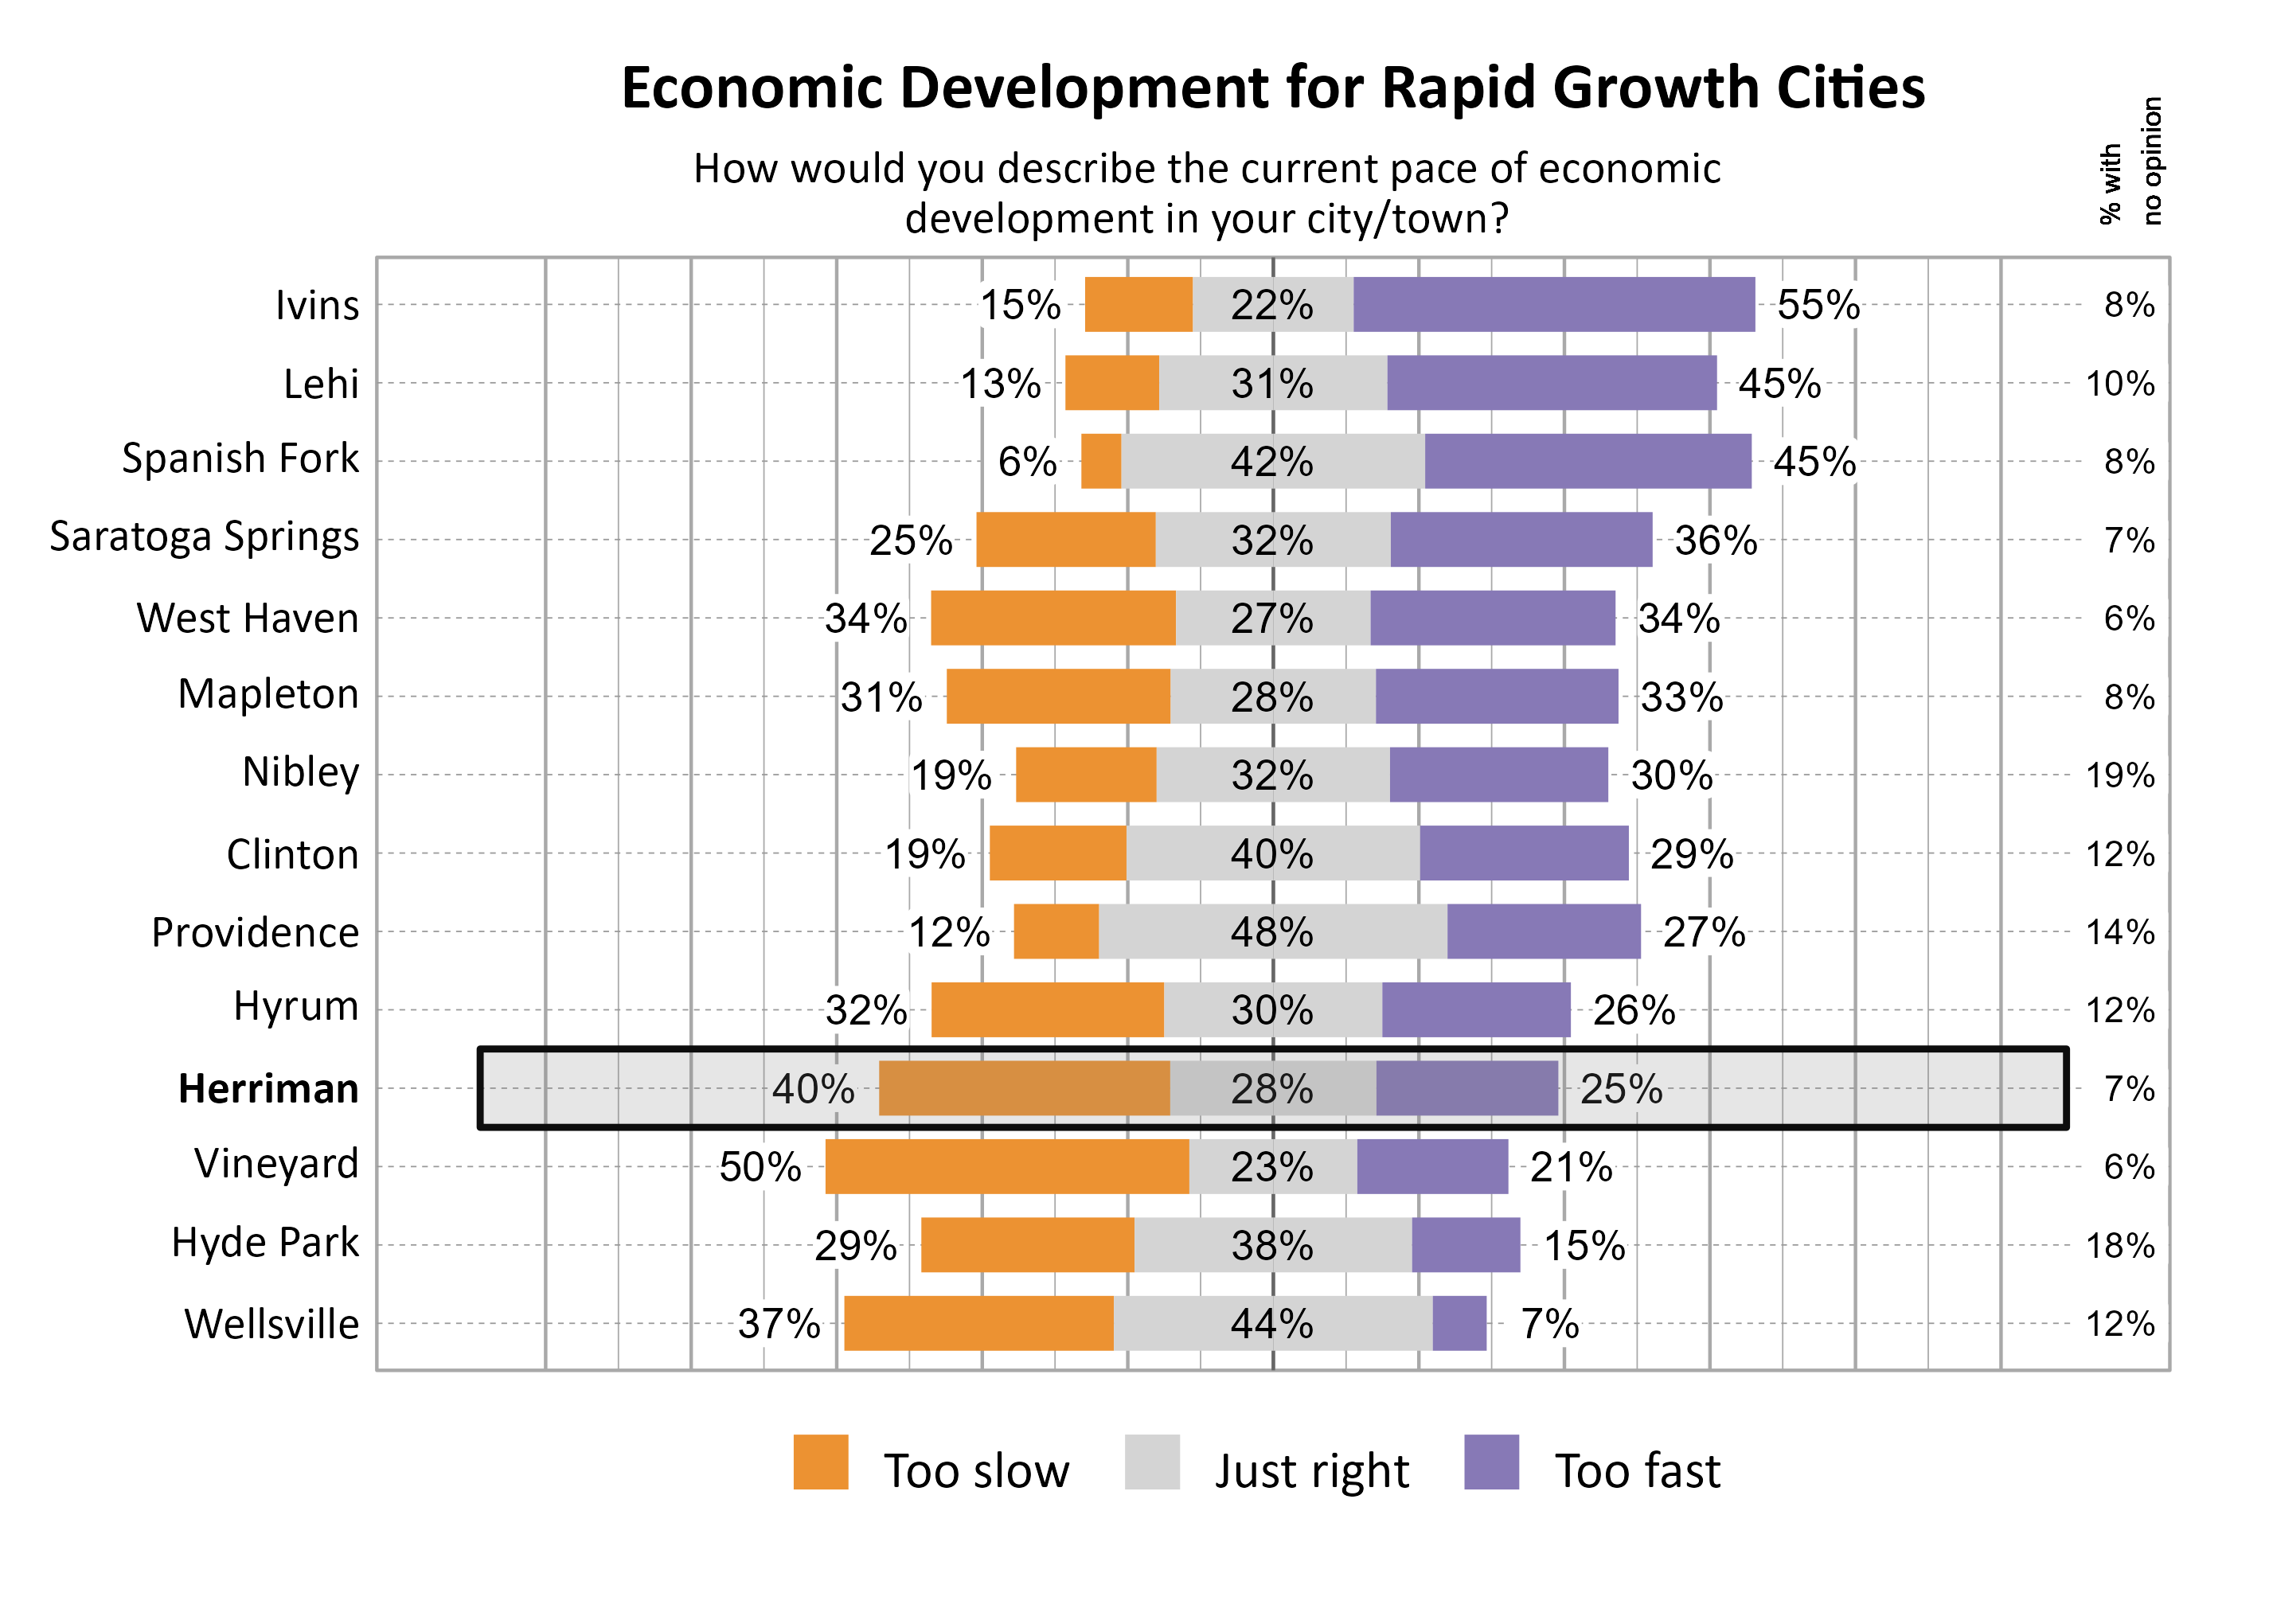
The majority of respondents in Herriman indicated that they felt the population growth was too fast (86%). For the pace of economic development, the largest proportion of respondents indicated that it was too slow (40%).
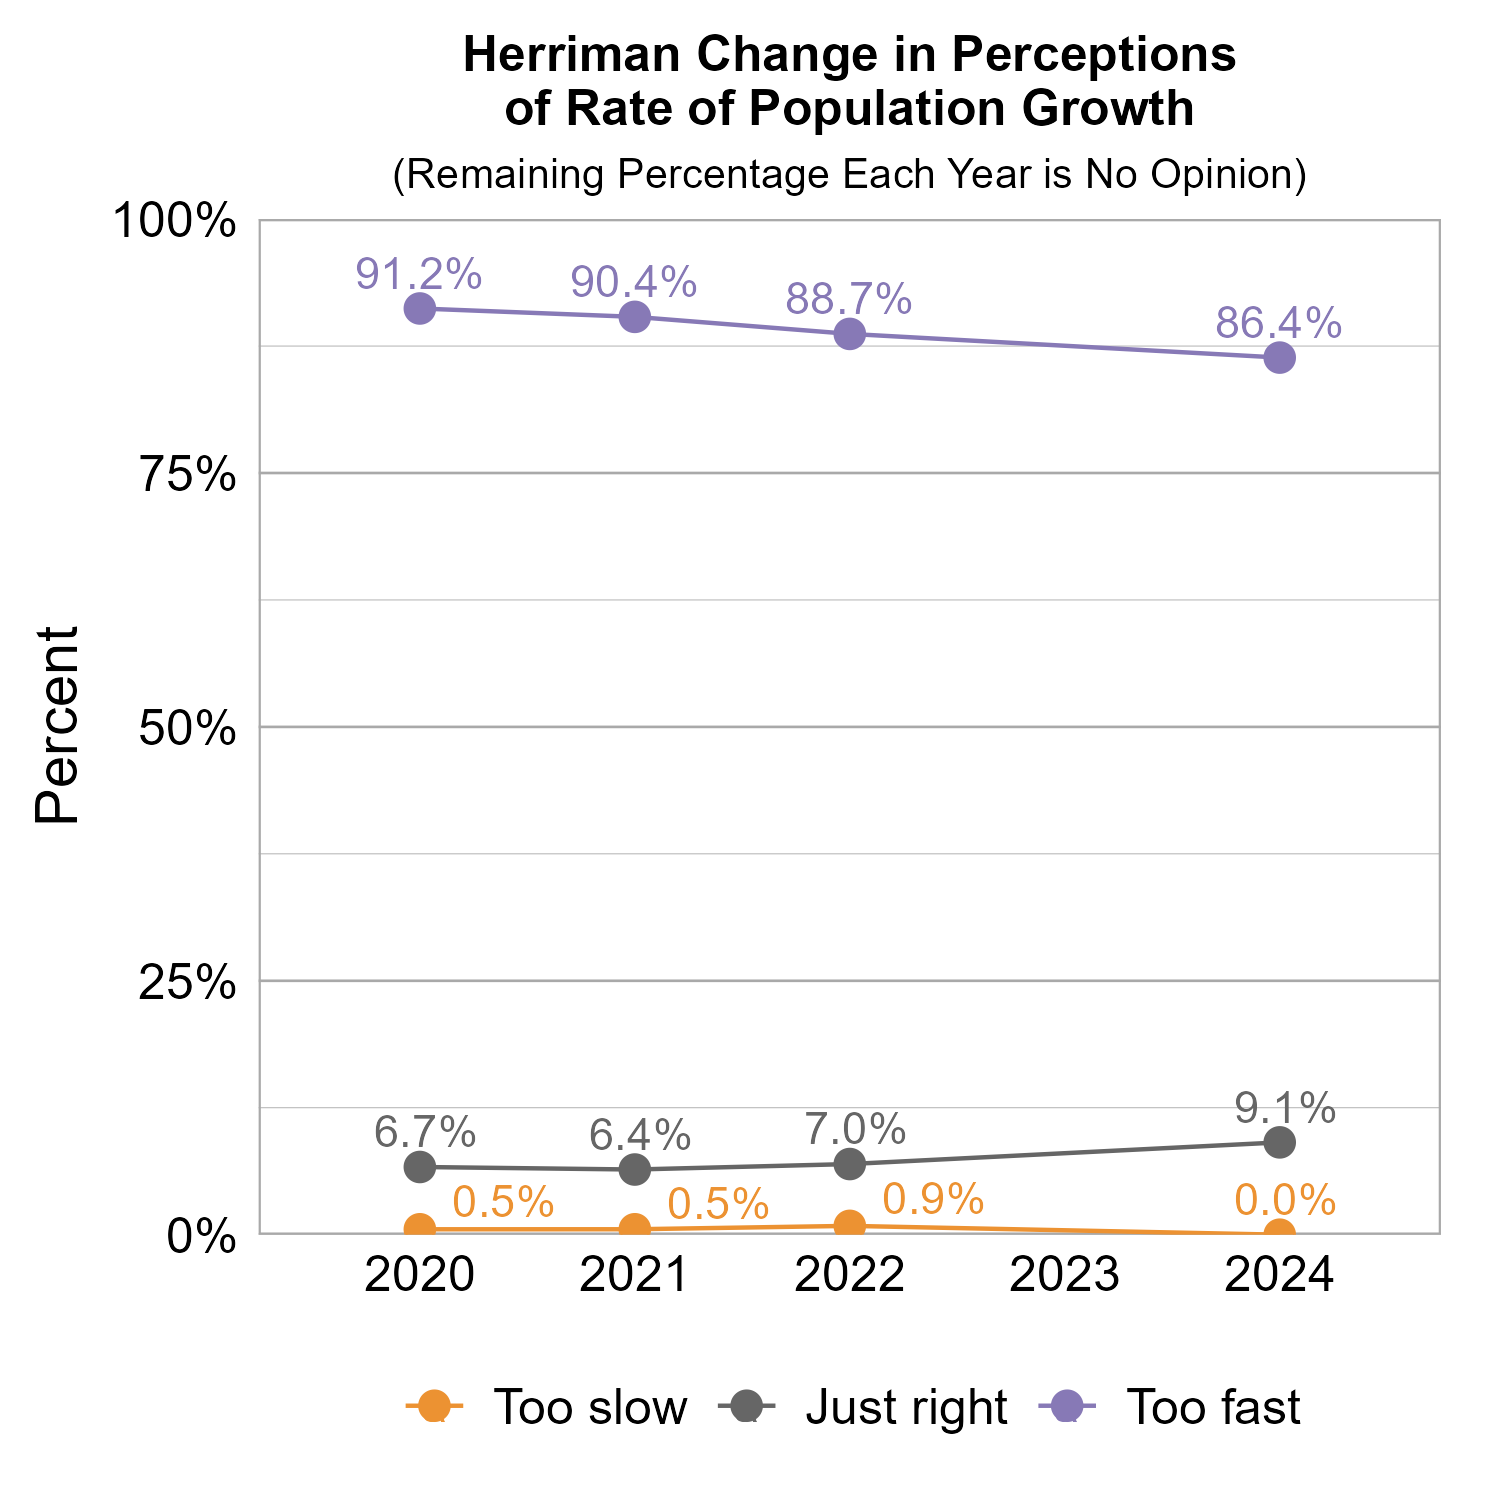
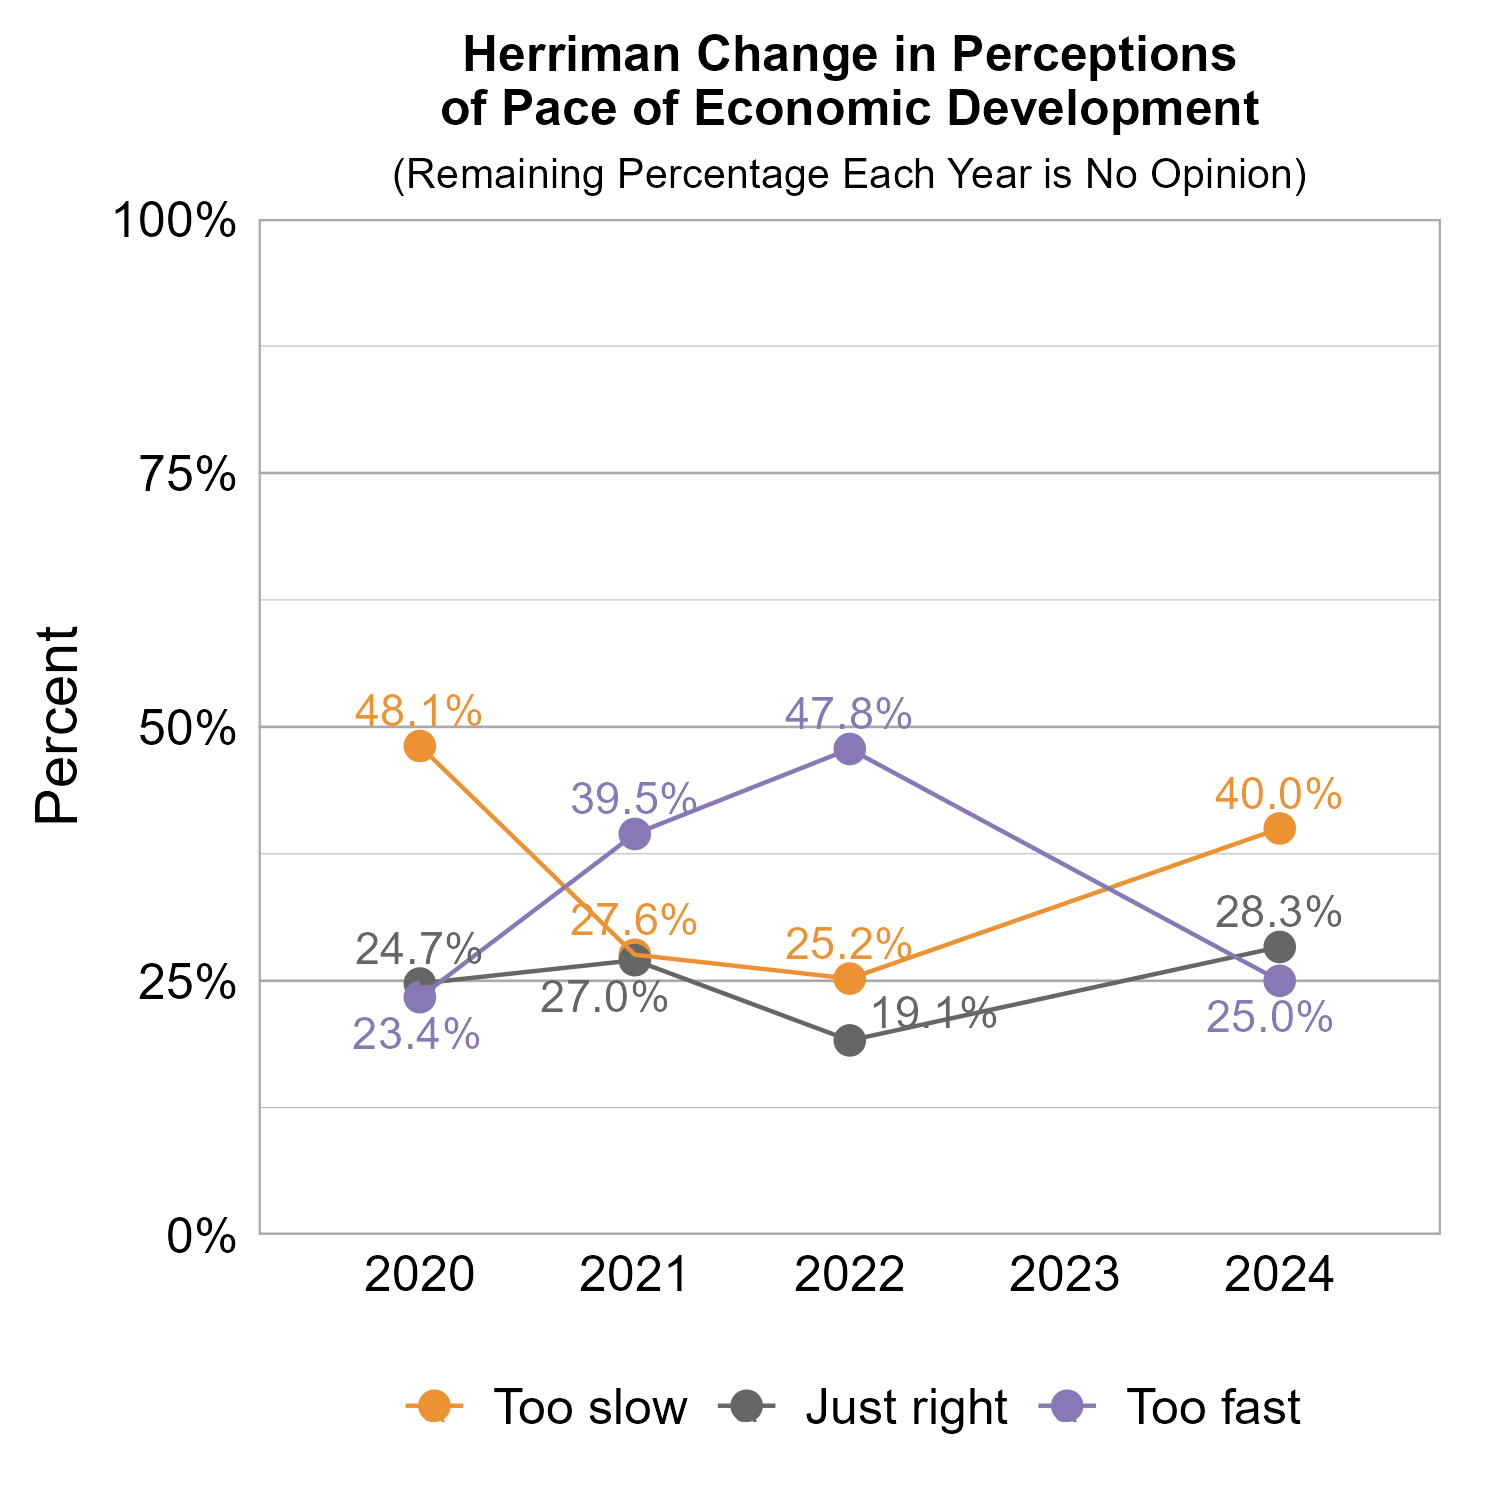
The graphs below show how perceptions of population growth and economic development in Herriman have varied across recent years of Wellbeing Surveys. Perception that the rate of population growth is too fast has consistently been very high over the survey years, with a slight decline since 2020. Perceptions of the pace of economic development have fluctuated over the years.
The graphs below show perceptions of population growth and economic development for Herriman compared to other participating cities and towns in the Rapid Growth Cities cluster.
The graph below illustrates how many respondents perceived the pace of economic development as too slow, just right, too fast, or had no opinion, with additional breakdowns for the number of respondents who provided comments.
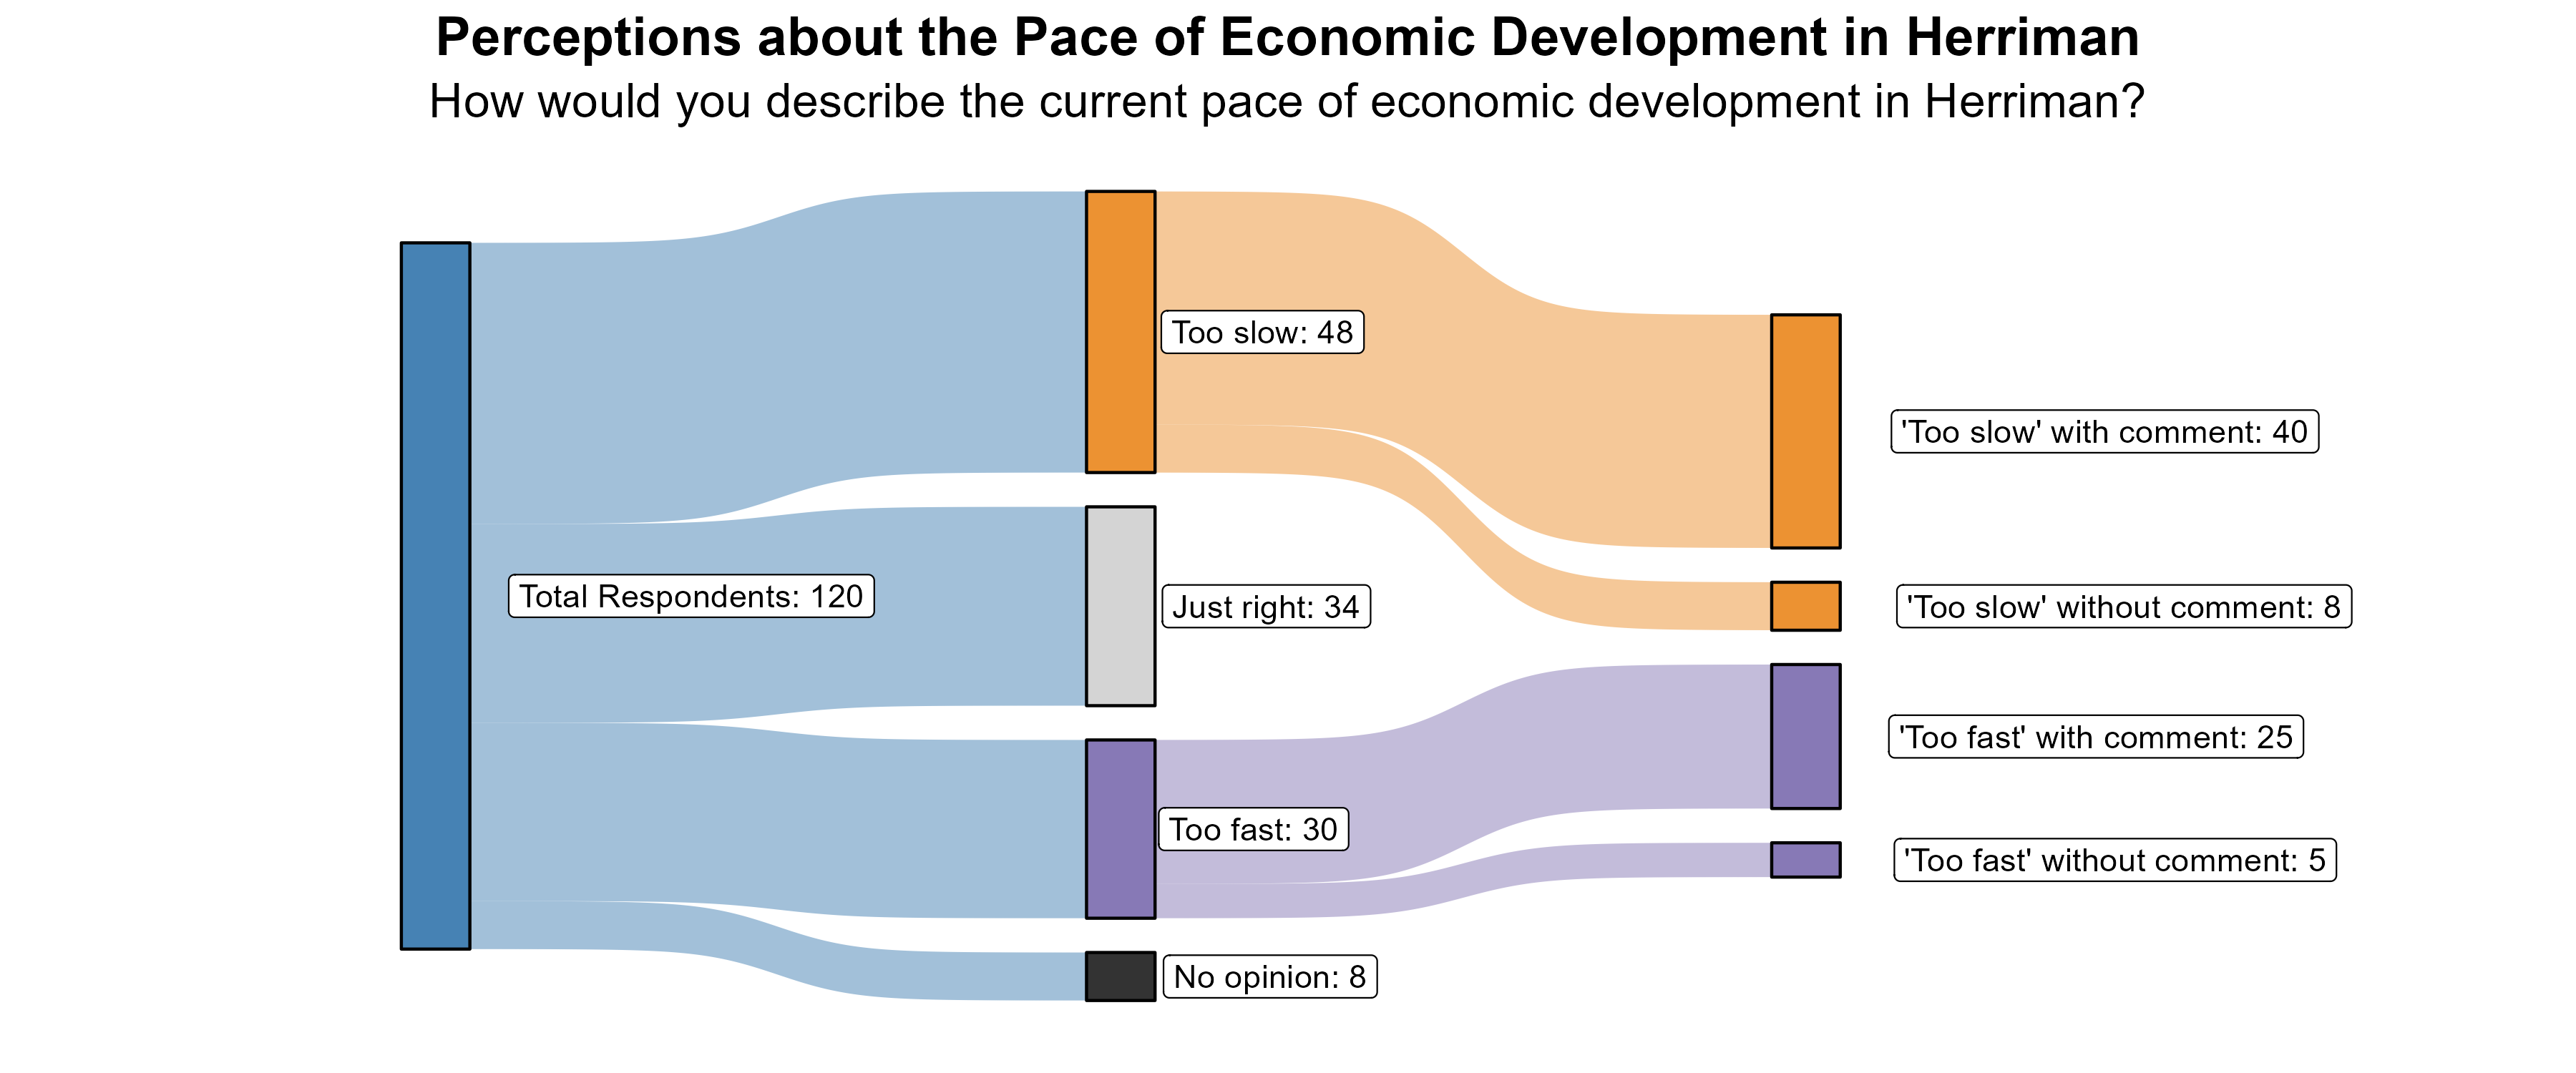
The 40% of respondents who rated the pace of economic growth as “too slow” were further asked what aspects of the local economy they would like to see more of in Herriman. An overwhelming majority of comments pleaded for more stores, restaurants, and businesses in Herriman. Many people expressed frustration in having to leave town for everything they need.
Additionally, the 25% of respondents who rated the pace of economic growth as “too fast” were further asked what aspects of the local economy they feel are growing too quickly in Herriman. Comments mainly centered around infrastructure and traffic and how that is lagging behind building development.
Transportation in Herriman
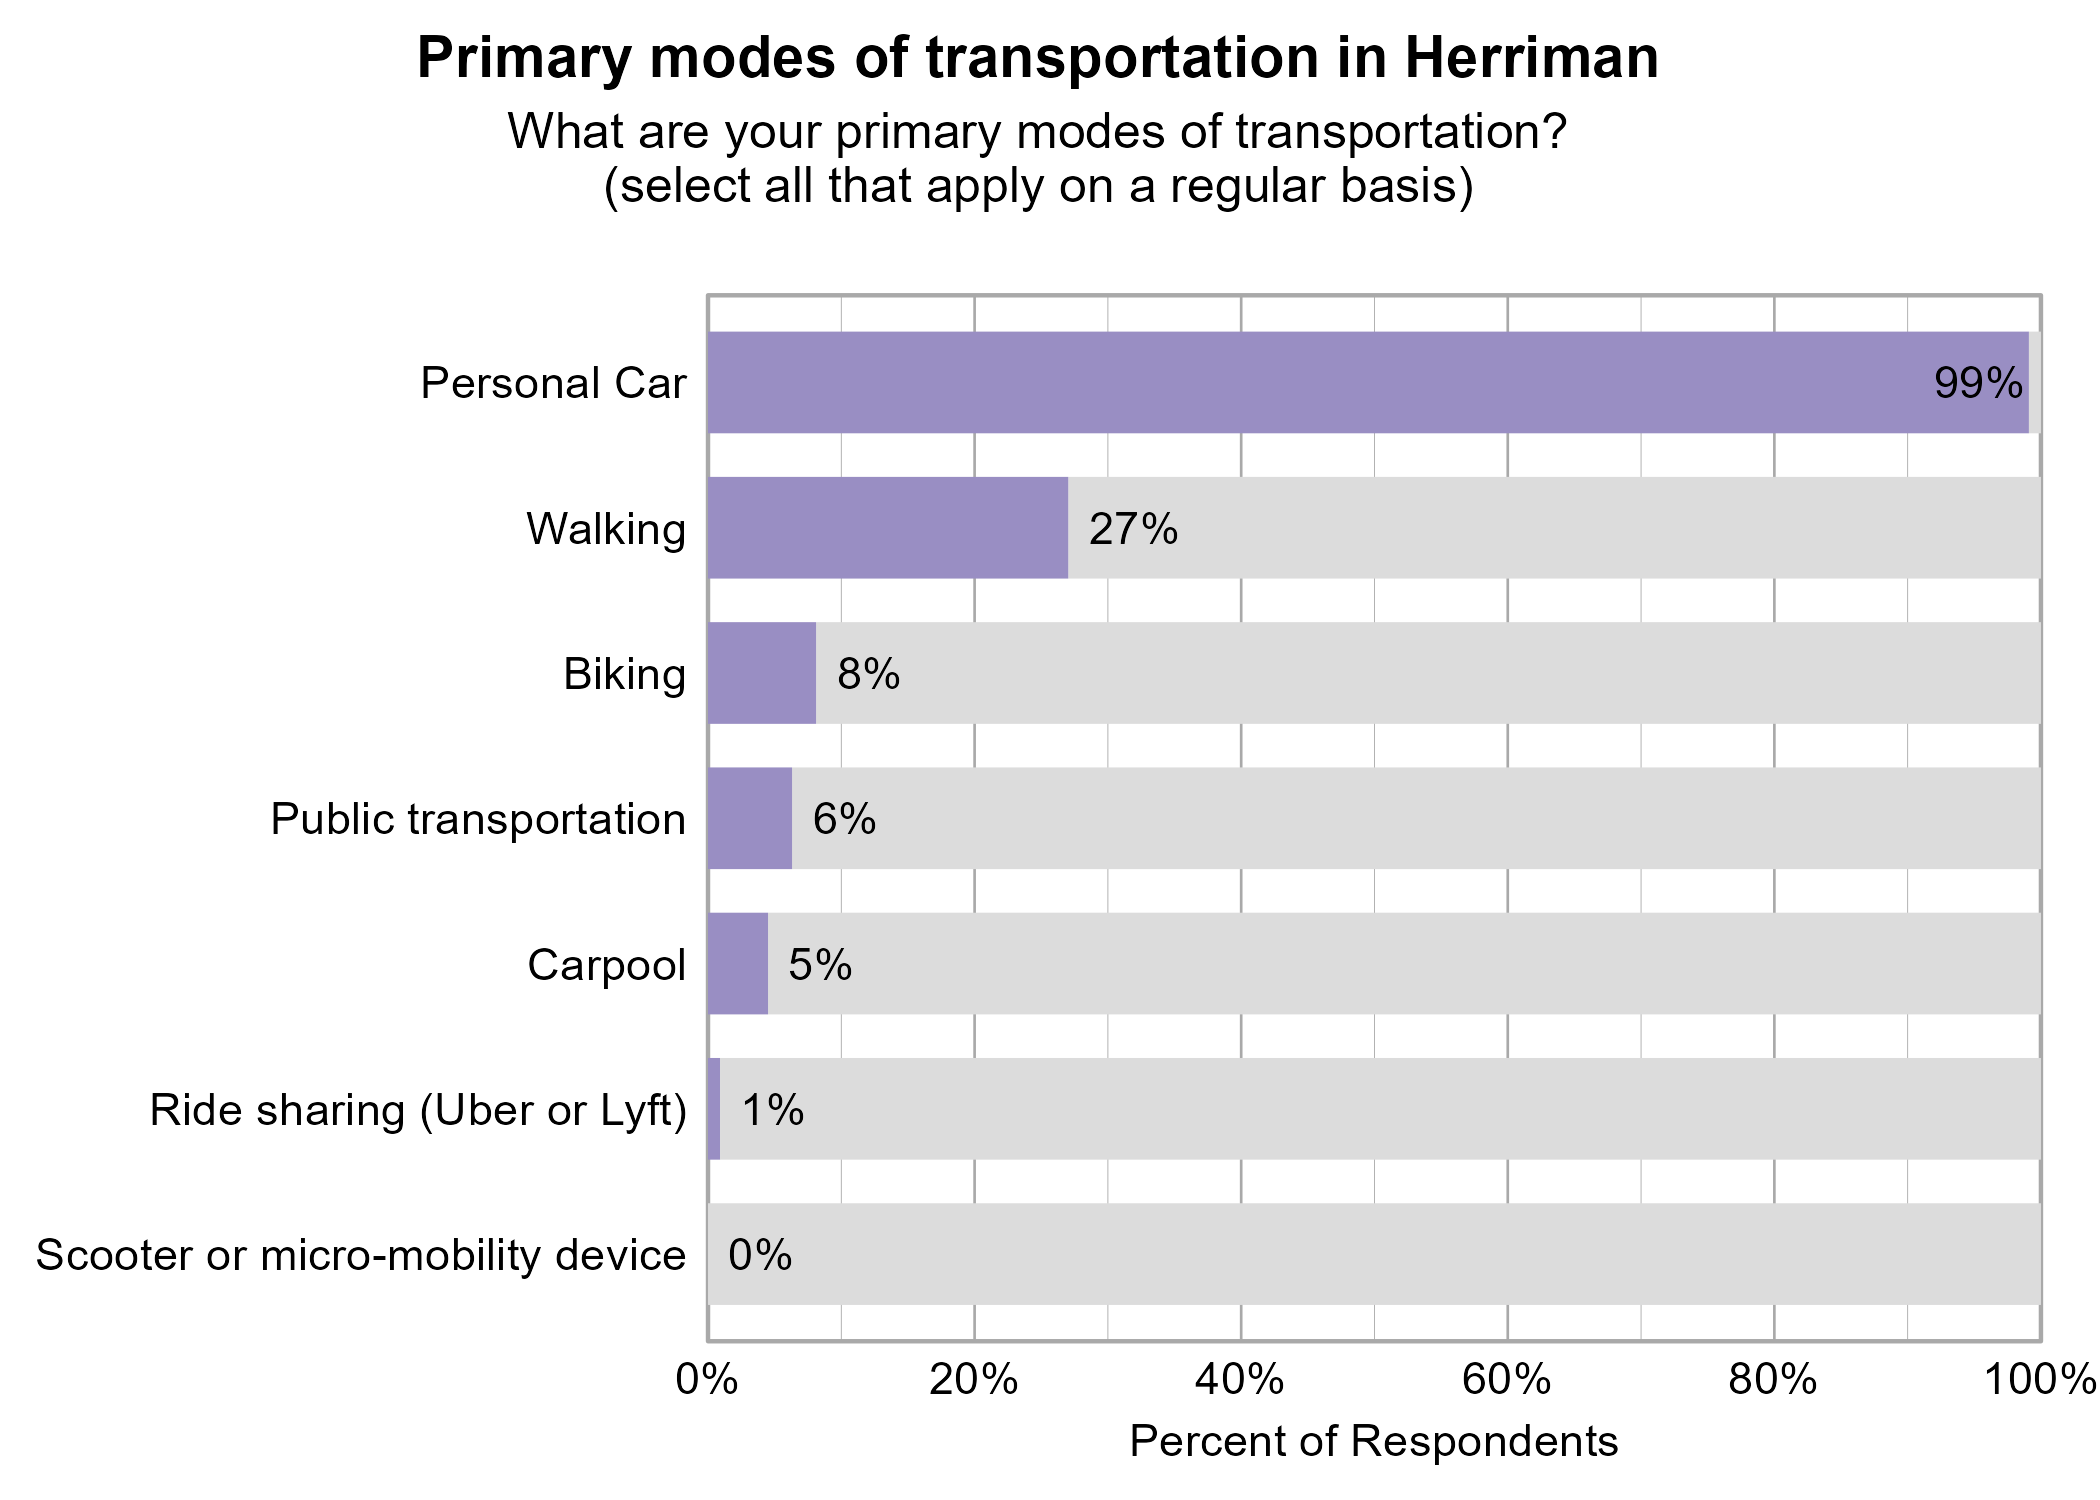
Respondents were asked to indicate all of their primary modes of transportation on a regular basis in Herriman. The most popular modes of transportation were personal car (99%) and walking (27%).
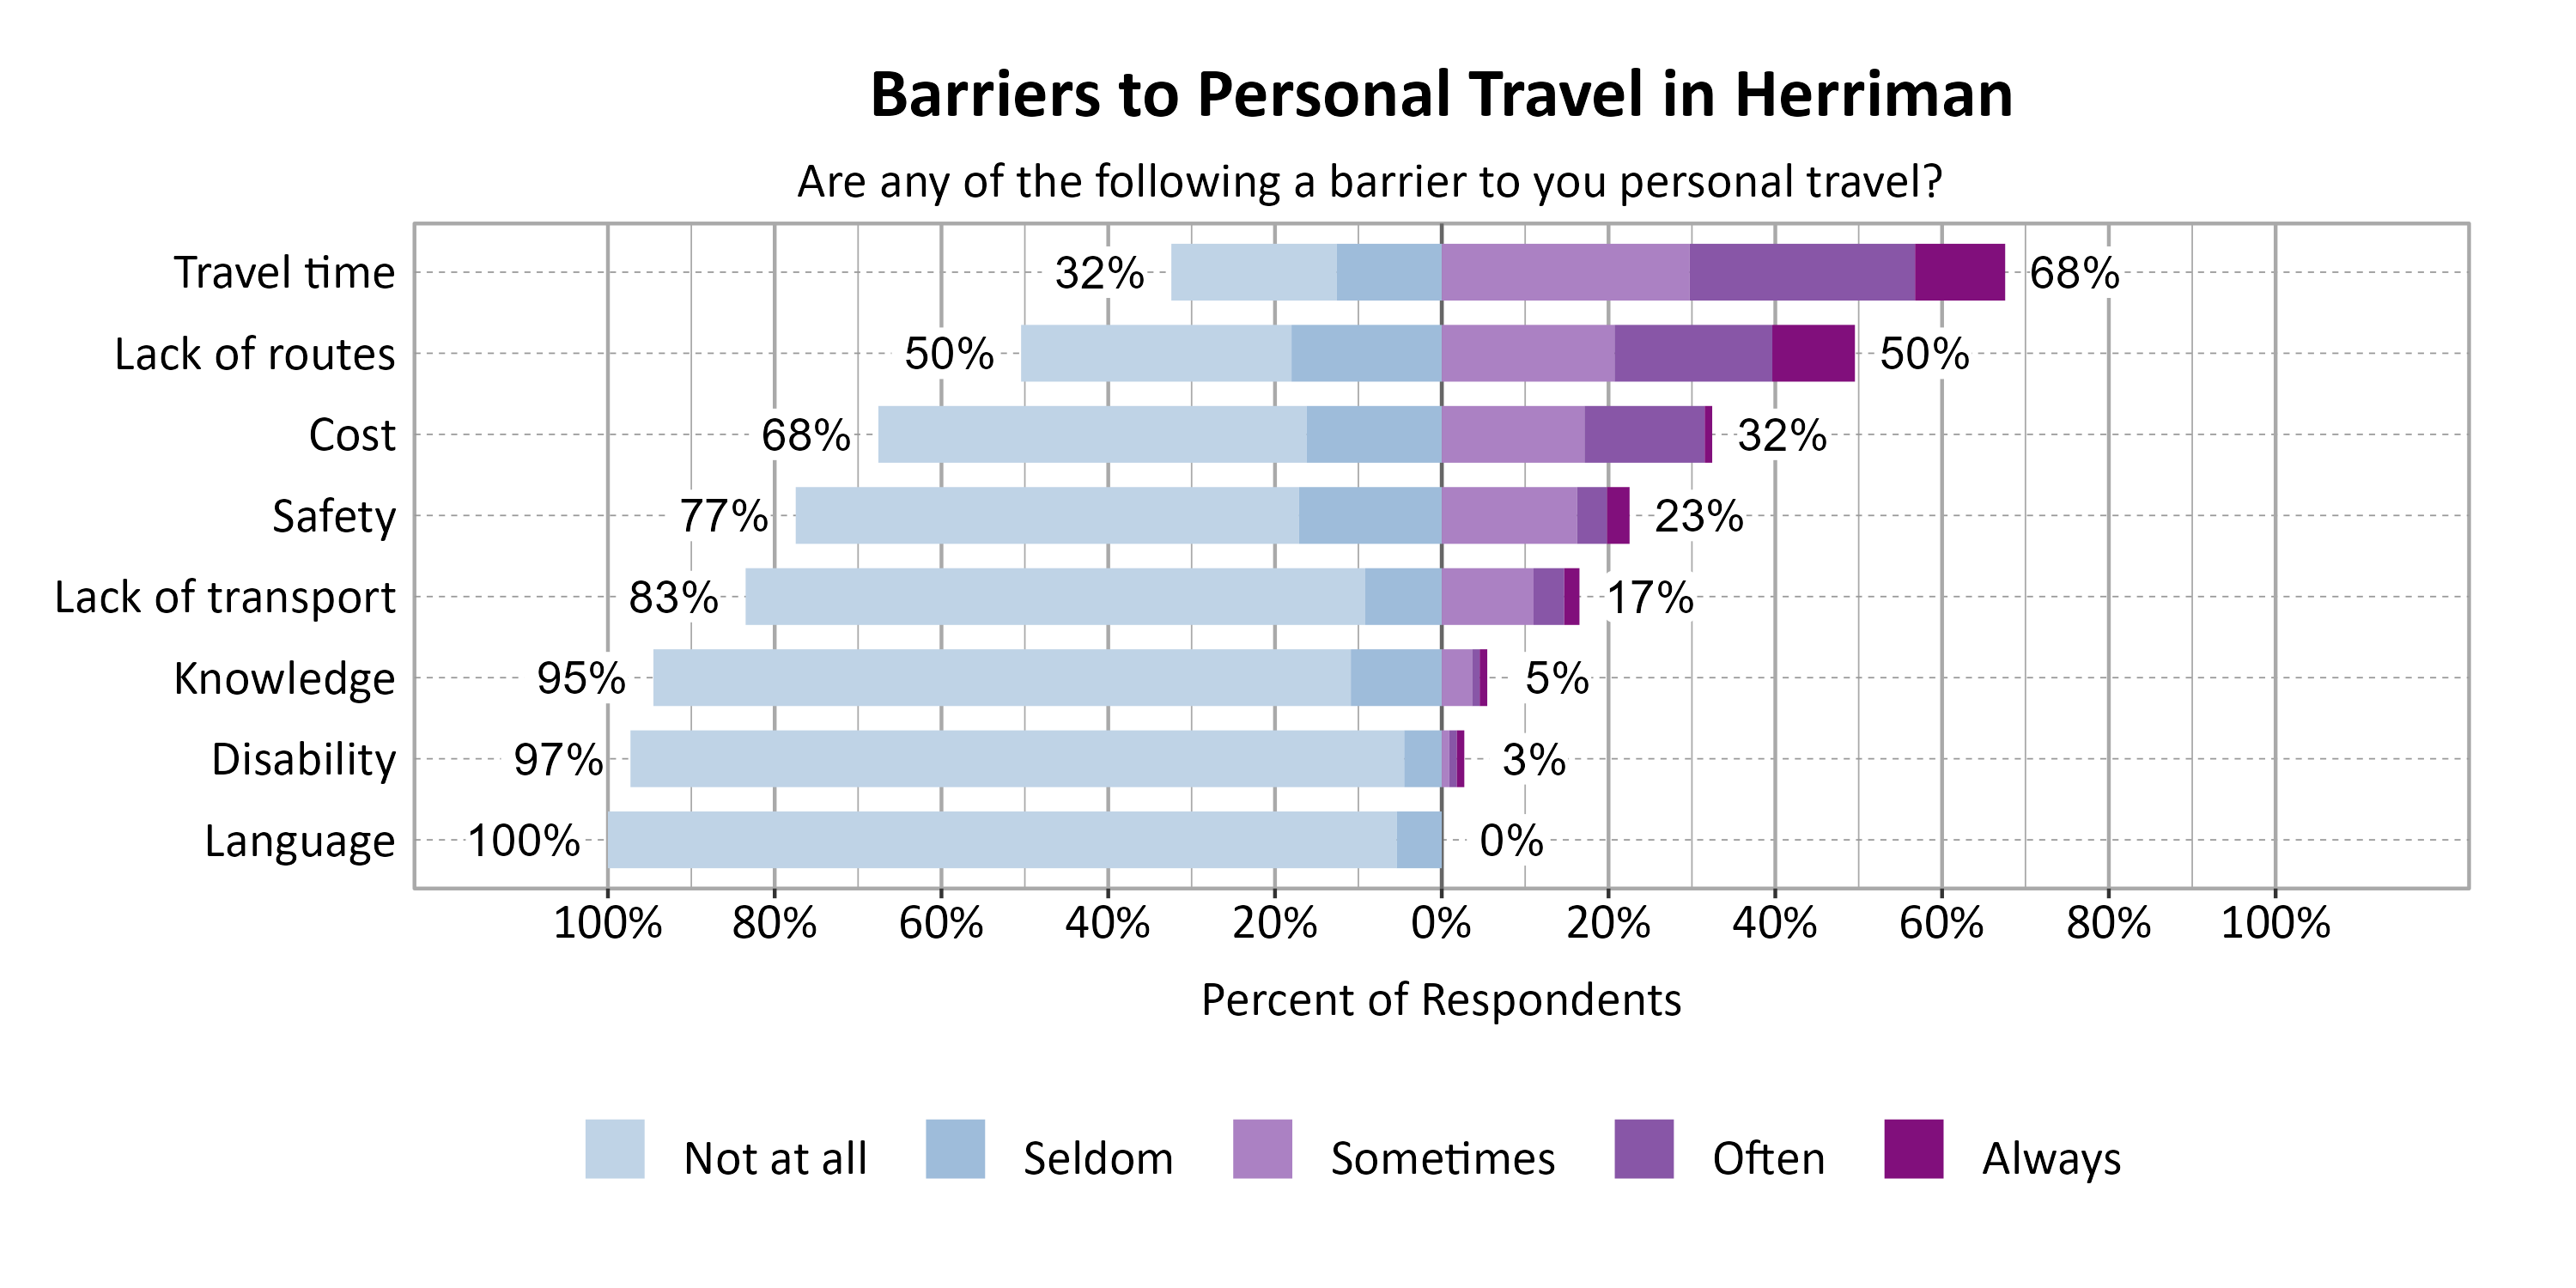
Respondents were asked to indicate the most common barriers to transportation in Herriman. The most problematic barriers were Travel time (68%) and Lack of routes (50%).
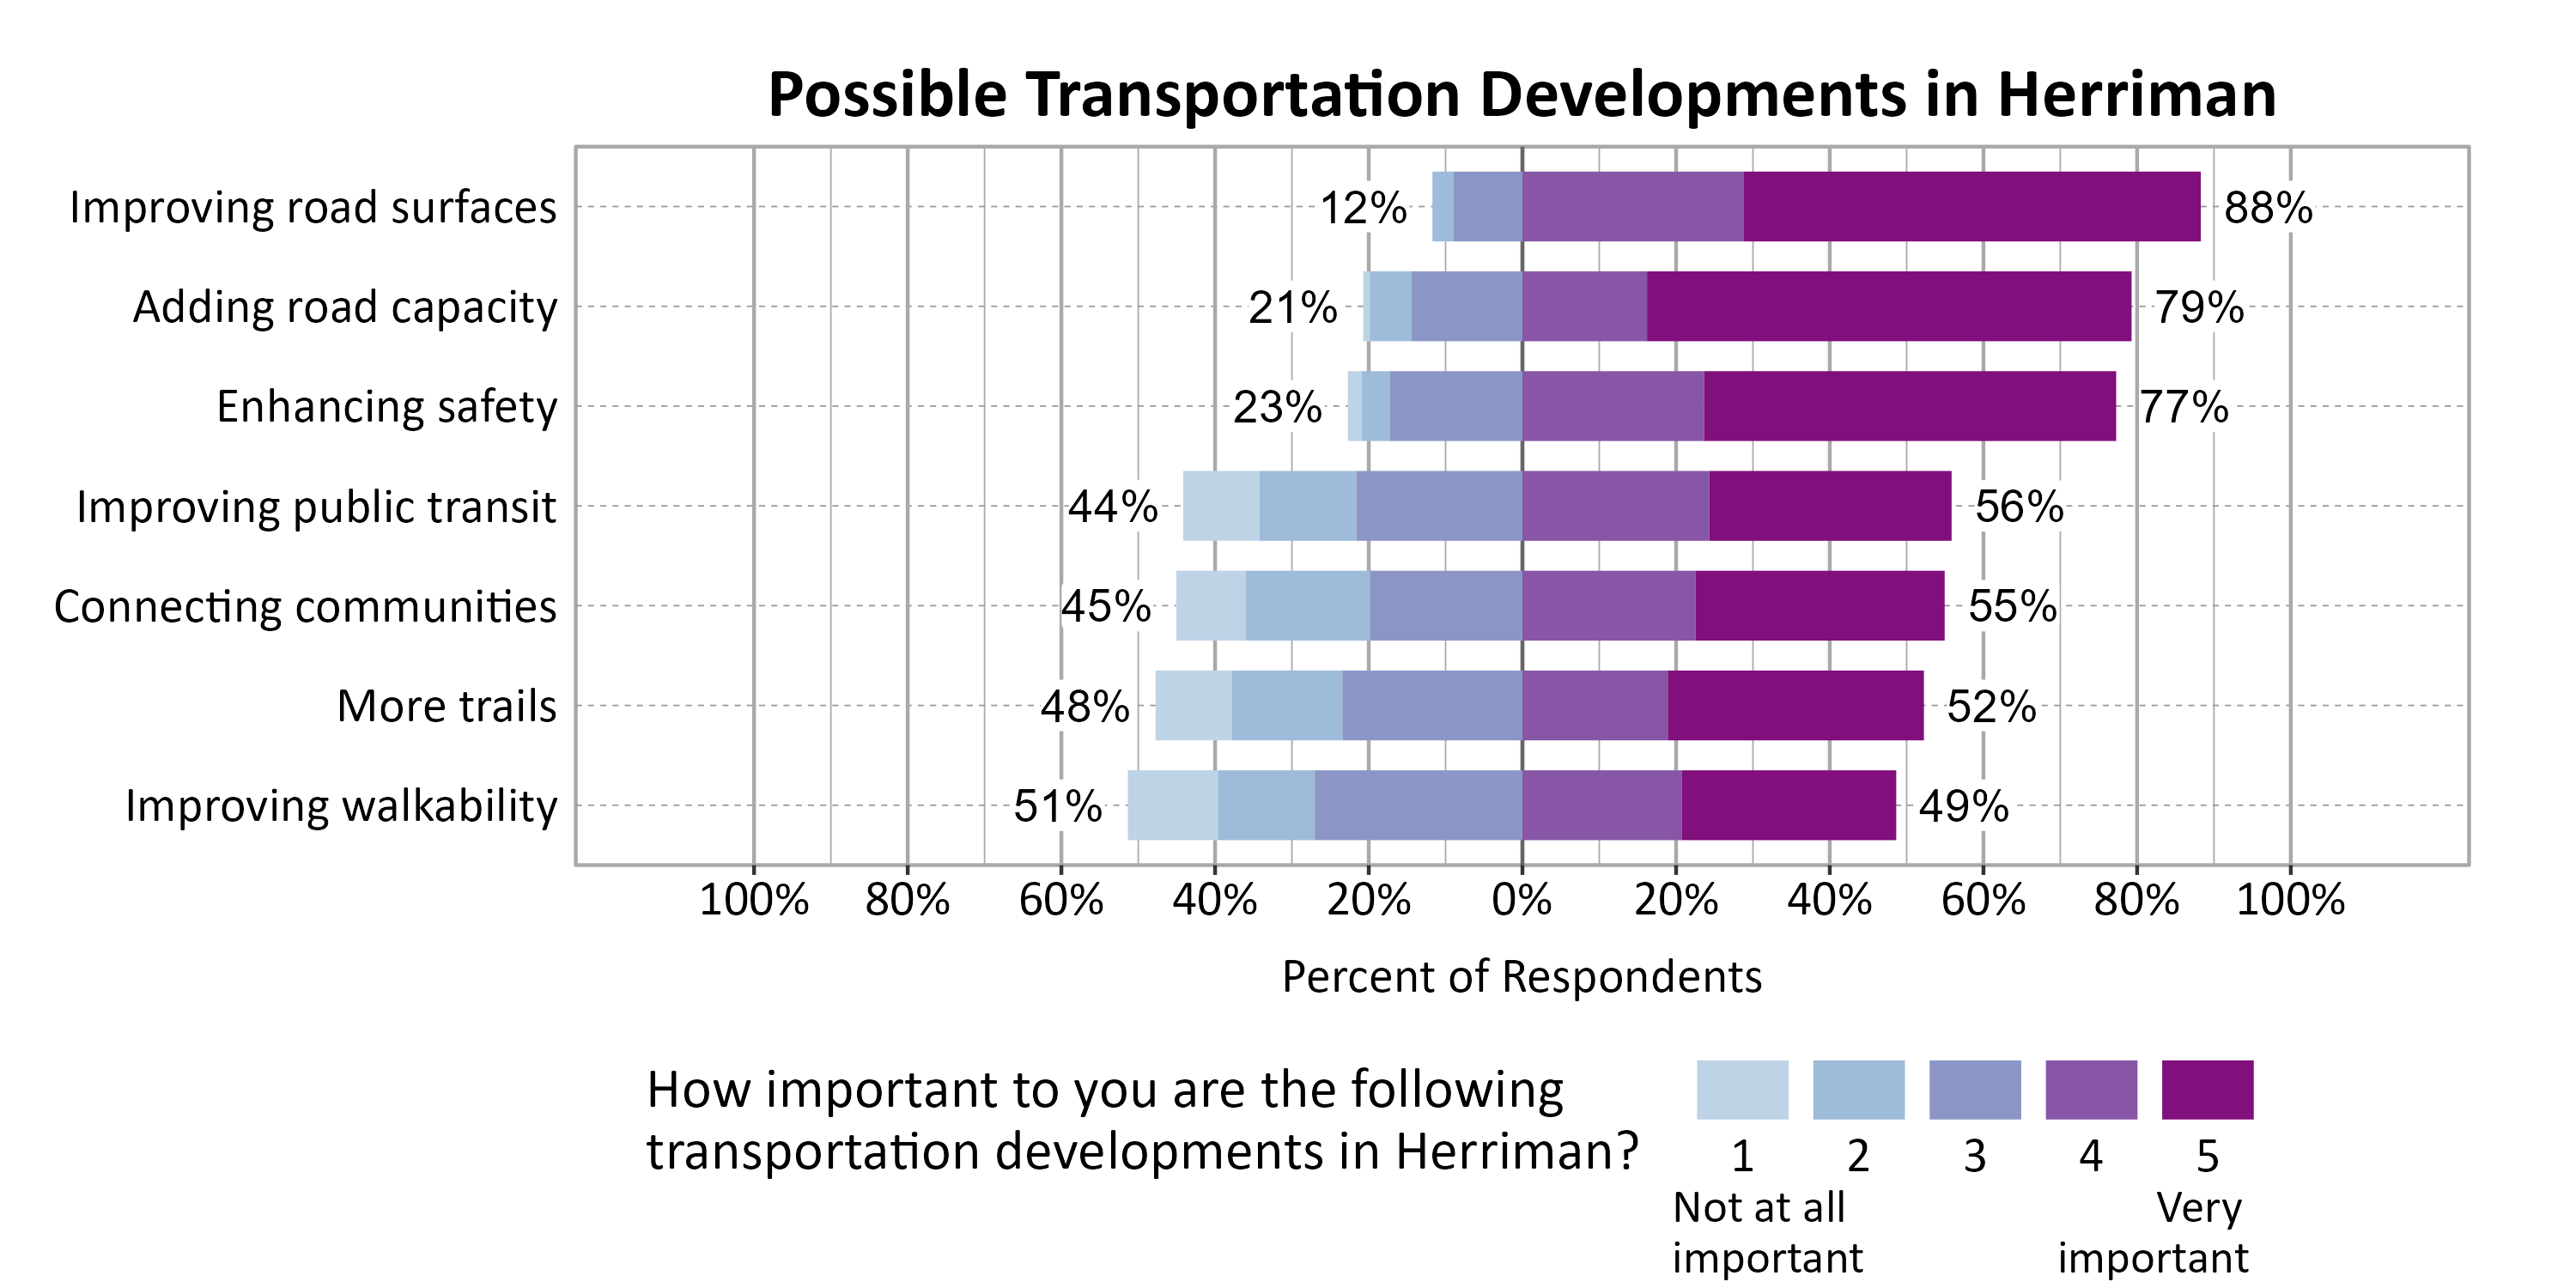
Respondents were asked to indicate the importance of a set of possible transportation developments in Herriman. The most important development to respondents were Improving road surfaces (88%), Adding road capacity (79%), and Enhancing safety (77%).
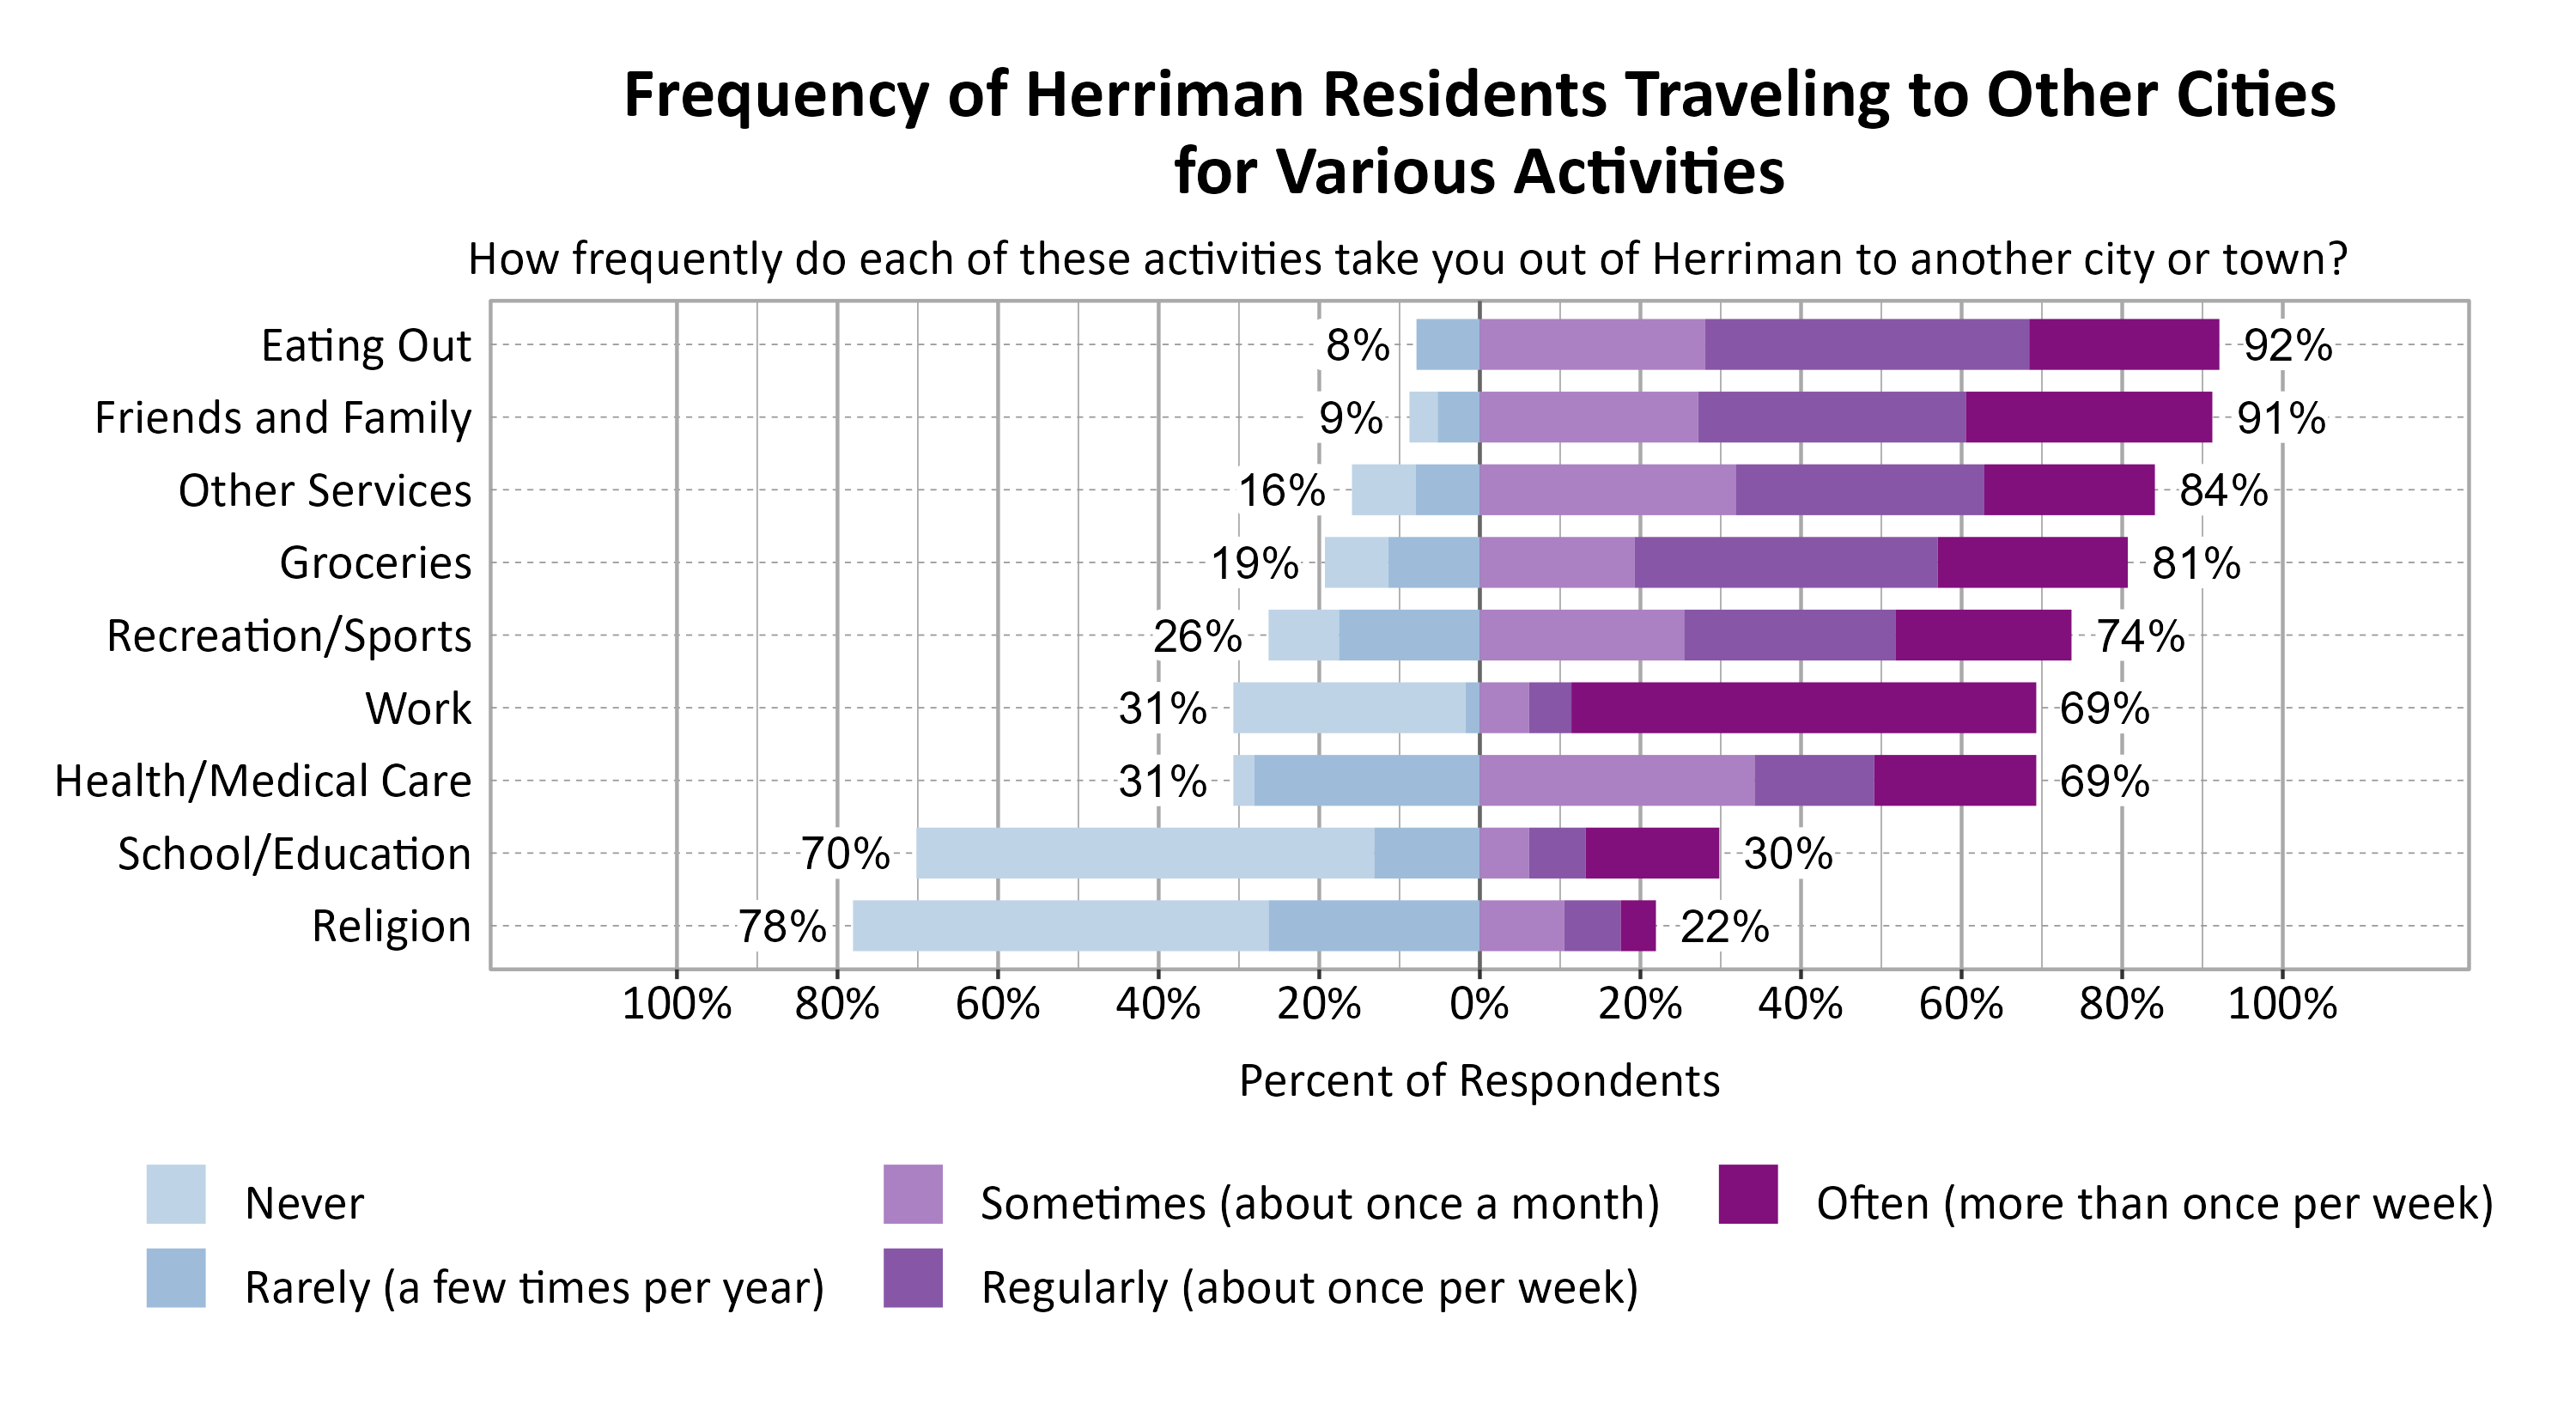
Respondents were asked to indicate how frequently various activities take them out of Herriman to another city or town. The most commonly indicated reasons for traveling to another city or town at least sometimes or once a month were Eating Out (92%), Friends and Family (91%), and Other Services (84%).
Concerns in Herriman
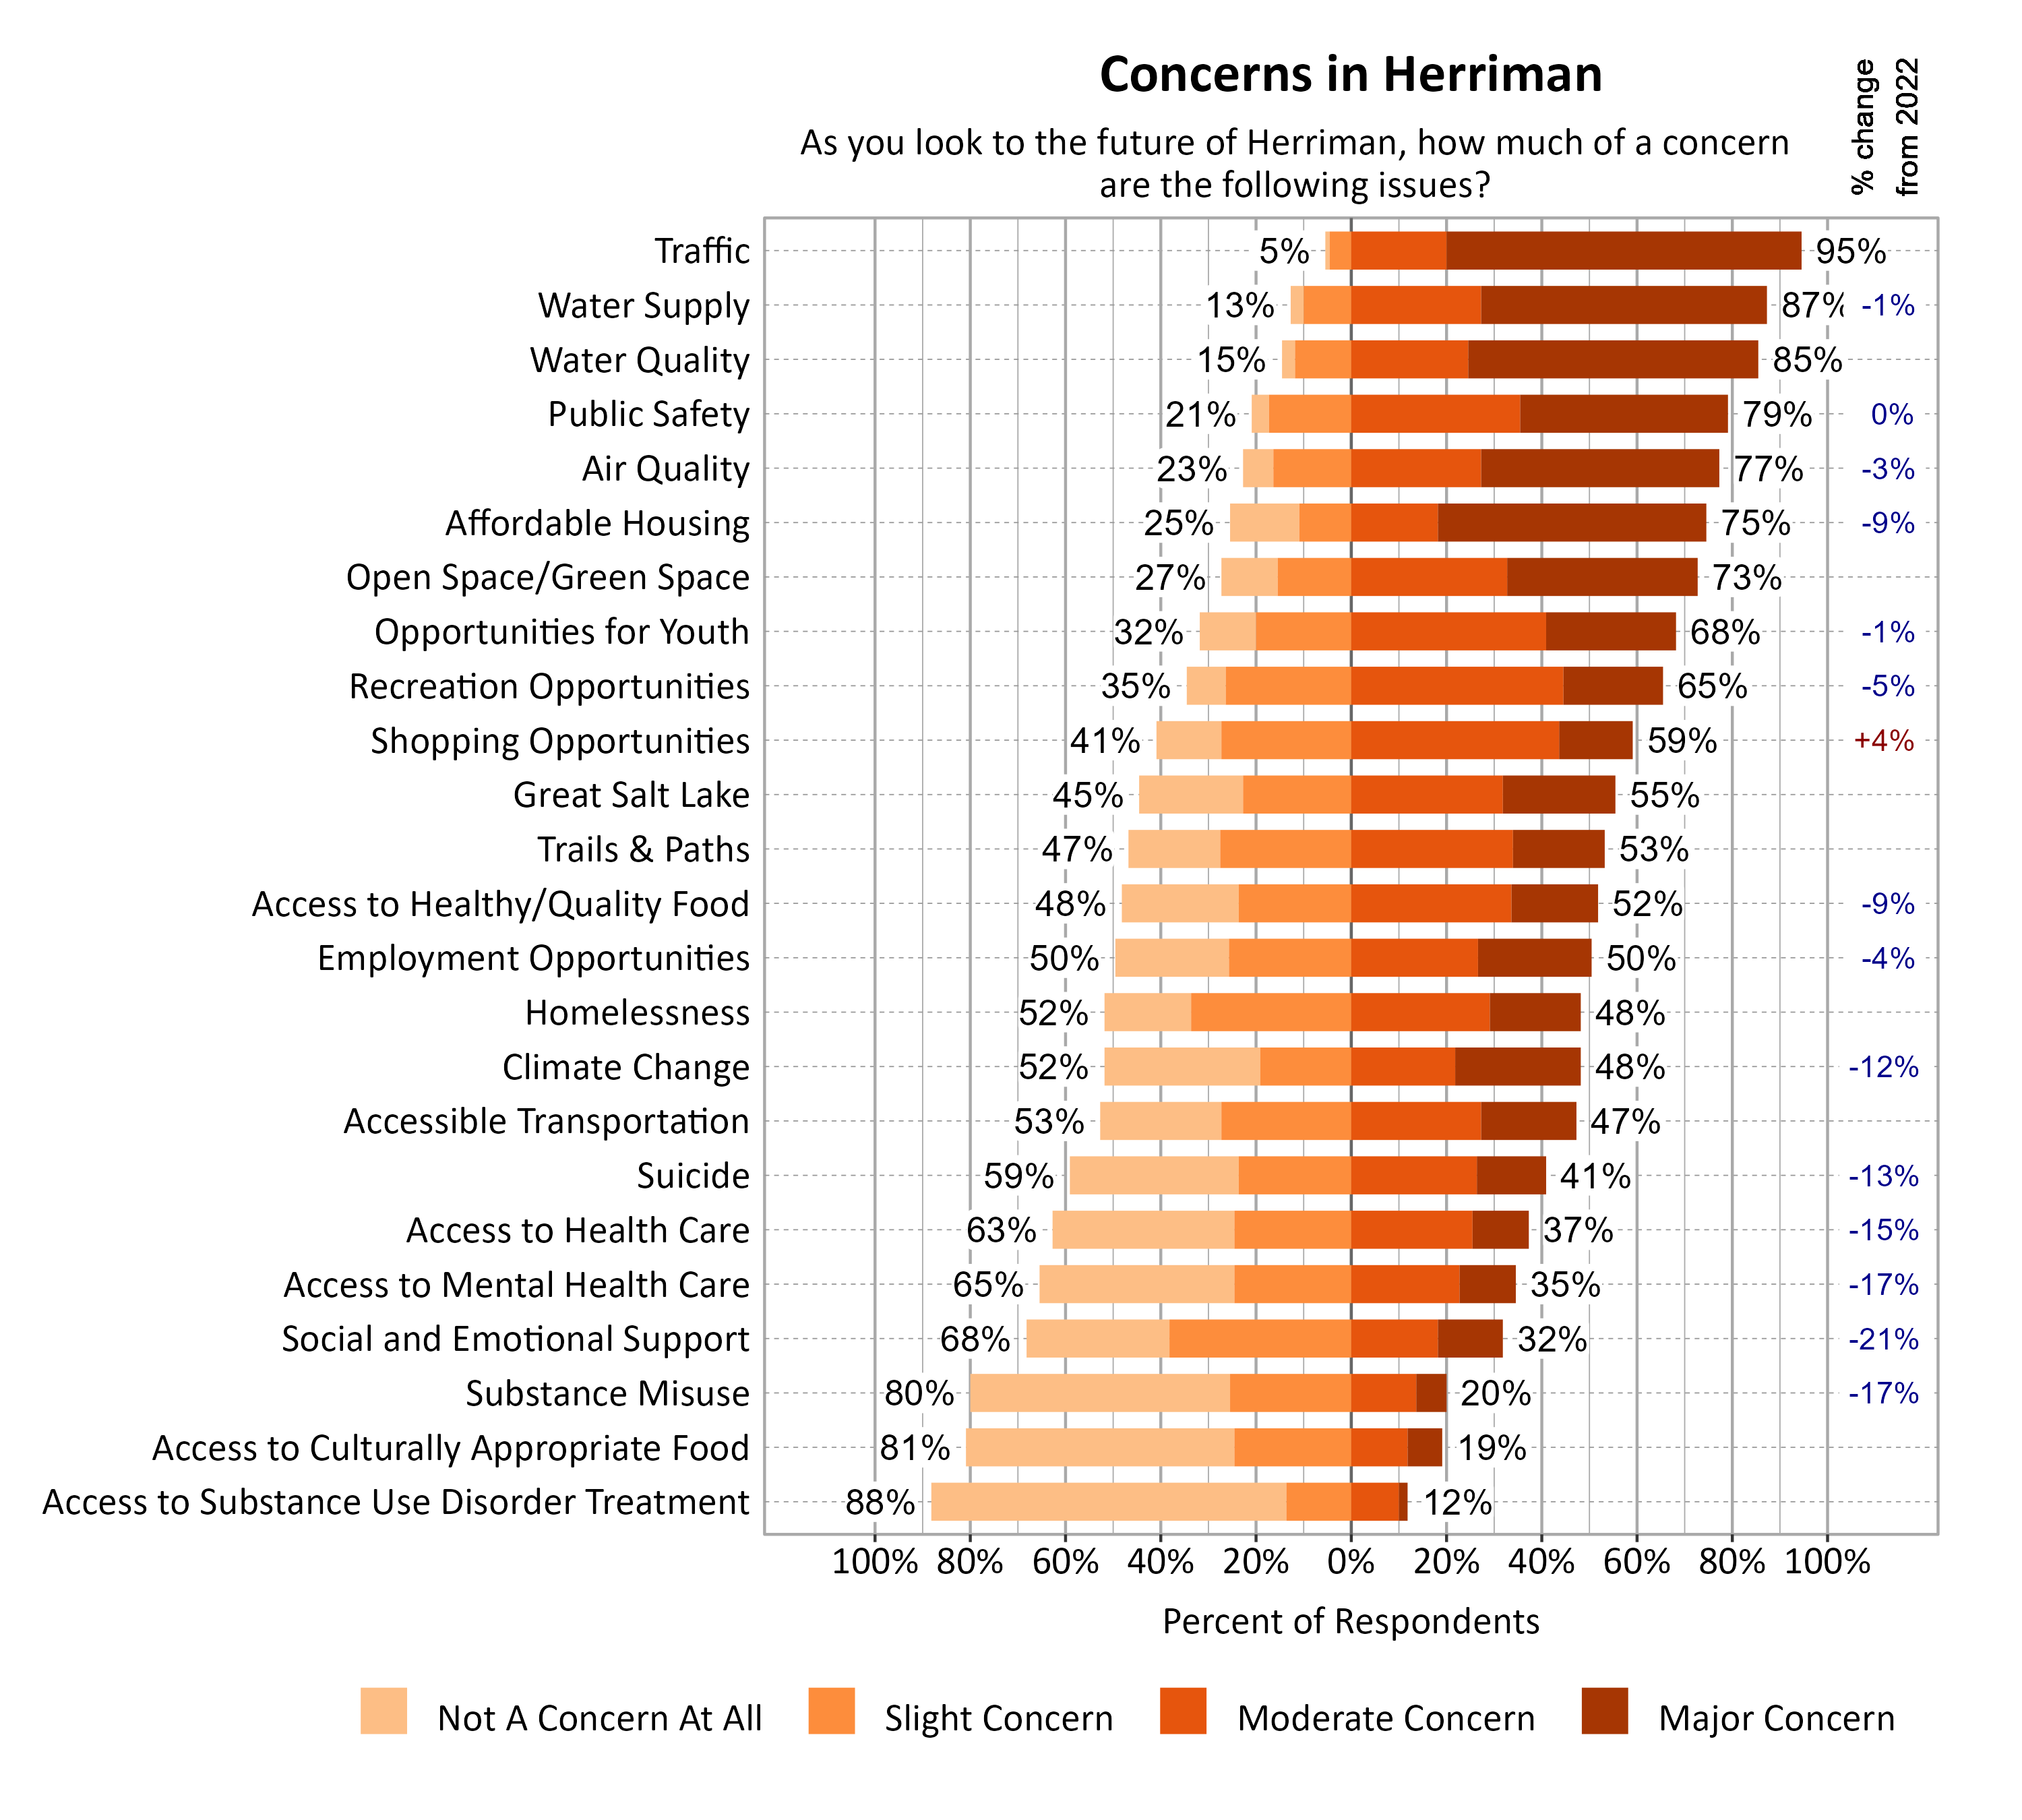
Survey respondents indicated the degree to which a number of possible local issues were a concern as they look to the future of Herriman. Traffic (95%), Water Supply (87%), and Water Quality (85%) were the top concerns. Since 2022, moderate or major concern about social and emotional support (-21%), access to mental health care (-17%), substance misuse (-17%), access to health care (-15%), suicide (-13%), and climate change (-12%) notably decreased.
Additional Questions for Herriman
Commuting and Transportation in Herriman
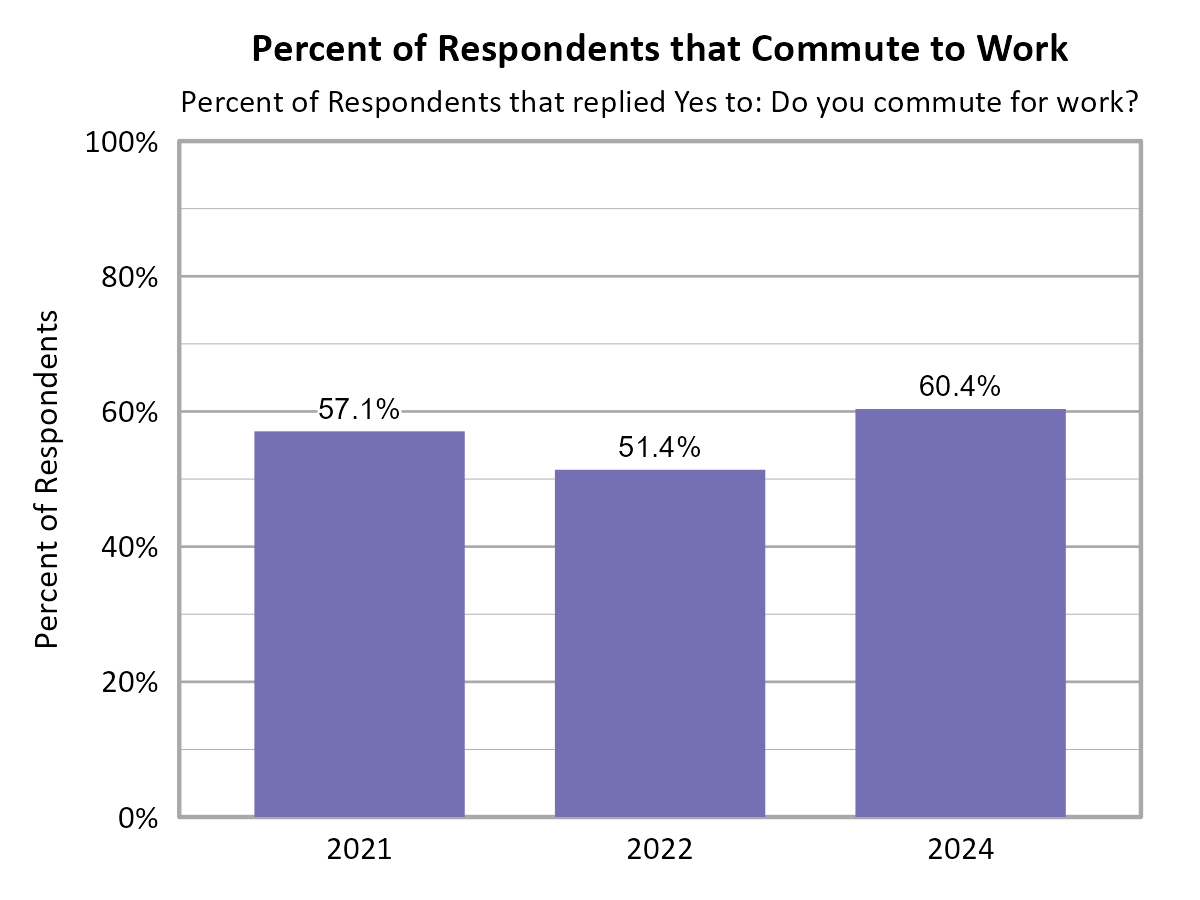
Survey respondents from 2021, 2022, and 2024 survey years were asked whether or not they commuted to work. The results from each year are shown below. In 2024, 60.4% of respondents indicated that they commuted to work.
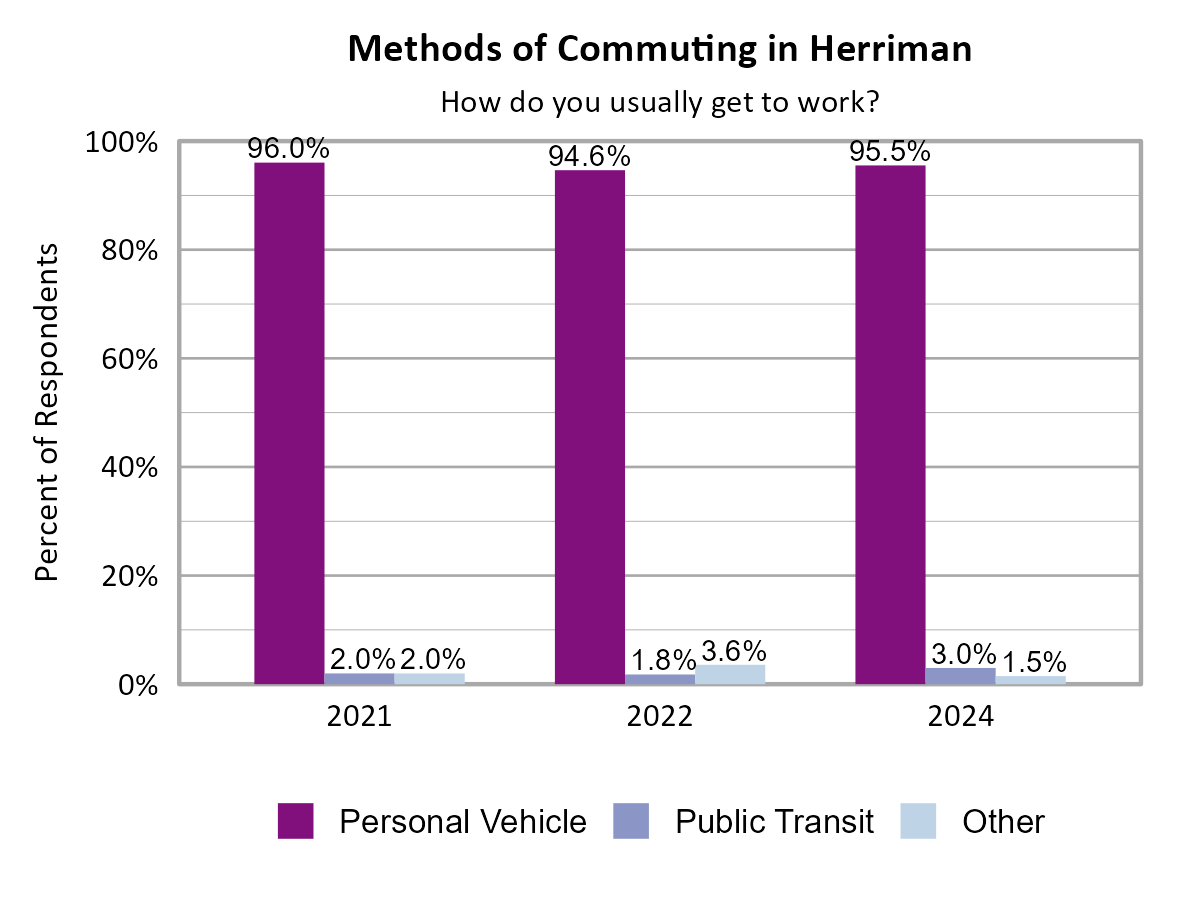
For survey participants that indicated they commute, they were also asked how they commute to work. The most common method for each survey year is a personal vehicle. Other forms of commuting included work vehicles.
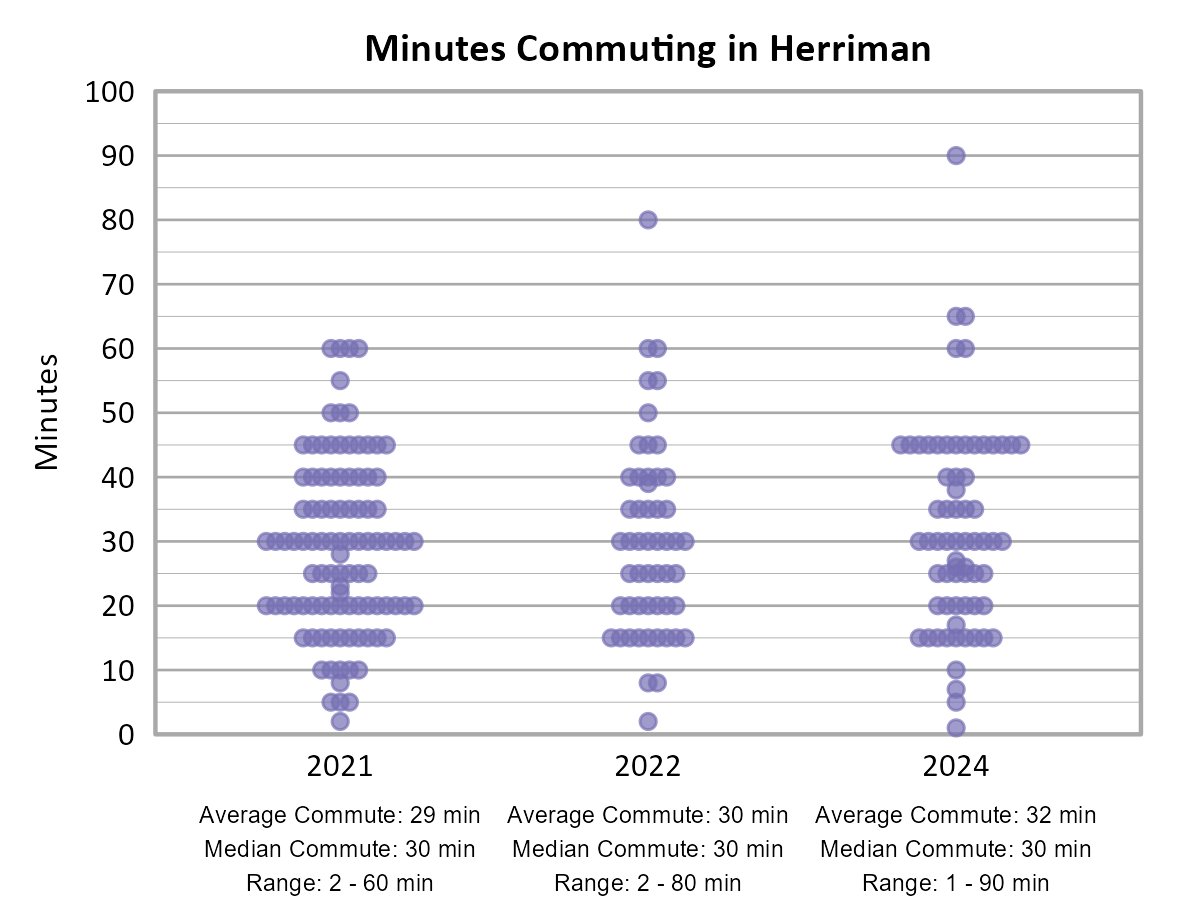
Additionally, survey participants were asked how long their commute was, and the distribution of each survey year can be seen below. The average, median, and range of commute times has stayed fairly consistent between survey years.
Open Comments
All open comments collected in the survey were shared with city leaders. General observations and themes are shared here.
What Respondents Value Most in Herriman
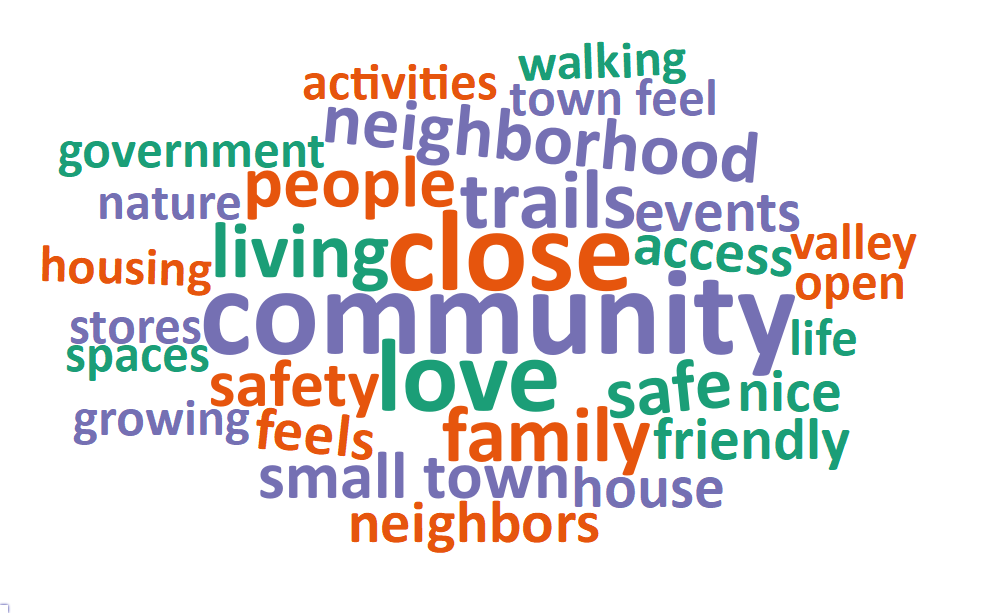
Survey respondents were asked to comment on what they value most about Herriman. The most common words and phrases from all city comments are included in the word cloud below. It is possible that negative or unrelated words may appear since these words have been taken out of context, and they may not indicate the respondent’s intended meaning. Most comments indicated that Herriman’s social climate was what they valued most, usually due to connections to family or strong communities. There were several comments that addressed valuing the city character, access to nature and recreation, safety, and peace and quiet. There was a significant number of negative comments, especially from individuals who felt they used to value things like community, small town feel, open spaces, etc. but feel that there is too much development now.
Local Environmental Quality in Herriman
The 64% of respondents who rated the Local Environmental Quality domain as 1, 2, or 3 (Poor, Fair, or Moderate) were further asked if there are specific aspects of local environmental quality that they feel are problematic. Overall air quality was a major concern affecting the public health local environmental quality. Concerns about traffic and need to alternative modes of transportation were common. There were also many mentions of wanting/needing more green or open spaces.
Improving Wellbeing in Herriman
Survey respondents were asked if there is anything that could be done to improve wellbeing in Herriman. Comments overwhelmingly addressed transportation, housing, and/or growth and development. Many expressed that there has been too much focus on building high-density housing and not enough focus on creating sufficient transportation infrastructure to accommodate that housing. The majority of commenters expressed that their wellbeing would be improved if the city focused on improving transportation infrastructure, particularly creating more roads going east/west, fixing other traffic problems, and providing more public transportation options. A few also addressed recreation and requested more access to things like trails, the nearby reservoir, and other recreational activities in the city.
Additional Comments
Respondents were also asked if they had any additional comments on wellbeing in Herriman. Many comments addressed transportation issues, primarily around traffic, traffic control, and road upkeep. There were also several concerns about growth and development and effects on the economy, such as increased taxes. Some comments requested more access to recreation and more affordable options for restaurants and retail.