Hyrum Wellbeing Survey Findings 2024

By Dr. Courtney Flint and Team


utah wellbeing survey logo

Contact Information

Summary

Hyrum is one of 51 cities participating in the Utah Wellbeing Survey Project in 2024. This project is designed to assess the wellbeing and local perspectives of city residents and to provide information to city leaders to inform general planning processes. Additional analysis is underway and this report may be updated over time.

We are grateful to all those who took the survey and to our city partners who helped to make this possible. We are grateful to a number of entities for funding: the Utah League of Cities and Towns, USU Extension, USU’s Institute for Land Water and Air, the Wasatch Front Regional Council, Utah Department of Transportation, the Utah Agricultural Experiment Station, and the cities of Alpine, Cedar Hills, Draper, Millcreek, Nephi, North Salt Lake, Ogden, Orem, Pleasant Grove, Providence, Springdale, Tremonton, West Bountiful, and West Valley City.

This report describes findings from the 2024 Hyrum survey and comparative information with other project cities. In April and May 2024, Hyrum City advertised the survey for residents largely through social media. All city residents age 18+ were encouraged to take the online Qualtrics survey.

How many people responded?

  • 306 viable surveys were recorded in this 2024 survey effort.
  • The adult population of Hyrum was estimated at 6,374, based on the American Community Survey by the U.S. Census. The 306 survey responses in 2024 represent 4.8% of the adult population and have a conservative margin of error of 5.47%.

Survey Respondent Characteristics

Resident Statistics
Full Time Residents of Hyrum 98.4%
Part Time Residents of Hyrum 1.6%
Length of Residency — Range 0.4-88 years
Length of Residency — Average 17.4 years
Length of Residency — Median 10 years
Length of Residency 5 Years or less 34.4%

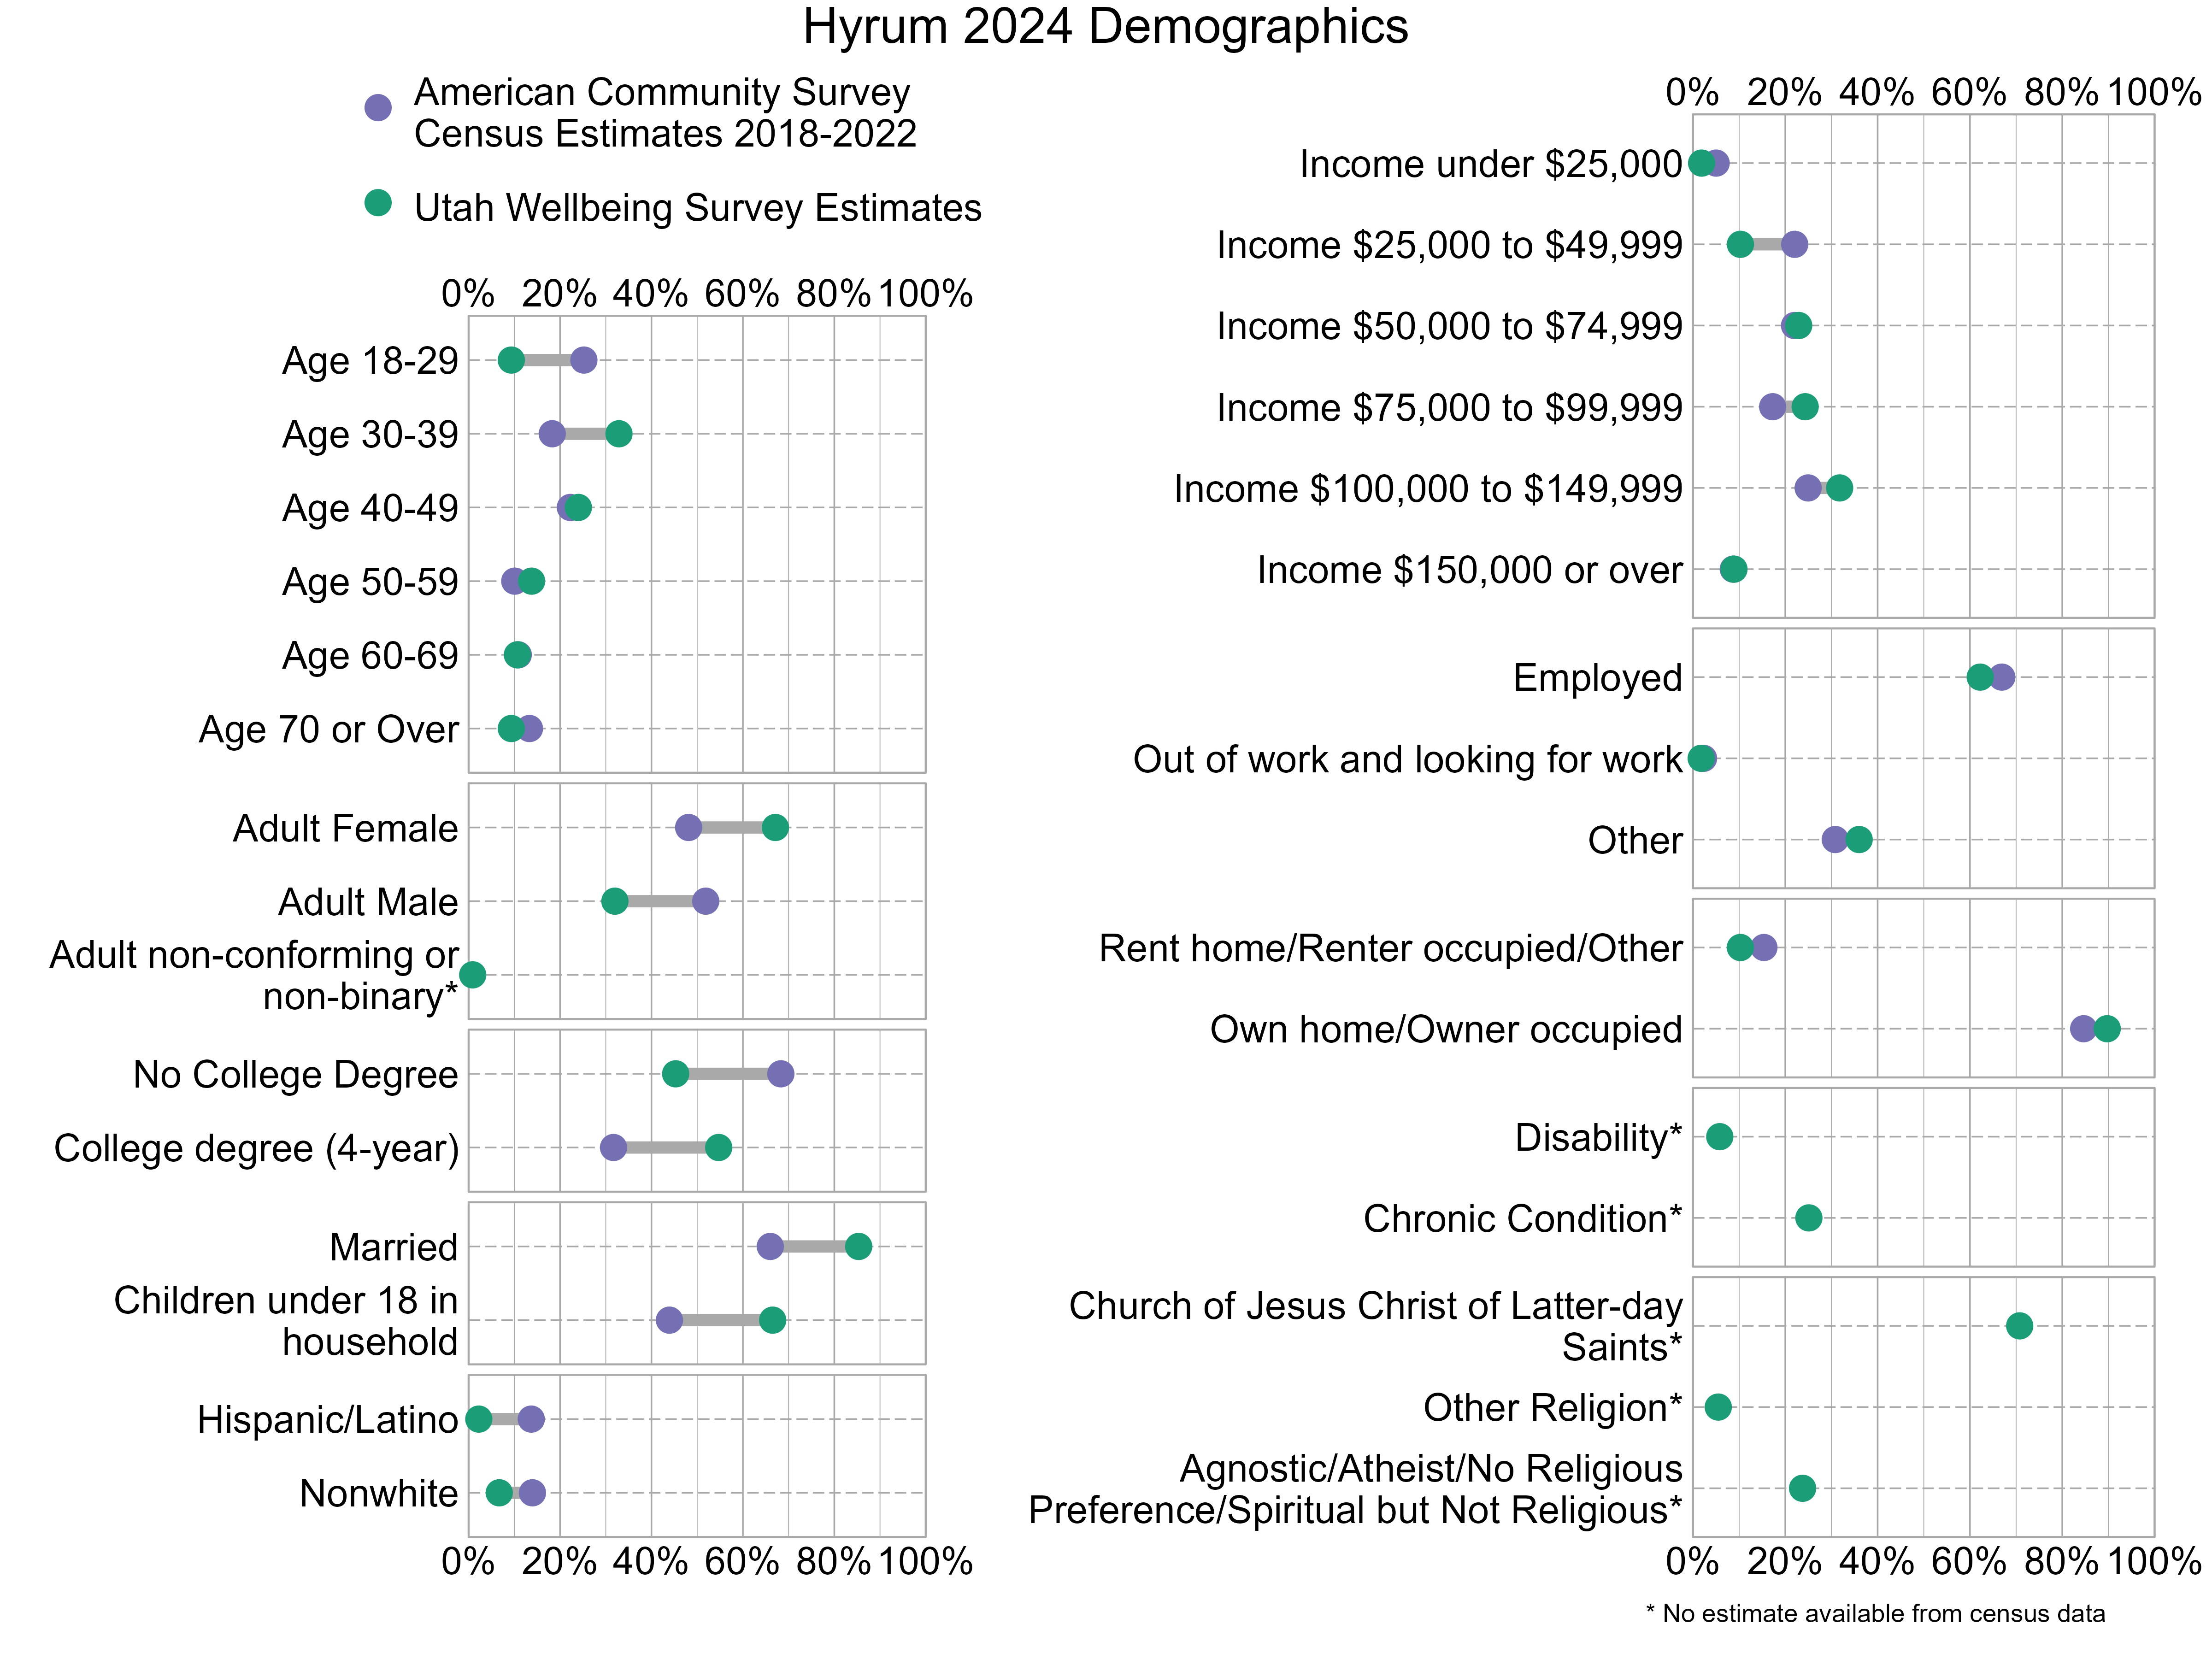
Demographic characteristics of the survey respondents were compared below with U.S. Census information from the 2018-2022 American Community Survey. In the graph below, gray bars indicate differences between the American Community Survey estimates and the Utah Wellbeing Project surveys. The wider the gray bars, the larger the differences. Also note that estimates for religious affiliation, adult non-conforming or non-binary gender, disability, and chronic conditions are unavailable from the census data. There can also be a variable margin of error in the American Community Survey estimates, and caution should be used when comparing estimates. Not all respondents provided demographic information. As the graph shows, 2024 survey respondents were not fully representative of Hyrum. People who are adult females, have at least a 4-year college degree, are married, and have children under 18 in their household were overrepresented while those who are age 18-29, are adult males, and do not have a college degree were underrepresented.

Dot Plot. Title: Hyrum 2024 Demographics. Data — Age 18-29: American Community Survey Estimate: 25%, Utah Wellbeing Survey Estimate: 9%; Age 30-39: American Community Survey Estimate: 18%, Utah Wellbeing Survey Estimate: 33%; Age 40-49: American Community Survey Estimate: 22%, Utah Wellbeing Survey Estimate: 24%; Age 50-59: American Community Survey Estimate: 10%, Utah Wellbeing Survey Estimate: 14%; Age 60-69: American Community Survey Estimate: 11%, Utah Wellbeing Survey Estimate: 11%; Age 70 or Over: American Community Survey Estimate: 13%, Utah Wellbeing Survey Estimate: 9%; Income under $25,000: American Community Survey Estimate: 5%, Utah Wellbeing Survey Estimate: 2%; Income $25,000 to $49,999: American Community Survey Estimate: 22%, Utah Wellbeing Survey Estimate: 10%; Income $50,000 to $74,999: American Community Survey Estimate: 22%, Utah Wellbeing Survey Estimate: 23%; Income $75,000 to $99,999: American Community Survey Estimate: 17%, Utah Wellbeing Survey Estimate: 24%; Income $100,000 to $149,999: American Community Survey Estimate: 25%, Utah Wellbeing Survey Estimate: 32%; Income $150,000 or over: American Community Survey Estimate: 9%, Utah Wellbeing Survey Estimate: 9%; Adult Female: American Community Survey Estimate: 48%, Utah Wellbeing Survey Estimate: 67%; Adult Male: American Community Survey Estimate: 52%, Utah Wellbeing Survey Estimate: 32%; Adult non-conforming or non-binary*: American Community Survey Estimate: NA%, Utah Wellbeing Survey Estimate: 1%; Employed: American Community Survey Estimate: 67%, Utah Wellbeing Survey Estimate: 62%; Out of work and looking for work: American Community Survey Estimate: 2%, Utah Wellbeing Survey Estimate: 2%; Other: American Community Survey Estimate: 31%, Utah Wellbeing Survey Estimate: 36%; No College Degree: American Community Survey Estimate: 68%, Utah Wellbeing Survey Estimate: 45%; College degree (4-year): American Community Survey Estimate: 32%, Utah Wellbeing Survey Estimate: 55%; Rent home/Renter occupied/Other: American Community Survey Estimate: 15%, Utah Wellbeing Survey Estimate: 10%; Own home/Owner occupied: American Community Survey Estimate: 85%, Utah Wellbeing Survey Estimate: 90%; Married: American Community Survey Estimate: 66%, Utah Wellbeing Survey Estimate: 85%; Children under 18 in household: American Community Survey Estimate: 44%, Utah Wellbeing Survey Estimate: 67%; Disability*: American Community Survey Estimate: NA%, Utah Wellbeing Survey Estimate: 6%; Chronic Condition*: American Community Survey Estimate: NA%, Utah Wellbeing Survey Estimate: 25%; Hispanic/Latino: American Community Survey Estimate: 14%, Utah Wellbeing Survey Estimate: 2%; Nonwhite: American Community Survey Estimate: 14%, Utah Wellbeing Survey Estimate: 7%; Church of Jesus Christ of Latter-day Saints*: American Community Survey Estimate: NA%, Utah Wellbeing Survey Estimate: 71%; Other Religion*: American Community Survey Estimate: NA%, Utah Wellbeing Survey Estimate: 5%; Agnostic/Atheist/No Religious Preference/Spiritual but Not Religious*: American Community Survey Estimate: NA%, Utah Wellbeing Survey Estimate: 24%

Overall Personal Wellbeing and Overall Wellbeing in Hyrum

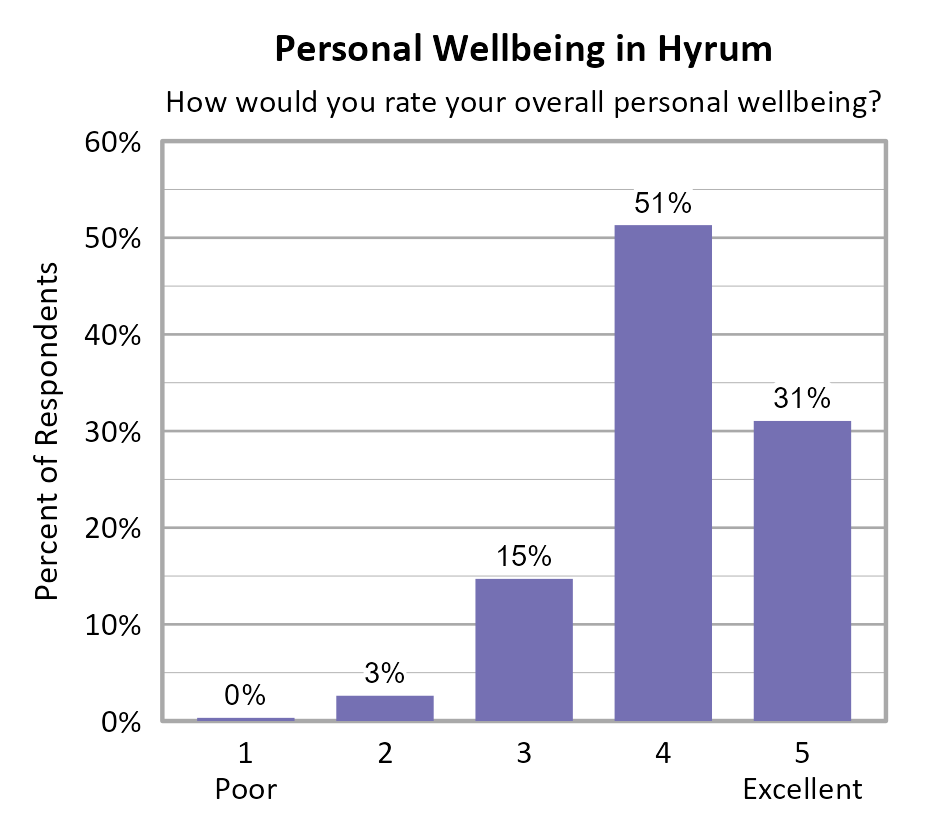
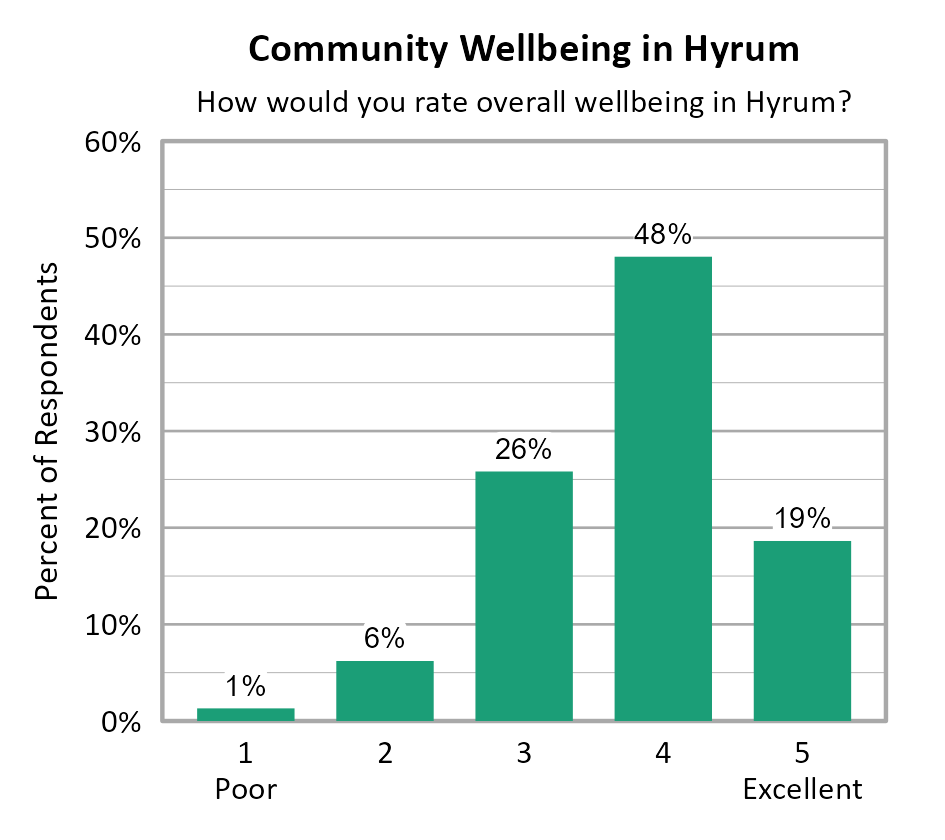
Survey participants were asked about their overall personal wellbeing and overall community wellbeing in Hyrum. These wellbeing indicators were both measured on a 5-point scale from poor (1) to excellent (5). The average personal wellbeing score in Hyrum was 4.10 with 82% of respondents indicating their wellbeing at a 4 or 5 on the 5-point scale. The average score for community wellbeing in Hyrum was 3.76 with 67% of respondents indicating community wellbeing at a 4 or 5 on the 5-point scale.

Bar Chart. Title: Personal Wellbeing in Hyrum. Subtitle: How would you rate your overall personal wellbeing? Data — 1 Poor: 0% of respondents; 2: 3% of respondents; 3: 15% of respondents; 4: 51% of respondents; 5 Excellent: 31% of respondents

Bar Chart. Title: Community Wellbeing in Hyrum. Subtitle: How would you rate overall wellbeing in Hyrum? Data — 1 Poor: 1% of respondents; 2: 6% of respondents; 3: 26% of respondents; 4: 48% of respondents; 5 Excellent: 19% of respondents

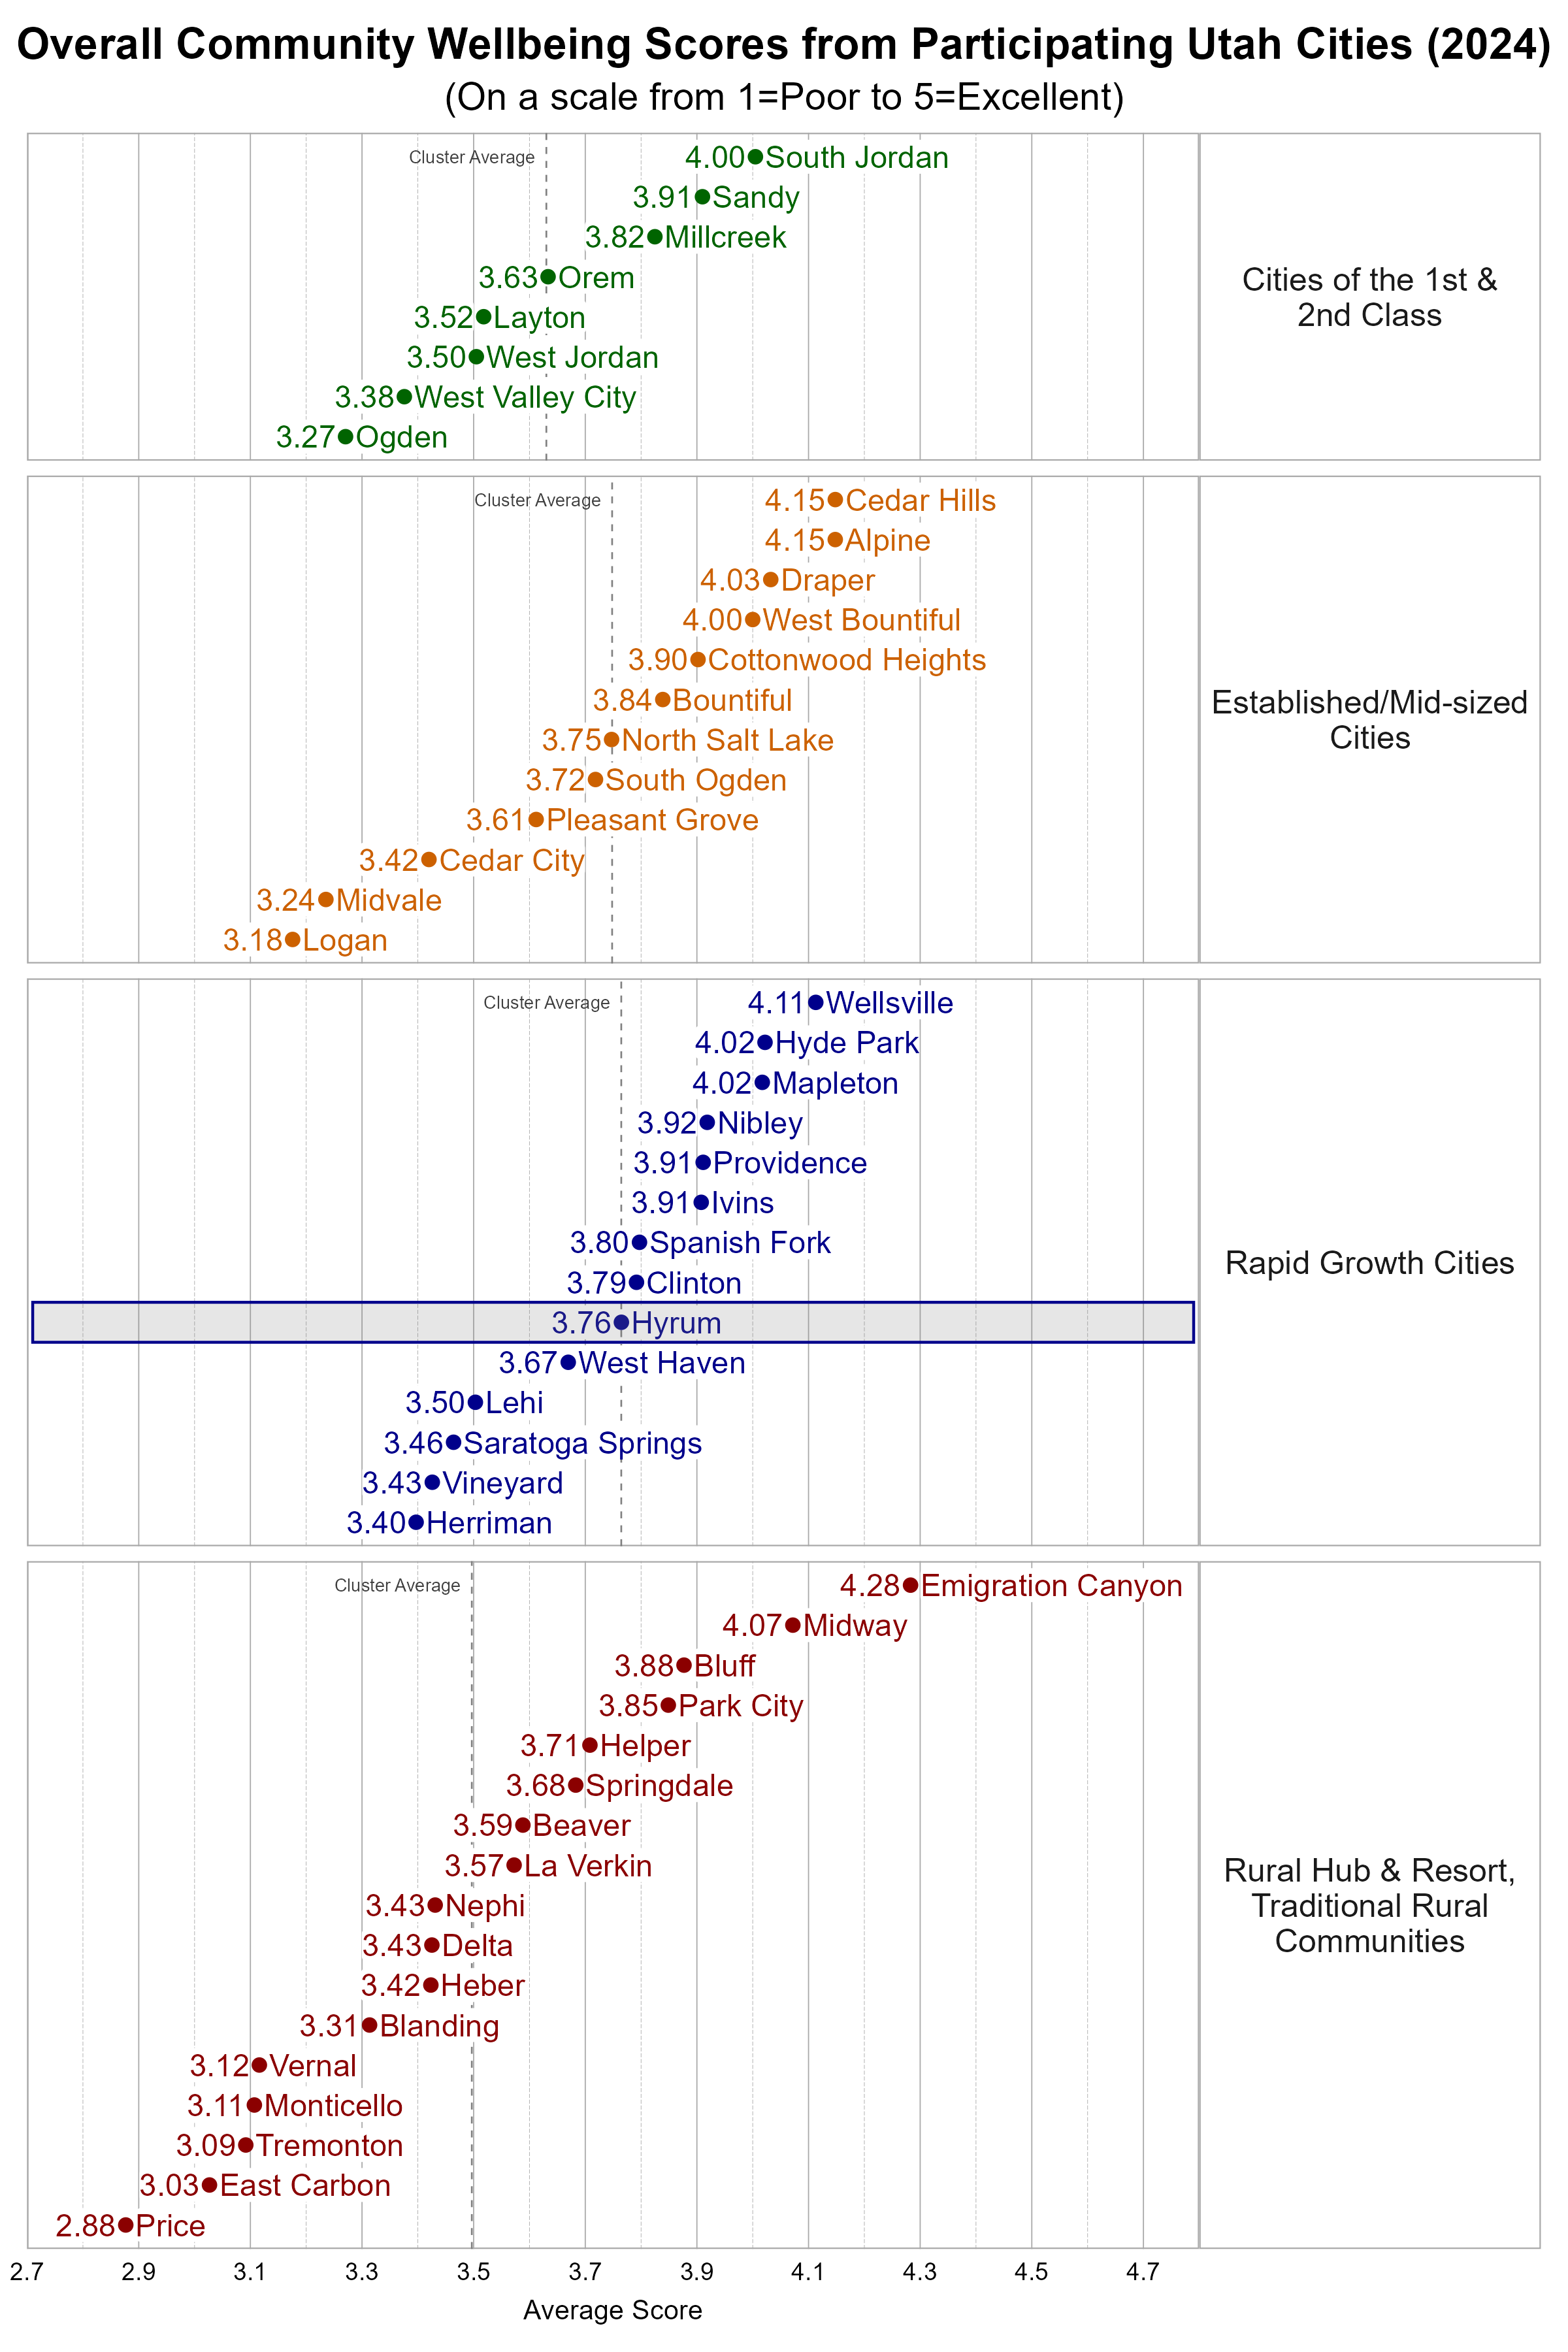
Comparing Wellbeing Across Utah Cities

The Utah League of Cities and Towns clusters cities and towns into five different categories based on size and growth rates. We utilize these clusters in our analysis. Hyrum is classified as a Rapid Growth City. Some cities may fit within more than one cluster.

Within the Rapid Growth city cluster, Hyrum was slightly below the average overall personal wellbeing score and slightly below the average overall community wellbeing score.

Dot Plot. Title: Overall Personal Wellbeing Scores from Participating Utah Cities (2024). Subtitle: (On a scale from 1=Poor to 5=Excellent). Data — Group: Cities of the 1st & 2nd Class — West Valley City Average Score 3.81; Ogden Average Score 3.91; Layton Average Score 3.96; West Jordan Average Score 4.01; Orem Average Score 4.05; South Jordan Average Score 4.13; Sandy Average Score 4.18; Millcreek Average Score 4.23; Group: Established/Mid-sized Cities — Logan Average Score 3.66; Midvale Average Score 3.71; Cedar City Average Score 3.94; South Ogden Average Score 4.04; Pleasant Grove Average Score 4.07; North Salt Lake Average Score 4.08; Bountiful Average Score 4.13; Draper Average Score 4.22; West Bountiful Average Score 4.22; Cottonwood Heights Average Score 4.29; Alpine Average Score 4.32; Cedar Hills Average Score 4.33; Group: Rapid Growth Cities — Herriman Average Score 3.97; Saratoga Springs Average Score 4.02; Lehi Average Score 4.05; Clinton Average Score 4.07; Hyrum Average Score 4.10; Spanish Fork Average Score 4.10; Nibley Average Score 4.14; West Haven Average Score 4.17; Vineyard Average Score 4.22; Hyde Park Average Score 4.23; Wellsville Average Score 4.24; Mapleton Average Score 4.26; Providence Average Score 4.27; Ivins Average Score 4.40; Group: Rural Hub & Resort, Traditional Rural Communities — Vernal Average Score 3.60; Price Average Score 3.62; Monticello Average Score 3.71; East Carbon Average Score 3.75; Delta Average Score 3.78; Helper Average Score 3.79; Tremonton Average Score 3.81; Blanding Average Score 3.85; Nephi Average Score 3.92; Beaver Average Score 3.95; Heber Average Score 4.01; La Verkin Average Score 4.13; Bluff Average Score 4.20; Springdale Average Score 4.21; Park City Average Score 4.22; Midway Average Score 4.27; Emigration Canyon Average Score 4.42

Dot Plot. Title: Overall Community Wellbeing Scores from Participating Utah Cities (2024). Subtitle: (On a scale from 1=Poor to 5=Excellent). Data — Group: Cities of the 1st & 2nd Class — Ogden Average Score 3.27; West Valley City Average Score 3.38; West Jordan Average Score 3.50; Layton Average Score 3.52; Orem Average Score 3.63; Millcreek Average Score 3.82; Sandy Average Score 3.91; South Jordan Average Score 4.00; Group: Established/Mid-sized Cities — Logan Average Score 3.18; Midvale Average Score 3.24; Cedar City Average Score 3.42; Pleasant Grove Average Score 3.61; South Ogden Average Score 3.72; North Salt Lake Average Score 3.75; Bountiful Average Score 3.84; Cottonwood Heights Average Score 3.90; West Bountiful Average Score 4.00; Draper Average Score 4.03; Alpine Average Score 4.15; Cedar Hills Average Score 4.15; Group: Rapid Growth Cities — Herriman Average Score 3.40; Vineyard Average Score 3.43; Saratoga Springs Average Score 3.46; Lehi Average Score 3.50; West Haven Average Score 3.67; Hyrum Average Score 3.76; Clinton Average Score 3.79; Spanish Fork Average Score 3.80; Ivins Average Score 3.91; Providence Average Score 3.91; Nibley Average Score 3.92; Hyde Park Average Score 4.02; Mapleton Average Score 4.02; Wellsville Average Score 4.11; Group: Rural Hub & Resort, Traditional Rural Communities — Price Average Score 2.88; East Carbon Average Score 3.03; Tremonton Average Score 3.09; Monticello Average Score 3.11; Vernal Average Score 3.12; Blanding Average Score 3.31; Heber Average Score 3.42; Delta Average Score 3.43; Nephi Average Score 3.43; La Verkin Average Score 3.57; Beaver Average Score 3.59; Springdale Average Score 3.68; Helper Average Score 3.71; Park City Average Score 3.85; Bluff Average Score 3.88; Midway Average Score 4.07; Emigration Canyon Average Score 4.28

Wellbeing Domains in Hyrum

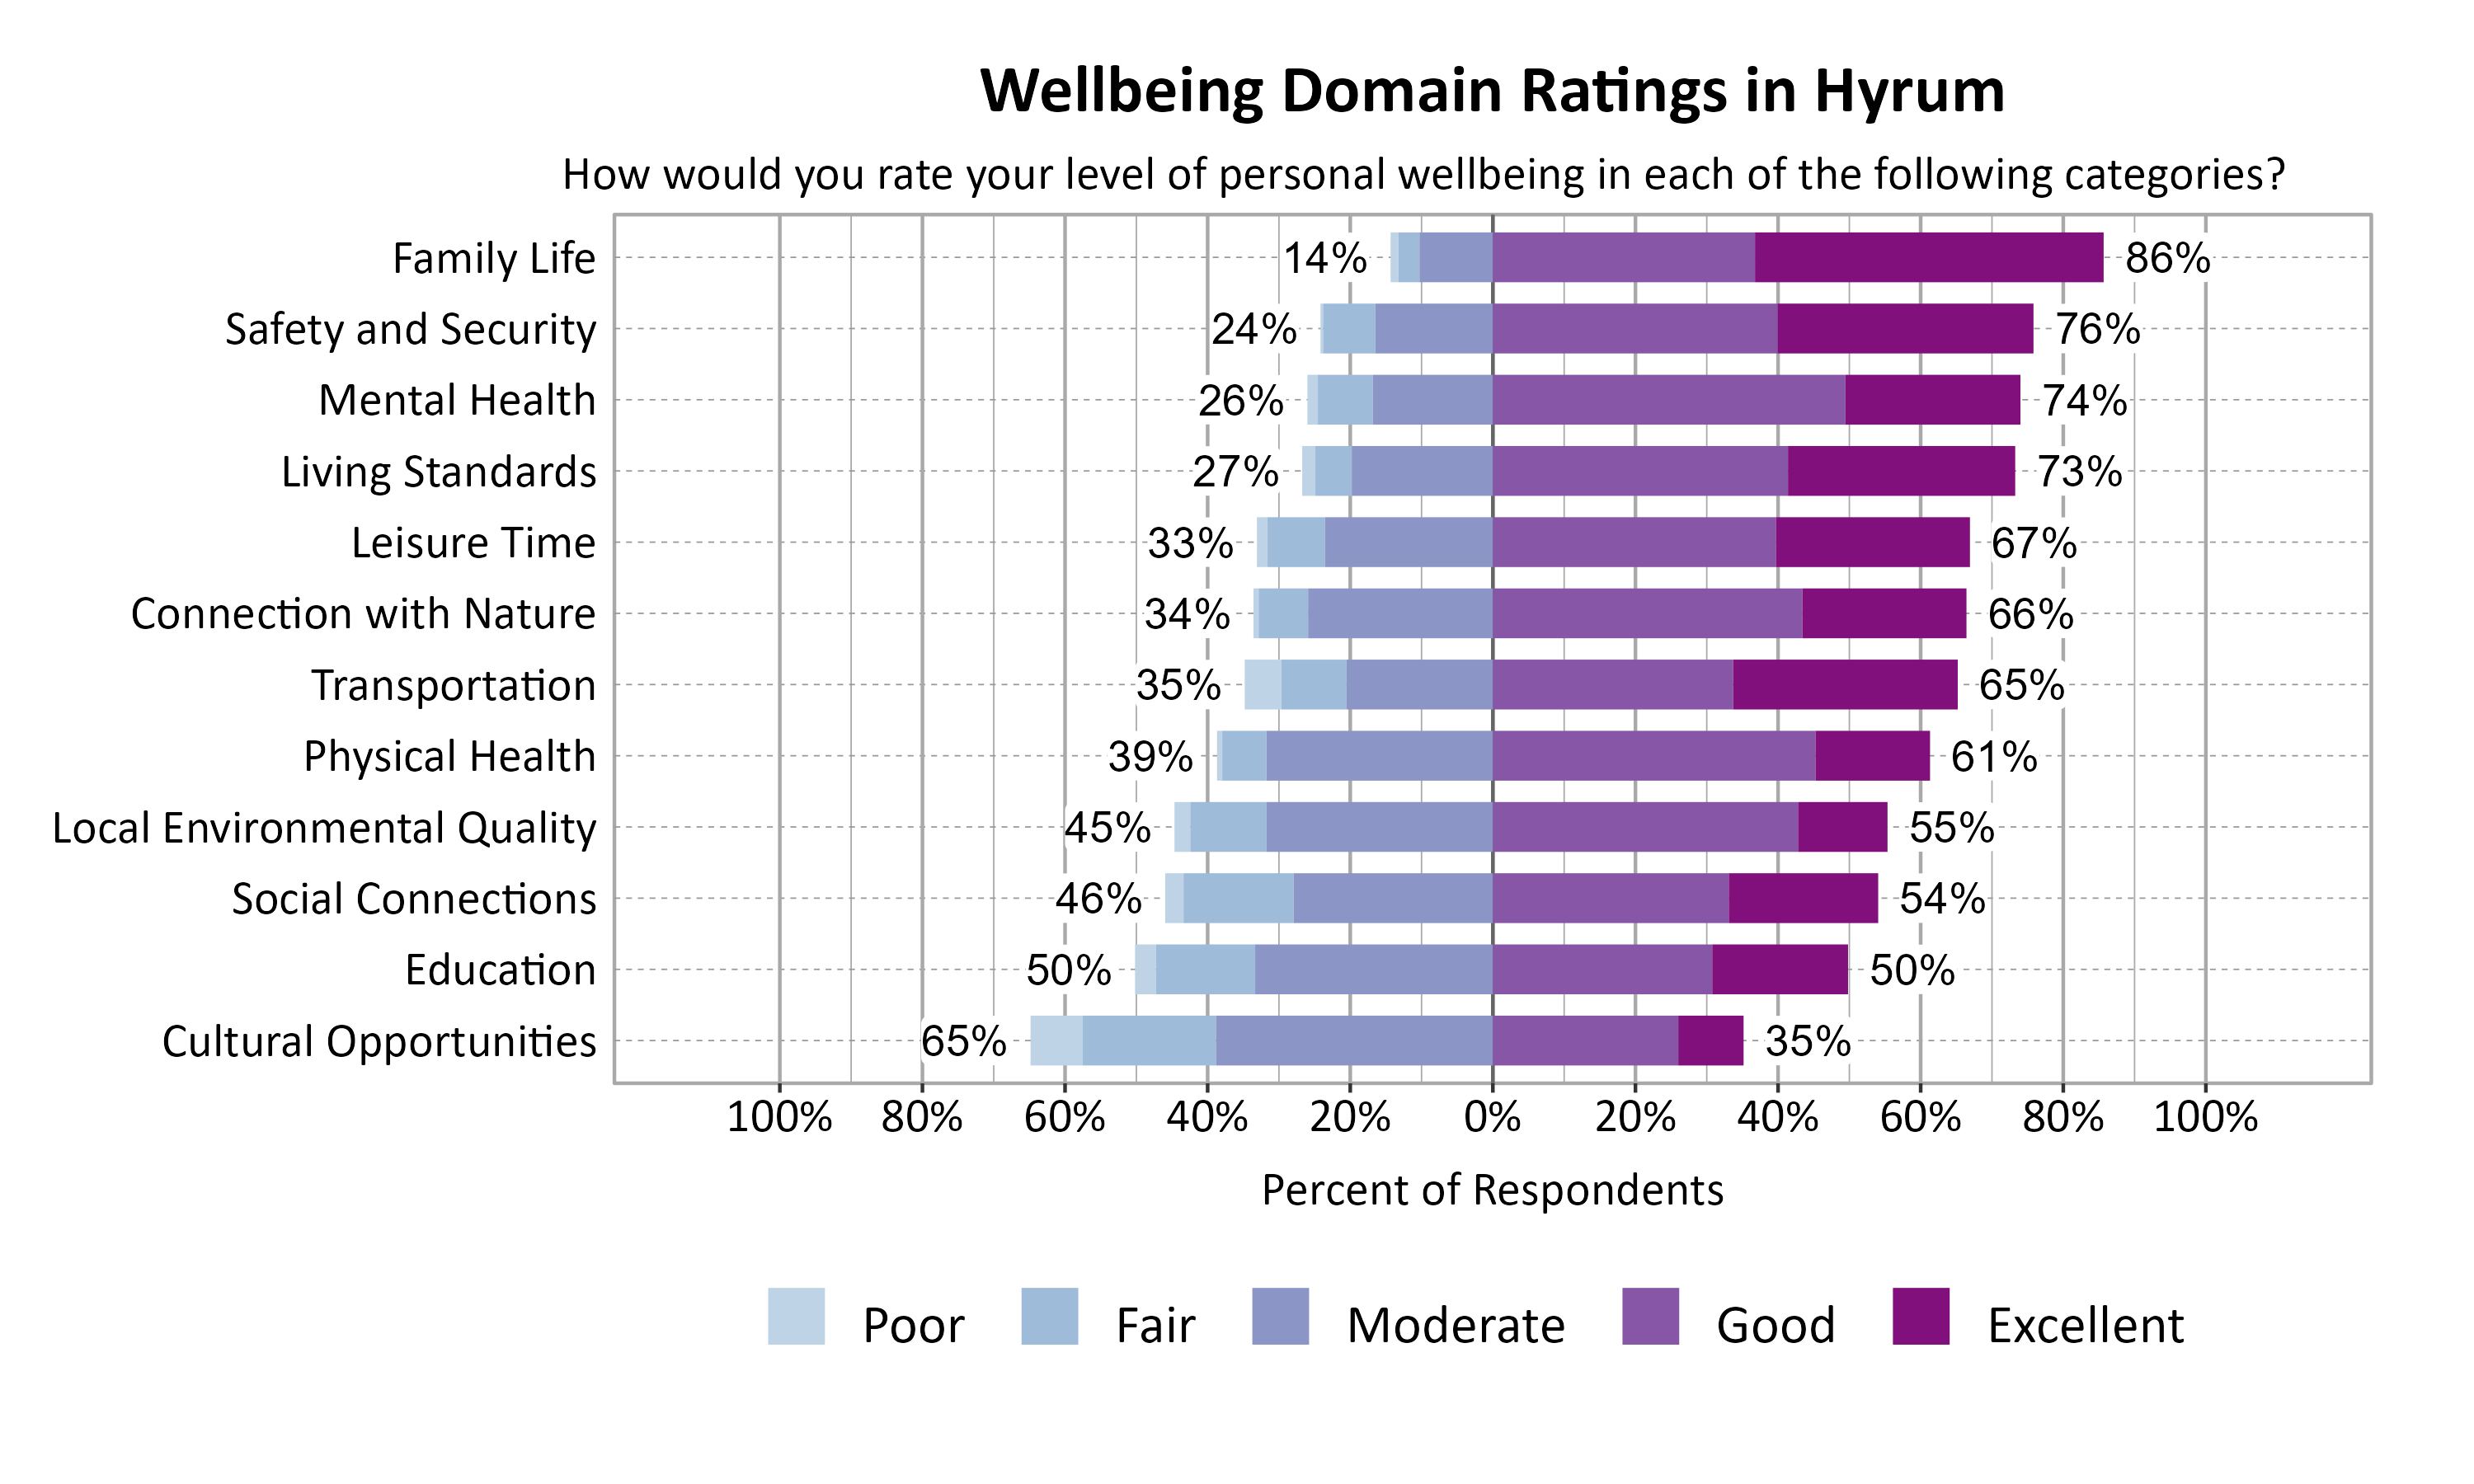
According to national and international entities that track wellbeing, there are a number of common dimensions or domains of wellbeing. Survey respondents rated twelve domains on a 5-point scale from poor to excellent. They were also asked to indicate the importance of each domain to their overall personal wellbeing on a 5-point scale from not at all important to very important. The highest rated wellbeing domains for respondents in Hyrum were Family Life (86%), Safety and Security (76%), Mental Health (74%), and Living Standards (73%). The most important wellbeing domains were Mental Health (99%), Safety and Security (97%), Family Life (95%), and Living Standards (94%).

Likert Graph. Title: Wellbeing Domain Ratings in Hyrum. Subtitle: How would you rate your level of personal wellbeing in each of the following categories? Data — Category: Family Life - 14% of respondents rated as poor, fair, or moderate while  86% rated as good or excellent; Category: Safety and Security - 24% of respondents rated as poor, fair, or moderate while  76% rated as good or excellent; Category: Mental Health - 26% of respondents rated as poor, fair, or moderate while  74% rated as good or excellent; Category: Living Standards - 27% of respondents rated as poor, fair, or moderate while  73% rated as good or excellent; Category: Leisure Time - 33% of respondents rated as poor, fair, or moderate while  67% rated as good or excellent; Category: Connection with Nature - 34% of respondents rated as poor, fair, or moderate while  66% rated as good or excellent; Category: Transportation - 35% of respondents rated as poor, fair, or moderate while  65% rated as good or excellent; Category: Physical Health - 39% of respondents rated as poor, fair, or moderate while  61% rated as good or excellent; Category: Local Environmental Quality - 45% of respondents rated as poor, fair, or moderate while  55% rated as good or excellent; Category: Social Connections - 46% of respondents rated as poor, fair, or moderate while  54% rated as good or excellent; Category: Education - 50% of respondents rated as poor, fair, or moderate while  50% rated as good or excellent; Category: Cultural Opportunities - 65% of respondents rated as poor, fair, or moderate while  35% rated as good or excellent Likert Graph. Title: Wellbeing Domain Importance in Hyrum. Subtitle: How important are the following categories to your overall personal wellbeing? Data — Category: Mental Health - 1% of respondents rated as not at all important, slightly important, or moderately important while 99% rated as important or very important; Category: Safety and Security - 3% of respondents rated as not at all important, slightly important, or moderately important while 97% rated as important or very important; Category: Family Life - 5% of respondents rated as not at all important, slightly important, or moderately important while 95% rated as important or very important; Category: Living Standards - 6% of respondents rated as not at all important, slightly important, or moderately important while 94% rated as important or very important; Category: Physical Health - 7% of respondents rated as not at all important, slightly important, or moderately important while 93% rated as important or very important; Category: Leisure Time - 9% of respondents rated as not at all important, slightly important, or moderately important while 91% rated as important or very important; Category: Local Environmental Quality -16% of respondents rated as not at all important, slightly important, or moderately important while 84% rated as important or very important; Category: Connection with Nature -19% of respondents rated as not at all important, slightly important, or moderately important while 81% rated as important or very important; Category: Social Connections -30% of respondents rated as not at all important, slightly important, or moderately important while 70% rated as important or very important; Category: Education -32% of respondents rated as not at all important, slightly important, or moderately important while 68% rated as important or very important; Category: Transportation -42% of respondents rated as not at all important, slightly important, or moderately important while 58% rated as important or very important; Category: Cultural Opportunities -49% of respondents rated as not at all important, slightly important, or moderately important while 51% rated as important or very important

Wellbeing Matrix for Hyrum

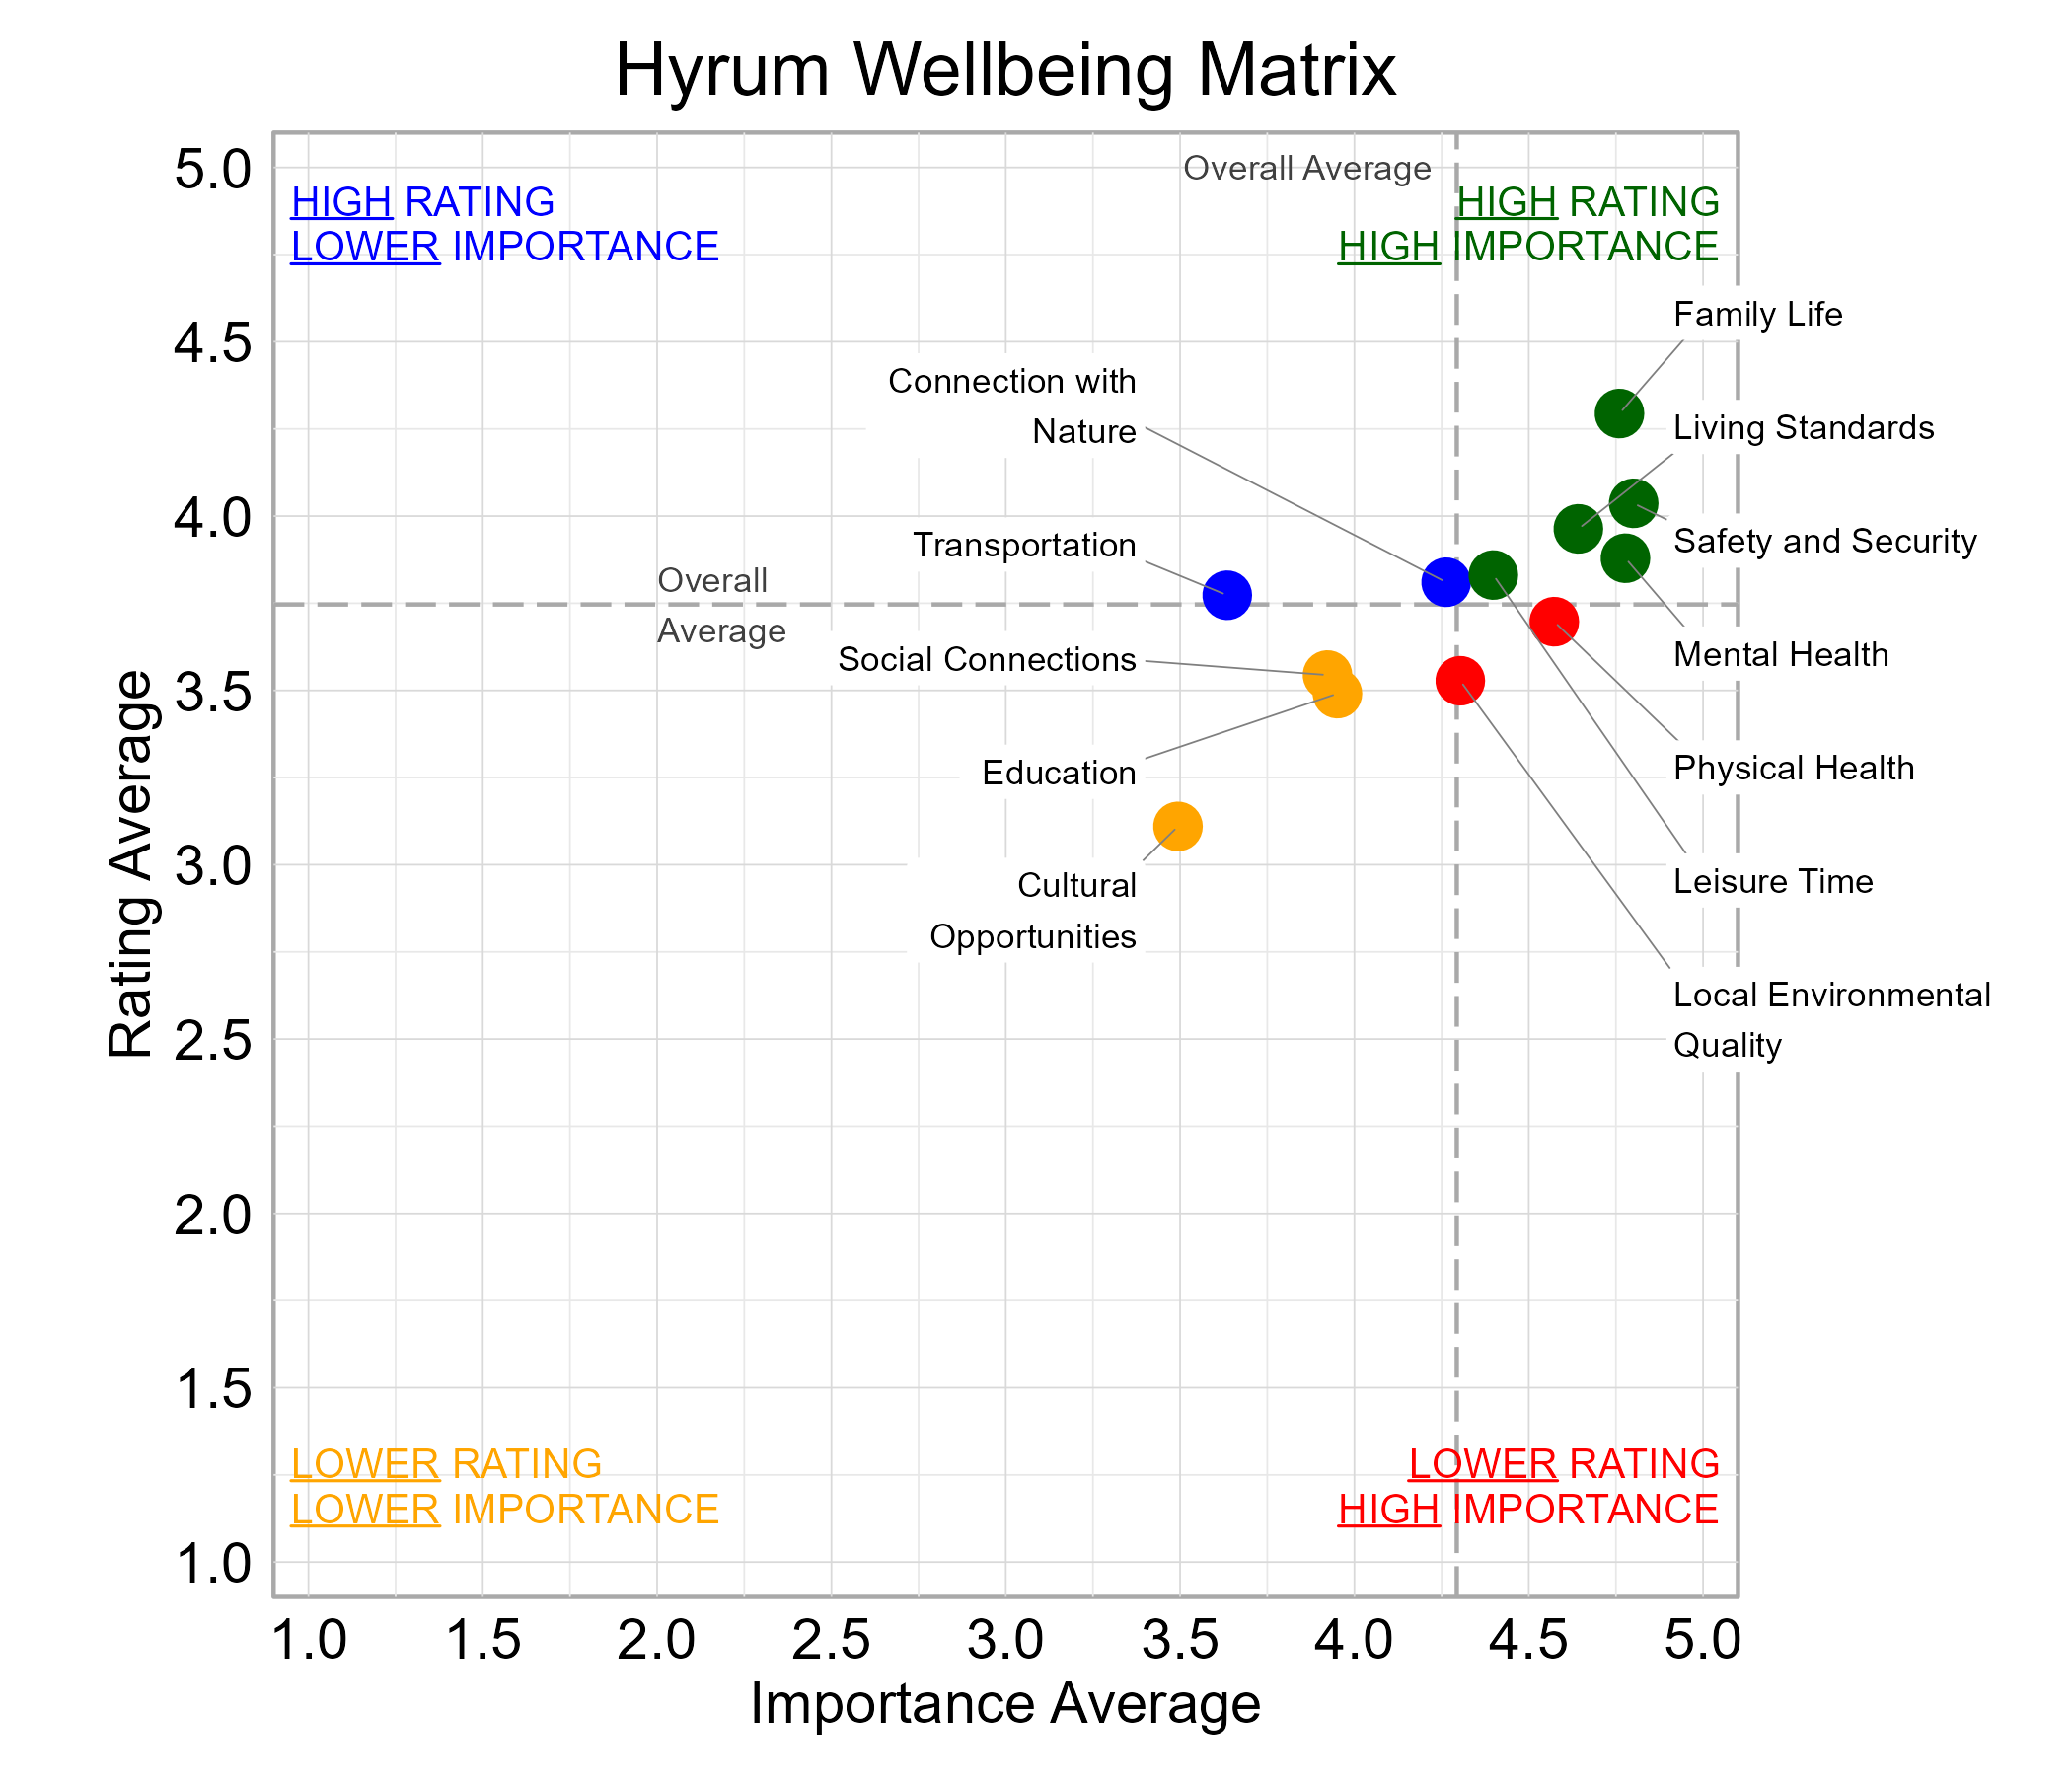
The graph below illustrates the relationship between the average rating and the average importance of wellbeing domains for survey respondents from Hyrum. Family Life, Leisure Time, Living Standards, Mental Health, and Safety and Security were highly important and rated above average among the domains. Local Environmental Quality and Physical Health fell in the “red zone” of higher importance and lower ratings.

Scatterplot. Title: Hyrum Wellbeing Matrix. Subtitle: Domains are classified into four quadrants depending on their average rating and average importance as compared to the average of all the average domain ratings and the average domain importance ratings. Data — High rating, high importance (green quadrant) domains include: Family Life, Leisure Time, Living Standards, Mental Health, and Safety and Security; High rating, lower importance (blue quadrant) domains include: Connection with Nature  and  Transportation; Lower rating, lower importance (yellow quadrant) domains include: Cultural Opportunities, Education, and Social Connections; Lower rating, high importance (red quadrant) domains include: Local Environmental Quality  and  Physical Health

Community Connection in Hyrum

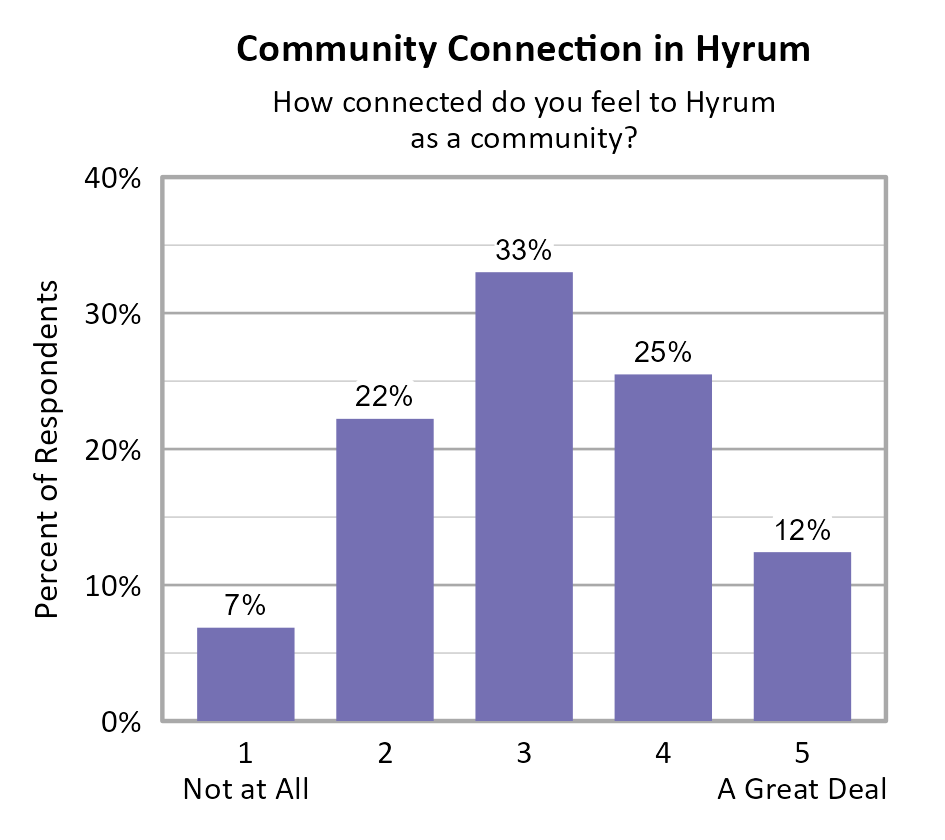
Survey participants were asked about how connected they feel to Hyrum on a 5-point scale from not at all (1) to a great deal (5), and the average score of all respondents was 3.14.

Bar Chart. Title: Community Connection in Hyrum. Subtitle: How connected do you feel to Hyrum as a community? Data — 1 Not at All: 7% of respondents; 2: 22% of respondents; 3: 33% of respondents; 4: 25% of respondents; 5 A Great Deal: 12% of respondents

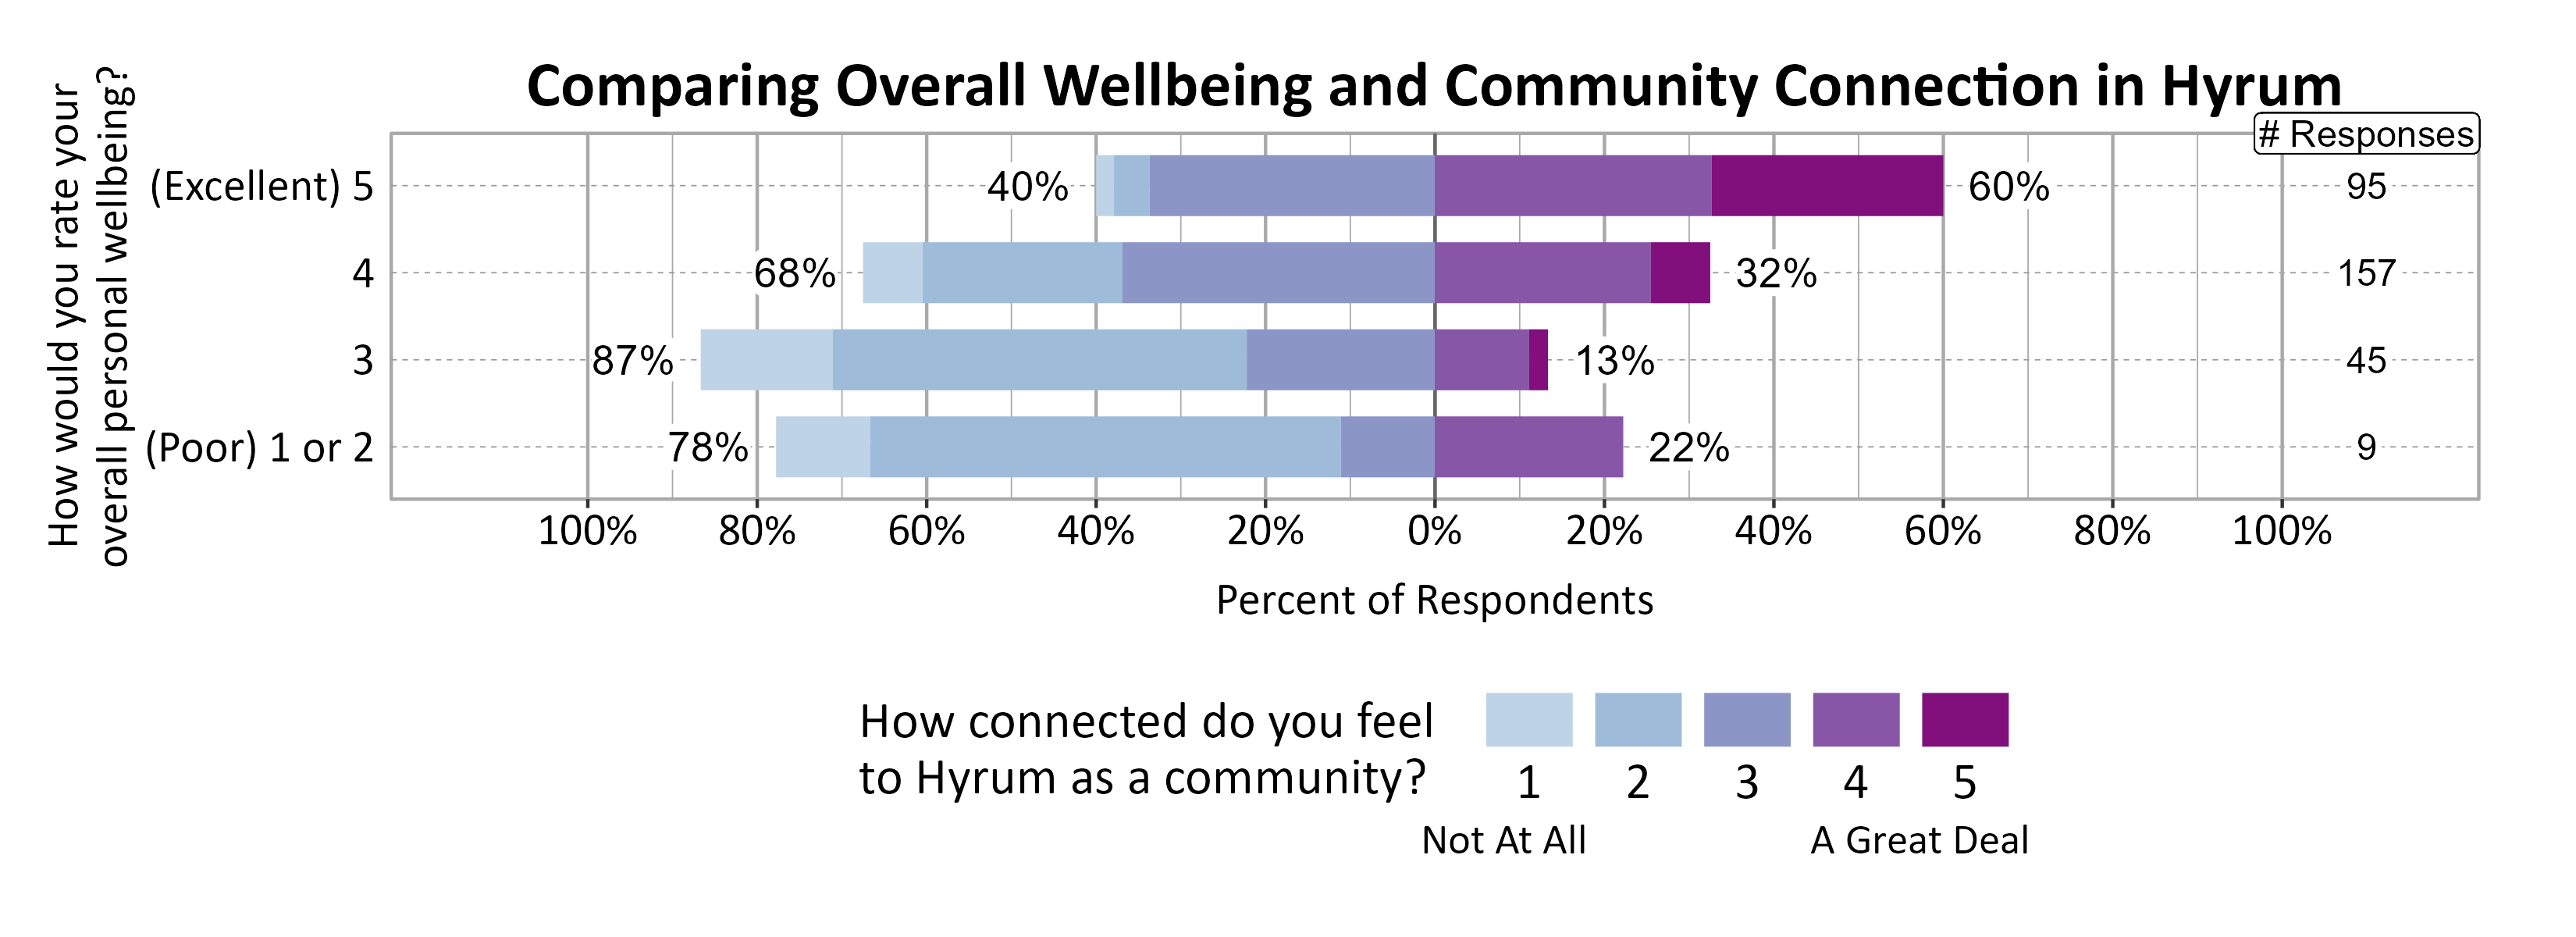
A positive relationship was found between individuals’ community connection and mental health, and to some extent between community connection and overall personal wellbeing.

Likert Graph. Title: Comparing Overall Wellbeing and Community Connection in Hyrum. Data — Of the 9 respondents that rate their overall personal wellbeing as a (Poor) 1 or 2, 78% indicate a community connection score of 1, 2, or 3 while 22% indicate a community connection score of 4 or 5; Of the 45 respondents that rate their overall personal wellbeing as a 3, 87% indicate a community connection score of 1, 2, or 3 while 13% indicate a community connection score of 4 or 5; Of the 157 respondents that rate their overall personal wellbeing as a 4, 68% indicate a community connection score of 1, 2, or 3 while 32% indicate a community connection score of 4 or 5; Of the 95 respondents that rate their overall personal wellbeing as a (Excellent) 5, 40% indicate a community connection score of 1, 2, or 3 while 60% indicate a community connection score of 4 or 5

Likert Graph. Title: Comparing Mental Health Rating and Community Connection in Hyrum. Data — Of the 25 respondents that rate their mental health rating as a (Poor) 1 or 2, 84% indicate a community connection score of 1, 2, or 3 while 16% indicate a community connection score of 4 or 5; Of the 46 respondents that rate their mental health rating as a 3, 76% indicate a community connection score of 1, 2, or 3 while 24% indicate a community connection score of 4 or 5; Of the 135 respondents that rate their mental health rating as a 4, 64% indicate a community connection score of 1, 2, or 3 while 36% indicate a community connection score of 4 or 5; Of the 67 respondents that rate their mental health rating as a (Excellent) 5, 39% indicate a community connection score of 1, 2, or 3 while 61% indicate a community connection score of 4 or 5

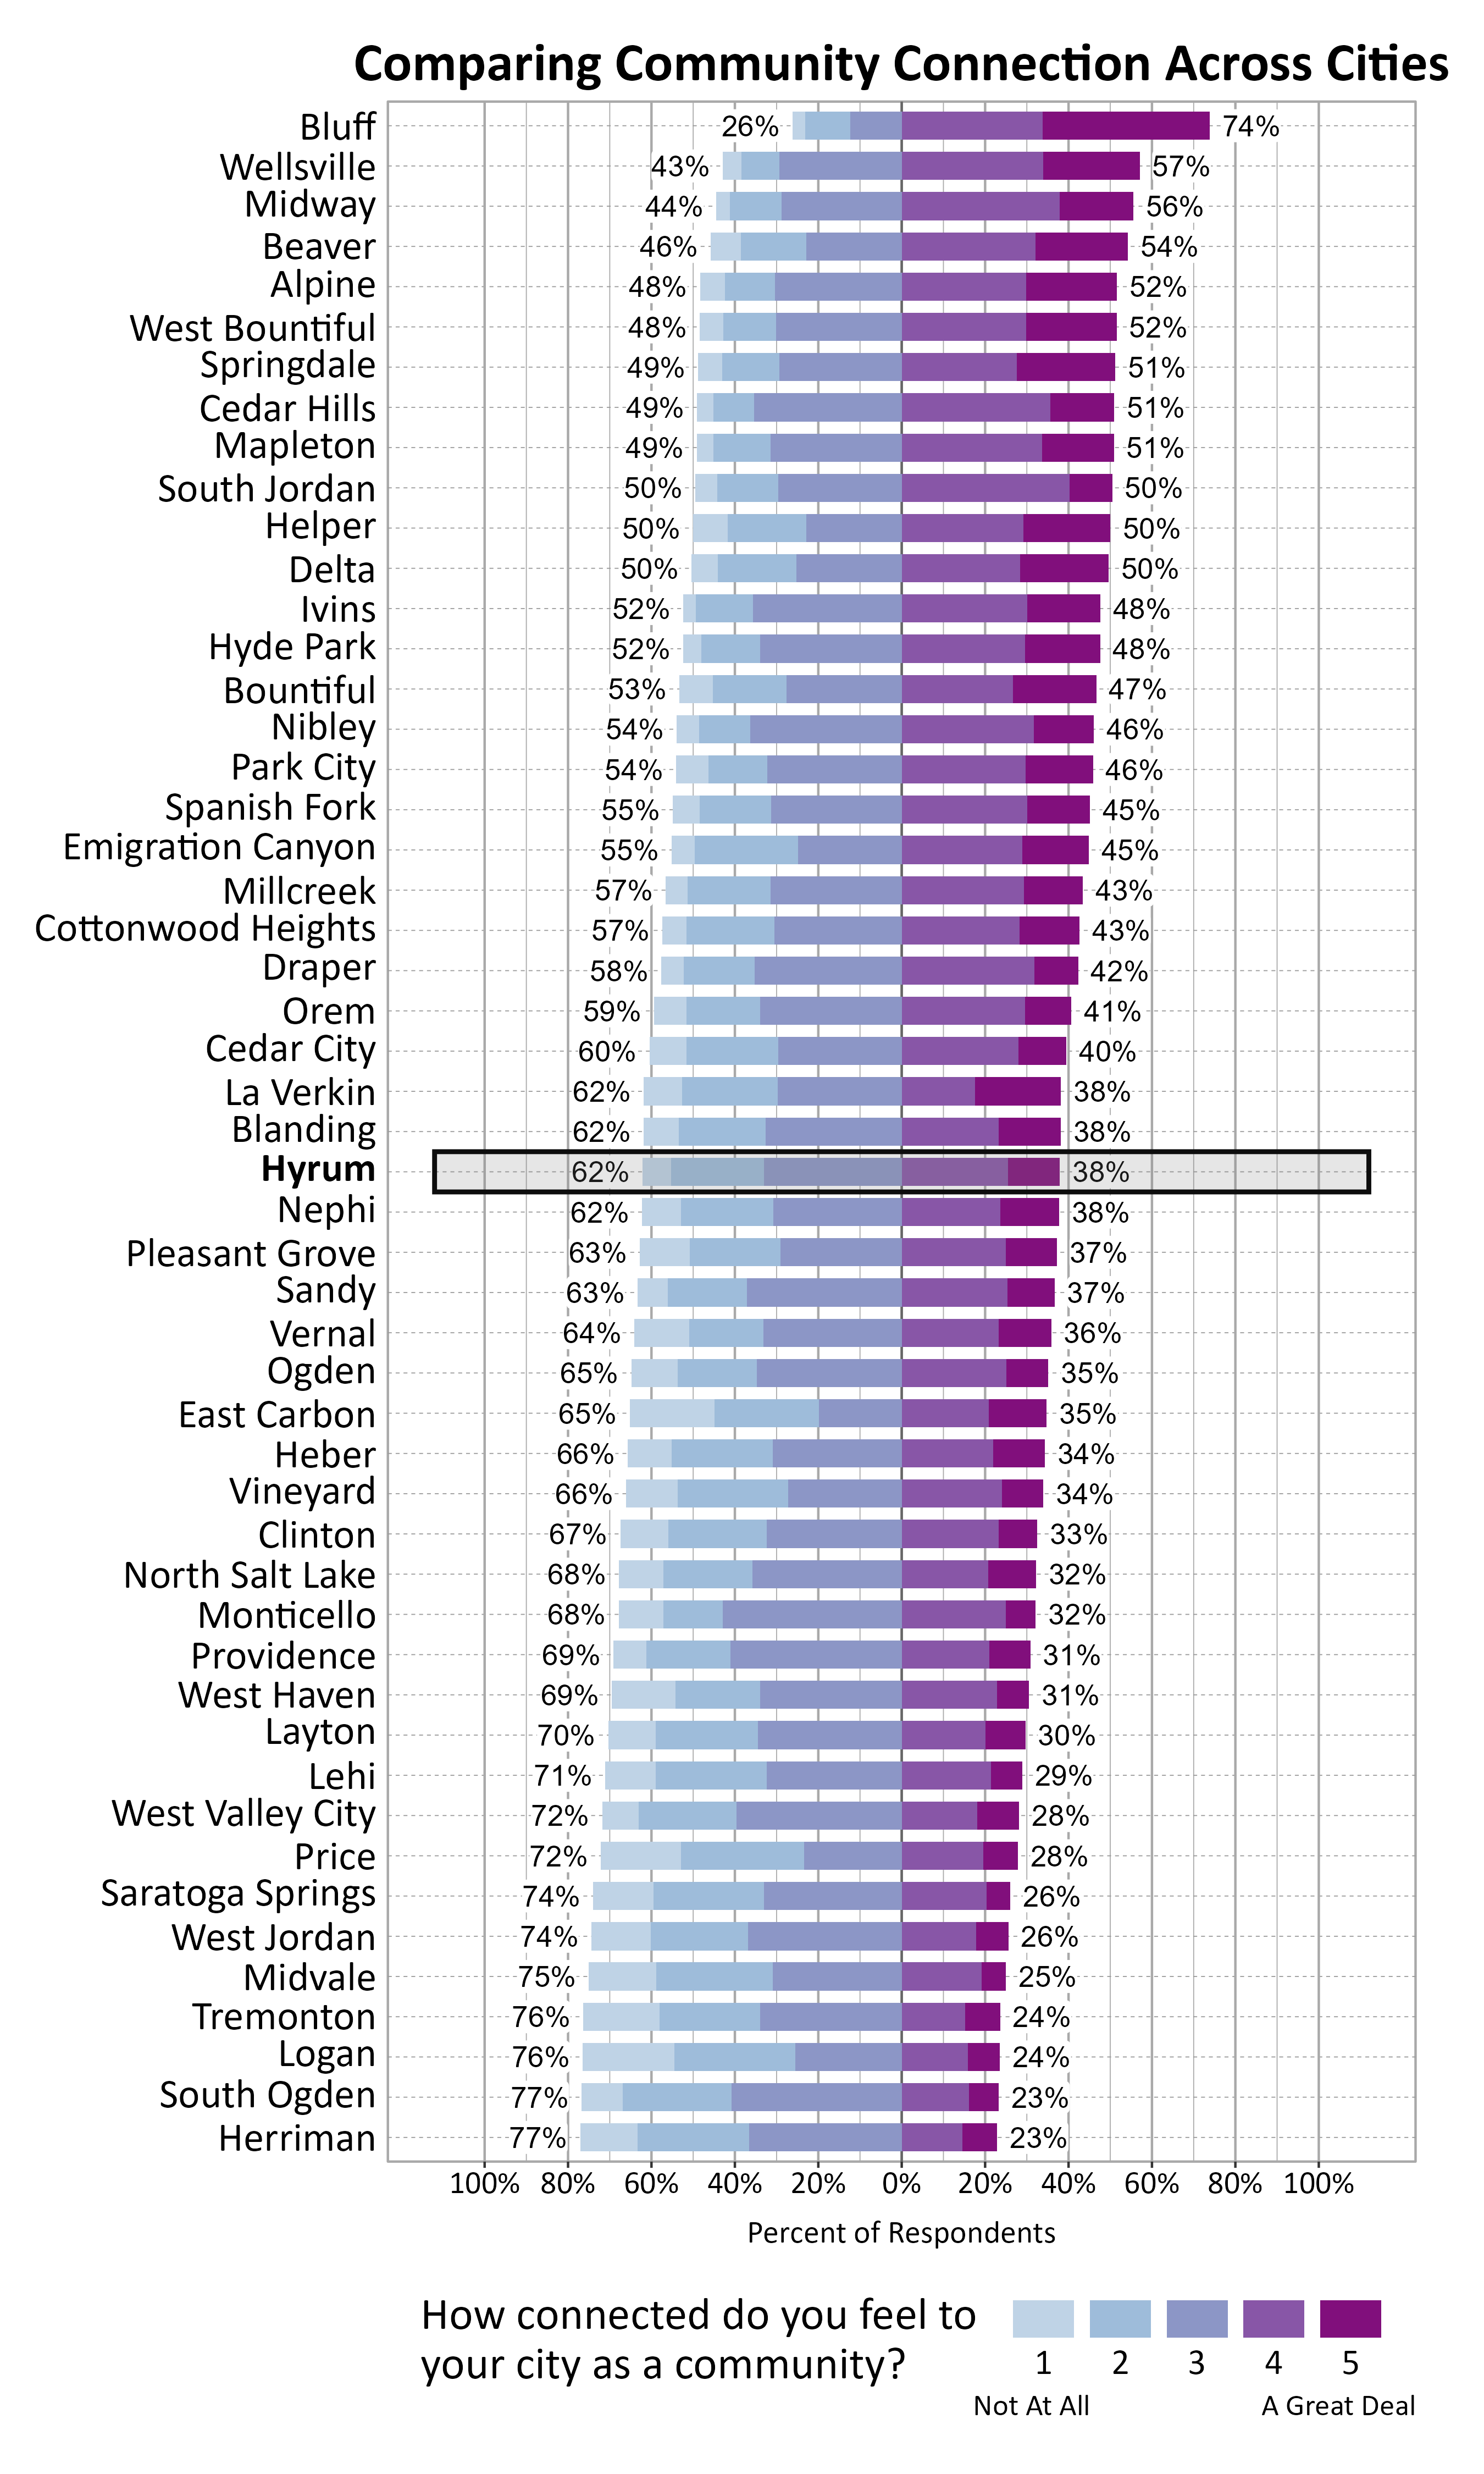
The graph below shows how Wellbeing Project cities and towns compare on feelings of community connection based on the percentage of respondents who answered 4 or a 5 on a 5-point scale from “not at all” to “a great deal” connected to their city or town. Hyrum ranked 27 out of the 51 cities that participated.

Likert Graph. Title: Comparing Community Connection Across Cities. Subtitle: How connected do you feel to your city as a community? 1 being not at all and 5 being a great deal. Data — City: Bluff 26% of respondents indicated a community connection score of 1, 2, or 3 while 74% of respondents indicated a community connection score of 4 or 5; City: Wellsville 43% of respondents indicated a community connection score of 1, 2, or 3 while 57% of respondents indicated a community connection score of 4 or 5; City: Midway 44% of respondents indicated a community connection score of 1, 2, or 3 while 56% of respondents indicated a community connection score of 4 or 5; City: Beaver 46% of respondents indicated a community connection score of 1, 2, or 3 while 54% of respondents indicated a community connection score of 4 or 5; City: Alpine 48% of respondents indicated a community connection score of 1, 2, or 3 while 52% of respondents indicated a community connection score of 4 or 5; City: West Bountiful 48% of respondents indicated a community connection score of 1, 2, or 3 while 52% of respondents indicated a community connection score of 4 or 5; City: Springdale 49% of respondents indicated a community connection score of 1, 2, or 3 while 51% of respondents indicated a community connection score of 4 or 5; City: Cedar Hills 49% of respondents indicated a community connection score of 1, 2, or 3 while 51% of respondents indicated a community connection score of 4 or 5; City: Mapleton 49% of respondents indicated a community connection score of 1, 2, or 3 while 51% of respondents indicated a community connection score of 4 or 5; City: South Jordan 50% of respondents indicated a community connection score of 1, 2, or 3 while 50% of respondents indicated a community connection score of 4 or 5; City: Helper 50% of respondents indicated a community connection score of 1, 2, or 3 while 50% of respondents indicated a community connection score of 4 or 5; City: Delta 50% of respondents indicated a community connection score of 1, 2, or 3 while 50% of respondents indicated a community connection score of 4 or 5; City: Ivins 52% of respondents indicated a community connection score of 1, 2, or 3 while 48% of respondents indicated a community connection score of 4 or 5; City: Hyde Park 52% of respondents indicated a community connection score of 1, 2, or 3 while 48% of respondents indicated a community connection score of 4 or 5; City: Bountiful 53% of respondents indicated a community connection score of 1, 2, or 3 while 47% of respondents indicated a community connection score of 4 or 5; City: Nibley 54% of respondents indicated a community connection score of 1, 2, or 3 while 46% of respondents indicated a community connection score of 4 or 5; City: Park City 54% of respondents indicated a community connection score of 1, 2, or 3 while 46% of respondents indicated a community connection score of 4 or 5; City: Spanish Fork 55% of respondents indicated a community connection score of 1, 2, or 3 while 45% of respondents indicated a community connection score of 4 or 5; City: Emigration Canyon 55% of respondents indicated a community connection score of 1, 2, or 3 while 45% of respondents indicated a community connection score of 4 or 5; City: Millcreek 57% of respondents indicated a community connection score of 1, 2, or 3 while 43% of respondents indicated a community connection score of 4 or 5; City: Cottonwood Heights 57% of respondents indicated a community connection score of 1, 2, or 3 while 43% of respondents indicated a community connection score of 4 or 5; City: Draper 58% of respondents indicated a community connection score of 1, 2, or 3 while 42% of respondents indicated a community connection score of 4 or 5; City: Orem 59% of respondents indicated a community connection score of 1, 2, or 3 while 41% of respondents indicated a community connection score of 4 or 5; City: Cedar City 60% of respondents indicated a community connection score of 1, 2, or 3 while 40% of respondents indicated a community connection score of 4 or 5; City: La Verkin 62% of respondents indicated a community connection score of 1, 2, or 3 while 38% of respondents indicated a community connection score of 4 or 5; City: Blanding 62% of respondents indicated a community connection score of 1, 2, or 3 while 38% of respondents indicated a community connection score of 4 or 5; City: Hyrum 62% of respondents indicated a community connection score of 1, 2, or 3 while 38% of respondents indicated a community connection score of 4 or 5; City: Nephi 62% of respondents indicated a community connection score of 1, 2, or 3 while 38% of respondents indicated a community connection score of 4 or 5; City: Pleasant Grove 63% of respondents indicated a community connection score of 1, 2, or 3 while 37% of respondents indicated a community connection score of 4 or 5; City: Sandy 63% of respondents indicated a community connection score of 1, 2, or 3 while 37% of respondents indicated a community connection score of 4 or 5; City: Vernal 64% of respondents indicated a community connection score of 1, 2, or 3 while 36% of respondents indicated a community connection score of 4 or 5; City: Ogden 65% of respondents indicated a community connection score of 1, 2, or 3 while 35% of respondents indicated a community connection score of 4 or 5; City: East Carbon 65% of respondents indicated a community connection score of 1, 2, or 3 while 35% of respondents indicated a community connection score of 4 or 5; City: Heber 66% of respondents indicated a community connection score of 1, 2, or 3 while 34% of respondents indicated a community connection score of 4 or 5; City: Vineyard 66% of respondents indicated a community connection score of 1, 2, or 3 while 34% of respondents indicated a community connection score of 4 or 5; City: Clinton 67% of respondents indicated a community connection score of 1, 2, or 3 while 33% of respondents indicated a community connection score of 4 or 5; City: North Salt Lake 68% of respondents indicated a community connection score of 1, 2, or 3 while 32% of respondents indicated a community connection score of 4 or 5; City: Monticello 68% of respondents indicated a community connection score of 1, 2, or 3 while 32% of respondents indicated a community connection score of 4 or 5; City: Providence 69% of respondents indicated a community connection score of 1, 2, or 3 while 31% of respondents indicated a community connection score of 4 or 5; City: West Haven 69% of respondents indicated a community connection score of 1, 2, or 3 while 31% of respondents indicated a community connection score of 4 or 5; City: Layton 70% of respondents indicated a community connection score of 1, 2, or 3 while 30% of respondents indicated a community connection score of 4 or 5; City: Lehi 71% of respondents indicated a community connection score of 1, 2, or 3 while 29% of respondents indicated a community connection score of 4 or 5; City: West Valley City 72% of respondents indicated a community connection score of 1, 2, or 3 while 28% of respondents indicated a community connection score of 4 or 5; City: Price 72% of respondents indicated a community connection score of 1, 2, or 3 while 28% of respondents indicated a community connection score of 4 or 5; City: Saratoga Springs 74% of respondents indicated a community connection score of 1, 2, or 3 while 26% of respondents indicated a community connection score of 4 or 5; City: West Jordan 74% of respondents indicated a community connection score of 1, 2, or 3 while 26% of respondents indicated a community connection score of 4 or 5; City: Midvale 75% of respondents indicated a community connection score of 1, 2, or 3 while 25% of respondents indicated a community connection score of 4 or 5; City: Tremonton 76% of respondents indicated a community connection score of 1, 2, or 3 while 24% of respondents indicated a community connection score of 4 or 5; City: Logan 76% of respondents indicated a community connection score of 1, 2, or 3 while 24% of respondents indicated a community connection score of 4 or 5; City: South Ogden 77% of respondents indicated a community connection score of 1, 2, or 3 while 23% of respondents indicated a community connection score of 4 or 5; City: Herriman 77% of respondents indicated a community connection score of 1, 2, or 3 while 23% of respondents indicated a community connection score of 4 or 5

Participation in Recreation and Nature-Related Activities

Respondents were asked to indicate whether or not they participated in various activities in the last 12 months. The most popular activities were walking or biking in your neighborhood or city (93%), gardening at home (84%), and recreating in parks in your city (83%).

Bar Graph. Title: Participation in Recreation and Nature-Based Activities in Hyrum. Subtitle: Have you participated in any of the following activities during the past 12 months? Data — 93% of respondents indicated yes to Walking or biking in your neighborhood or city; 84% of respondents indicated yes to Gardening at home; 83% of respondents indicated yes to Recreating in parks in your city; 76% of respondents indicated yes to Community events; 68% of respondents indicated yes to Using trails in or near your city; 68% of respondents indicated yes to Non-motorized recreation on public lands or waters in Utah; 44% of respondents indicated yes to City recreation programs; 43% of respondents indicated yes to Buying food from a farmer's market; 38% of respondents indicated yes to Motorized recreation on public lands or waters in Utah; 1% of respondents indicated yes to Participating in a community garden

Participating in community events and using trails in or near your city were significantly related to higher ratings of personal wellbeing.

Participating in community events and recreating in parks in your city were significantly related to higher ratings of community wellbeing.

Participating in community events was significantly related to higher ratings of community connection.

Perspectives on Population Growth and Economic Development

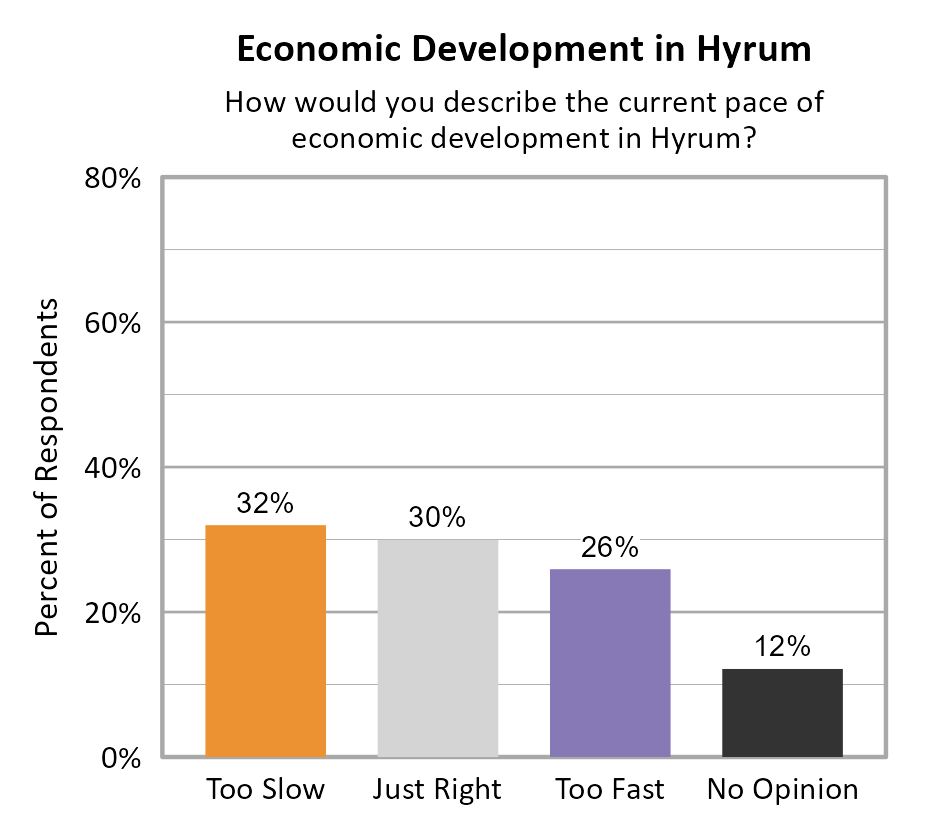
The majority of respondents in Hyrum indicated that they felt the population growth was too fast (75%). For the pace of economic development, respondents were split between opinions that it was too slow (32%), just right (30%), and too fast (26%).

Bar Chart. Title: Population Growth in Hyrum. Subtitle: How would you describe the current rate of population growth in Hyrum? Data — Too Slow: 1% of respondents; Just Right: 19% of respondents; Too Fast: 75% of respondents; No Opinion: 5% of respondents

Bar Chart. Title: Economic Development in Hyrum. Subtitle: How would you describe the current pace of economic development in Hyrum? Data — Too Slow: 32% of respondents; Just Right: 30% of respondents; Too Fast: 26% of respondents; No Opinion: 12% of respondents

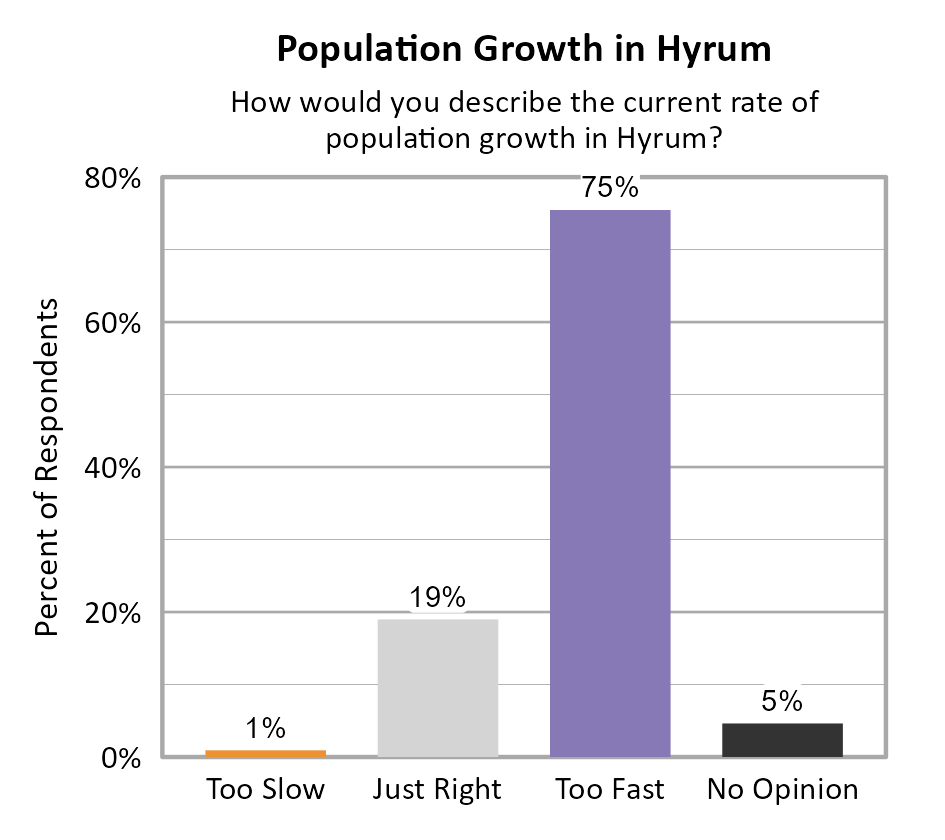
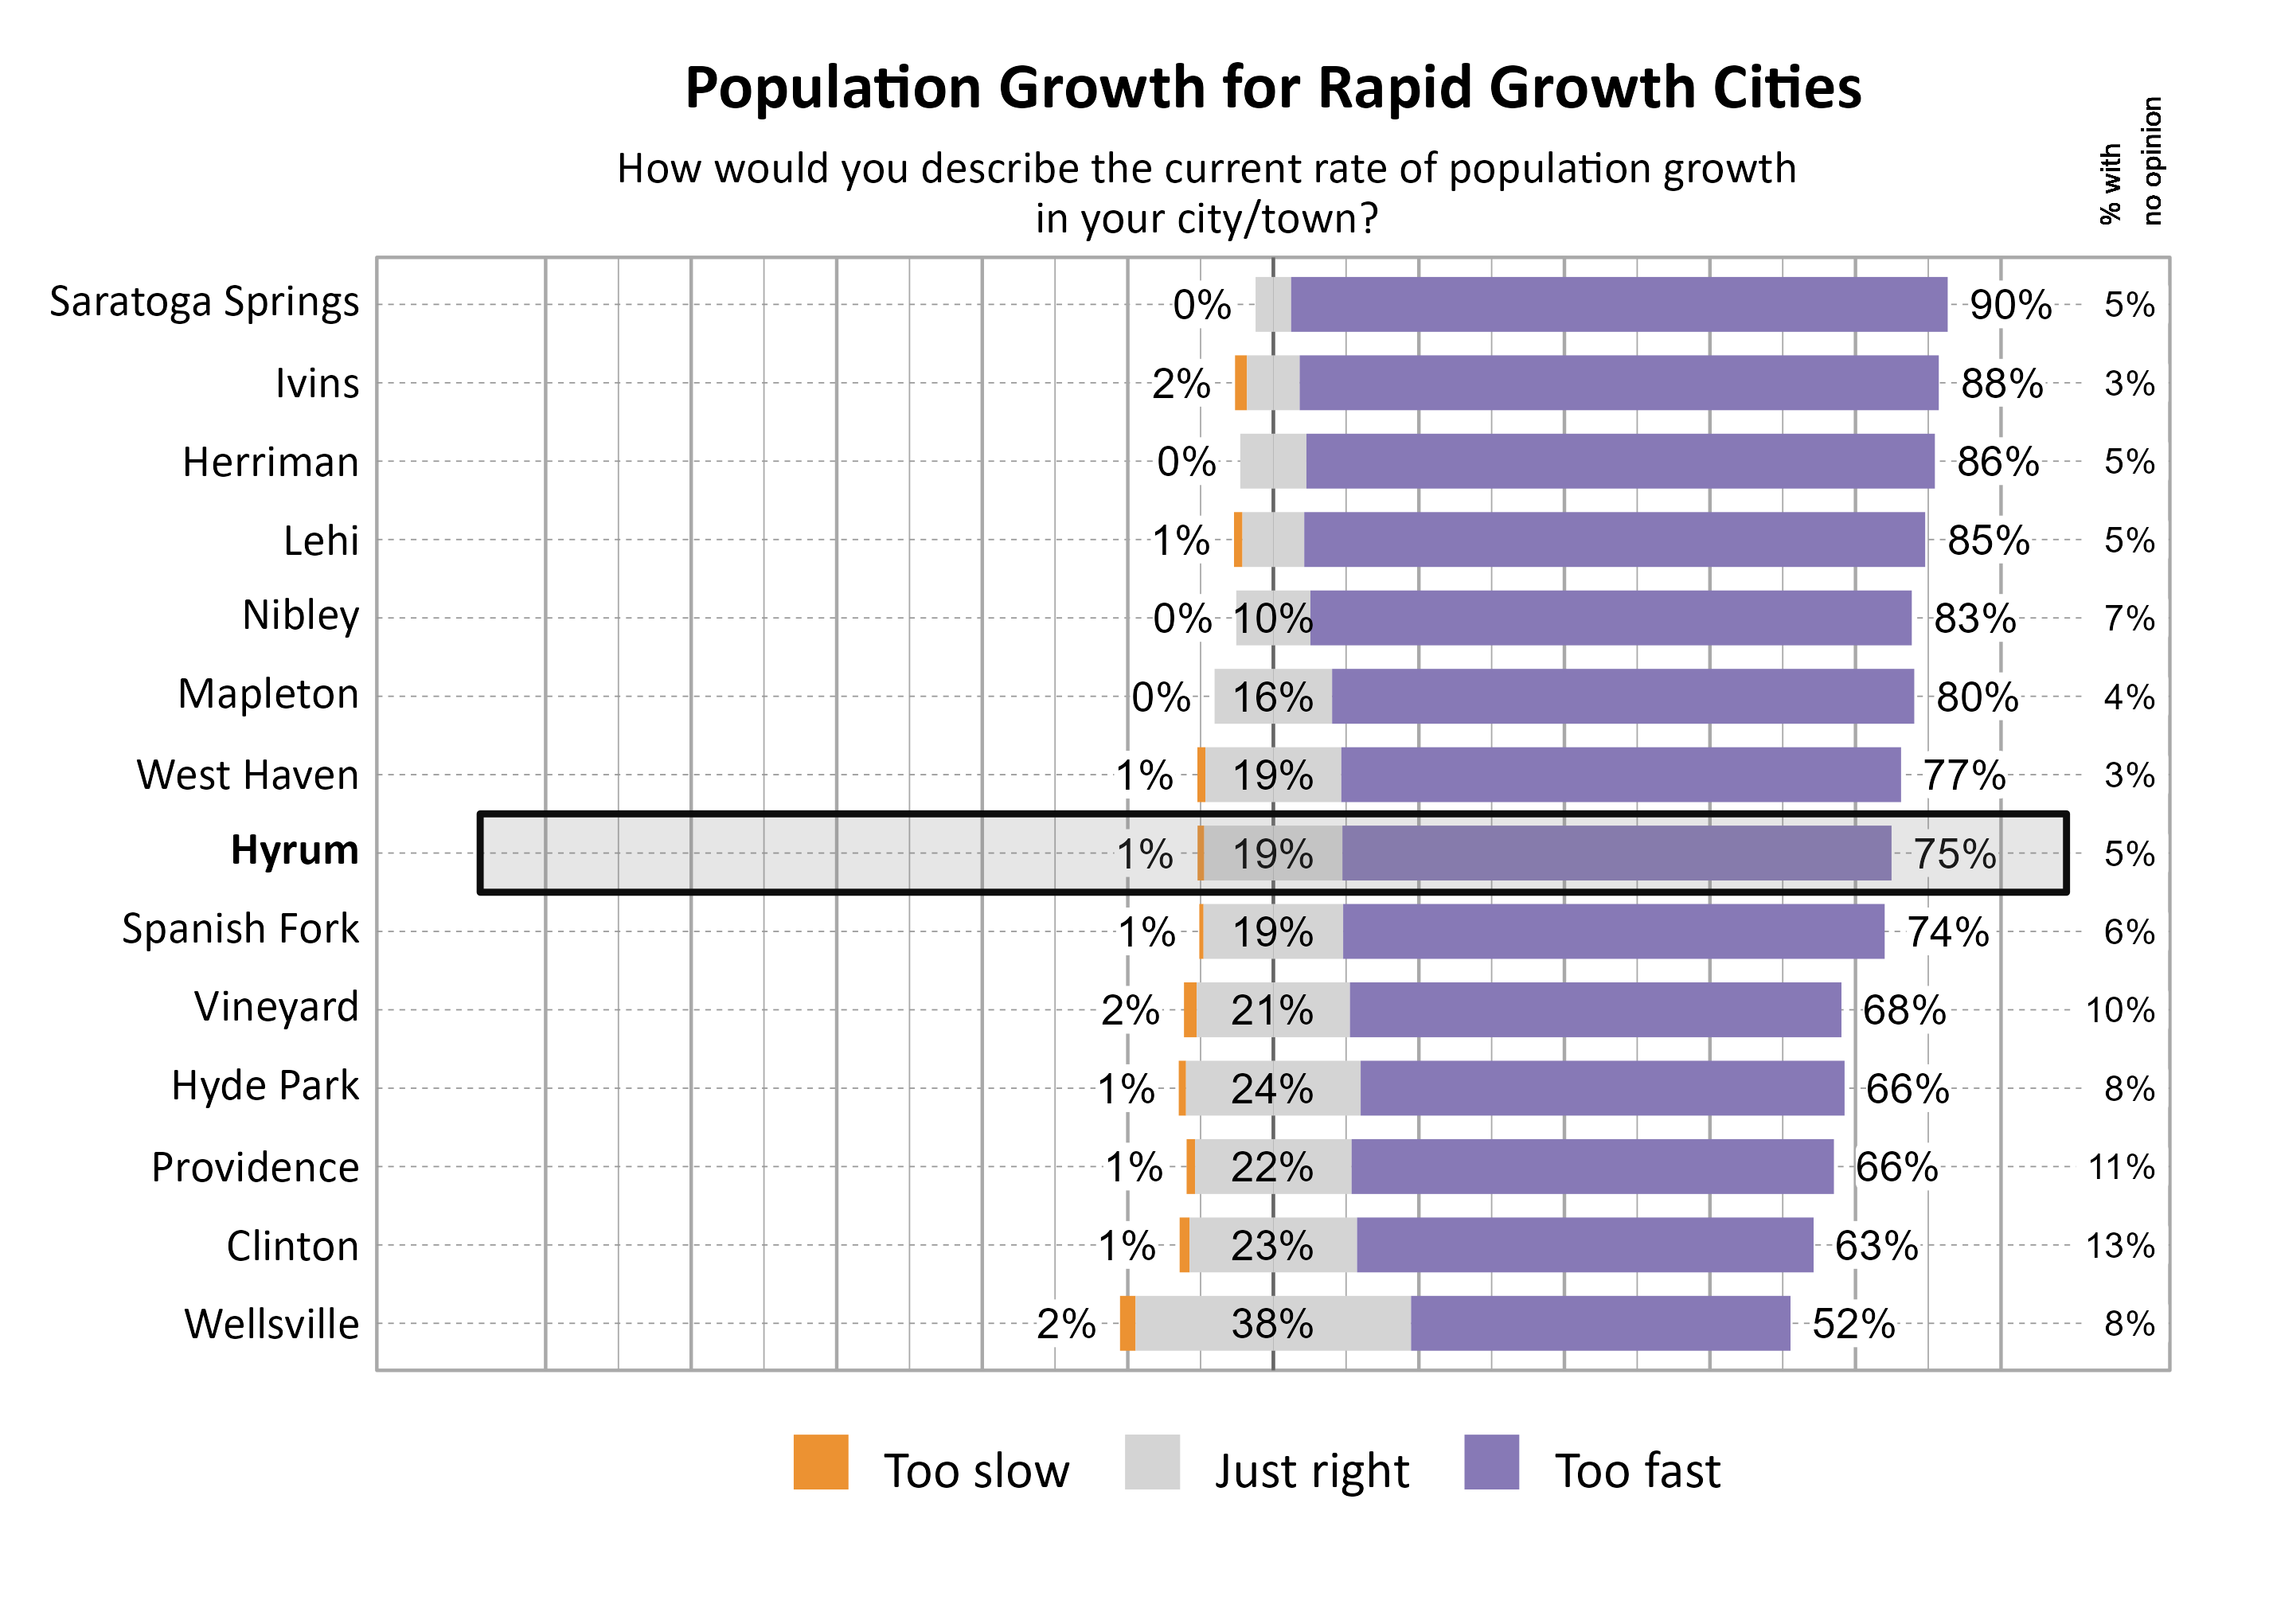
The graphs below show perceptions of population growth and economic development for Hyrum compared to other participating cities and towns in the Rapid Growth Cities cluster.

Likert Graph. Title: Population Growth for Rapid Growth Cities. Subtitle: How would you describe the current rate of population growth in your city/town? Data — City: Saratoga Springs 0% of respondents indicated that it was too slow,  5% indicated that it was just right, 90% indicated that it was too fast, and  5% had no opinion; City: Ivins 2% of respondents indicated that it was too slow,  7% indicated that it was just right, 88% indicated that it was too fast, and  3% had no opinion; City: Herriman 0% of respondents indicated that it was too slow,  9% indicated that it was just right, 86% indicated that it was too fast, and  5% had no opinion; City: Lehi 1% of respondents indicated that it was too slow,  8% indicated that it was just right, 85% indicated that it was too fast, and  5% had no opinion; City: Nibley 0% of respondents indicated that it was too slow, 10% indicated that it was just right, 83% indicated that it was too fast, and  7% had no opinion; City: Mapleton 0% of respondents indicated that it was too slow, 16% indicated that it was just right, 80% indicated that it was too fast, and  4% had no opinion; City: West Haven 1% of respondents indicated that it was too slow, 19% indicated that it was just right, 77% indicated that it was too fast, and  3% had no opinion; City: Hyrum 1% of respondents indicated that it was too slow, 19% indicated that it was just right, 75% indicated that it was too fast, and  5% had no opinion; City: Spanish Fork 1% of respondents indicated that it was too slow, 19% indicated that it was just right, 74% indicated that it was too fast, and  6% had no opinion; City: Vineyard 2% of respondents indicated that it was too slow, 21% indicated that it was just right, 68% indicated that it was too fast, and 10% had no opinion; City: Hyde Park 1% of respondents indicated that it was too slow, 24% indicated that it was just right, 66% indicated that it was too fast, and  8% had no opinion; City: Providence 1% of respondents indicated that it was too slow, 22% indicated that it was just right, 66% indicated that it was too fast, and 11% had no opinion; City: Clinton 1% of respondents indicated that it was too slow, 23% indicated that it was just right, 63% indicated that it was too fast, and 13% had no opinion; City: Wellsville 2% of respondents indicated that it was too slow, 38% indicated that it was just right, 52% indicated that it was too fast, and  8% had no opinion

Likert Graph. Title: Economic Development for Rapid Growth Cities. Subtitle: How would you describe the current pace of economic development in your city/town? Data — City: Ivins 15% of respondents indicated that it was too slow, 22% indicated that it was just right, 55% indicated that it was too fast, and  8% had no opinion; City: Lehi 13% of respondents indicated that it was too slow, 31% indicated that it was just right, 45% indicated that it was too fast, and 10% had no opinion; City: Spanish Fork  6% of respondents indicated that it was too slow, 42% indicated that it was just right, 45% indicated that it was too fast, and  8% had no opinion; City: Saratoga Springs 25% of respondents indicated that it was too slow, 32% indicated that it was just right, 36% indicated that it was too fast, and  7% had no opinion; City: West Haven 34% of respondents indicated that it was too slow, 27% indicated that it was just right, 34% indicated that it was too fast, and  6% had no opinion; City: Mapleton 31% of respondents indicated that it was too slow, 28% indicated that it was just right, 33% indicated that it was too fast, and  8% had no opinion; City: Nibley 19% of respondents indicated that it was too slow, 32% indicated that it was just right, 30% indicated that it was too fast, and 19% had no opinion; City: Clinton 19% of respondents indicated that it was too slow, 40% indicated that it was just right, 29% indicated that it was too fast, and 12% had no opinion; City: Providence 12% of respondents indicated that it was too slow, 48% indicated that it was just right, 27% indicated that it was too fast, and 14% had no opinion; City: Hyrum 32% of respondents indicated that it was too slow, 30% indicated that it was just right, 26% indicated that it was too fast, and 12% had no opinion; City: Herriman 40% of respondents indicated that it was too slow, 28% indicated that it was just right, 25% indicated that it was too fast, and  7% had no opinion; City: Vineyard 50% of respondents indicated that it was too slow, 23% indicated that it was just right, 21% indicated that it was too fast, and  6% had no opinion; City: Hyde Park 29% of respondents indicated that it was too slow, 38% indicated that it was just right, 15% indicated that it was too fast, and 18% had no opinion; City: Wellsville 37% of respondents indicated that it was too slow, 44% indicated that it was just right,  7% indicated that it was too fast, and 12% had no opinion

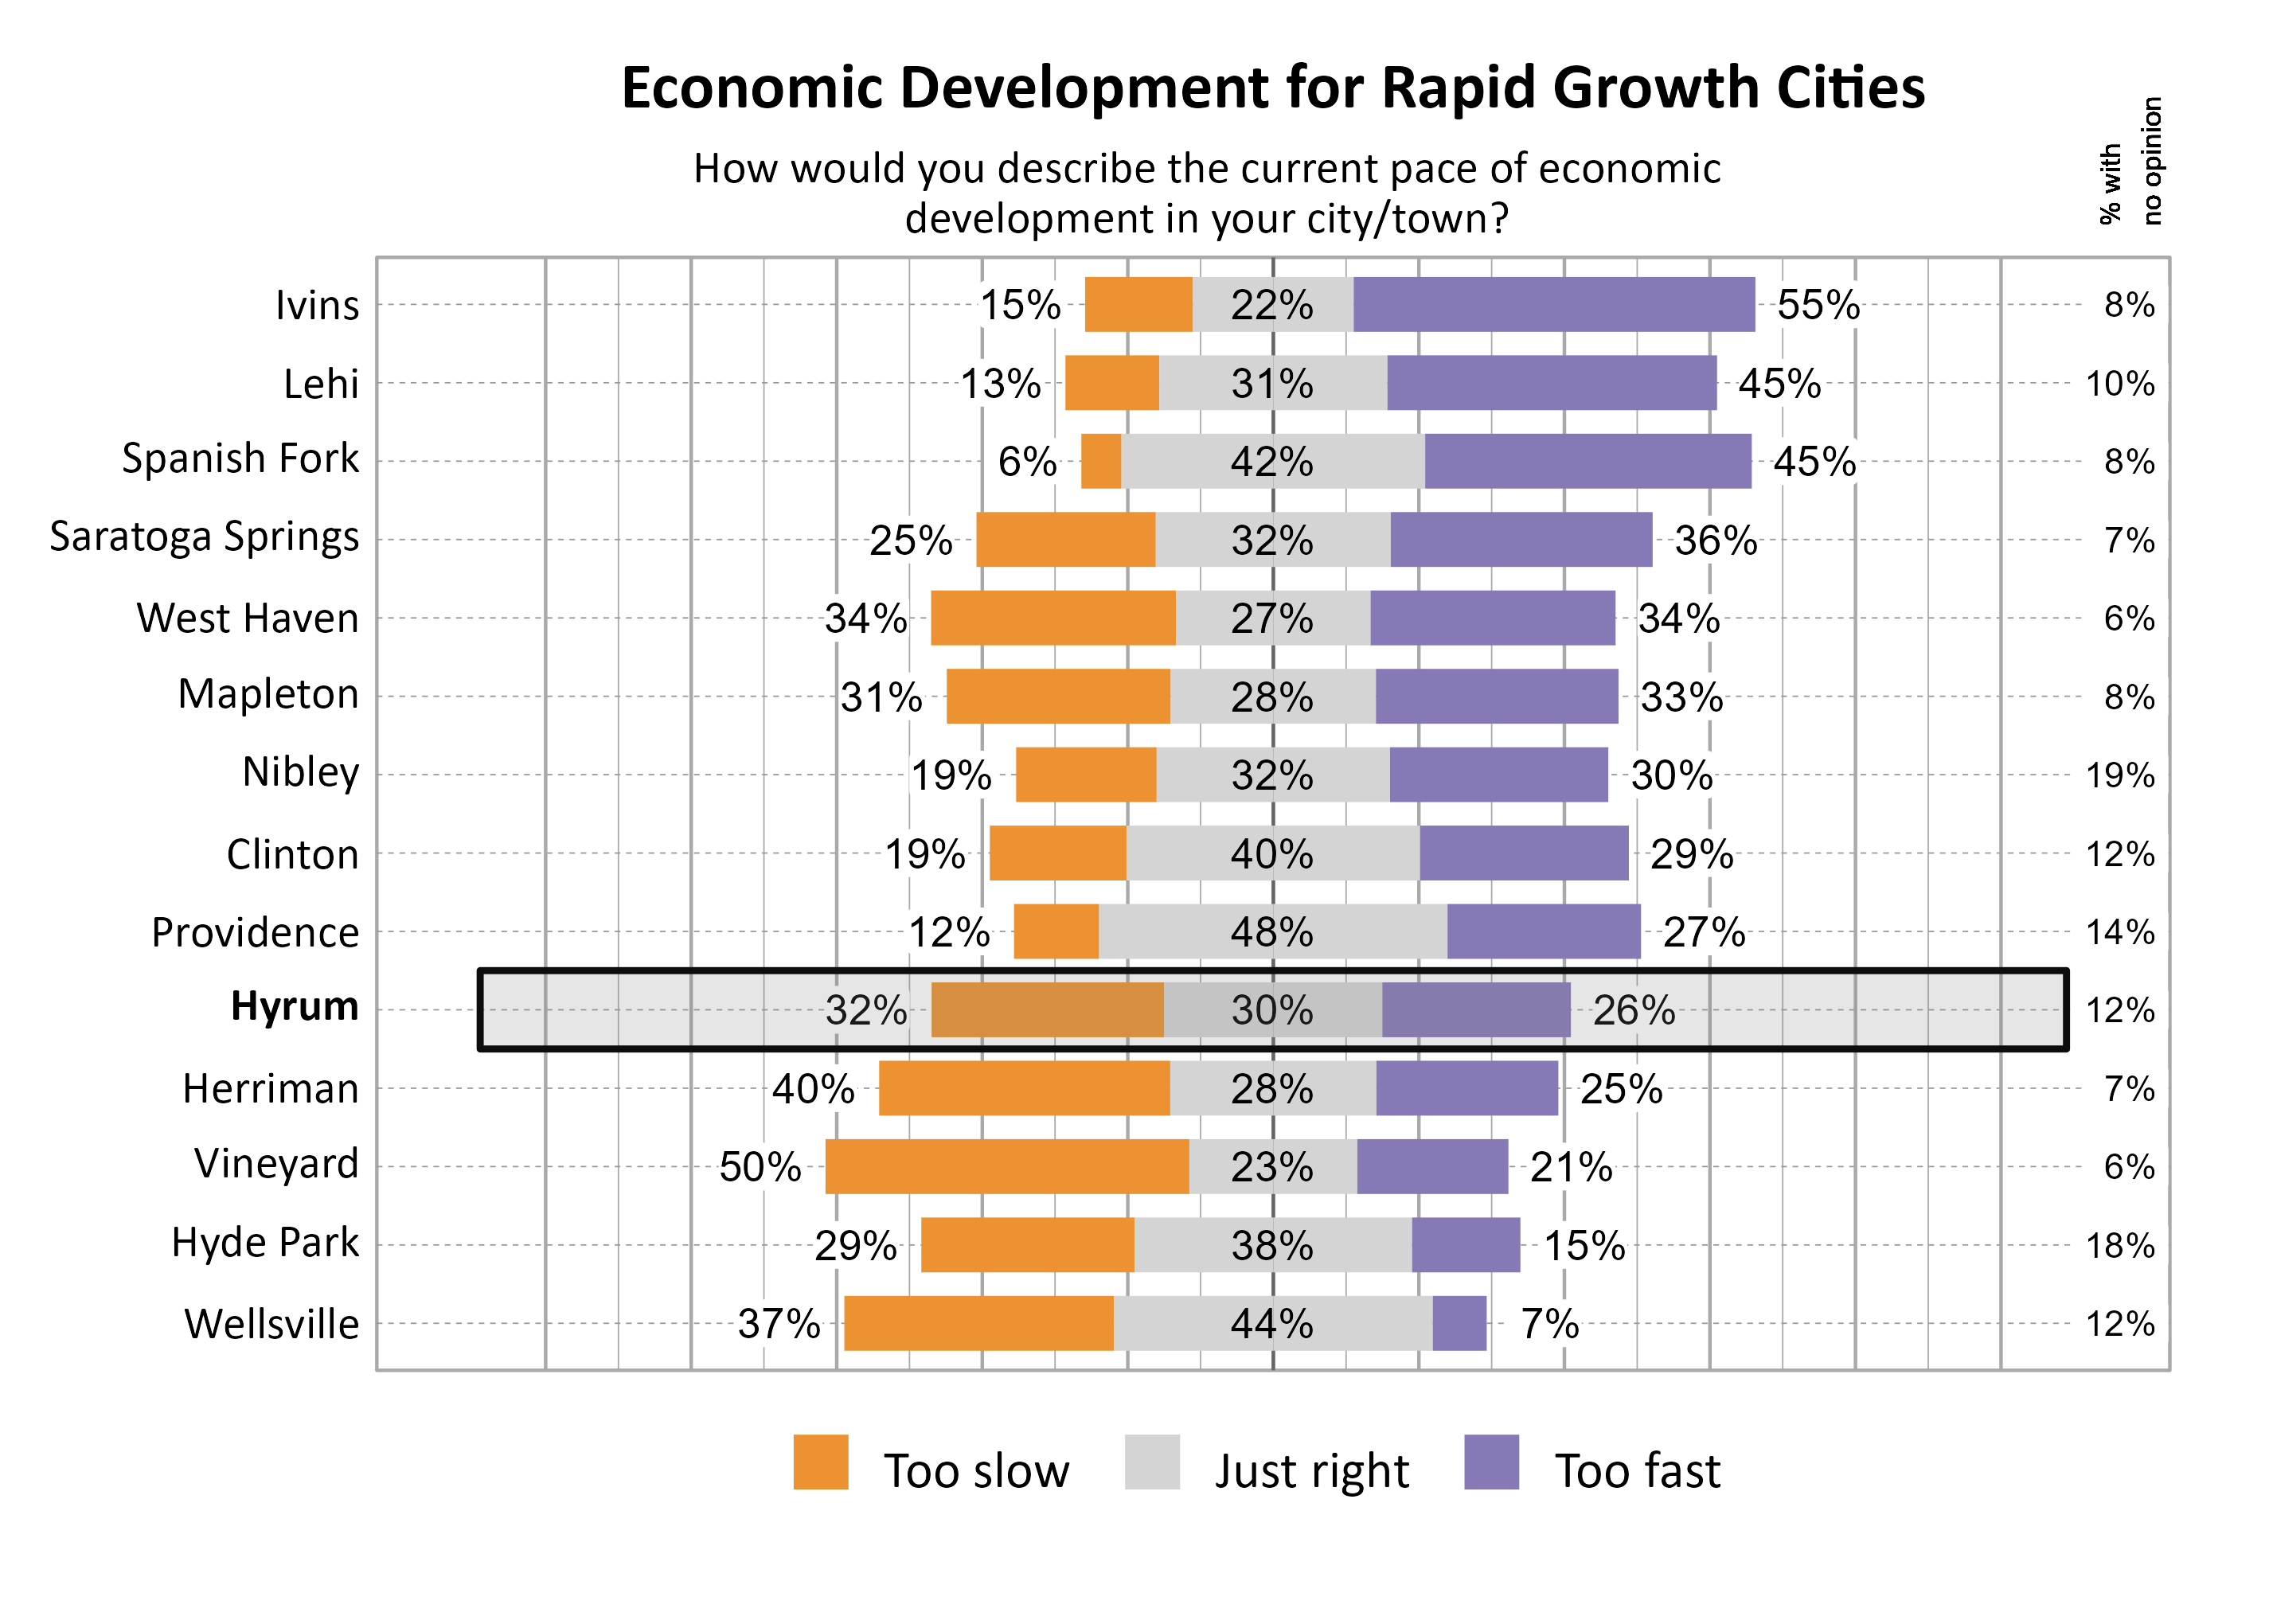
The graph below illustrates how many respondents perceived the pace of economic development as too slow, just right, too fast, or had no opinion, with additional breakdowns for the number of respondents who provided comments.

Sankey Graph. Title: Perceptions about the Pace of Economic Development in Hyrum. Subtitle: How would you describe the current pace of economic development in Hyrum? (In Number of Respondents). Data — Total Respondents: 247; No opinion: 30; Too fast: 64; Just right: 74; Too slow: 79; 'Too fast' without comment: 9; 'Too fast' with comment: 55; 'Too slow' without comment: 11; 'Too slow' with comment: 68

The 32% of respondents who rated the pace of economic growth as “too slow” were further asked what aspects of the local economy they would like to see more of in Hyrum. The dominant theme in the comments was a desire for more retail and business in Hyrum, particularly restaurants and a new grocery store. There were also comments suggesting a need for other amenities and services in Hyrum.

Additionally, the 26% of respondents who rated the pace of economic growth as “too fast” were further asked what aspects of the local economy they feel are growing too quickly in Hyrum. Comments focused mostly on housing, particularly apartments and multi-family housing. Sentiments expressed concern about stress on resources such as water and power as well as loss of green space and open space. There were quite a few comments about the loss of small town feel in Hyrum with new housing developments.

Transportation in Hyrum

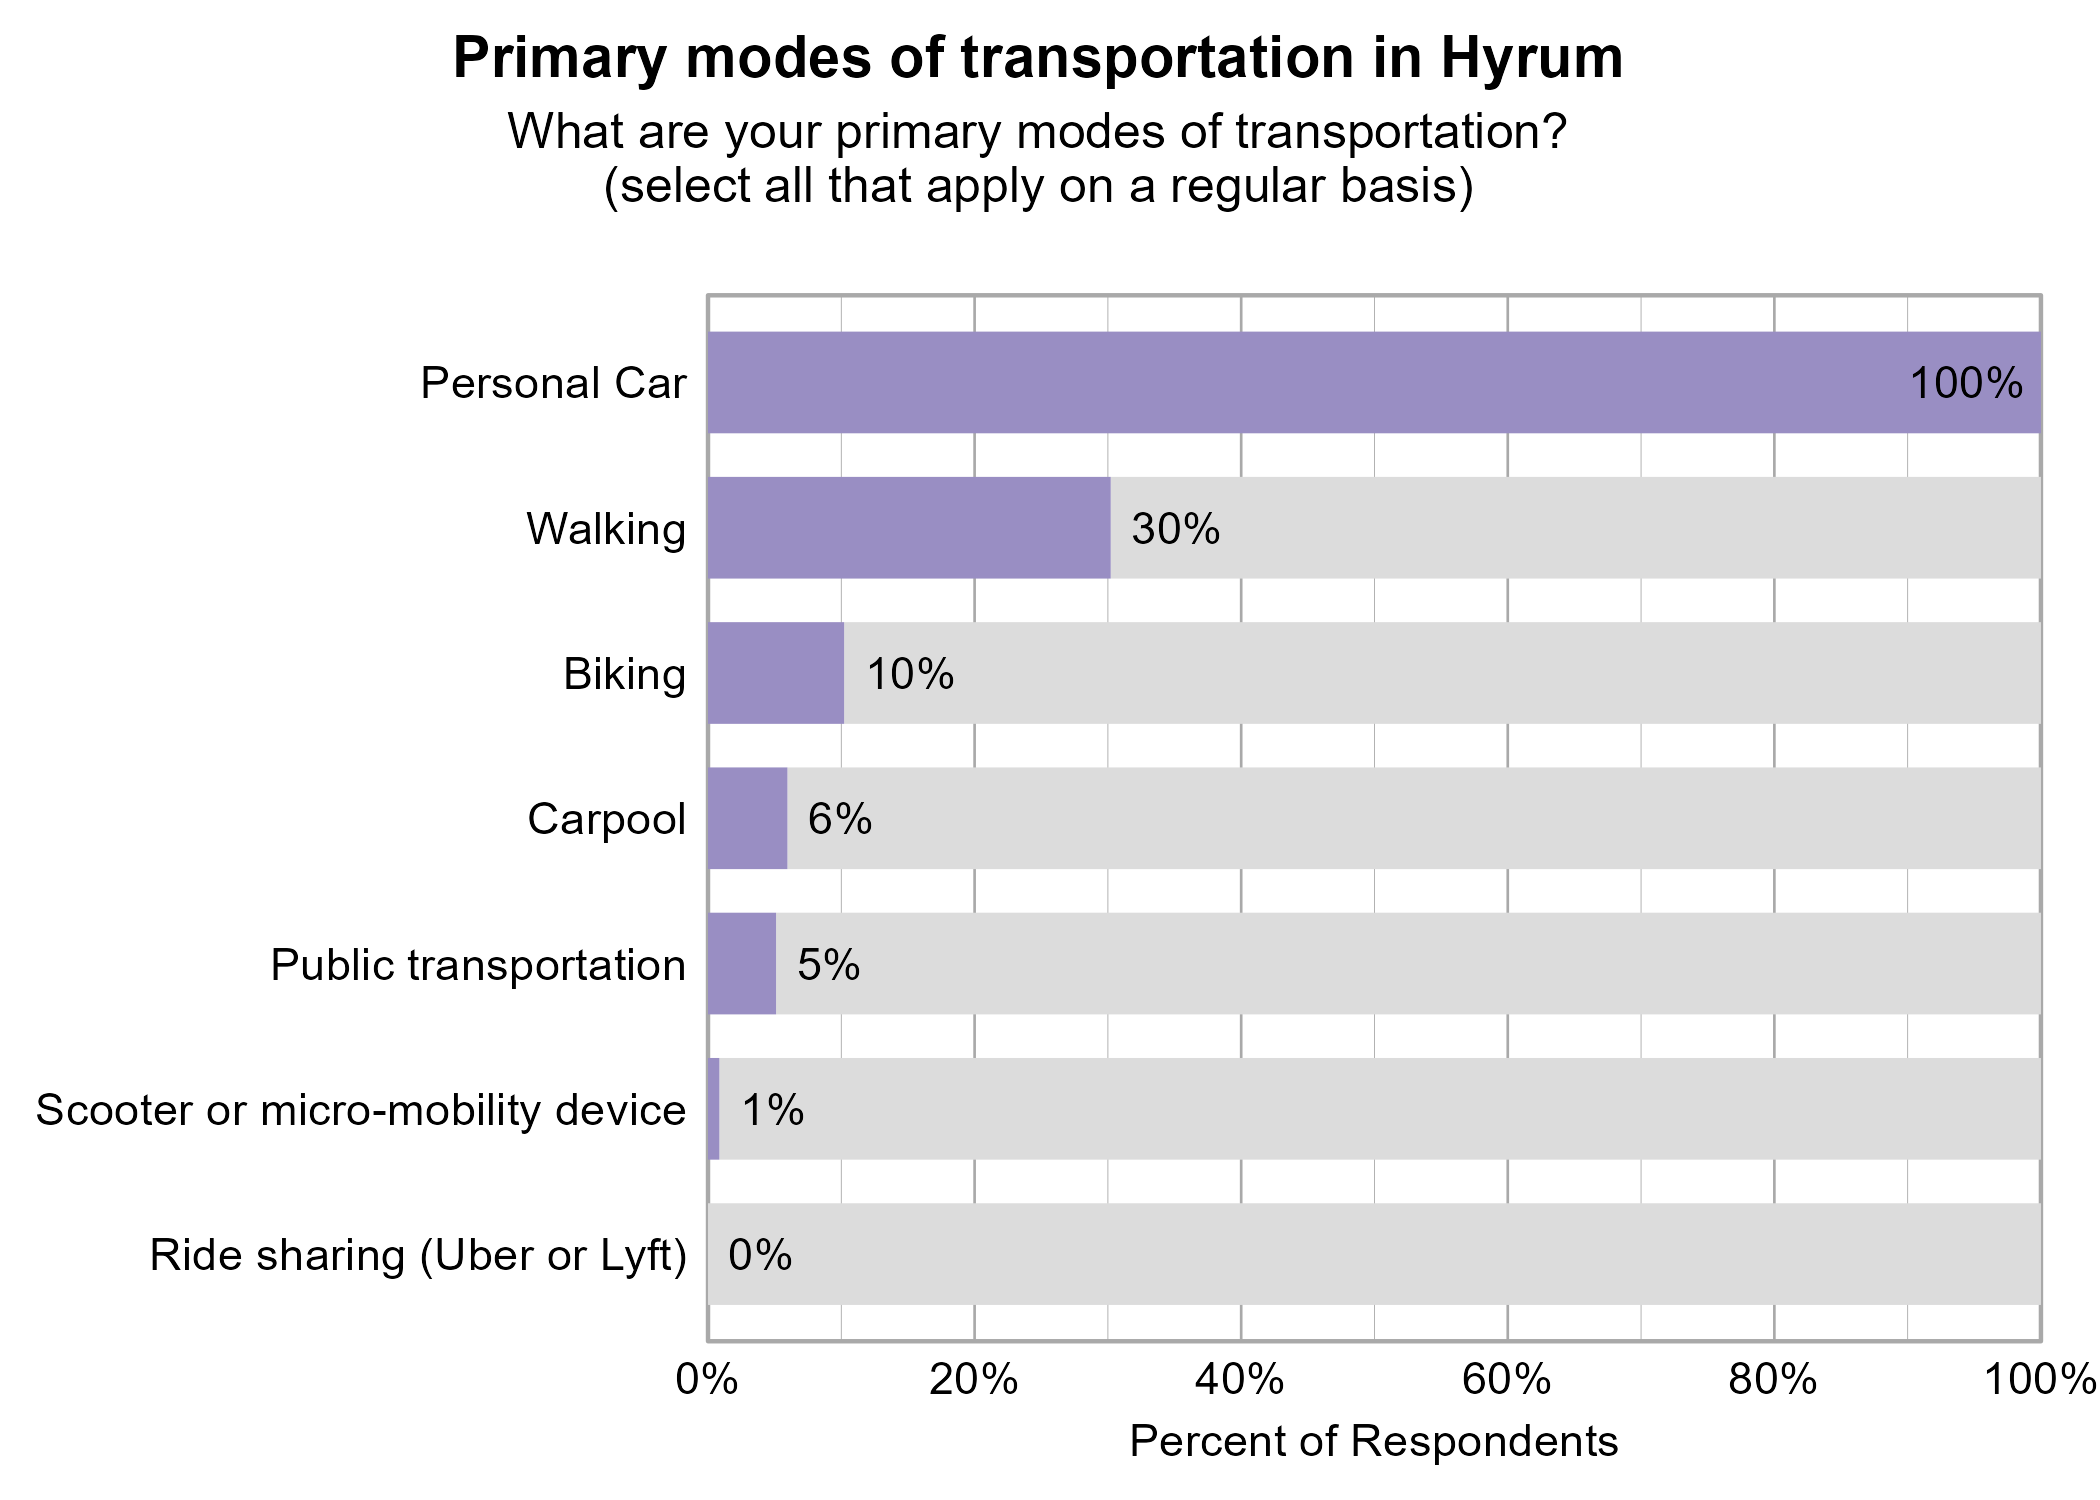
Respondents were asked to indicate all of their primary modes of transportation on a regular basis in Hyrum. The most popular modes of transportation were personal car (100%) and walking (30%).

Bar Graph. Title: Primary modes of transportation in Hyrum. Subtitle: What are your primary modes of transportation? (select all that apply on a regular basis) Data — 100% of respondents indicated yes to Personal Car; 30% of respondents indicated yes to Walking; 10% of respondents indicated yes to Biking; 6% of respondents indicated yes to Carpool; 5% of respondents indicated yes to Public transportation; 1% of respondents indicated yes to Scooter or micro-mobility device; 0% of respondents indicated yes to Ride sharing (Uber or Lyft)

Respondents were asked to indicate the most common barriers to transportation in Hyrum. The most problematic barriers were Travel time (38%) and Cost (34%).

Likert Graph. Title: Barriers to Personal Travel in Hyrum. Subtitle: Are any of the following a barrier to you personal travel? Data — Category: Travel time - 62% of respondents indicated it was not a barrier or seldom a barrier, while 38% of respondents indicated it was sometimes, often, or always a barrier; Category: Cost - 66% of respondents indicated it was not a barrier or seldom a barrier, while 34% of respondents indicated it was sometimes, often, or always a barrier; Category: Lack of routes - 77% of respondents indicated it was not a barrier or seldom a barrier, while 23% of respondents indicated it was sometimes, often, or always a barrier; Category: Safety - 85% of respondents indicated it was not a barrier or seldom a barrier, while 15% of respondents indicated it was sometimes, often, or always a barrier; Category: Knowledge - 94% of respondents indicated it was not a barrier or seldom a barrier, while  6% of respondents indicated it was sometimes, often, or always a barrier; Category: Disability - 95% of respondents indicated it was not a barrier or seldom a barrier, while  5% of respondents indicated it was sometimes, often, or always a barrier; Category: Lack of transport - 95% of respondents indicated it was not a barrier or seldom a barrier, while  5% of respondents indicated it was sometimes, often, or always a barrier; Category: Language - 98% of respondents indicated it was not a barrier or seldom a barrier, while  2% of respondents indicated it was sometimes, often, or always a barrier

Respondents were asked to indicate the importance of a set of possible transportation developments in Hyrum. The most important development to respondents were Enhancing safety (65%), Improving road surfaces (62%), and Improving walkability (57%).

Likert Graph. Title: Possible Transportation Developments in Hyrum. Subtitle: On a scale of 1 - Not at all important to 5 - Very important, please rate the importance of the following developments to you. Data — Category: Enhancing safety - 35% of respondents indicated it 1, 2, or 3, while 65% of respondents rated it a 4 or 5.; Category: Improving road surfaces - 38% of respondents indicated it 1, 2, or 3, while 62% of respondents rated it a 4 or 5.; Category: Improving walkability - 43% of respondents indicated it 1, 2, or 3, while 57% of respondents rated it a 4 or 5.; Category: More trails - 50% of respondents indicated it 1, 2, or 3, while 50% of respondents rated it a 4 or 5.; Category: Connecting communities - 63% of respondents indicated it 1, 2, or 3, while 37% of respondents rated it a 4 or 5.; Category: Adding road capacity - 72% of respondents indicated it 1, 2, or 3, while 28% of respondents rated it a 4 or 5.; Category: Improving public transit - 74% of respondents indicated it 1, 2, or 3, while 26% of respondents rated it a 4 or 5.

Respondents were asked to indicate how frequently various activities take them out of Hyrum to another city or town. The most commonly indicated reasons for traveling to another city or town at least sometimes or once a month were Groceries (98%), Eating Out (94%), and Friends and Family (87%).
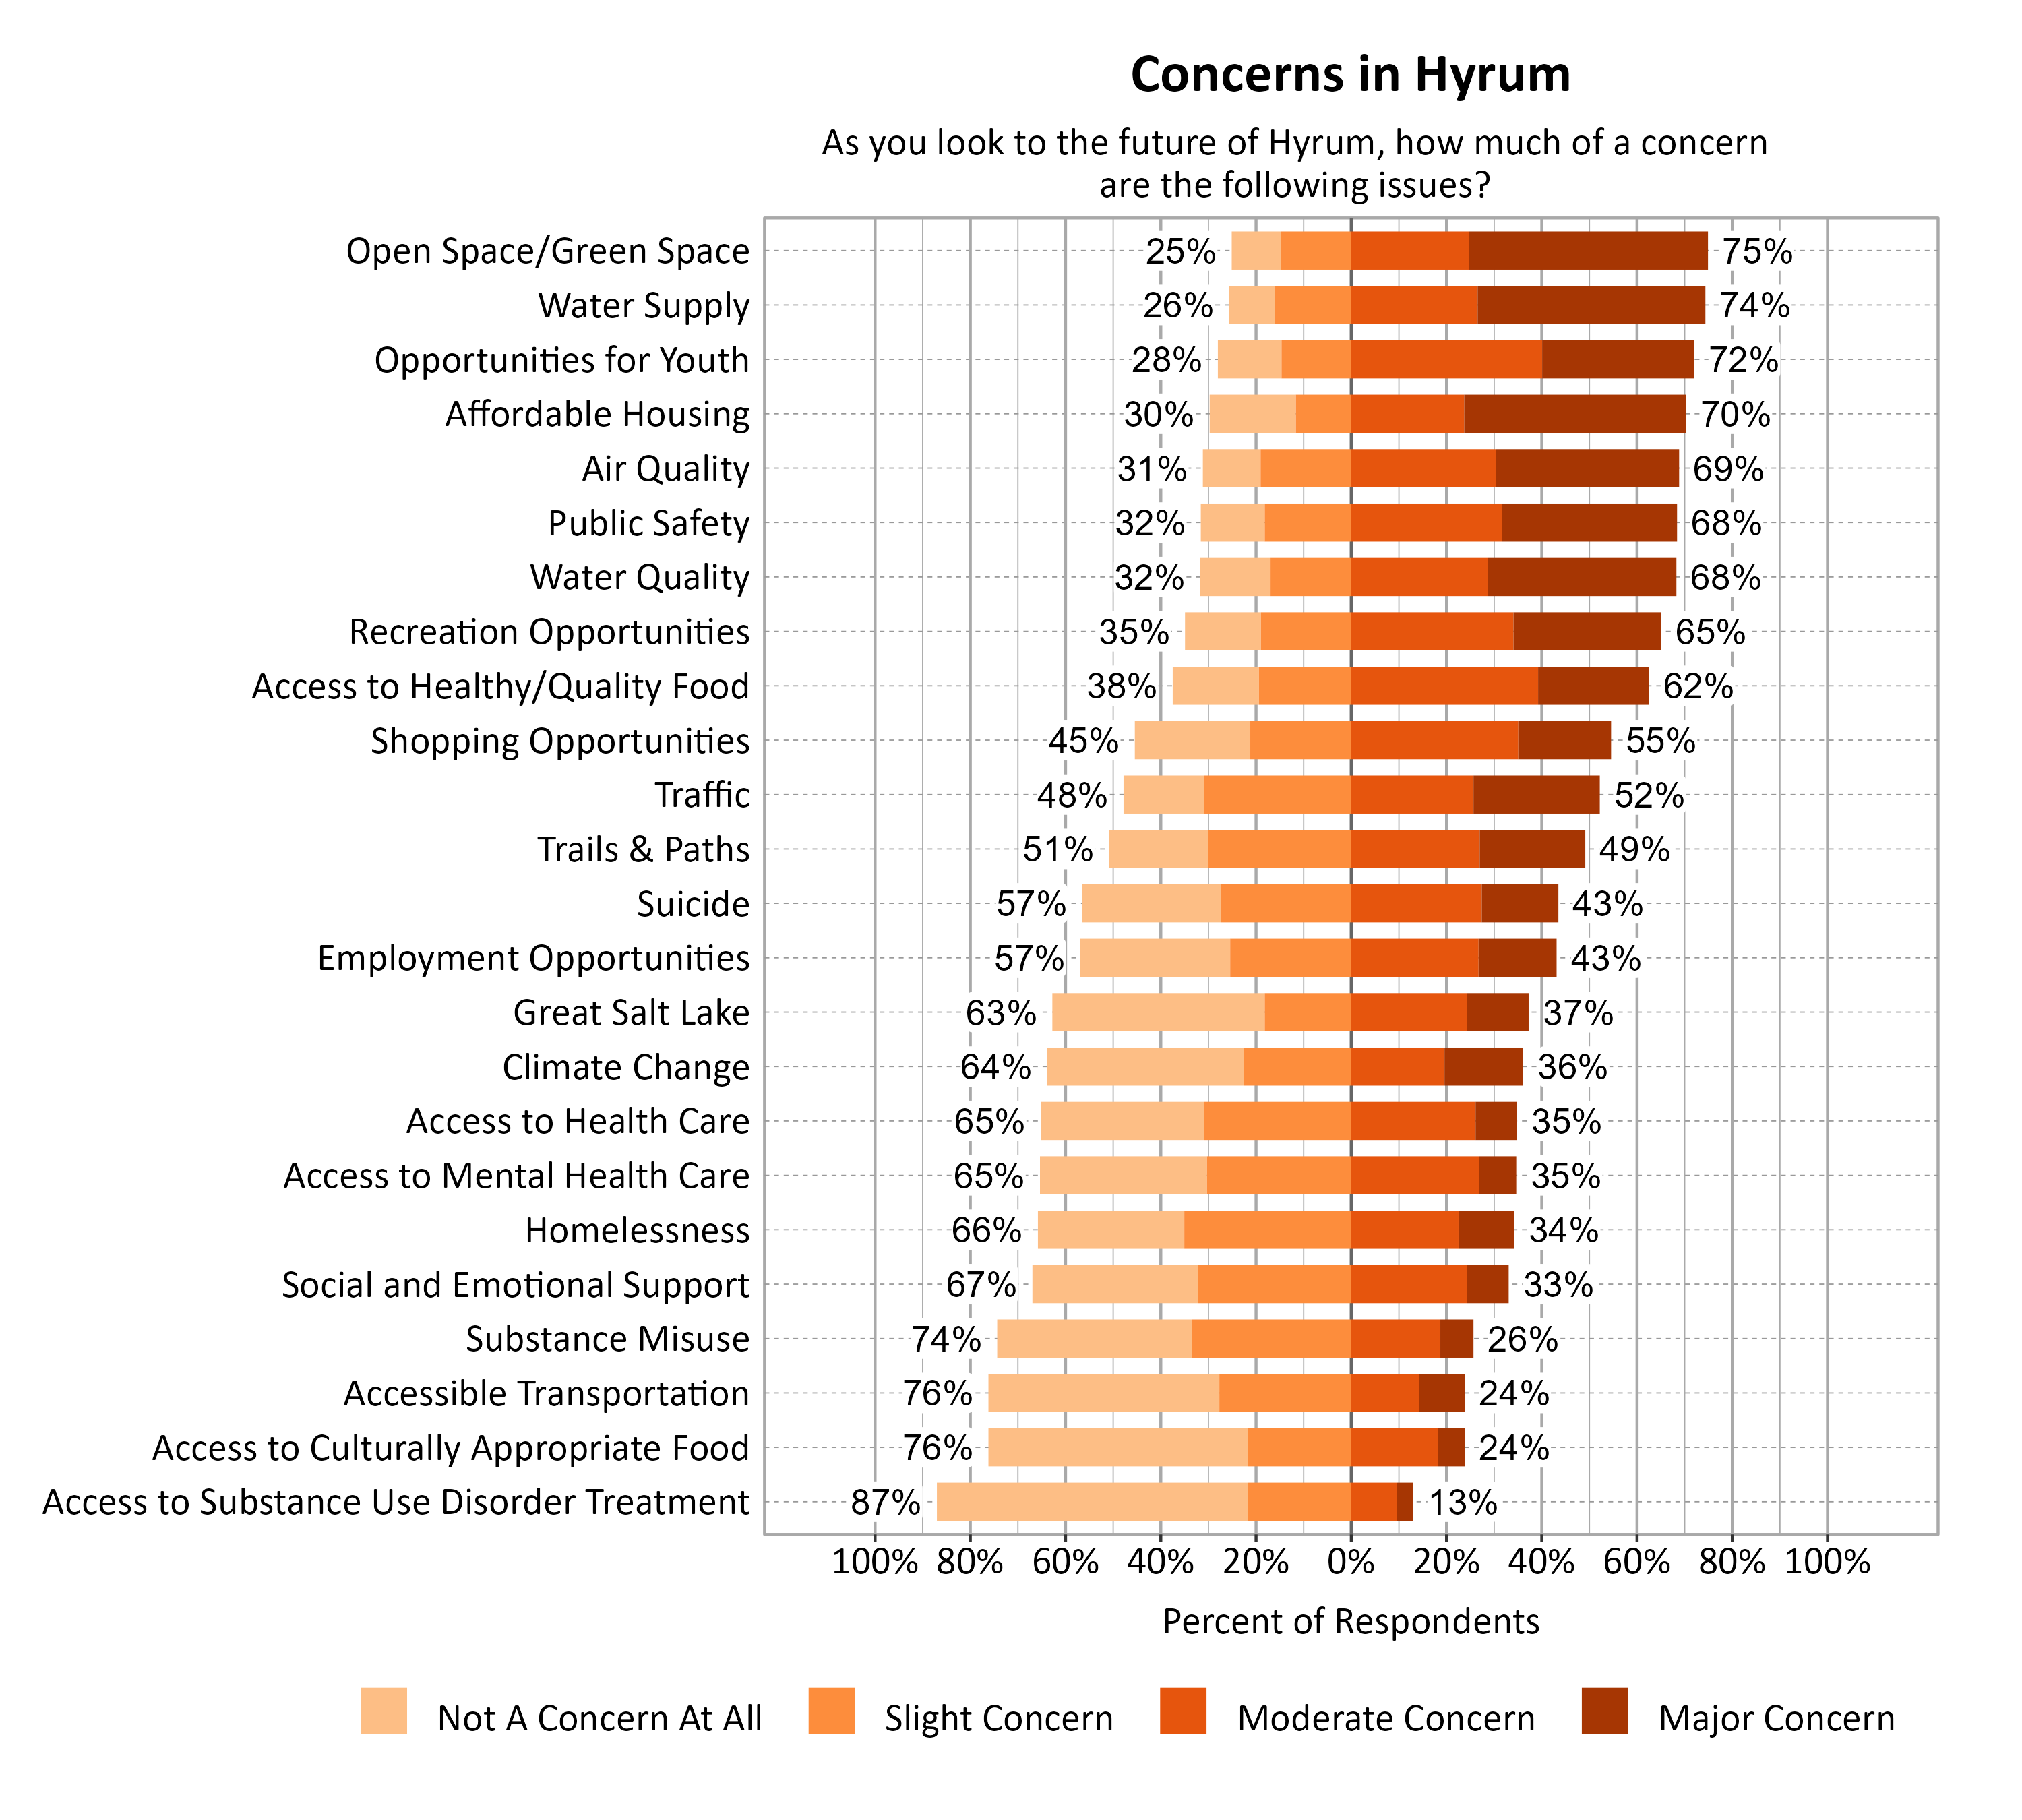
Likert Graph. Title: Frequency of Hyrum Residents Traveling to Other Cities for Various Activities. Subtitle: How frequently do each of these activities take you out of Hyrum to another city or town? Data — Category: Groceries -  2% of respondents indicated it was never or rarely and 98% of respondents indicated it was sometimes, regularly, often; Category: Eating Out -  6% of respondents indicated it was never or rarely and 94% of respondents indicated it was sometimes, regularly, often; Category: Friends and Family - 13% of respondents indicated it was never or rarely and 87% of respondents indicated it was sometimes, regularly, often; Category: Other Services - 15% of respondents indicated it was never or rarely and 85% of respondents indicated it was sometimes, regularly, often; Category: Health/Medical Care - 23% of respondents indicated it was never or rarely and 77% of respondents indicated it was sometimes, regularly, often; Category: Recreation/Sports - 27% of respondents indicated it was never or rarely and 73% of respondents indicated it was sometimes, regularly, often; Category: Work - 34% of respondents indicated it was never or rarely and 66% of respondents indicated it was sometimes, regularly, often; Category: School/Education - 64% of respondents indicated it was never or rarely and 36% of respondents indicated it was sometimes, regularly, often; Category: Religion - 80% of respondents indicated it was never or rarely and 20% of respondents indicated it was sometimes, regularly, often

Concerns in Hyrum

Survey respondents indicated the degree to which a number of possible local issues were a concern as they look to the future of Hyrum. Open Space/Green Space (75%), Water Supply (74%), and Opportunities for Youth (72%) were the top concerns.

Likert Graph. Title: Concerns in Hyrum. Subtitle: As you look to the future of Hyrum, how much of a concern are the following issues? Data — Category: Open Space/Green Space - 25% of respondents indicated not a concern at all or slight concern while 75% of respondents indicated a moderate or major concern; Category: Water Supply - 26% of respondents indicated not a concern at all or slight concern while 74% of respondents indicated a moderate or major concern; Category: Opportunities for Youth - 28% of respondents indicated not a concern at all or slight concern while 72% of respondents indicated a moderate or major concern; Category: Affordable Housing - 30% of respondents indicated not a concern at all or slight concern while 70% of respondents indicated a moderate or major concern; Category: Air Quality - 31% of respondents indicated not a concern at all or slight concern while 69% of respondents indicated a moderate or major concern; Category: Public Safety - 32% of respondents indicated not a concern at all or slight concern while 68% of respondents indicated a moderate or major concern; Category: Water Quality - 32% of respondents indicated not a concern at all or slight concern while 68% of respondents indicated a moderate or major concern; Category: Recreation Opportunities - 35% of respondents indicated not a concern at all or slight concern while 65% of respondents indicated a moderate or major concern; Category: Access to Healthy/Quality Food - 38% of respondents indicated not a concern at all or slight concern while 62% of respondents indicated a moderate or major concern; Category: Shopping Opportunities - 45% of respondents indicated not a concern at all or slight concern while 55% of respondents indicated a moderate or major concern; Category: Traffic - 48% of respondents indicated not a concern at all or slight concern while 52% of respondents indicated a moderate or major concern; Category: Trails & Paths - 51% of respondents indicated not a concern at all or slight concern while 49% of respondents indicated a moderate or major concern; Category: Employment Opportunities - 57% of respondents indicated not a concern at all or slight concern while 43% of respondents indicated a moderate or major concern; Category: Suicide - 57% of respondents indicated not a concern at all or slight concern while 43% of respondents indicated a moderate or major concern; Category: Great Salt Lake - 63% of respondents indicated not a concern at all or slight concern while 37% of respondents indicated a moderate or major concern; Category: Climate Change - 64% of respondents indicated not a concern at all or slight concern while 36% of respondents indicated a moderate or major concern; Category: Access to Health Care - 65% of respondents indicated not a concern at all or slight concern while 35% of respondents indicated a moderate or major concern; Category: Access to Mental Health Care - 65% of respondents indicated not a concern at all or slight concern while 35% of respondents indicated a moderate or major concern; Category: Homelessness - 66% of respondents indicated not a concern at all or slight concern while 34% of respondents indicated a moderate or major concern; Category: Social and Emotional Support - 67% of respondents indicated not a concern at all or slight concern while 33% of respondents indicated a moderate or major concern; Category: Substance Misuse - 74% of respondents indicated not a concern at all or slight concern while 26% of respondents indicated a moderate or major concern; Category: Access to Culturally Appropriate Food - 76% of respondents indicated not a concern at all or slight concern while 24% of respondents indicated a moderate or major concern; Category: Accessible Transportation - 76% of respondents indicated not a concern at all or slight concern while 24% of respondents indicated a moderate or major concern; Category: Access to Substance Use Disorder Treatment - 87% of respondents indicated not a concern at all or slight concern while 13% of respondents indicated a moderate or major concern

Additional Questions for Hyrum

Amenities and Services in Hyrum

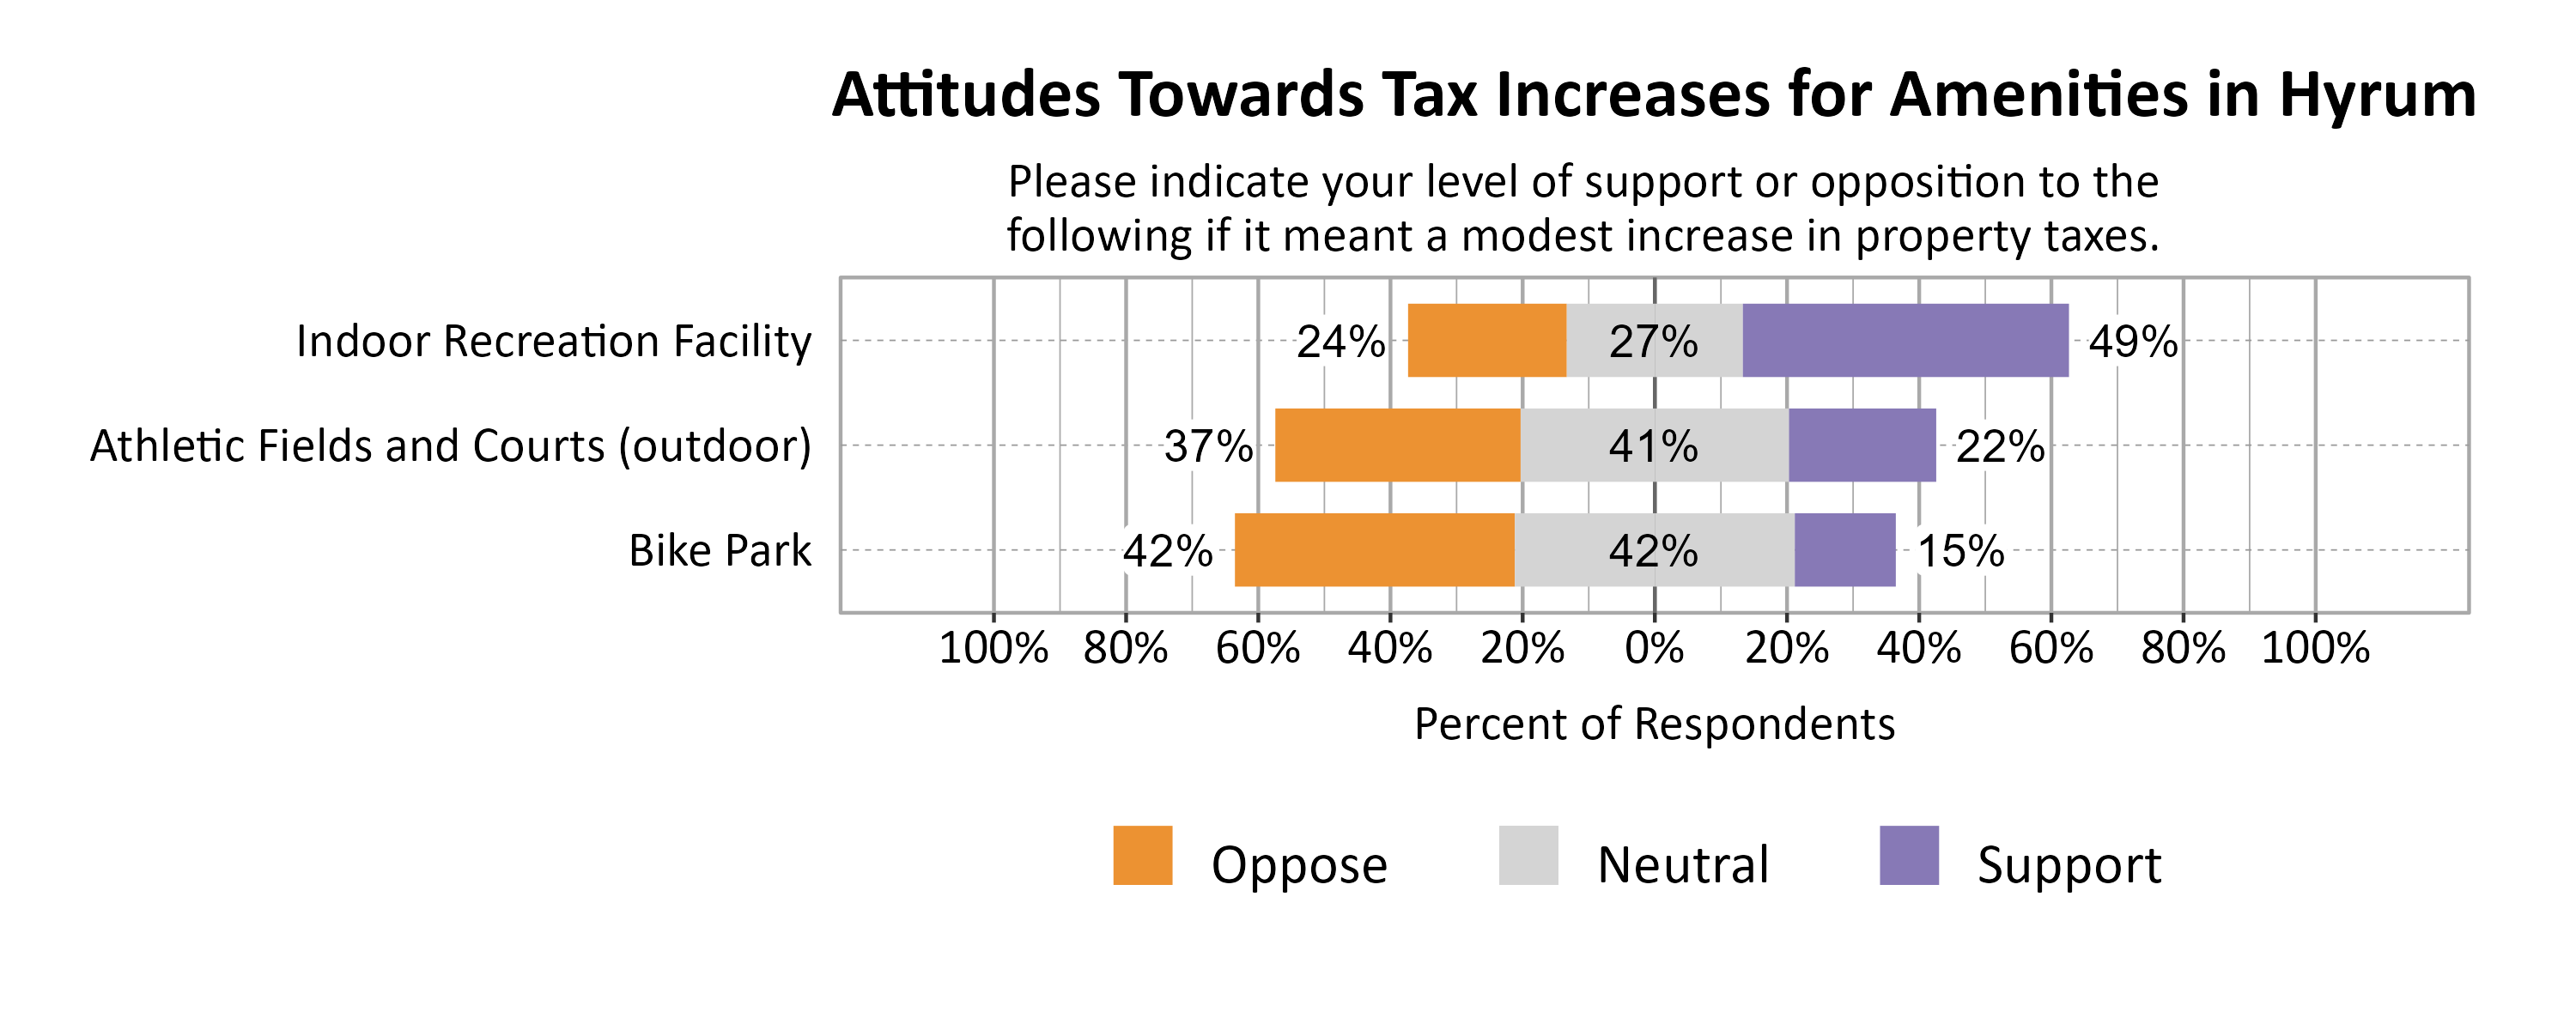
Survey participants were asked how important certain possible amenities in Hyrum would be to the wellbeing of their household. The most important amenities were Indoor Recreation Facility (76%) and Athletic Fields and Courts (outdoor) (76%).

Likert Graph. Title: Importance of Amenities in Hyrum. Data — Category: Athletic Fields and Courts (outdoor) - 24% of respondents rated it as not important, while 76% rated it as somewhat or very important.; Category: Indoor Recreation Facility - 24% of respondents rated it as not important, while 76% rated it as somewhat or very important.; Category: Bike Park - 43% of respondents rated it as not important, while 57% rated it as somewhat or very important.

Respondents were also asked about their preference regarding taxation to fund potential these same amenities in Hyde Park. The most supported amenity was an Indoor Recreation Facility (49%).

Likert Graph. Title: Attitudes Towards Tax Increases for Amenities in Hyrum. Subtitle: Please indicate your level of support or opposition to the following if it meant a modest increase in property taxes. Data — Category: Indoor Recreation Facility - 24% of respondents indicated that they oppose a tax increase, 27% indicated that they are neutral, and 49% support a tax increase; Category: Athletic Fields and Courts (outdoor) - 37% of respondents indicated that they oppose a tax increase, 41% indicated that they are neutral, and 22% support a tax increase; Category: Bike Park - 42% of respondents indicated that they oppose a tax increase, 42% indicated that they are neutral, and 15% support a tax increase

Respondents were also asked if they had any additional comments about Hyrum City amenities or services. There were many comments related to recreation. Quite a few comments expressed desire for an indoor recreation facility (with a pool) and additional recreation opportunities in general, though there were a few comments against an indoor facility. Some would value more walking or bike paths. There were comments requesting more attention to the needs of those with disabilities or special needs. There was appreciation for the new skate park and new playground equipment. There were a few frustrations about locked baseball fields and safety issues in crosswalks.

Open Comments

All open comments collected in the survey were shared with city leaders. General observations and themes are shared here.

What Respondents Value Most in Hyrum

Survey respondents were asked to comment on what they value most about Hyrum. The most common words and phrases from all city comments are included in the word cloud below. It is possible that negative or unrelated words may appear since these words have been taken out of context, and they may not indicate the respondent’s intended meaning. Appreciation about the small-town feel of the town was the most common theme. Comments also recognized the positive social climate and community in Hyrum.

A word cloud of most common words about what respondents value most in their city

Local Environmental Quality in Hyrum

The 45% of respondents who rated the Local Environmental Quality domain as 1, 2, or 3 (Poor, Fair, or Moderate) were further asked if there are specific aspects of local environmental quality that they feel are problematic. Trash, cleanliness, and odors from the JBS plant and mink farms were major concerns that detract from local environmental quality in Hyrum. Air Quality was also a main concern, as well as preserving green and open space as growth continues.

Improving Wellbeing in Hyrum

Survey respondents were asked if there is anything that could be done to improve wellbeing in Hyrum. Many comments expressed the desire to slow or stop the rapid growth in the area. Several comments also expressed concerns about the road conditions and many indicated a need for more sidewalks. Many comments expressed the desire for more local recreational facilities and local opportunities, especially for children in the winter months.

Additional Comments

Respondents were also asked if they had any additional comments on wellbeing in Hyrum. The most frequent concerns revolved around the rapid growth of the town, with many residents calling for a slowdown in building new houses and townhouses to preserve open spaces and prevent overcrowding. Transportation improvements were also mentioned, including better road maintenance, enhanced road signage, more sidewalks, and safer pedestrian paths to address traffic congestion and speeding issues.