Layton Wellbeing Survey Findings 2024
By Dr. Courtney Flint and Team
![]()
Contact Information
Dr. Courtney Flint
courtney.flint@usu.edu
435-797-8635
Summary
Layton is one of 51 cities participating in the Utah Wellbeing Survey Project in 2024. This project is designed to assess the wellbeing and local perspectives of city residents and to provide information to city leaders to inform general planning processes. Additional analysis is underway and this report may be updated over time.
We are grateful to all those who took the survey and to our city partners who helped to make this possible. We are grateful to a number of entities for funding: the Utah League of Cities and Towns, USU Extension, USU’s Institute for Land Water and Air, the Wasatch Front Regional Council, Utah Department of Transportation, the Utah Agricultural Experiment Station, and the cities of Alpine, Cedar Hills, Draper, Millcreek, Nephi, North Salt Lake, Ogden, Orem, Pleasant Grove, Providence, Springdale, Tremonton, West Bountiful, and West Valley City.
This report describes findings from the 2024 Layton survey and comparative information with other project cities. In March and April 2024, Layton City advertised the survey for residents largely through social media. All city residents age 18+ were encouraged to take the online Qualtrics survey.
How many people responded?
- 334 viable surveys were recorded in this 2024 survey effort.
- The Layton 2022 survey had 319 responses and the Layton 2021 survey had 403 responses.
- The adult population of Layton was estimated at 57,663, based on the American Community Survey by the U.S. Census. The 334 survey responses in 2024 represent 0.6% of the adult population and have a conservative margin of error of 5.35%.
Survey Respondent Characteristics
| Resident Statistics | |
|---|---|
| Full Time Residents of Layton | 98.5% |
| Part Time Residents of Layton | 1.5% |
| Length of Residency — Range | 0.2-68 years |
| Length of Residency — Average | 18.8 years |
| Length of Residency — Median | 14 years |
| Length of Residency 5 Years or less | 24.6% |
| ZIP Code | Percent |
|---|---|
| 84040 | 42.5% |
| 84041 | 57.5% |
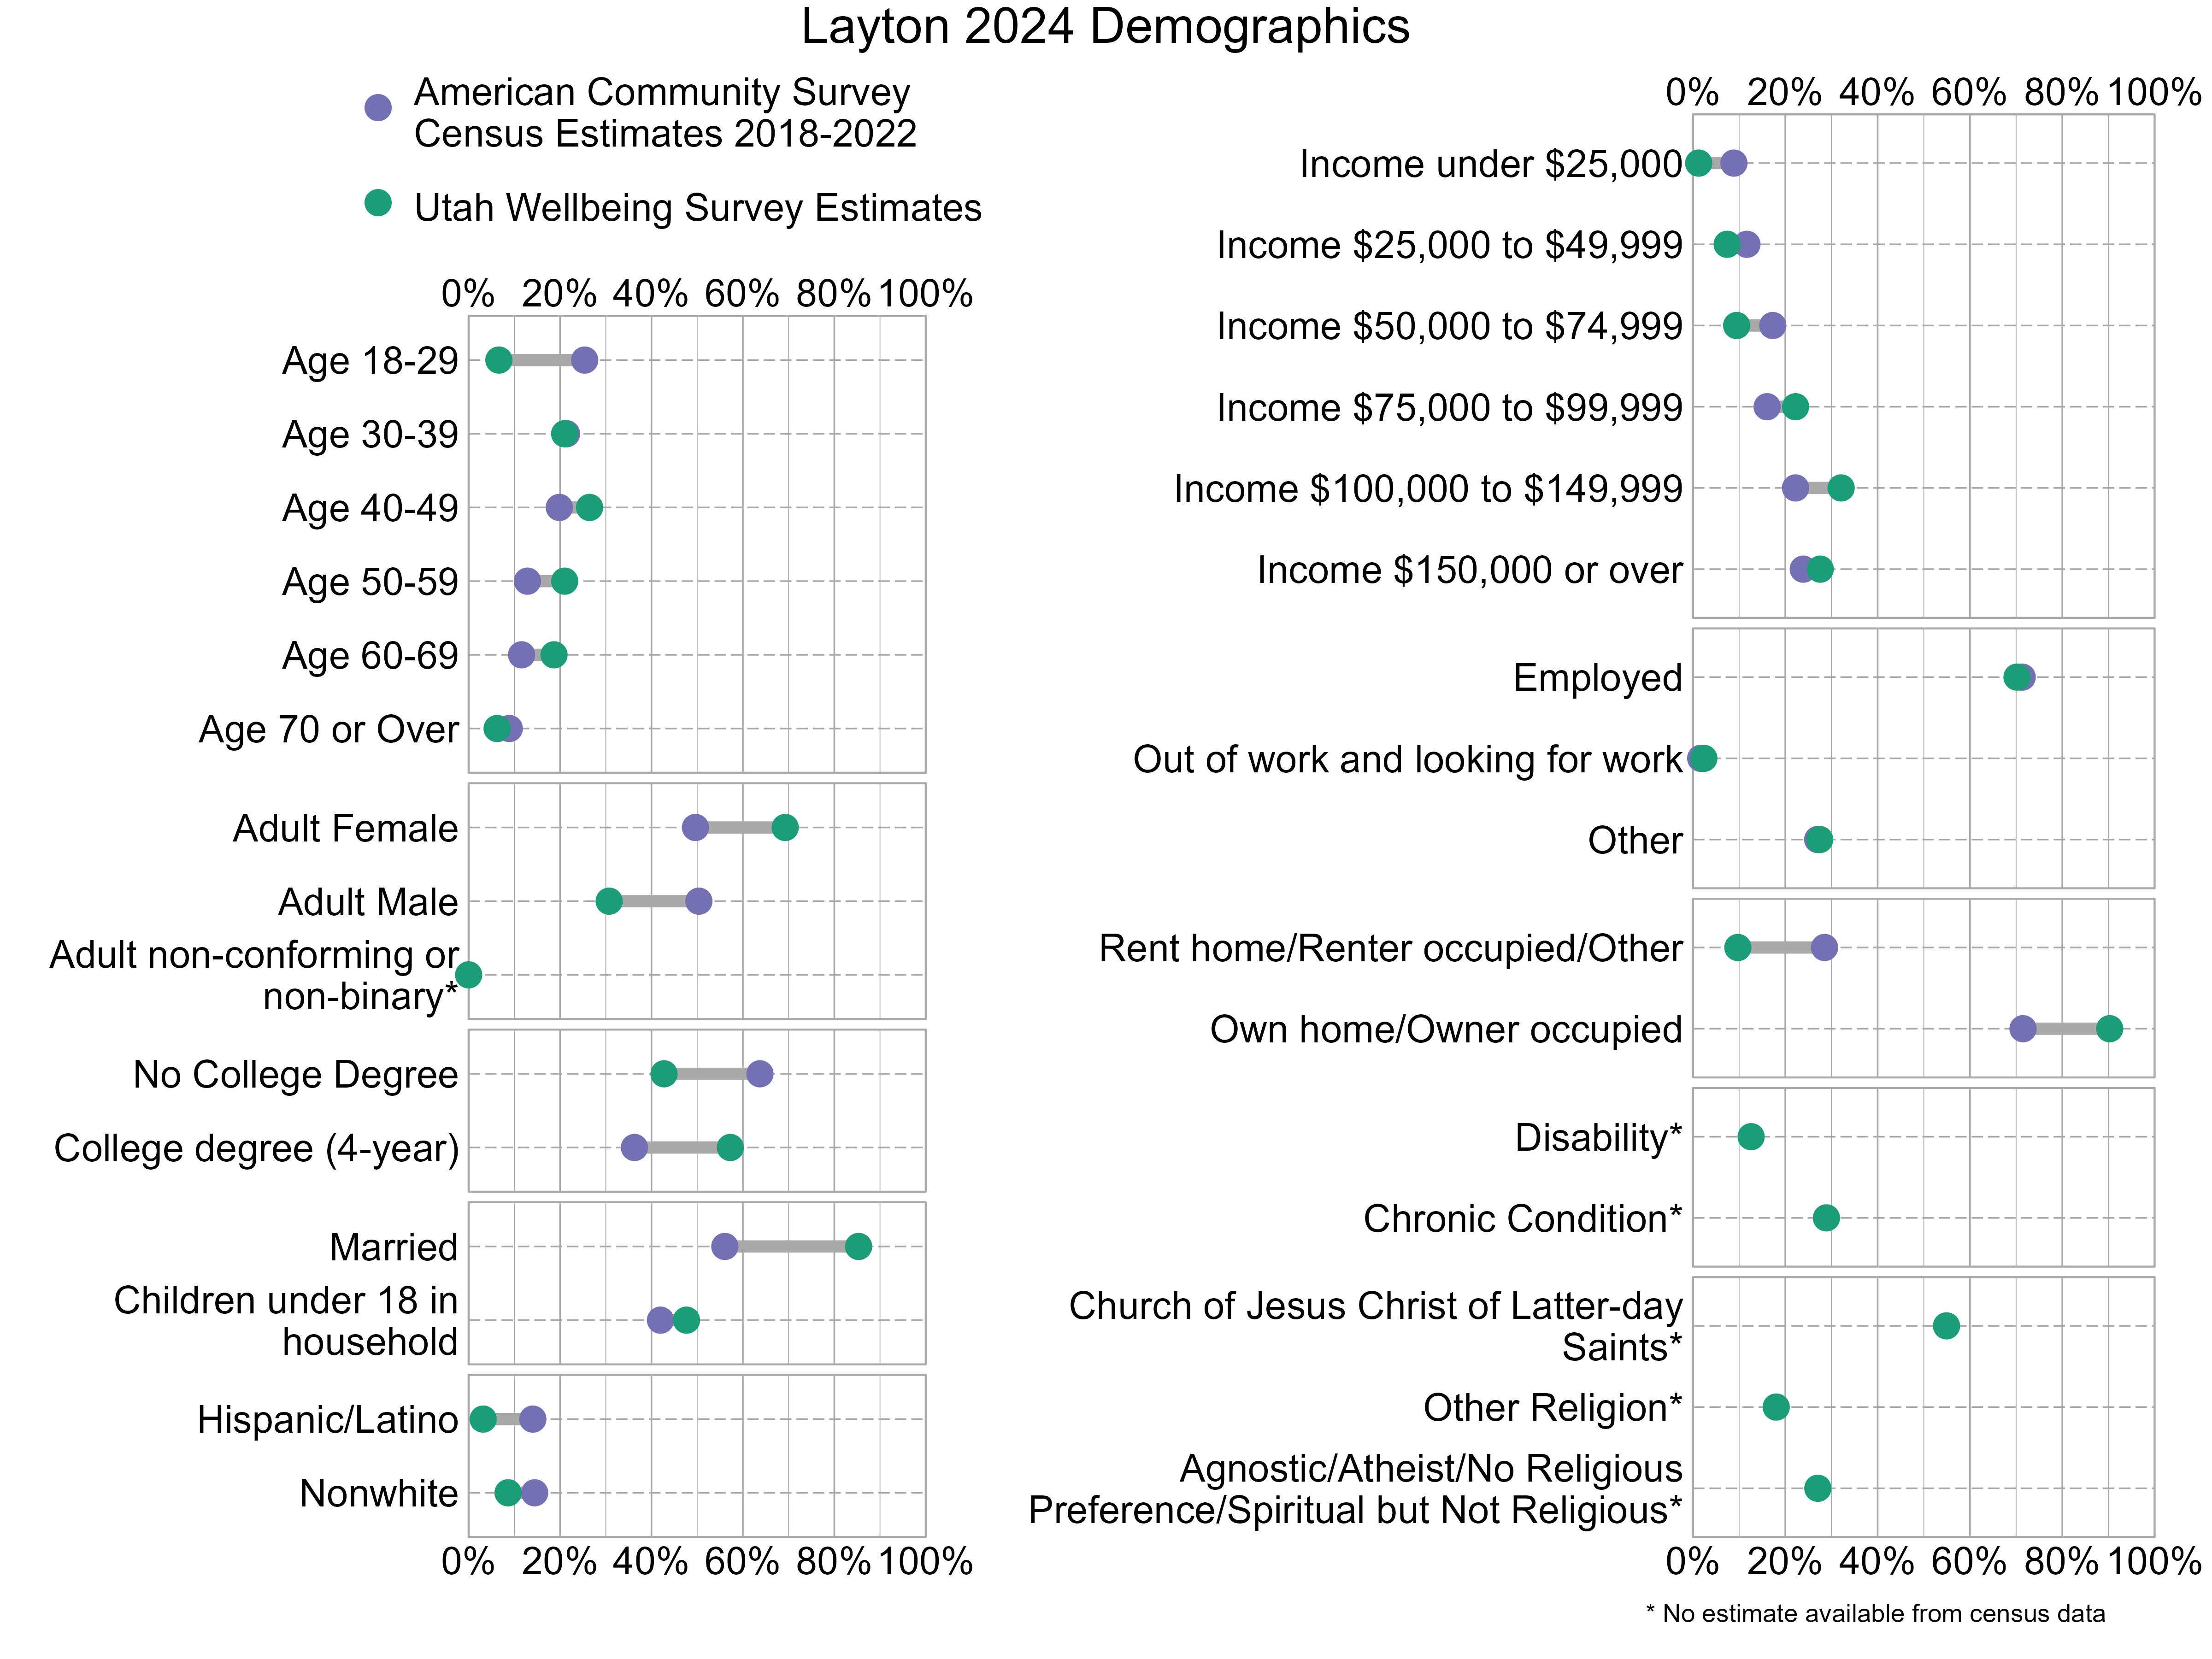
Demographic characteristics of the survey respondents were compared below with U.S. Census information from the 2018-2022 American Community Survey. In the graph below, gray bars indicate differences between the American Community Survey estimates and the Utah Wellbeing Project surveys. The wider the gray bars, the larger the differences. Also note that estimates for religious affiliation, adult non-conforming or non-binary gender, disability, and chronic conditions are unavailable from the census data. There can also be a variable margin of error in the American Community Survey estimates, and caution should be used when comparing estimates. Not all respondents provided demographic information. As the graph shows, 2024 survey respondents were not fully representative of Layton. People who are adult females, have at least a 4-year college degree, are married, and own their homes were overrepresented while those who are age 18-29, are adult males, do not have a college degree, and are renters were underrepresented.
Overall Personal Wellbeing and Overall Wellbeing in Layton
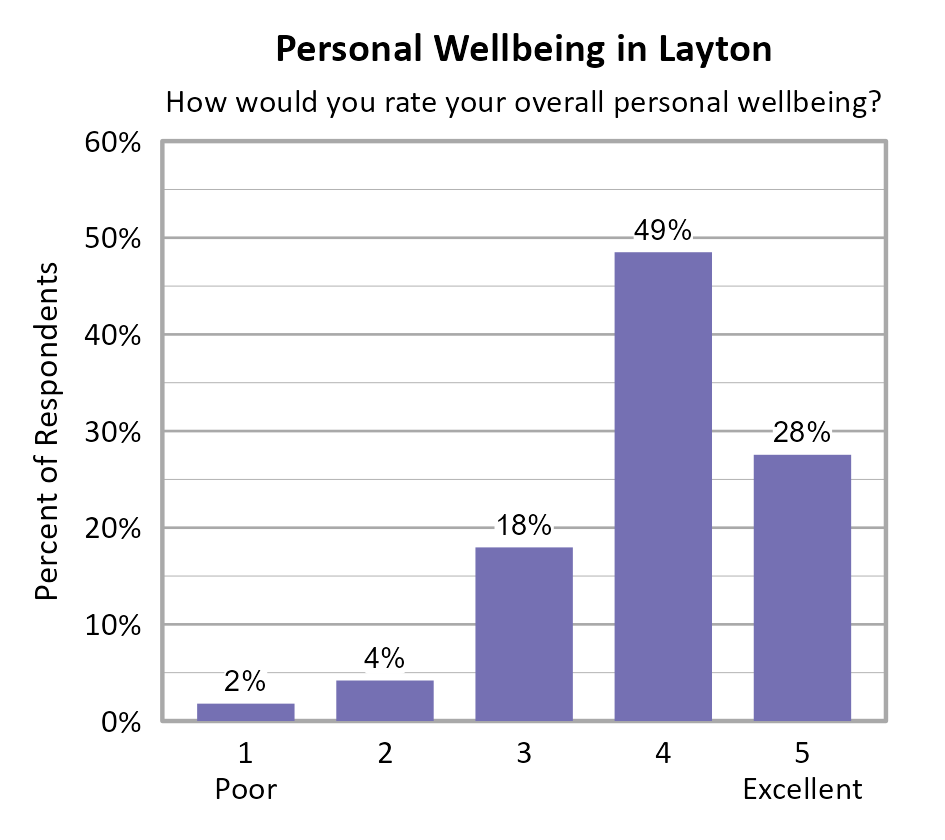
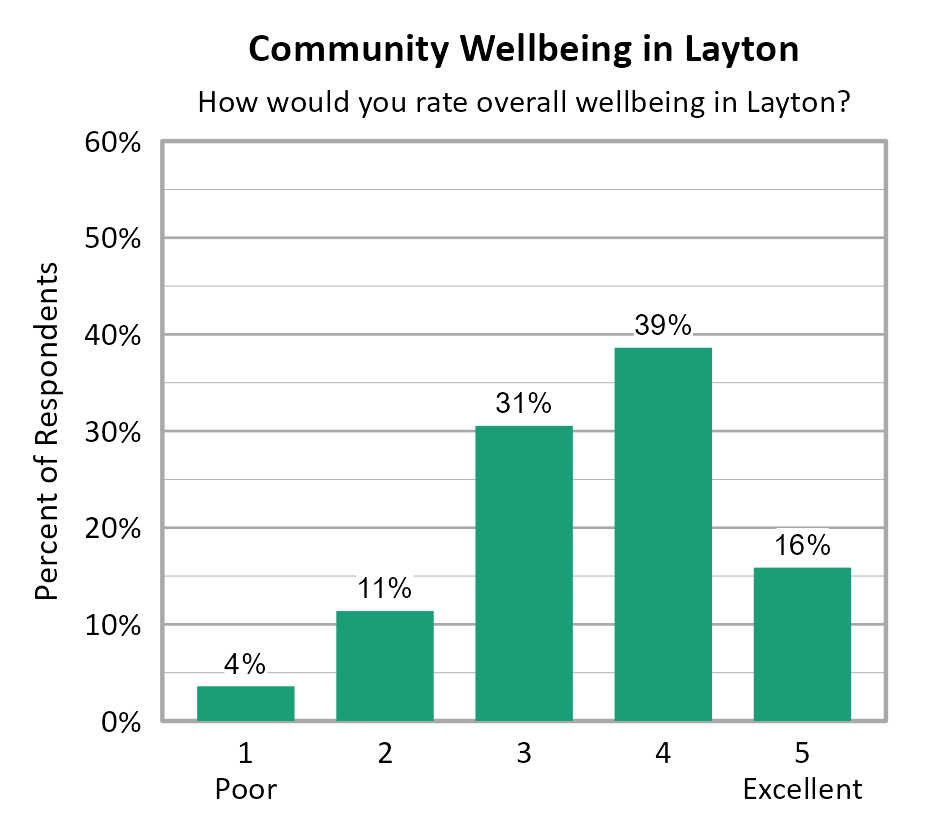
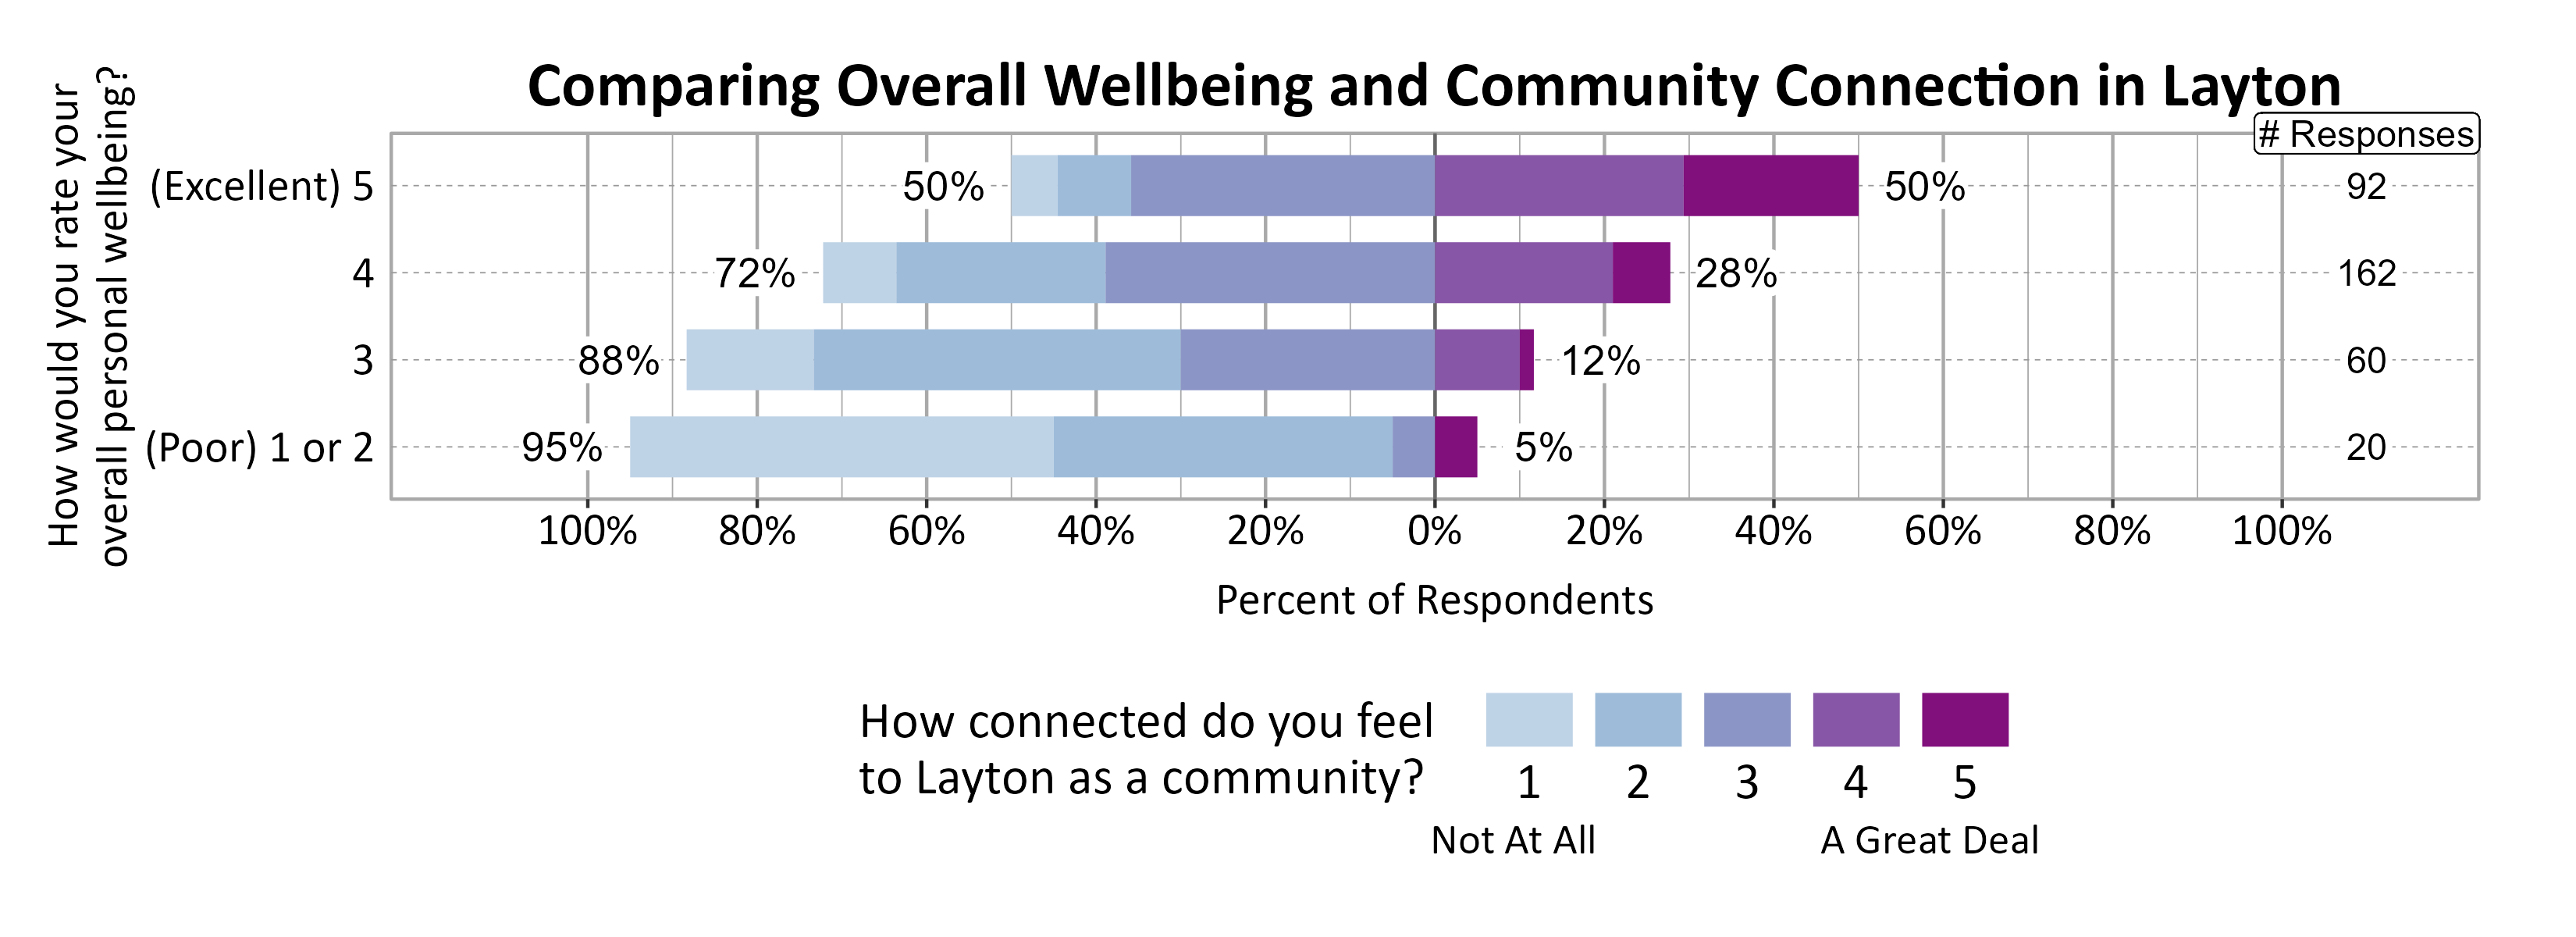
Survey participants were asked about their overall personal wellbeing and overall community wellbeing in Layton. These wellbeing indicators were both measured on a 5-point scale from poor (1) to excellent (5). The average personal wellbeing score in Layton was 3.96 with 76% of respondents indicating their wellbeing at a 4 or 5 on the 5-point scale. The average score for community wellbeing in Layton was 3.52 with 54% of respondents indicating community wellbeing at a 4 or 5 on the 5-point scale. While ZIP code 84040 had slightly higher personal and community wellbeing scores than ZIP 84041, this was not a statistically significant difference.
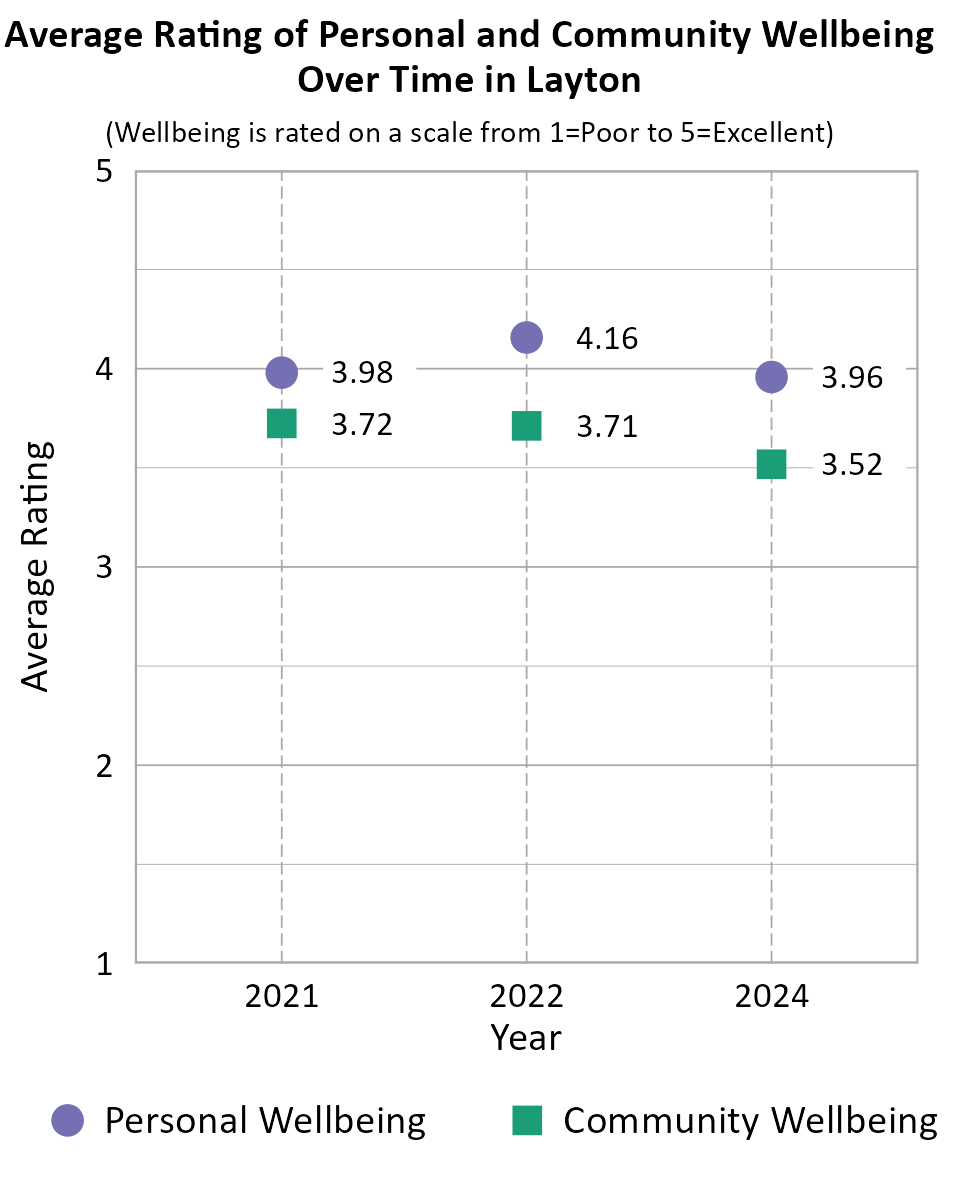
When comparing survey data from Layton over the years as shown in the information below, we can see that the average personal wellbeing score saw a increase in 2022 but 2024 responses returned to an average similar to 2021. The average community wellbeing score remained nearly the same between 2021 and 2022, and declined between 2022 and 2024. Note that the number of respondents differed between years, there is no tracking of individuals from one year to the next, and the low end of the scale was "Poor" in 2024 but "Very Poor" in prior years which may account for differences in scores over time.
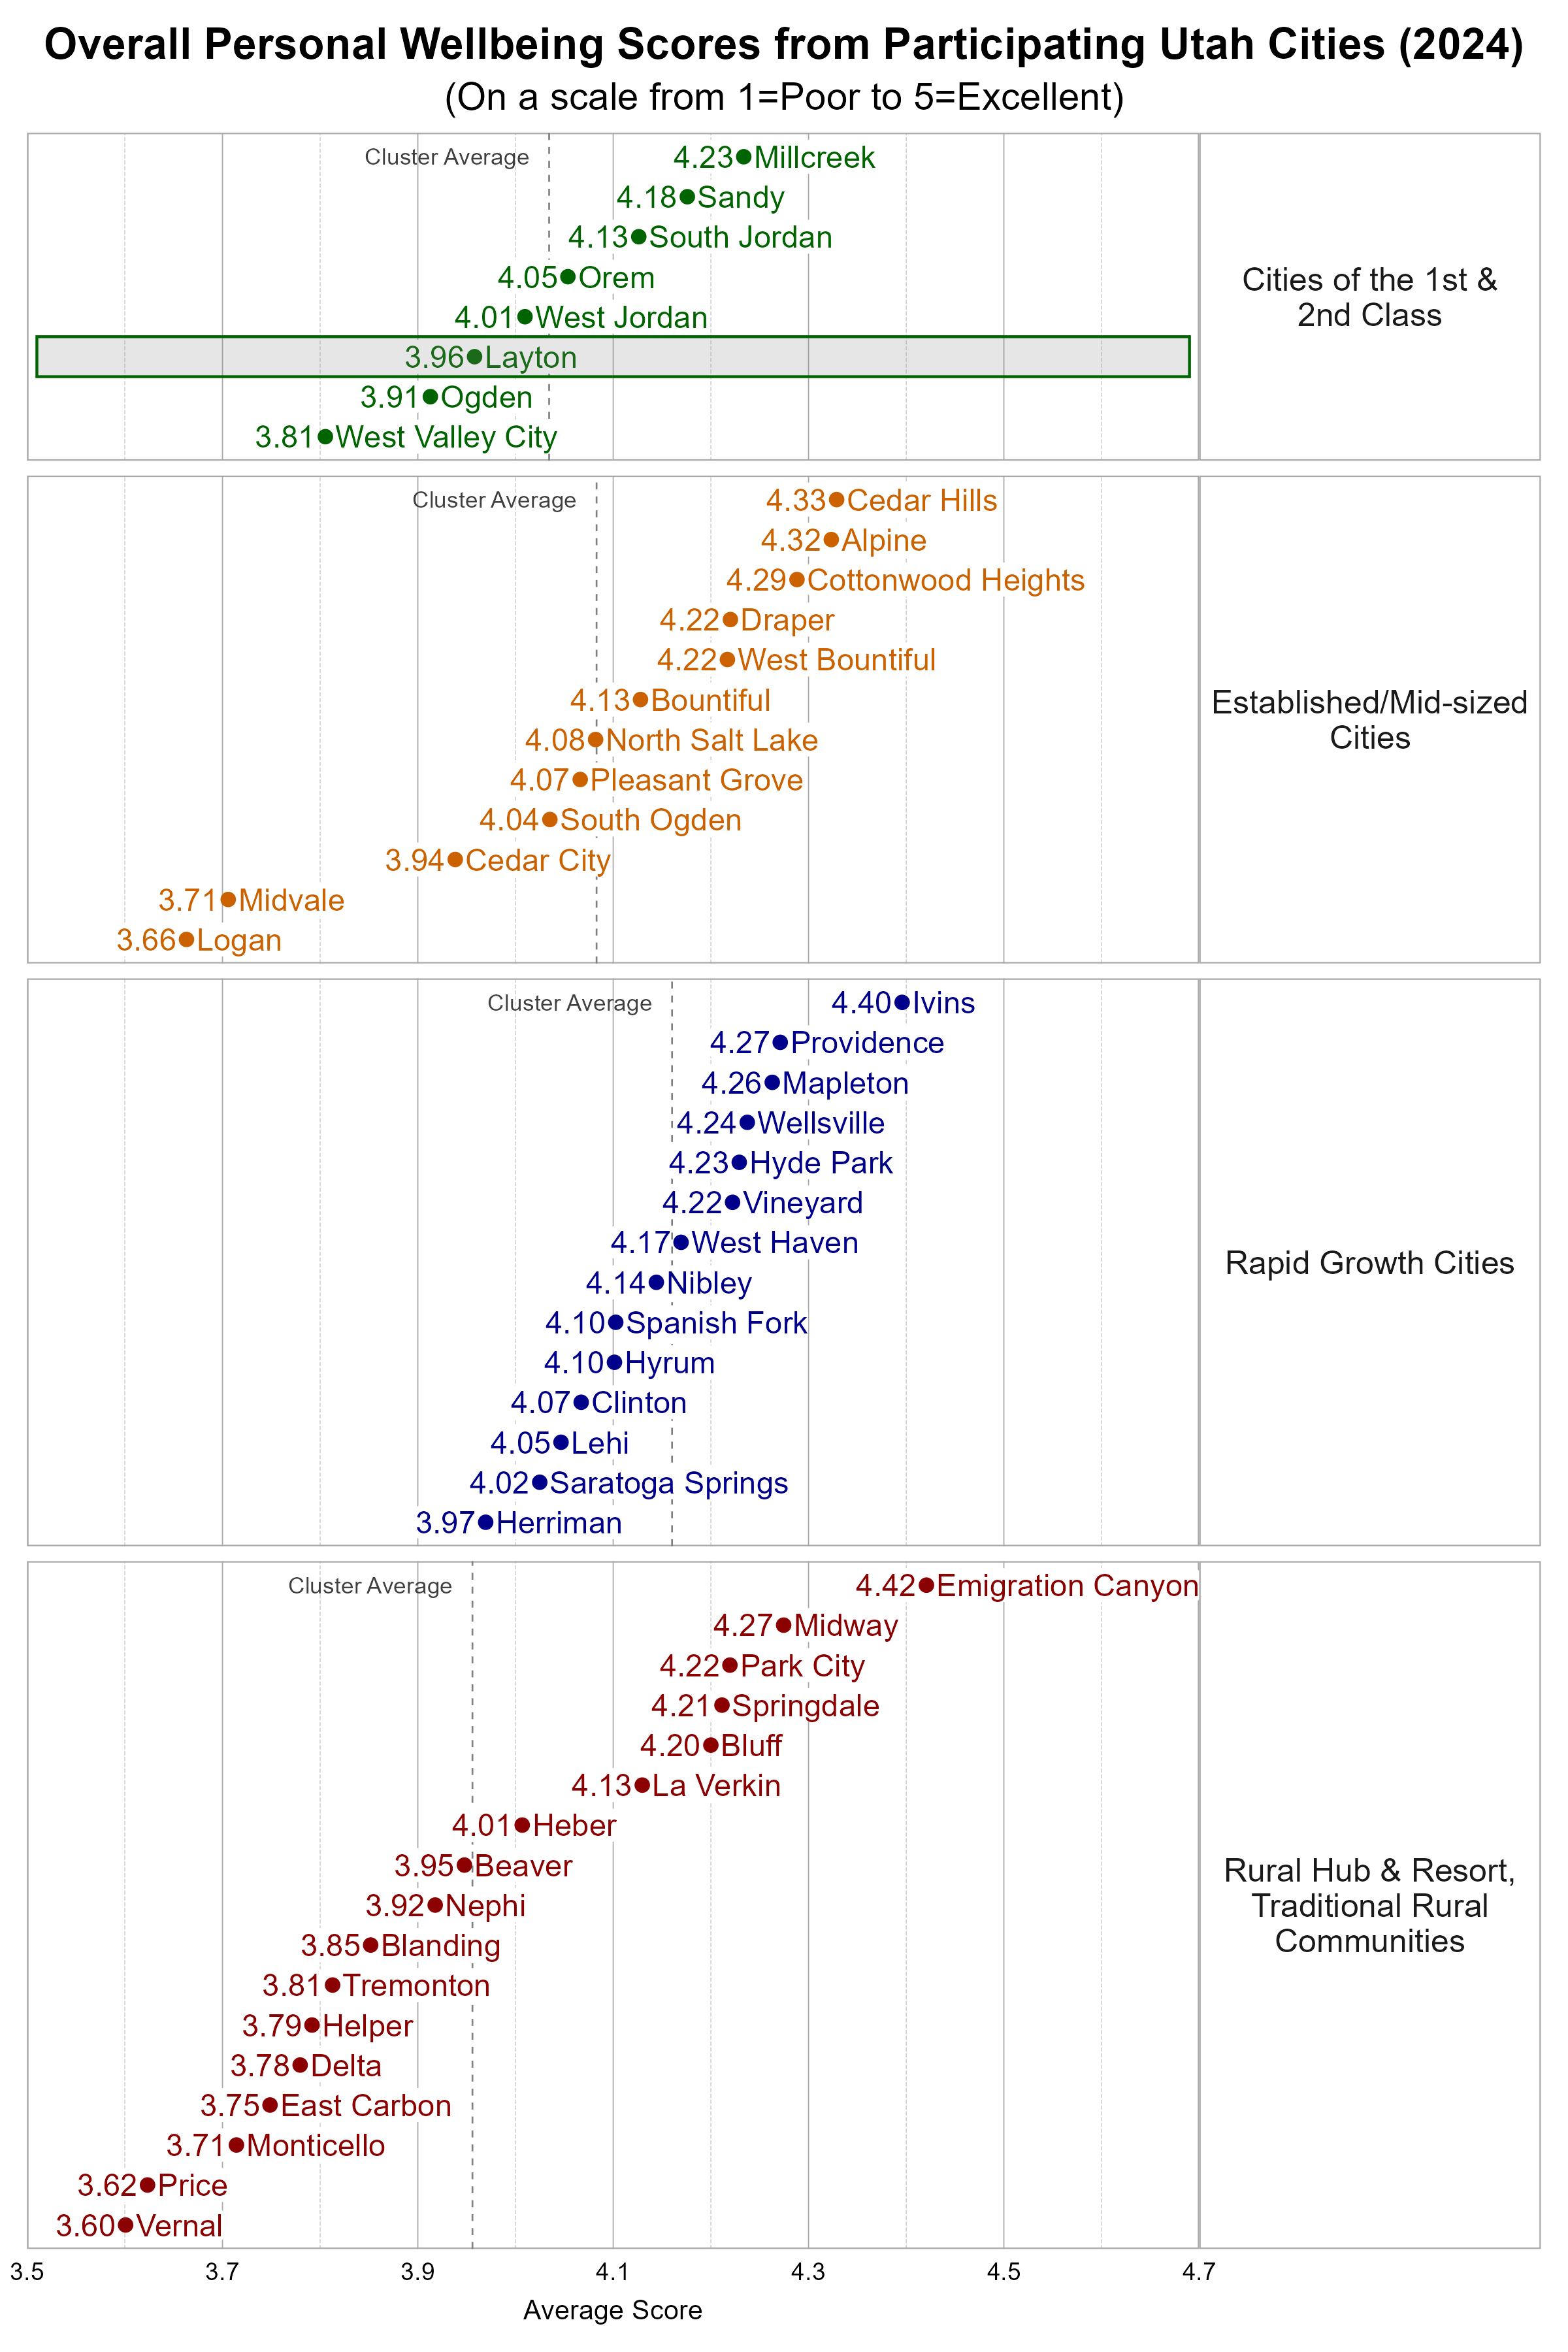
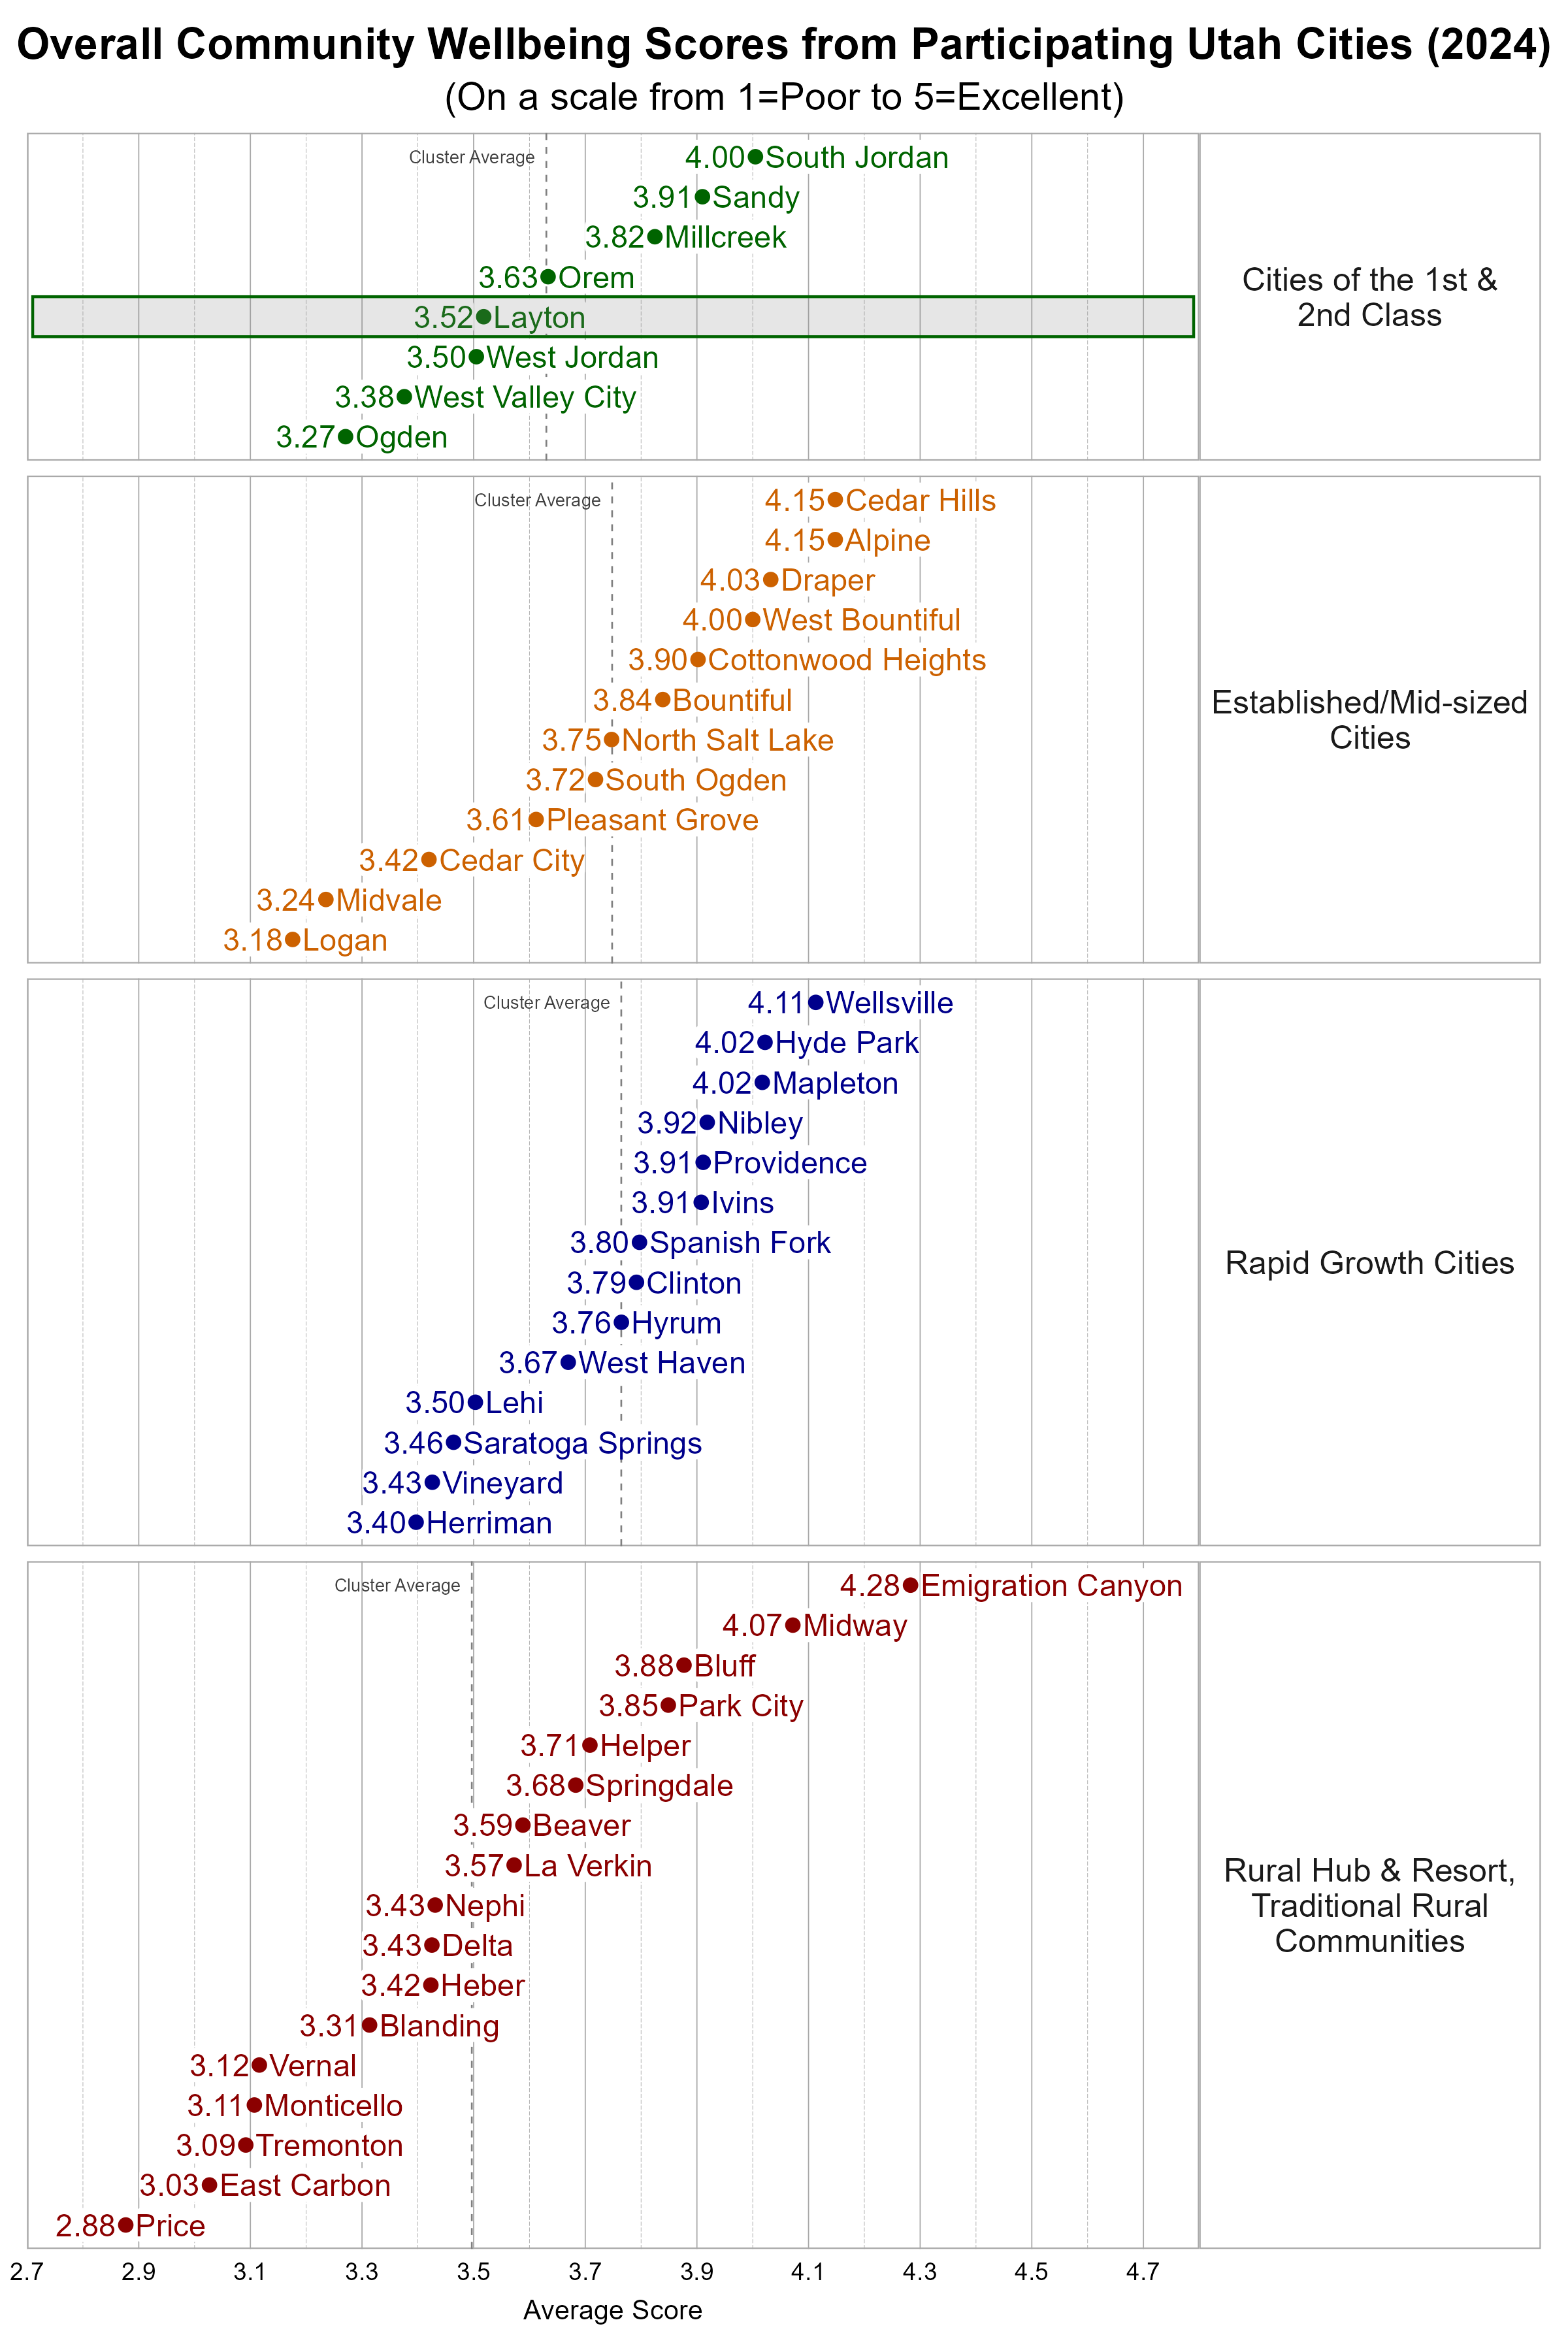
Comparing Wellbeing Across Utah Cities
The Utah League of Cities and Towns clusters cities and towns into five different categories based on size and growth rates. We utilize these clusters in our analysis. Layton is classified as a City of the 1st and 2nd Class. Some cities may fit within more than one cluster.
Within the more Urban city cluster, Layton was below the average overall personal wellbeing score and below the average overall community wellbeing score.
Wellbeing Domains in Layton
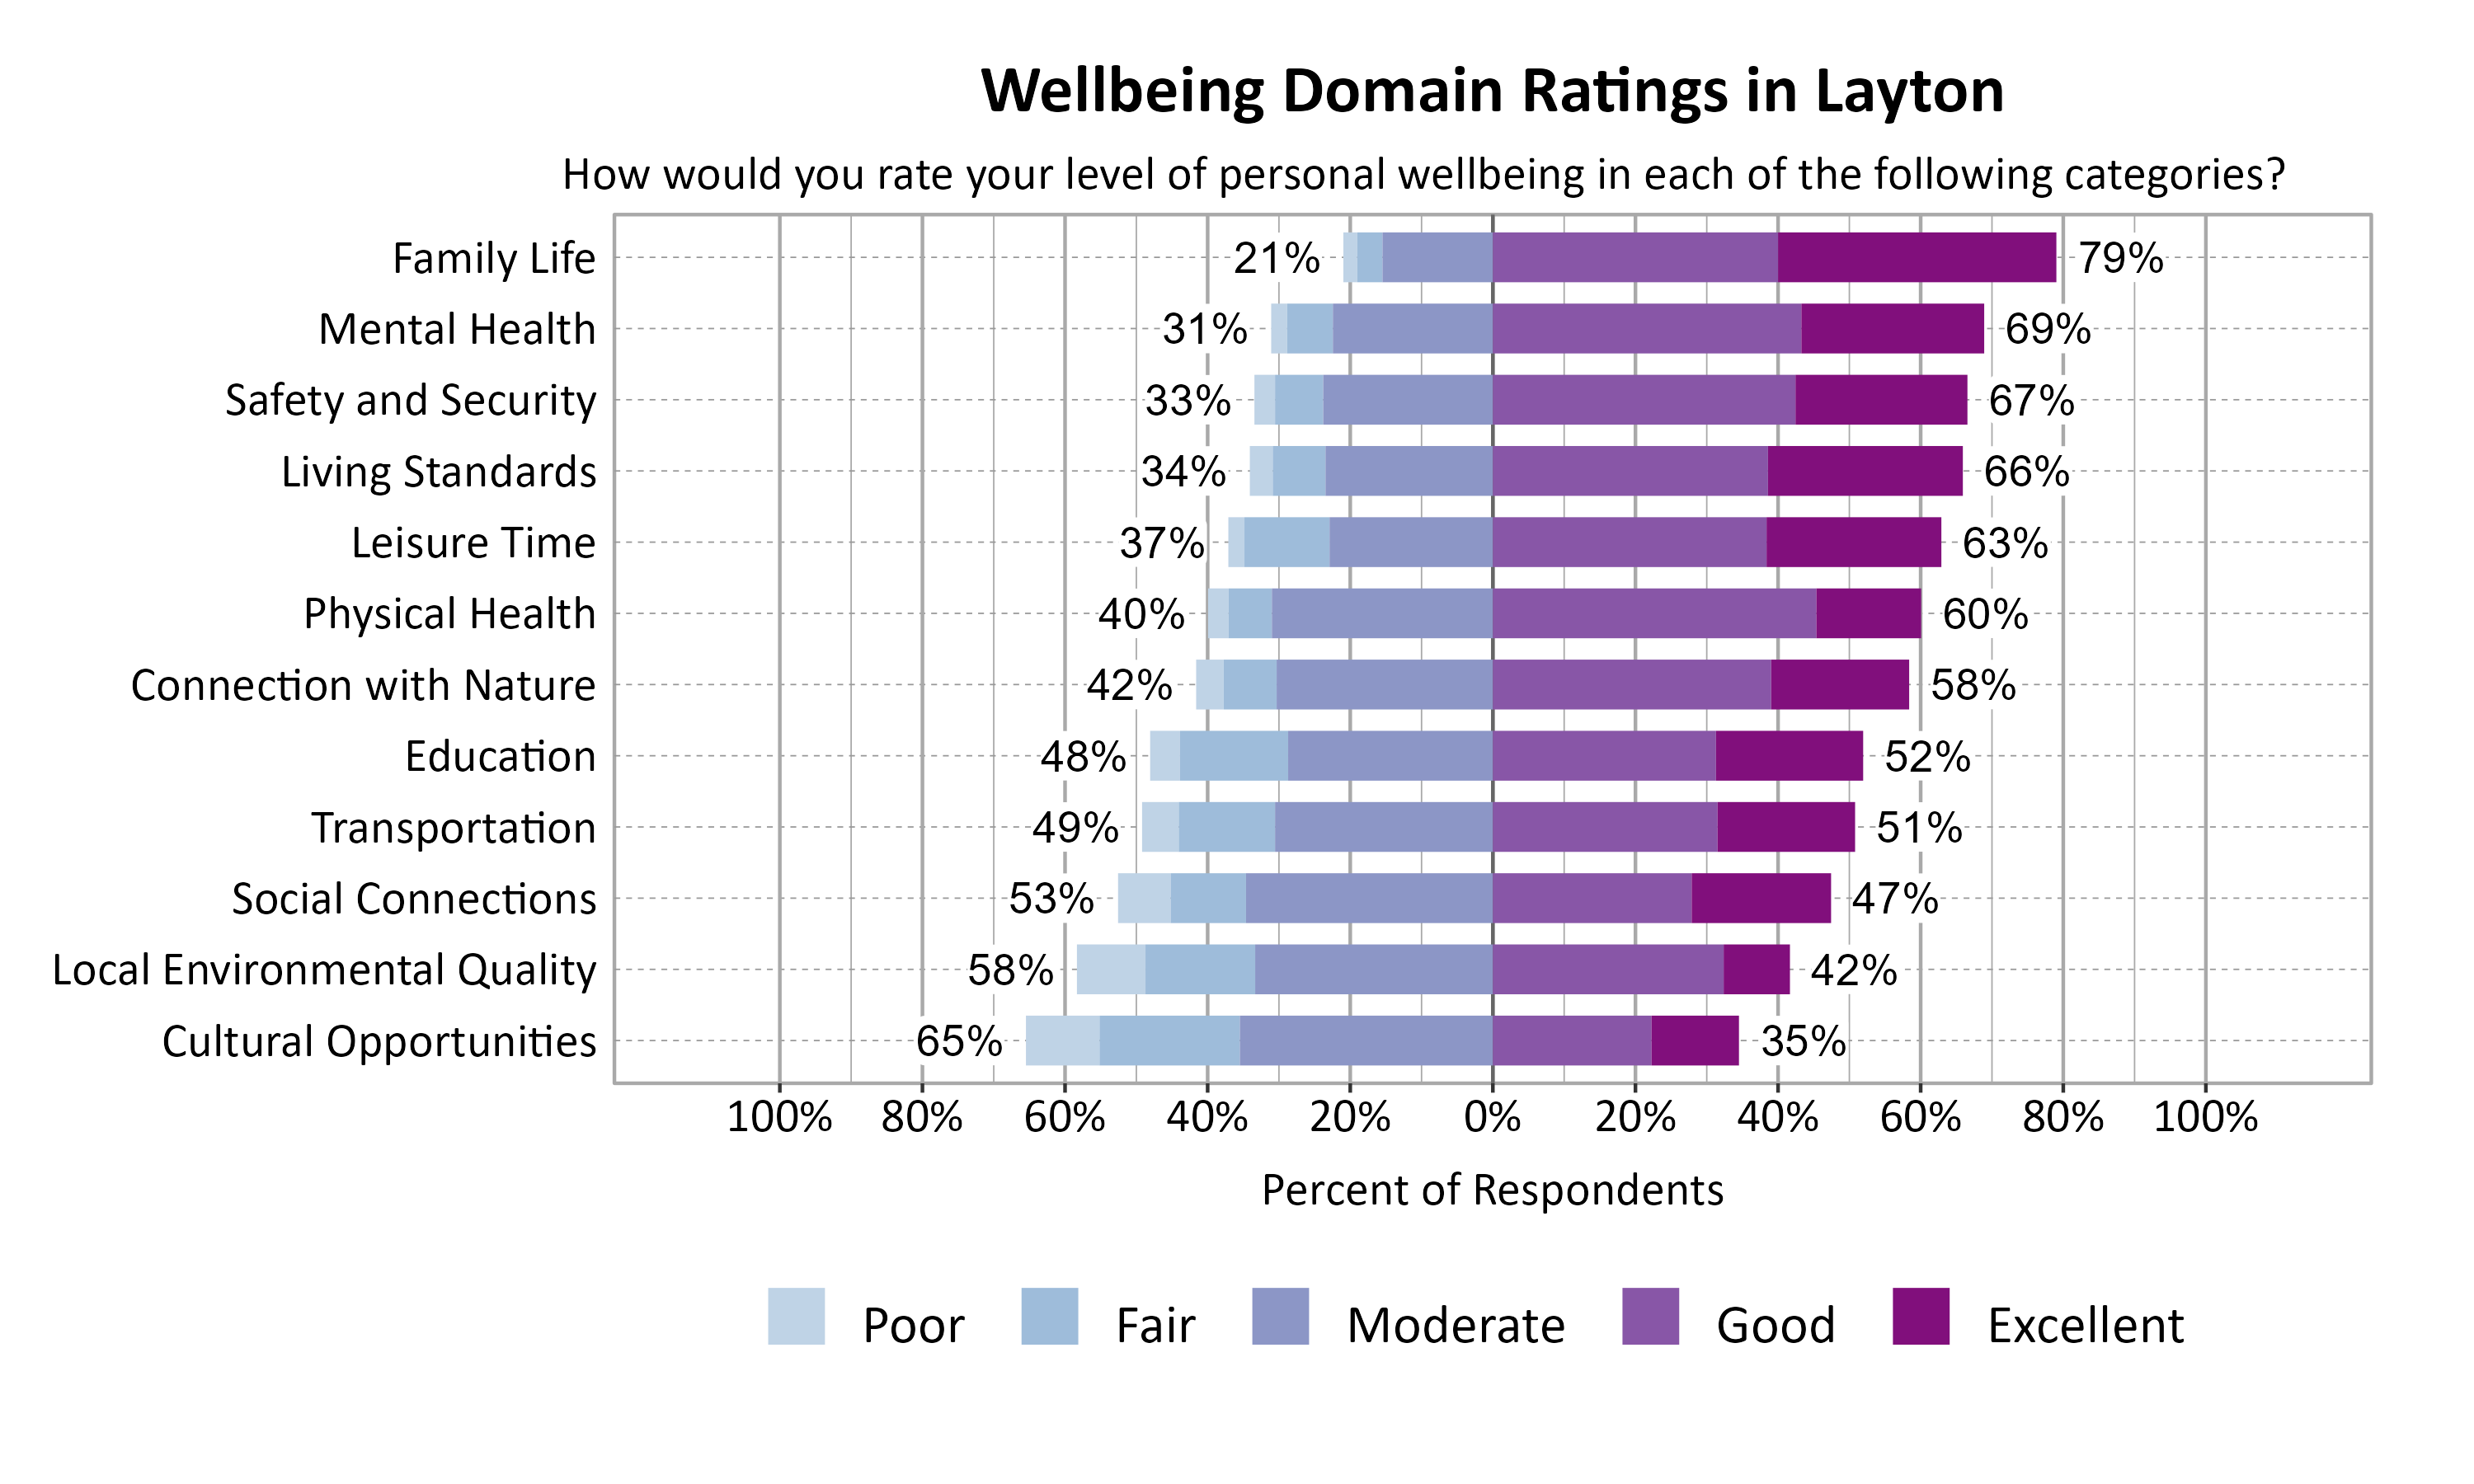
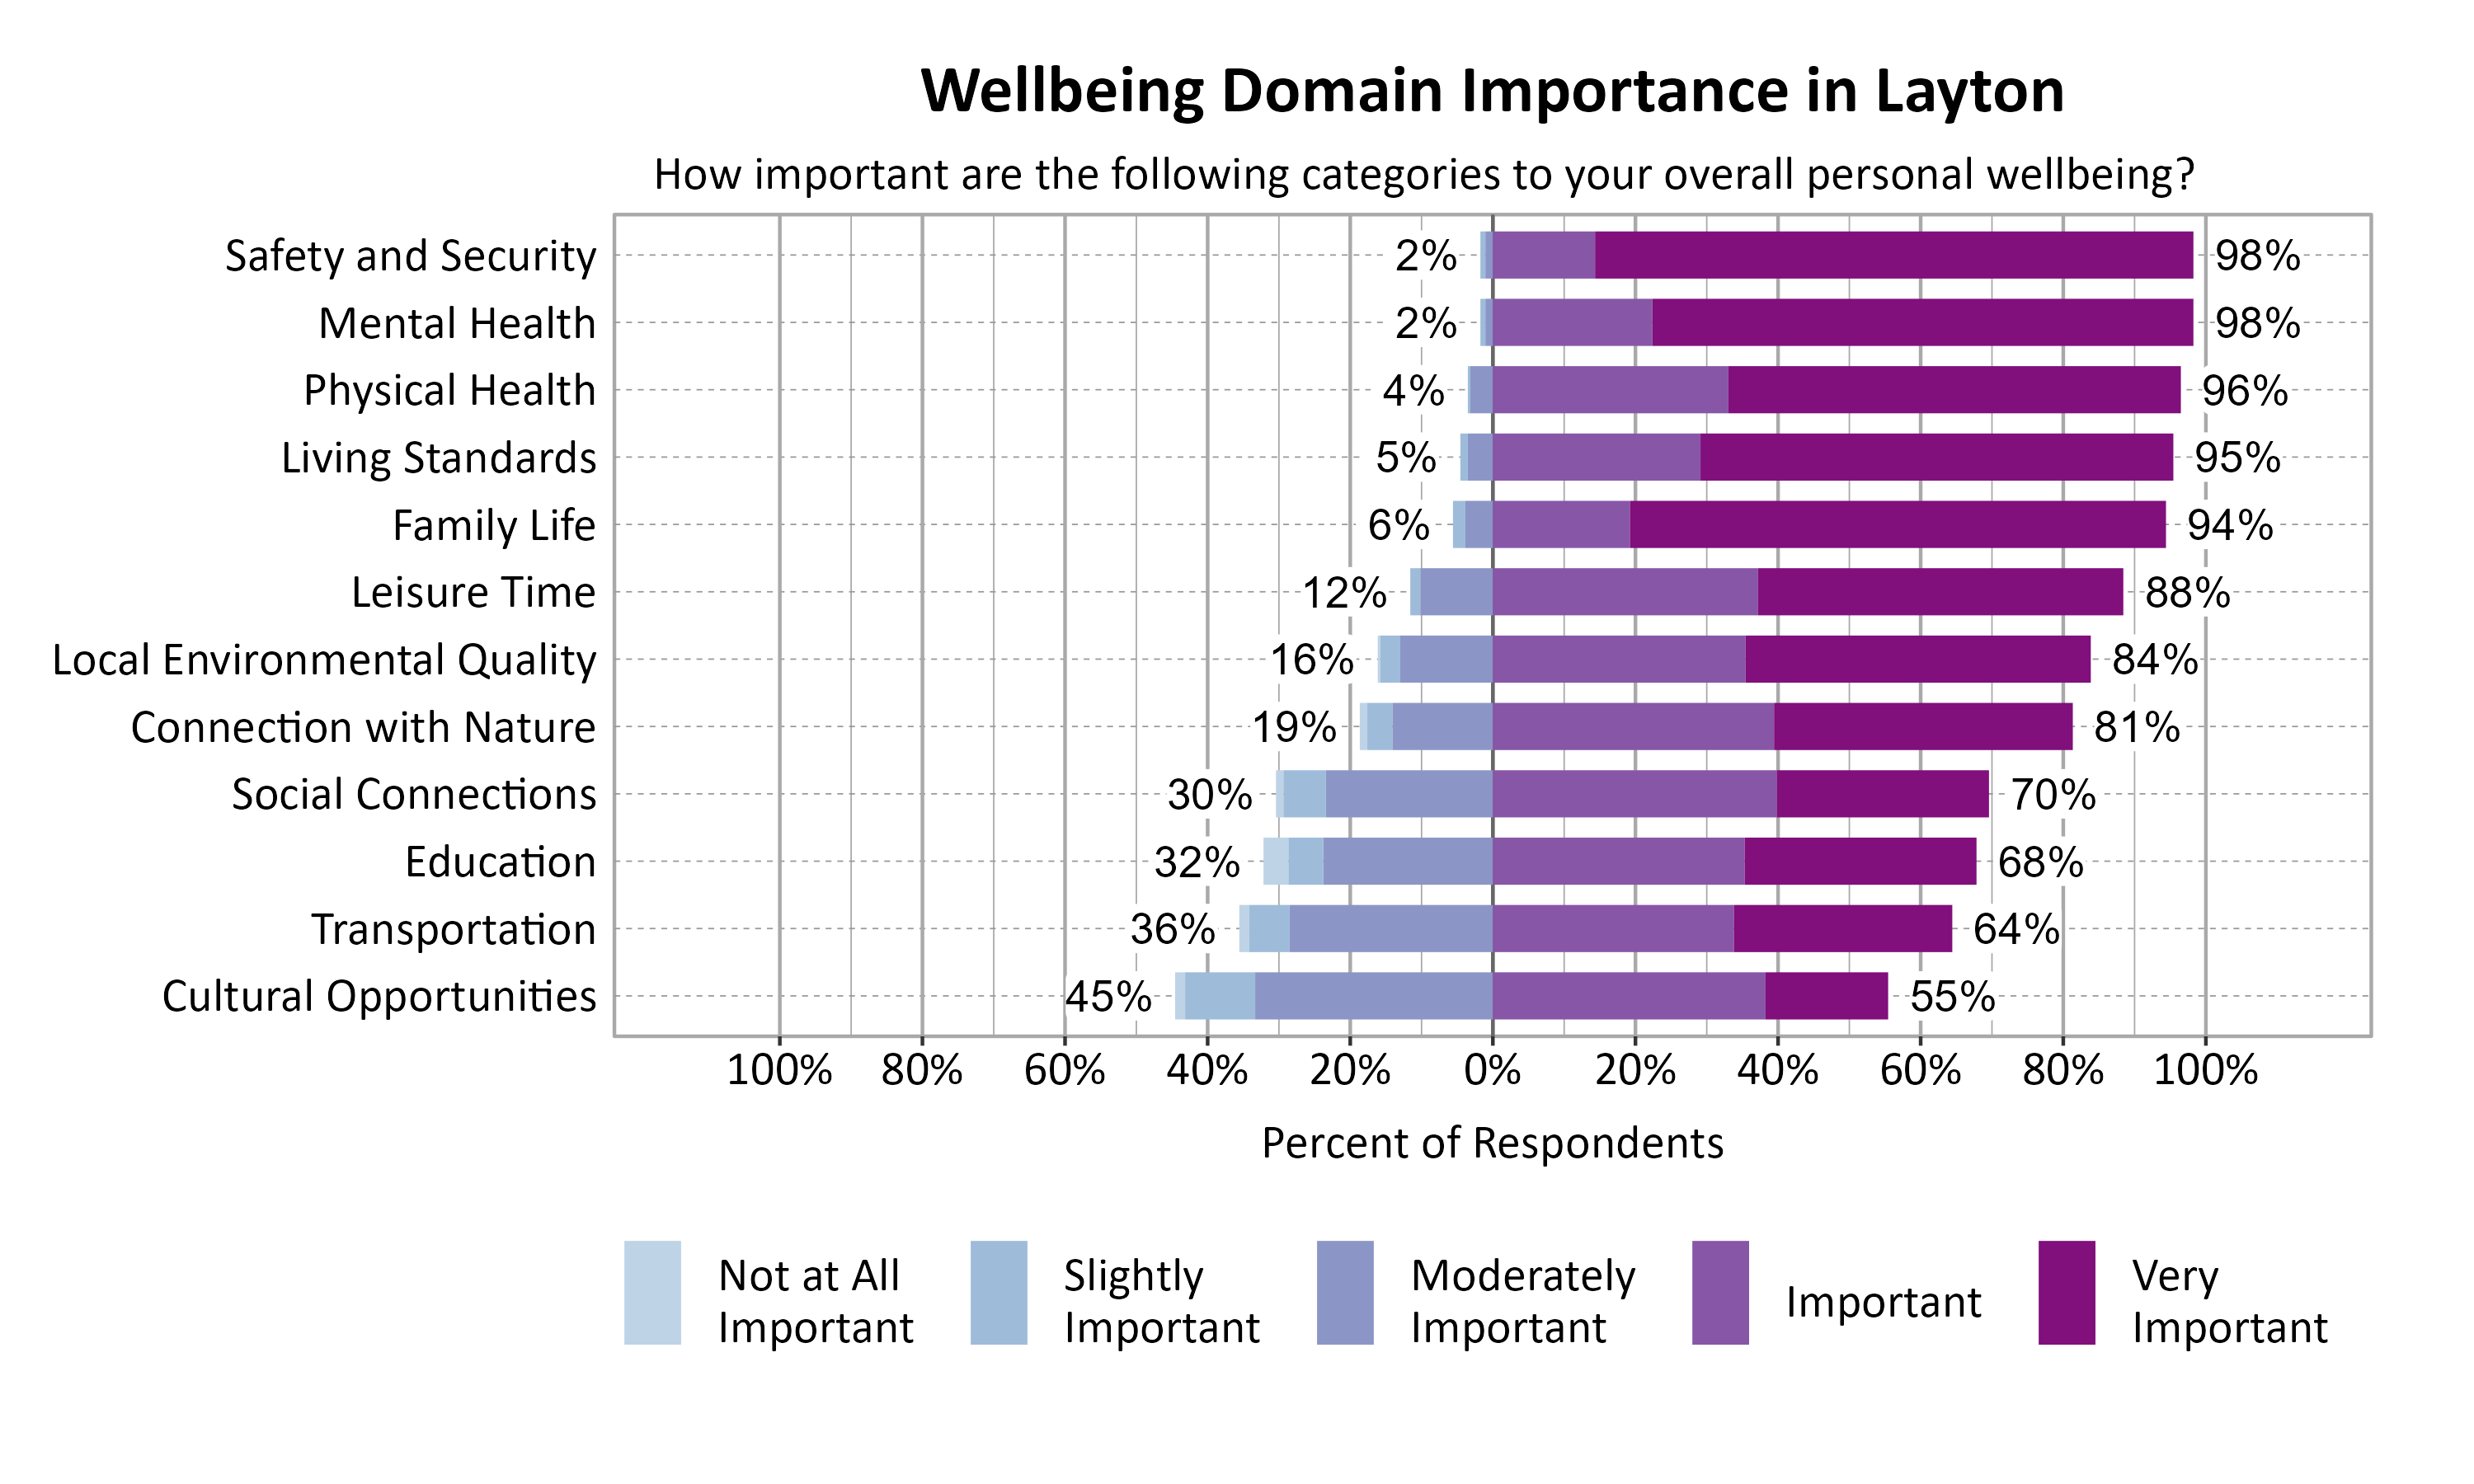
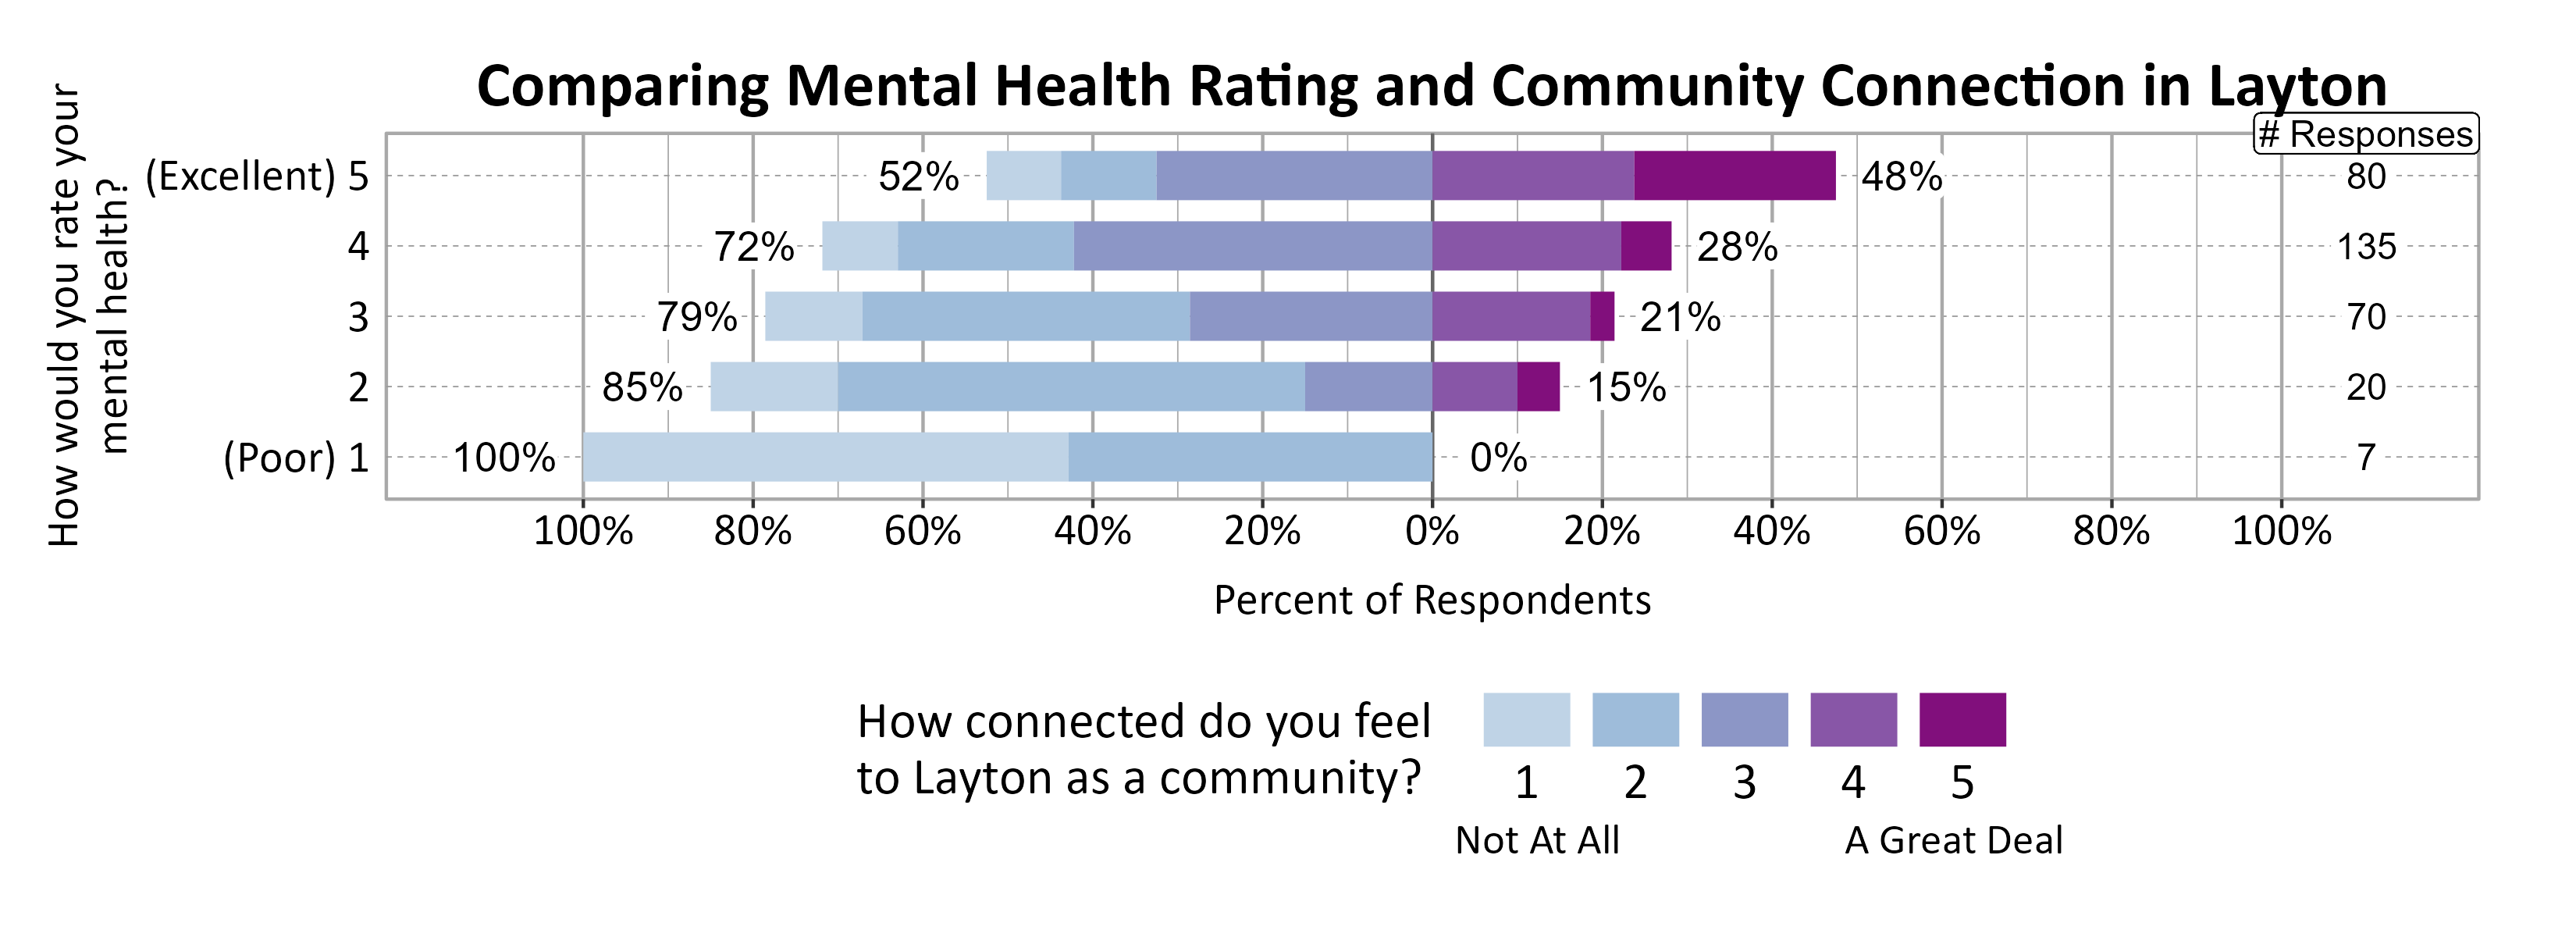
According to national and international entities that track wellbeing, there are a number of common dimensions or domains of wellbeing. Survey respondents rated twelve domains on a 5-point scale from poor to excellent. They were also asked to indicate the importance of each domain to their overall personal wellbeing on a 5-point scale from not at all important to very important. The highest rated wellbeing domains for respondents in Layton were Family Life (79%), Mental Health (69%), Safety and Security (67%), and Living Standards (66%). The most important wellbeing domains were Mental Health (98%), Safety and Security (98%), Physical Health (96%), and Living Standards (95%).
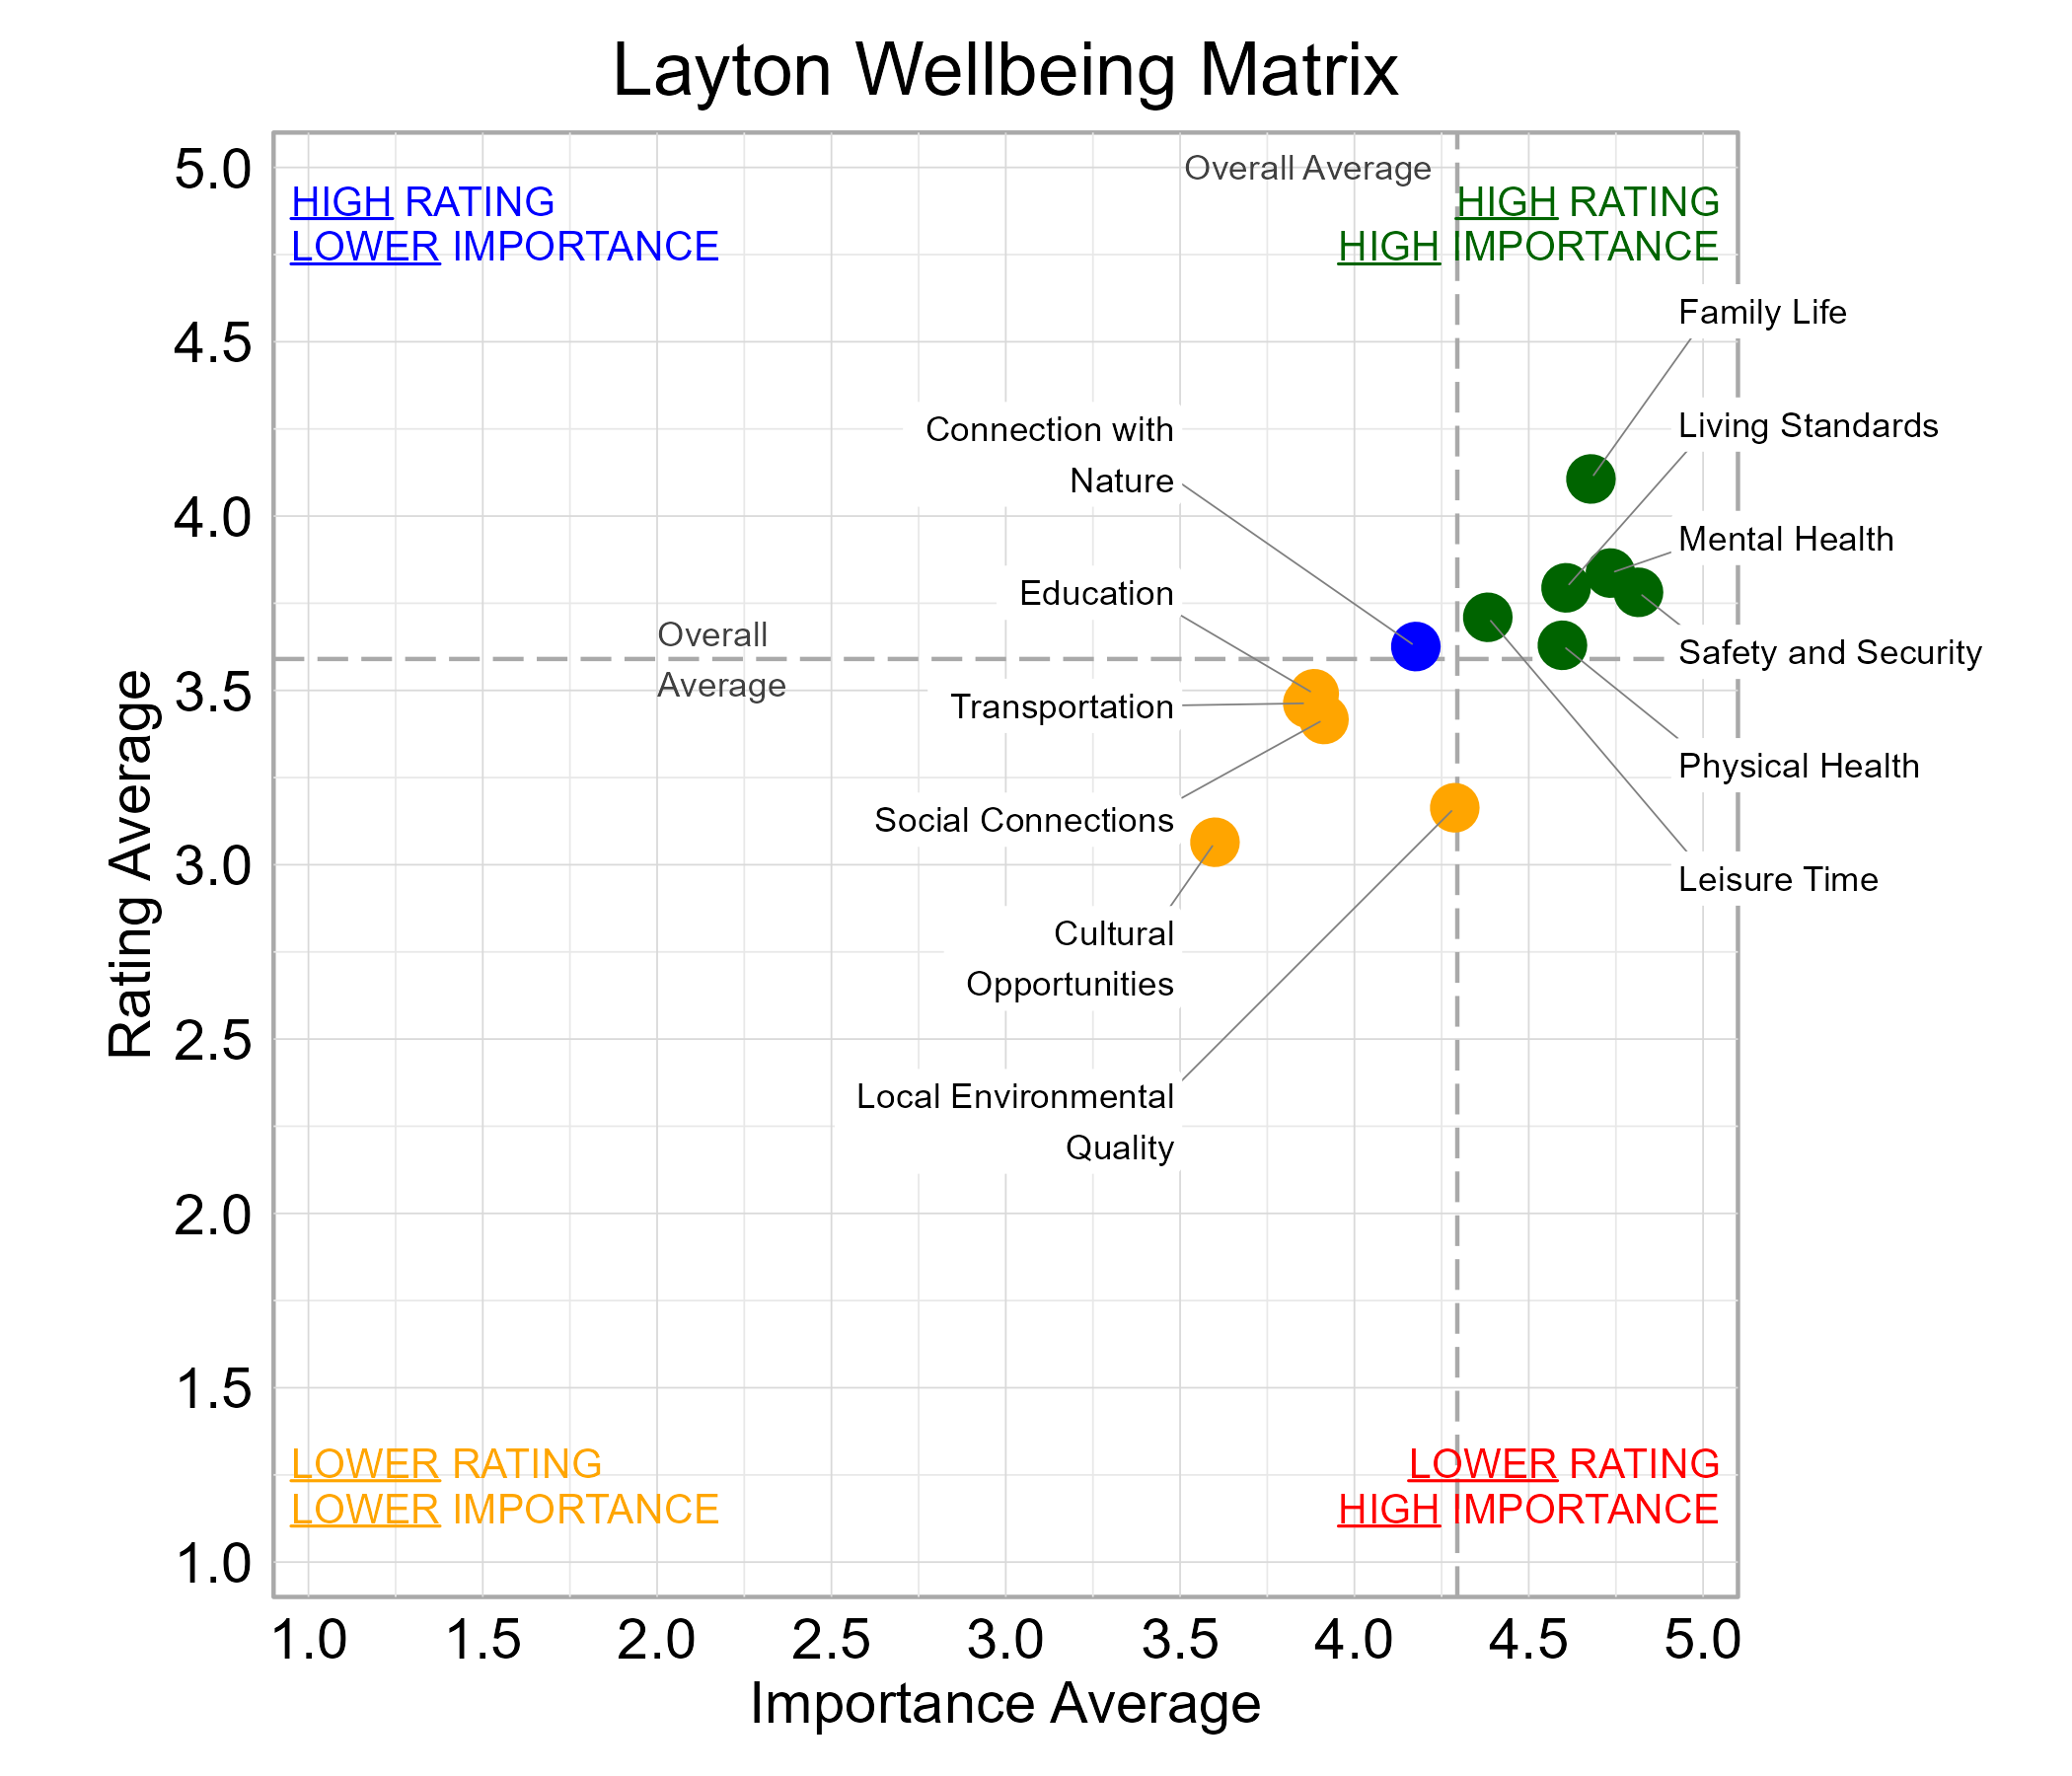
Wellbeing Matrix for Layton
The graph below illustrates the relationship between the average rating and the average importance of wellbeing domains for survey respondents from Layton. Family Life, Leisure Time, Living Standards, Mental Health, Physical Health, and Safety and Security were highly important and rated above average among the domains. No Domains fell in the “red zone” of higher importance and lower ratings.
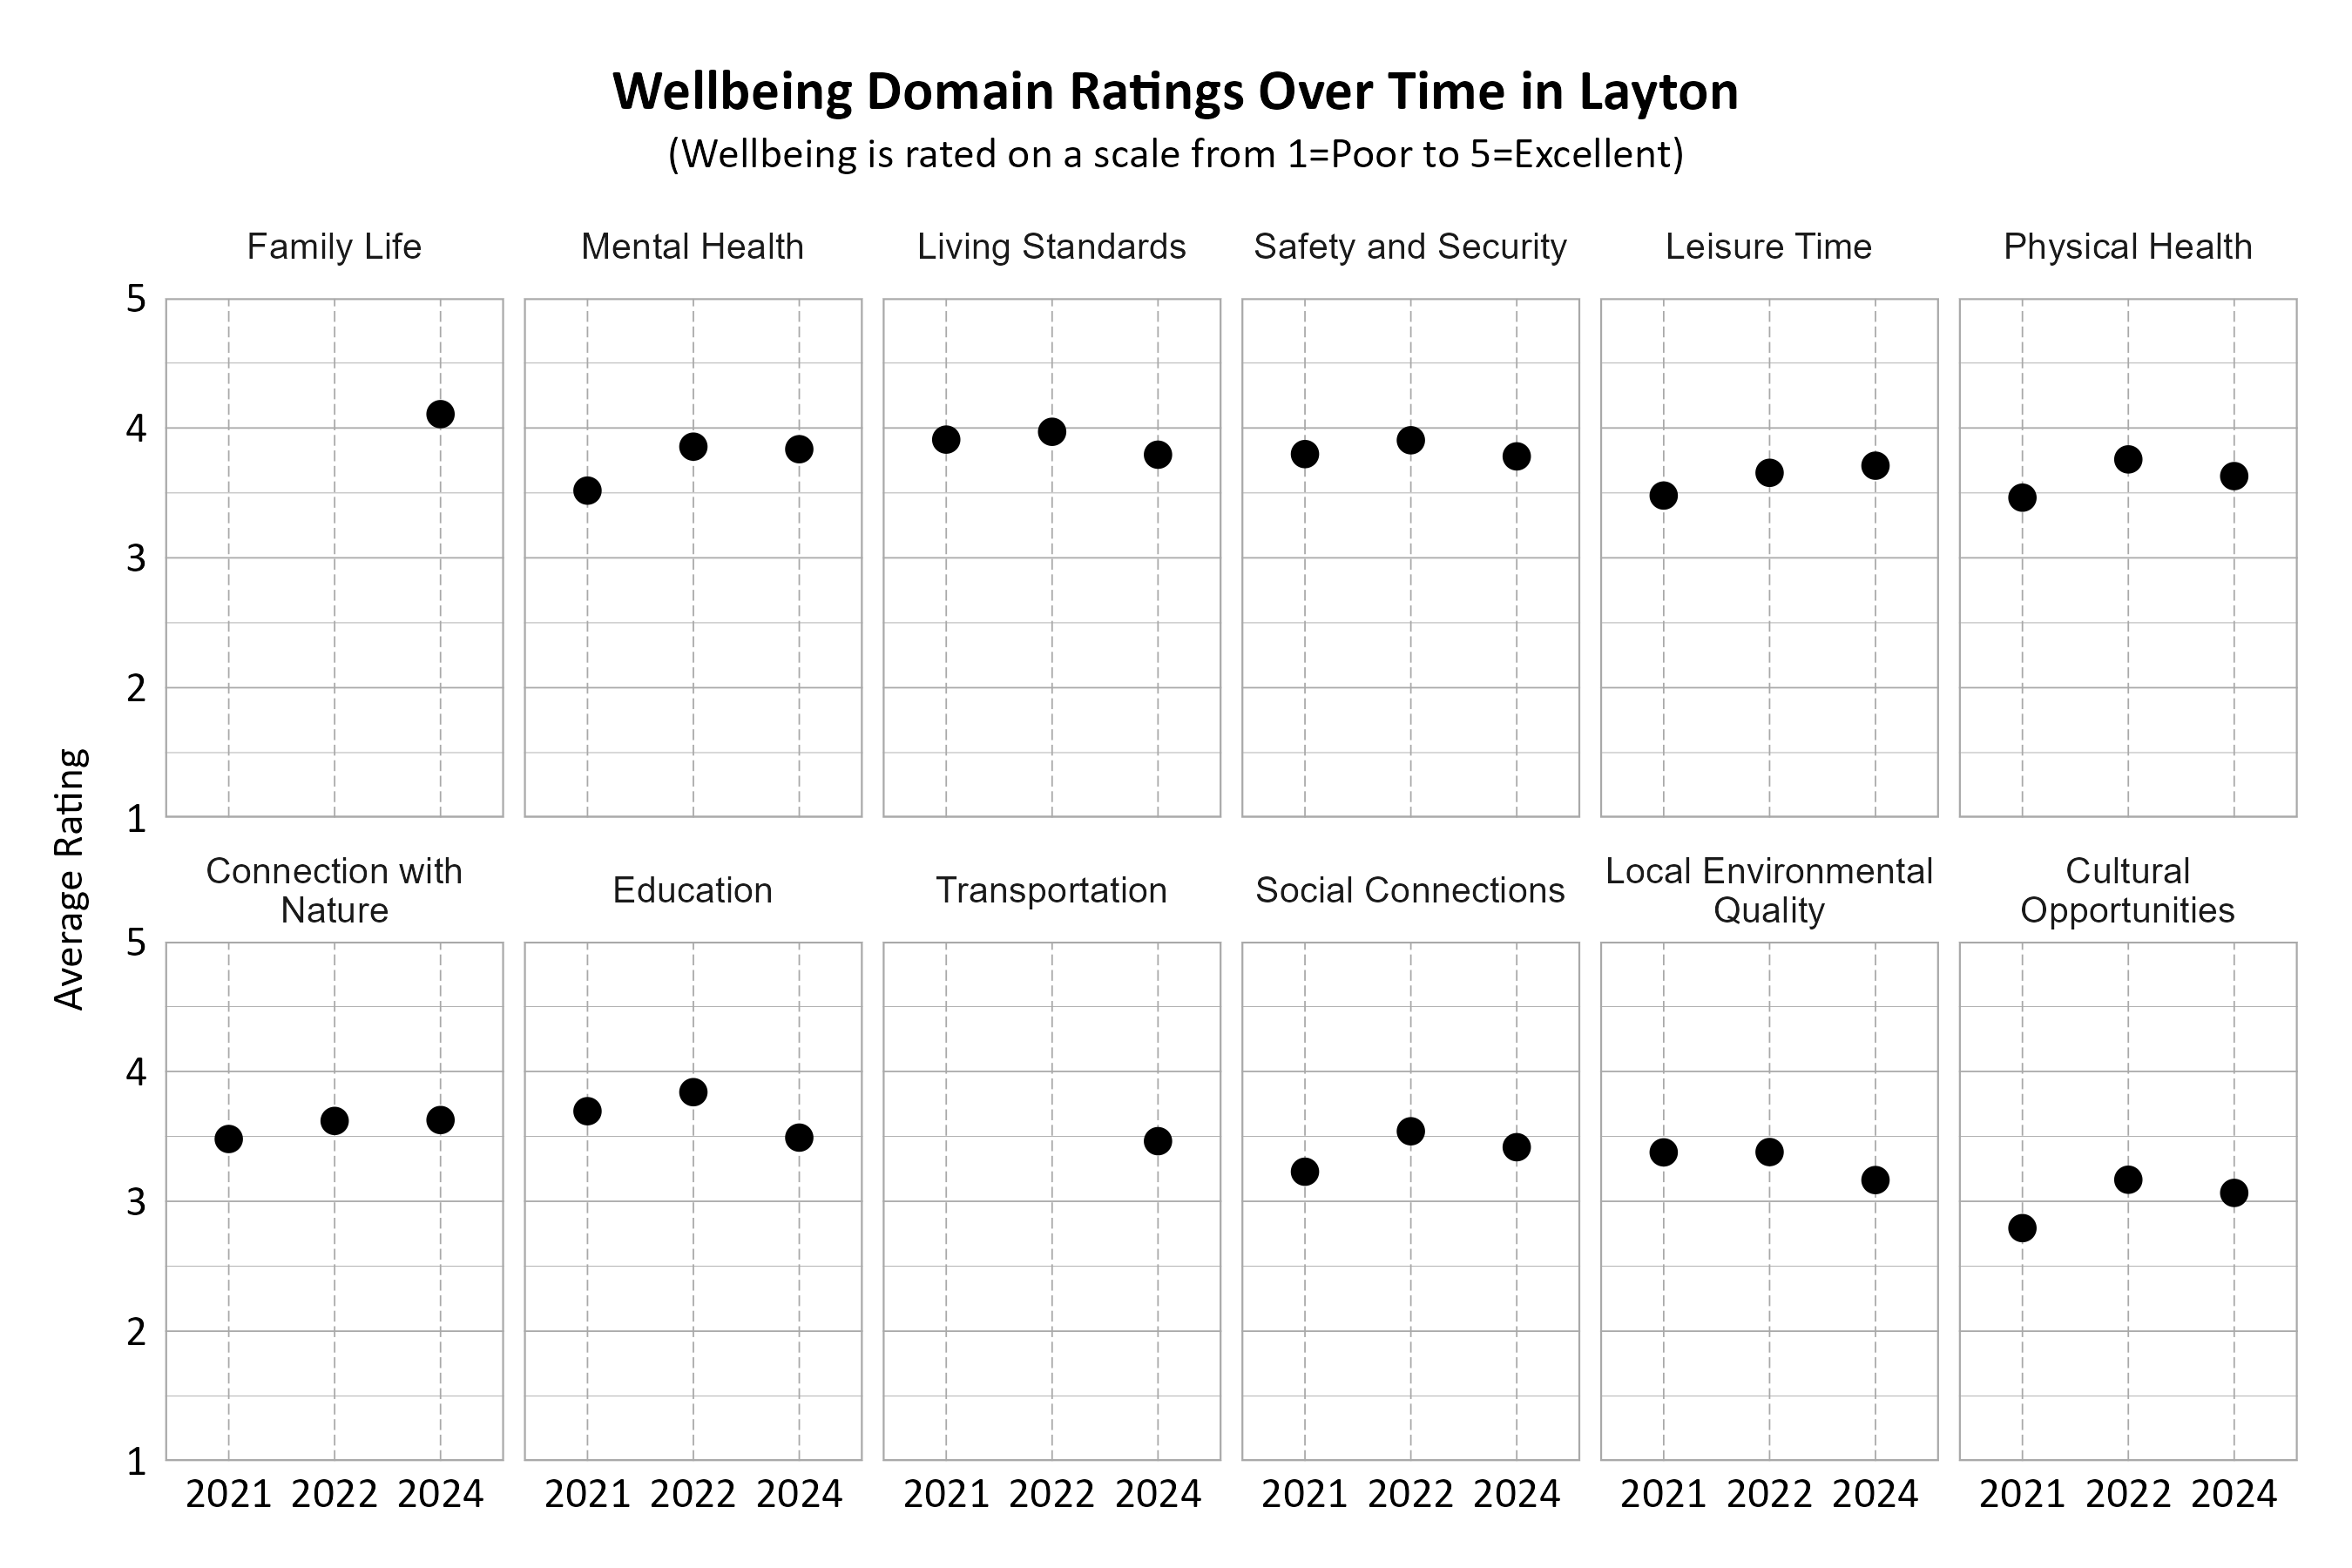
Wellbeing Domains Over Time in Layton
The graphs below show how the domains were rated over the years by Layton residents. The number of respondents changed over time. Note that the two domains Family Life and Transportation were new categories in the 2024 survey and were not measured in previous years. Most domains declined in ratings between 2022 and 2024, except for Mental Health, Leisure Time, and Connection with Nature which stayed the same or improved. Living Standards and Safety and Security were consistently among the top rated domains each survey year, while Cultural Opportunities was consistently among the lowest.
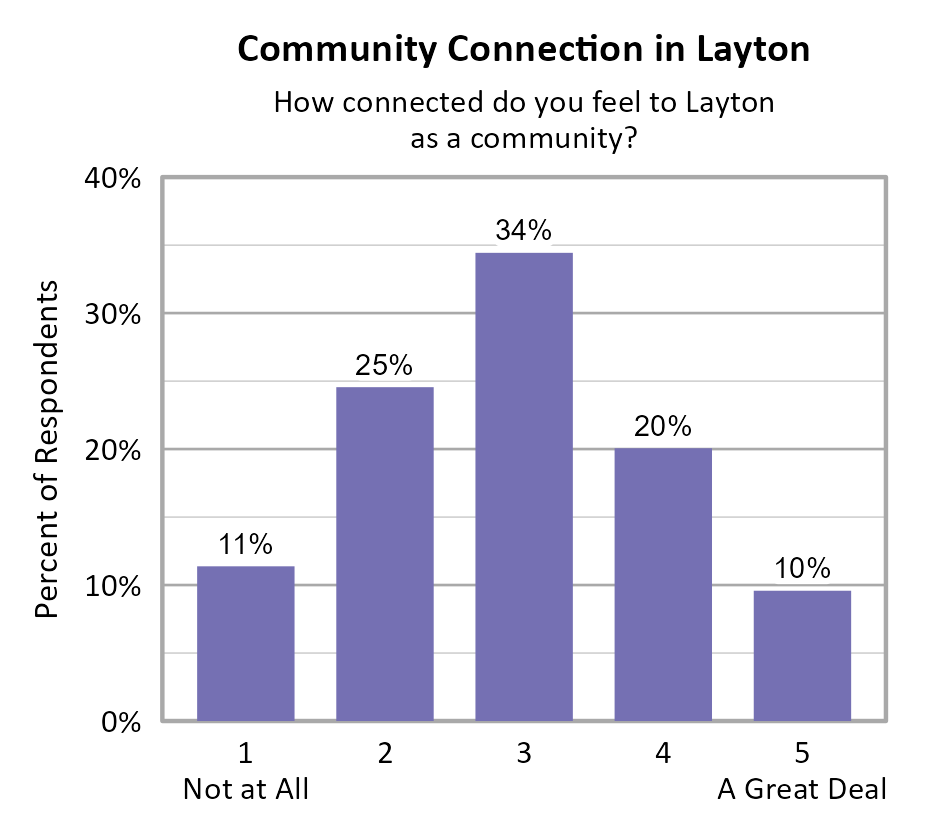
Community Connection in Layton
Survey participants were asked about how connected they feel to Layton on a 5-point scale from not at all (1) to a great deal (5), and the average score of all respondents was 2.92. While ZIP code 84040 had slightly higher community connection scores than ZIP 84041, it was not a statistically significant difference.
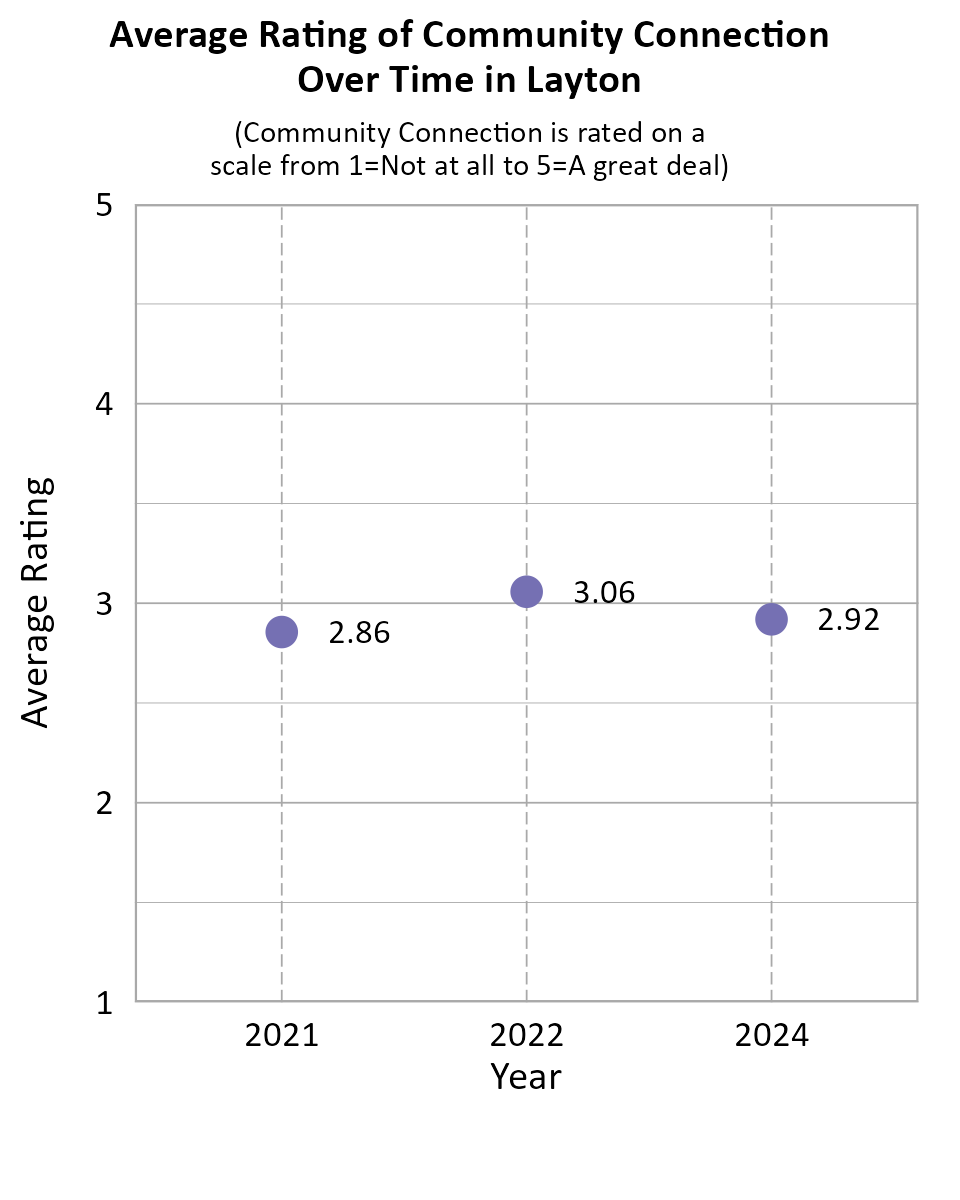
When comparing survey data from Layton over the years as shown in the information below, we can see that the average community connection score improved between 2021 and 2022, and declined between 2022 and 2024.
A positive relationship was found between individuals’ community connection and overall personal wellbeing as well as mental health.
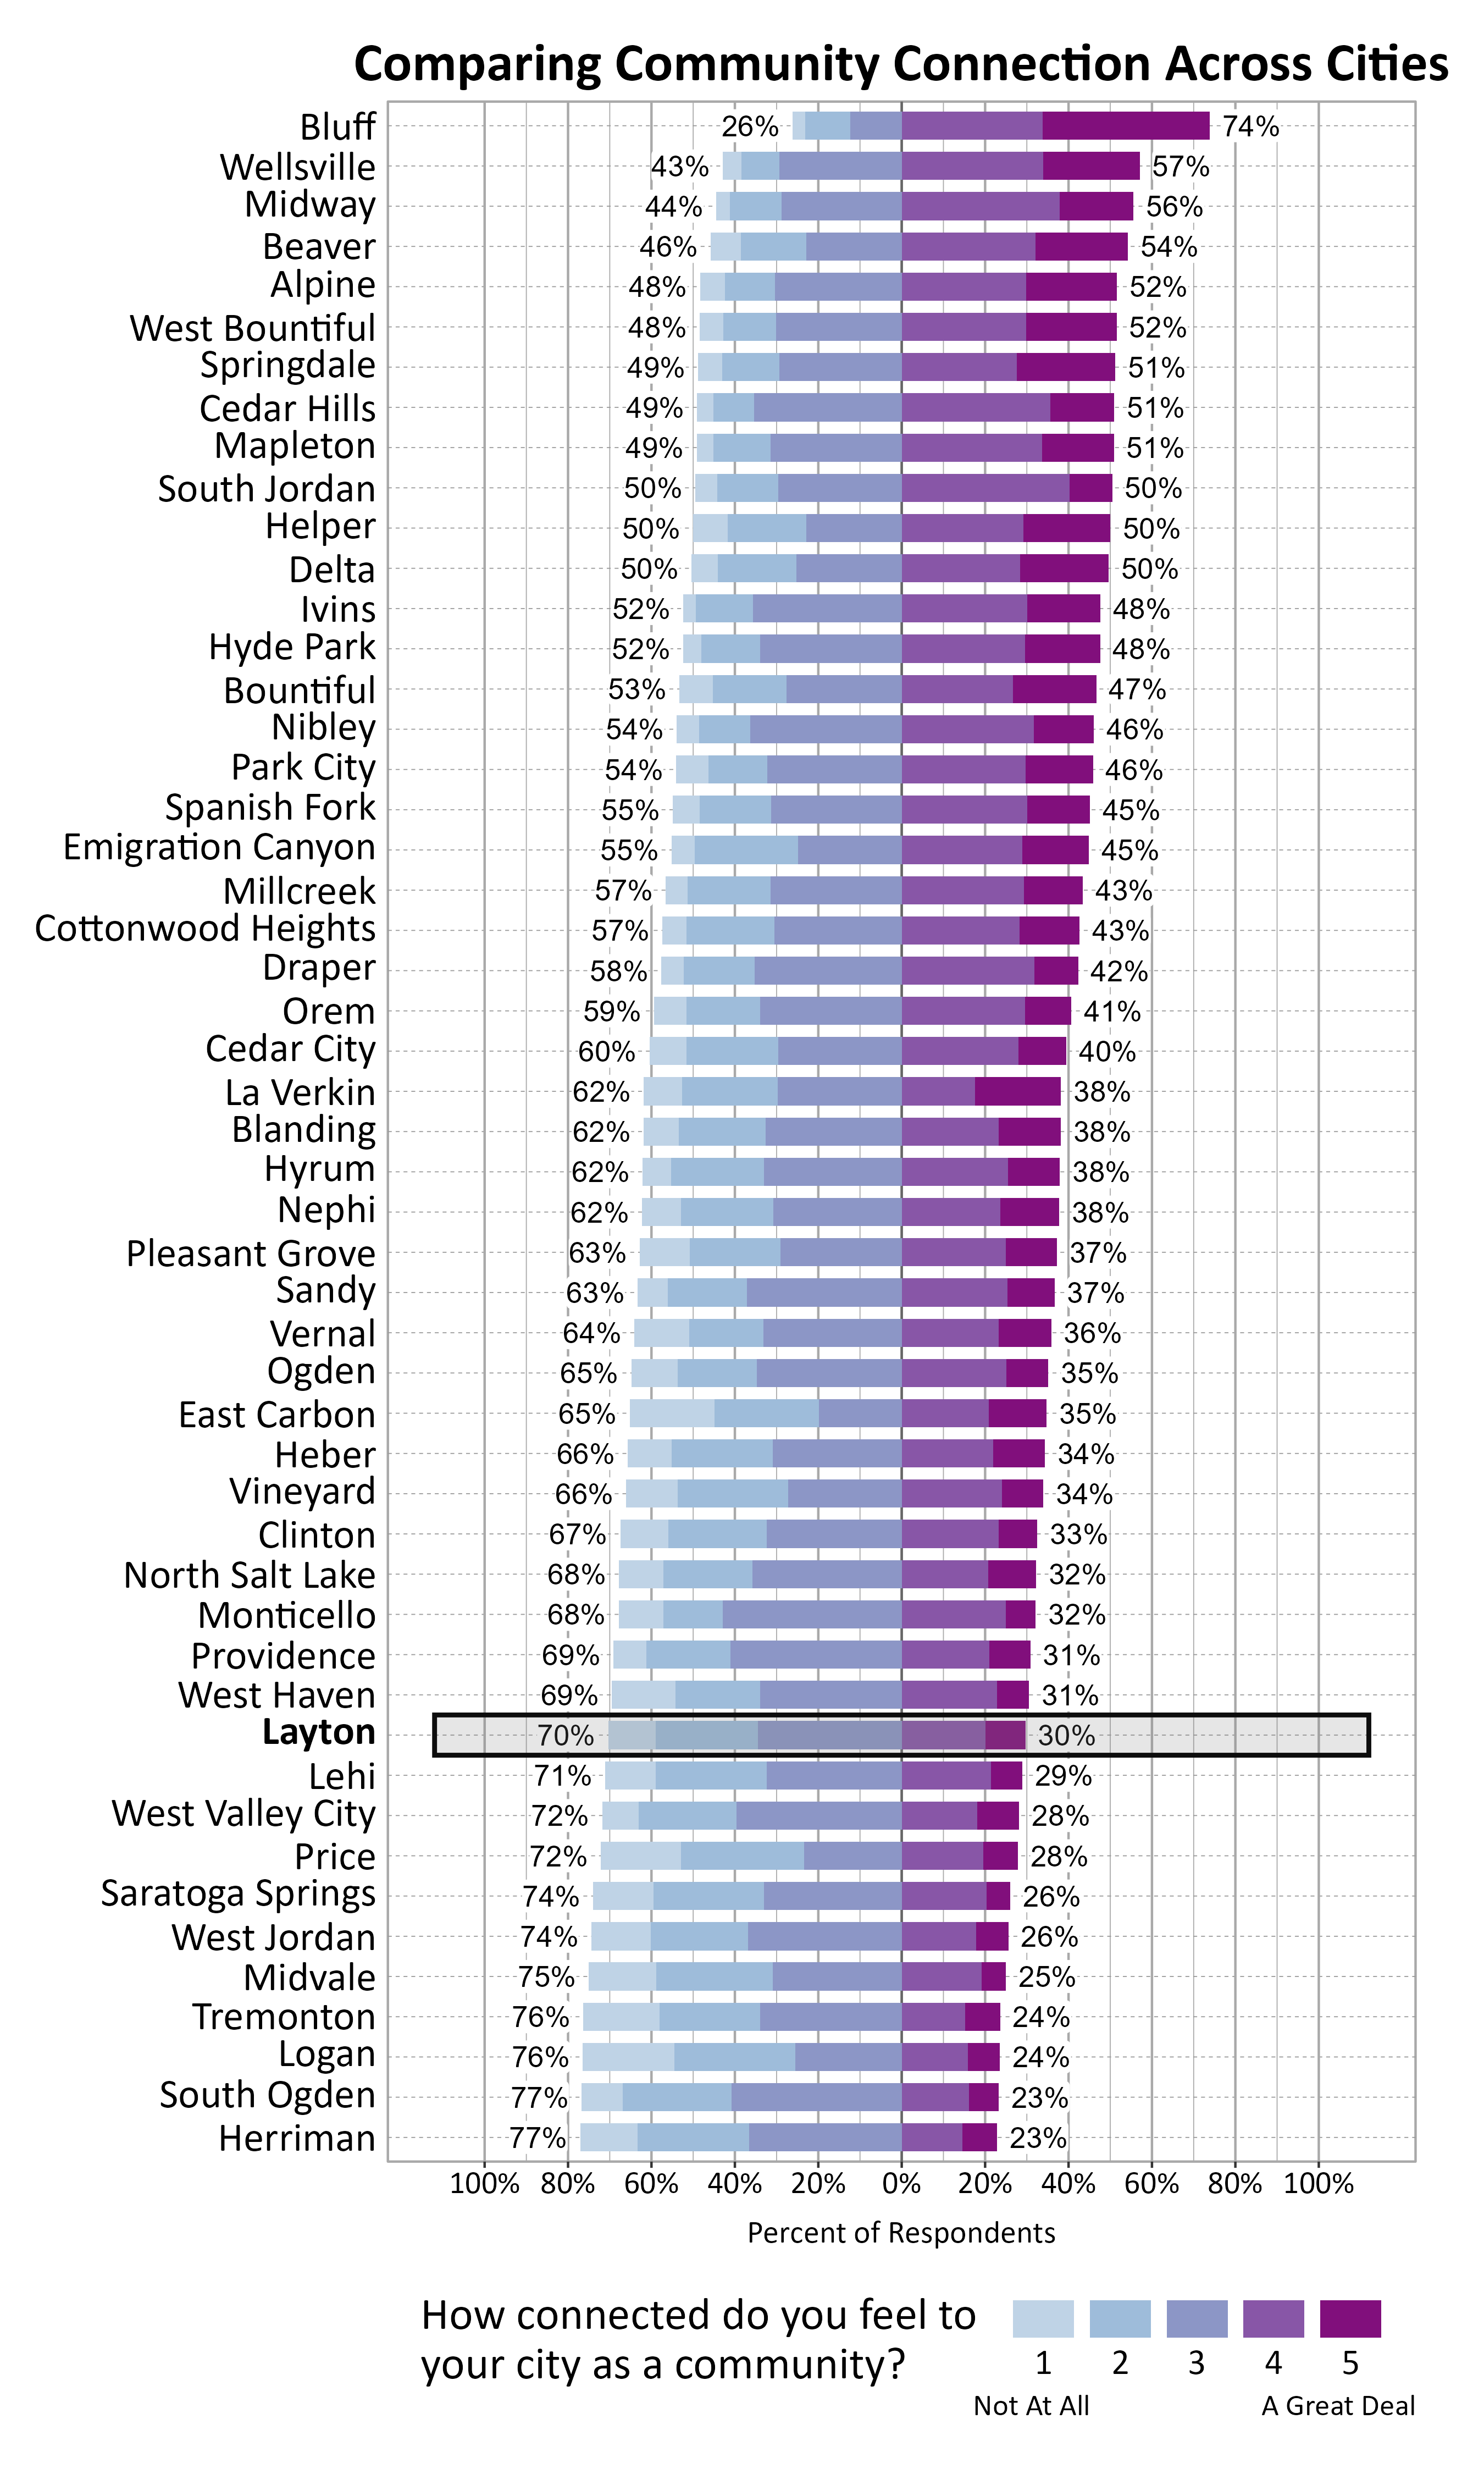
The graph below shows how Wellbeing Project cities and towns compare on feelings of community connection based on the percentage of respondents who answered 4 or a 5 on a 5-point scale from “not at all” to “a great deal” connected to their city or town. Layton ranked 41 out of the 51 cities that participated.
Participation in Recreation and Nature-Related Activities
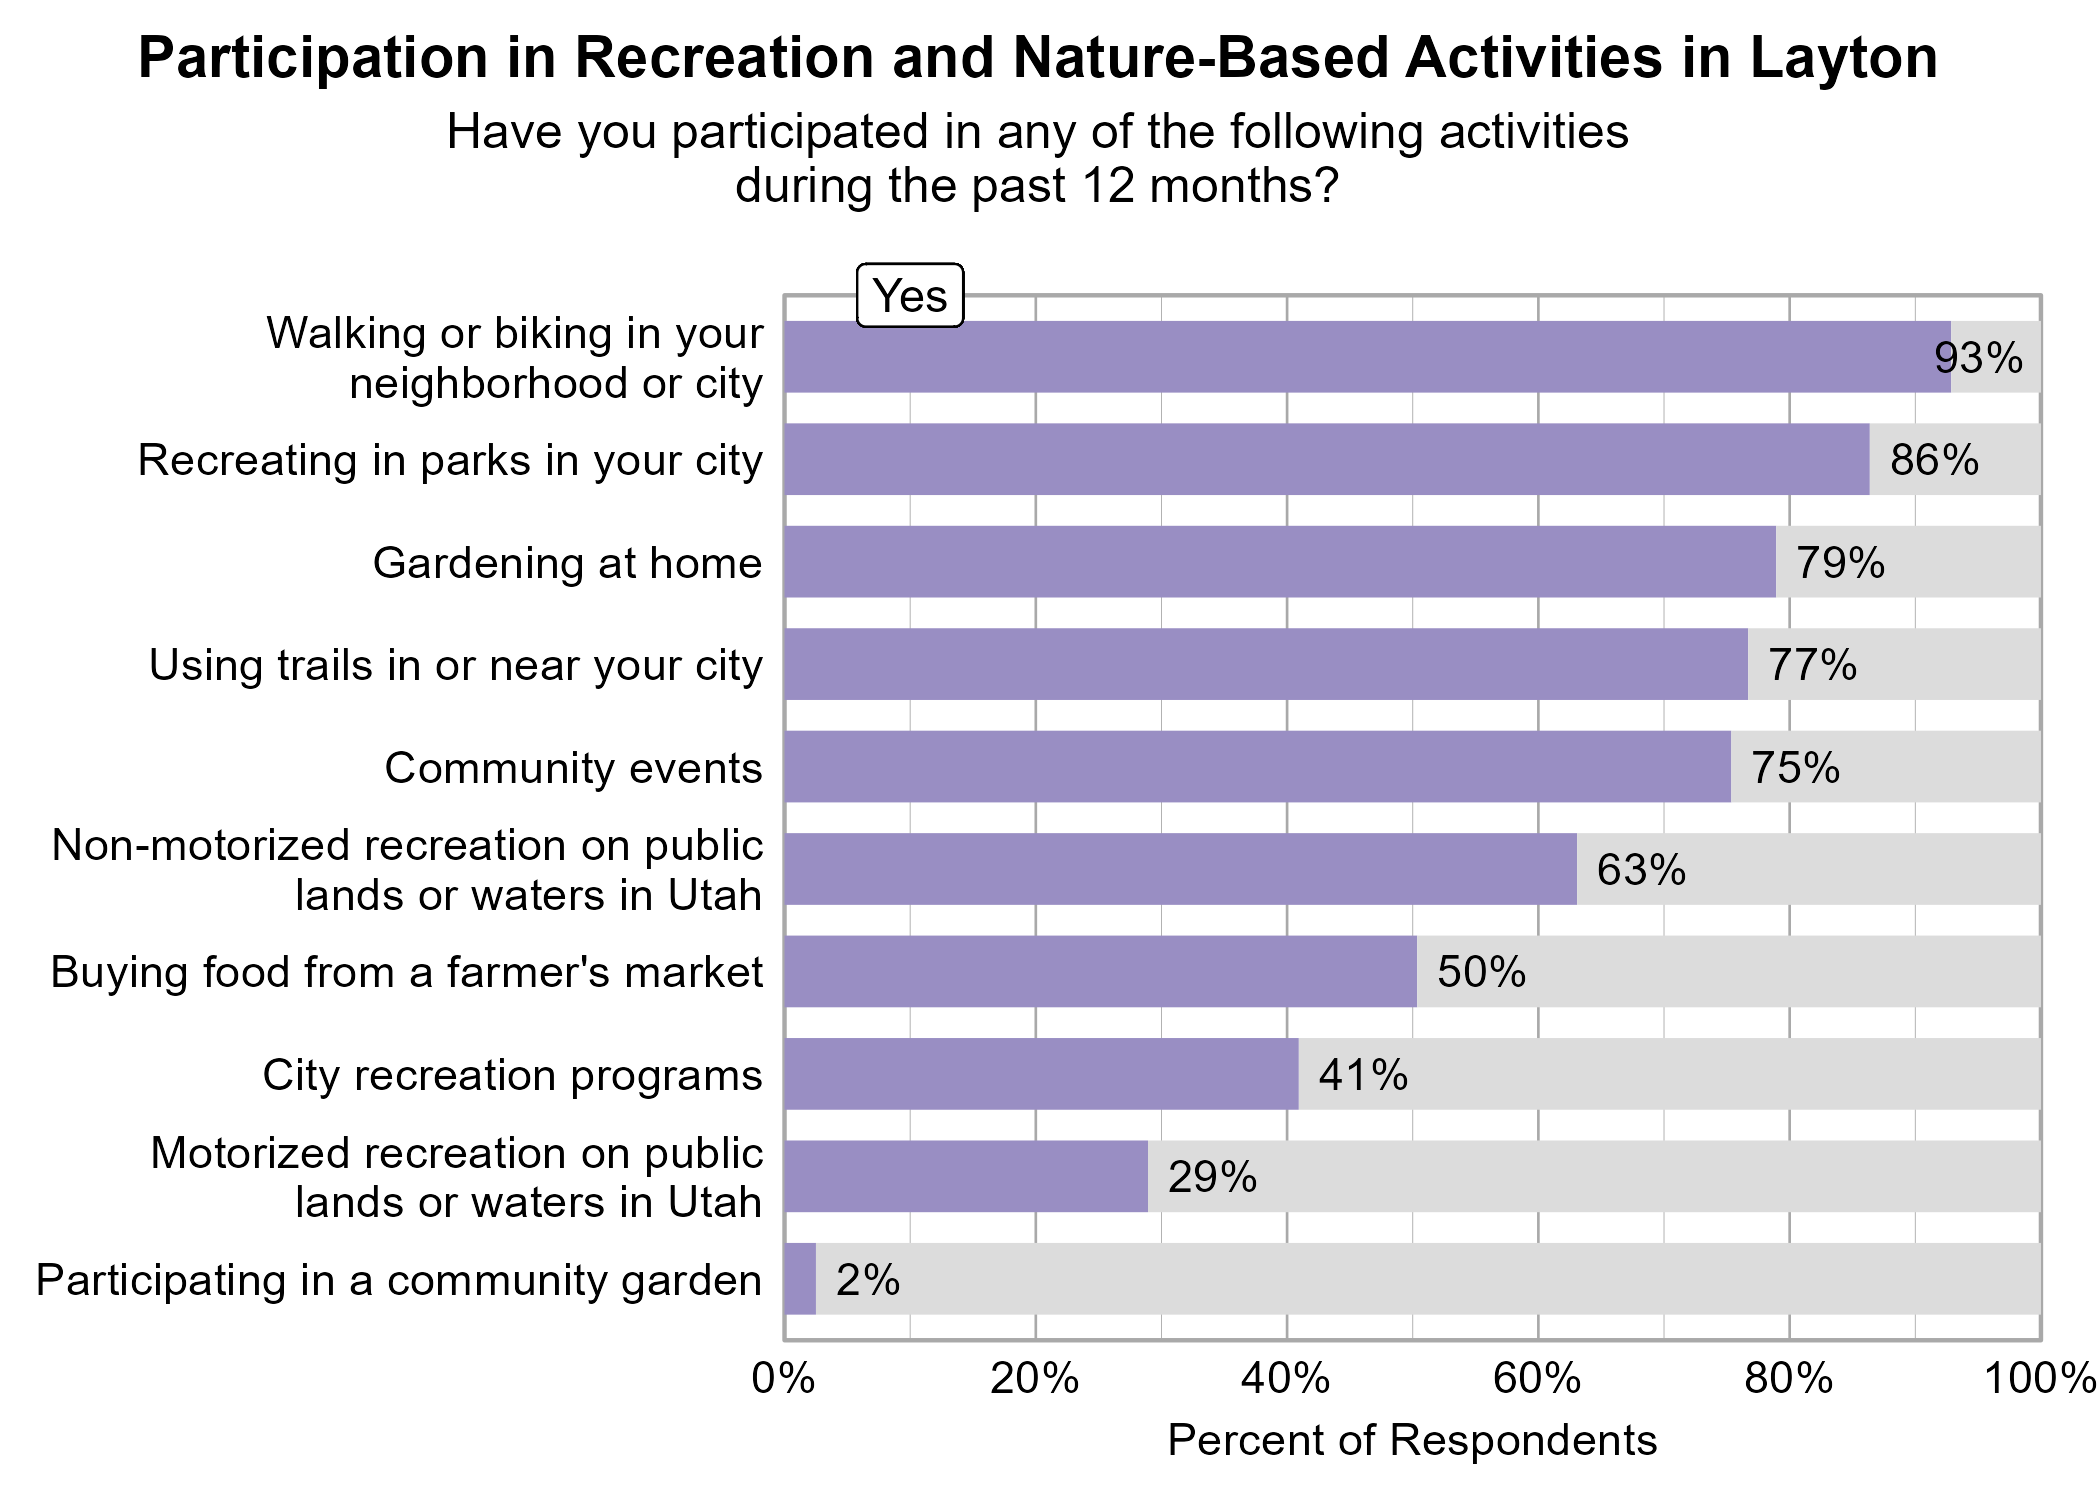
Respondents were asked to indicate whether or not they participated in various activities in the last 12 months. The most popular activities were walking or biking in your neighborhood or city (93%), recreating in parks in your city (86%), gardening at home (79%), and using trails in or near your city (77%).
Participating in community events, gardening at home, motorized recreation on public lands or waters in Utah, and recreating in parks in your city were significantly related to higher ratings of personal wellbeing.
Participating in community events and recreating in parks in your city were significantly related to higher ratings of community wellbeing.
Participating in city recreation programs, participating in community events, gardening at home, and recreating in parks in your city were significantly related to higher ratings of community connection.
Perspectives on Population Growth and Economic Development
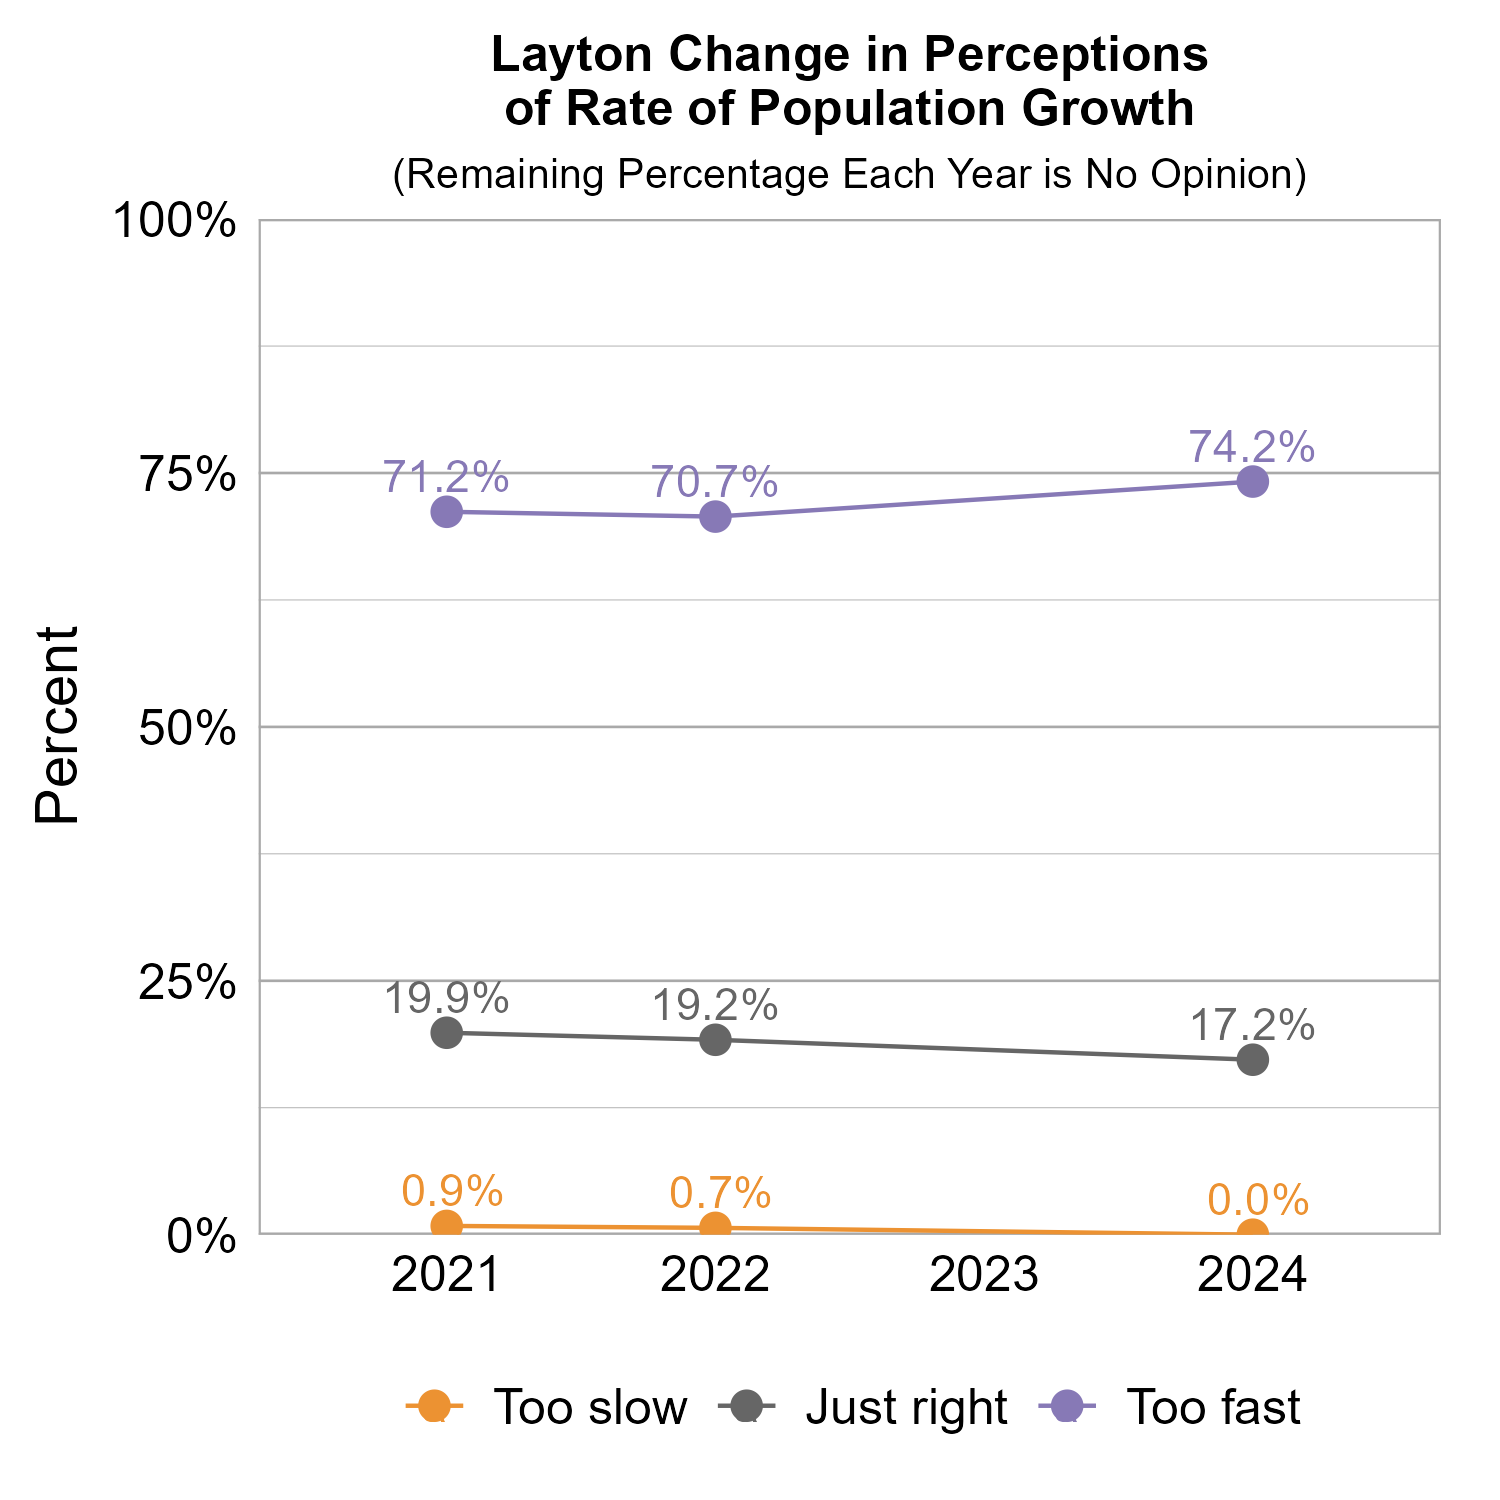
The majority of respondents in Layton indicated that they felt the population growth was too fast (74%). For the pace of economic development, respondents were split between opinions that it was just right (34%) and too fast (33%).


The graphs below show how perceptions of population growth and economic development in Layton have varied across recent years of Wellbeing Surveys. Perception that the rate of population growth is too fast has remained consistently high over the survey years. The perception that the pace of economic development is too fast decreased from 2022 to 2024.

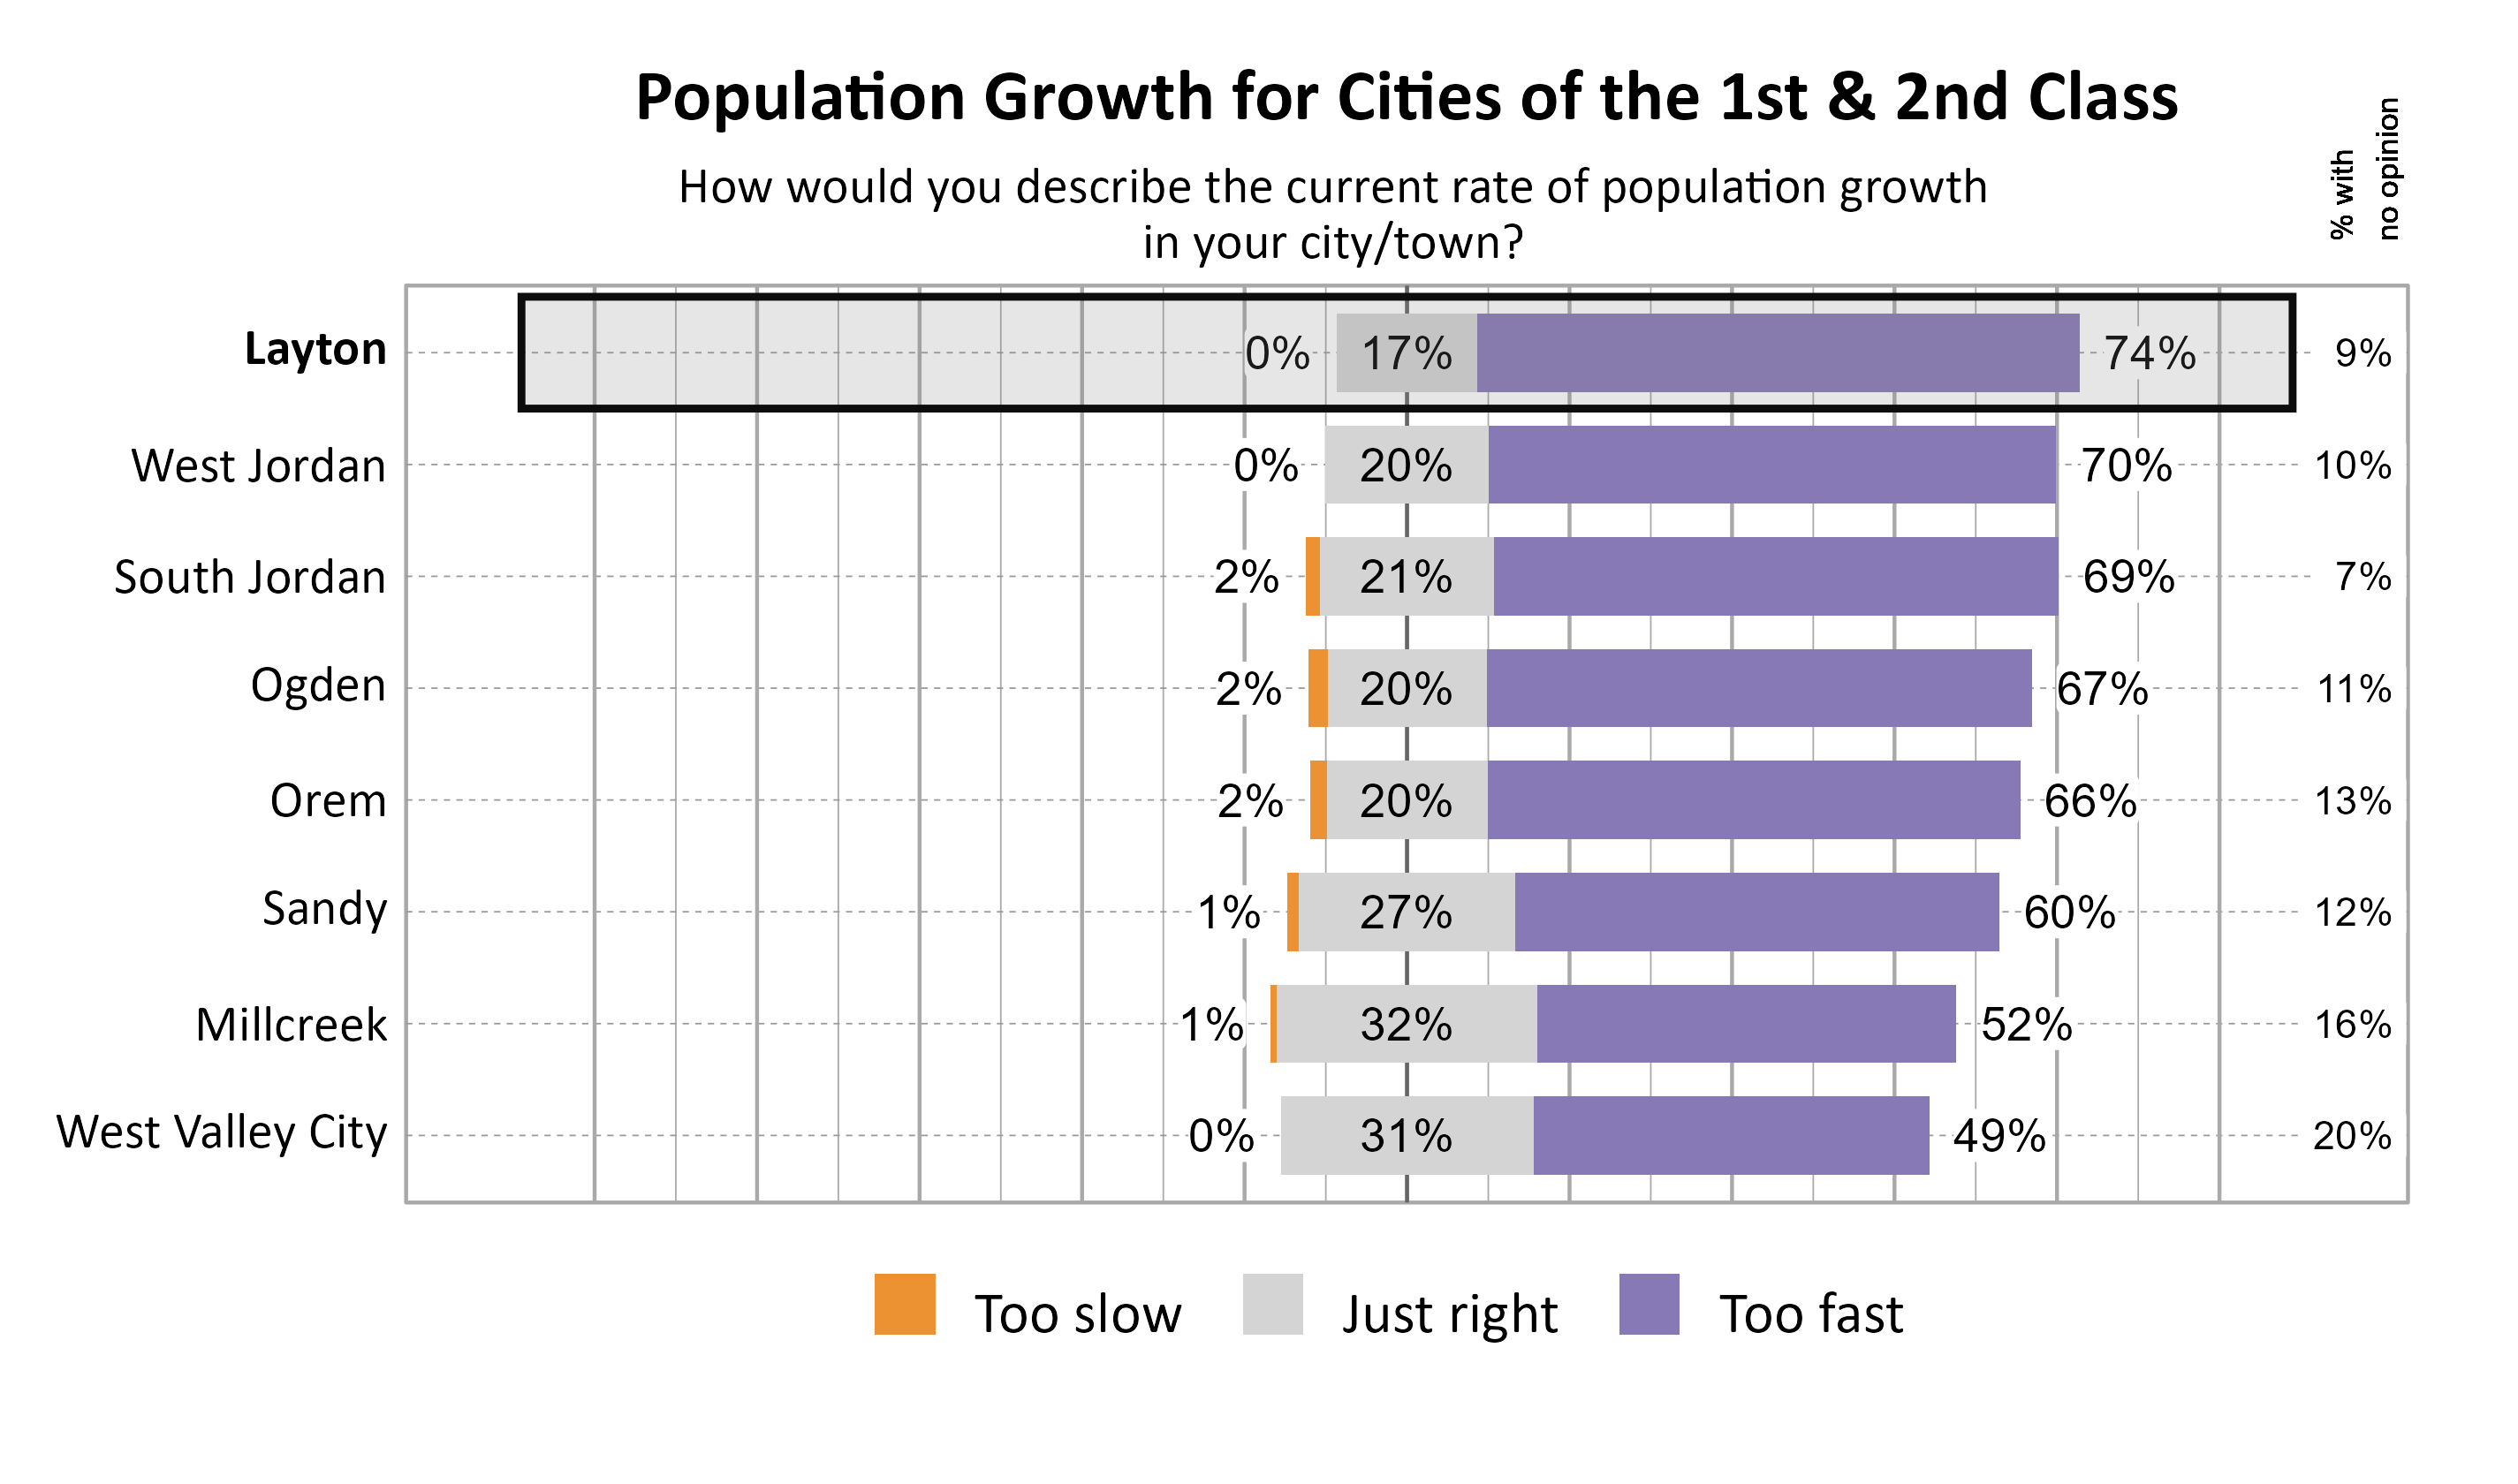
The graphs below show perceptions of population growth and economic development for Layton compared to other participating cities and towns in the Cities of the 1st & 2nd Class cluster.

The graph below illustrates how many respondents perceived the pace of economic development as too slow, just right, too fast, or had no opinion, with additional breakdowns for the number of respondents who provided comments.

The 21% of respondents who rated the pace of economic growth as “too slow” were further asked what aspects of the local economy they would like to see more of in Layton. Many commented that retail options are largely chain restaurants and stores and there are too many car washes and storage units. There were also numerous comments about the mall being outdated and about empty buildings that have gone out of business. Respondents indicated they would like to see new stores, restaurants, and things to do, and not just large chains. There were also several comments on the topic of jobs with hopes for better paying jobs and more options that don’t require commuting out of Layton.
Additionally, the 33% of respondents who rated the pace of economic growth as “too fast” were further asked what aspects of the local economy they feel are growing too quickly in Layton. Respondents expressed concern over the fast-paced building of housing. Relatedly, there were comments about infrastructure, water availability, traffic, and general congestion. Many respondents brought up the loss of green space and farmland and associated change in the character of Layton.
Transportation in Layton
Respondents were asked to indicate all of their primary modes of transportation on a regular basis in Layton. The most popular modes of transportation were personal car (100%) and walking (33%).

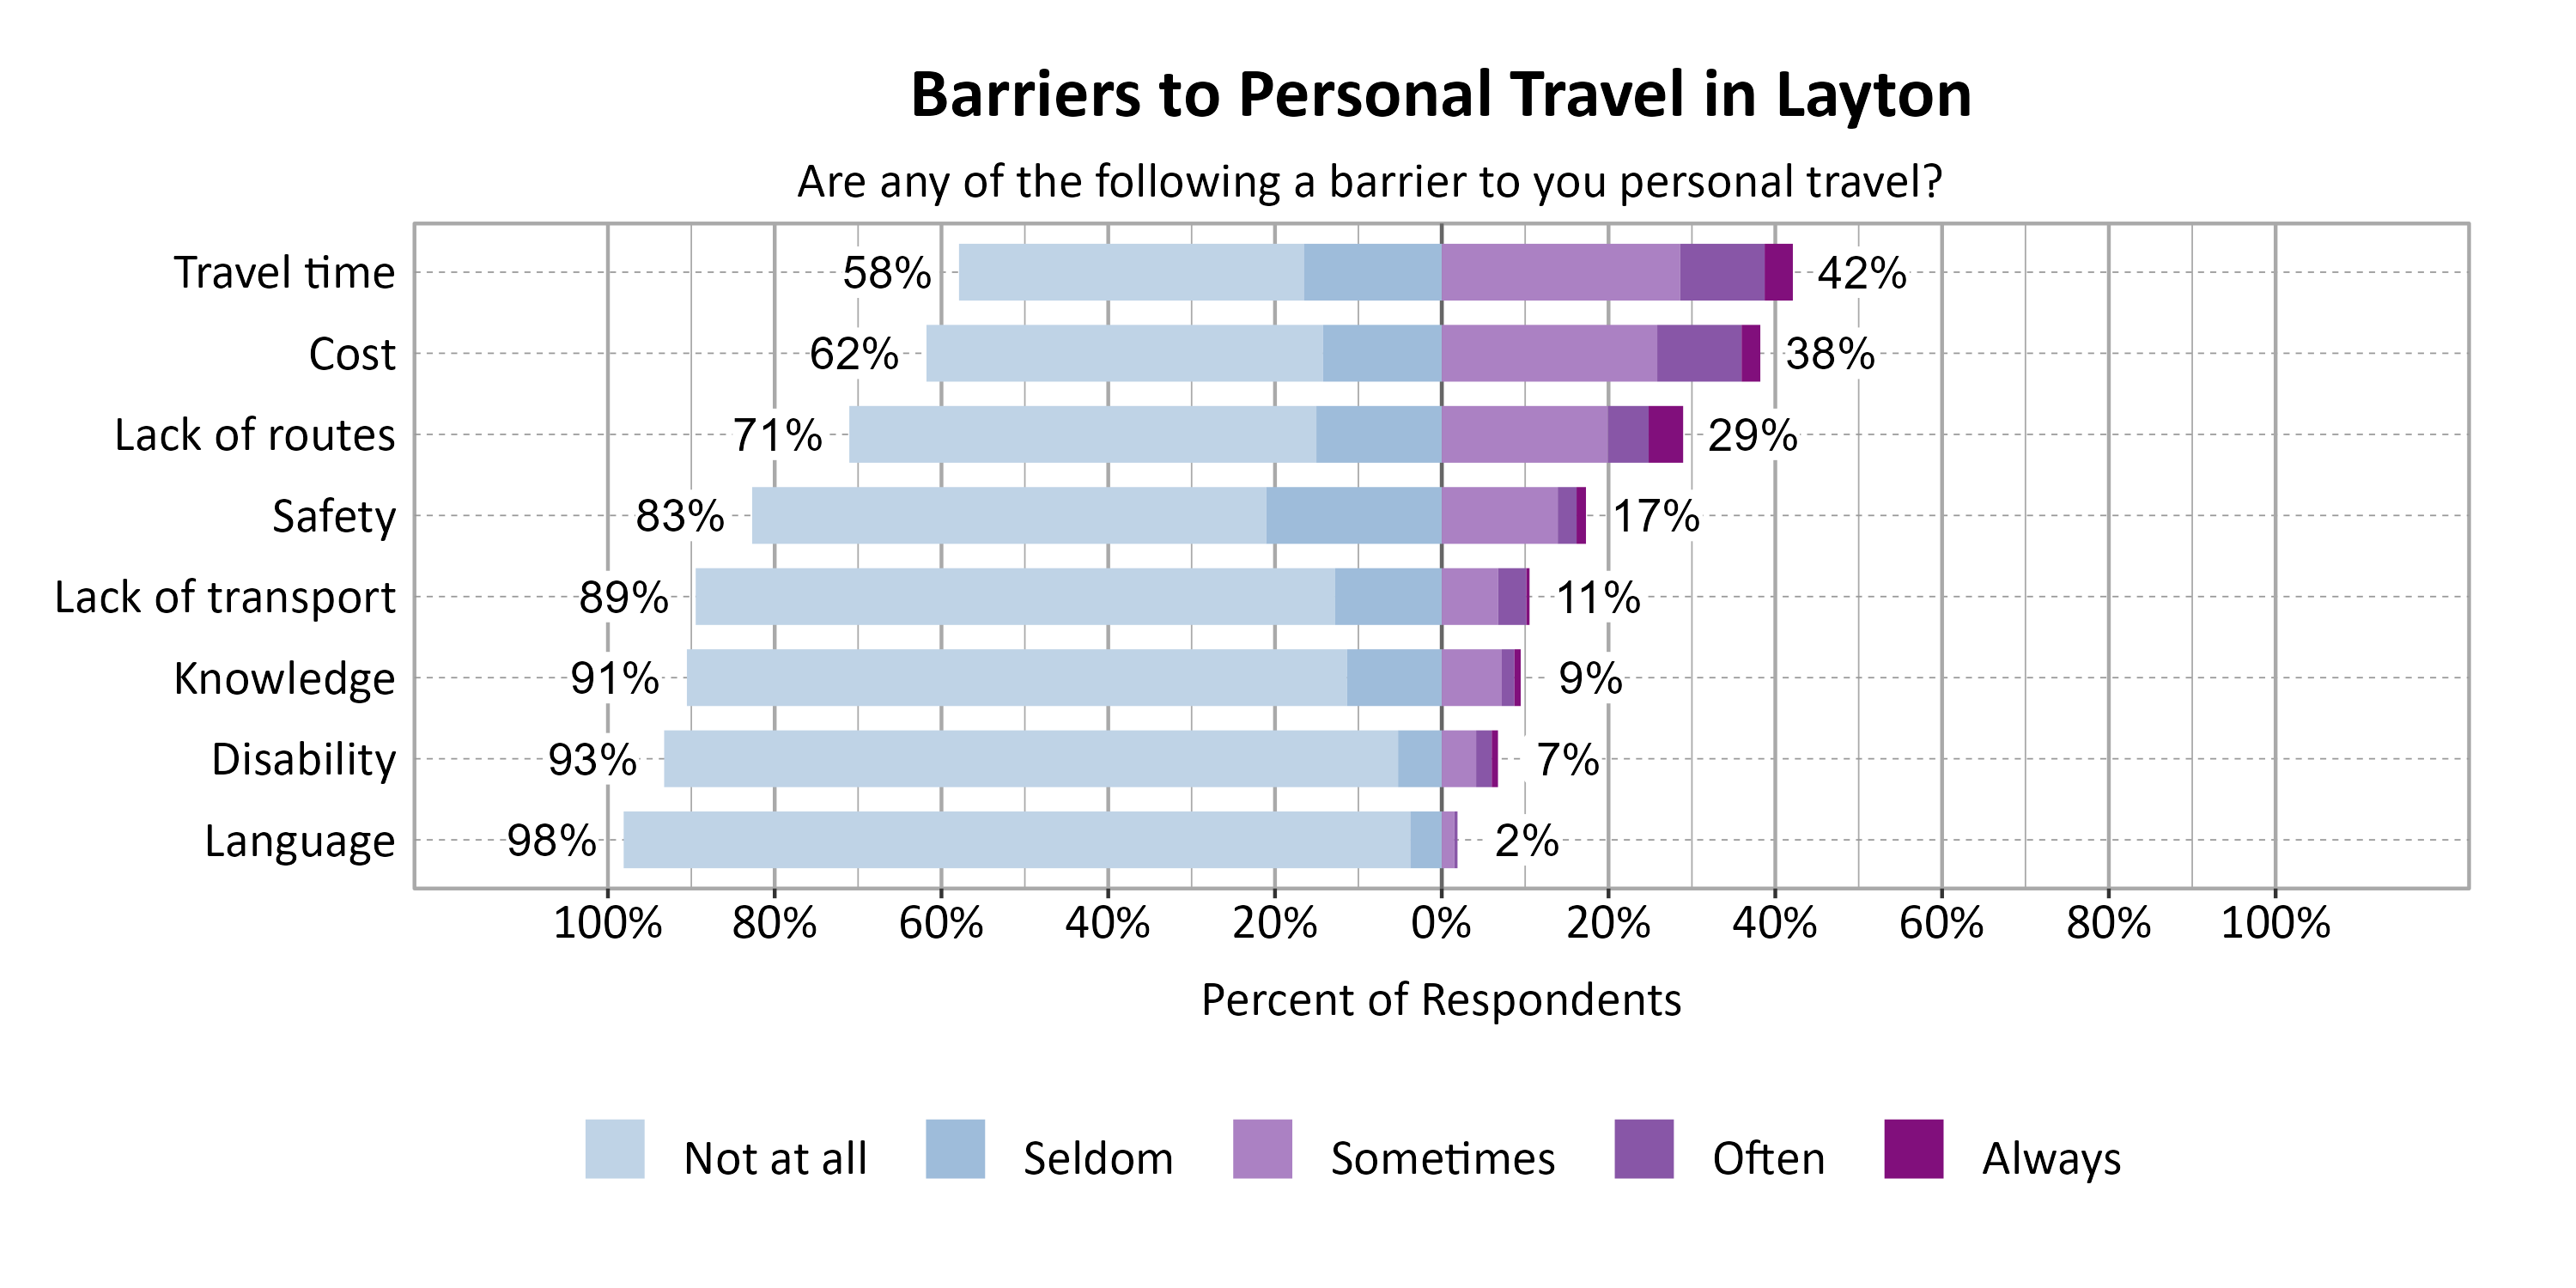
Respondents were asked to indicate the most common barriers to transportation in Layton. The most problematic barriers were Travel time (42%) and Cost (38%).
Respondents were asked to indicate the importance of a set of possible transportation developments in Layton. The most important development to respondents were Improving road surfaces (82%), Enhancing safety (73%), and More trails (62%).

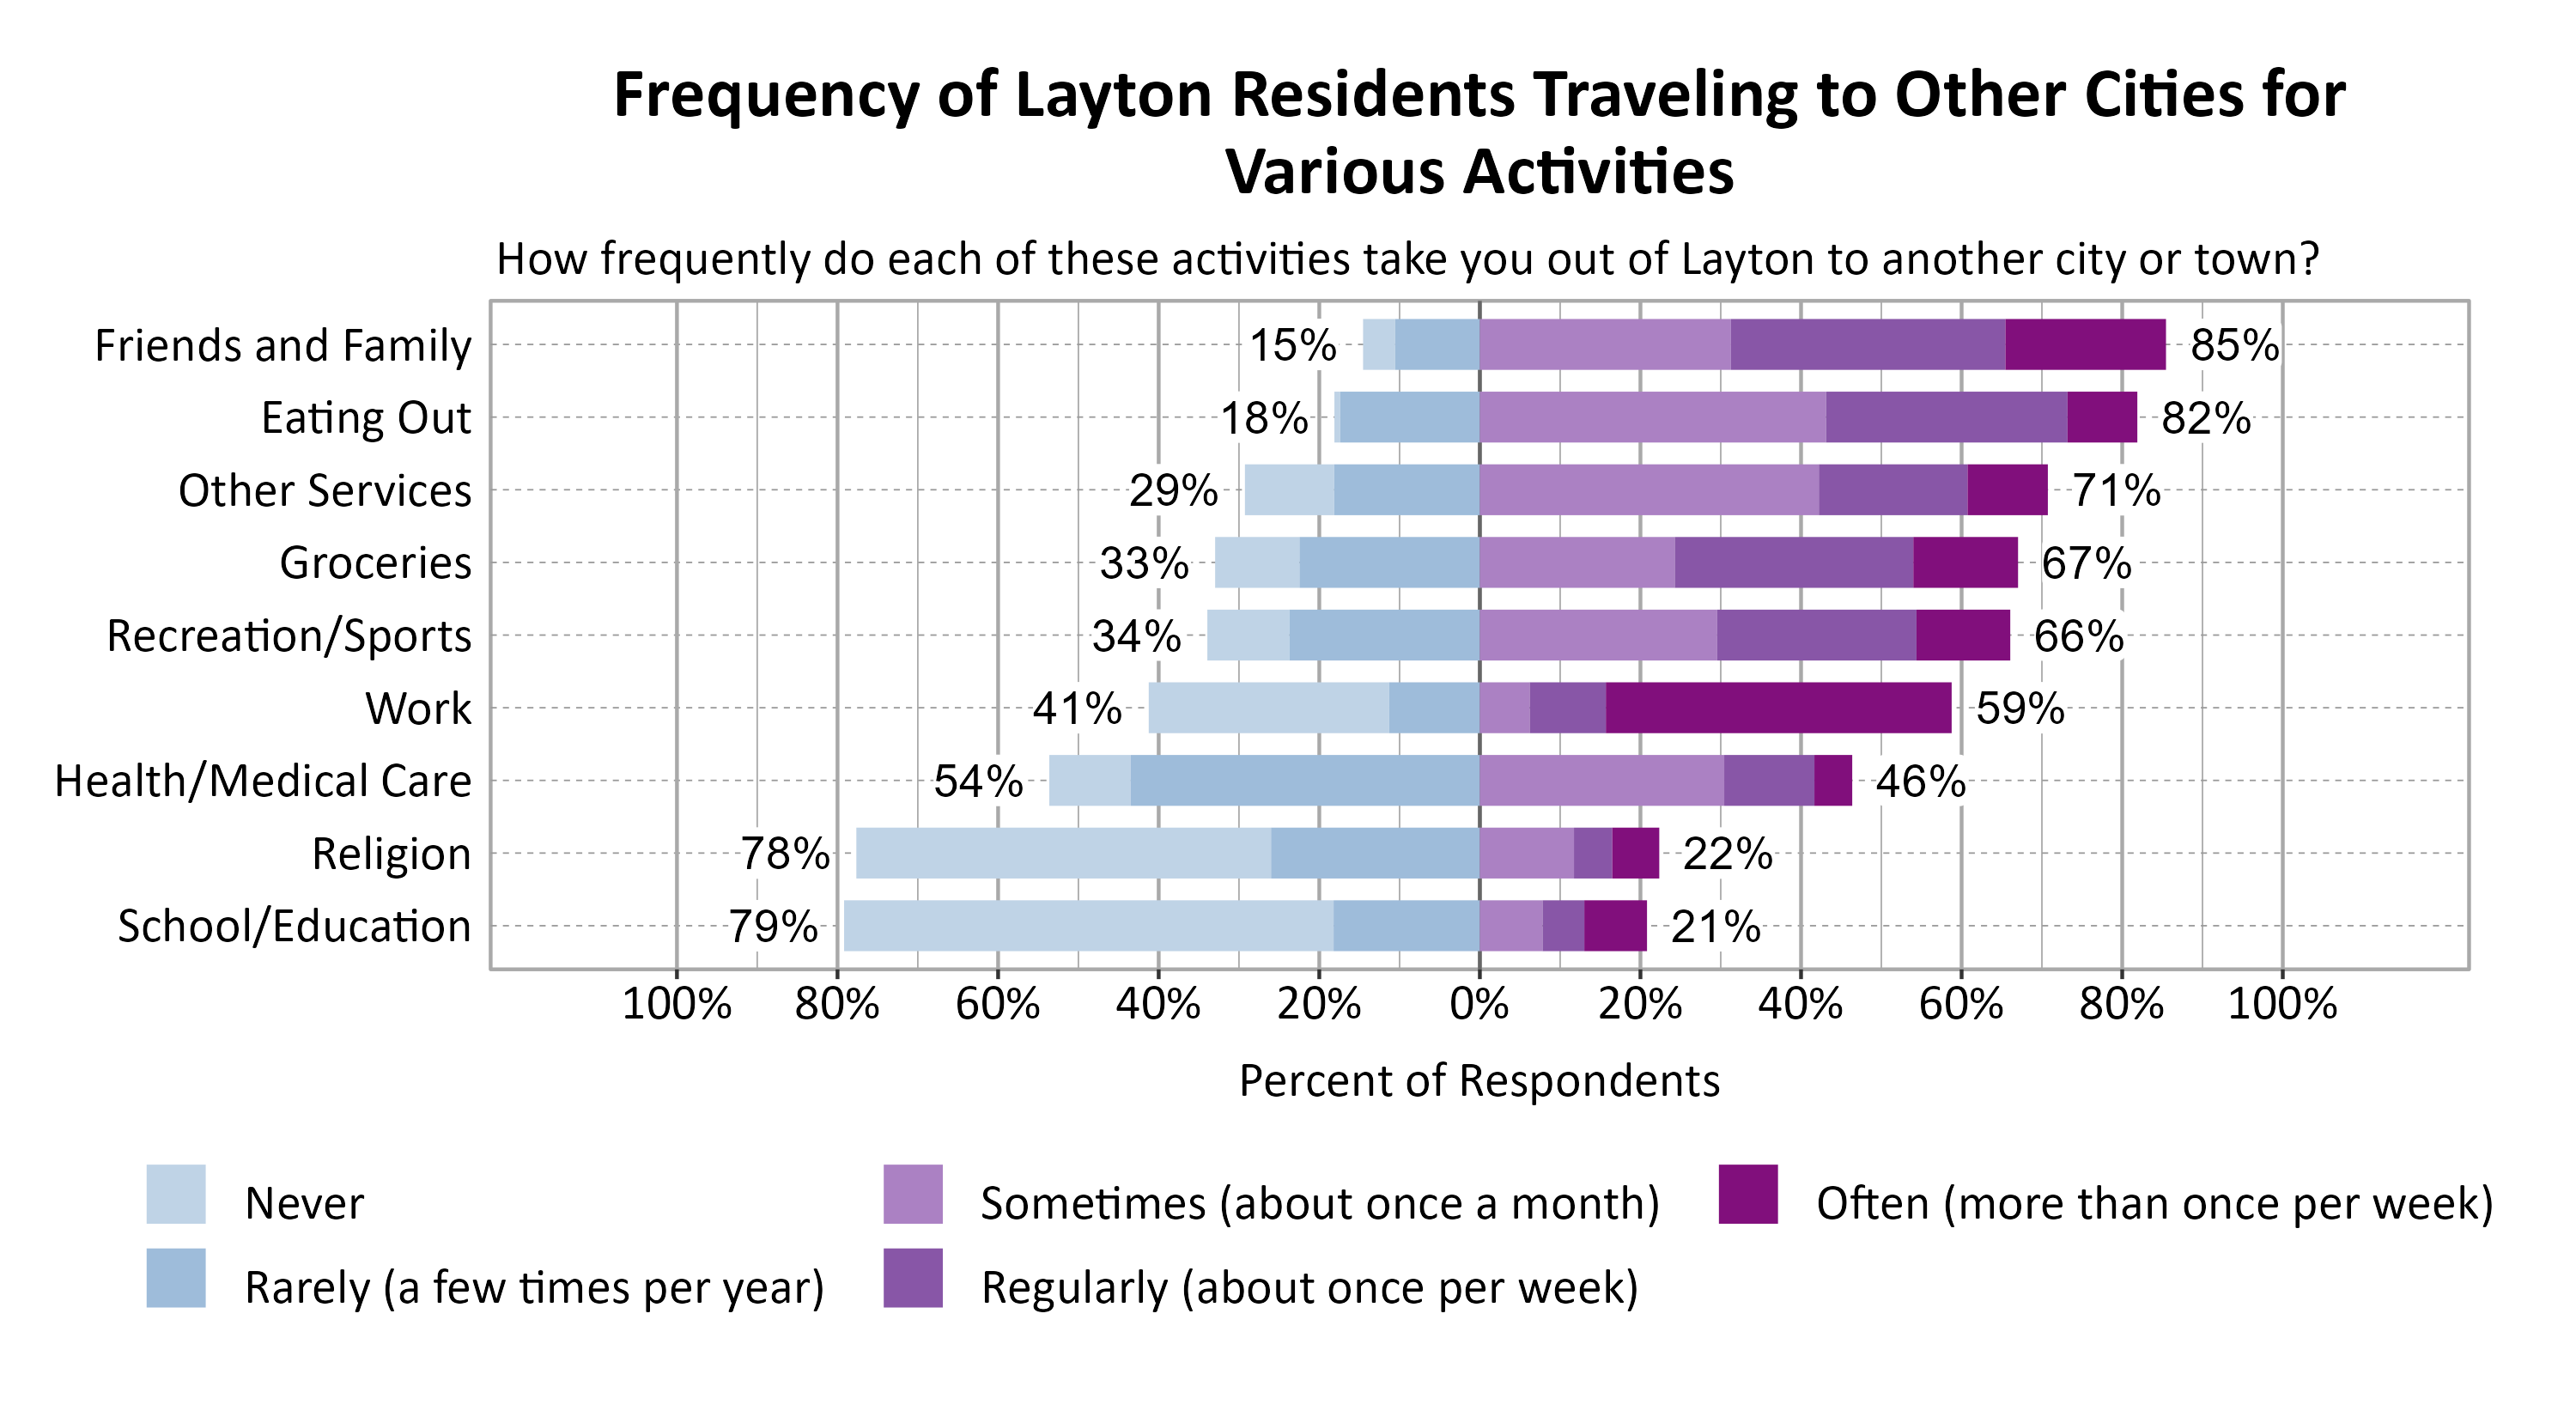
Respondents were asked to indicate how frequently various activities take them out of Layton to another city or town. The most commonly indicated reasons for traveling to another city or town at least sometimes or once a month were Friends and Family (85%), Eating Out (82%), and Other Services (71%).
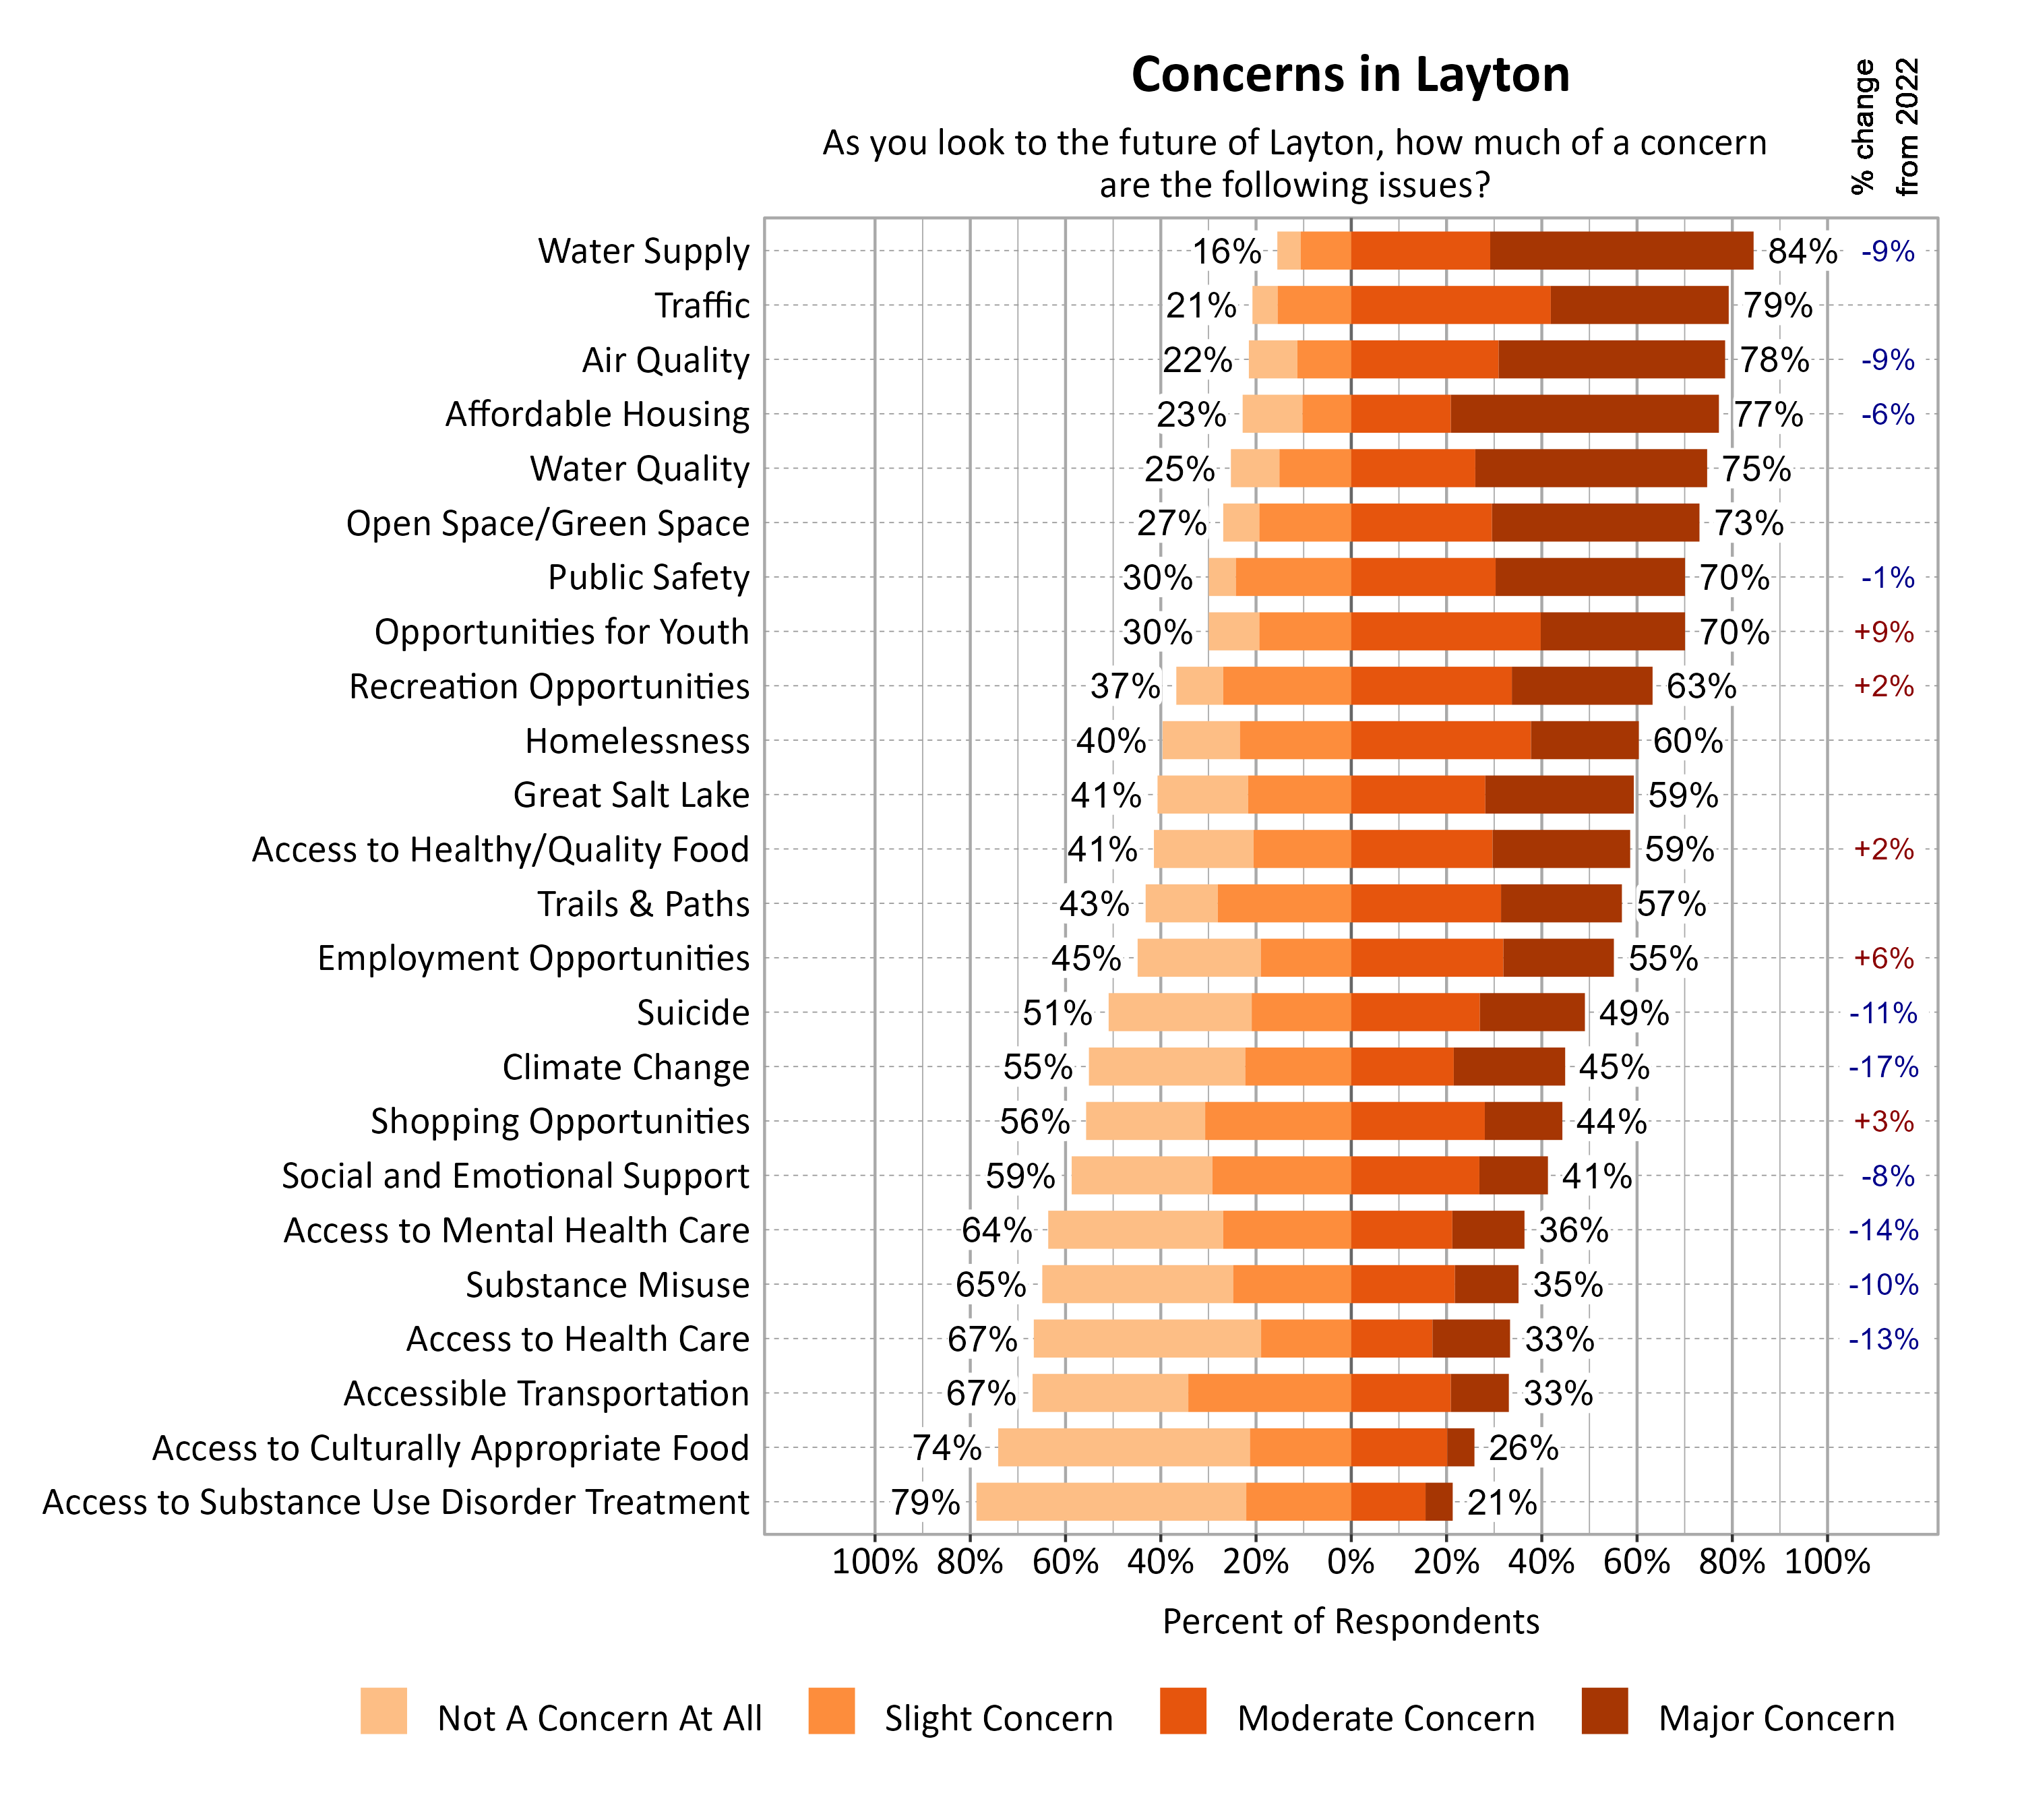
Concerns in Layton
Survey respondents indicated the degree to which a number of possible local issues were a concern as they look to the future of Layton. Water Supply (84%), Traffic (79%), Air Quality (78%), and Affordable Housing (77%) were the top concerns. Since 2022, moderate or major concern about climate change (-17%), access to mental health care (-14%), access to health care (-13%), suicide (-11%), and substance misuse (-10%) notably decreased.
Open Comments
All open comments collected in the survey were shared with city leaders. General observations and themes are shared here.
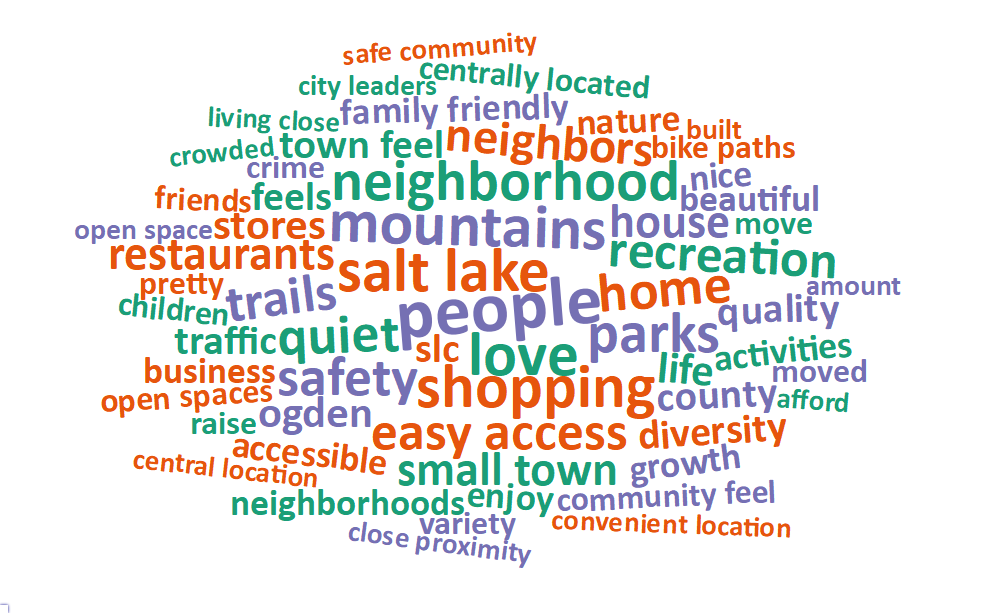
What Respondents Value Most in Layton
Survey respondents were asked to comment on what they value most about Layton. The most common words and phrases from all city comments are included in the word cloud below. It is possible that negative or unrelated words may appear since these words have been taken out of context, and they may not indicate the respondent’s intended meaning. A majority of respondents valued Layton’s convenient location, particularly being central to Salt Lake City and Ogden, and easy access to highways, transportation, and various amenities like shopping, restaurants, and recreational activities. Comments expressed value of the close proximity to family and nature, such as parks, trails, and mountains, which contribute to a high quality of life. The community was often described as safe, family-friendly, and maintaining a small-town feel despite recent growth. Open spaces and farmland were valued as well.
Local Environmental Quality in Layton
The 58% of respondents who rated the Local Environmental Quality domain as 1, 2, or 3 (Poor, Fair, or Moderate) were further asked if there are specific aspects of local environmental quality that they feel are problematic. Noise pollution was one of the most common points of concern. With Hill Air Force Base close by and jets flying at low altitudes, the noise shakes houses and is frustrating to residents. Air quality was connected to inversions and car exhaust, and Great Salt Lake dust was a concern. Green space was mentioned as being taken by apartment complexes and other developments contributing to traffic and congestion in the area. Water was also a concern connected to congestion. With new developments, respondents were fearful that there will not be enough water in the future. Trash, litter, and rundown houses were also points of concern for some.
Improving Wellbeing in Layton
Survey respondents were asked if there is anything that could be done to improve wellbeing in Layton. Comments included the need for better road maintenance and infrastructure, particularly on the west side, and a desire for increased pedestrian and bicycle connectivity. Traffic congestion, exacerbated by rapid residential development, was a frequent comment. There was a strong call for a new recreation center, more parks, and community-focused spaces, alongside better support for local businesses and farmers’ markets. Noise pollution from Hill Air Force Base, especially from F-35 jets, was a significant health concern for many, with requests for noise mitigation measures. Residents also emphasized the importance of preserving open spaces and creating more affordable housing.
Additional Comments
Respondents were also asked if they had any additional comments on wellbeing in Layton. Layton respondents commented on the need for better walkability, public transportation, improved road conditions, and reduced traffic congestion. Many valued the safety and community, but indicated they are increasingly concerned about rapid development, particularly of high-density housing without adequate infrastructure like roads and parks. There was frustration expressed about noise pollution from Hill Air Force Base’s F-35 jets, impacting quality of life significantly. Respondents mentioned desire for more recreational facilities and cultural amenities. There were also comments expressing that city leadership should prioritize resident input and address infrastructure needs before further development.