Logan Wellbeing Survey Findings 2024
By Dr. Courtney Flint and Team
![]()
Contact Information
Dr. Courtney Flint
courtney.flint@usu.edu
435-797-8635
Summary
Logan is one of 51 cities participating in the Utah Wellbeing Survey Project in 2024. This project is designed to assess the wellbeing and local perspectives of city residents and to provide information to city leaders to inform general planning processes. Additional analysis is underway and this report may be updated over time.
We are grateful to all those who took the survey and to our city partners who helped to make this possible. We are grateful to a number of entities for funding: the Utah League of Cities and Towns, USU Extension, USU’s Institute for Land Water and Air, the Wasatch Front Regional Council, Utah Department of Transportation, the Utah Agricultural Experiment Station, and the cities of Alpine, Cedar Hills, Draper, Millcreek, Nephi, North Salt Lake, Ogden, Orem, Pleasant Grove, Providence, Springdale, Tremonton, West Bountiful, and West Valley City.
This report describes findings from the 2024 Logan survey and comparative information with other project cities. In March, April, and May 2024, Logan City advertised the survey for residents largely through flyers, neighborhood meetings, social media, and the city website. All city residents age 18+ were encouraged to take the online Qualtrics survey.
How many people responded?
- 757 viable surveys were recorded in this 2024 survey effort.
- The Logan 2022 survey had 476 responses and the Logan 2021 survey had 563 responses.
- The adult population of Logan was estimated at 41,034, based on the American Community Survey by the U.S. Census. The 757 survey responses in 2024 represent 1.8% of the adult population and have a conservative margin of error of 3.53%.
Survey Respondent Characteristics
| Resident Statistics | |
|---|---|
| Full Time Residents of Logan | 95.9% |
| Part Time Residents of Logan | 4.1% |
| Length of Residency — Range | 0.2-71 years |
| Length of Residency — Average | 14.6 years |
| Length of Residency — Median | 10 years |
| Length of Residency 5 Years or less | 30.9% |
| ZIP Code | Percent |
|---|---|
| 84321 | 73.4% |
| 84322 | 0.9% |
| 84323 | 0.1% |
| 84339 | 0.7% |
| 84341 | 24.9% |
| City Area | Percent |
|---|---|
| Adams | 17.1% |
| Bridger | 19.4% |
| Ellis | 11.0% |
| Hillcrest | 8.7% |
| Wilson | 18.8% |
| Woodruff | 24.9% |

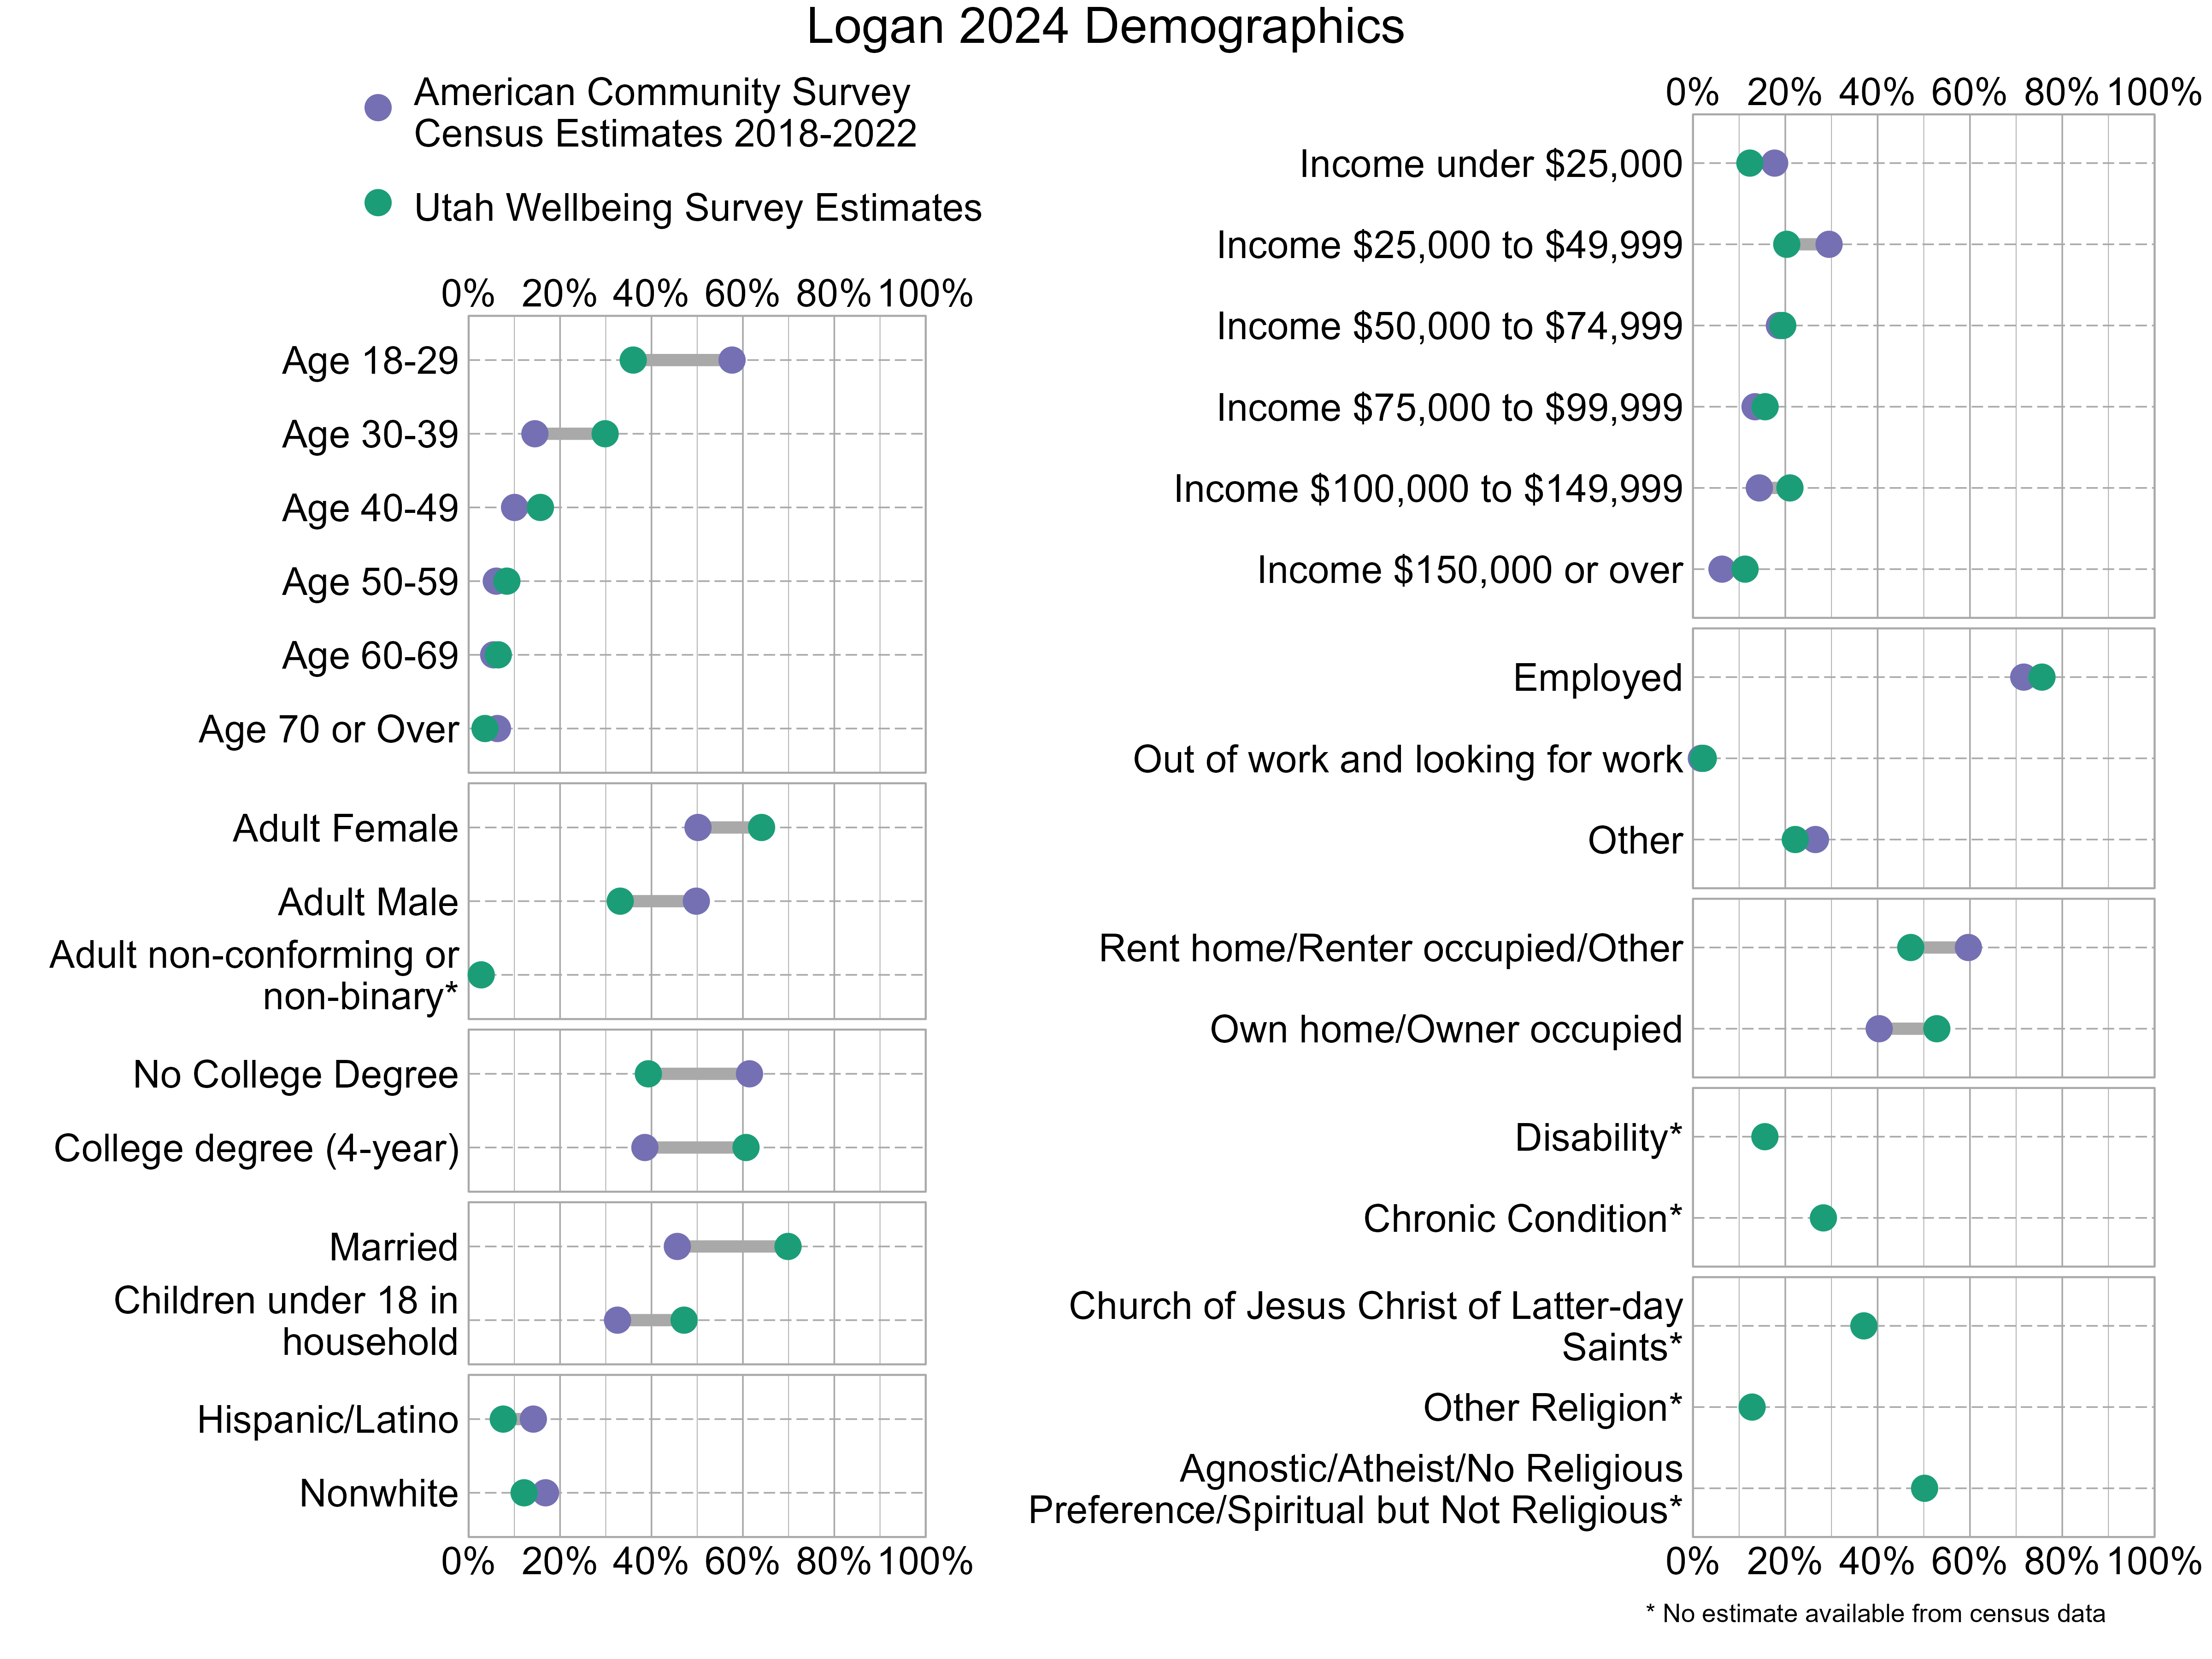
Demographic characteristics of the survey respondents were compared below with U.S. Census information from the 2018-2022 American Community Survey. In the graph below, gray bars indicate differences between the American Community Survey estimates and the Utah Wellbeing Project surveys. The wider the gray bars, the larger the differences. Also note that estimates for religious affiliation, adult non-conforming or non-binary gender, disability, and chronic conditions are unavailable from the census data. There can also be a variable margin of error in the American Community Survey estimates, and caution should be used when comparing estimates. Not all respondents provided demographic information. As the graph shows, 2024 survey respondents were not fully representative of Logan. People who are age 30-39, have at least a 4-year college degree, and are married were overrepresented while those who are age 18-29, are adult males, and do not have a college degree were underrepresented.
Overall Personal Wellbeing and Overall Wellbeing in Logan
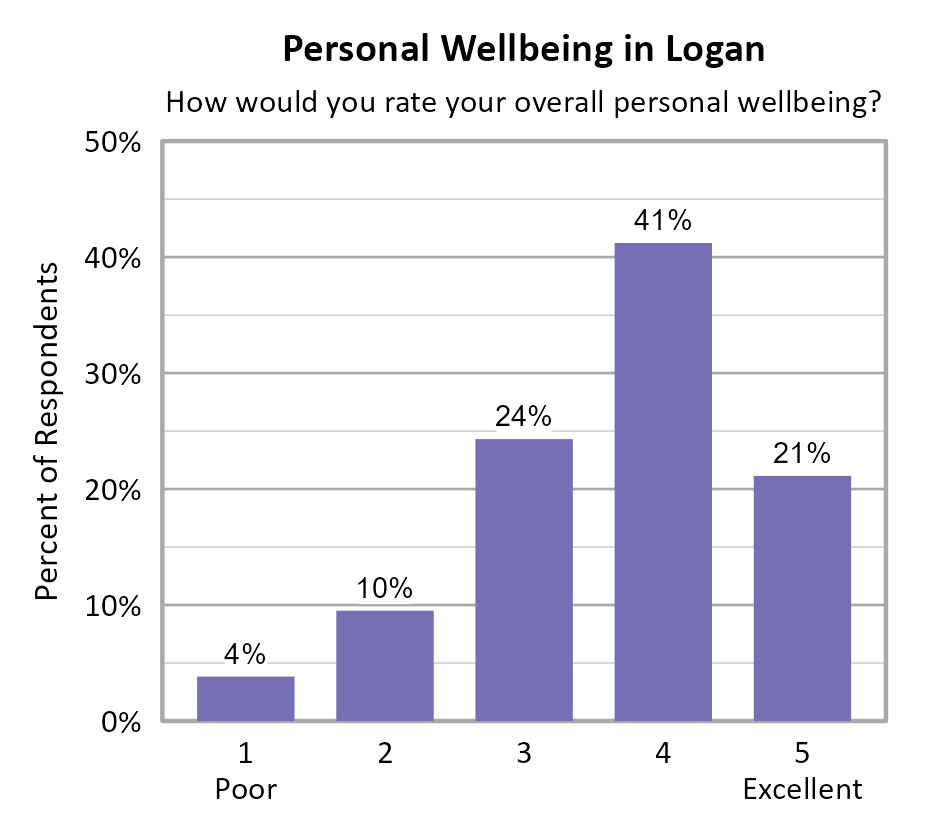
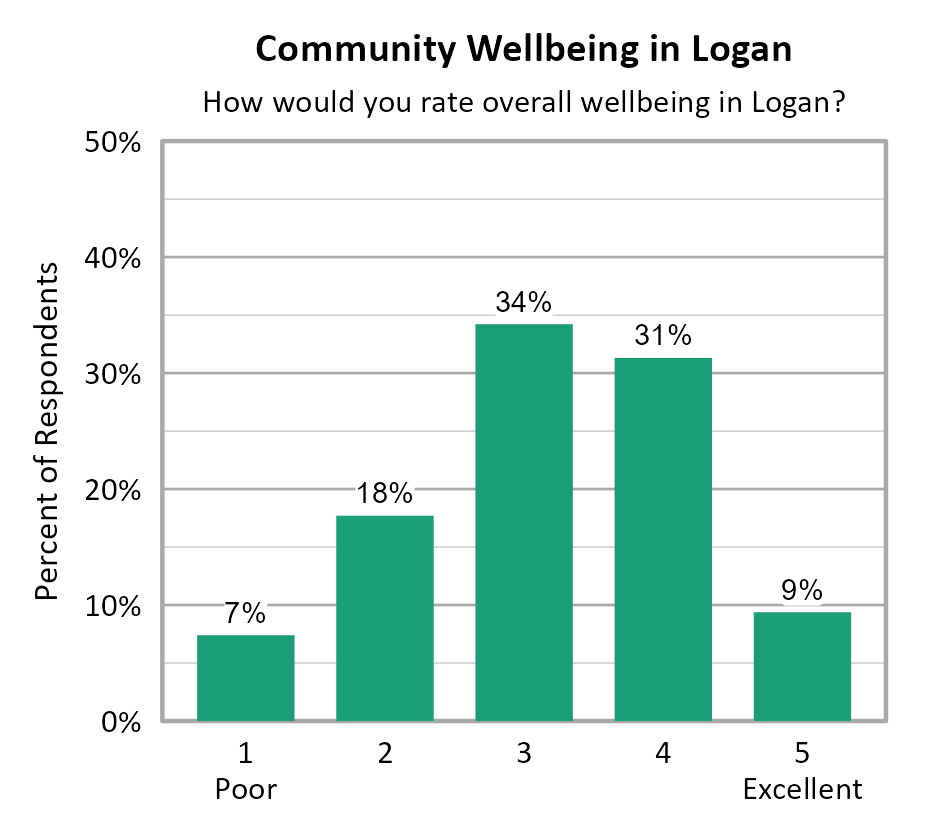
Survey participants were asked about their overall personal wellbeing and overall community wellbeing in Logan. These wellbeing indicators were both measured on a 5-point scale from poor (1) to excellent (5). The average personal wellbeing score in Logan was 3.66 with 62% of respondents indicating their wellbeing at a 4 or 5 on the 5-point scale. The average score for community wellbeing in Logan was 3.18 with 41% of respondents indicating community wellbeing at a 4 or 5 on the 5-point scale. There was no statistically significant difference in personal wellbeing scores among the city districts. However, Adams and Hillcrest districts were both significantly higher than the Bridger district in terms of community wellbeing.
When comparing survey data from Logan over the years as shown in the information below, we can see that the average personal wellbeing score improved between 2021 and 2022, and declined between 2022 and 2024. The average community wellbeing score remained nearly the same between 2021 and 2022, and declined between 2022 and 2024. Note that the number of respondents differed between years, there is no tracking of individuals from one year to the next, and the low end of the scale was "Poor" in 2024 but "Very Poor" in prior years which may account for differences in scores over time.

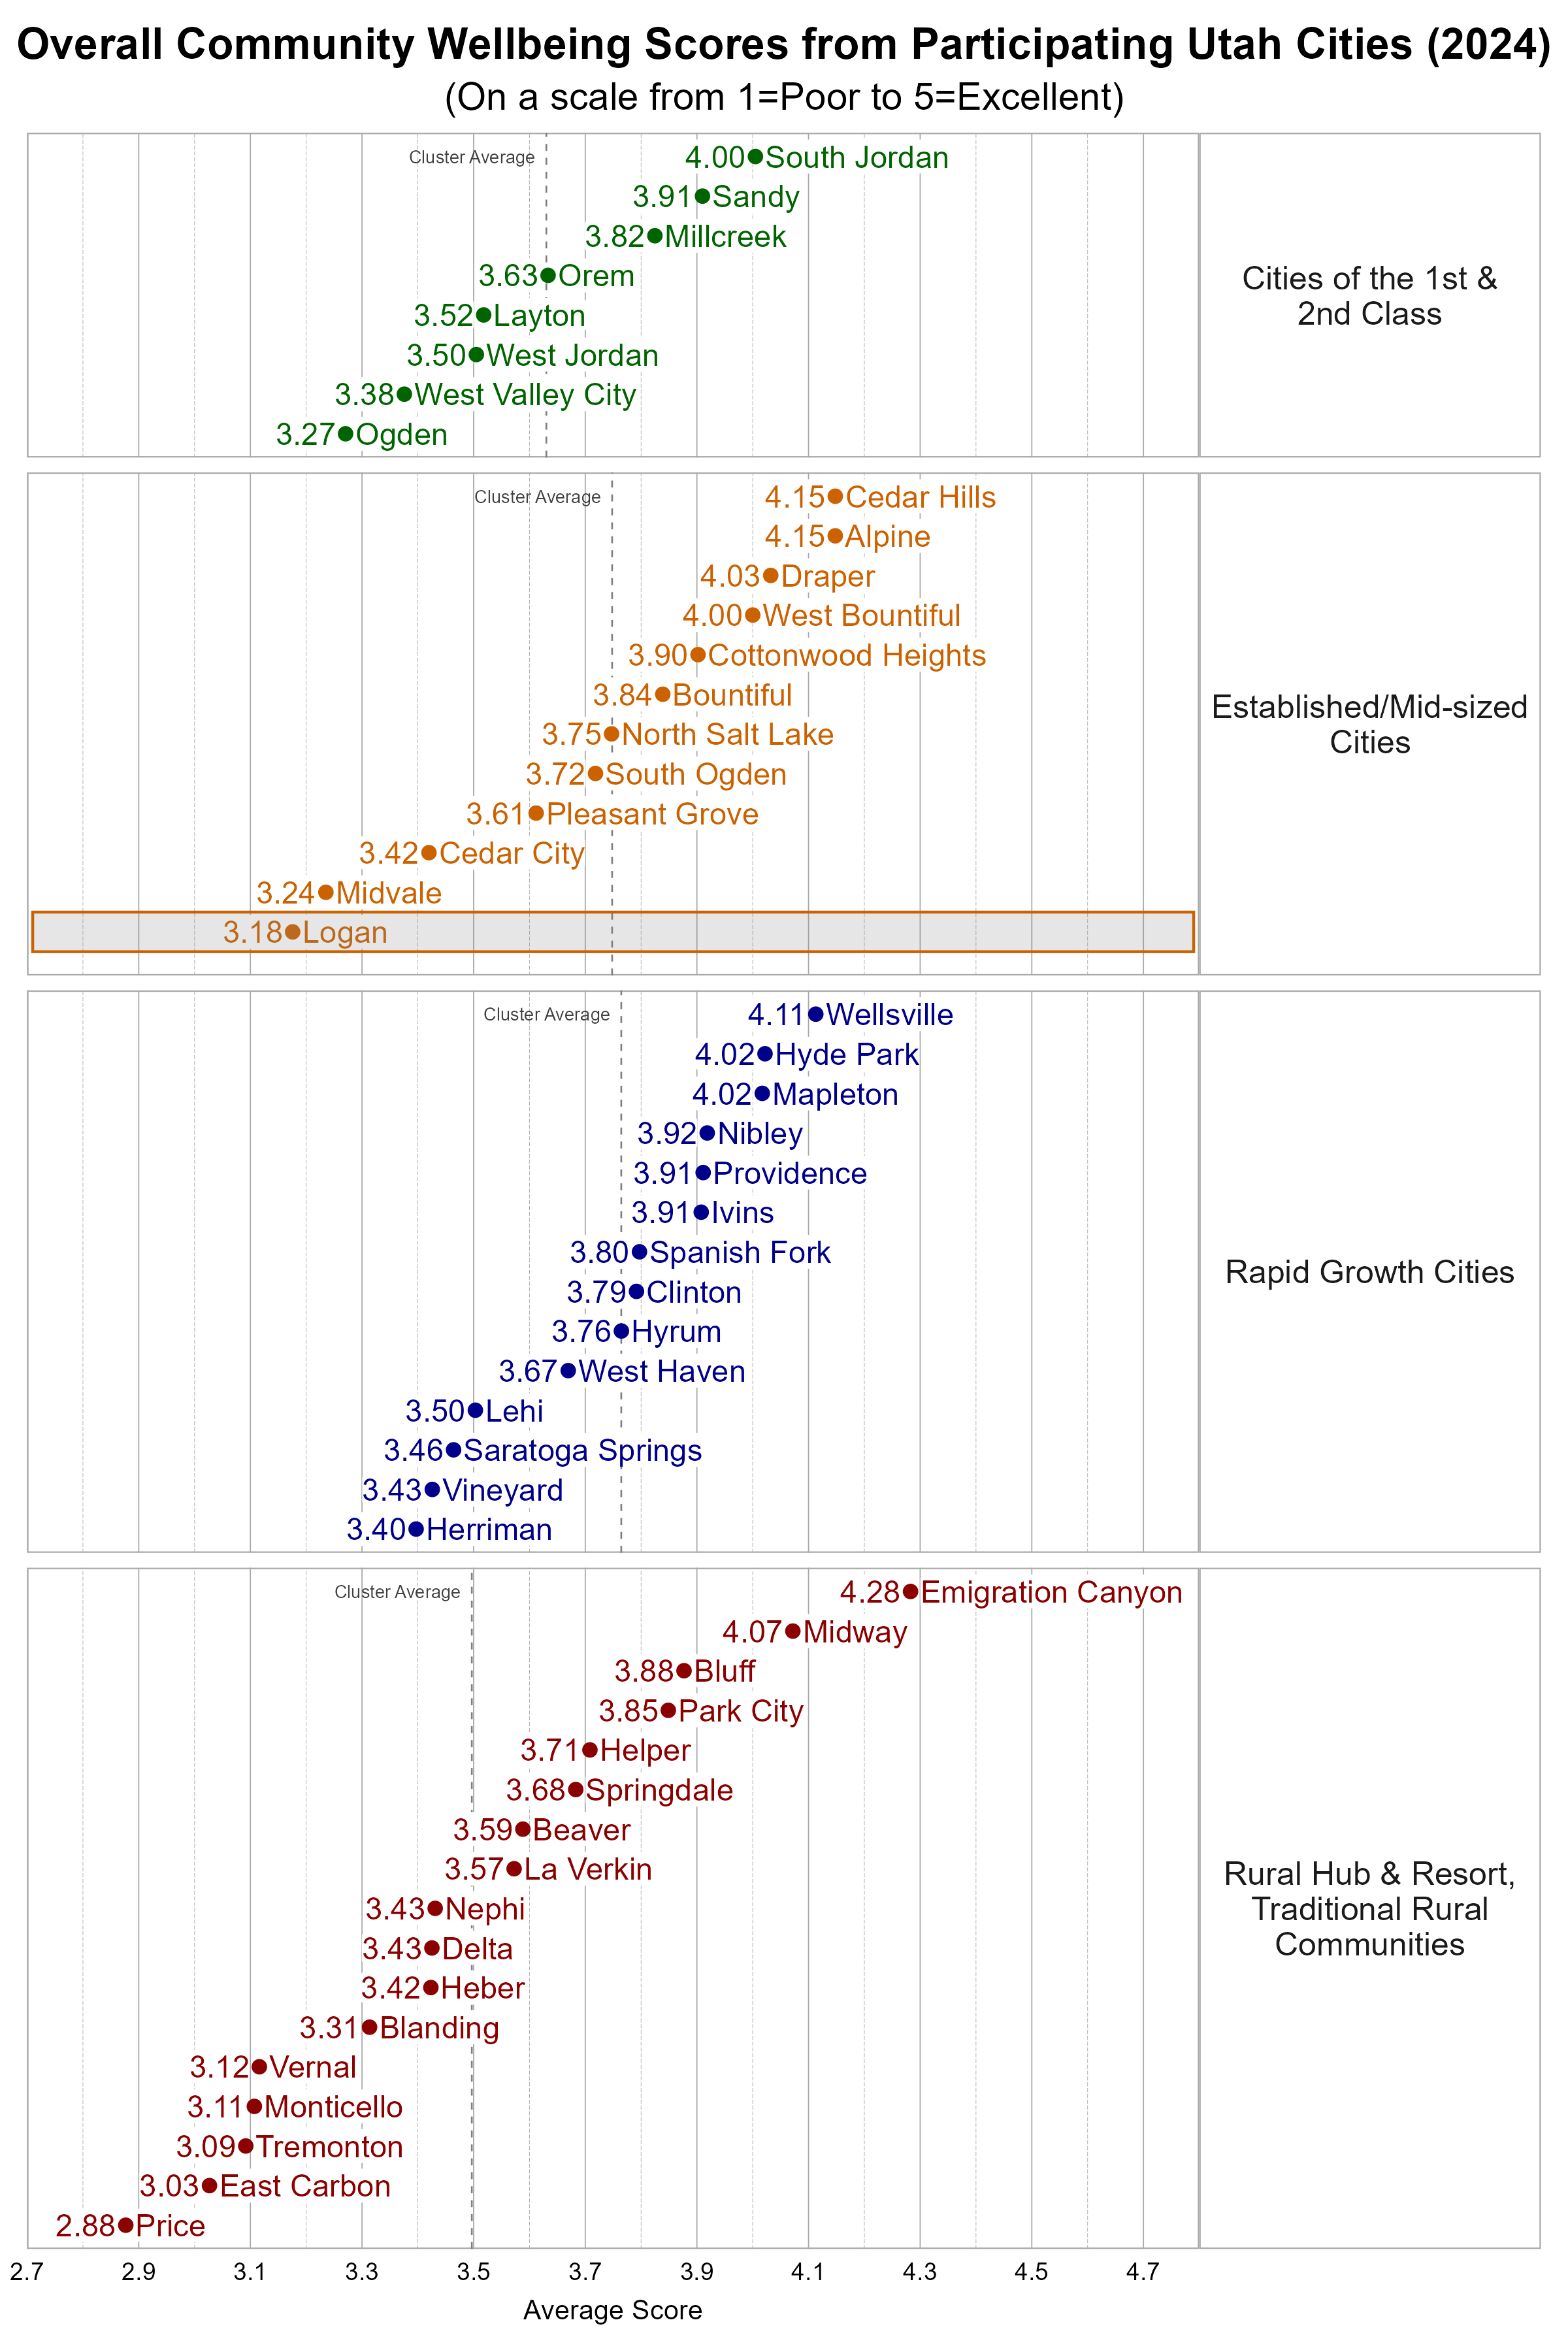
Comparing Wellbeing Across Utah Cities
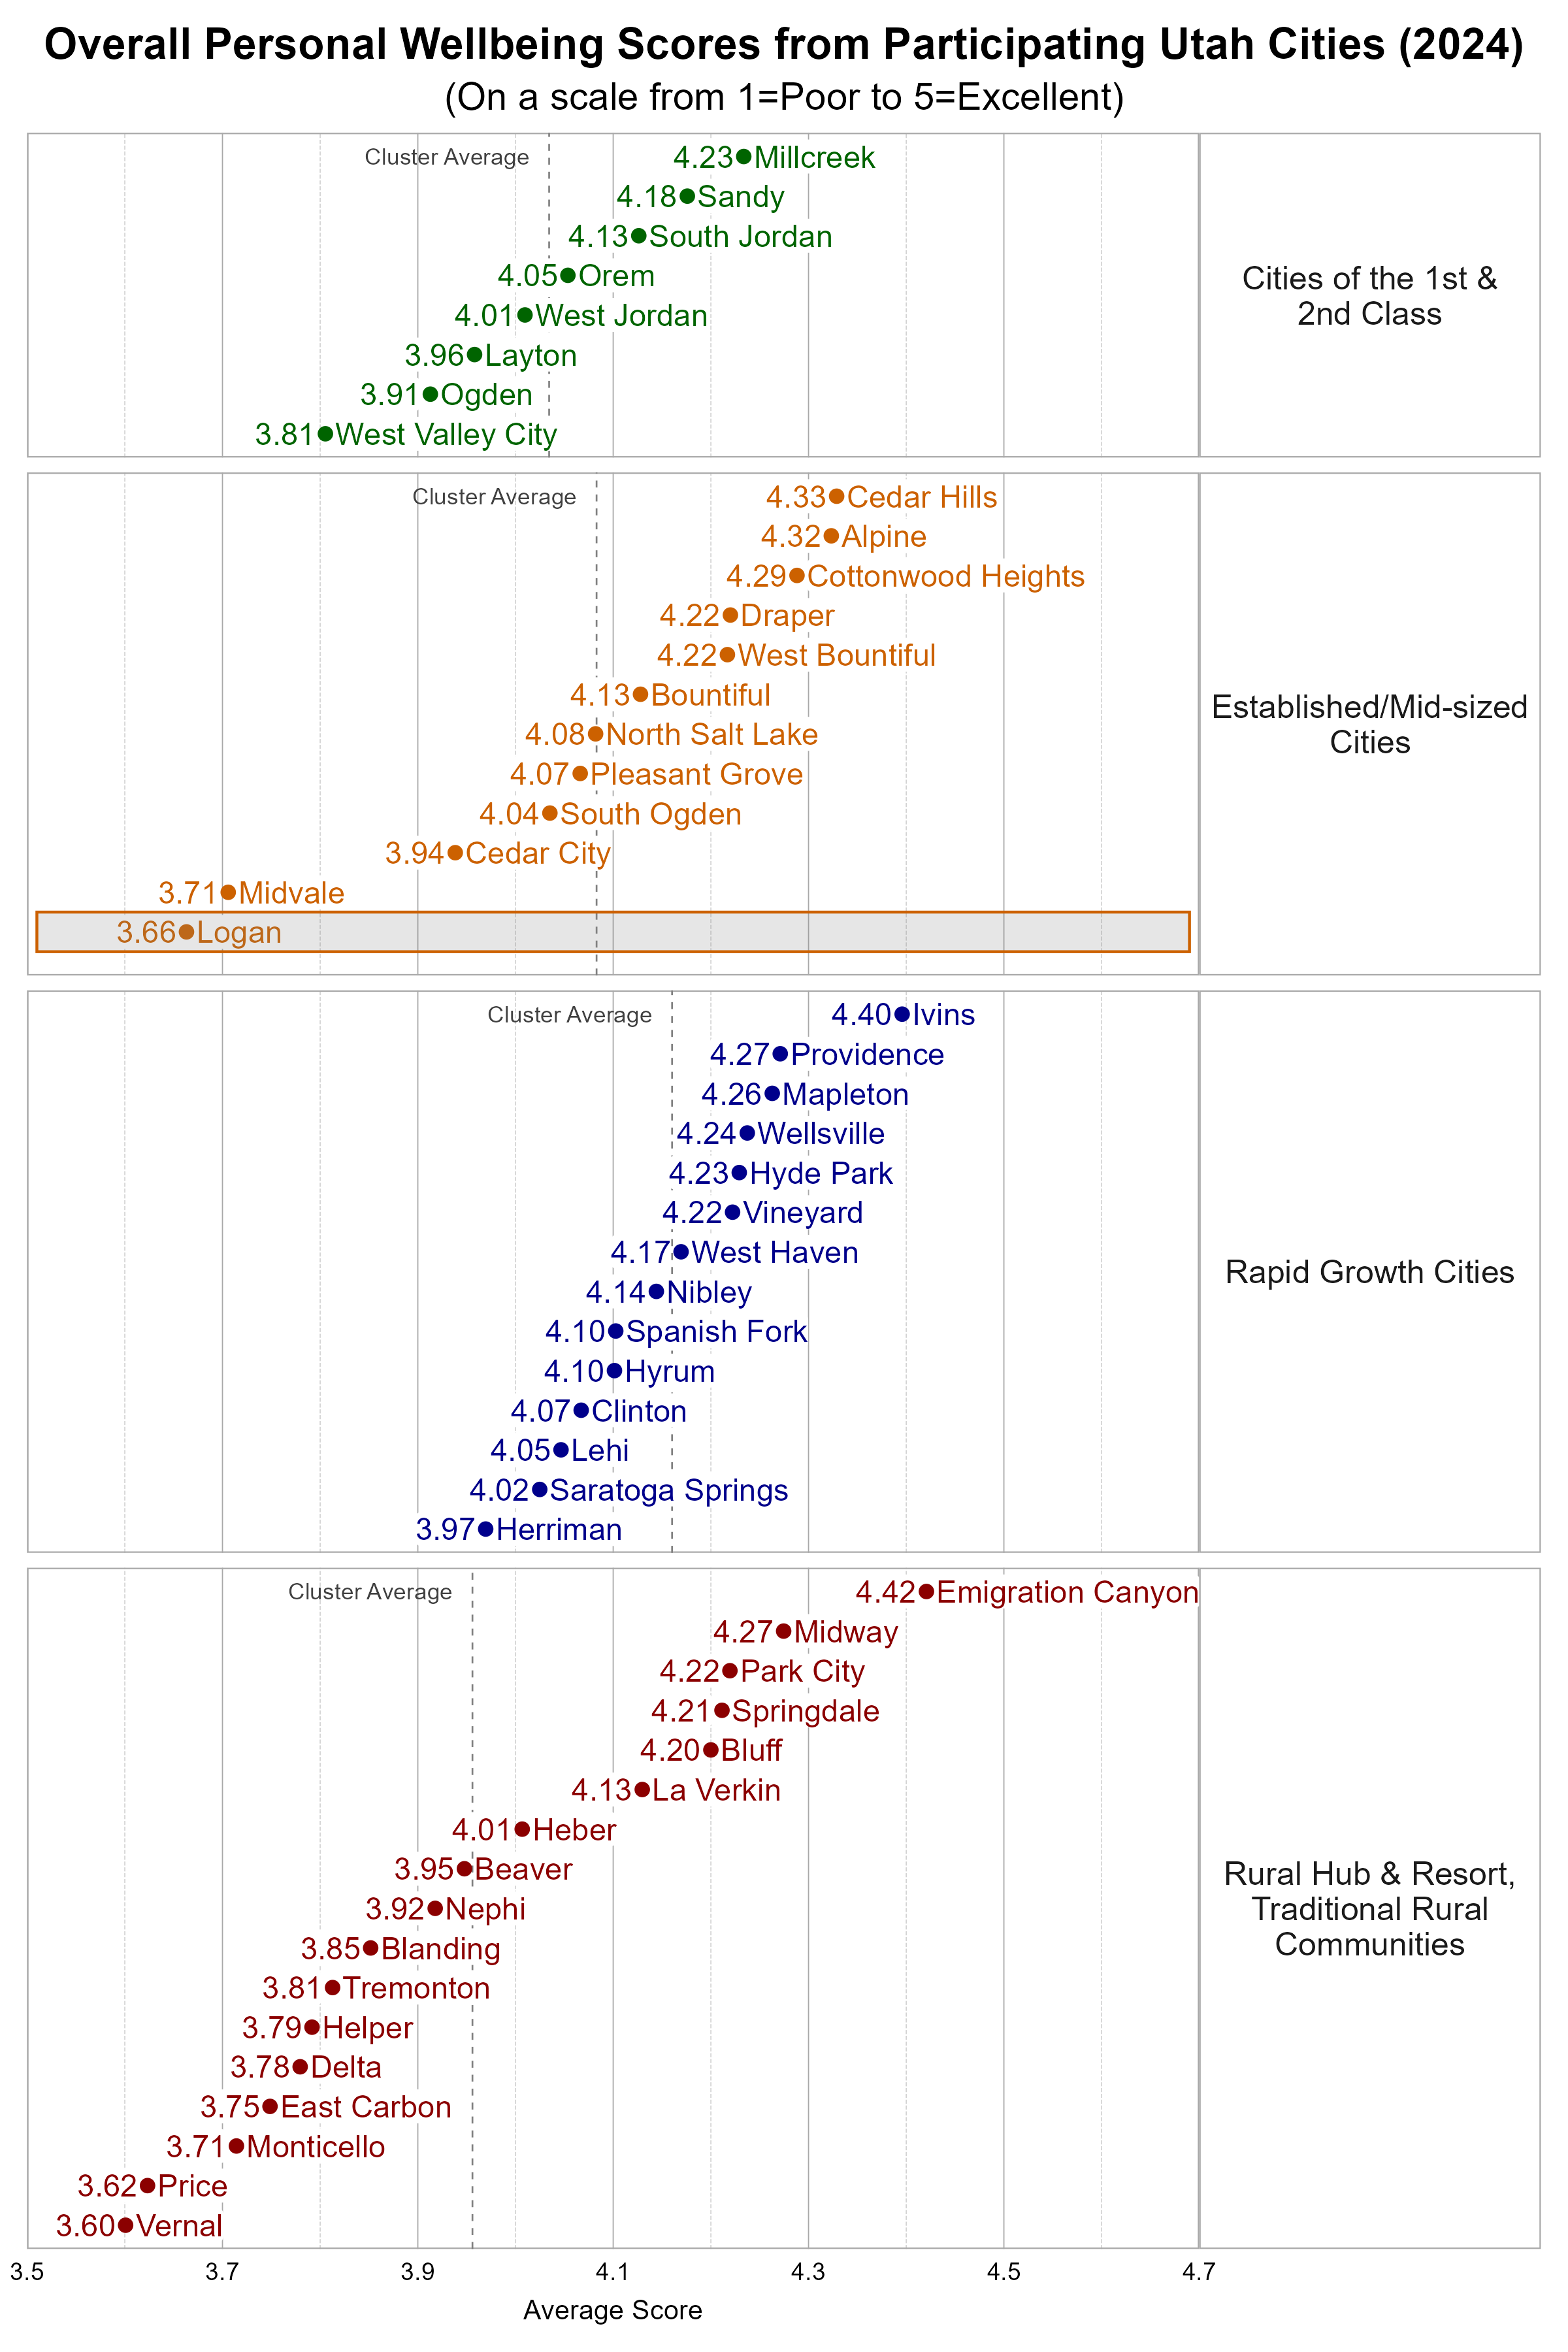
The Utah League of Cities and Towns clusters cities and towns into five different categories based on size and growth rates. We utilize these clusters in our analysis. Logan is classified as an Established/Mid-sized City. Some cities may fit within more than one cluster.
Within the more Urban city cluster, Logan was below the average overall personal wellbeing score and below the average overall community wellbeing score.
Wellbeing Domains in Logan
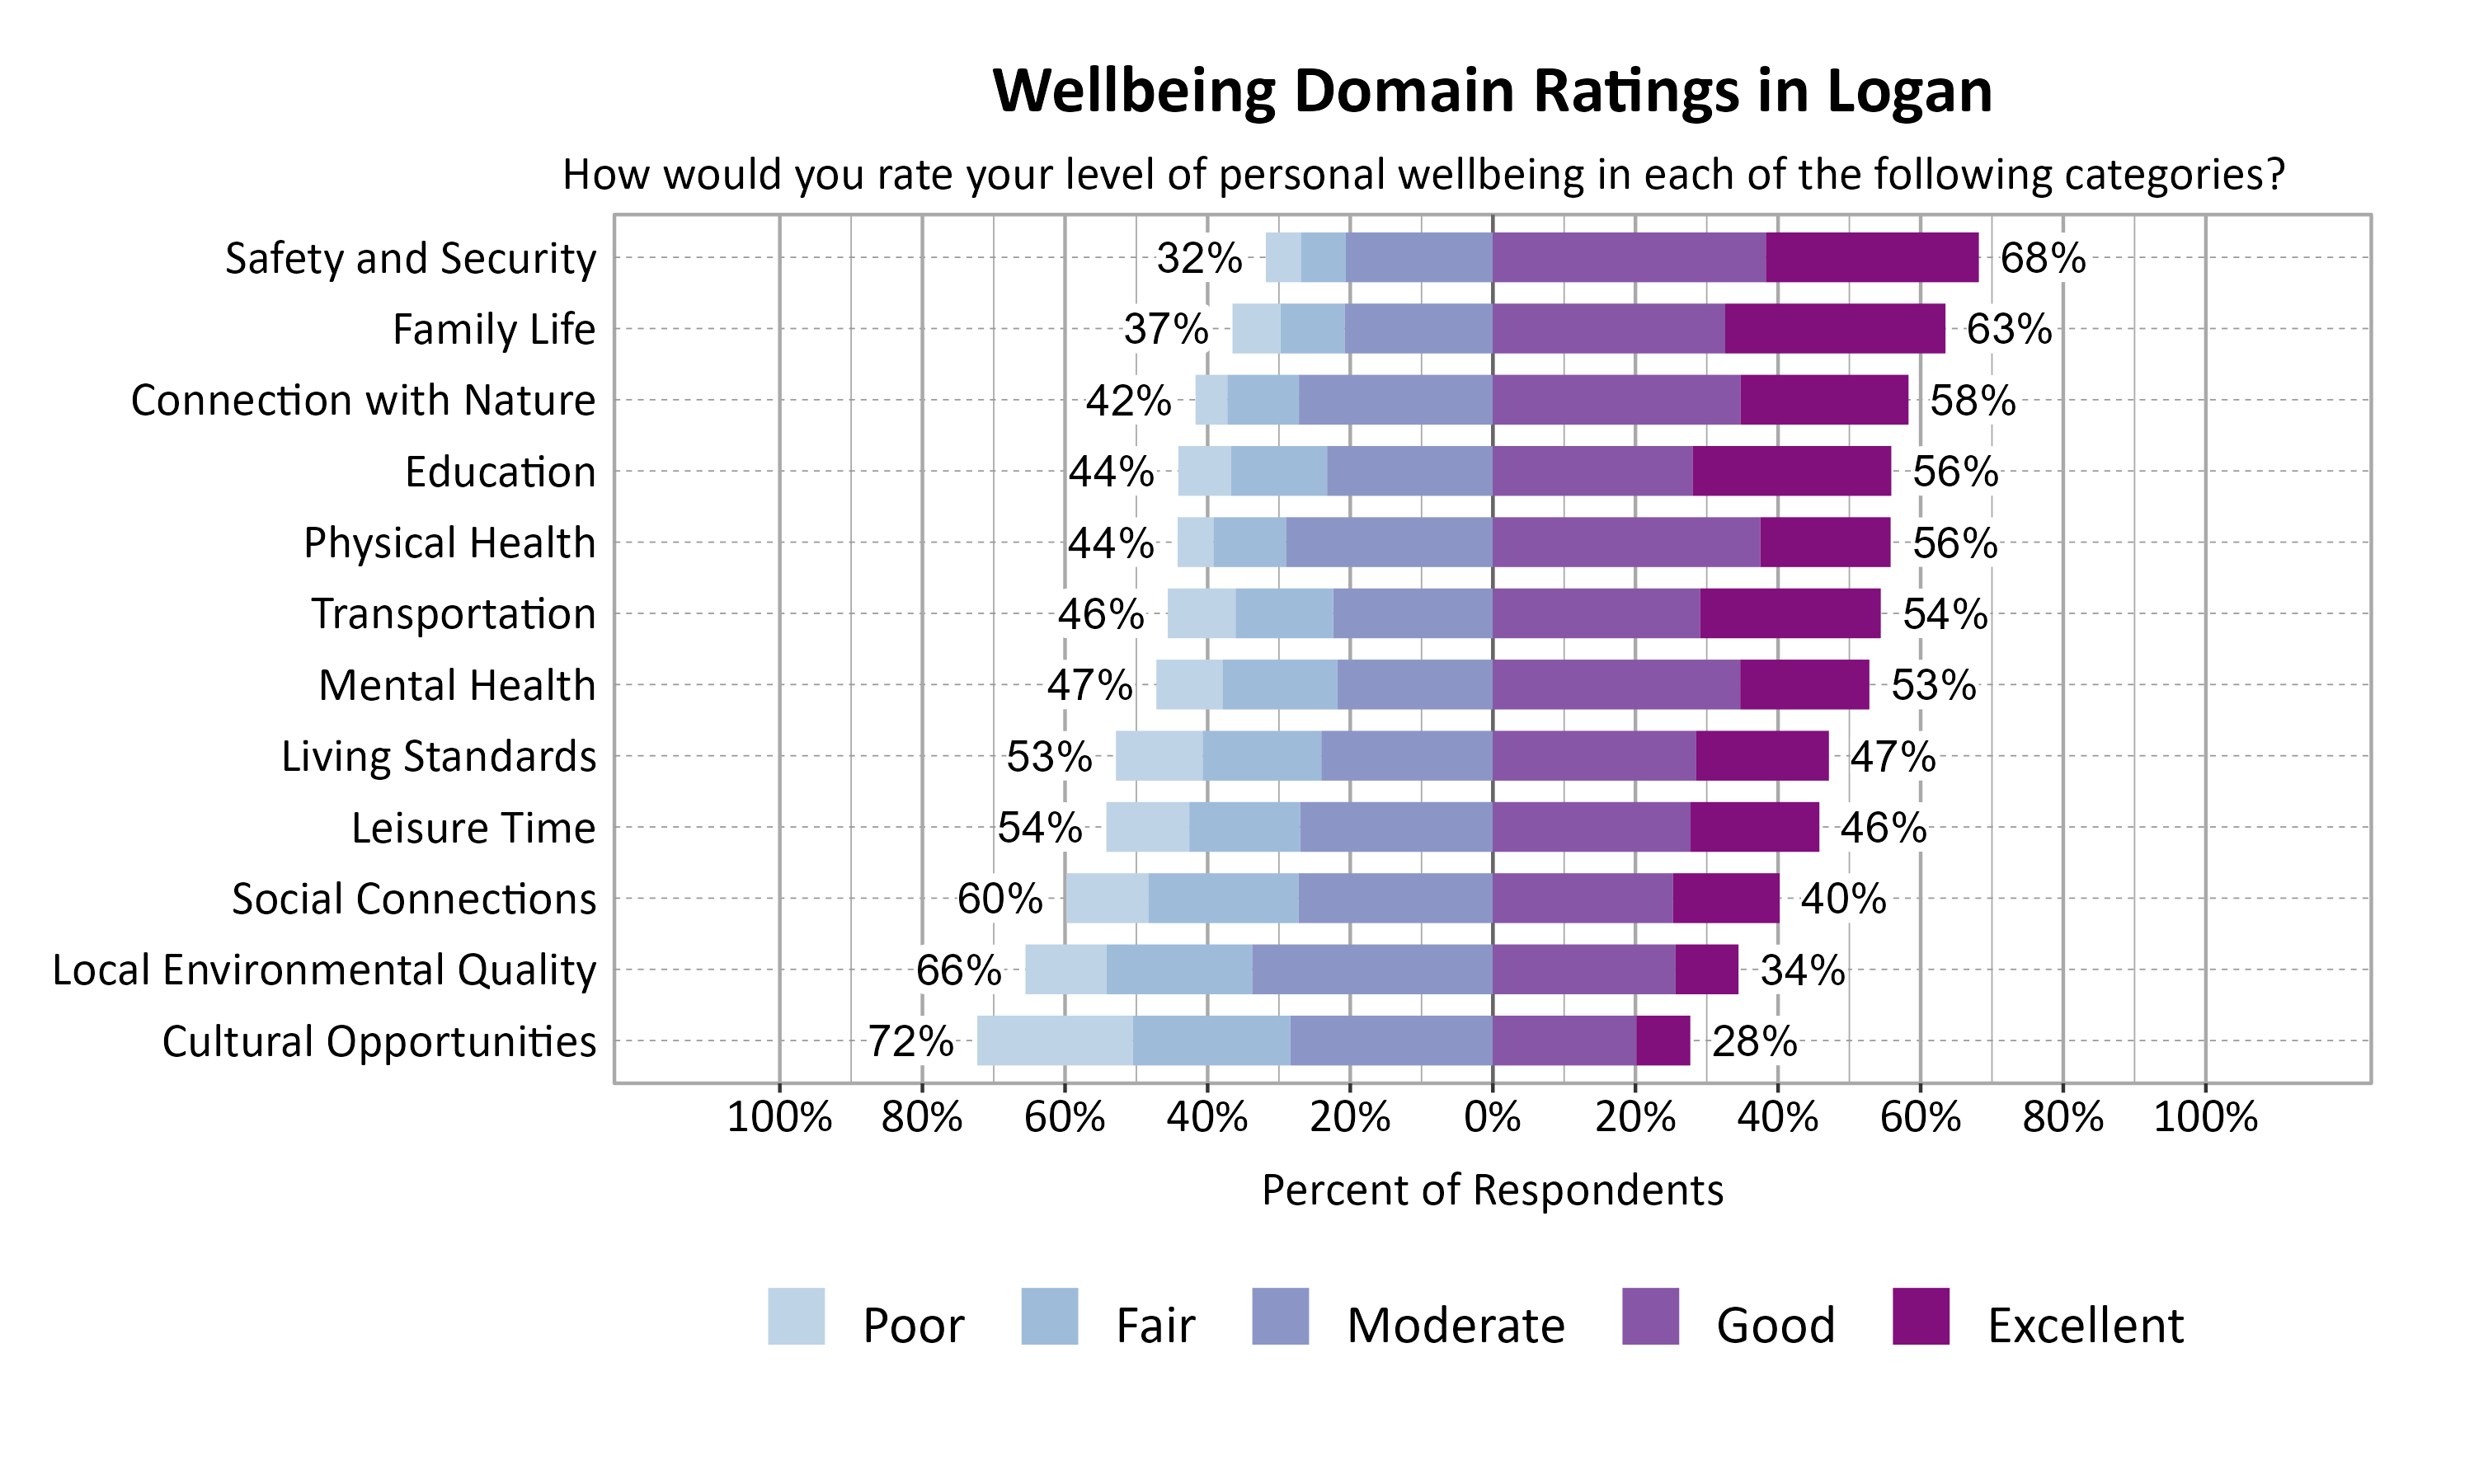
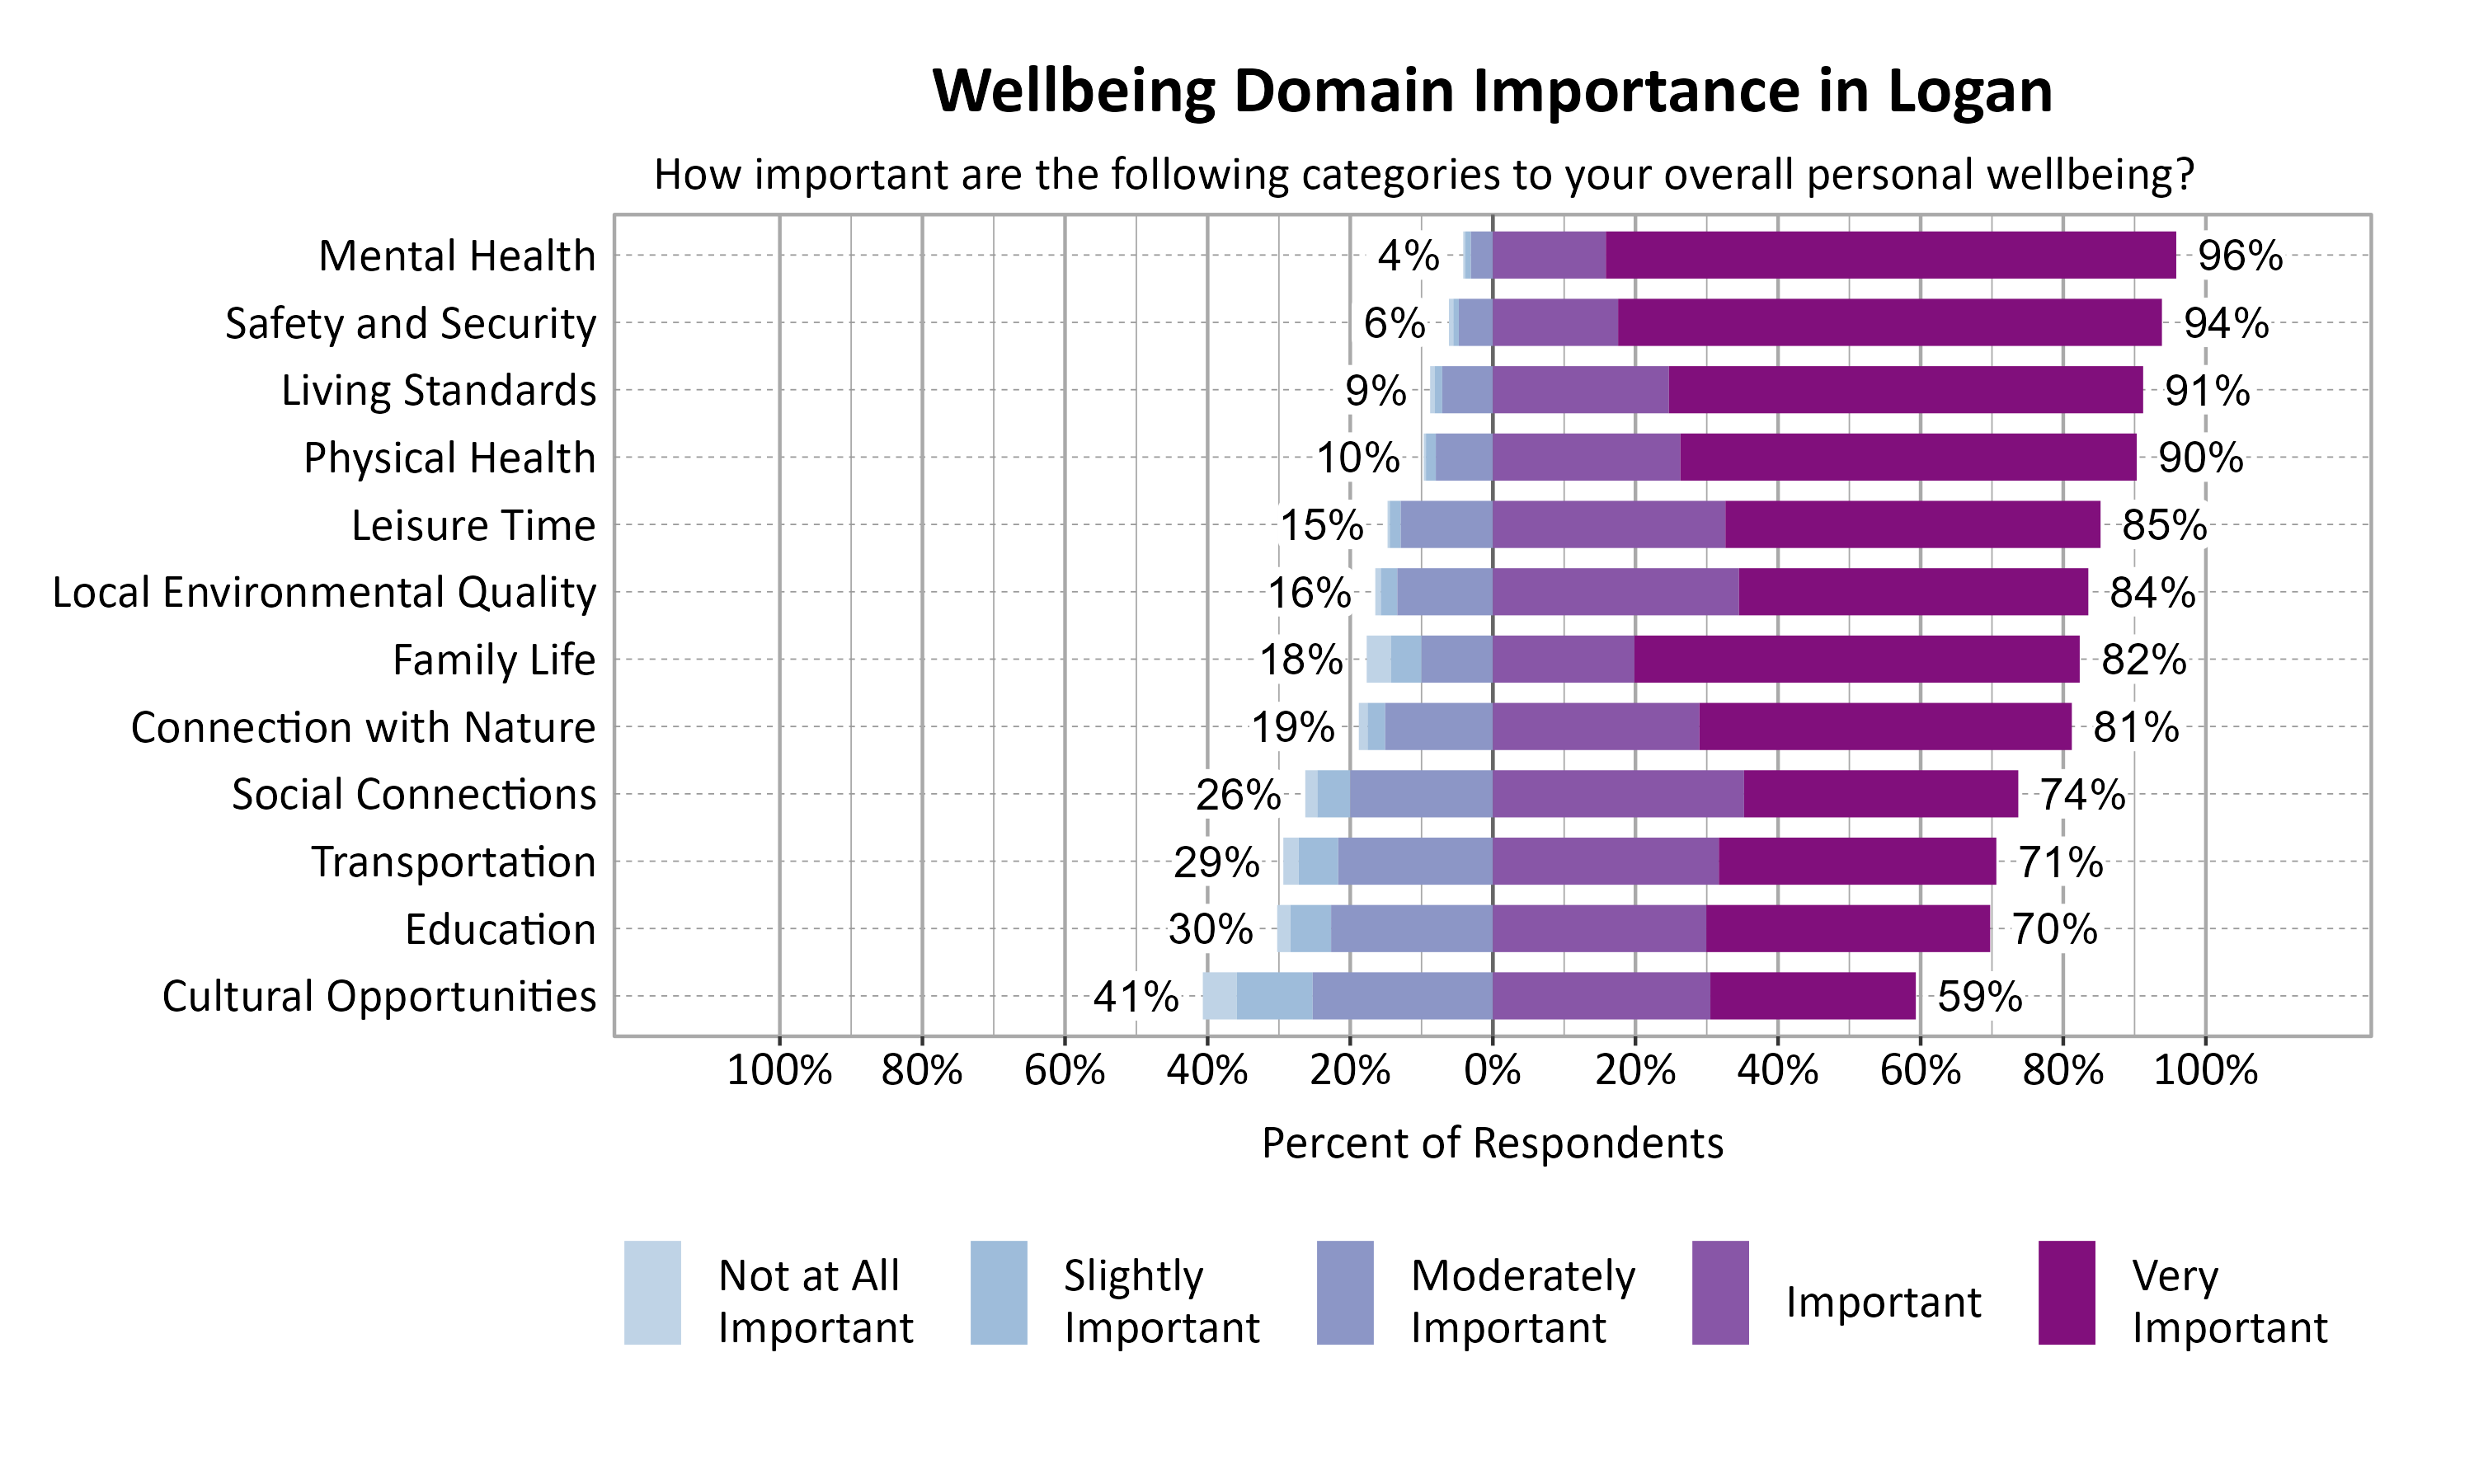
According to national and international entities that track wellbeing, there are a number of common dimensions or domains of wellbeing. Survey respondents rated twelve domains on a 5-point scale from poor to excellent. They were also asked to indicate the importance of each domain to their overall personal wellbeing on a 5-point scale from not at all important to very important. The highest rated wellbeing domains for respondents in Logan were Safety and Security (68%), Family Life (63%), and Connection with Nature (58%). The most important wellbeing domains were Mental Health (96%), Safety and Security (94%), Living Standards (91%), and Physical Health (90%).
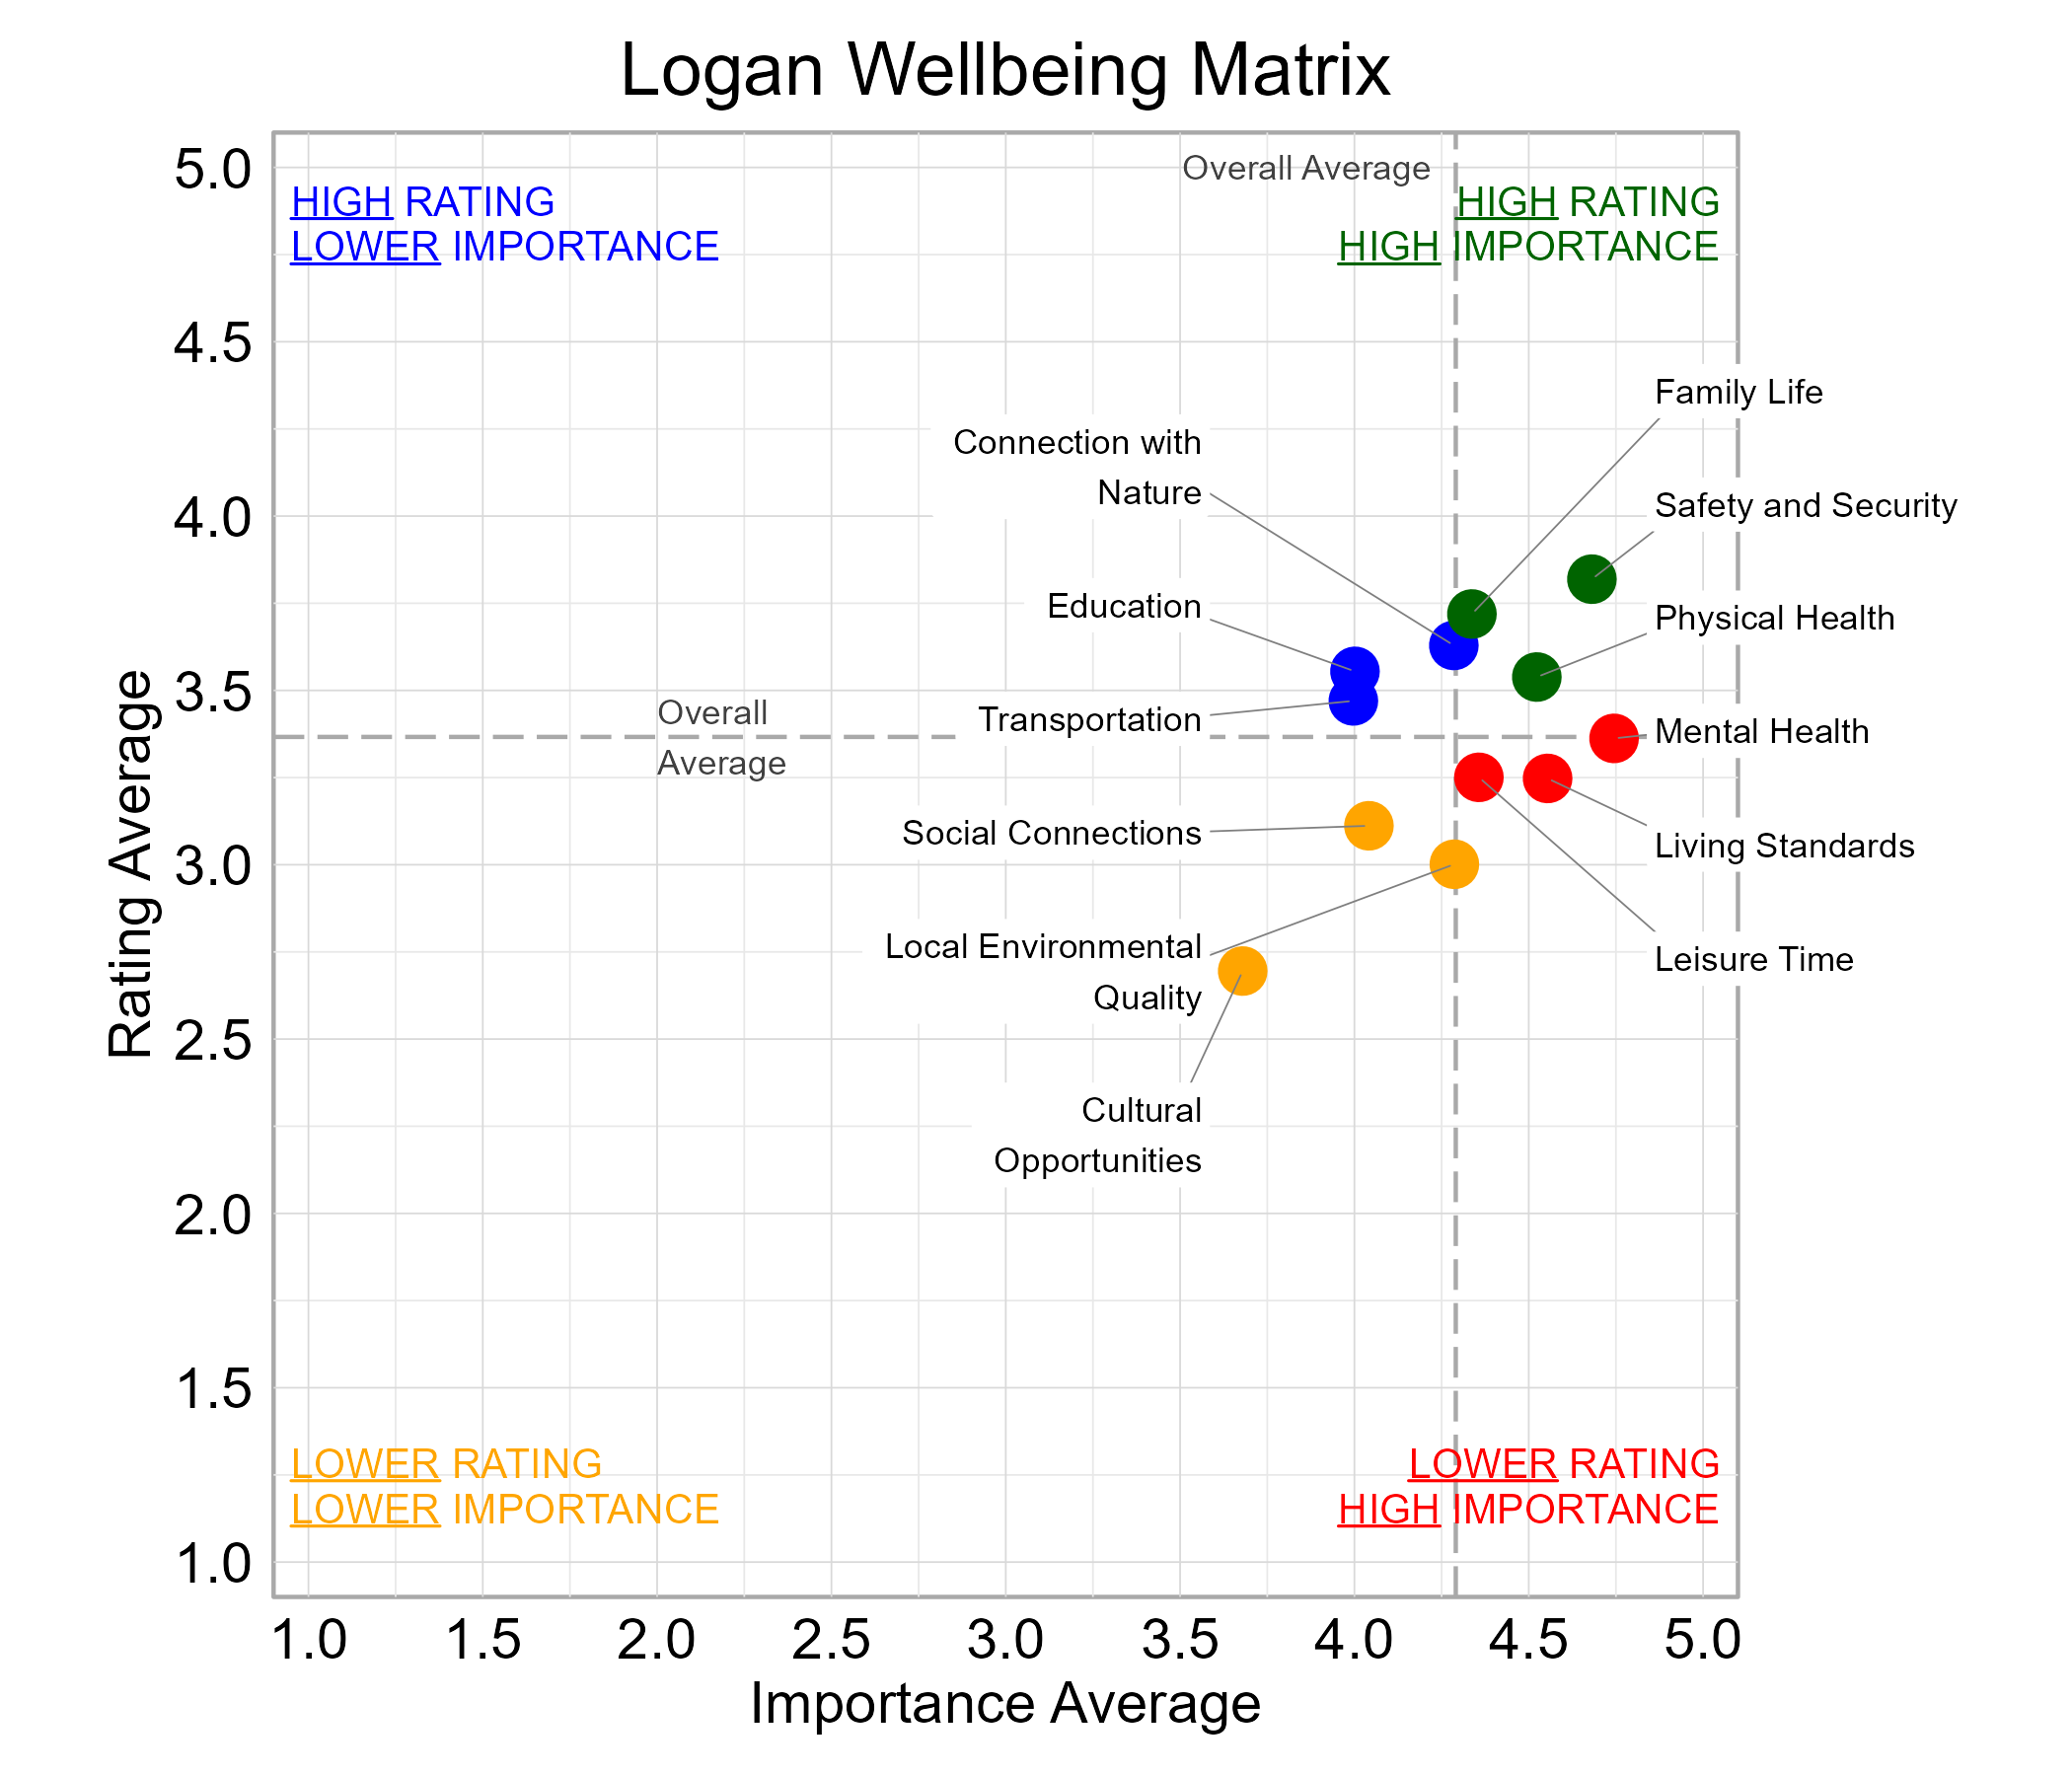
Wellbeing Matrix for Logan
The graph below illustrates the relationship between the average rating and the average importance of wellbeing domains for survey respondents from Logan. Family Life, Physical Health, and Safety and Security were highly important and rated above average among the domains. Leisure Time, Living Standards, and Mental Health fell in the “red zone” of higher importance and lower ratings.
Wellbeing Domains Over Time in Logan
The graphs below show how the domains were rated over the years by Logan residents. The number of respondents changed over time. Note that the two domains Family Life and Transportation were new categories in the 2024 survey and were not measured in previous years. All the domains saw a small drop in ratings from 2022 to 2024. Safety and Security and Connection with Nature were consistently among the top rated domains each survey year, while Cultural Opportunities was among the lowest.

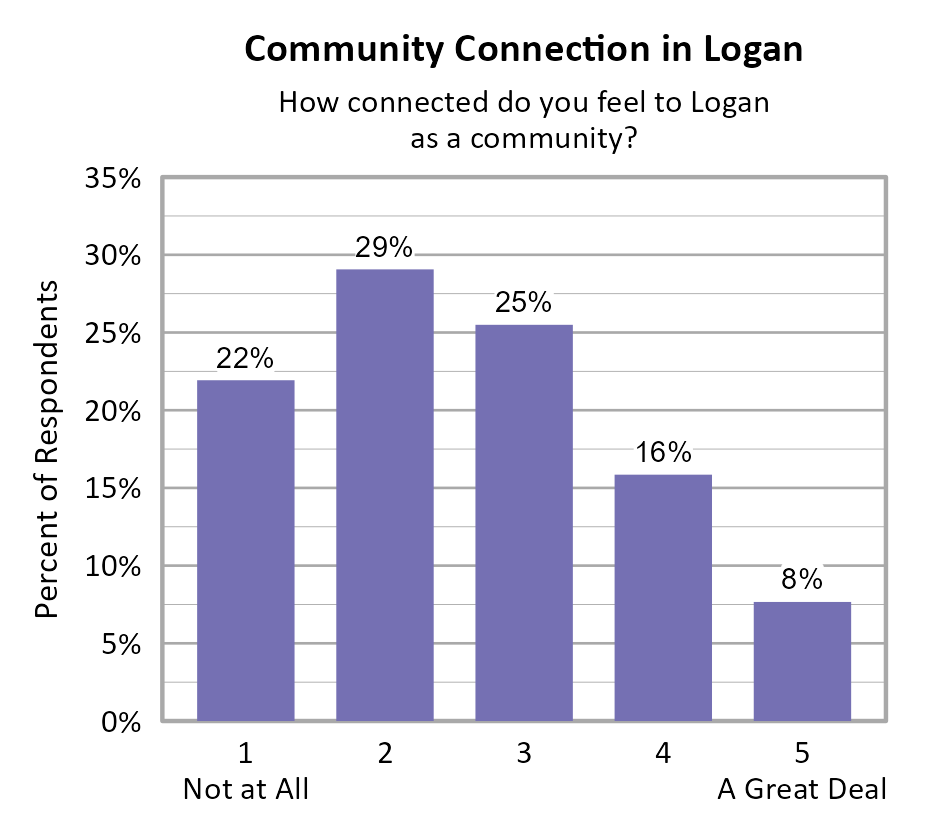
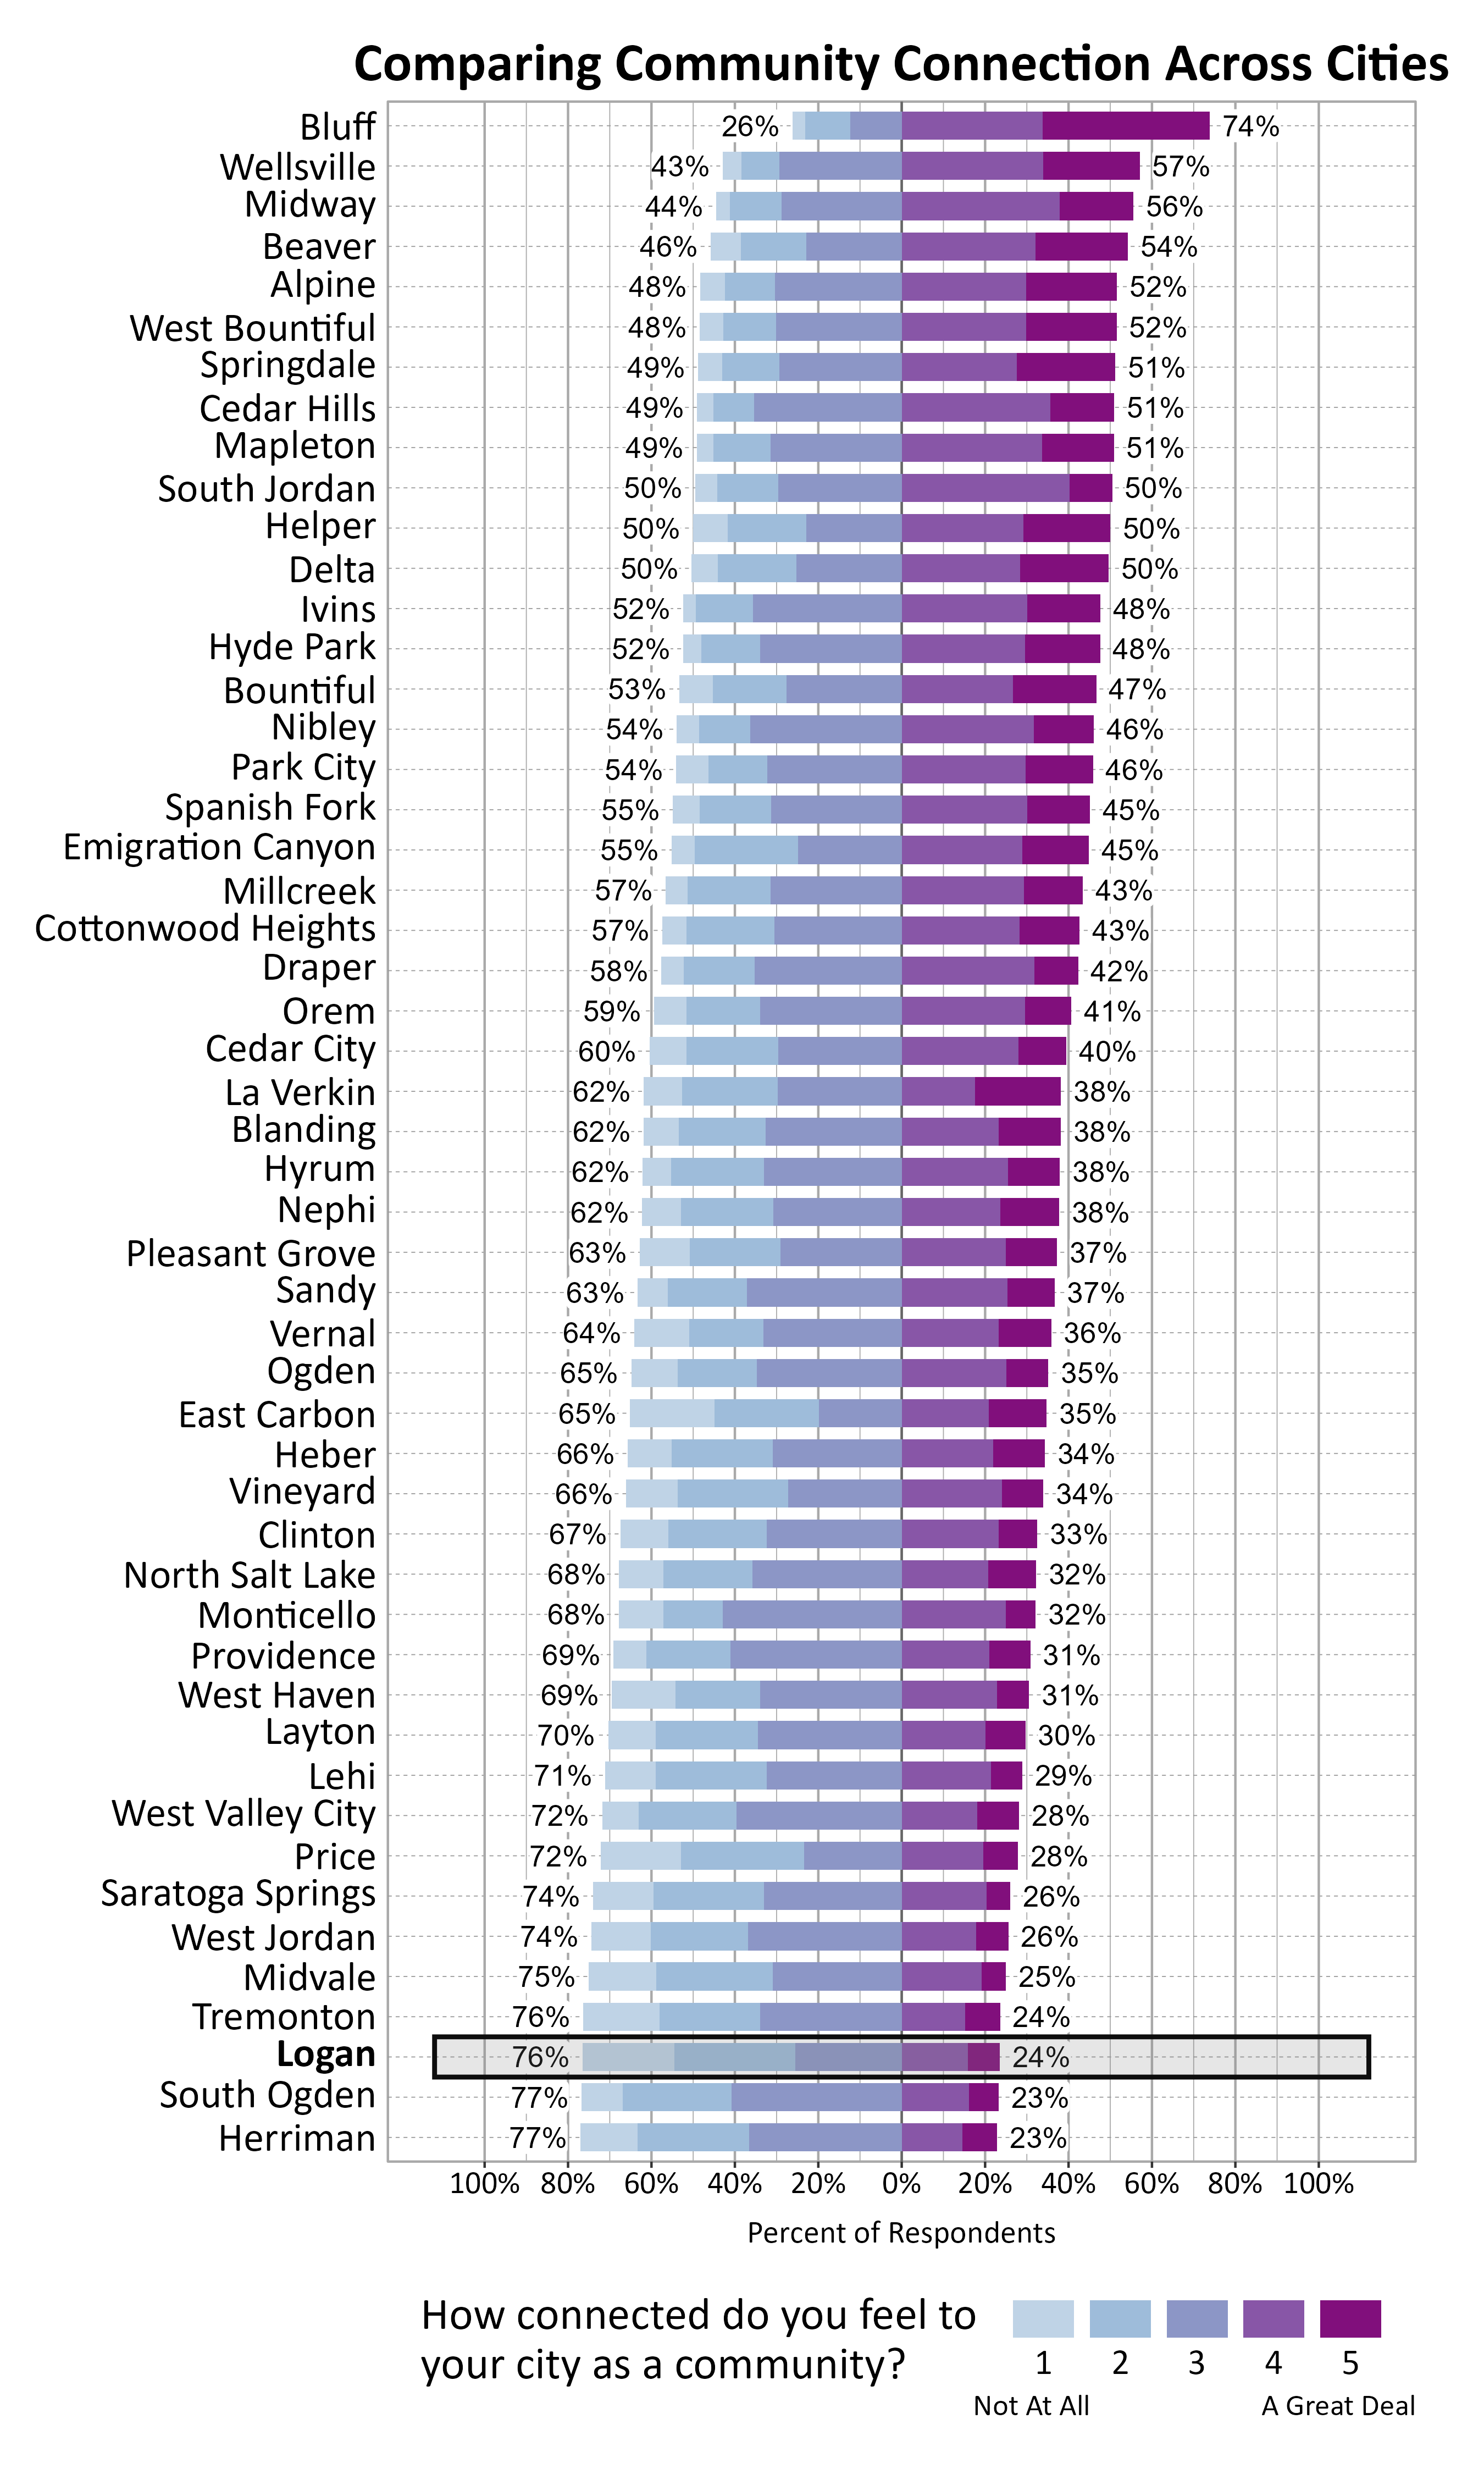
Community Connection in Logan
Survey participants were asked about how connected they feel to Logan on a 5-point scale from not at all (1) to a great deal (5), and the average score of all respondents was 2.58. The Hillcrest and Wilson city districts were both significantly higher than the Bridger and Woodruff city districts in terms of community connection scores.
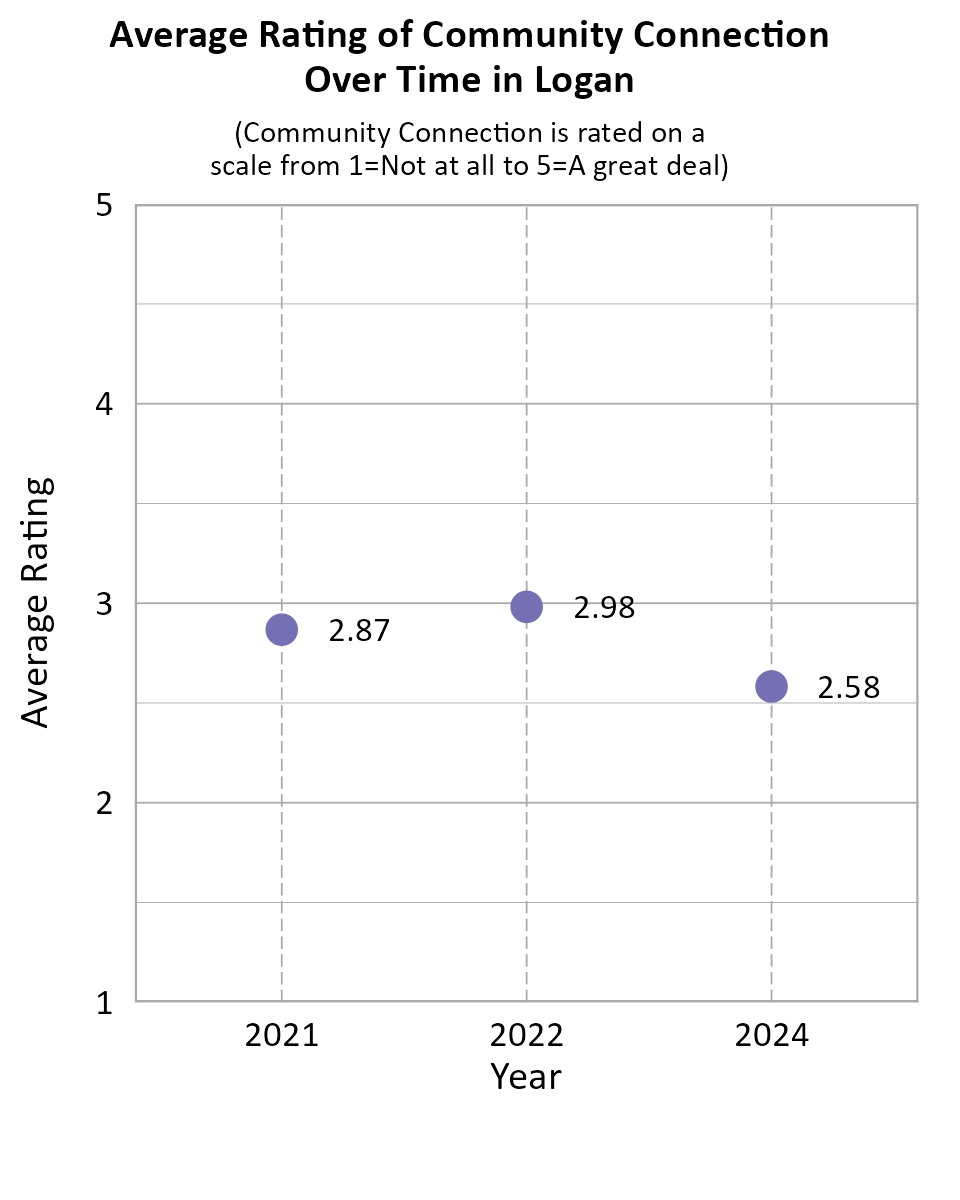
When comparing survey data from Logan over the years as shown in the information below, we can see that the average community connection score improved between 2021 and 2022, and declined between 2022 and 2024.
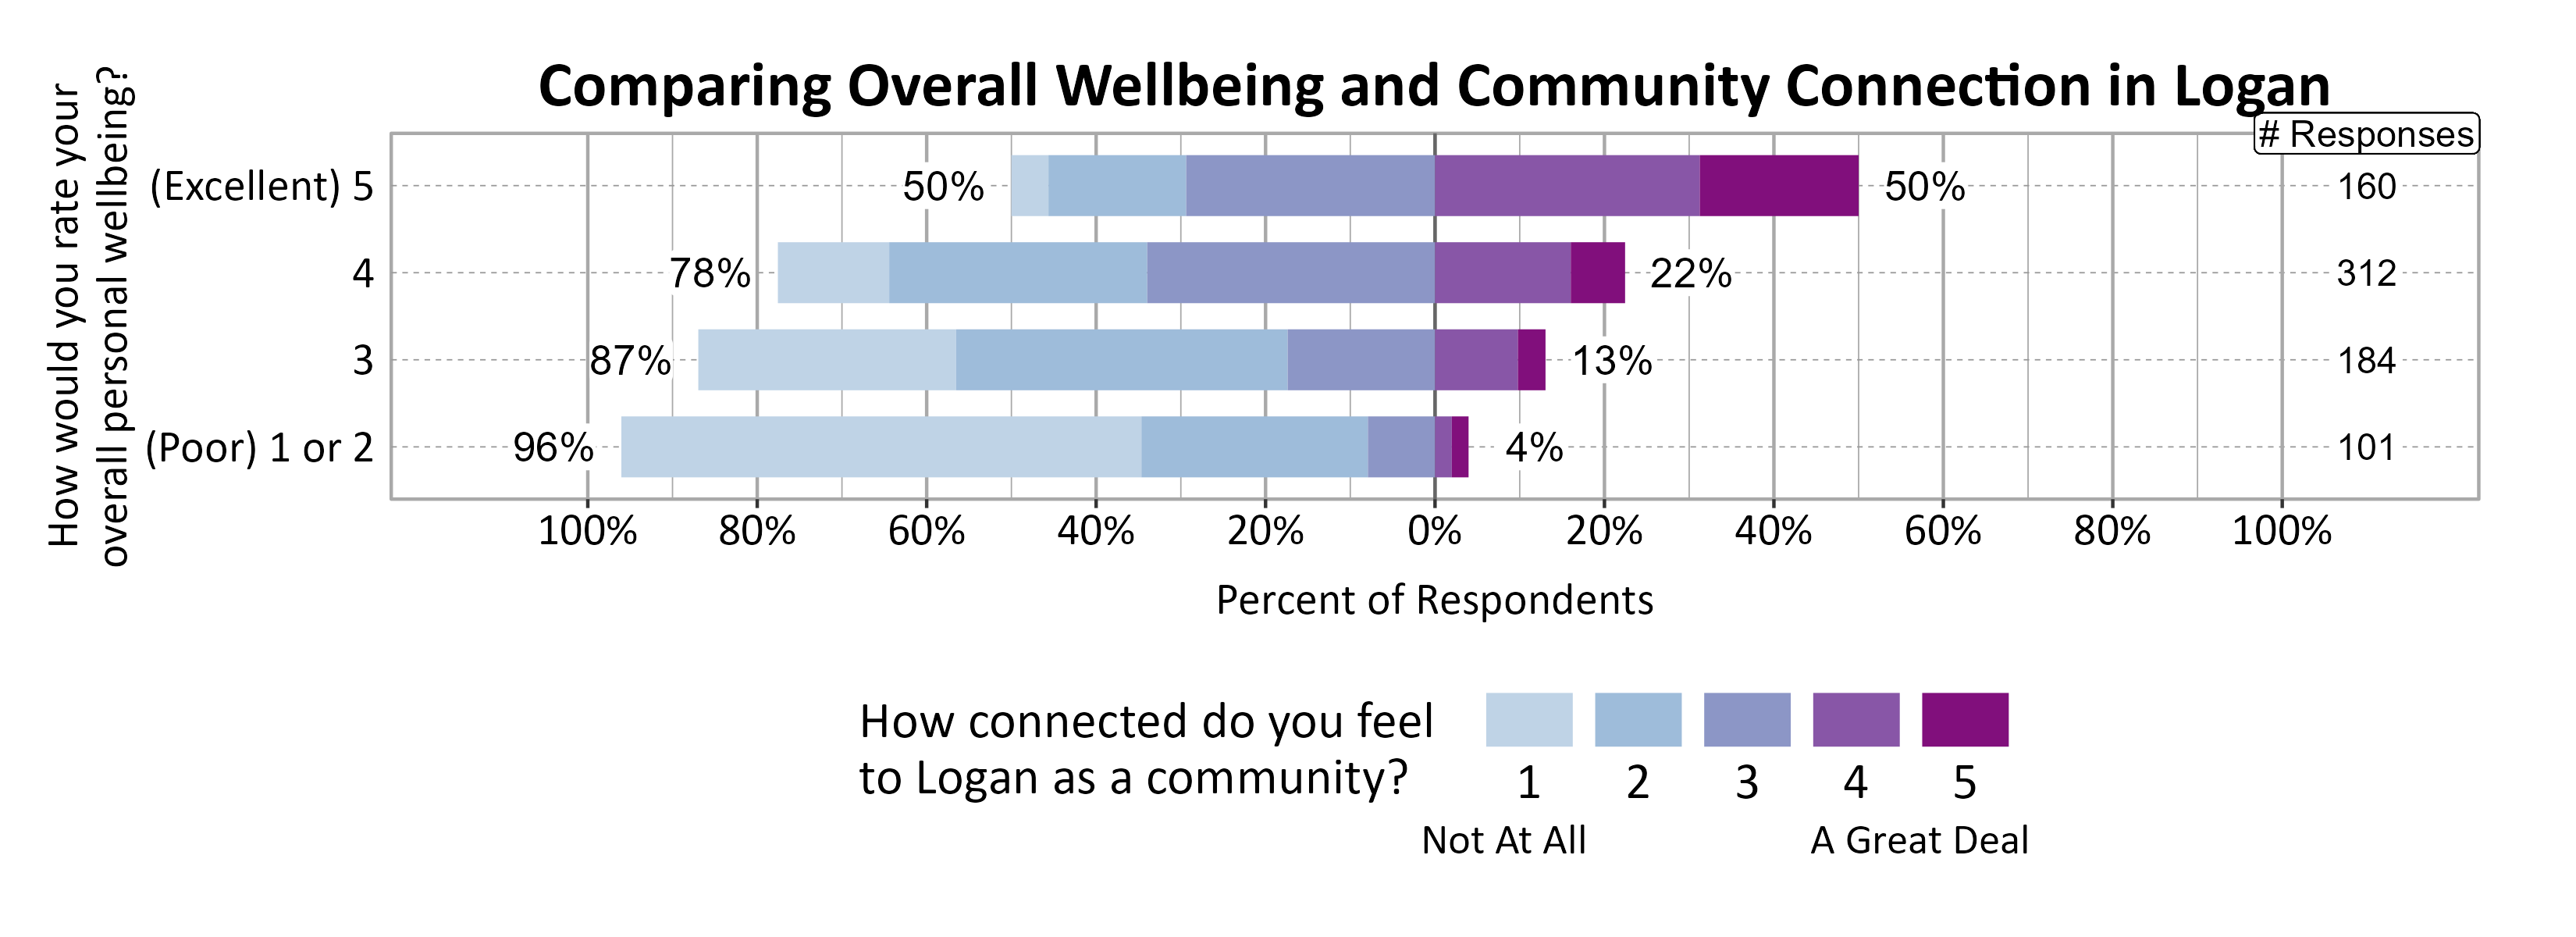
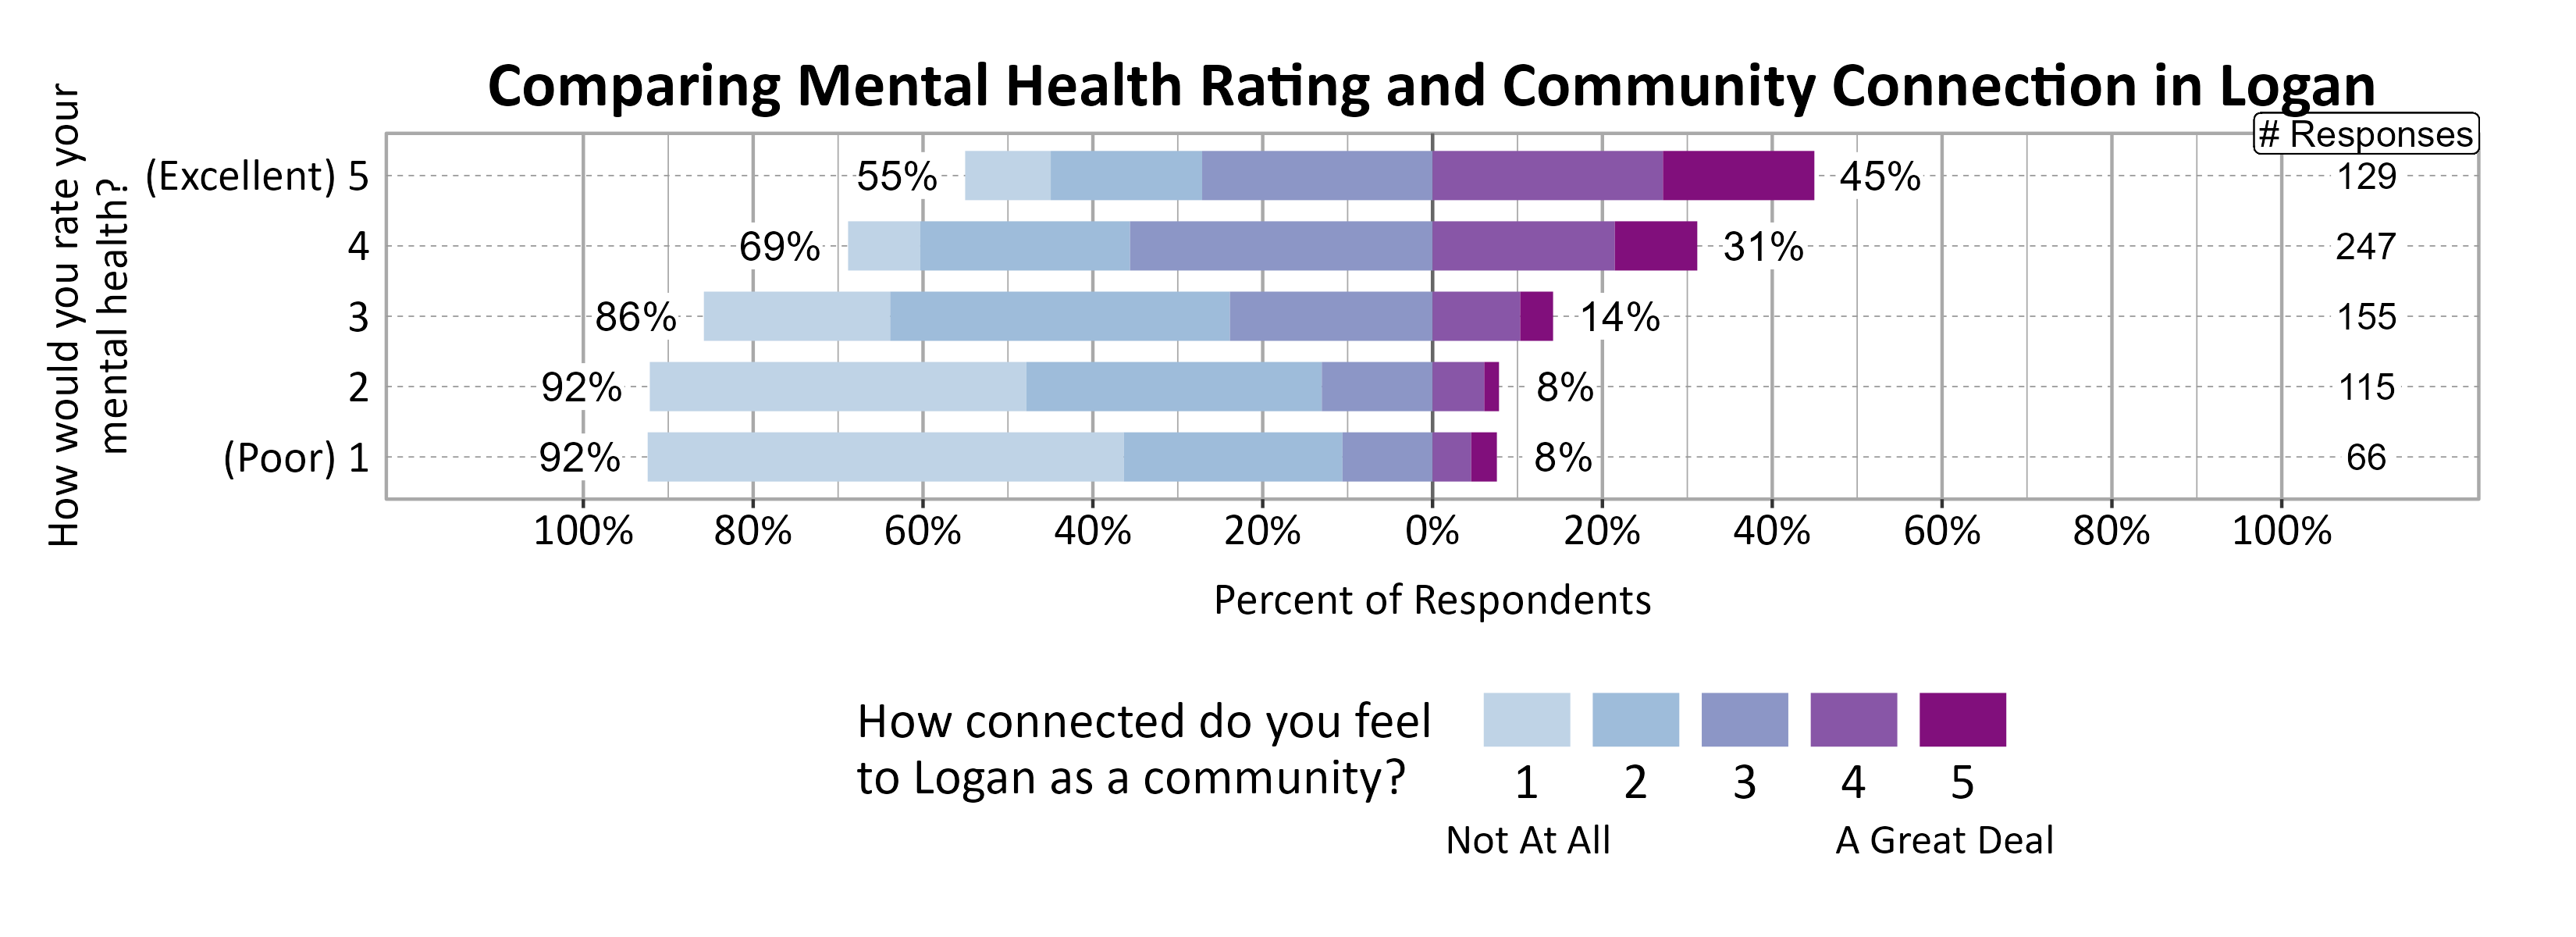
A positive relationship was found between individuals’ community connection and overall personal wellbeing as well as mental health.
The graph below shows how Wellbeing Project cities and towns compare on feelings of community connection based on the percentage of respondents who answered 4 or a 5 on a 5-point scale from “not at all” to “a great deal” connected to their city or town. Logan ranked 49 out of the 51 cities that participated.
Participation in Recreation and Nature-Related Activities
Respondents were asked to indicate whether or not they participated in various activities in the last 12 months. The most popular activities were walking or biking in your neighborhood or city (94%), using trails in or near your city (86%), recreating in parks in your city (84%), and community events (82%).
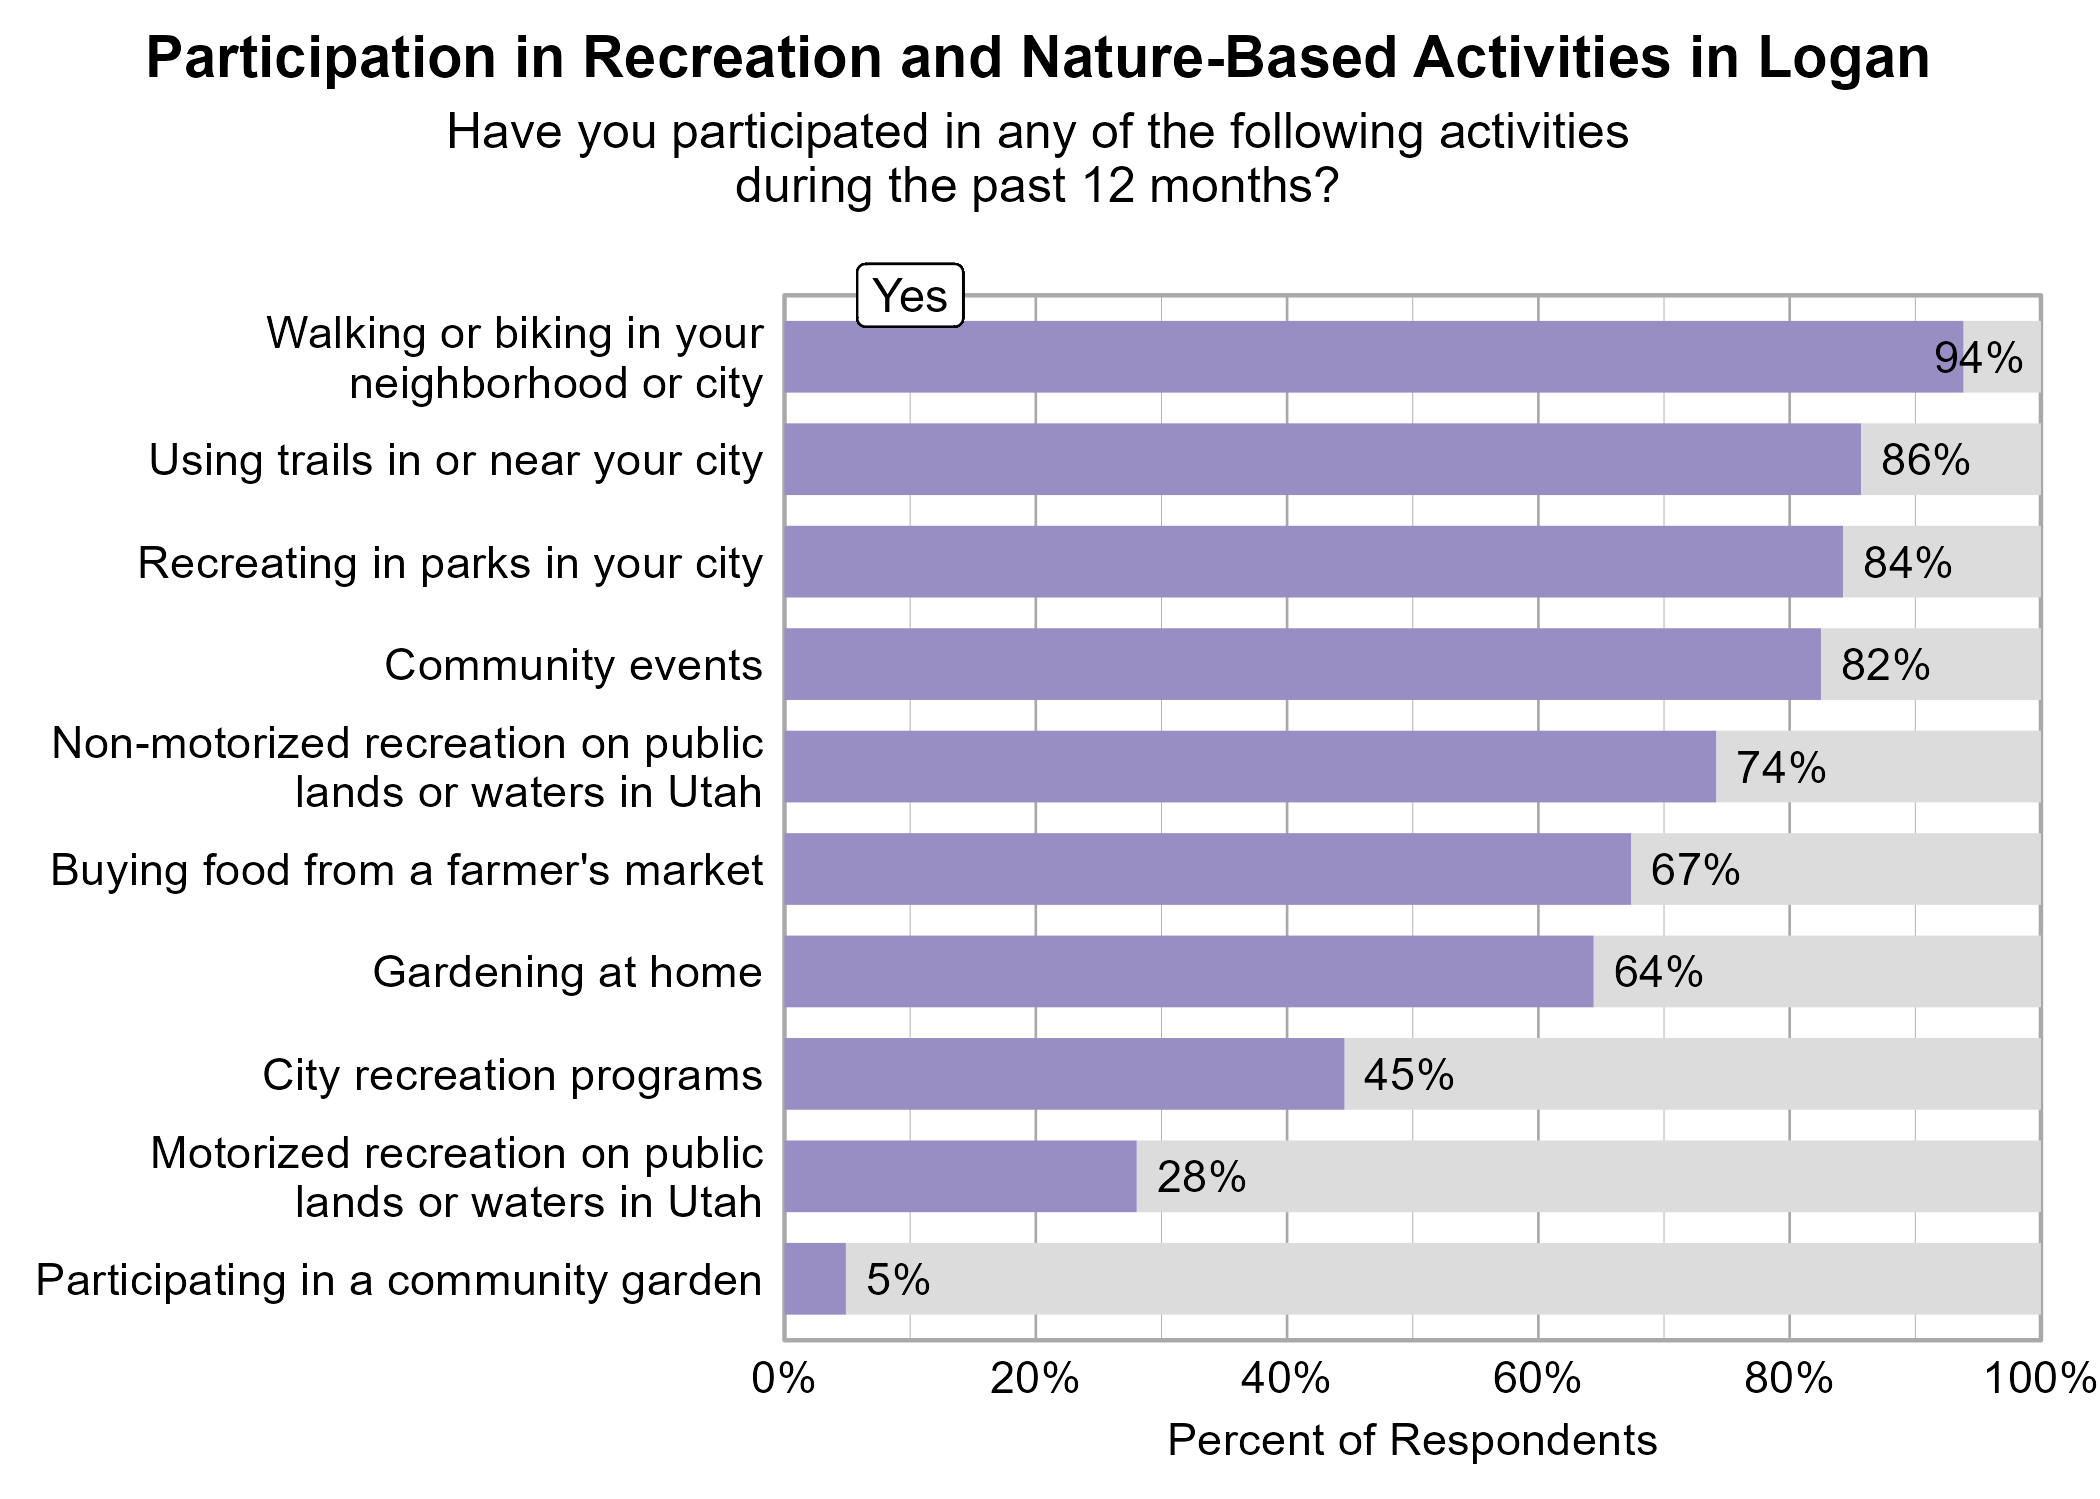
All of the recreation activities above, except for participating in a community garden, were significantly related to higher ratings of personal wellbeing.
Participating in city recreation programs, participating in community events, non-motorized recreation on public lands or waters in Utah, recreating in parks in your city, and walking or biking in your neighborhood or city were significantly related to higher ratings of community wellbeing.
All of the recreation activites above, except for participating in a community garden and motorized recreation on public lands or waters in Utah, were significantly related to higher ratings of community connection.
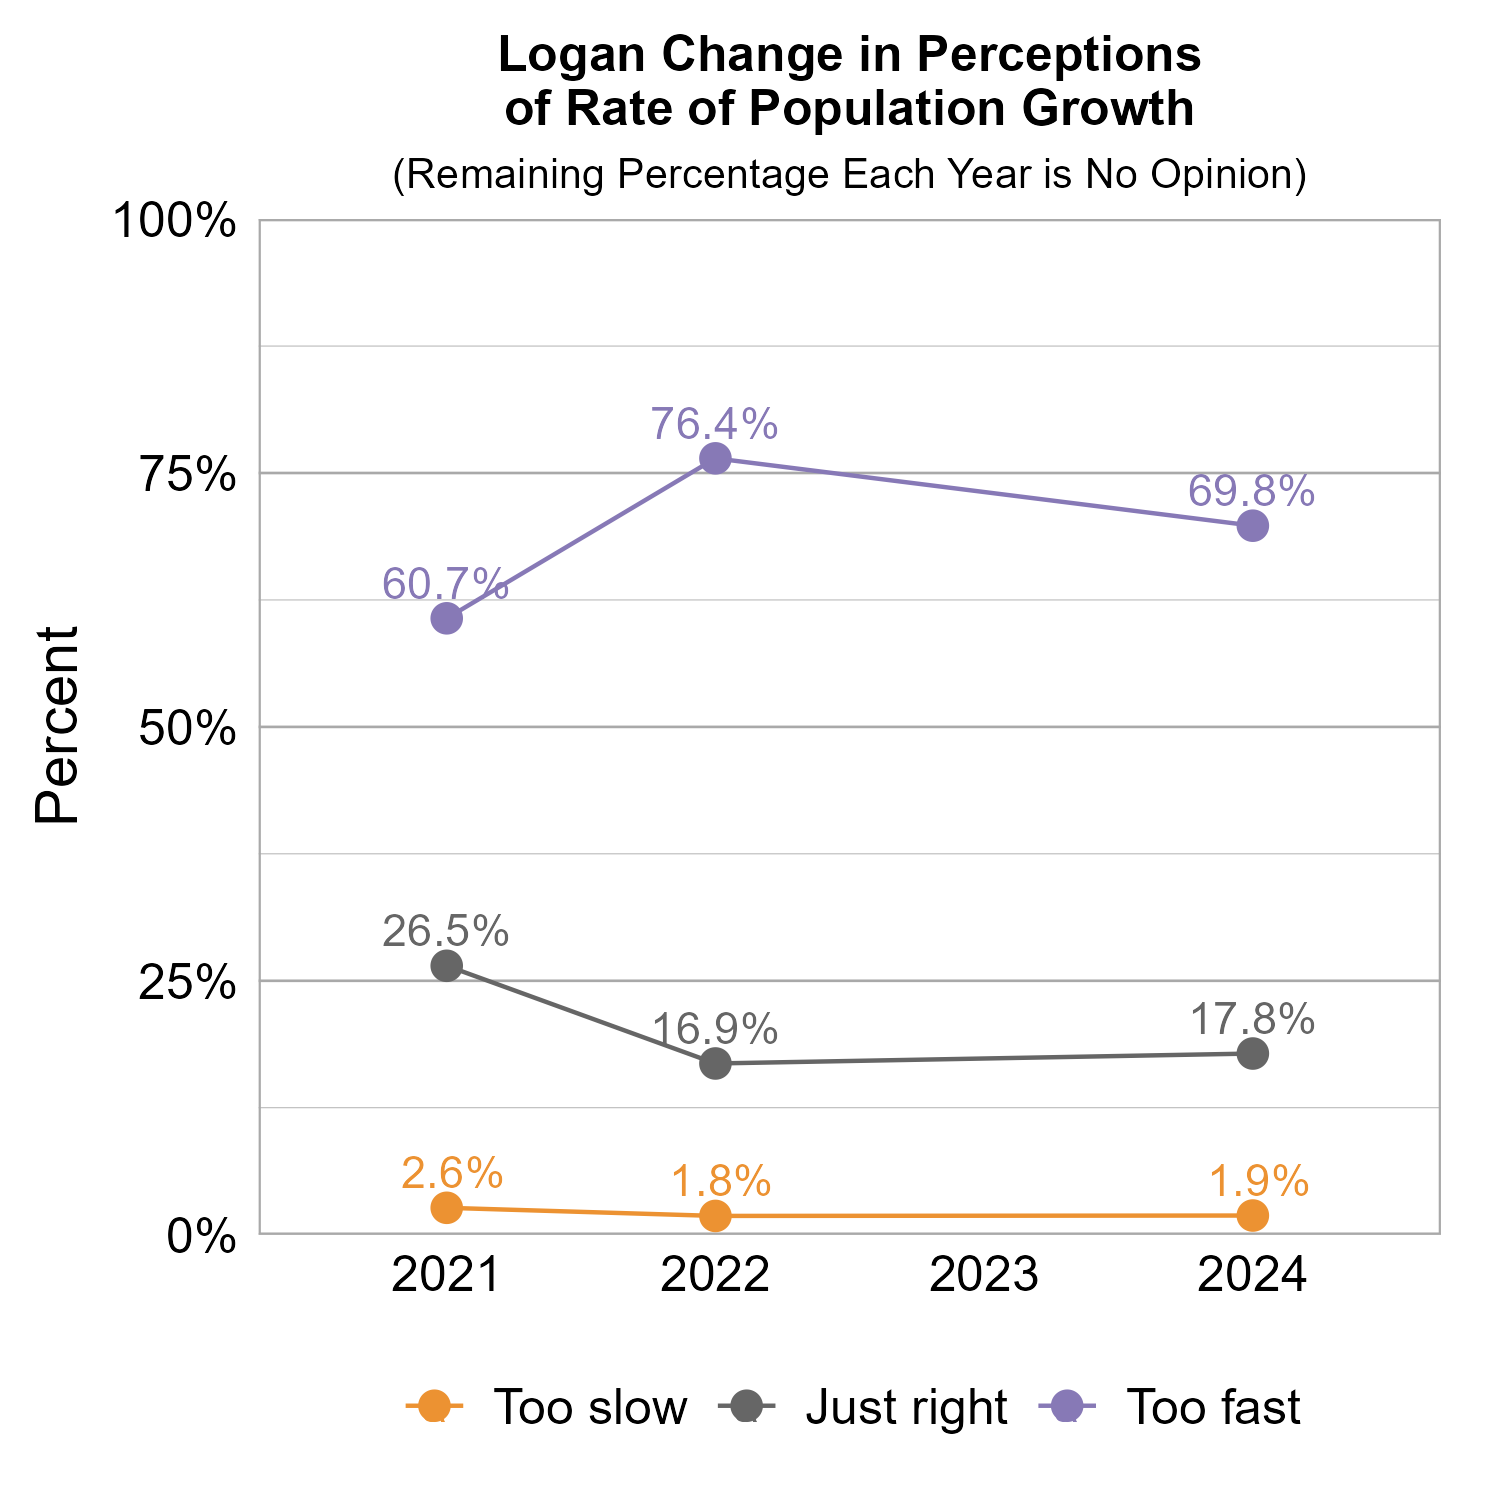
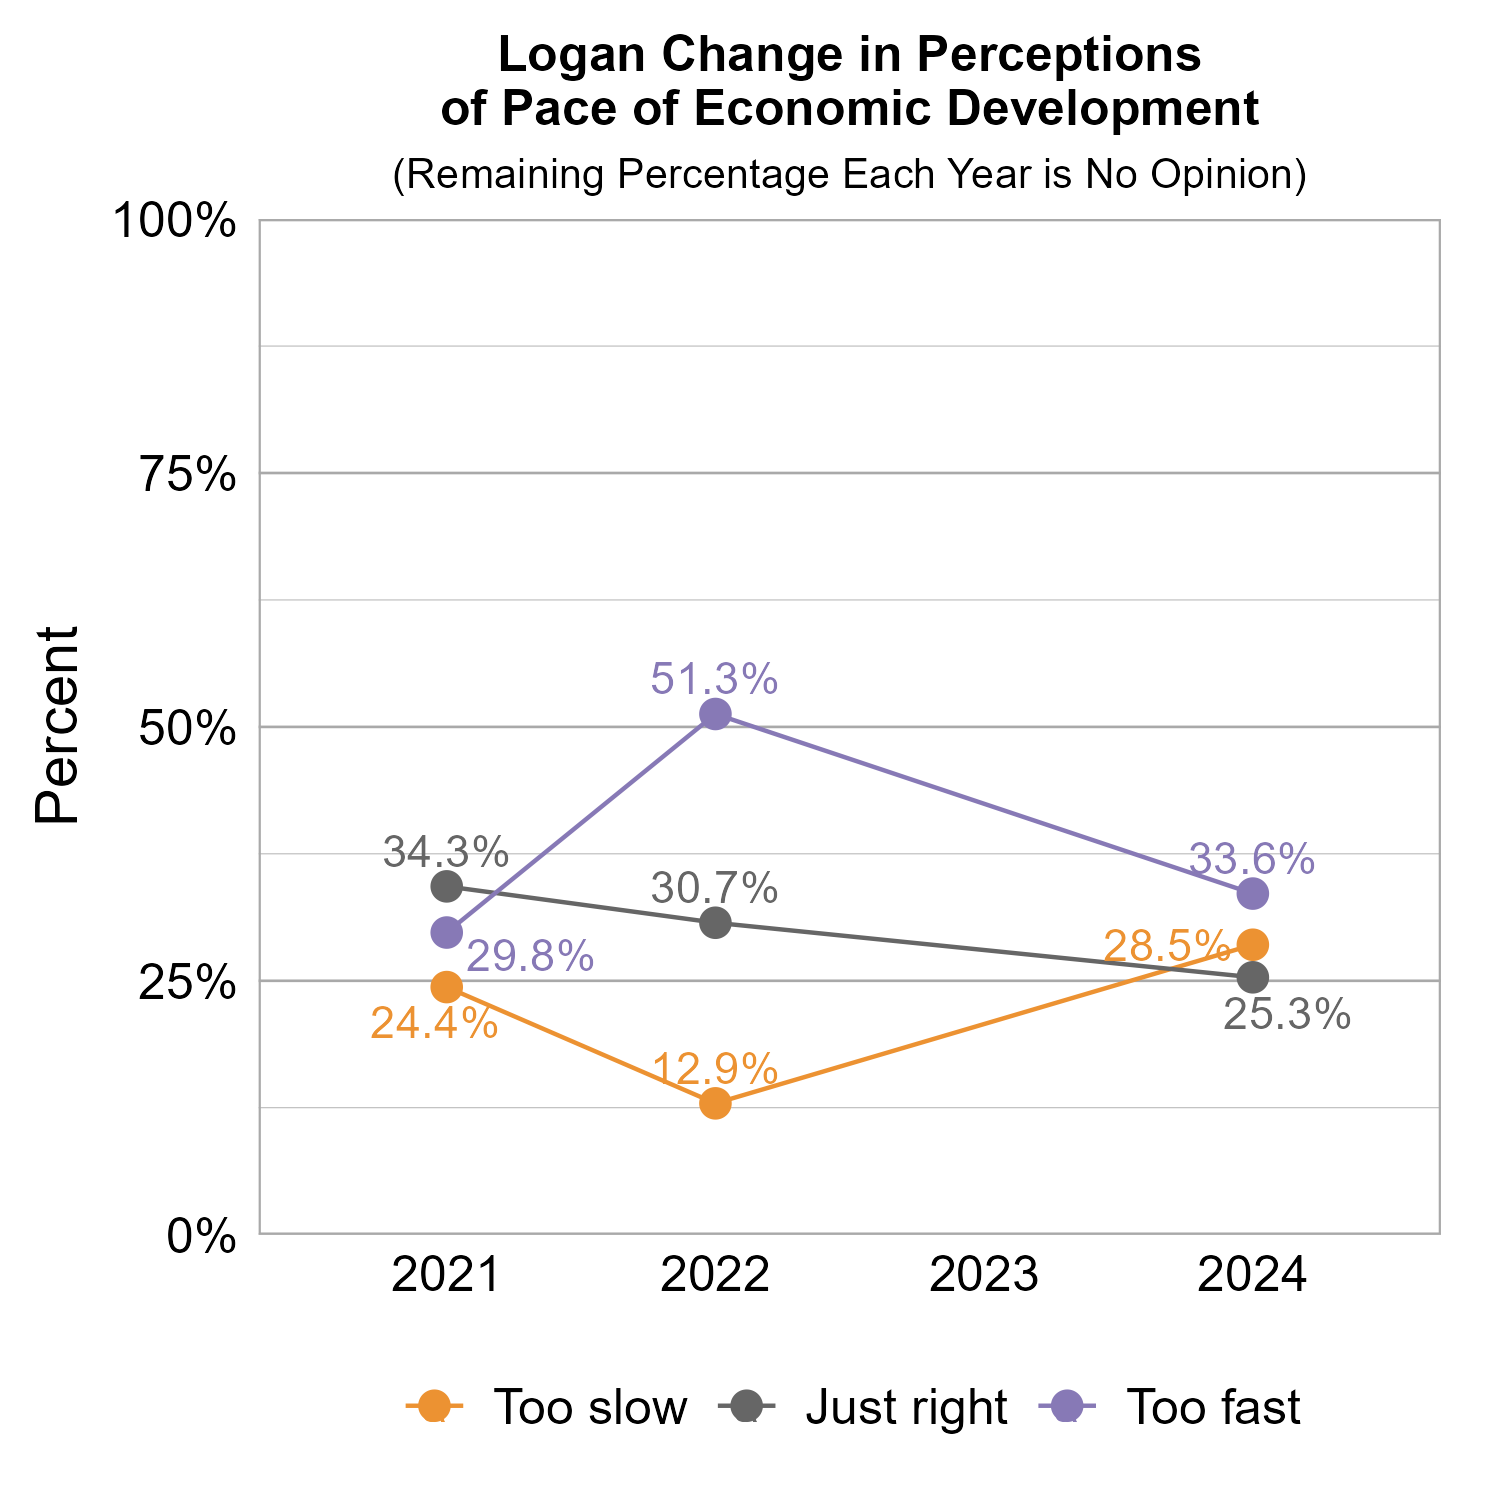
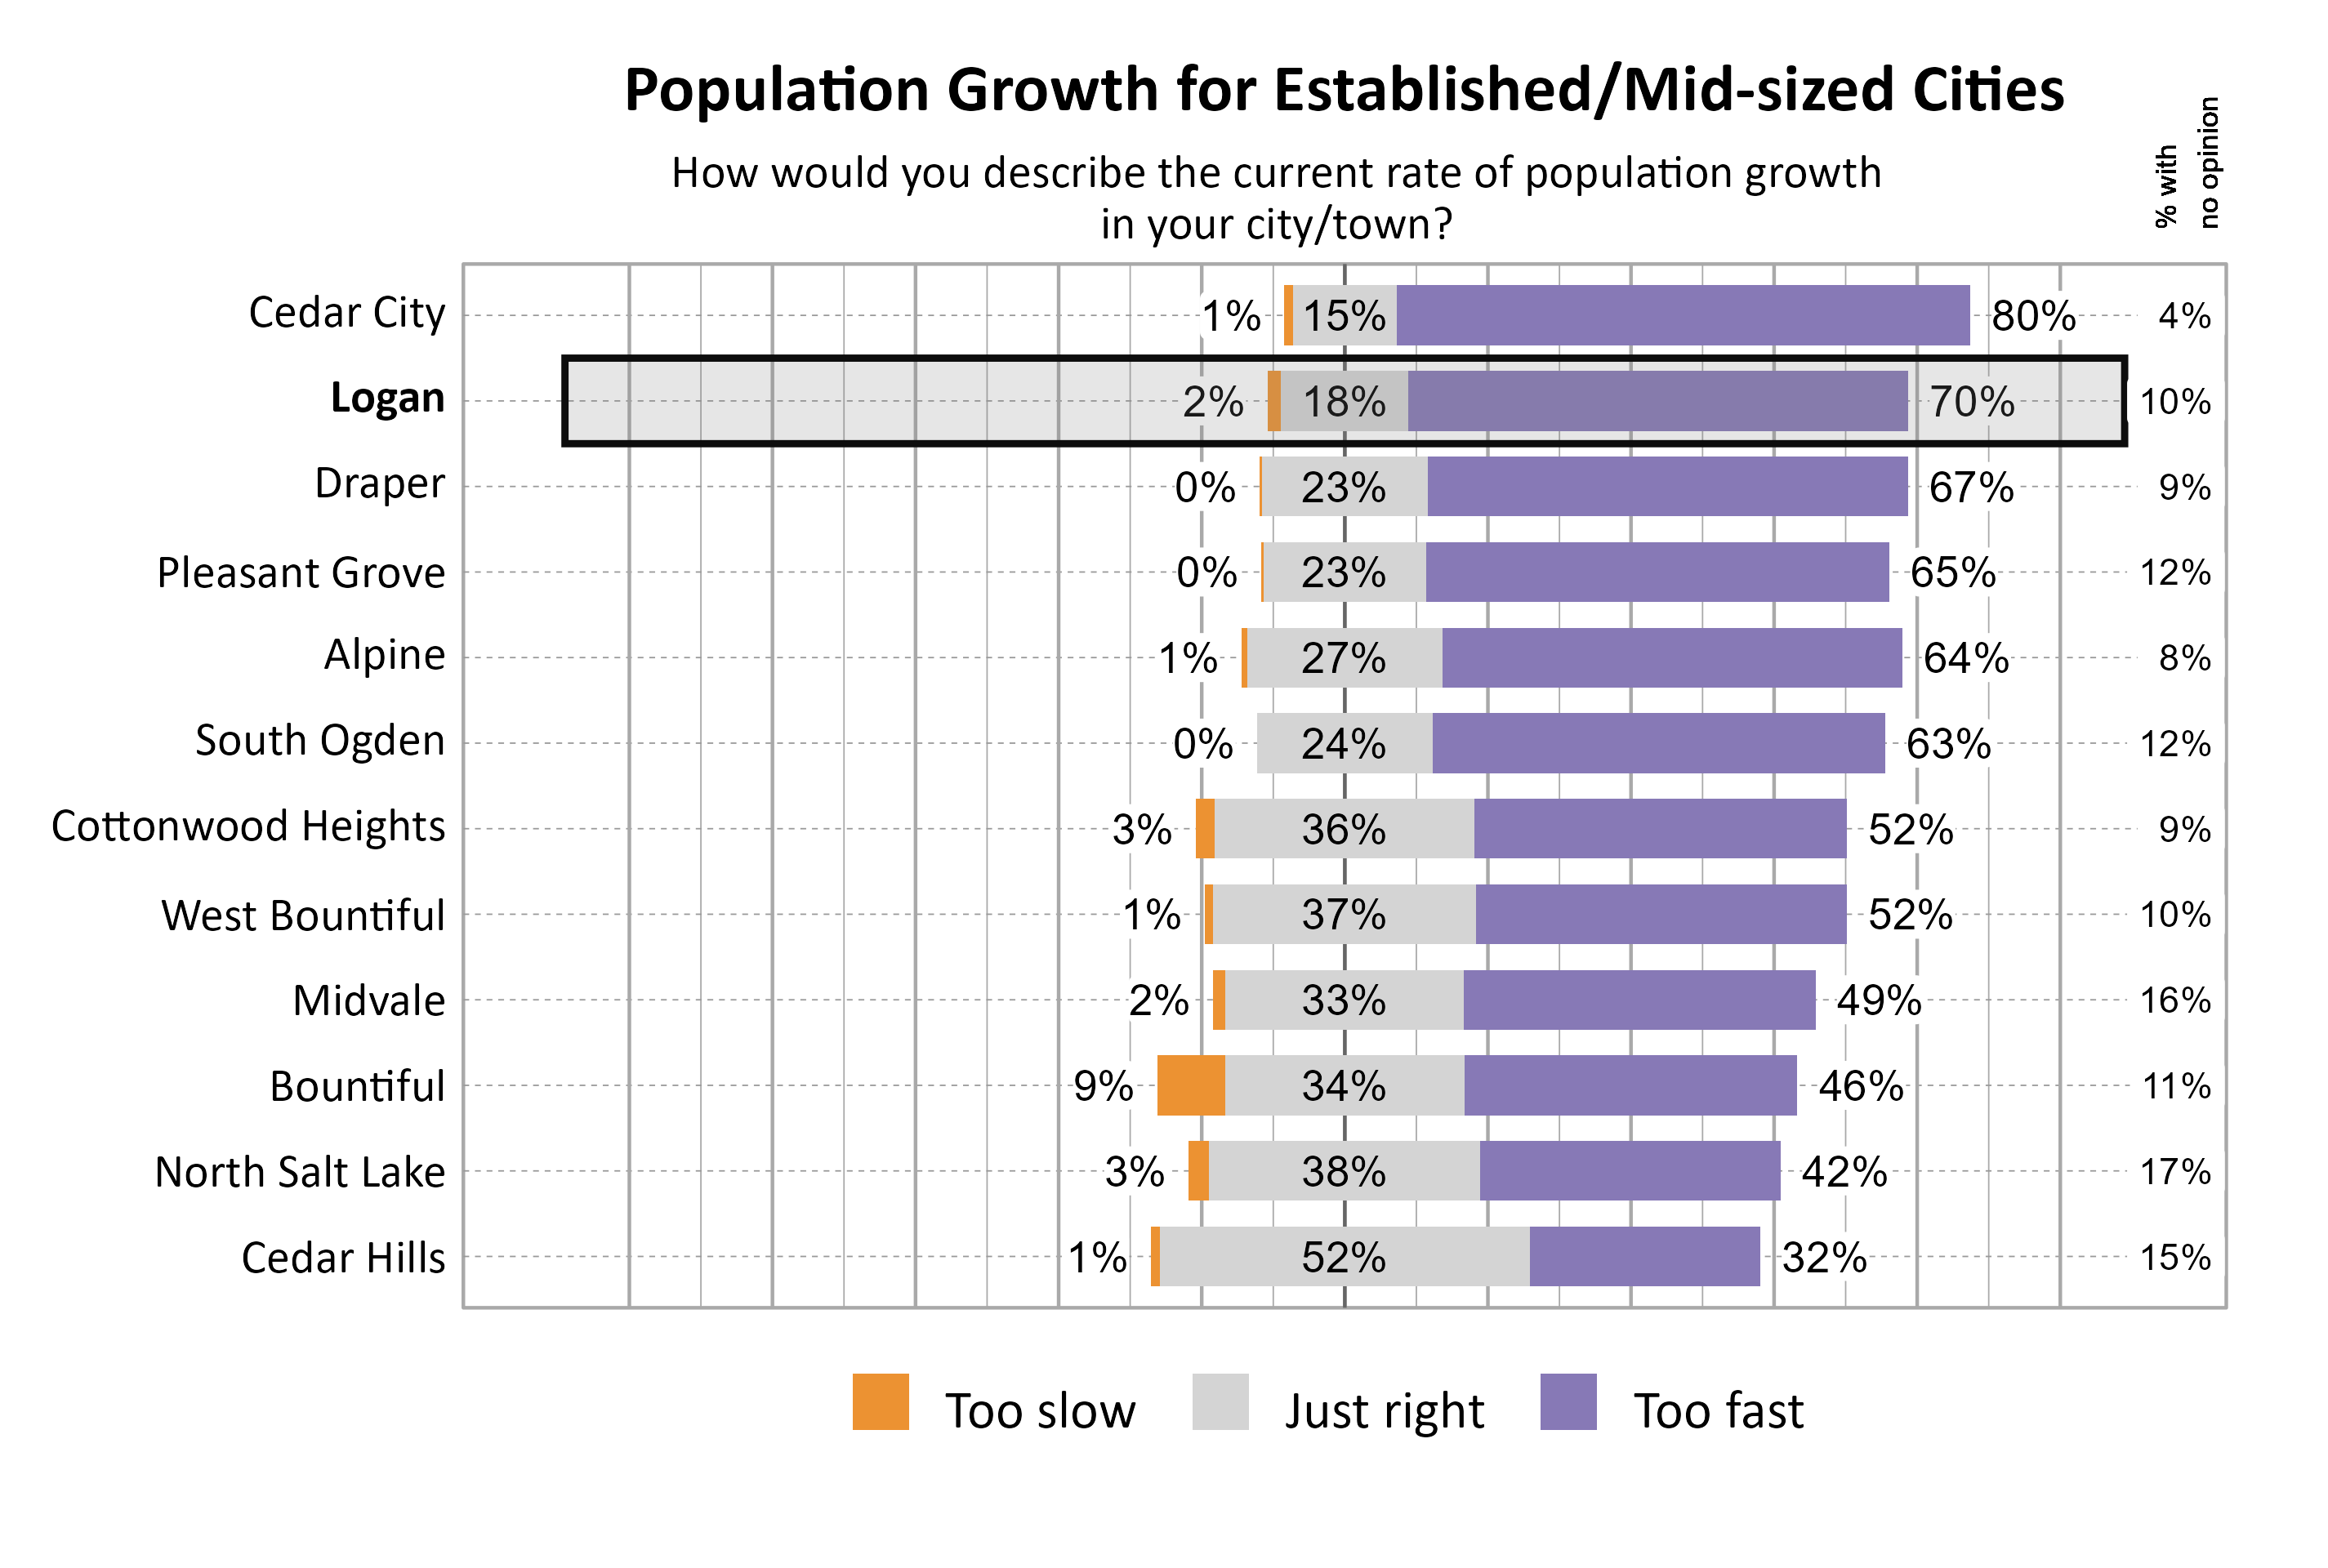
Perspectives on Population Growth and Economic Development
The majority of respondents in Logan indicated that they felt the population growth was too fast (70%). For the pace of economic development, respondents were split between opinions that it was too fast (34%), too slow (29%), and just right (25%).
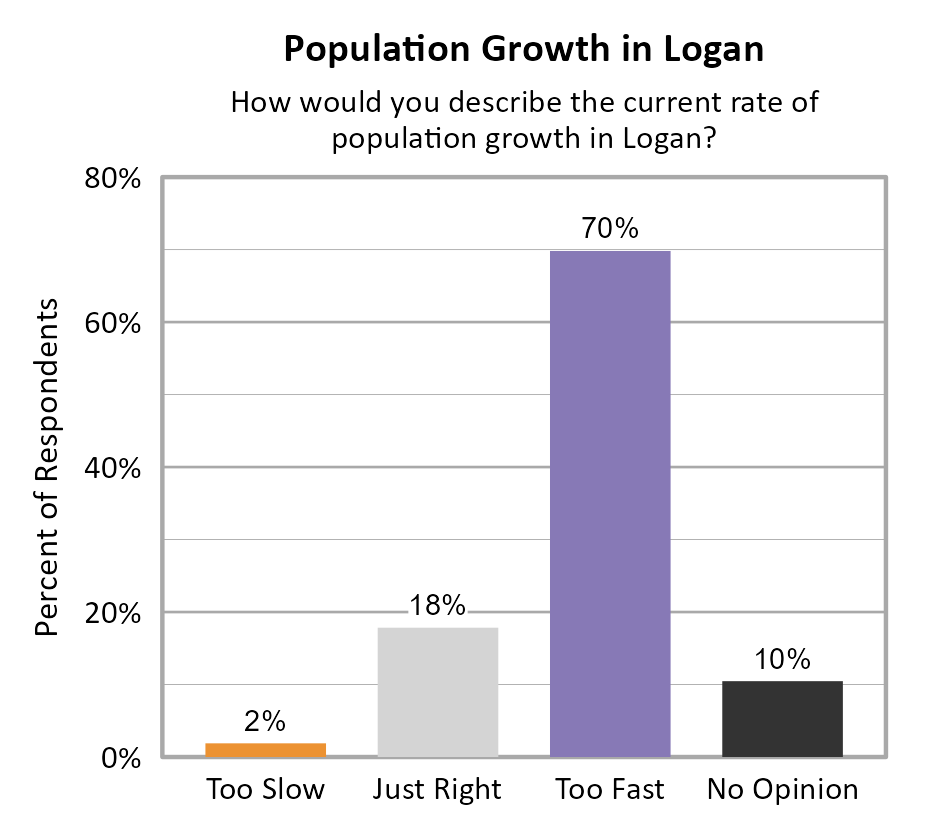
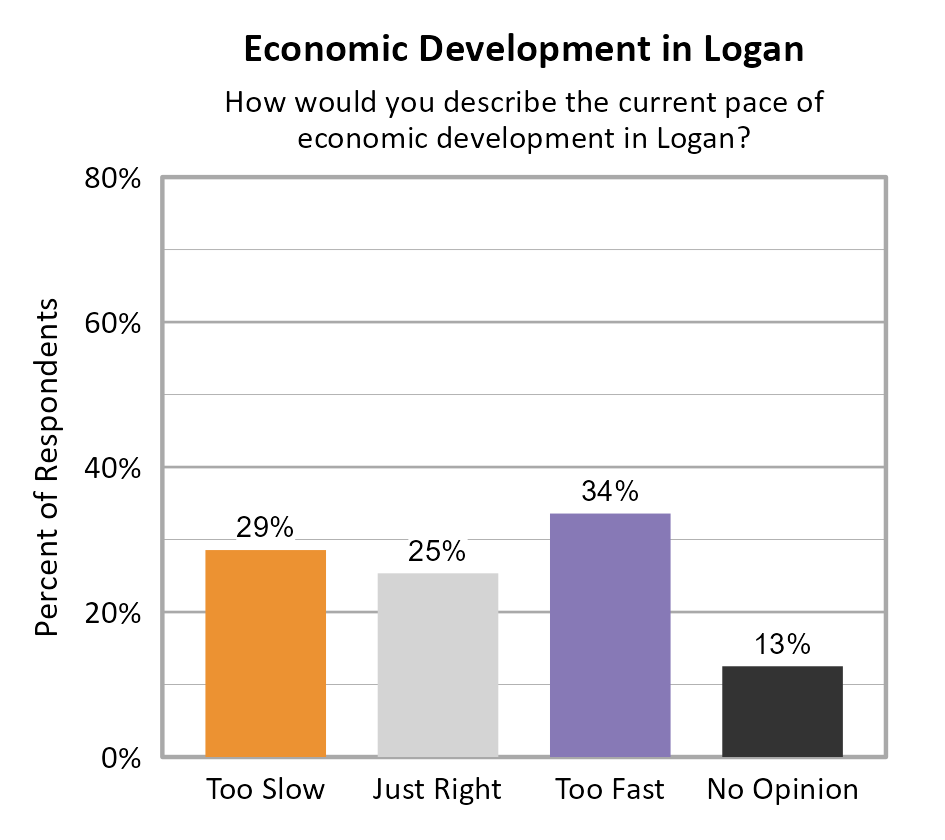
The graphs below show how perceptions of population growth and economic development in Logan have varied across recent years of Wellbeing Surveys. The majority of respondents have consistently indicated that the rate of population growth is too fast over the survey years, while the perception that economic development is too fast dropped from 2022 to 2024 and the perception that it is too slow increased from 2022 to 2024.
The graphs below show perceptions of population growth and economic development for Logan compared to other participating cities and towns in the Established/Mid-sized Cities cluster.
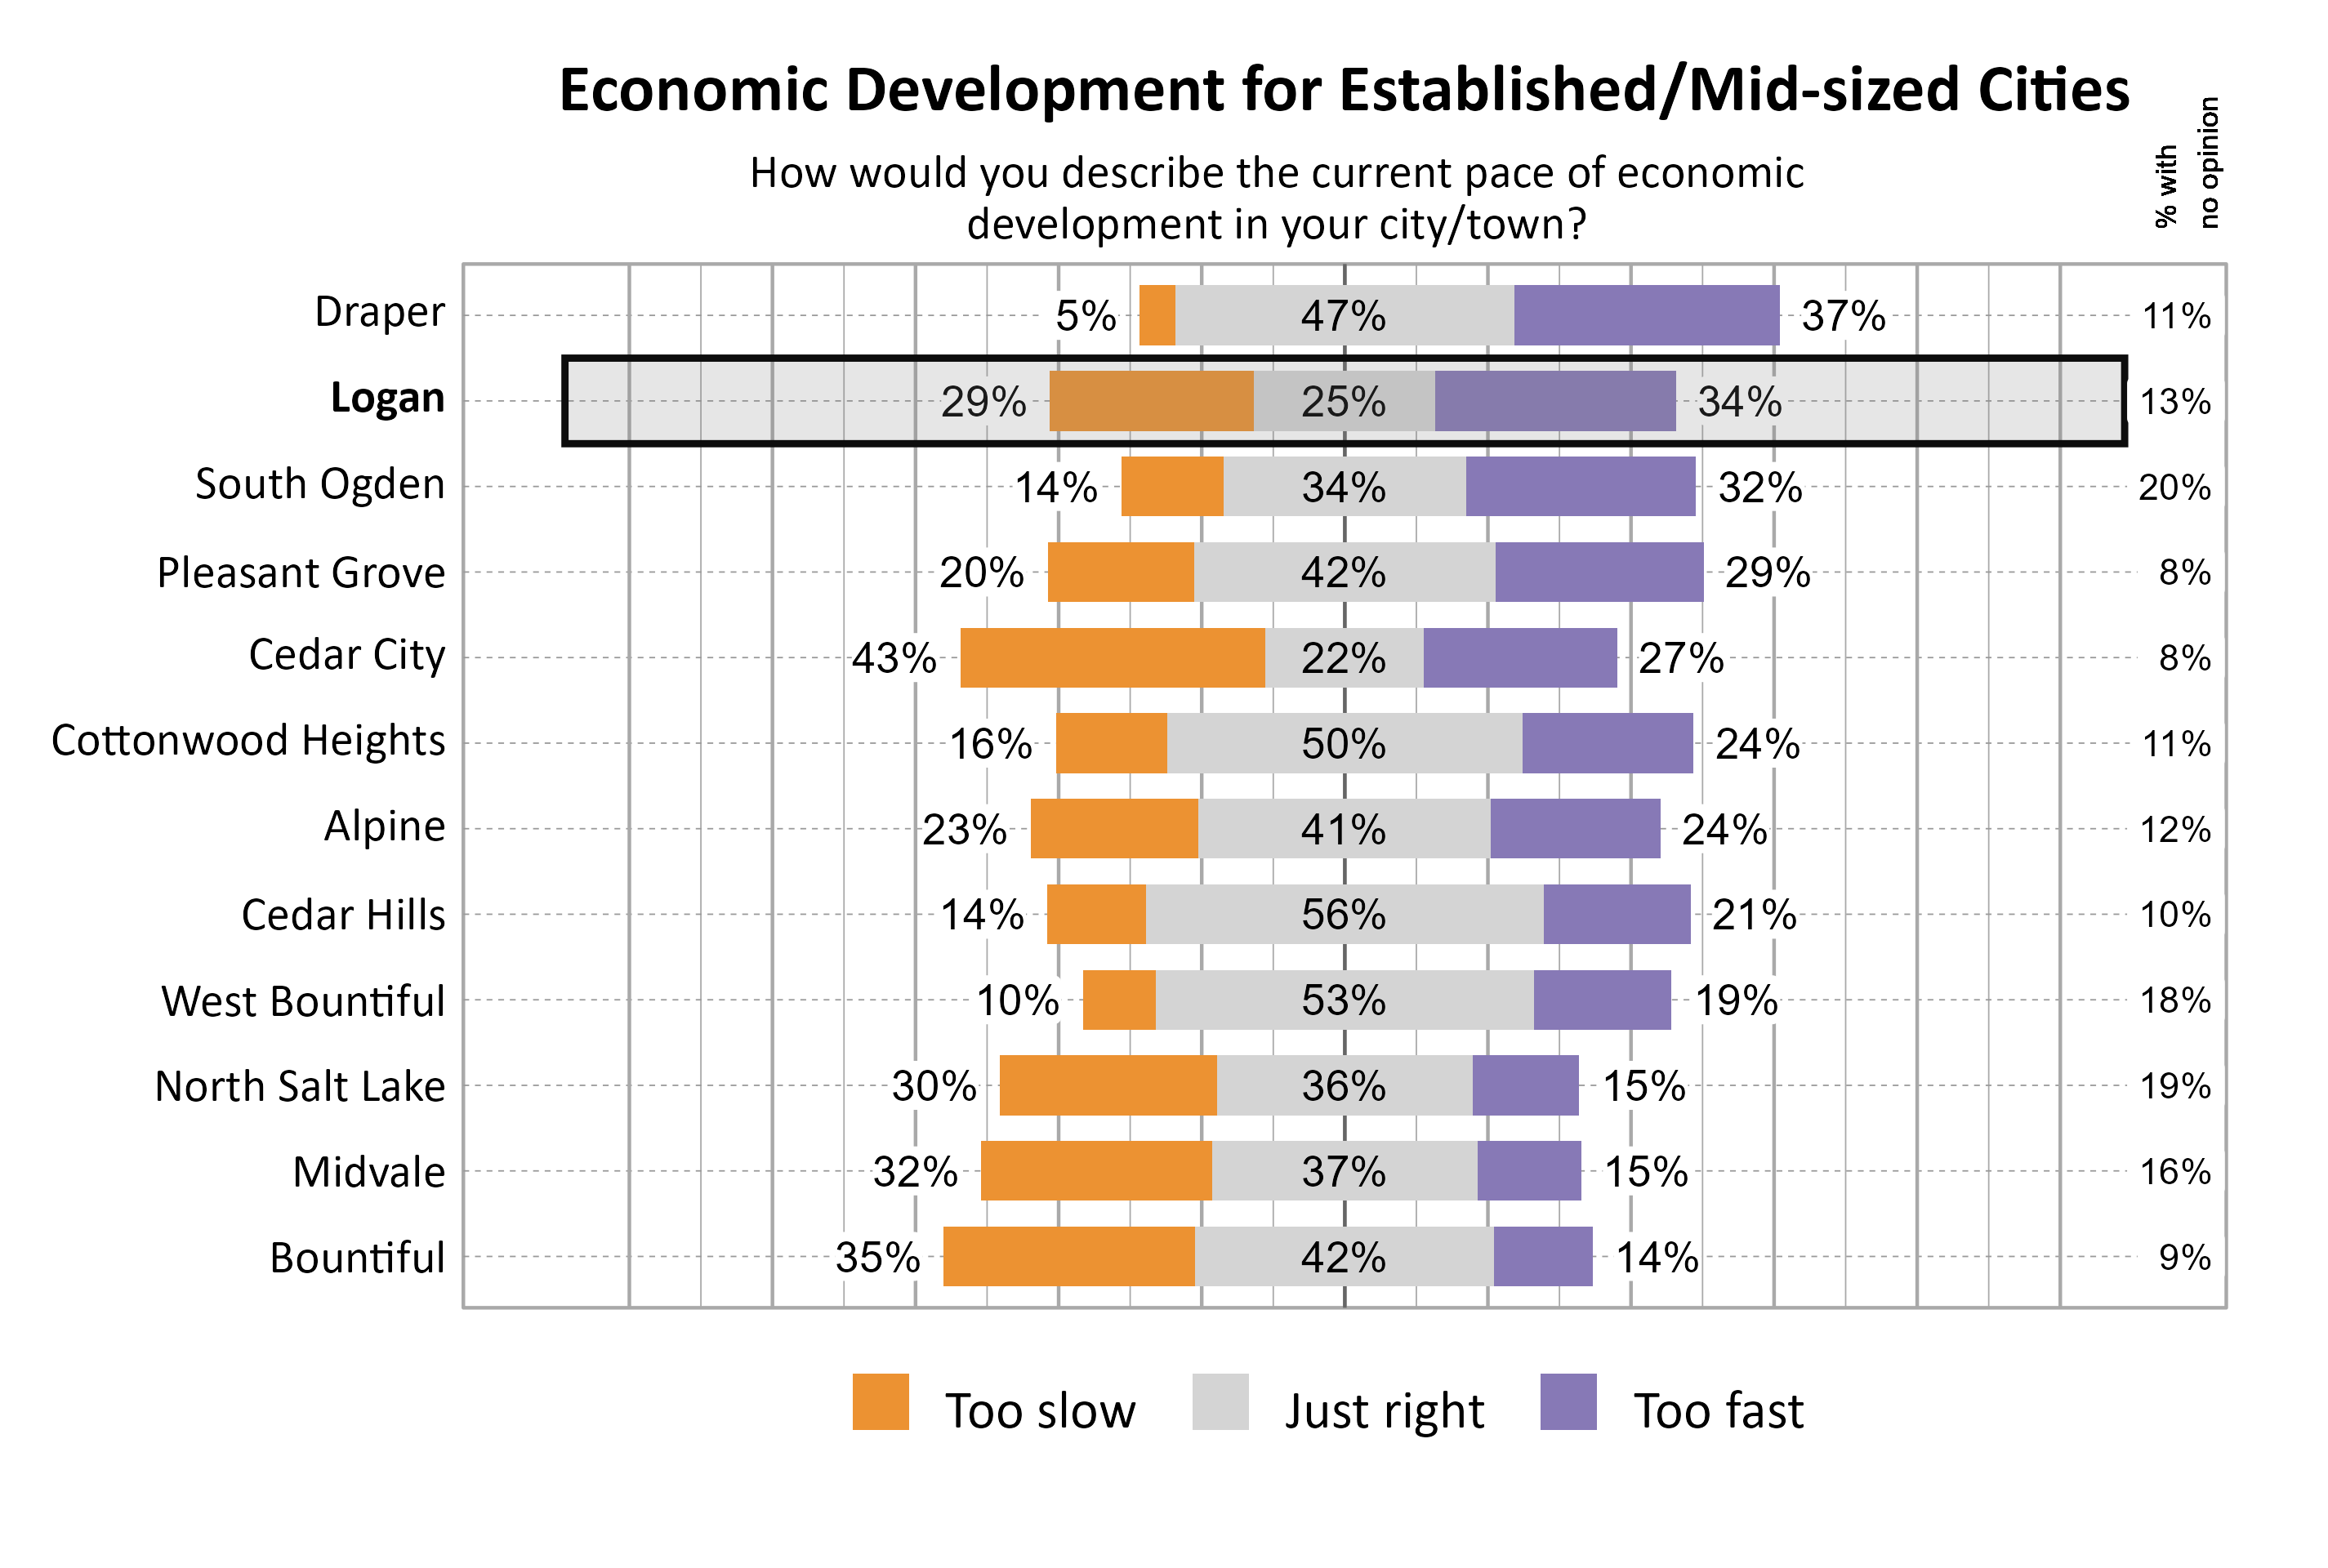
The graph below illustrates how many respondents perceived the pace of economic development as too slow, just right, too fast, or had no opinion, with additional breakdowns for the number of respondents who provided comments.
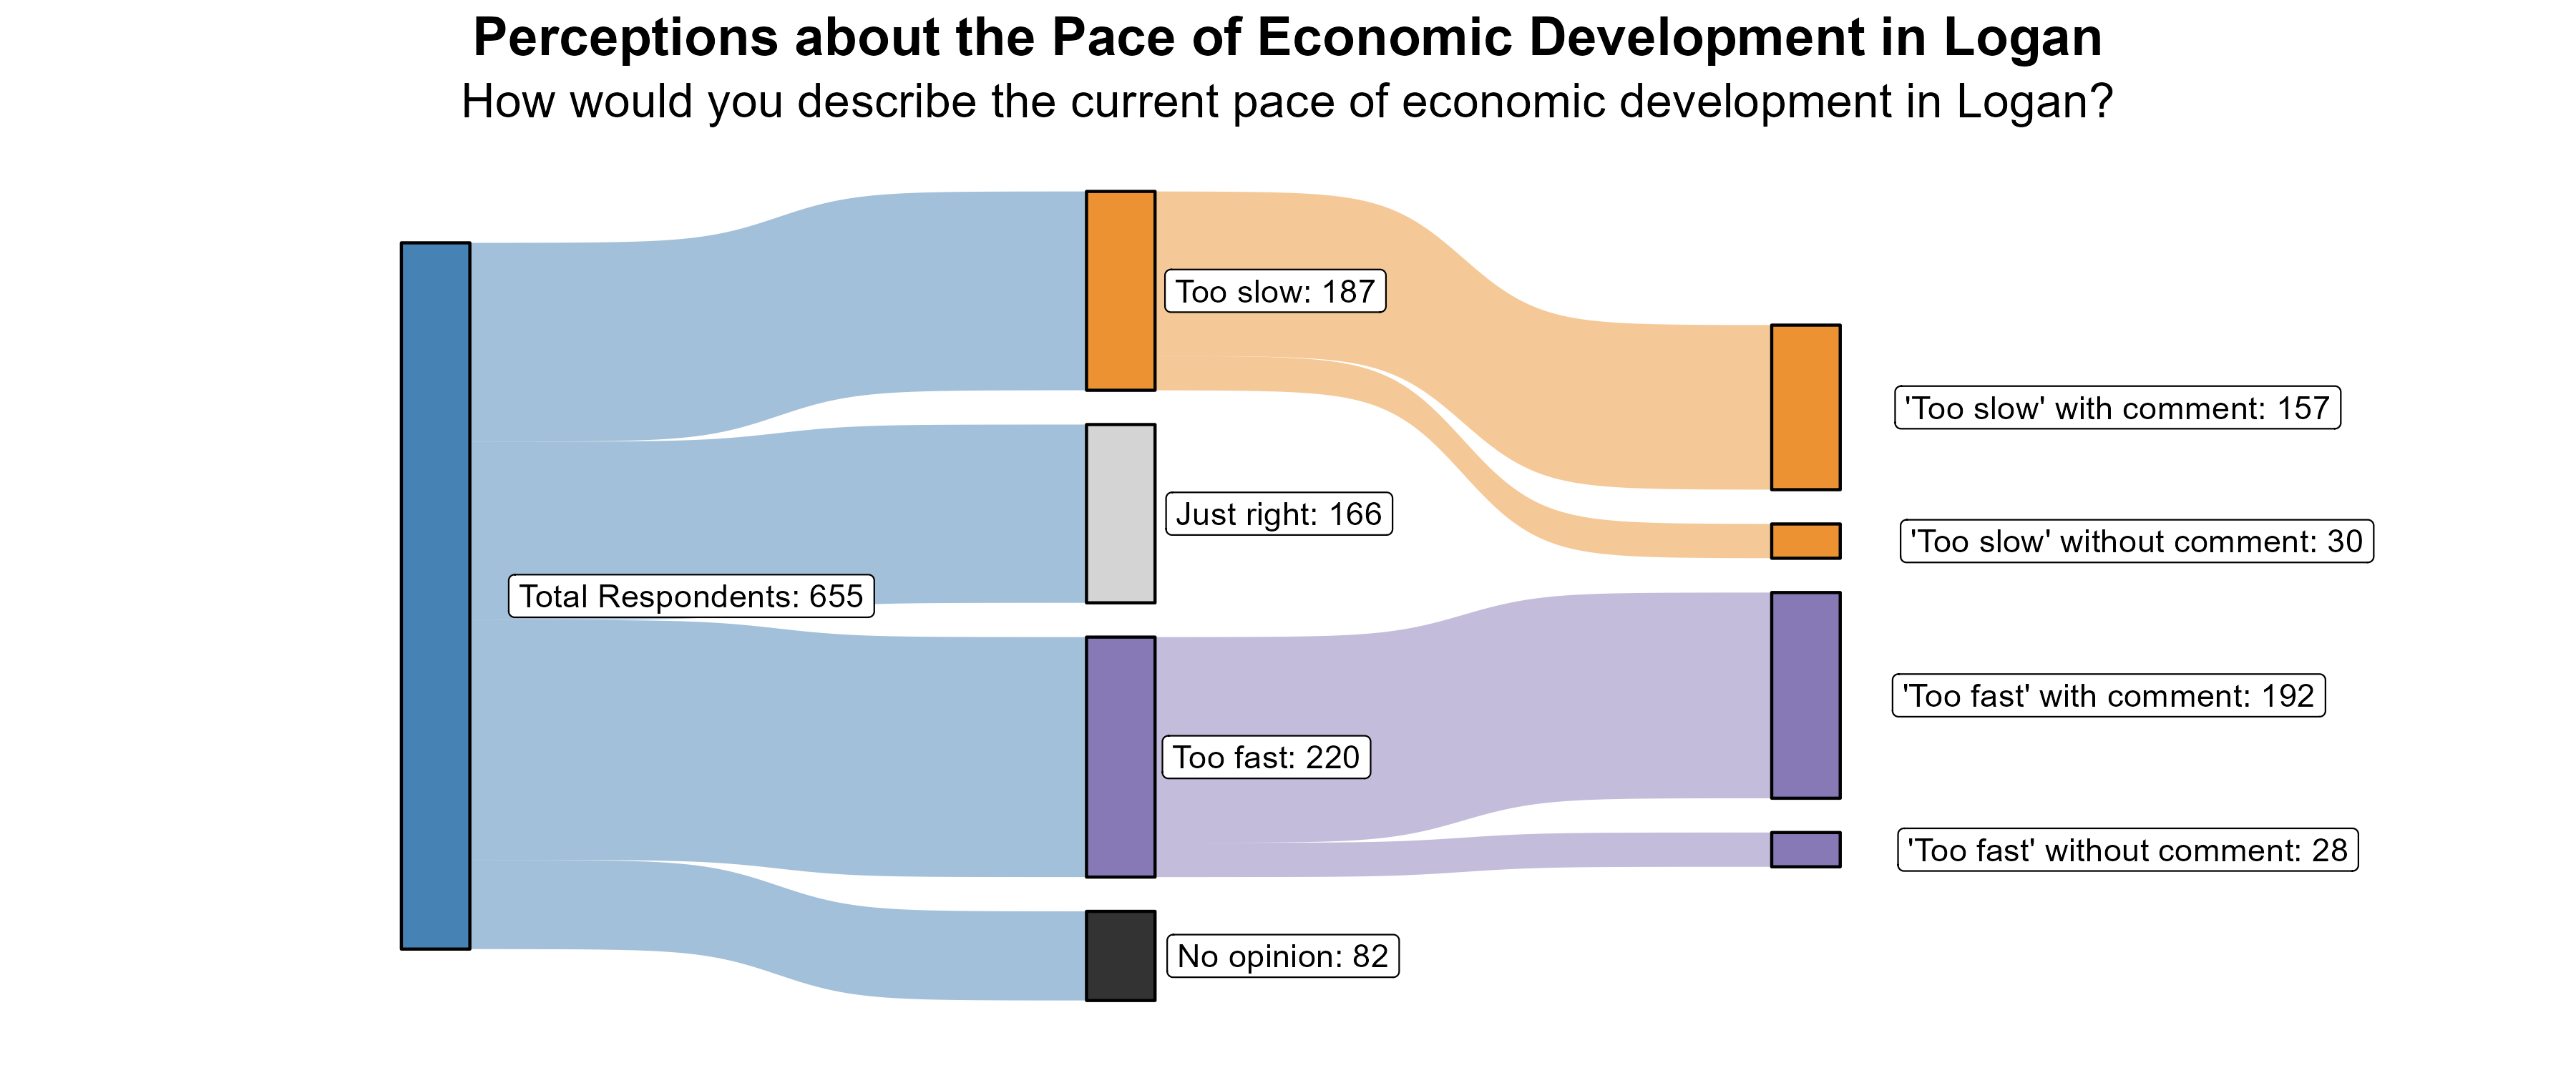
The 29% of respondents who rated the pace of economic growth as “too slow” were further asked what aspects of the local economy they would like to see more of in Logan. Comments focused on the need for better job opportunities and wages. Affordability was an issue for many, particularly housing. There were calls for additional retail and business opportunities, particularly support for local businesses.
Additionally, the 34% of respondents who rated the pace of economic growth as “too fast” were further asked what aspects of the local economy they feel are growing too quickly in Logan. Comments generally focused on housing development that is unaffordable and retail and business development in the form of fast food, chains, and warehouses. There were concerns about infrastructure, particularly related to roads and traffic. There were some concerns about resources and the loss of green space and open space. There were also mentions of the need for better job opportunities and the lack of affordability.
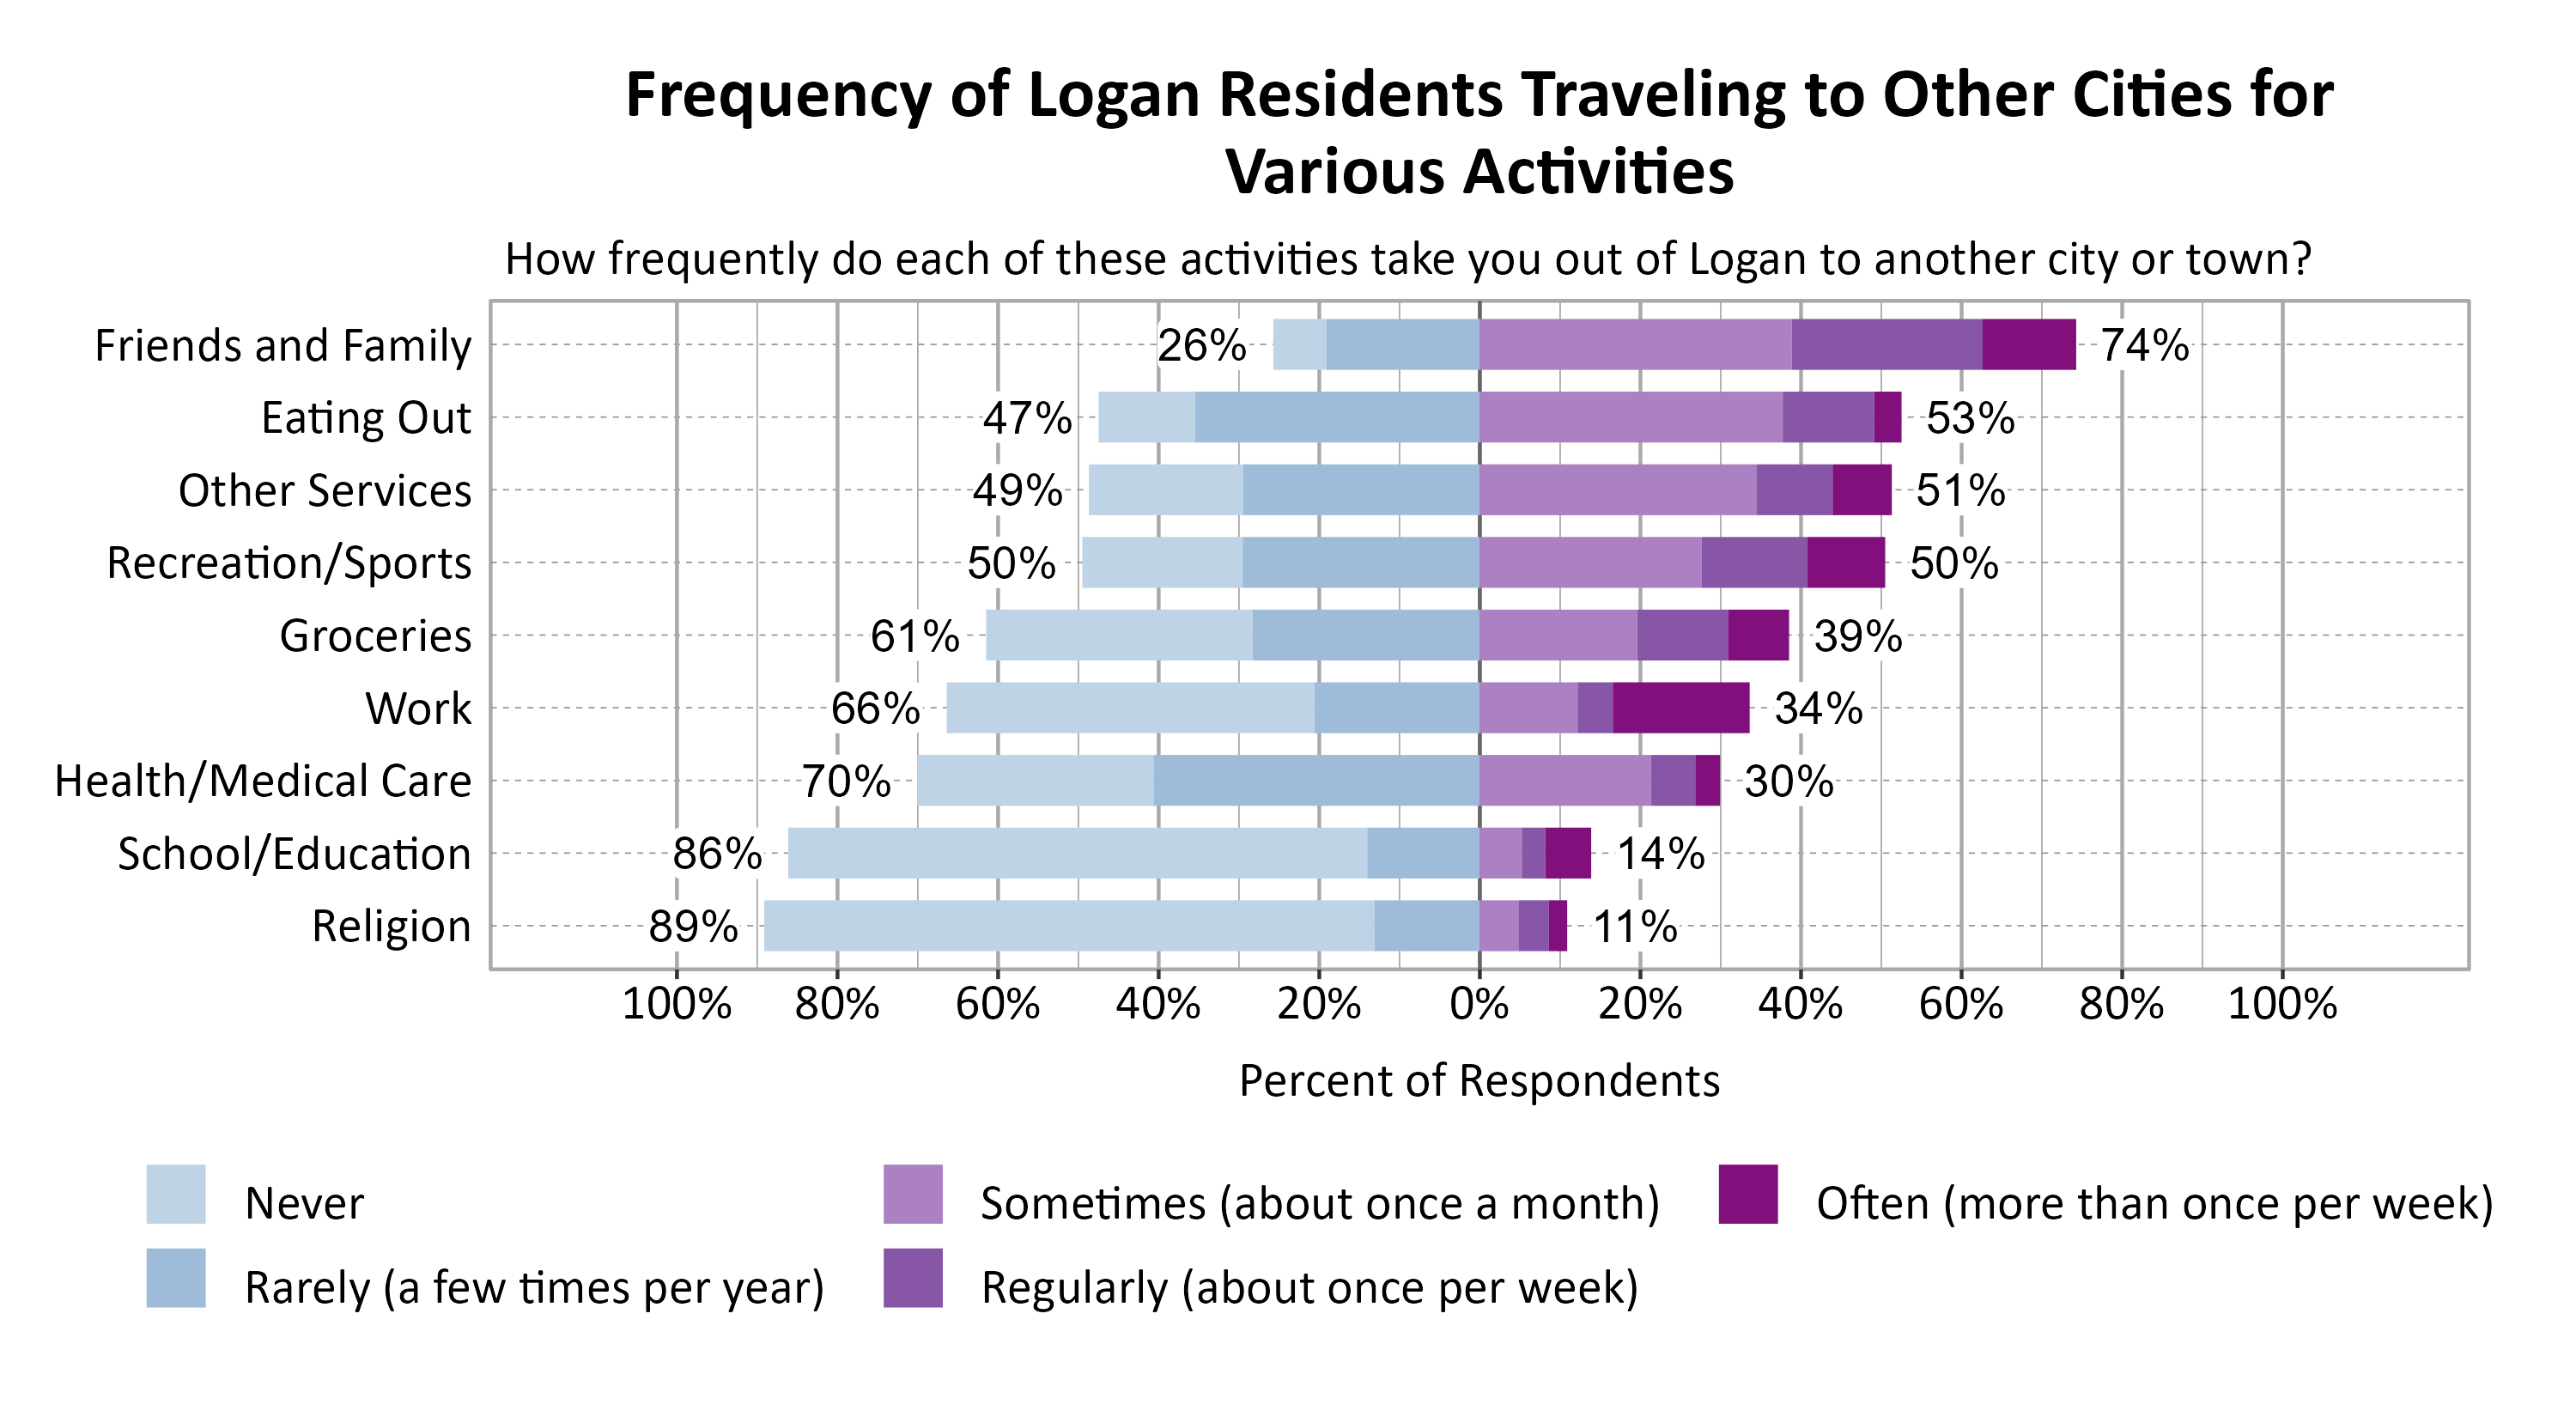
Transportation in Logan
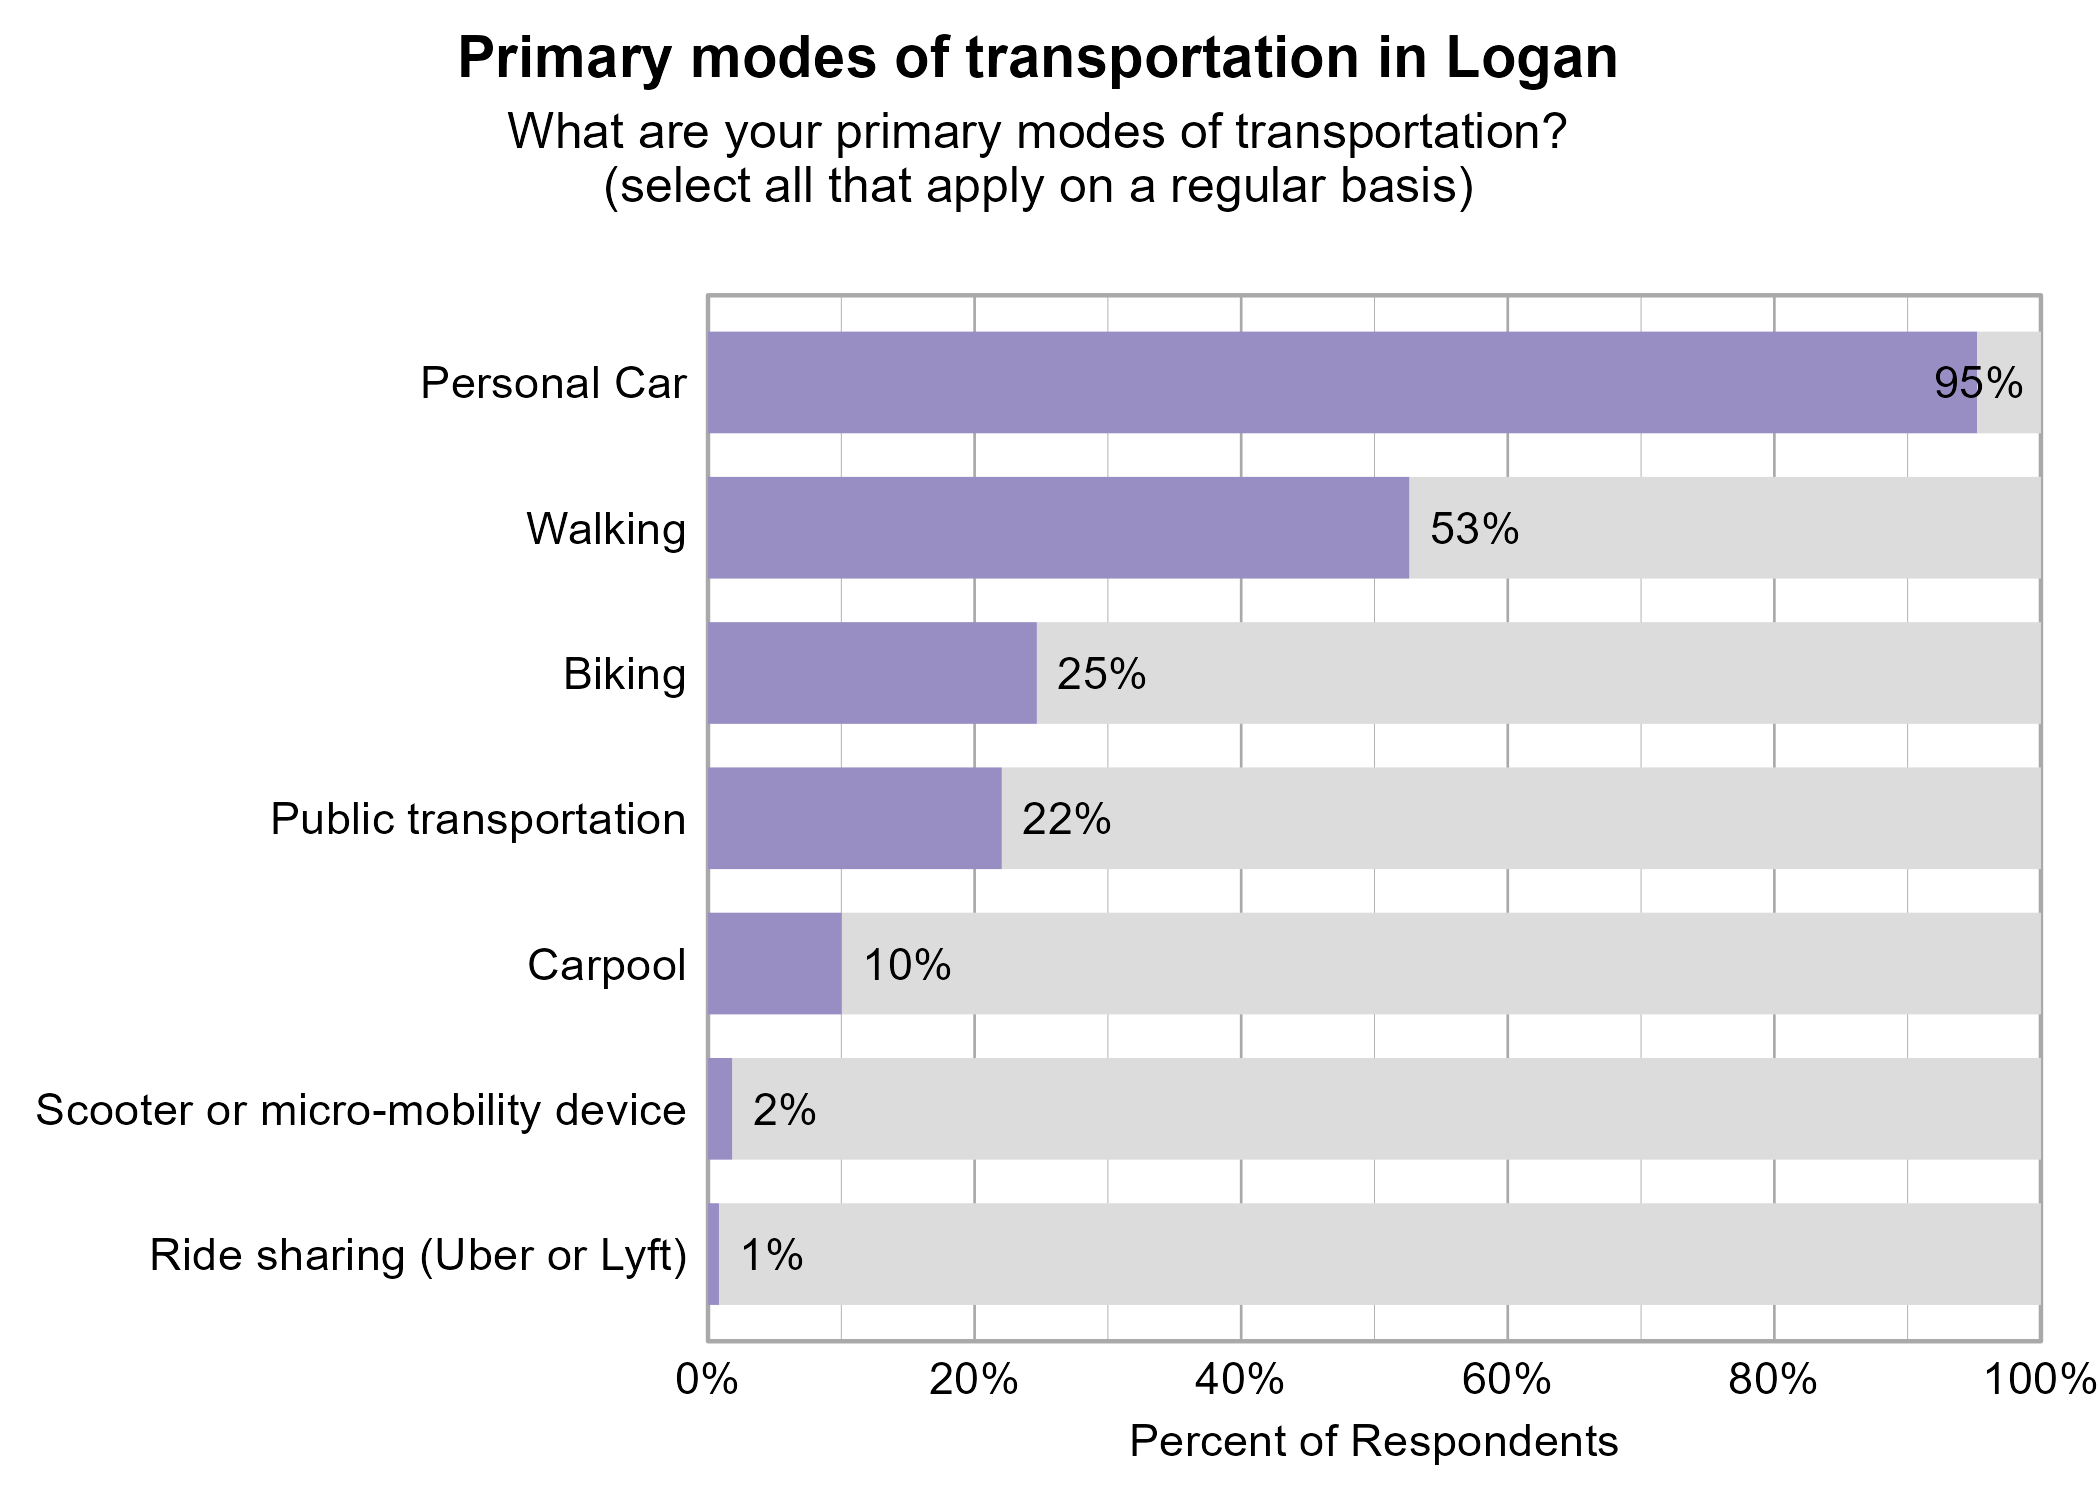
Respondents were asked to indicate all of their primary modes of transportation on a regular basis in Logan. The most popular modes of transportation were personal car (95%) and walking (53%).
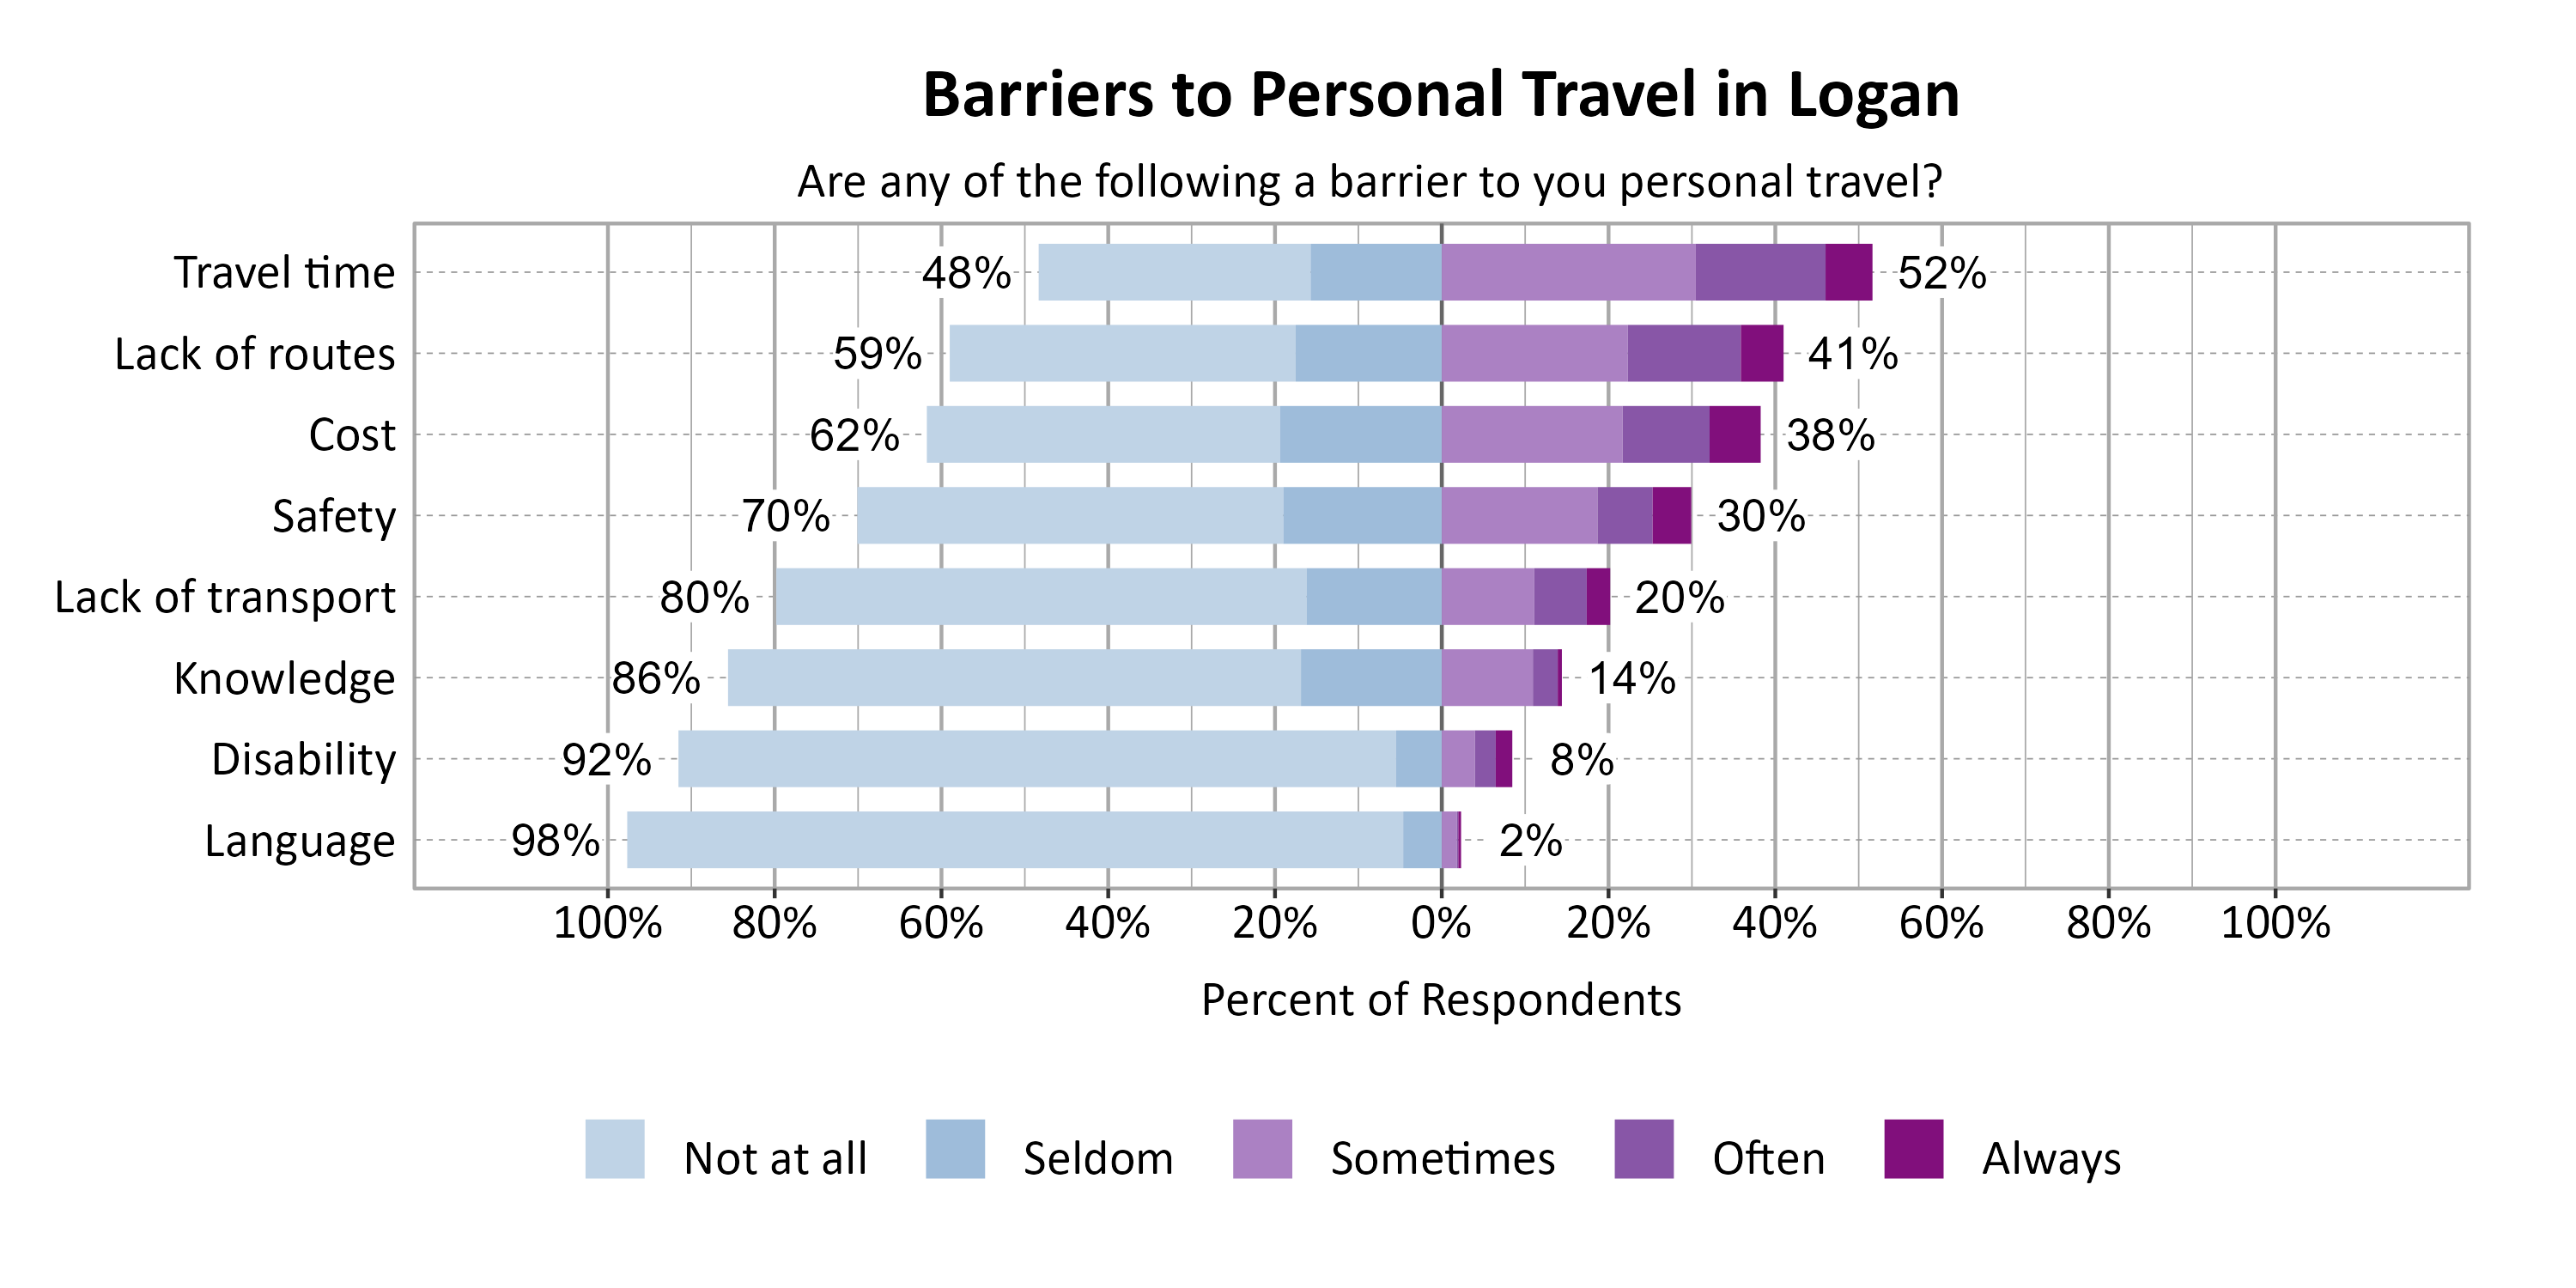
Respondents were asked to indicate the most common barriers to transportation in Logan. The most problematic barriers were Travel time (52%) and Lack of routes (41%).
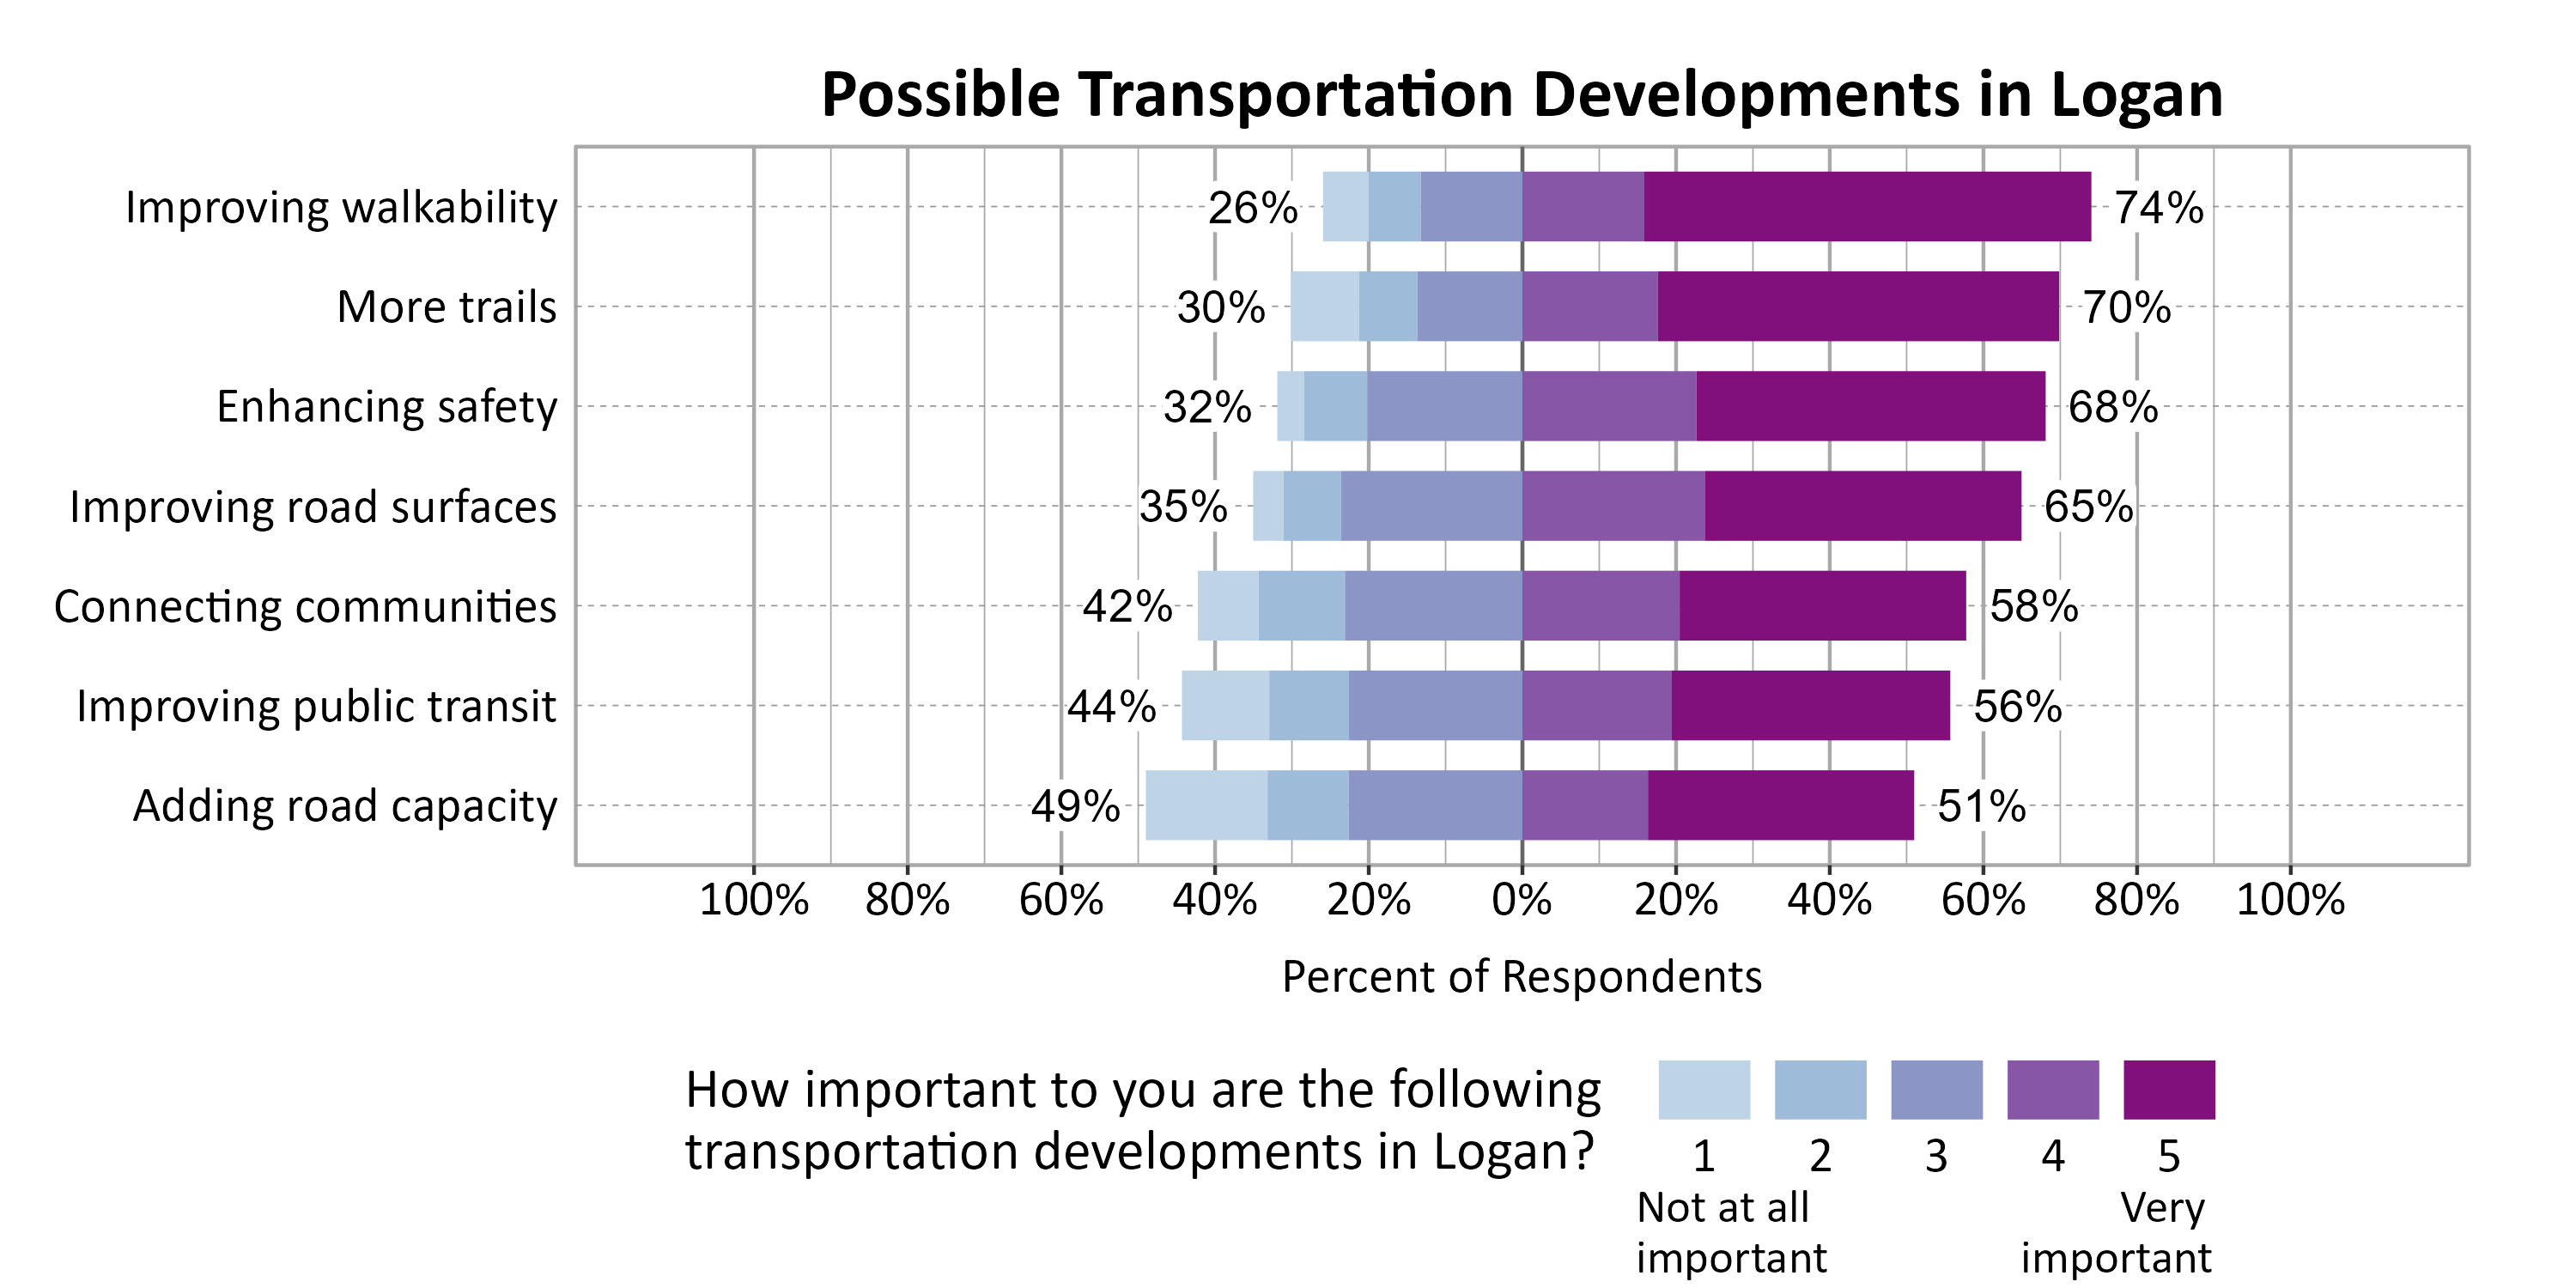
Respondents were asked to indicate the importance of a set of possible transportation developments in Logan. The most important development to respondents were Improving walkability (74%), More trails (70%), and Enhancing safety (68%).
Respondents were asked to indicate how frequently various activities take them out of Logan to another city or town. The most commonly indicated reasons for traveling to another city or town at least sometimes or once a month were Friends and Family (74%), Eating Out (53%), Other Services (51%), and Recreation/Sports (50%).
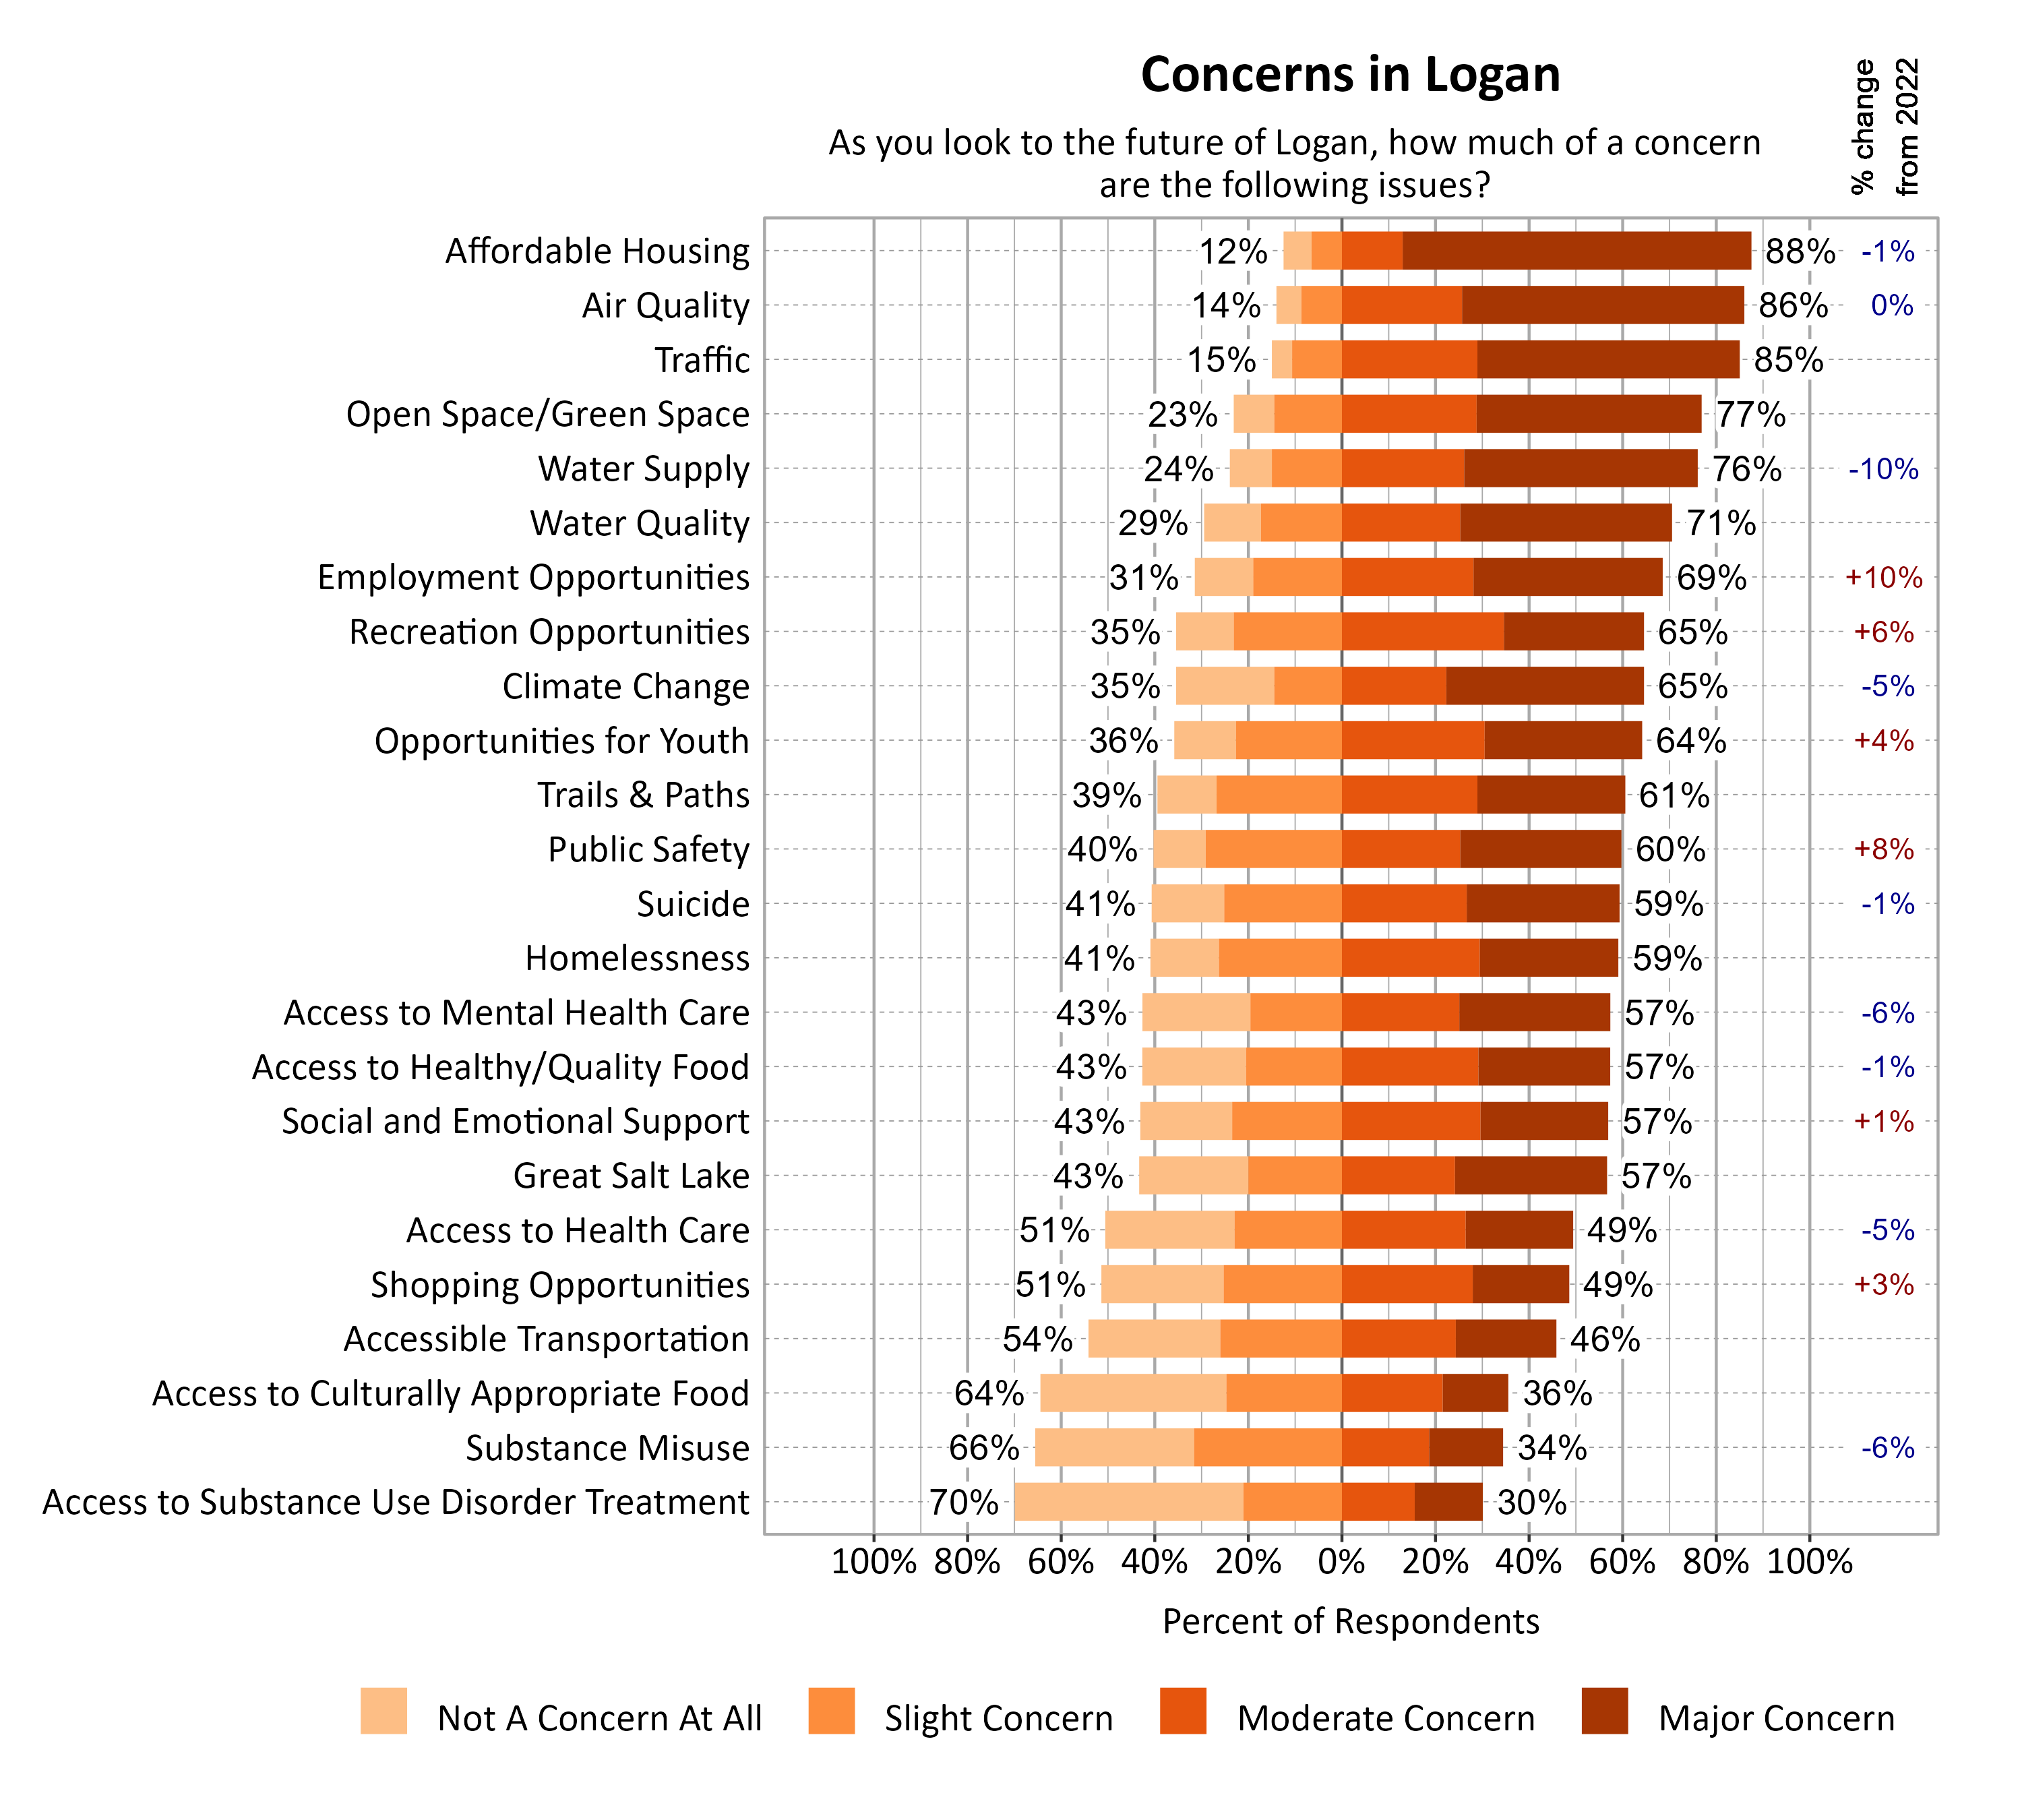
Concerns in Logan
Survey respondents indicated the degree to which a number of possible local issues were a concern as they look to the future of Logan. Affordable Housing (88%), Air Quality (86%), and Traffic (85%) were the top concerns. Since 2022, moderate or major concern about employment opportunities (+10%) notably increased, while concern about water supply (-10%) notably decreased.
Open Comments
All open comments collected in the survey were shared with city leaders. General observations and themes are shared here.
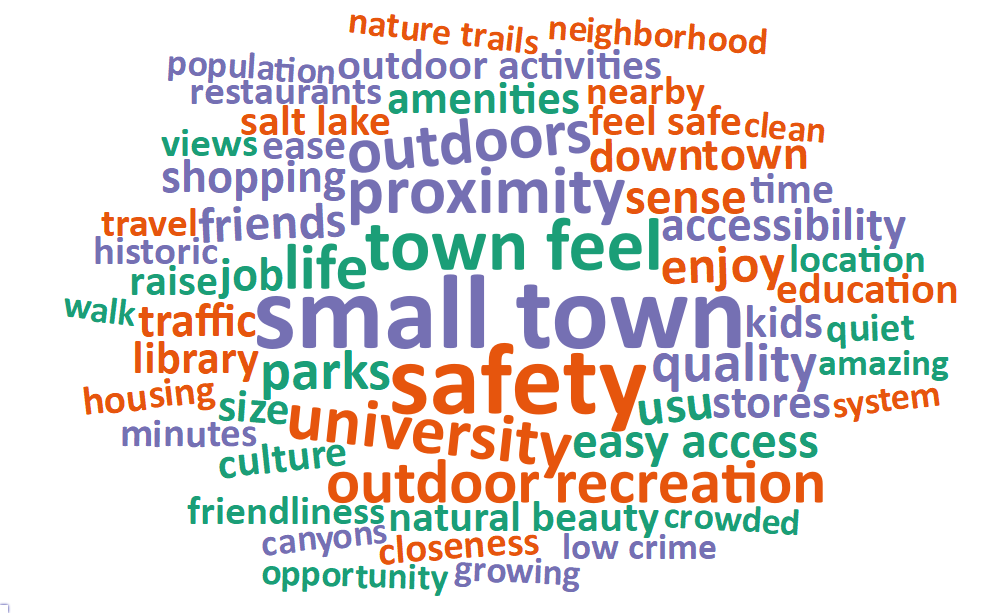
What Respondents Value Most in Logan
Survey respondents were asked to comment on what they value most about Logan. The most common words and phrases from all city comments are included in the word cloud below. It is possible that negative or unrelated words may appear since these words have been taken out of context, and they may not indicate the respondent’s intended meaning. Many respondents indicated that they value the nature and beauty in and around Logan, as well as the ease of accessing recreational activities in nature. Many expressed valuing the small town feel of Logan that is accompanied by bigger city amenities, such as retail opportunities, arts, community events, and public transportation. Many said they value the nice people, family, community, and friends they have in Logan. Several values the safety in Logan, both due to lower crime rates and the nature of the community. Some comments addressed accessibility and location, mentioning how easy it is to access amenities due to proximity and ease of transportation.
Local Environmental Quality in Logan
The 66% of respondents who rated the Local Environmental Quality domain as 1, 2, or 3 (Poor, Fair, or Moderate) were further asked if there are specific aspects of local environmental quality that they feel are problematic. Air Quality was a major concern, particularly related to inversions and idling cars. Water scarcity and quality were mentioned. Some residents described the taste of water as poor while others were concerned about water supply. Congestion and traffic were major concerns, and lack of bike lines or walk lanes frustrated respondents. There were a notable number of comments on recycling. Residents want a more productive recycling system and an easier way to dispose of glass. Trash and the lack of cleanliness of Logan were concerns as well. Green space was seen as important and diminishing as parks are de-emphasized for other developments or not well maintained.
Improving Wellbeing in Logan
Survey respondents were asked if there is anything that could be done to improve wellbeing in Logan. Many comments addressed concerns about transportation, particularly traffic, walkability, bike infrastructure, buses, and how these things relate to safety. Many requested restructuring road infrastructure to create more high traffic roads to relieve traffic burdens, especially on roads with businesses and housing, and to improve sidewalks, bike paths, bike lanes, and add more public transportation options (both within Logan and to other cities, such as Brigham City). Many brought up concerns about growth, development, and economic opportunities, especially in context of the housing crisis. There were concerns about traffic, housing affordability, and general cost of living. There were also many comments about recreation and local opportunities, particularly requests for a new recreation and/or community center, more community activities, and improving trails and parks. A few comments addressed concerns about diversity, inclusion, and community building, particularly in relation to local opportunities.
Additional Comments
Respondents were also asked if they had any additional comments on wellbeing in Logan. Transportation and growth and development were common themes in additional comments from Logan, particularly related to traffic and walkability. Many comments also mentioned housing issues, particularly issues with finding affordable housing. Issues were raised related to government, including complaints about corruption, growth and development choices, and the need for politicians or city officials to listen to the needs of the community. Several comments asked for more local opportunities, such as community events, a new rec center, and more winter time recreation options. A few comments addressed social climate, such as requests for more opportunities for non-LDS community members to find community and more acceptance for LGBTQ+ individuals.