Midvale Wellbeing Survey Findings 2024
By Dr. Courtney Flint and Team
![]()
Contact Information
Dr. Courtney Flint
courtney.flint@usu.edu
435-797-8635
Summary
Midvale is one of 51 cities participating in the Utah Wellbeing Survey Project in 2024. This project is designed to assess the wellbeing and local perspectives of city residents and to provide information to city leaders to inform general planning processes. Additional analysis is underway and this report may be updated over time.
We are grateful to all those who took the survey and to our city partners who helped to make this possible. We are grateful to a number of entities for funding: the Utah League of Cities and Towns, USU Extension, USU’s Institute for Land Water and Air, the Wasatch Front Regional Council, Utah Department of Transportation, the Utah Agricultural Experiment Station, and the cities of Alpine, Cedar Hills, Draper, Millcreek, Nephi, North Salt Lake, Ogden, Orem, Pleasant Grove, Providence, Springdale, Tremonton, West Bountiful, and West Valley City.
This report describes findings from the 2024 Midvale survey and comparative information with other project cities. In April and May 2024, Midvale City advertised the survey for residents largely through newsletters, utility bills, and the city website. All city residents age 18+ were encouraged to take the online Qualtrics survey.
How many people responded?
- 68 viable surveys were recorded in this 2024 survey effort.
- The Midvale 2022 survey had 52 responses.
- The adult population of Midvale was estimated at 27,560, based on the American Community Survey by the U.S. Census. The 68 survey responses in 2024 represent 0.2% of the adult population and have a conservative margin of error of 11.87%. Due to the low number of respondents and the high conservative margin of error, caution should be used when interpreting these survey results.
Survey Respondent Characteristics
| Resident Statistics | |
|---|---|
| Full Time Residents of Midvale | 100.0% |
| Part Time Residents of Midvale | 0.0% |
| Length of Residency — Range | 1-73 years |
| Length of Residency — Average | 12.6 years |
| Length of Residency — Median | 8 years |
| Length of Residency 5 Years or less | 37.3% |
| ZIP Code | Percent |
|---|---|
| 84047 | 97.1% |
| 84070 | 2.9% |
| City Area | Percent |
|---|---|
| 1 - Bonnie Billings (Blue) | 21.5% |
| 2 - Paul Glover (Green) | 20.0% |
| 3 - Heidi Robinson (Yellow) | 23.1% |
| 4 - Bryant Brown (Purple) | 15.4% |
| 5 - Dustin Gettel (Red) | 20.0% |

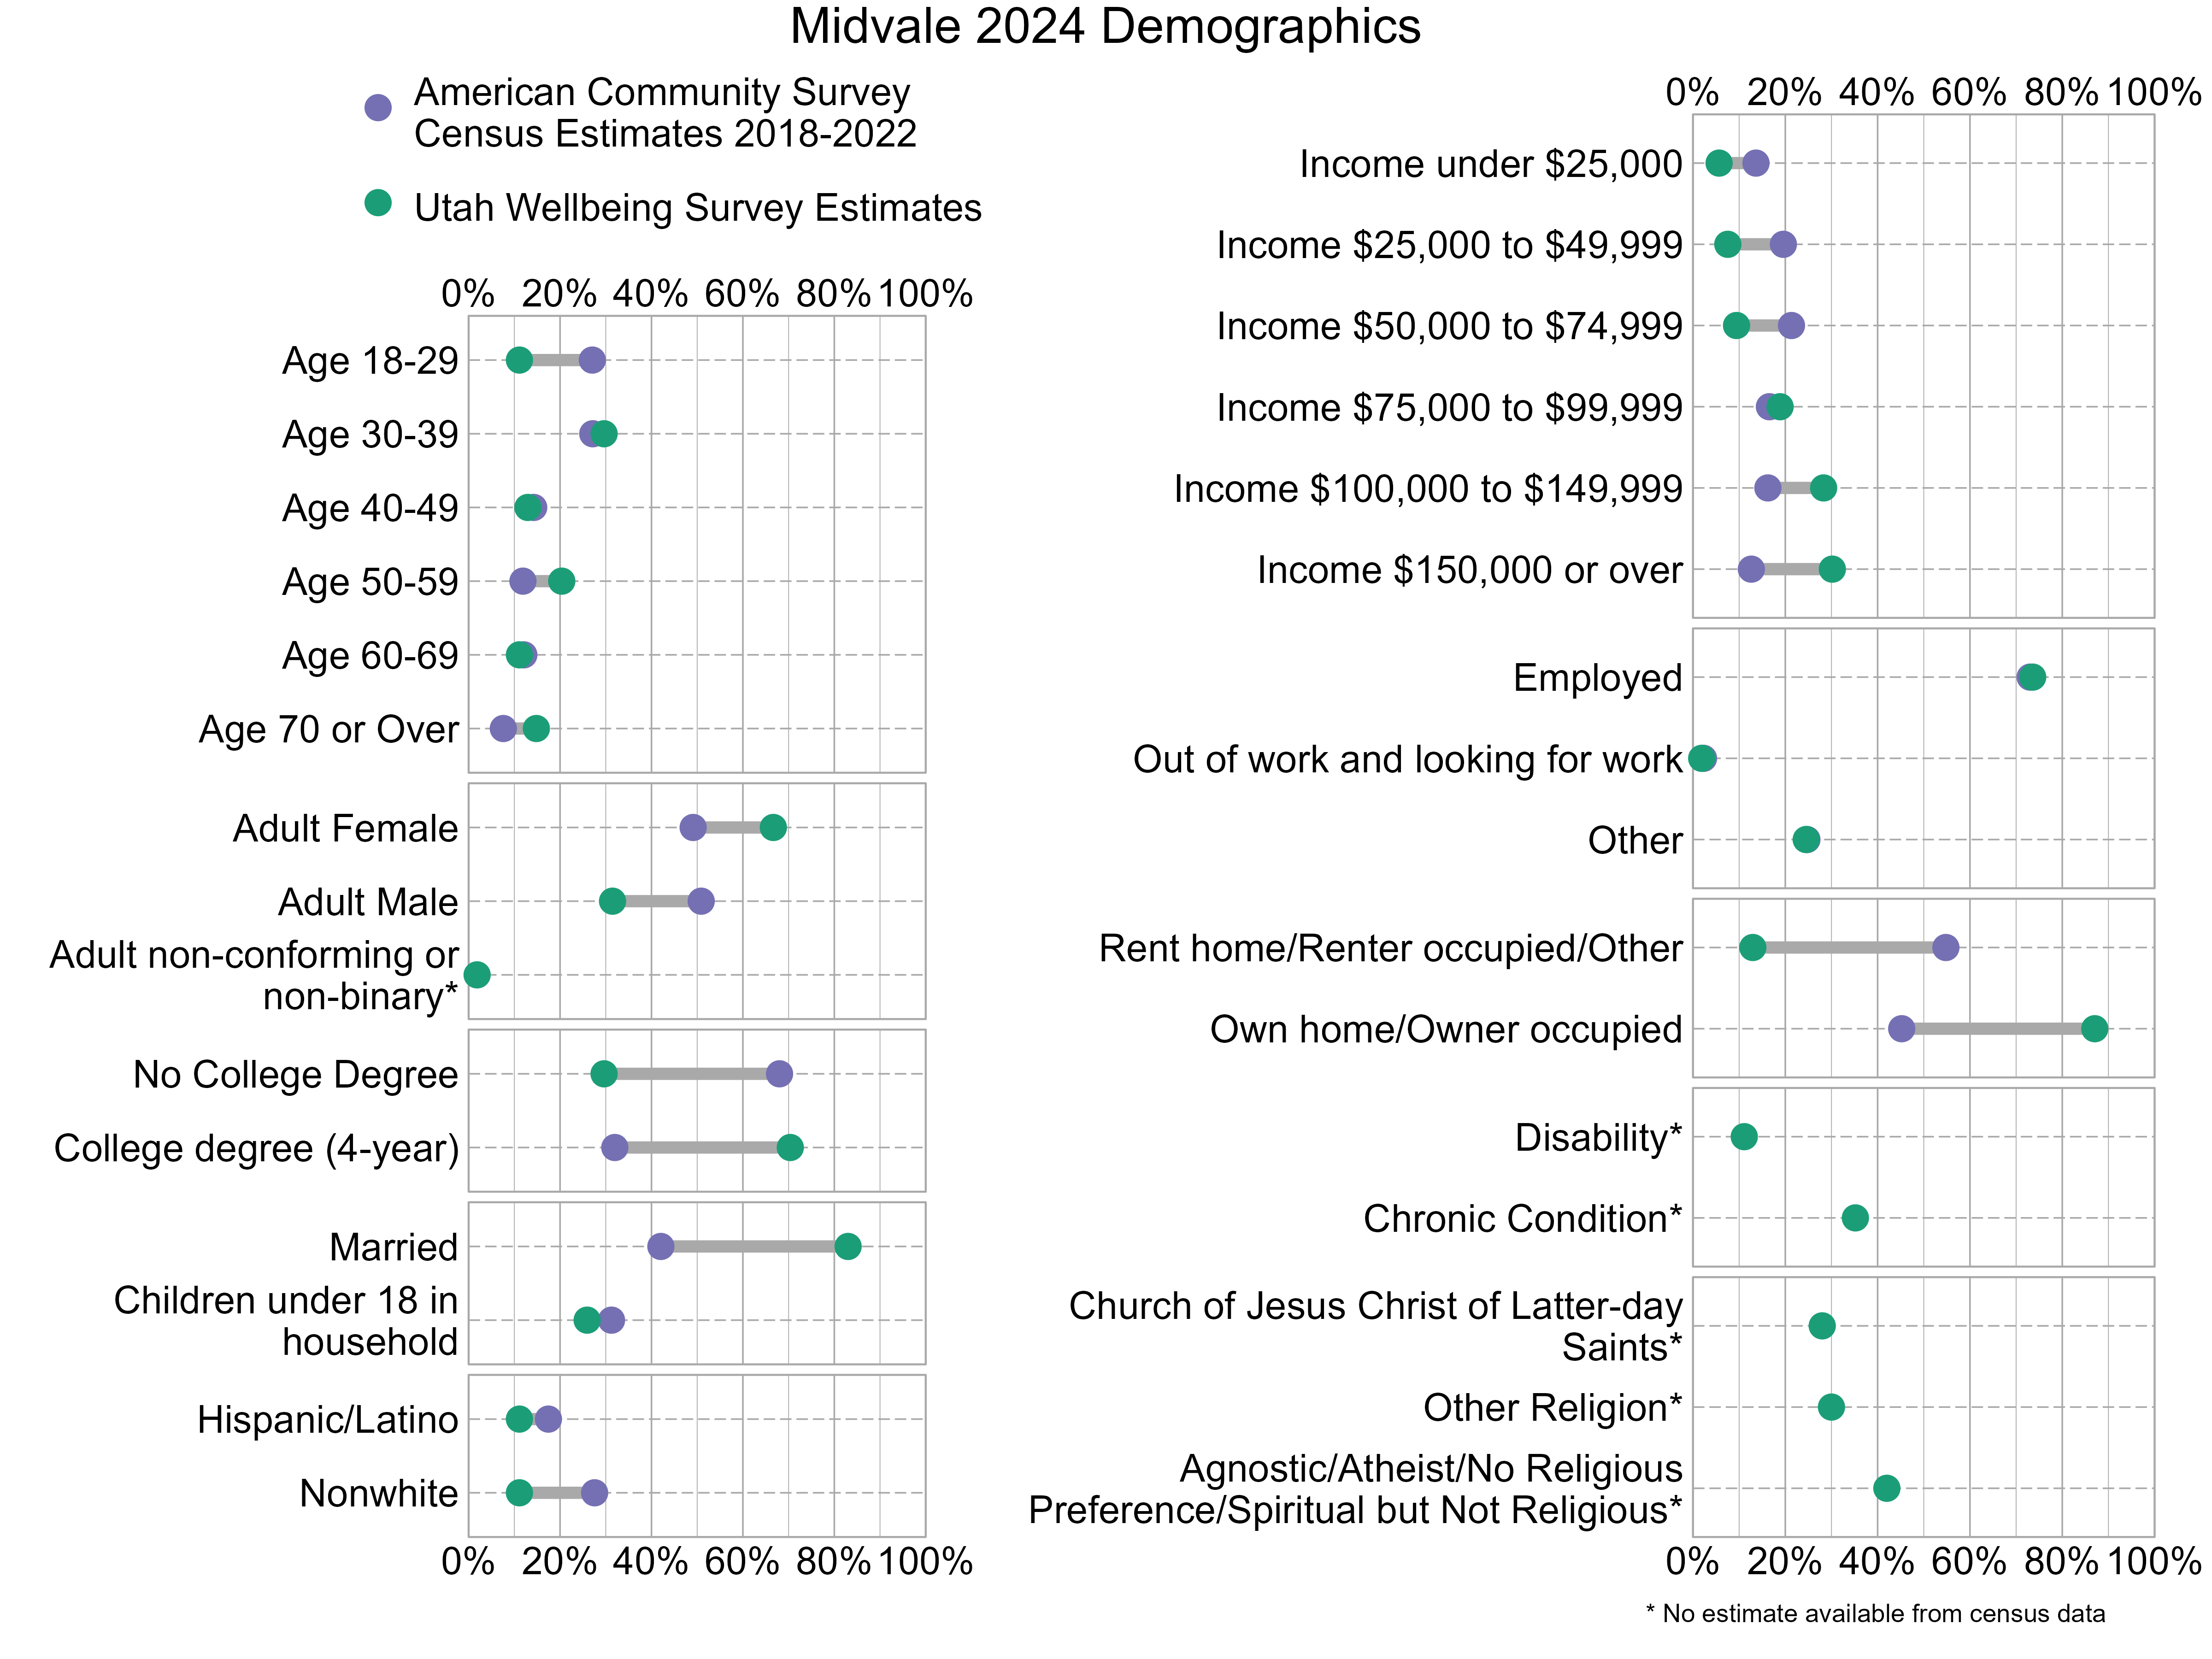
Demographic characteristics of the survey respondents were compared below with U.S. Census information from the 2018-2022 American Community Survey. In the graph below, gray bars indicate differences between the American Community Survey estimates and the Utah Wellbeing Project surveys. The wider the gray bars, the larger the differences. Also note that estimates for religious affiliation, adult non-conforming or non-binary gender, disability, and chronic conditions are unavailable from the census data. There can also be a variable margin of error in the American Community Survey estimates, and caution should be used when comparing estimates. Not all respondents provided demographic information. As the graph shows, 2024 survey respondents were not fully representative of Midvale. People who are adult females, have at least a 4-year college degree, have an income $150,000 or over, are married, and own their homes were overrepresented while those who are age 18-29, are adult males, do not have a college degree, are nonwhite, and are renters were underrepresented.
Overall Personal Wellbeing and Overall Wellbeing in Midvale
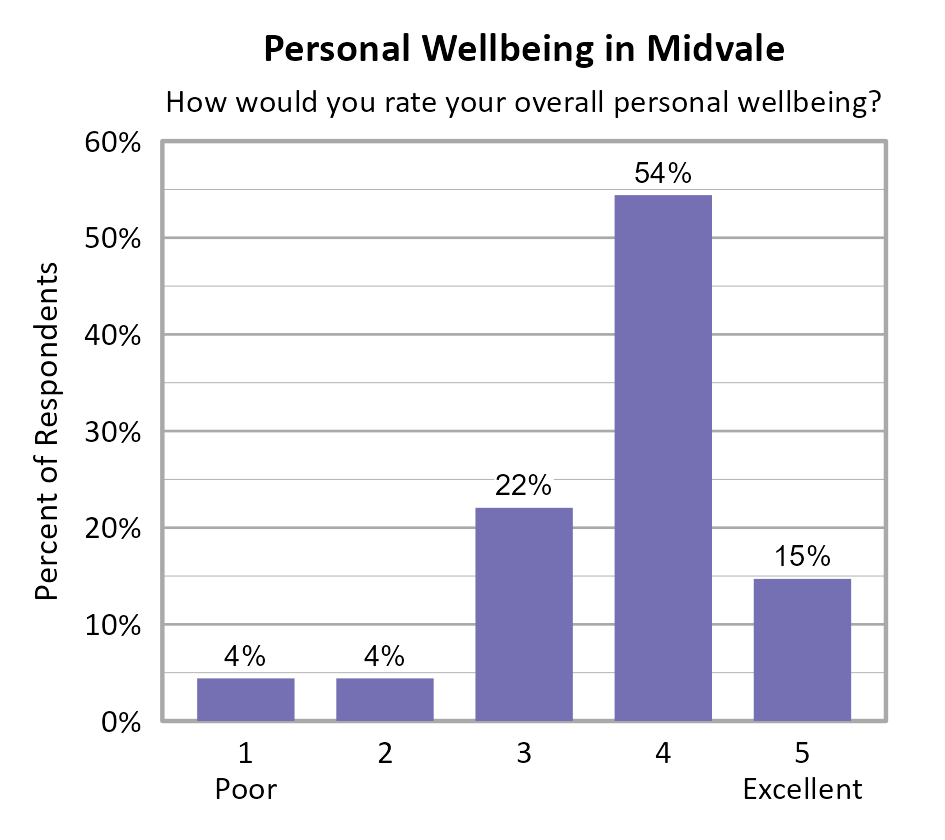
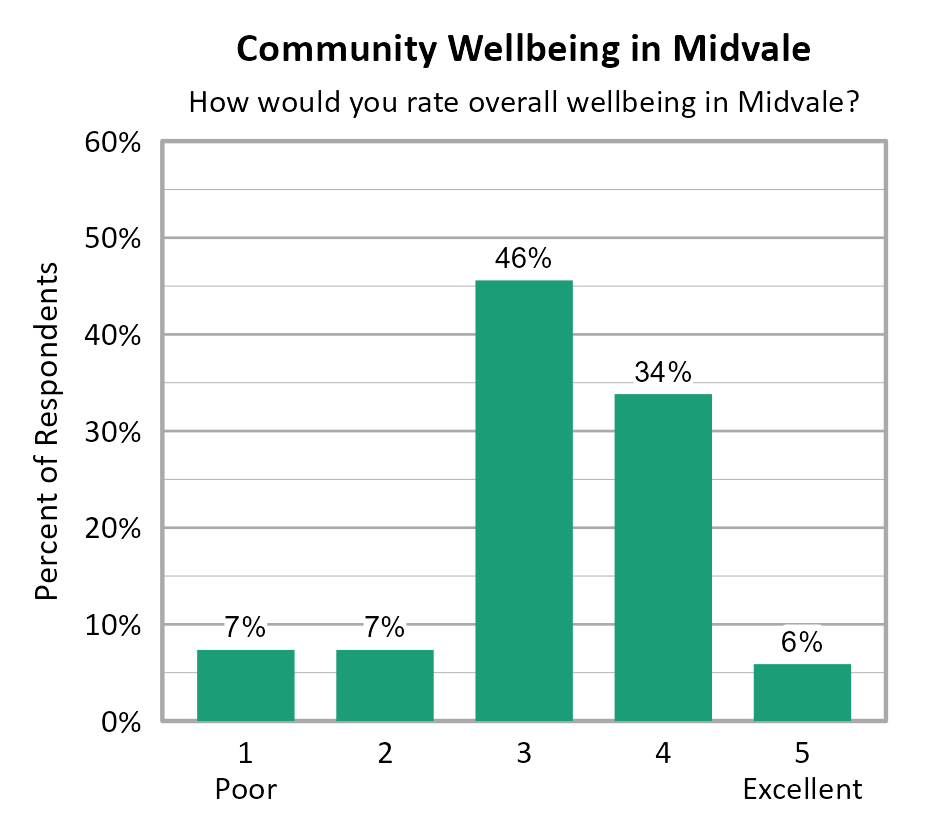
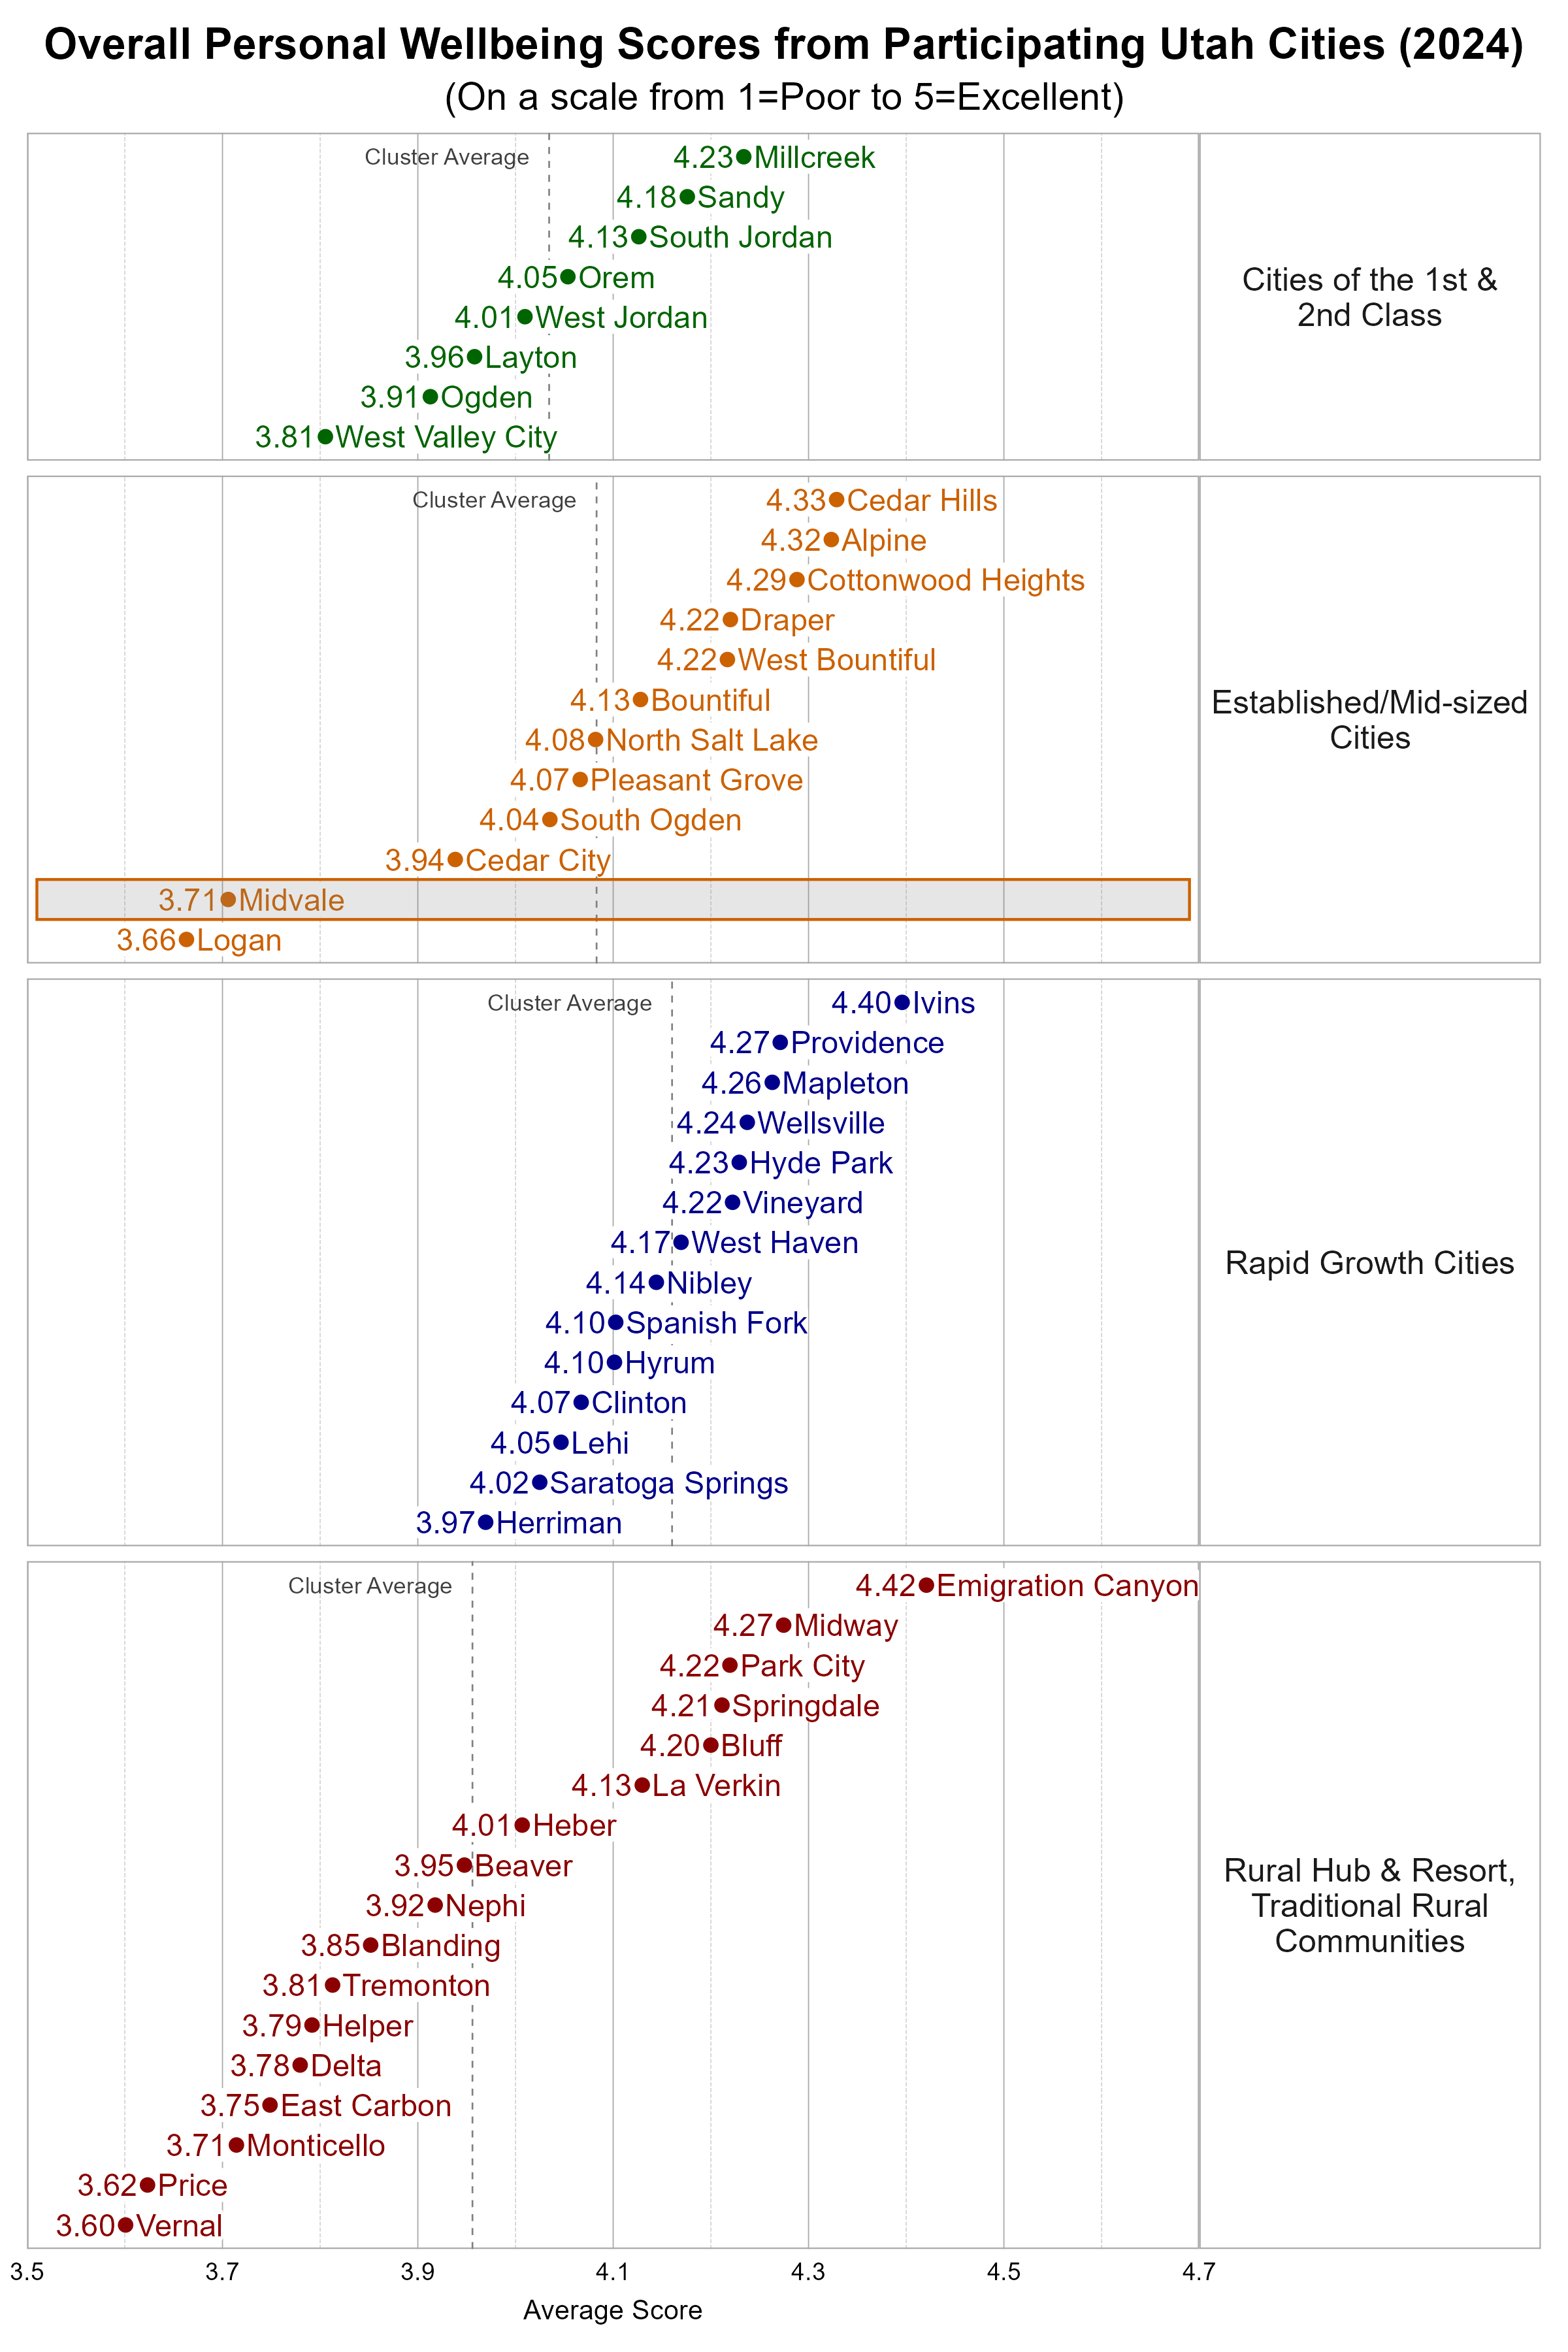
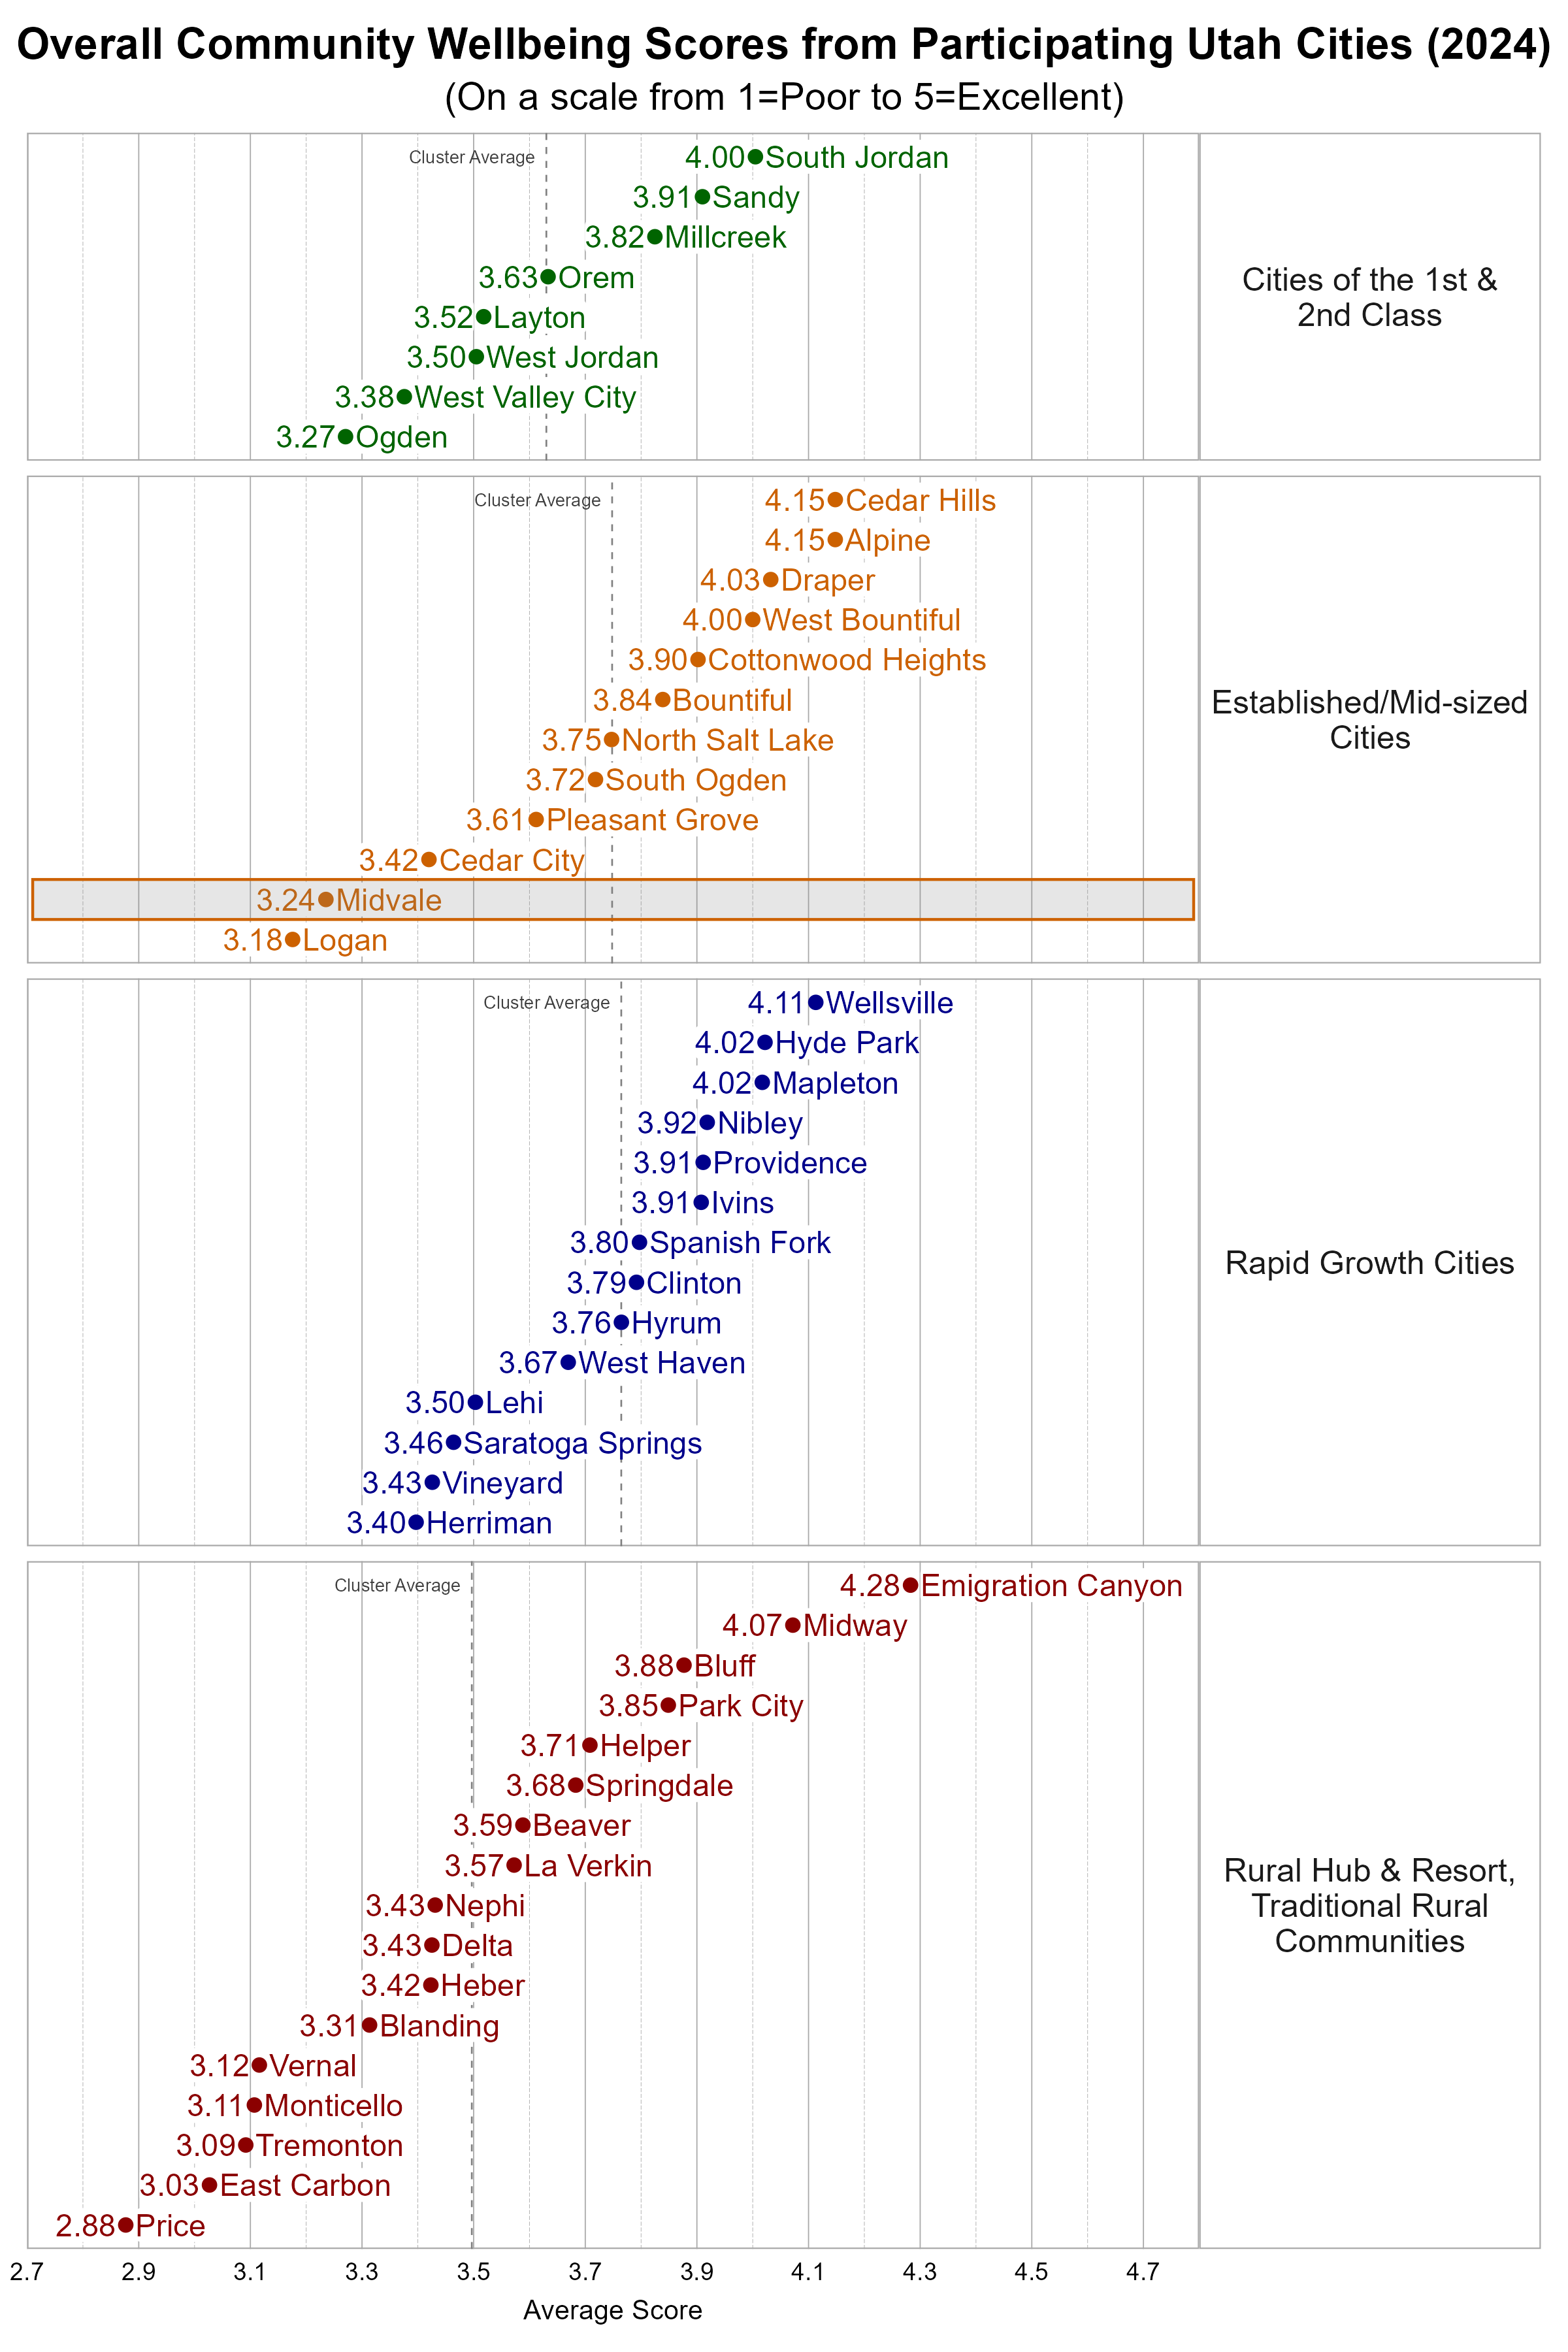
Survey participants were asked about their overall personal wellbeing and overall community wellbeing in Midvale. These wellbeing indicators were both measured on a 5-point scale from poor (1) to excellent (5). The average personal wellbeing score in Midvale was 3.71 with 69% of respondents indicating their wellbeing at a 4 or 5 on the 5-point scale. The average score for community wellbeing in Midvale was 3.24 with 40% of respondents indicating community wellbeing at a 4 or 5 on the 5-point scale. The 5 different council districts in Midvale did not have statistically significant different overall personal and community wellbeing scores, but each district had relatively few responses.
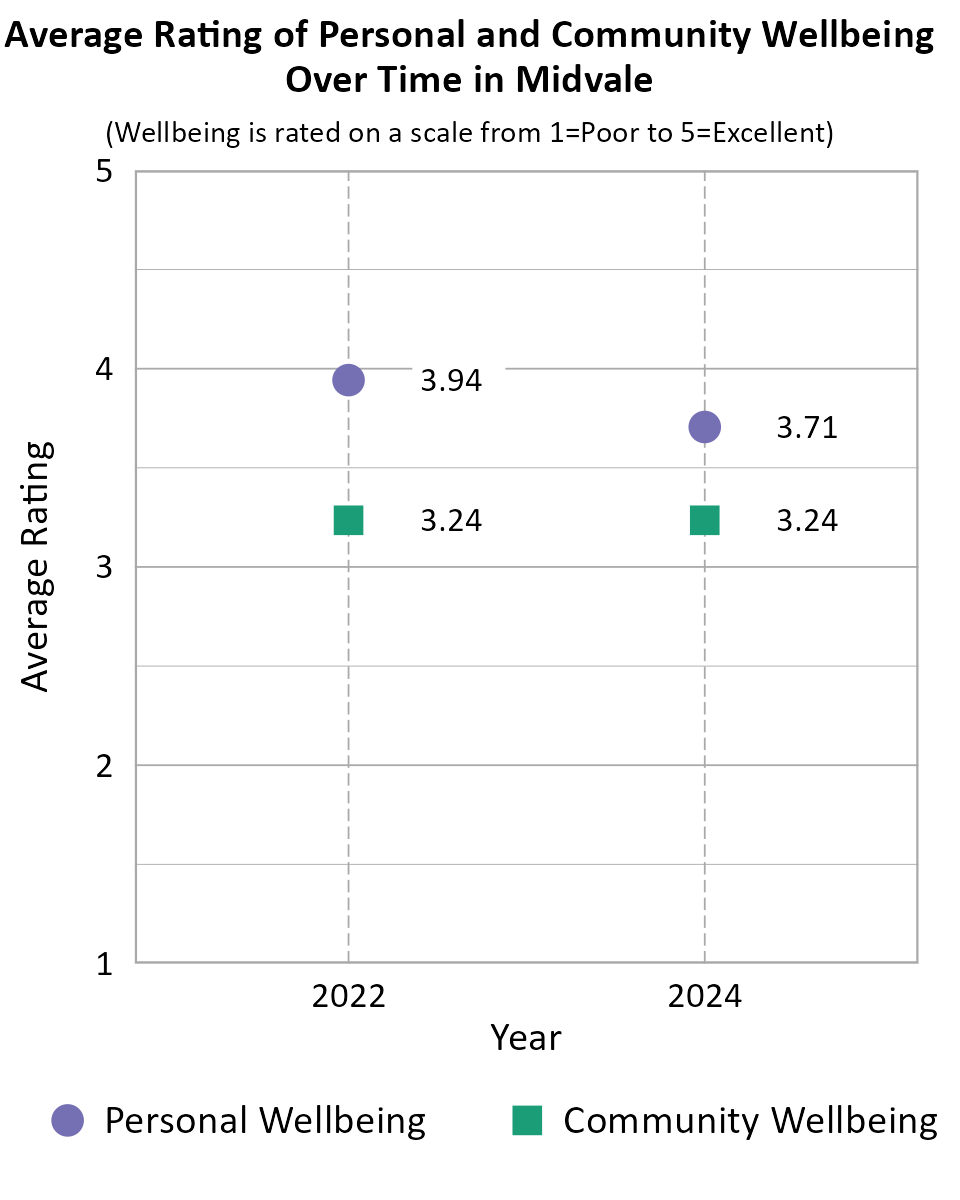
When comparing survey data from Midvale over the years as shown in the information below, we can see that the average personal wellbeing score declined between 2022 and 2024. The average community wellbeing score remained nearly the same between 2022 and 2024. Note that the number of respondents differed between years, there is no tracking of individuals from one year to the next, and the low end of the scale was "Poor" in 2024 but "Very Poor" in prior years which may account for differences in scores over time.
Comparing Wellbeing Across Utah Cities
The Utah League of Cities and Towns clusters cities and towns into five different categories based on size and growth rates. We utilize these clusters in our analysis. Midvale is classified as an Established/Mid-sized City. Some cities may fit within more than one cluster.
Within the more Urban city cluster, Midvale was below the average overall personal wellbeing score and below the average overall community wellbeing score.
Wellbeing Domains in Midvale
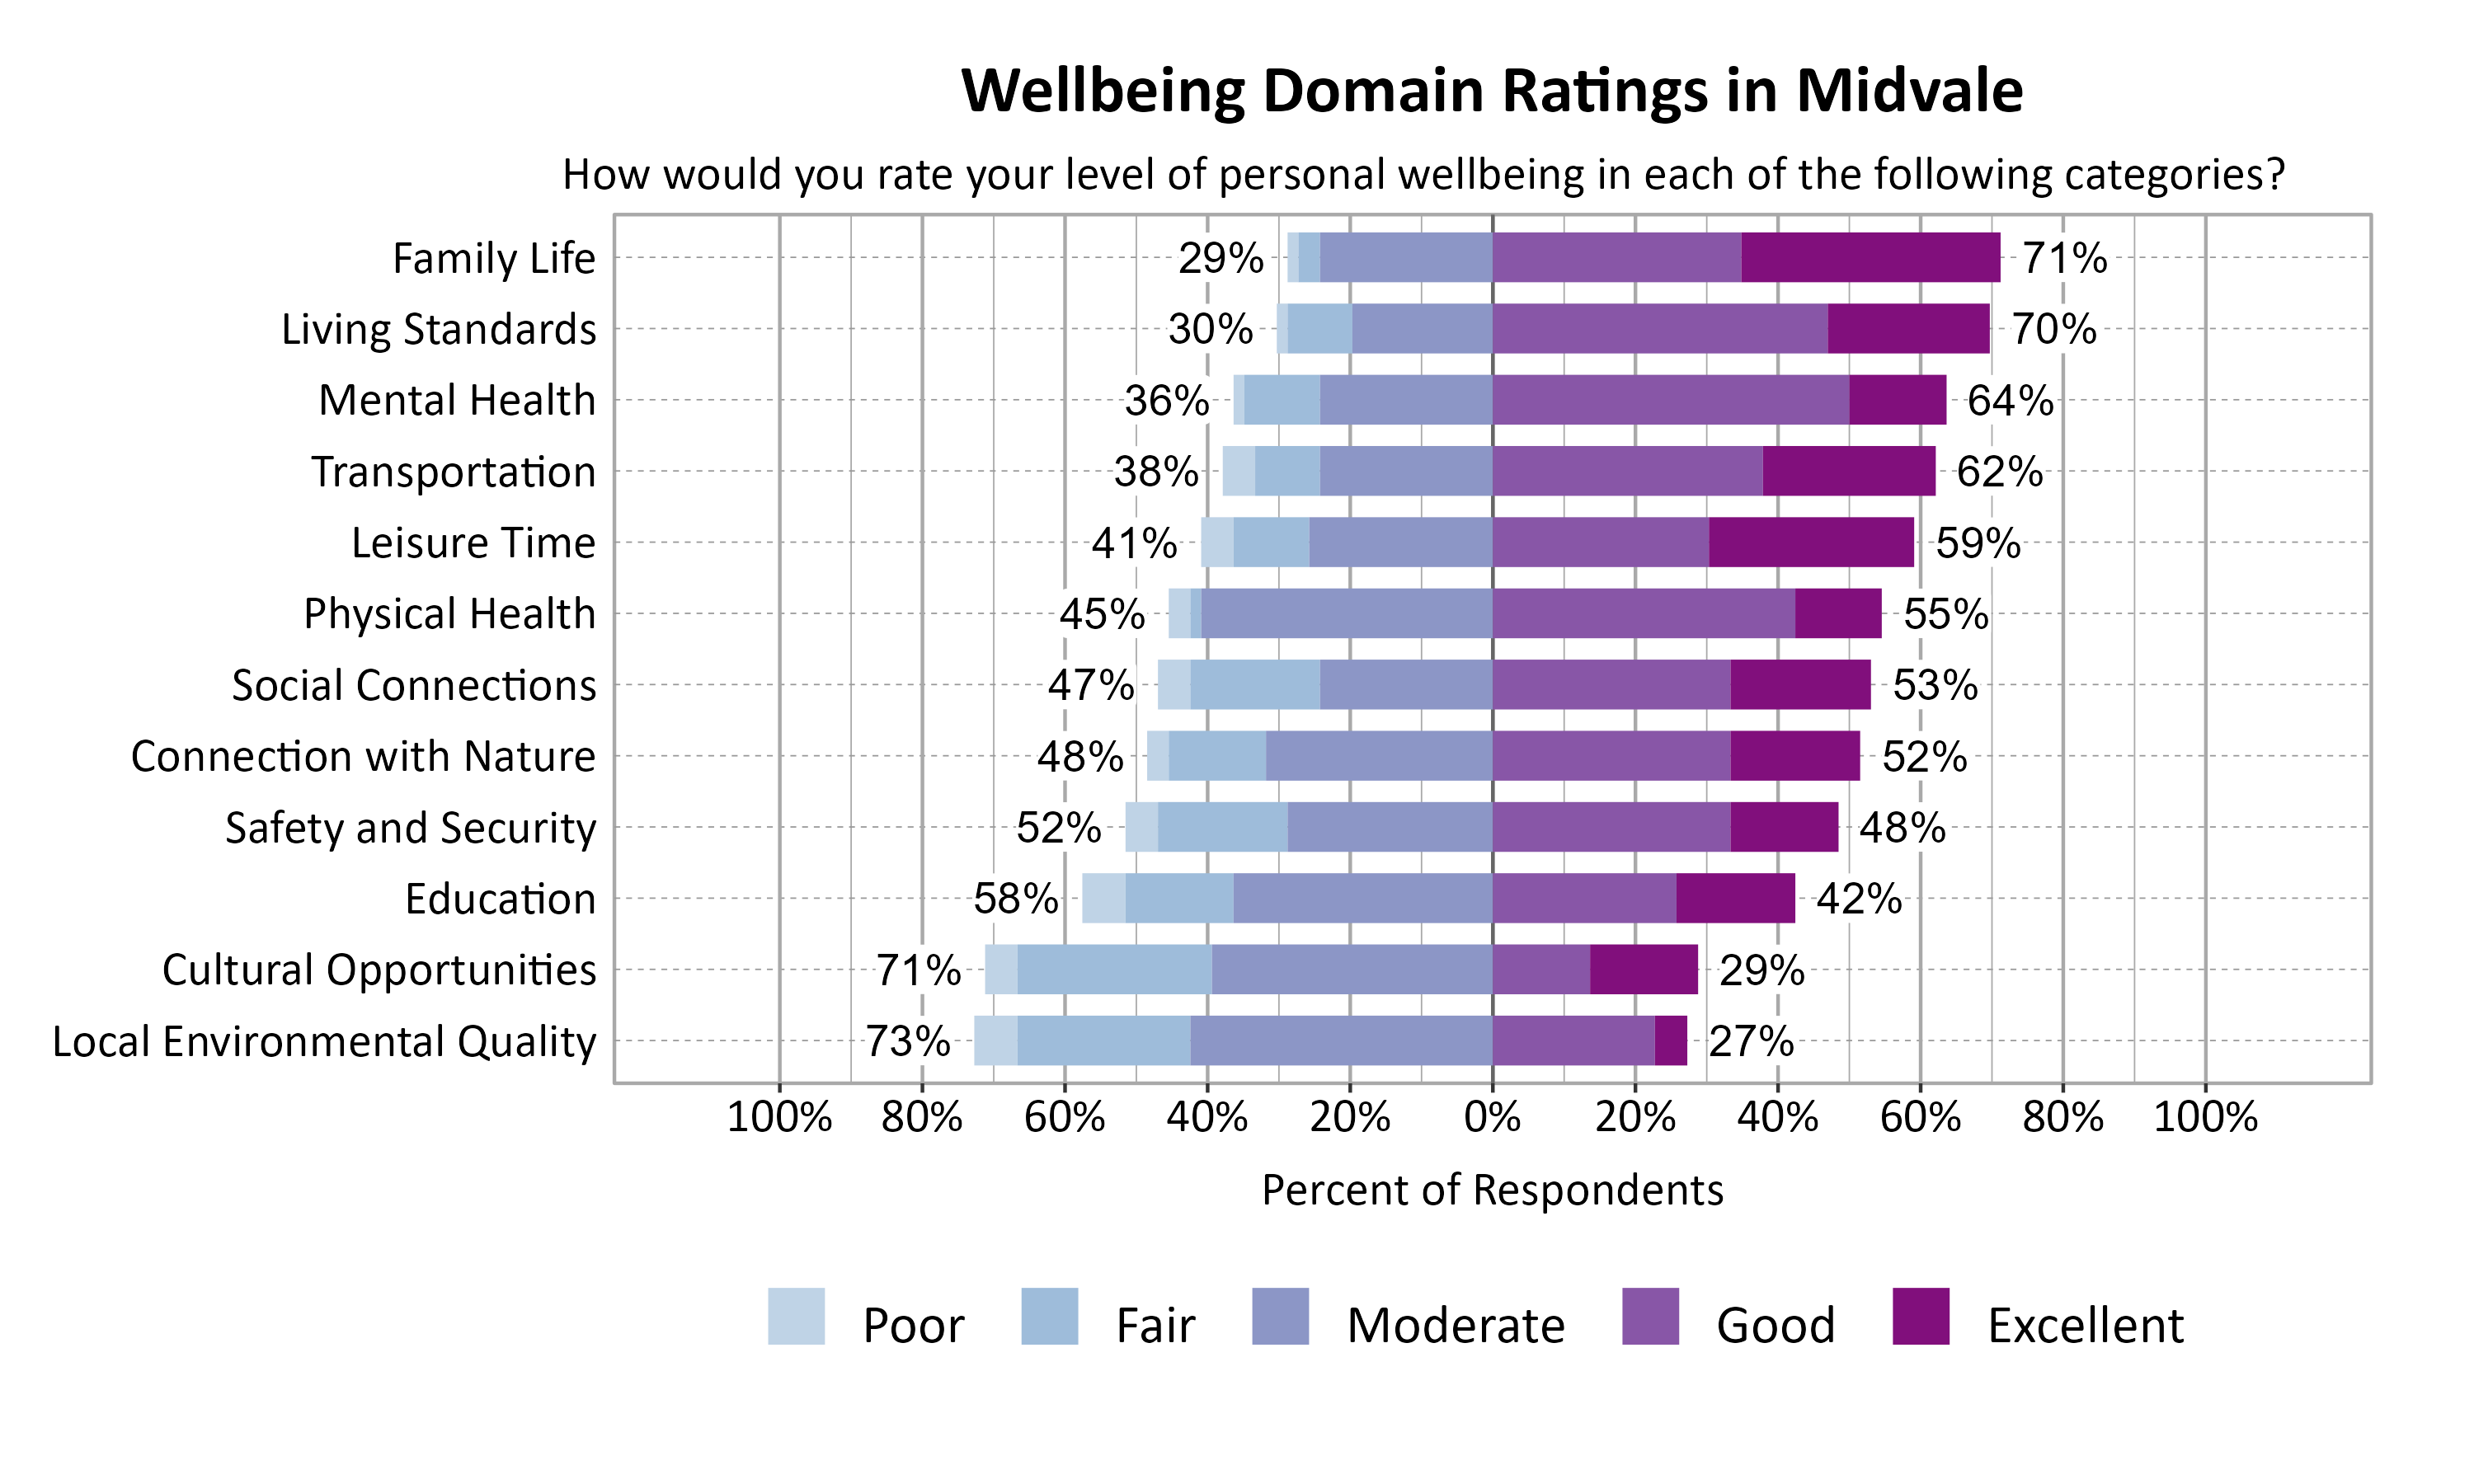
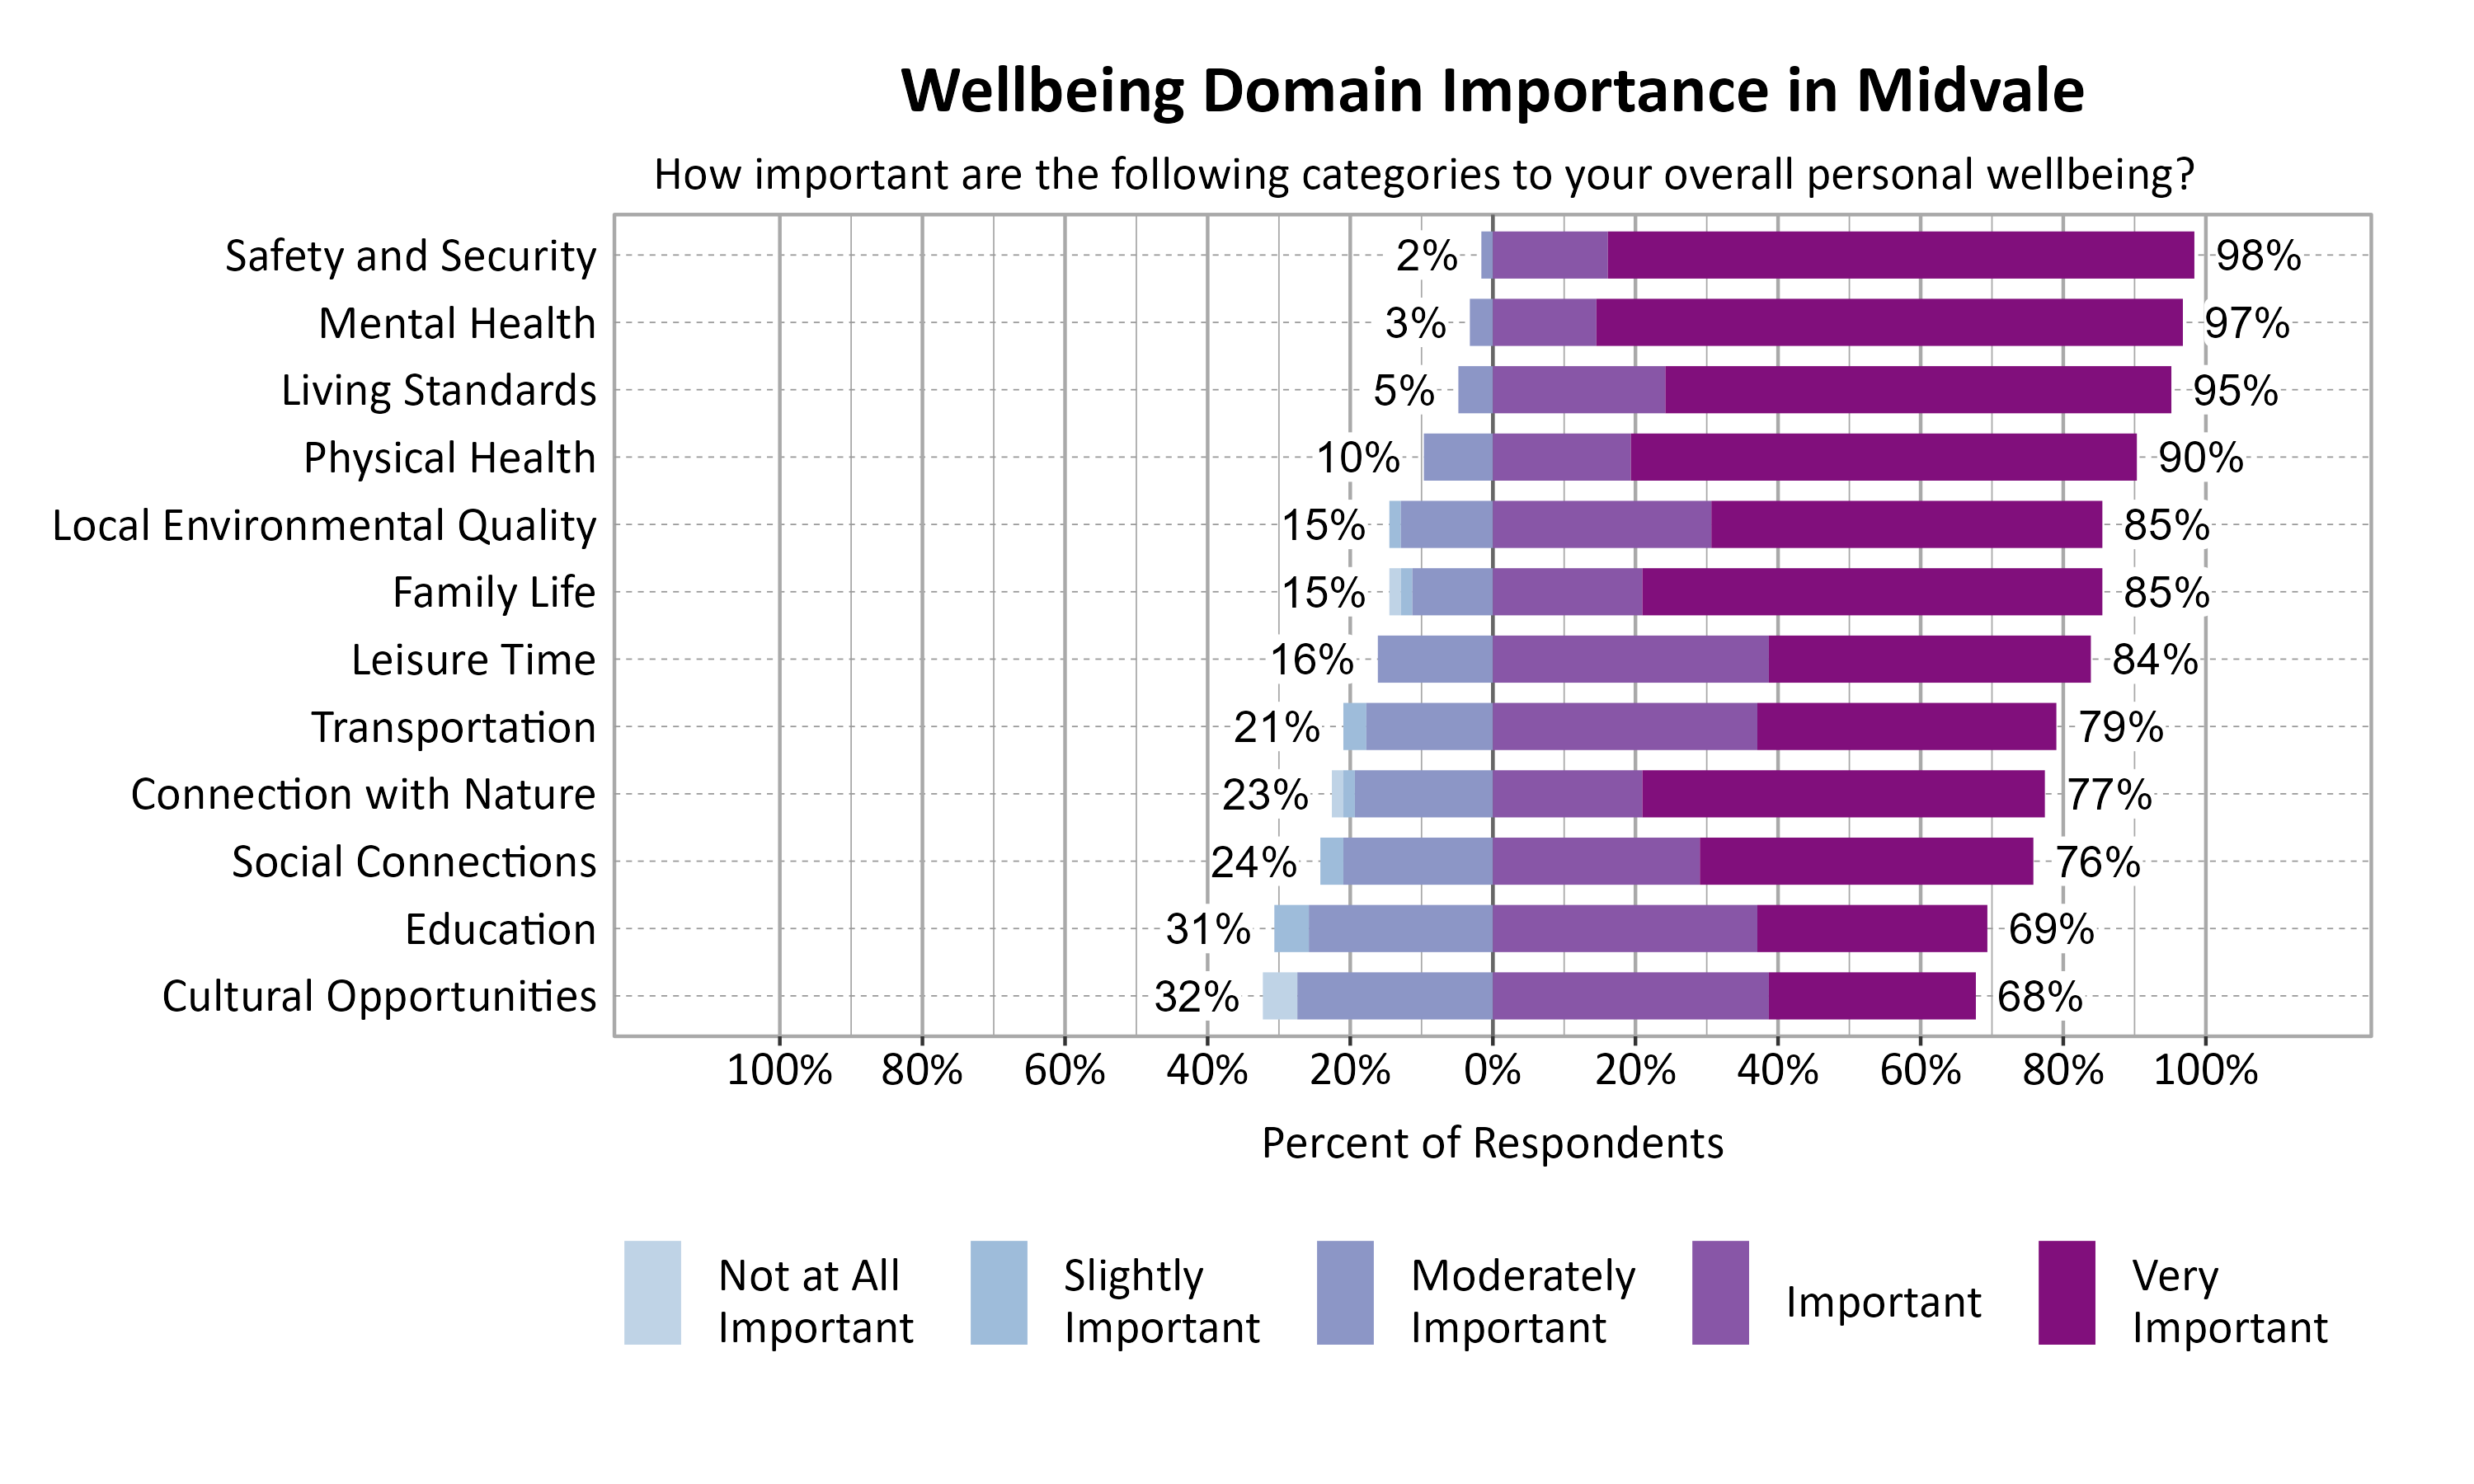
According to national and international entities that track wellbeing, there are a number of common dimensions or domains of wellbeing. Survey respondents rated twelve domains on a 5-point scale from poor to excellent. They were also asked to indicate the importance of each domain to their overall personal wellbeing on a 5-point scale from not at all important to very important. The highest rated wellbeing domains for respondents in Midvale were Family Life (71%), Living Standards (70%), and Mental Health (64%). The most important wellbeing domains were Safety and Security (98%), Mental Health (97%), and Living Standards (95%).
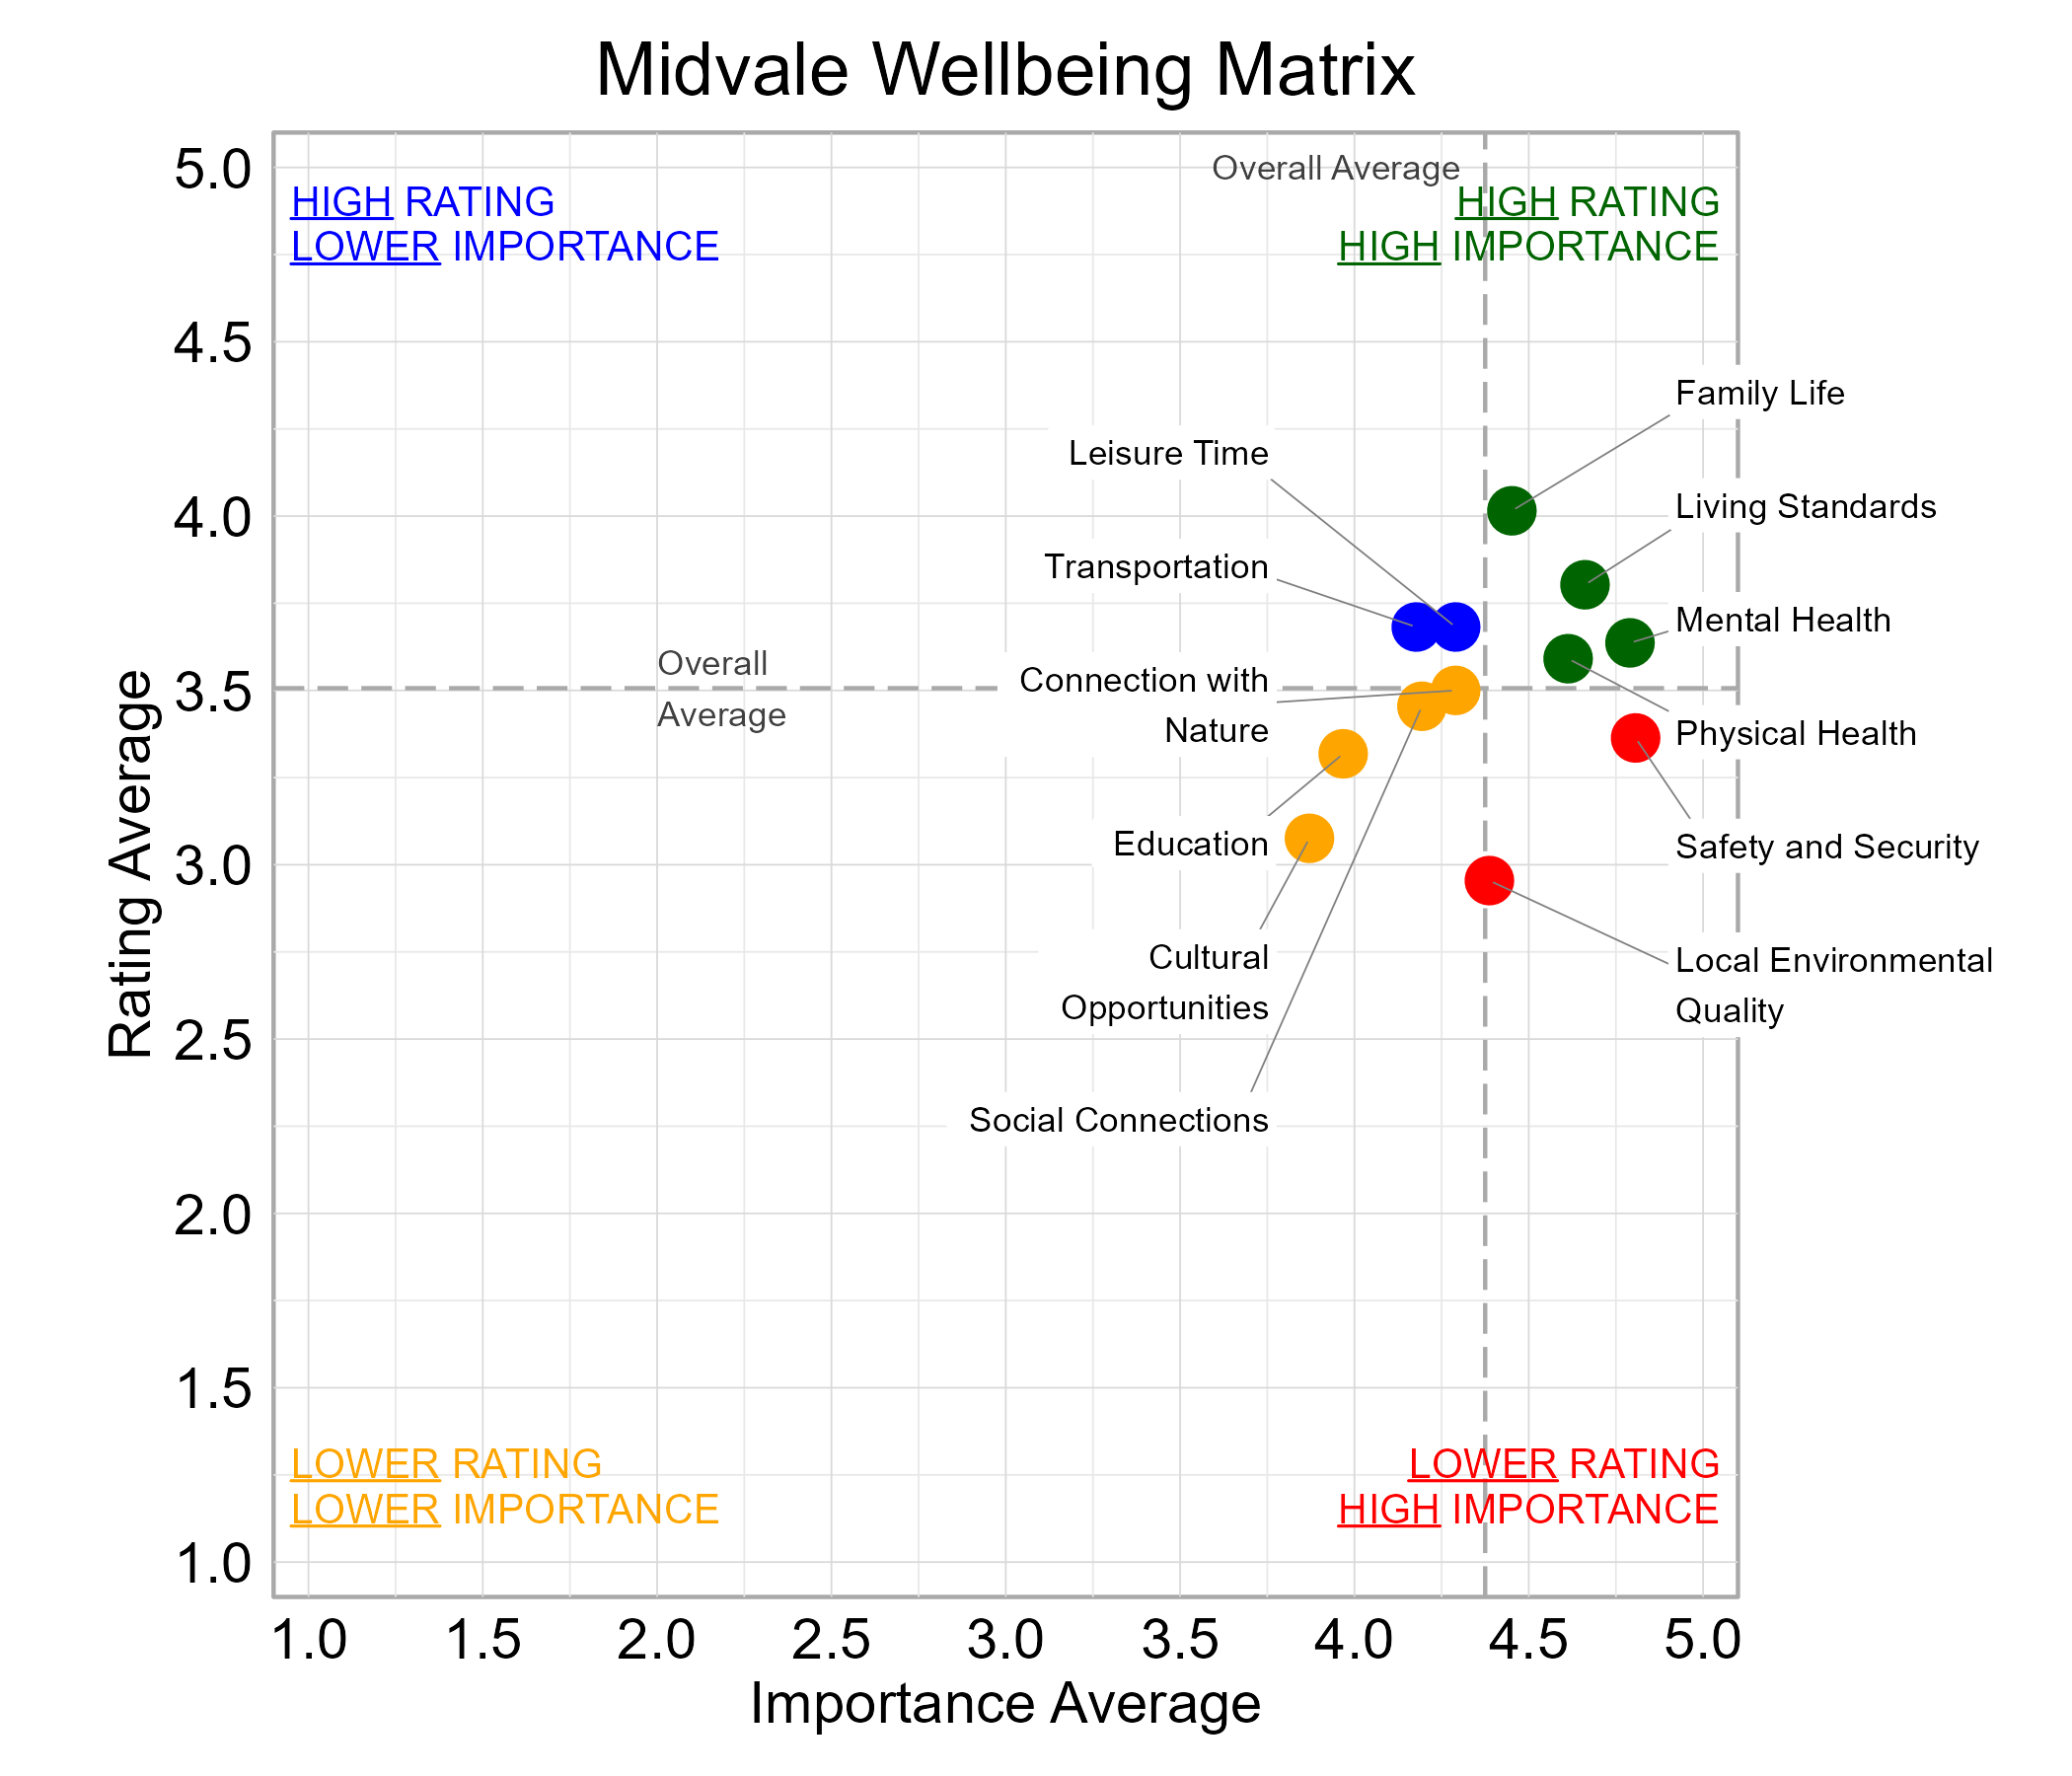
Wellbeing Matrix for Midvale
The graph below illustrates the relationship between the average rating and the average importance of wellbeing domains for survey respondents from Midvale. Family Life, Living Standards, Mental Health, and Physical Health were highly important and rated above average among the domains. Local Environmental Quality and Safety and Security fell in the “red zone” of higher importance and lower ratings.
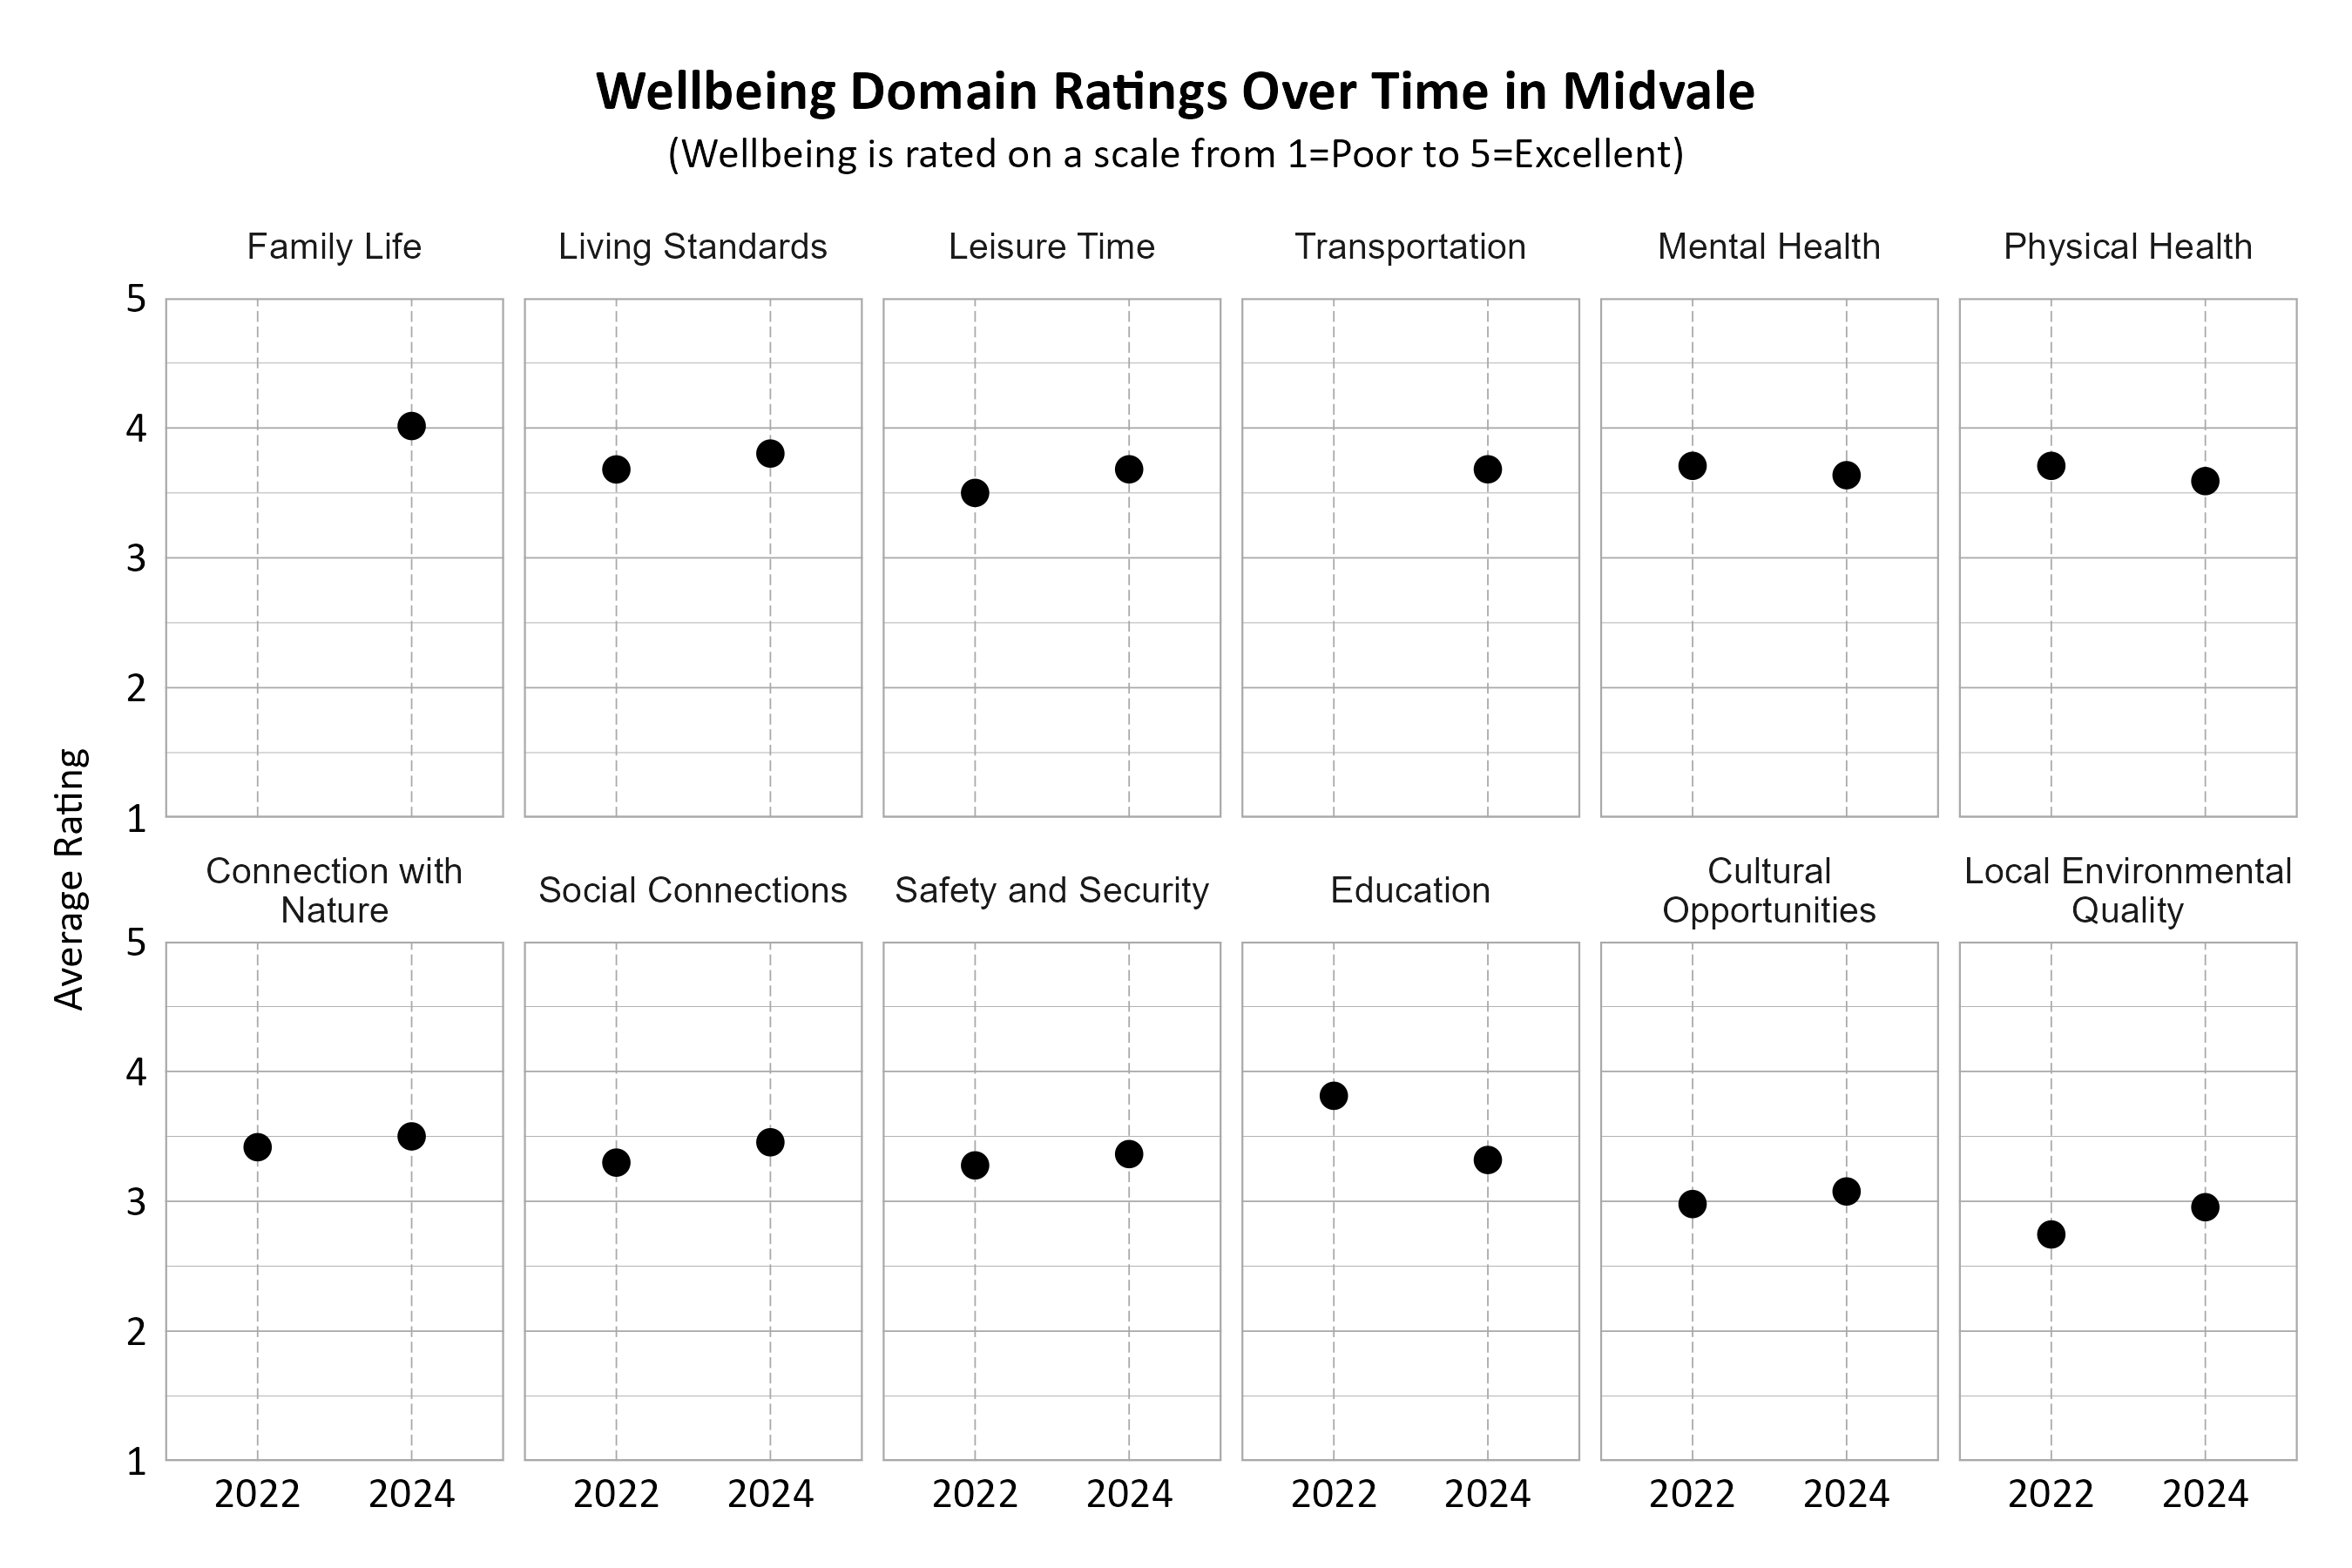
Wellbeing Domains Over Time in Midvale
The graphs below show how the domains were rated over the years by Midvale residents. The number of respondents changed over time. Note that the two domains Family Life and Transportation were new categories in the 2024 survey and were not measured in previous years. Most domains increased in ratings from 2022 to 2024, except for Mental Health, Physical Health, and Education which stayed the same or declined. Living Standards, Mental Health, and Physical Health were among the top rated domains in both survey years.
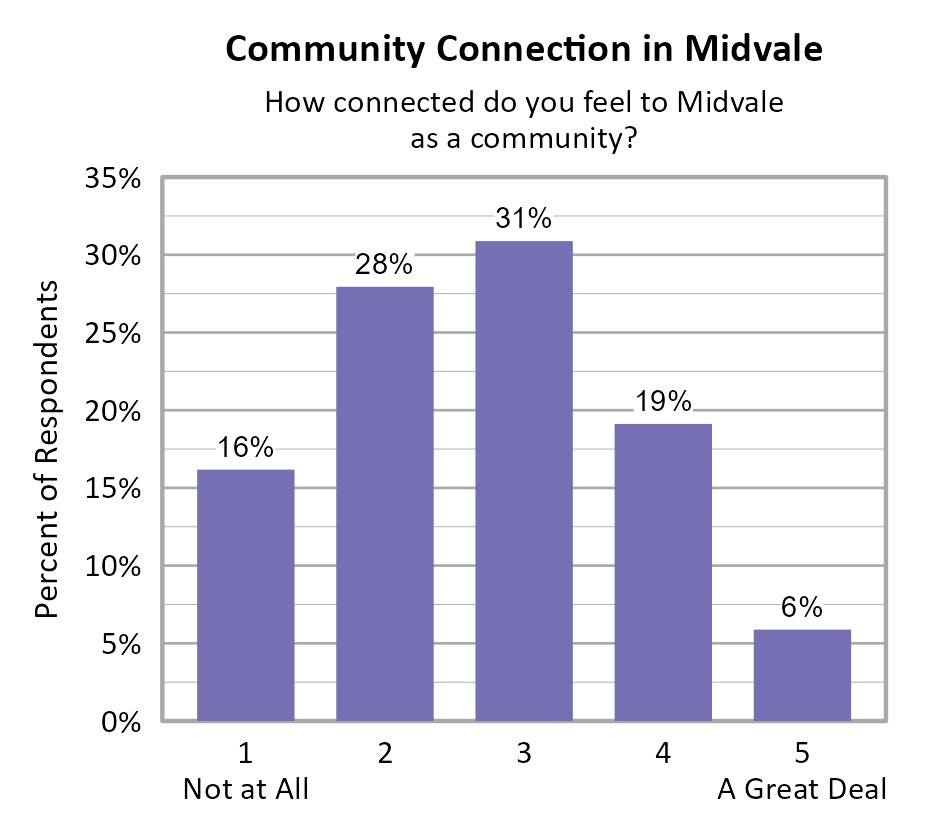
Community Connection in Midvale
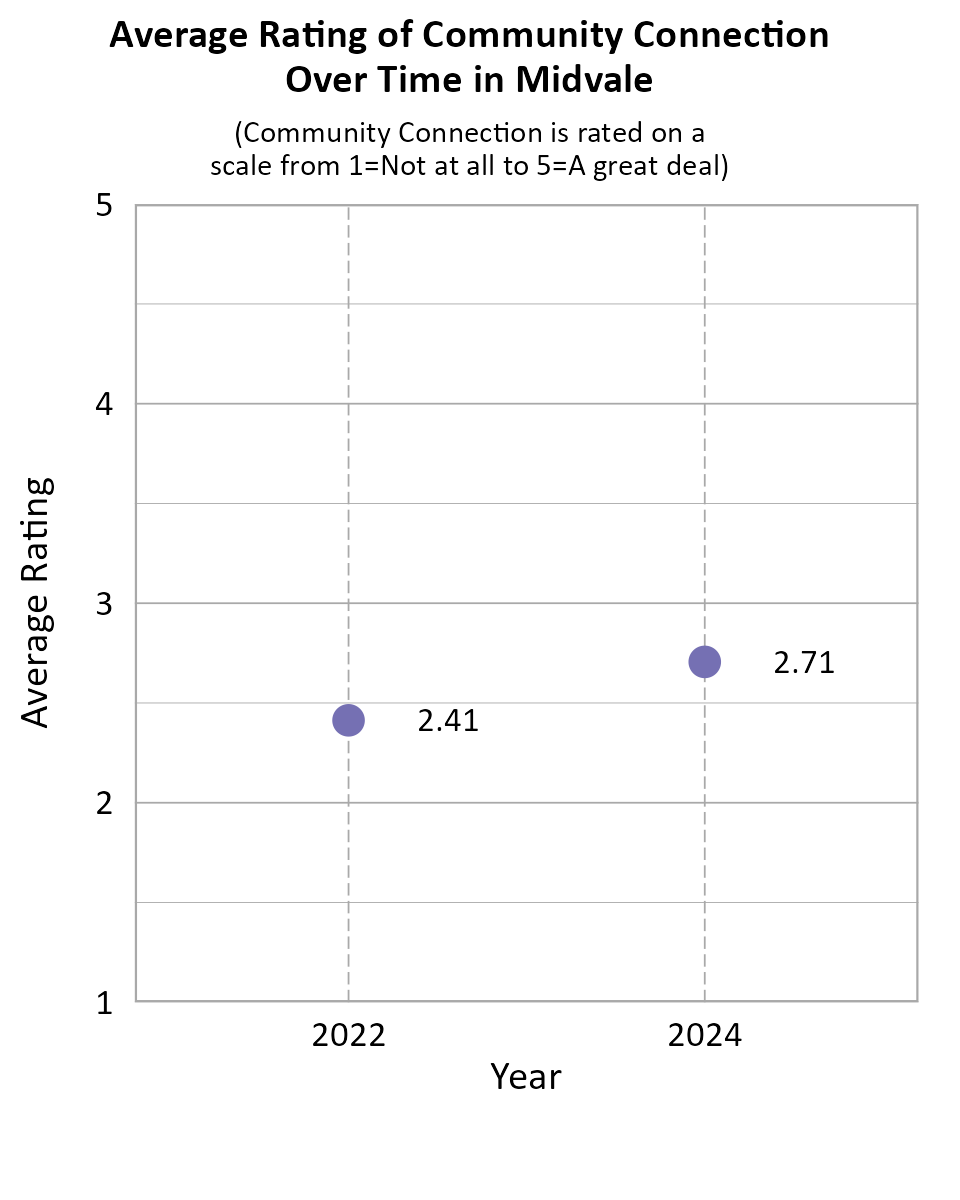
Survey participants were asked about how connected they feel to Midvale on a 5-point scale from not at all (1) to a great deal (5), and the average score of all respondents was 2.71. The 5 different council districts in Midvale did not have statistically significant different community connection scores, but each district had relatively few responses.
When comparing survey data from Midvale over the years as shown in the information below, we can see that the average community connection score improved between 2022 and 2024.
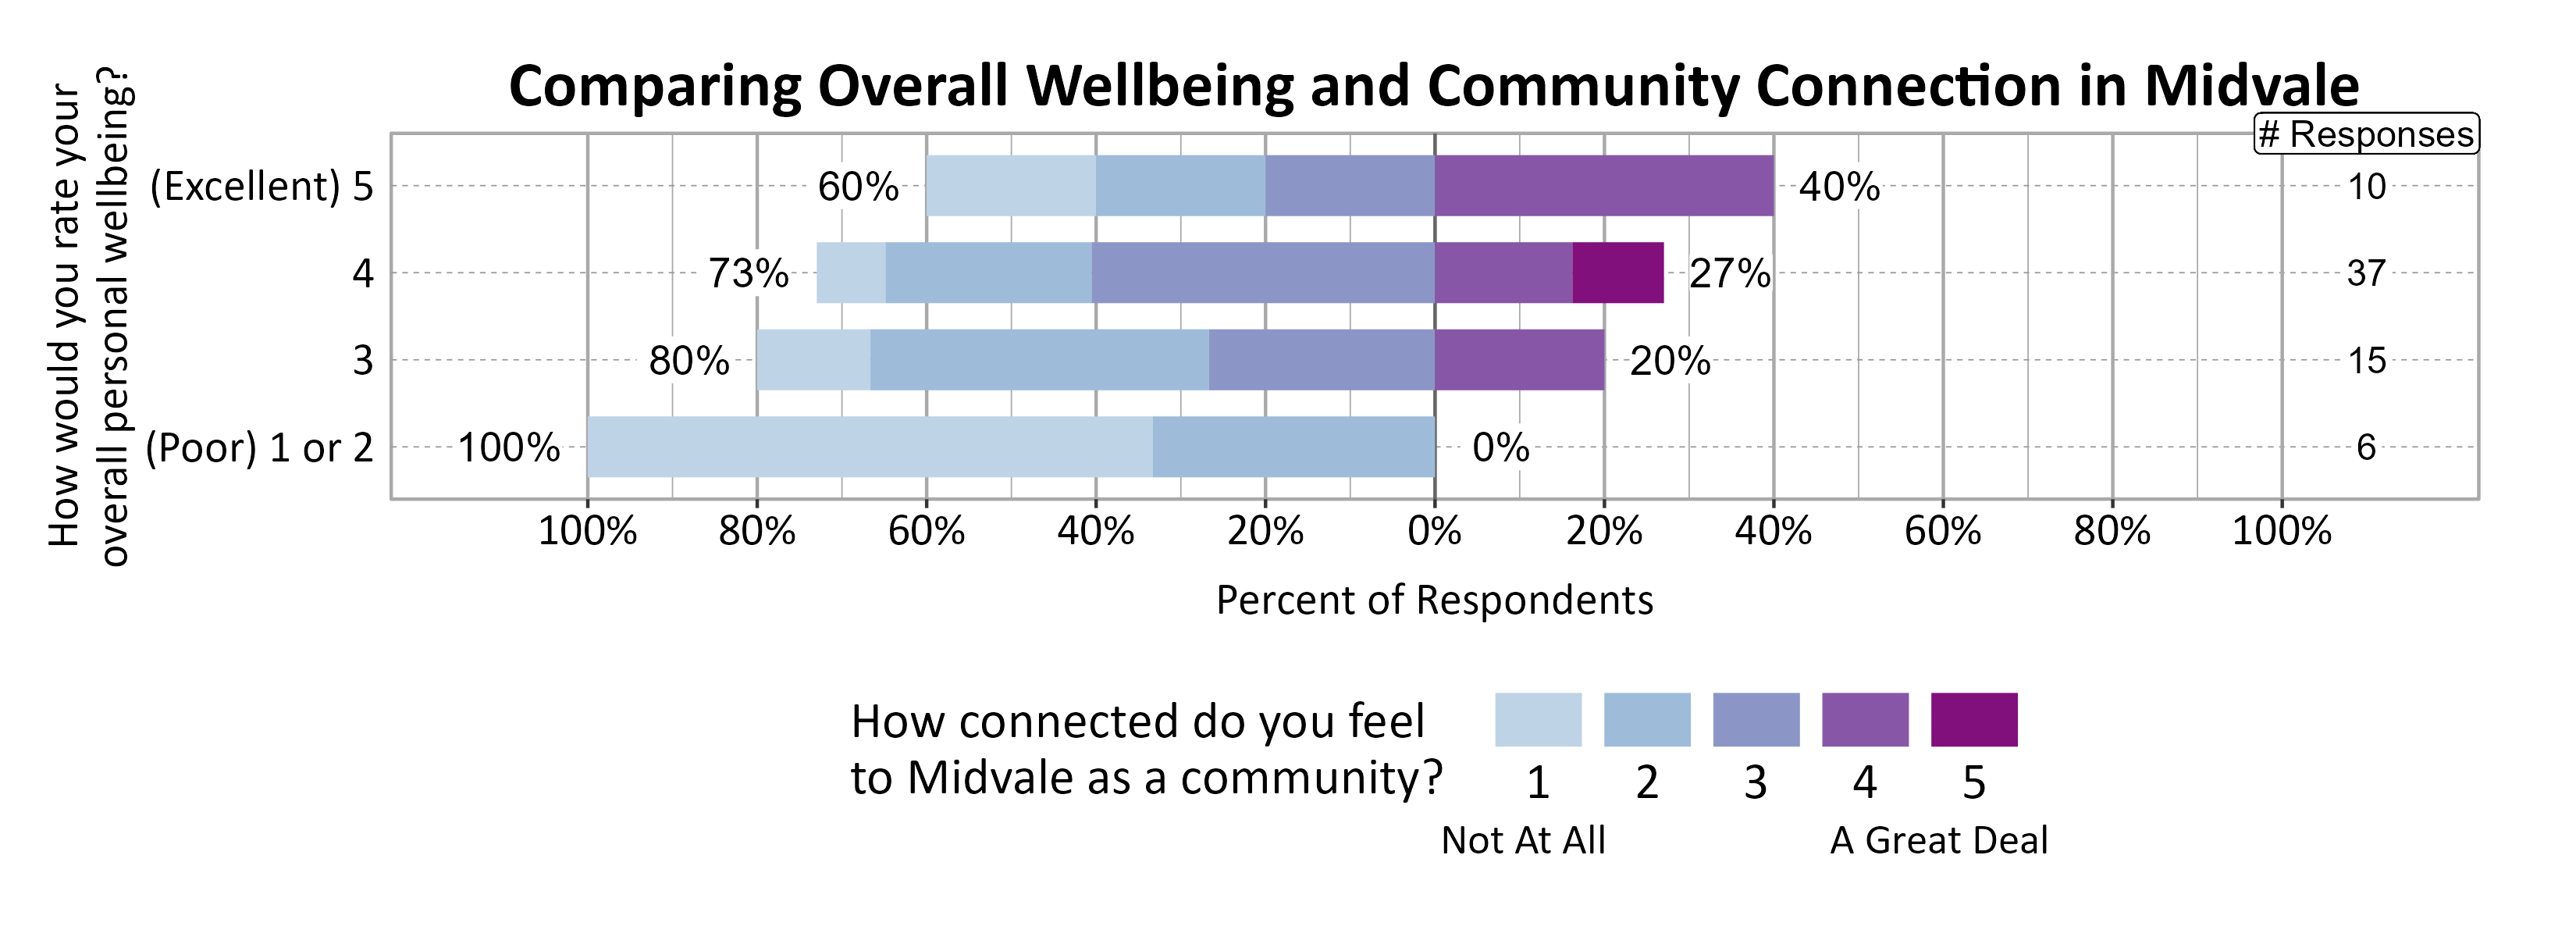
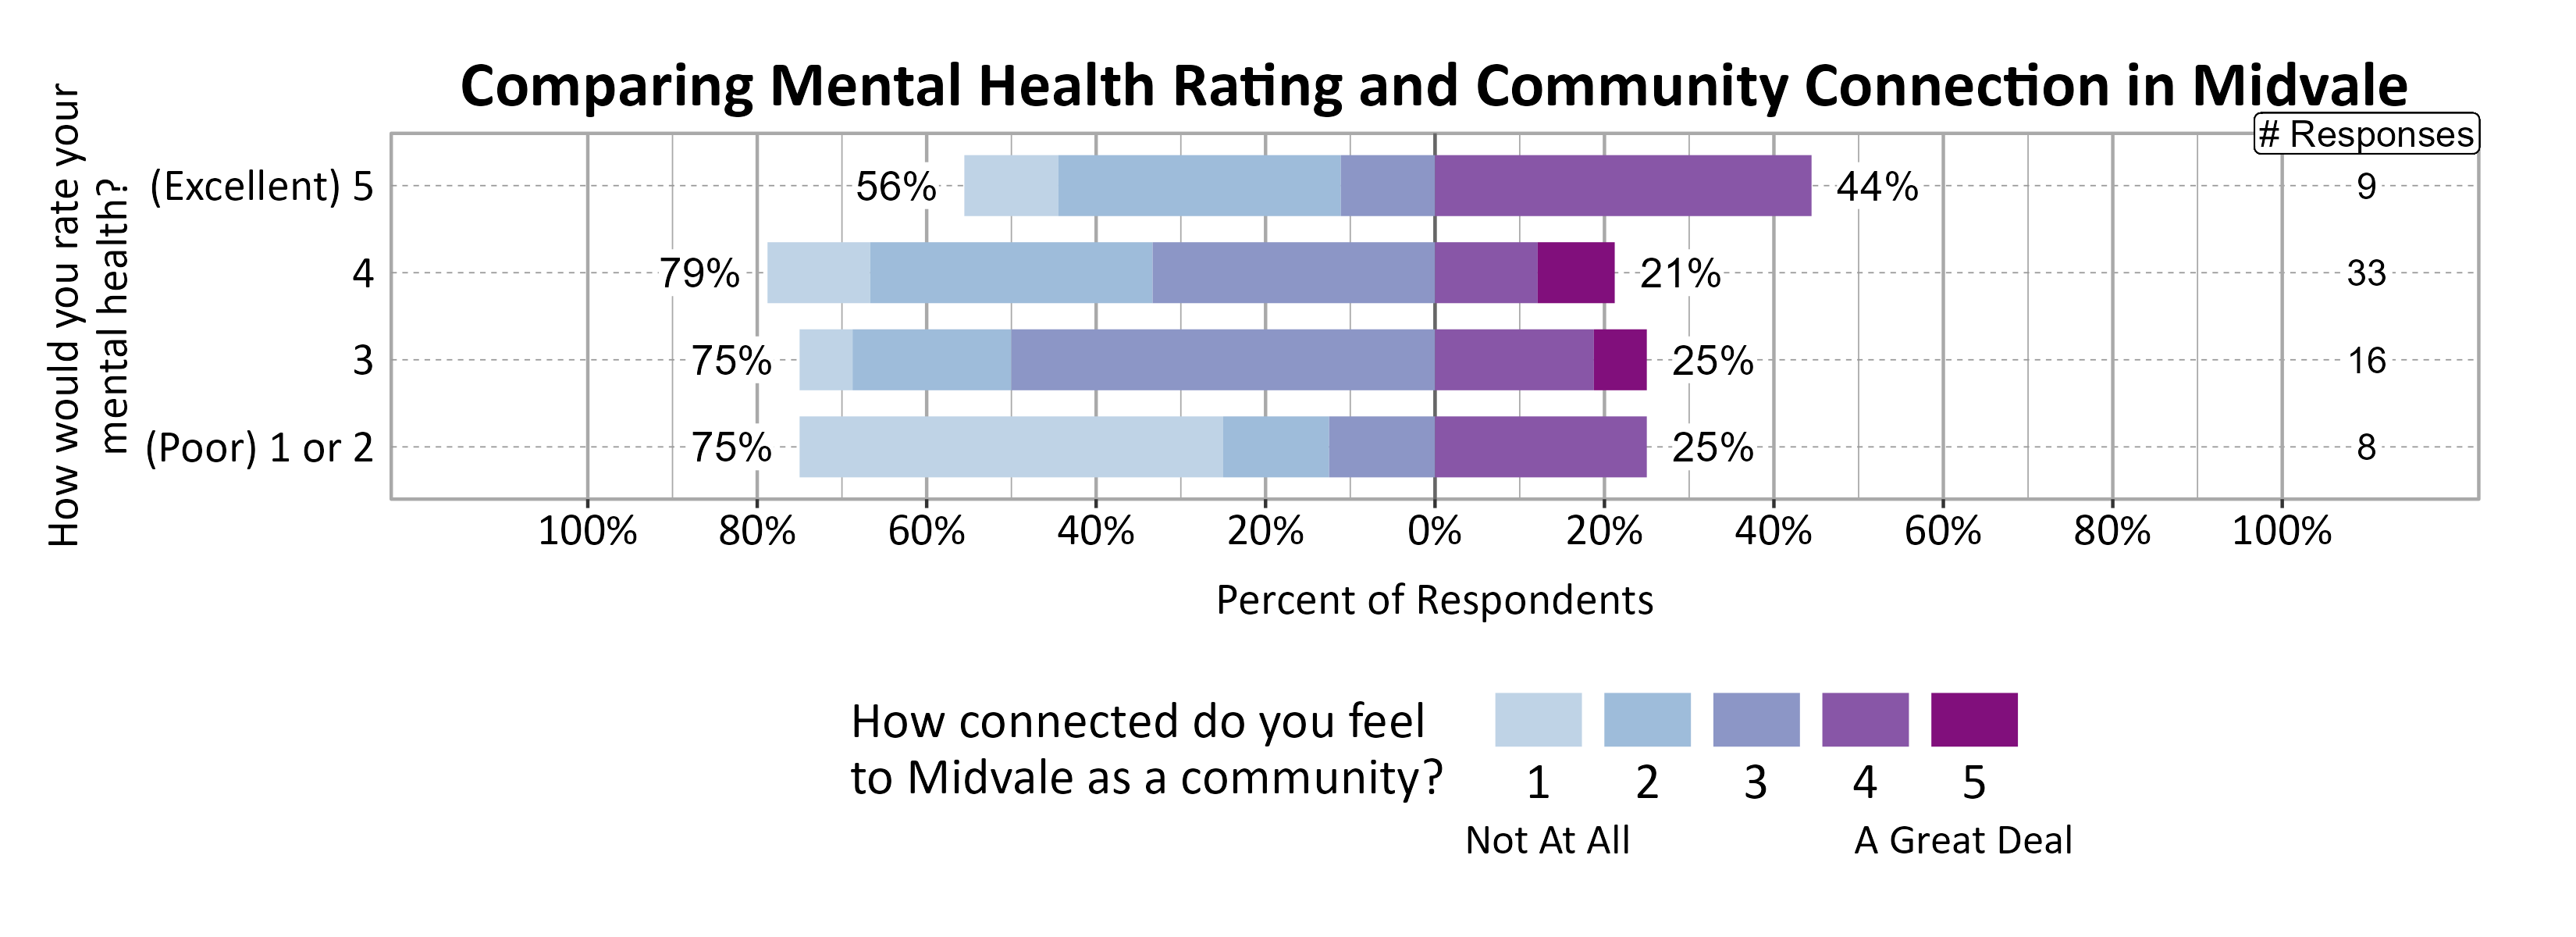
A positive relationship was found between individuals’ community connection and overall personal wellbeing, but no clear relationship was found between community connection and mental health.
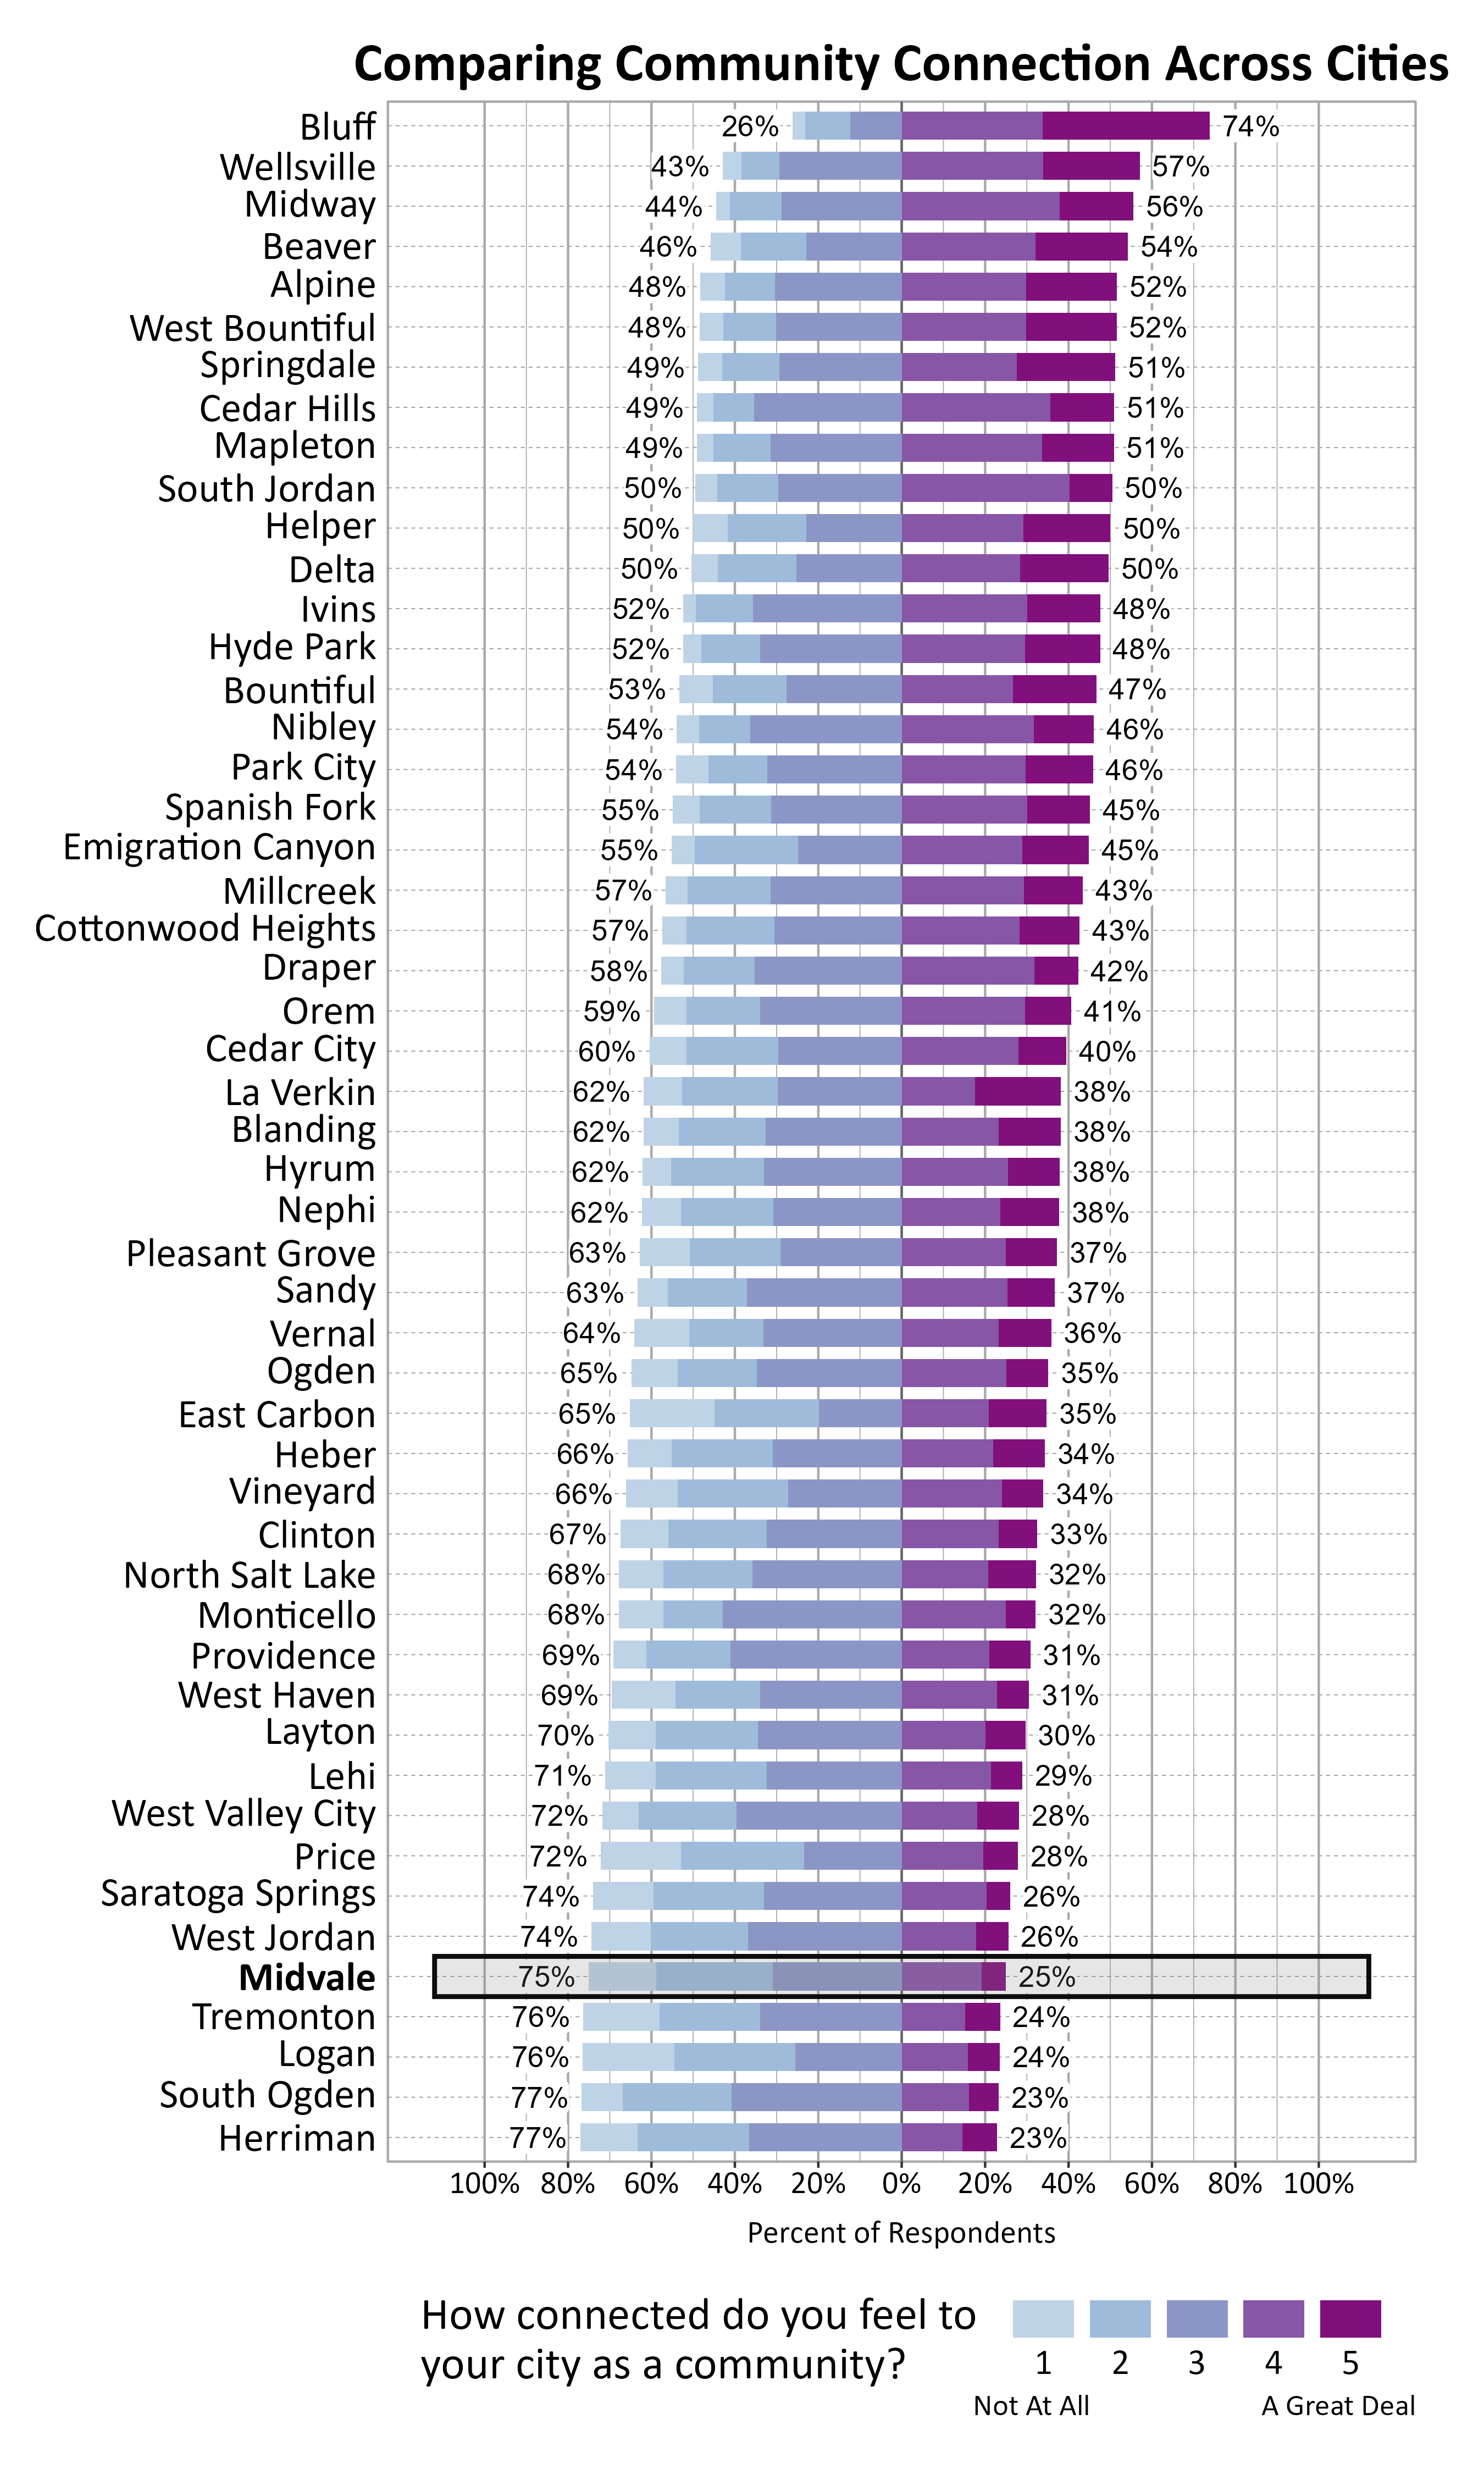
The graph below shows how Wellbeing Project cities and towns compare on feelings of community connection based on the percentage of respondents who answered 4 or a 5 on a 5-point scale from “not at all” to “a great deal” connected to their city or town. Midvale ranked 47 out of the 51 cities that participated.
Participation in Recreation and Nature-Related Activities
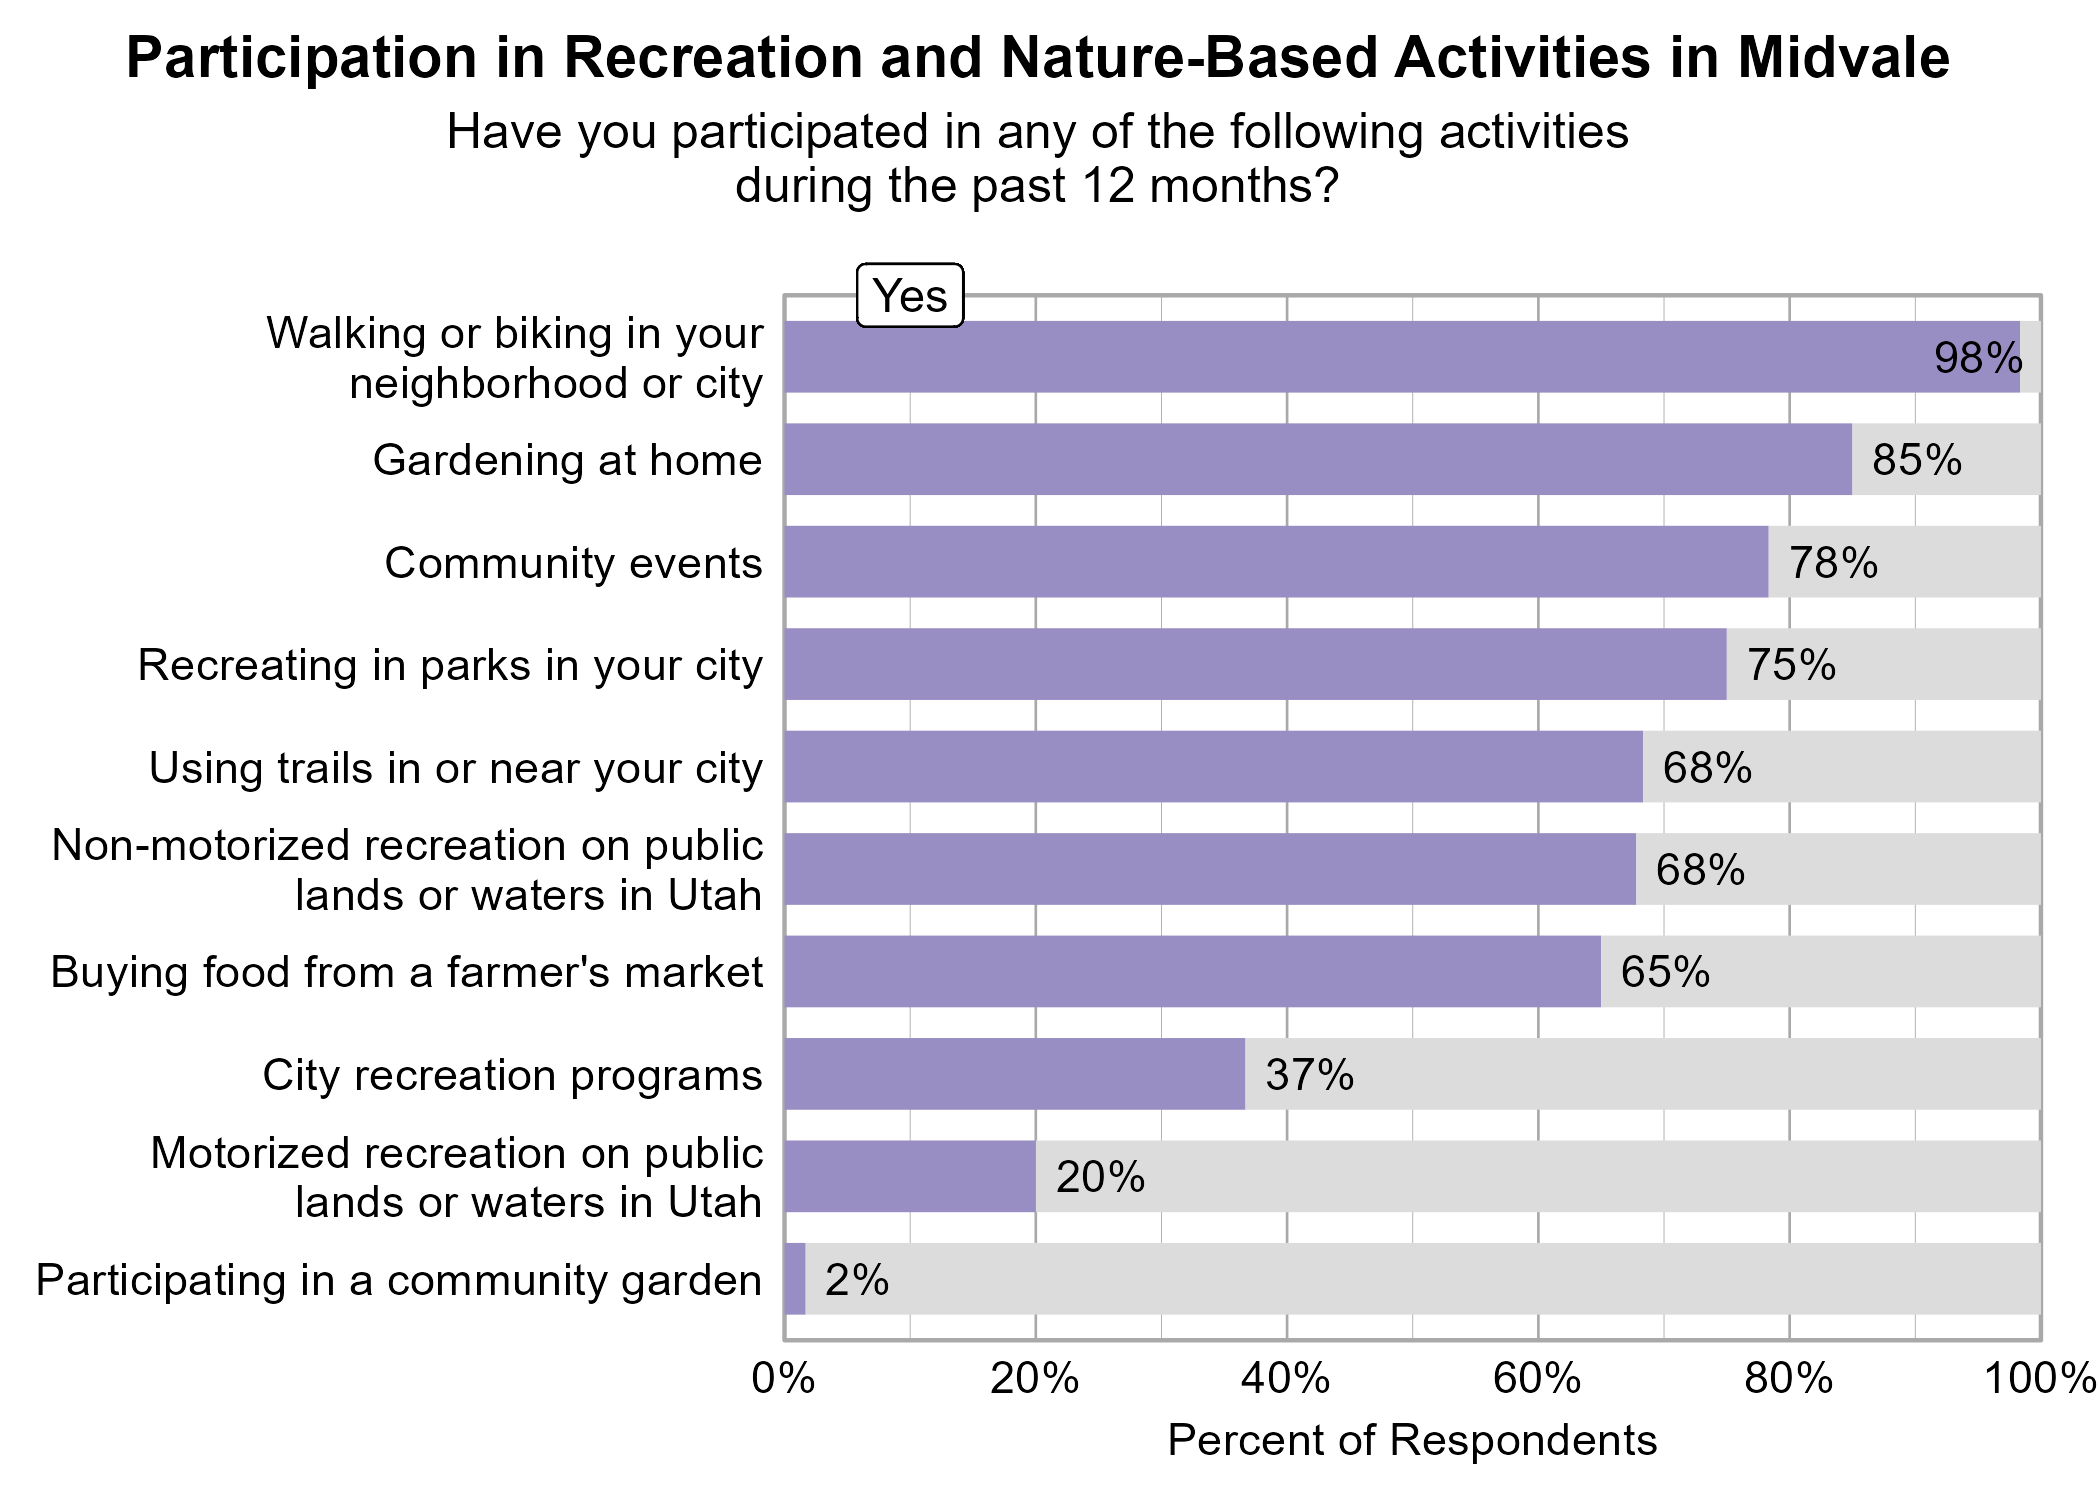
Respondents were asked to indicate whether or not they participated in various activities in the last 12 months. The most popular activities were walking or biking in your neighborhood or city (98%), gardening at home (85%), and community events (78%).
None of the recreation activities above were significantly related to higher ratings of personal wellbeing, community wellbeing, or community connection.
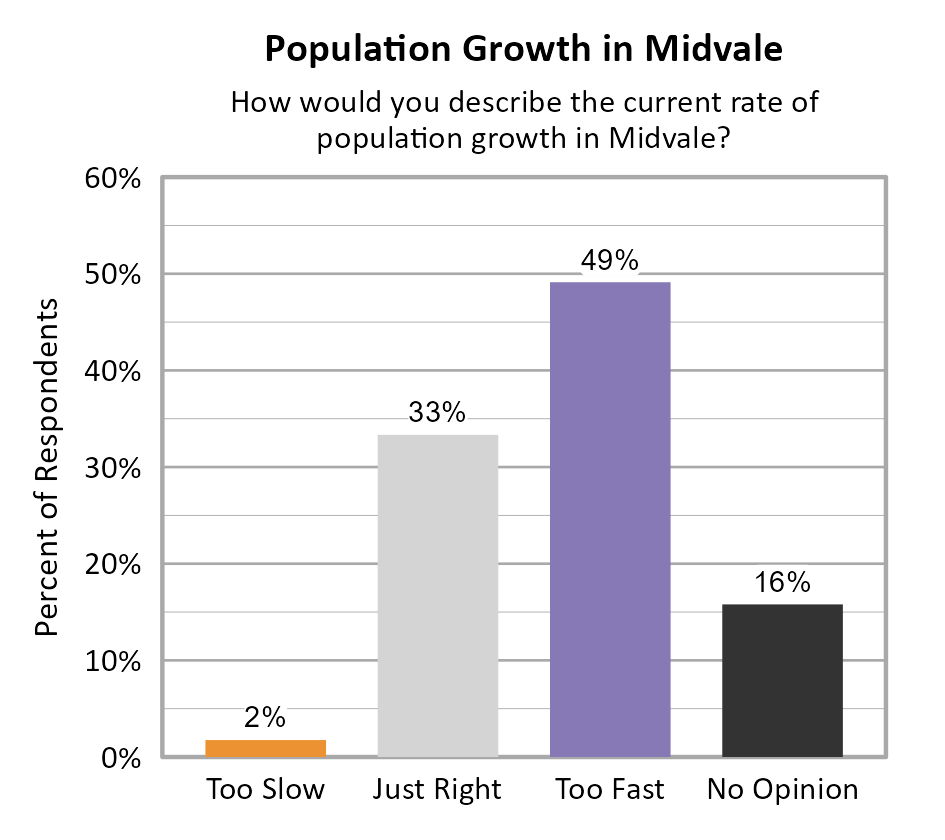
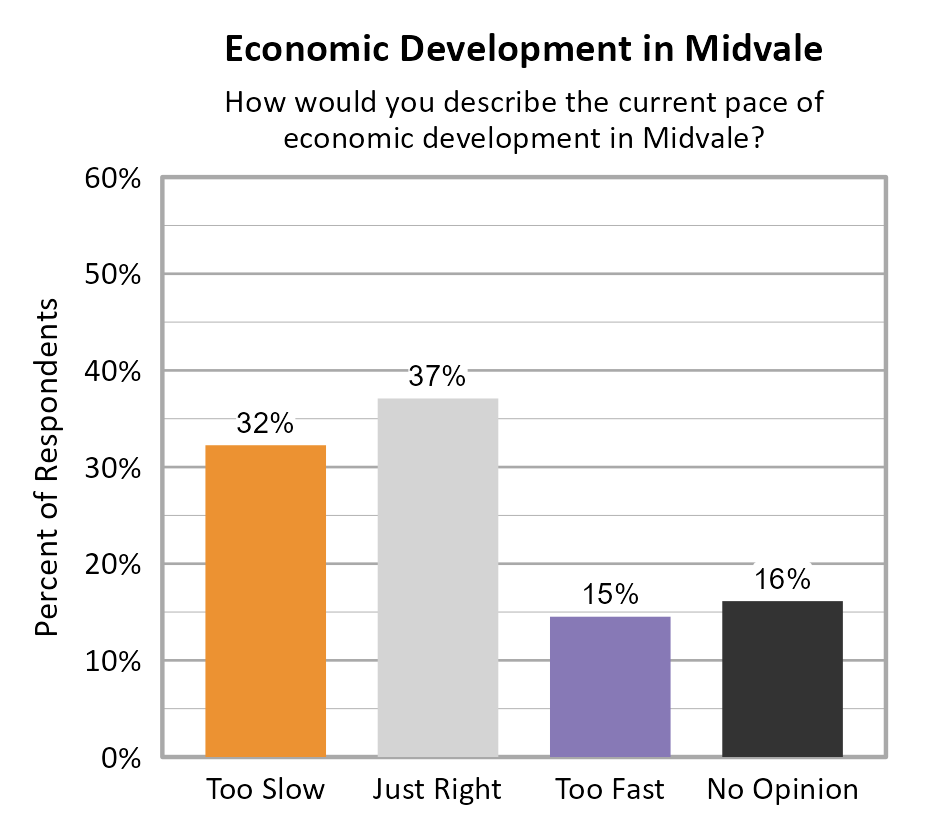
Perspectives on Population Growth and Economic Development
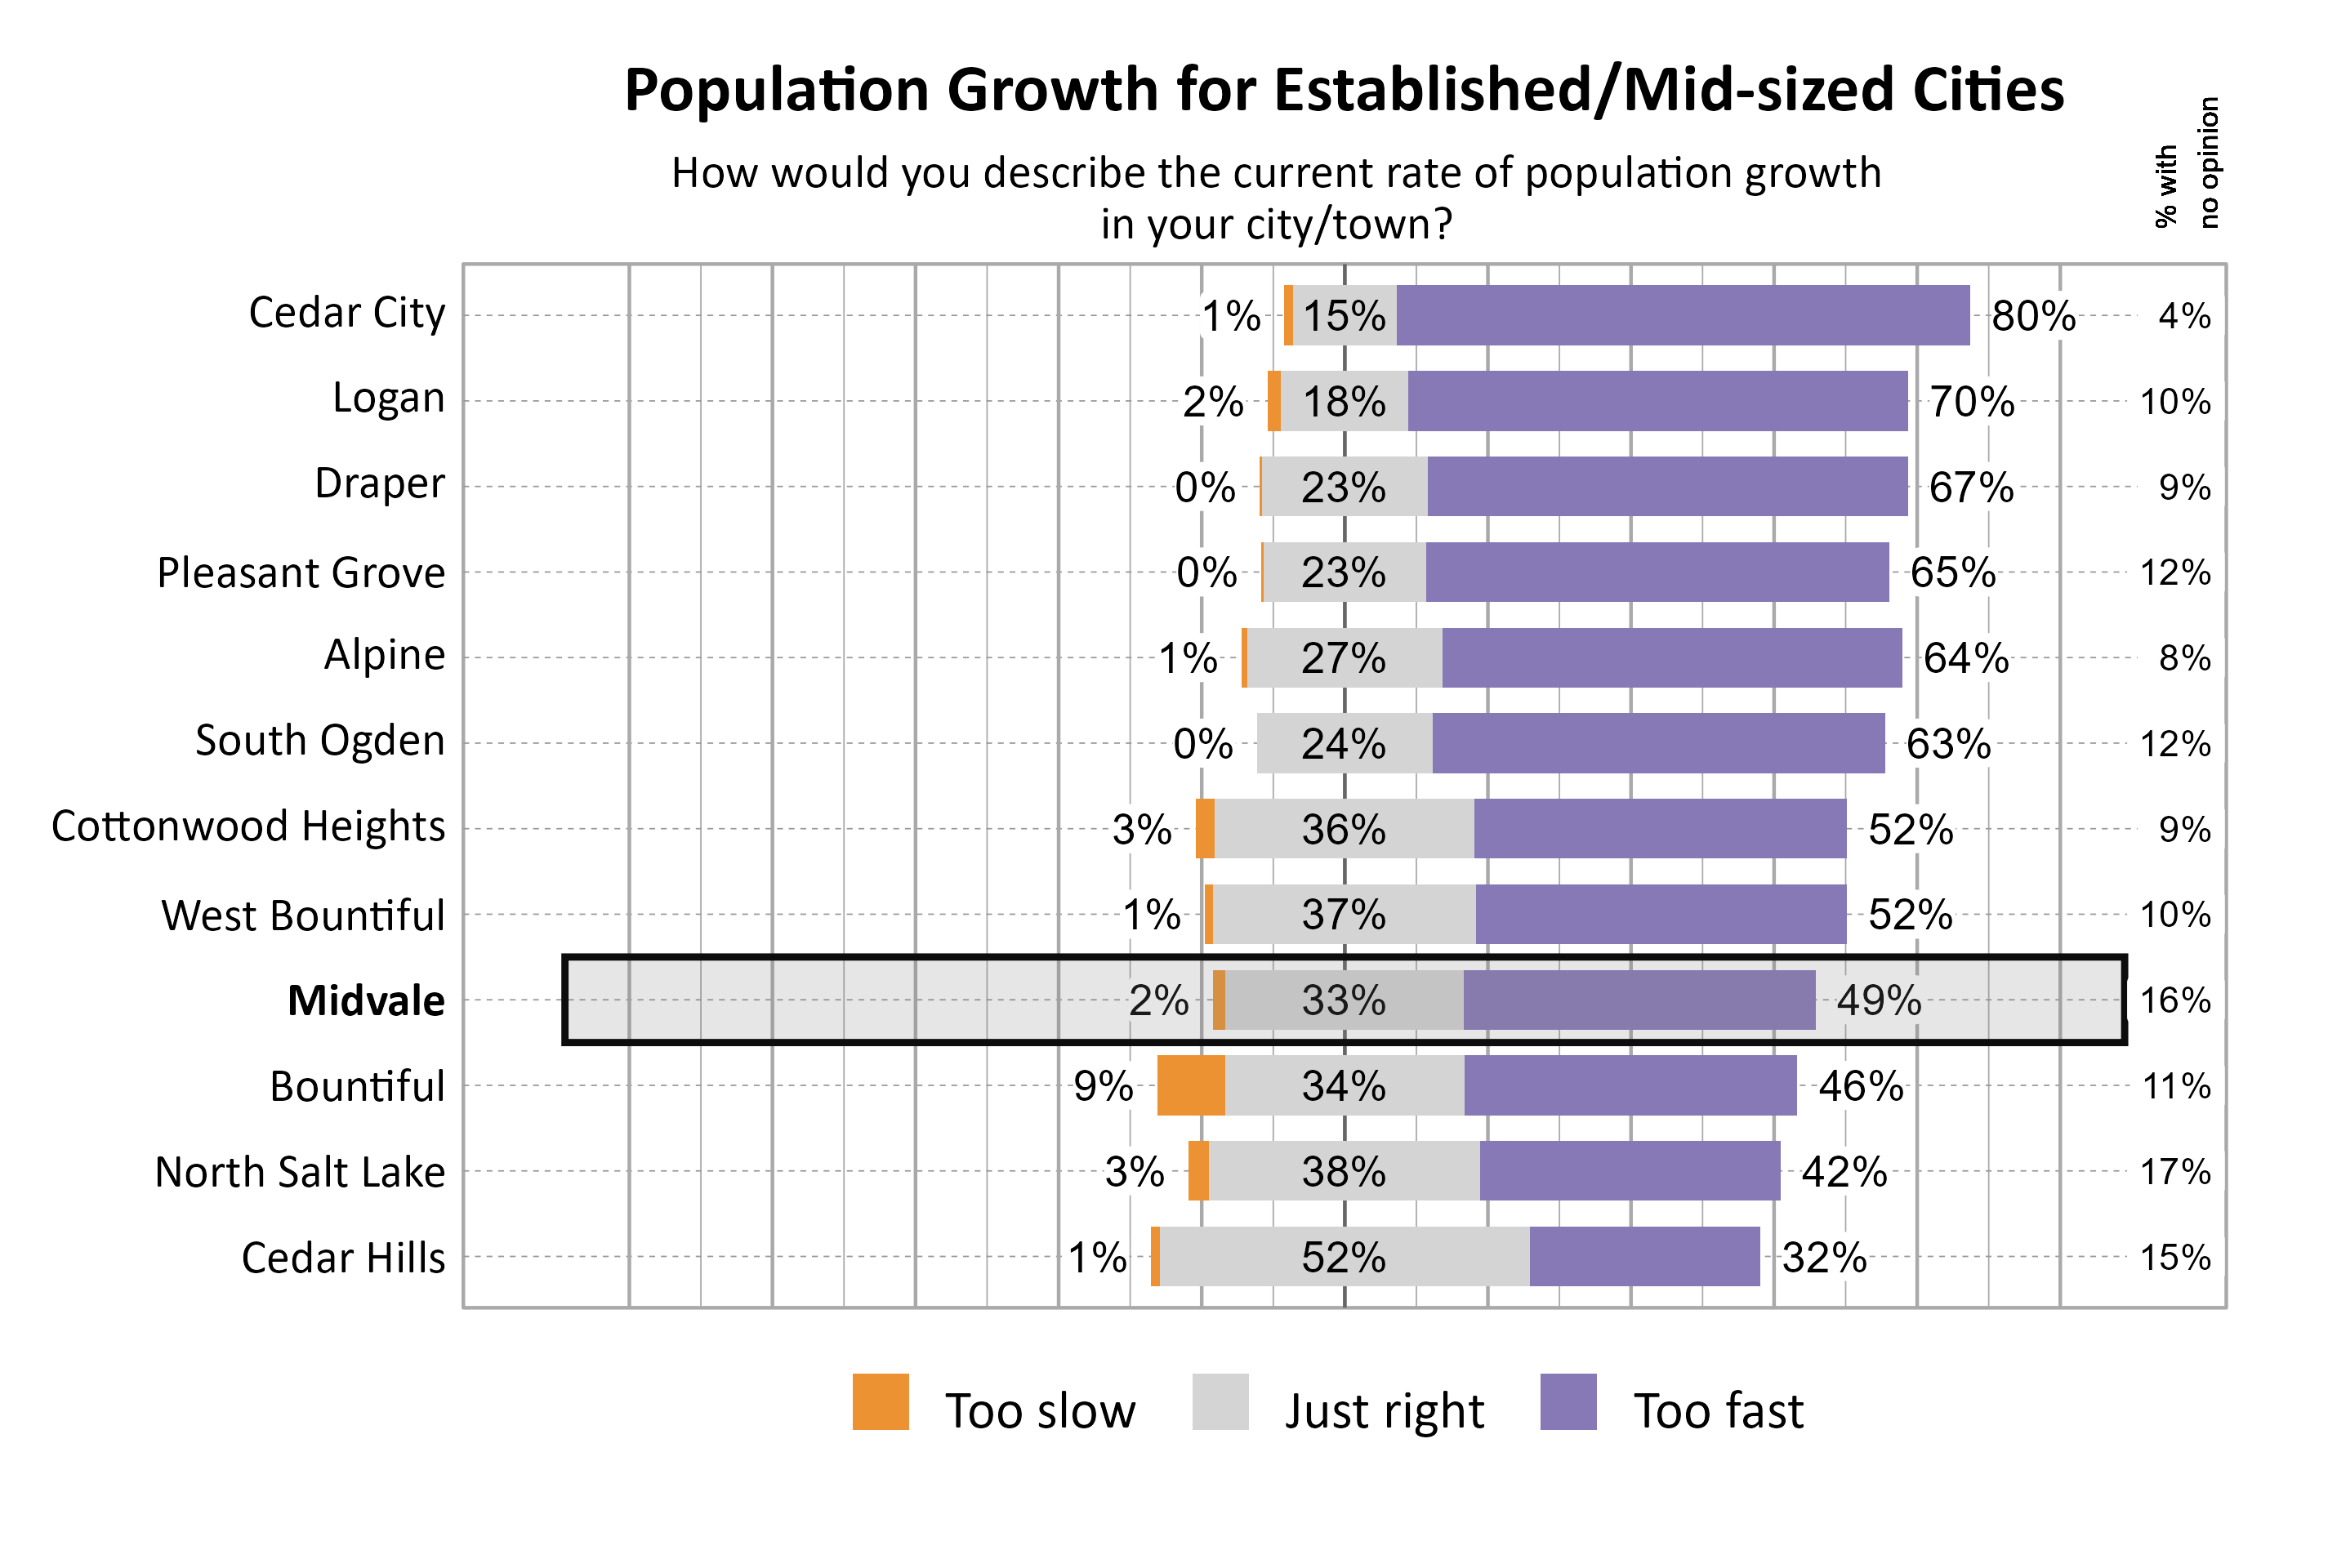
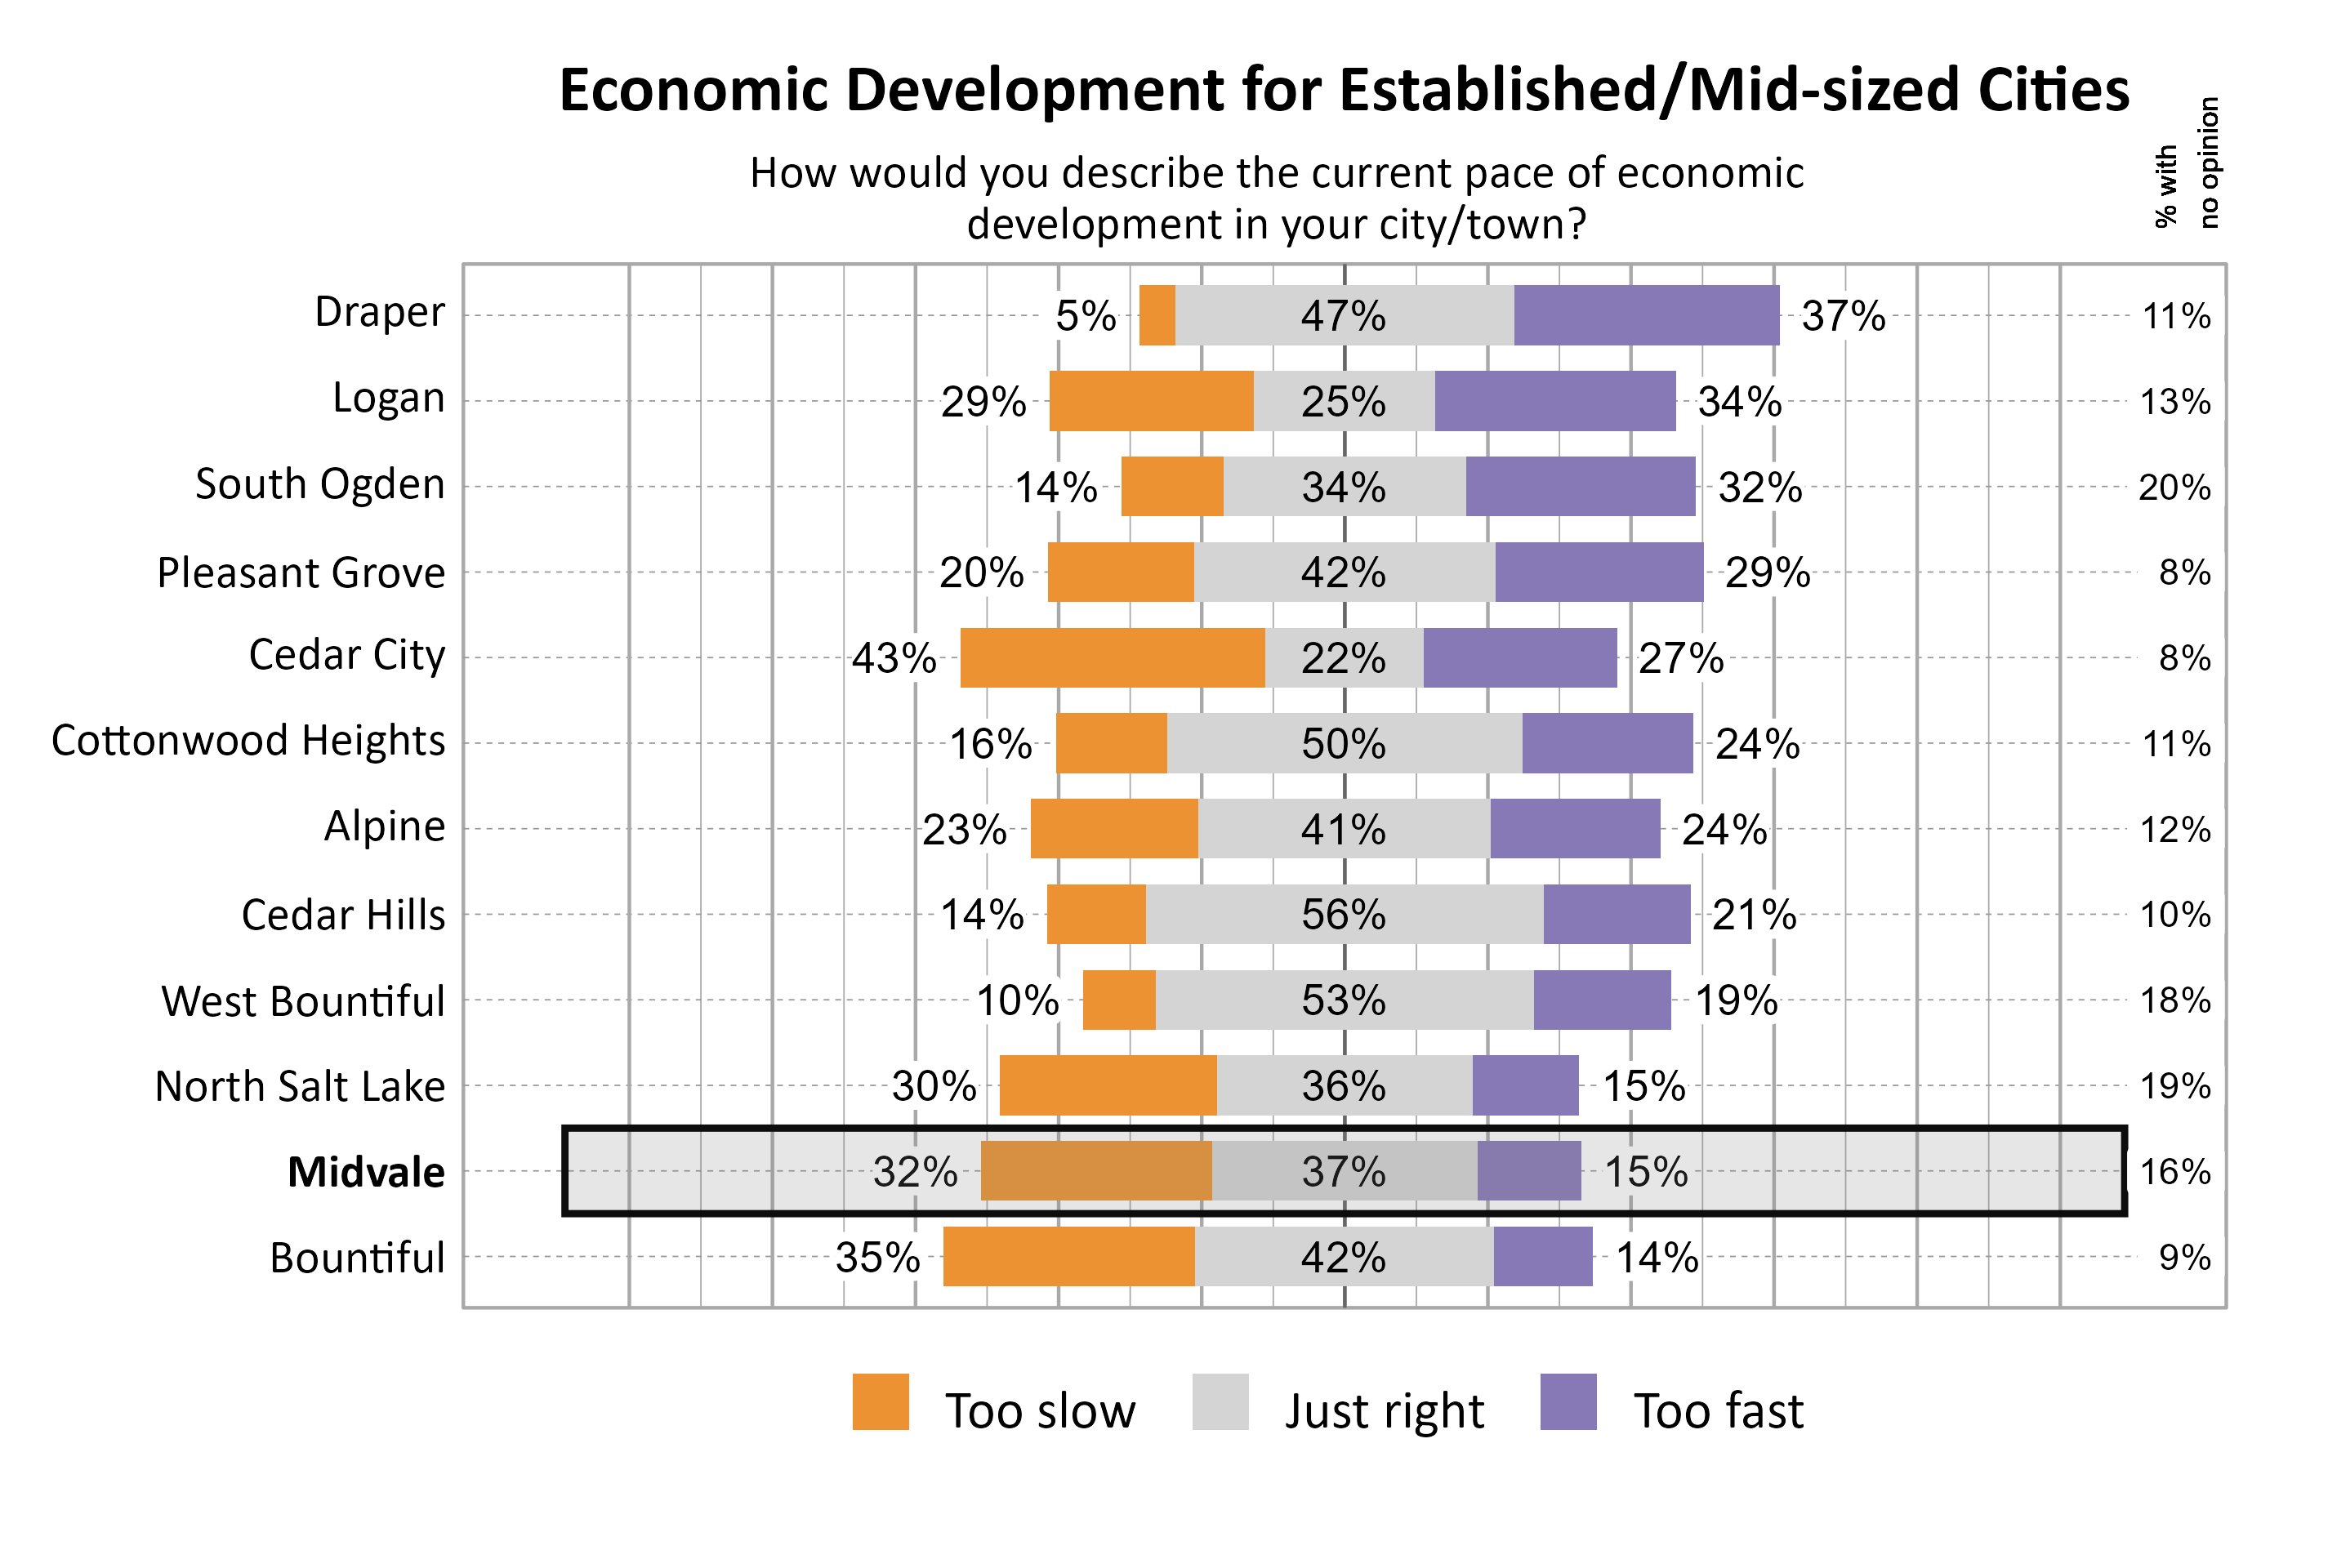
The largest proportion of respondents in Midvale indicated that they felt the population growth was too fast (49%). For the pace of economic development, respondents were split between opinions that it was just right (37%) and too slow (32%).
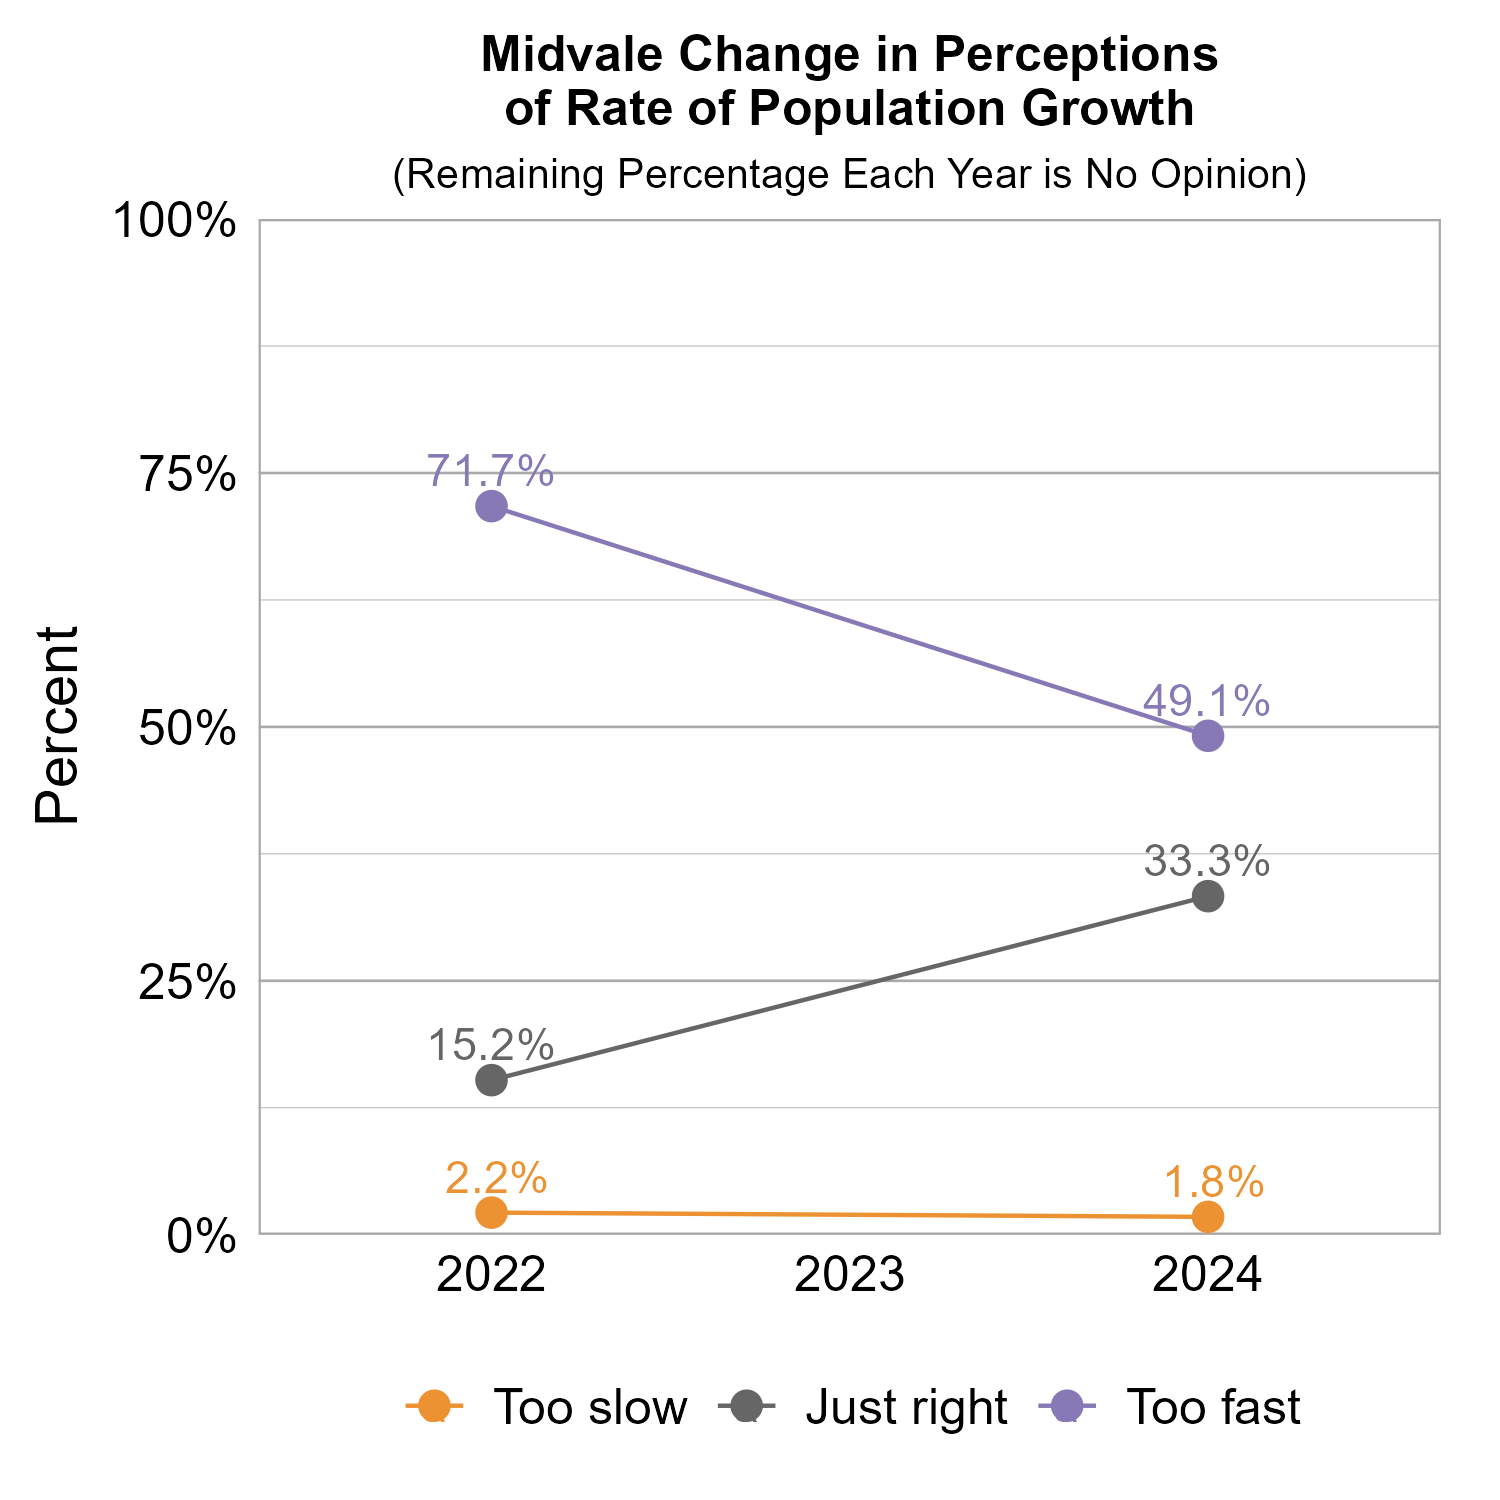
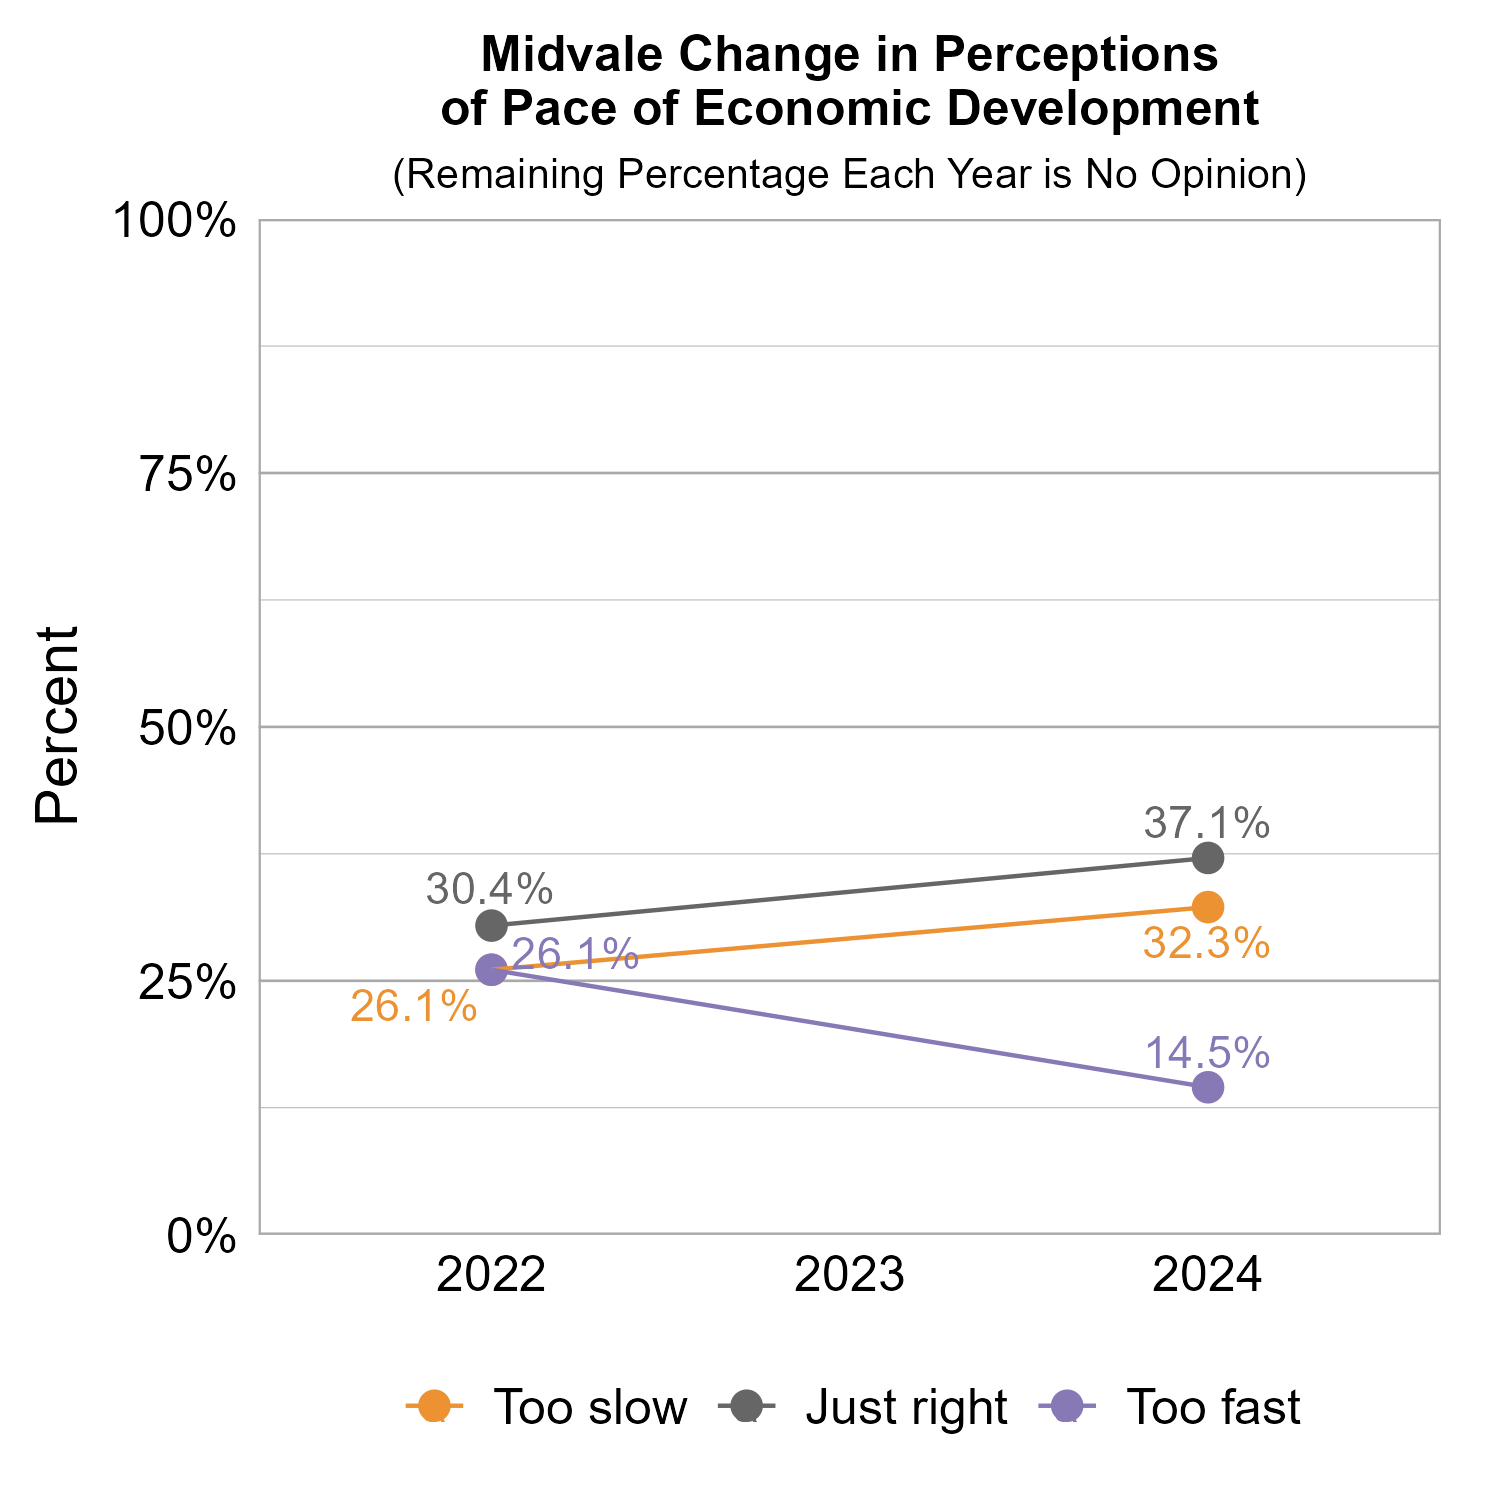
The graphs below show how perceptions of population growth and economic development in Midvale have varied across recent years of Wellbeing Surveys. Perception that the rate of population growth is too fast saw a large decrease from 2022 to 2024, while the perception that it is just right increased. Perceptions for the pace of economic development saw slight changes and a drop in the perception that it is too fast.
The graphs below show perceptions of population growth and economic development for Midvale compared to other participating cities and towns in the Established/Mid-sized Cities cluster.
The graph below illustrates how many respondents perceived the pace of economic development as too slow, just right, too fast, or had no opinion, with additional breakdowns for the number of respondents who provided comments.
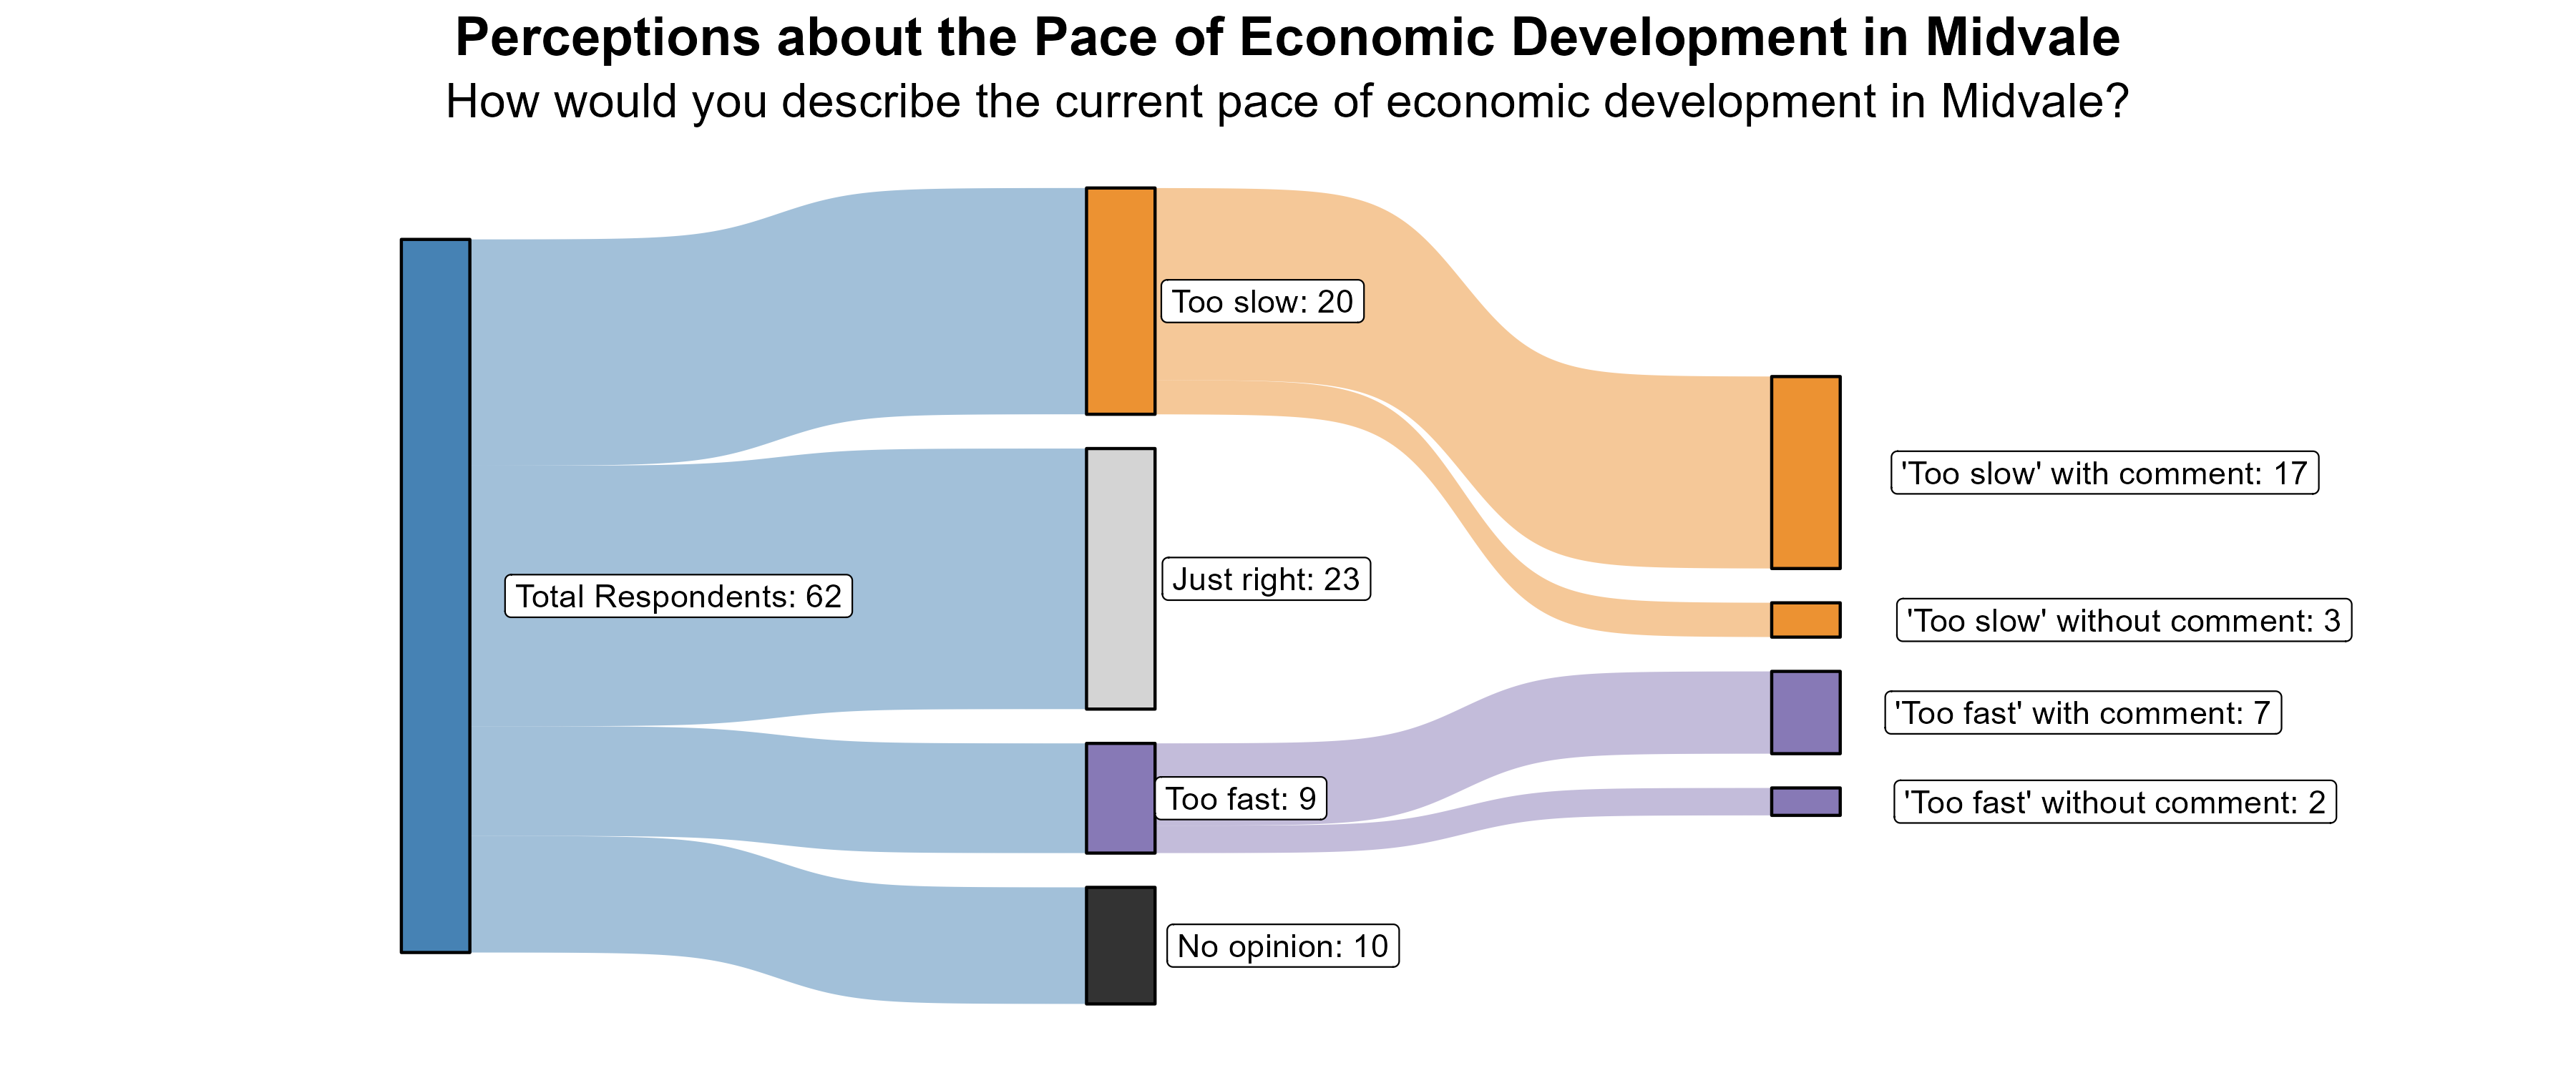
The 32% of respondents who rated the pace of economic growth as “too slow” were further asked what aspects of the local economy they would like to see more of in Midvale. The main themes in these comments were the desire for more retail businesses and things to do, as well as better infrastructure and walkability.
Additionally, the 15% of respondents who rated the pace of economic growth as “too fast” were further asked what aspects of the local economy they feel are growing too quickly in Midvale. The dominant concern from respondents was about removing single family residences and building apartments.
Transportation in Midvale
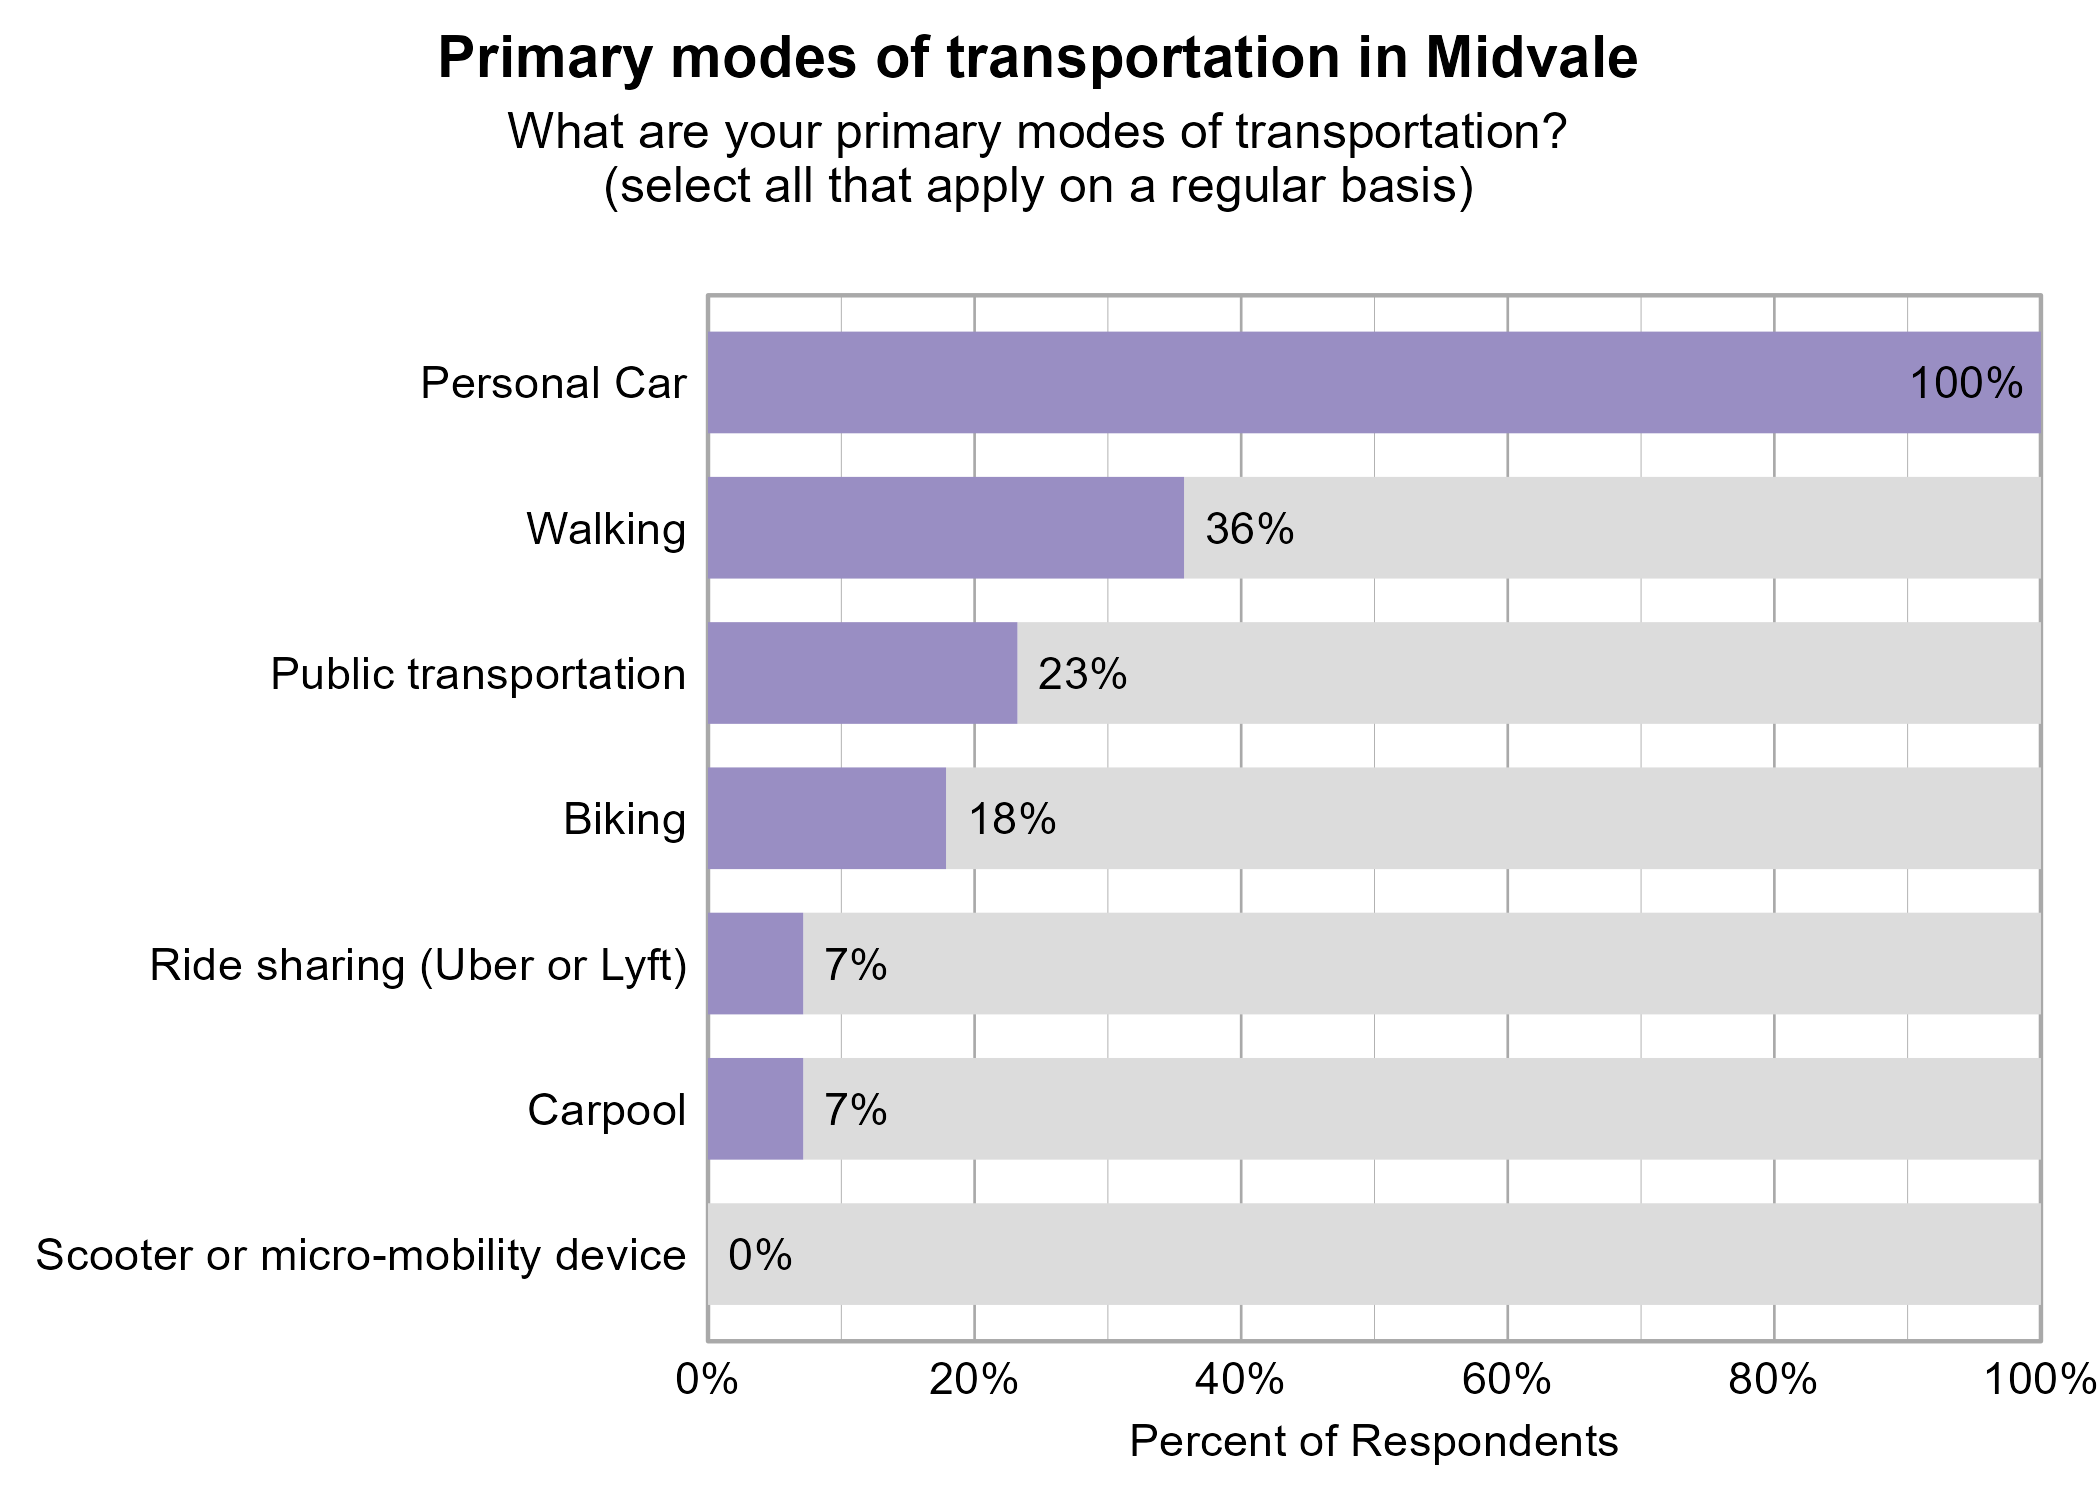
Respondents were asked to indicate all of their primary modes of transportation on a regular basis in Midvale. The most popular modes of transportation were personal car (100%) and walking (36%).
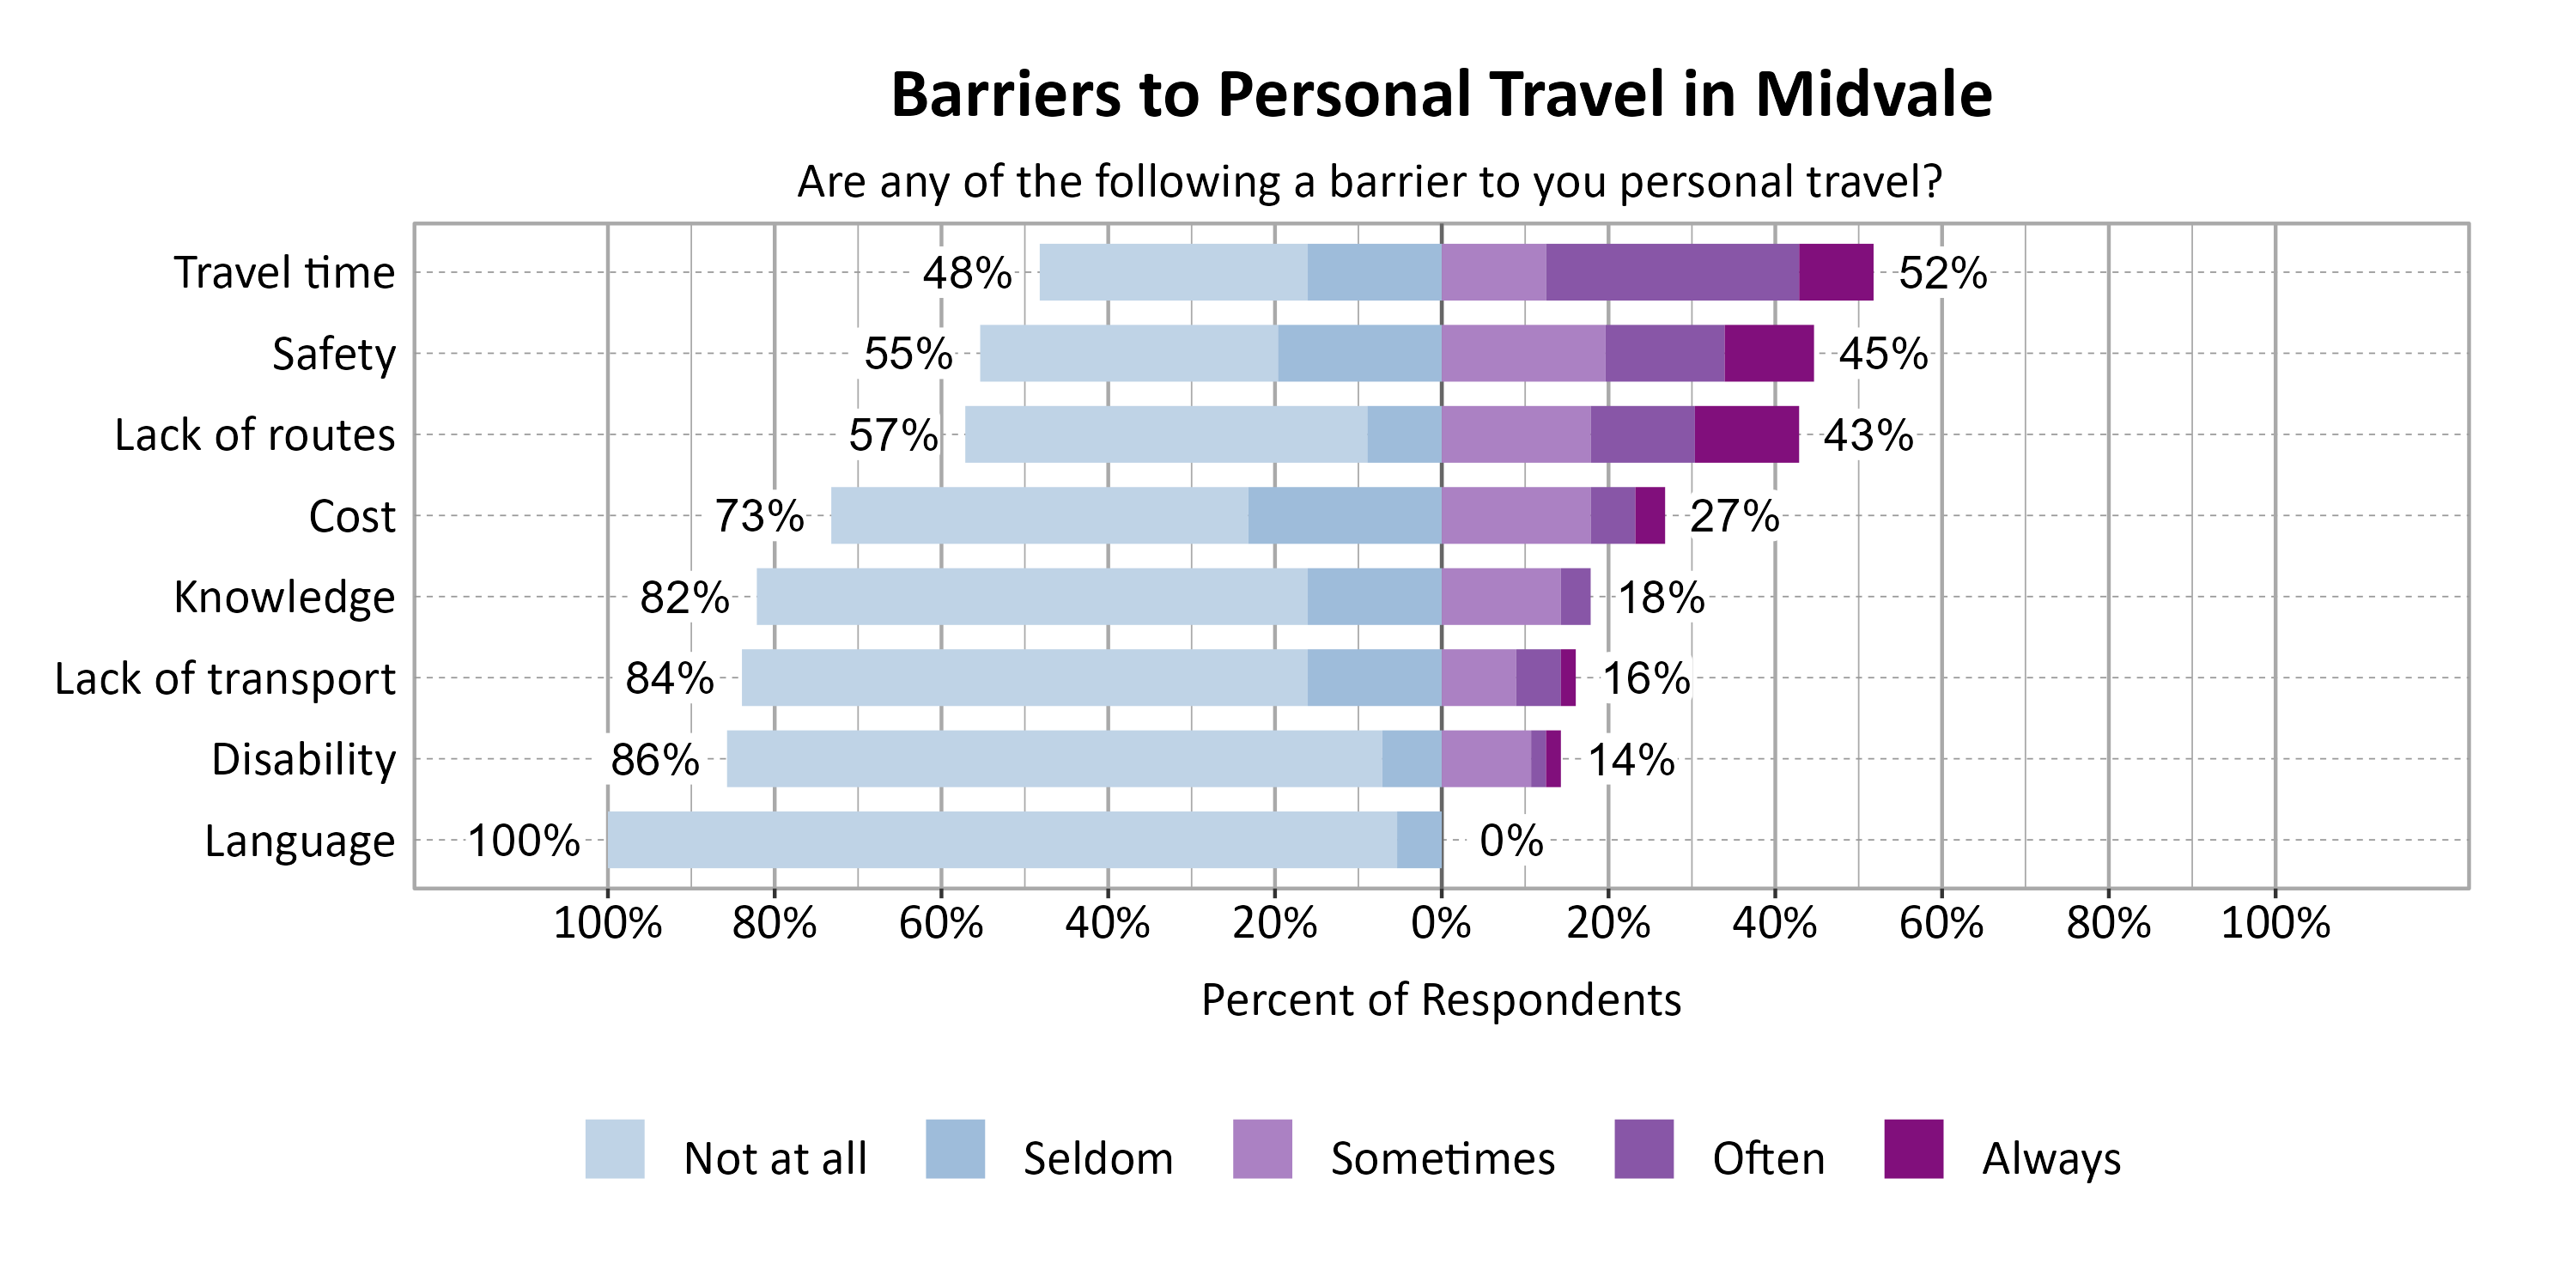
Respondents were asked to indicate the most common barriers to transportation in Midvale. The most problematic barriers were Travel time (52%) and Safety (45%).
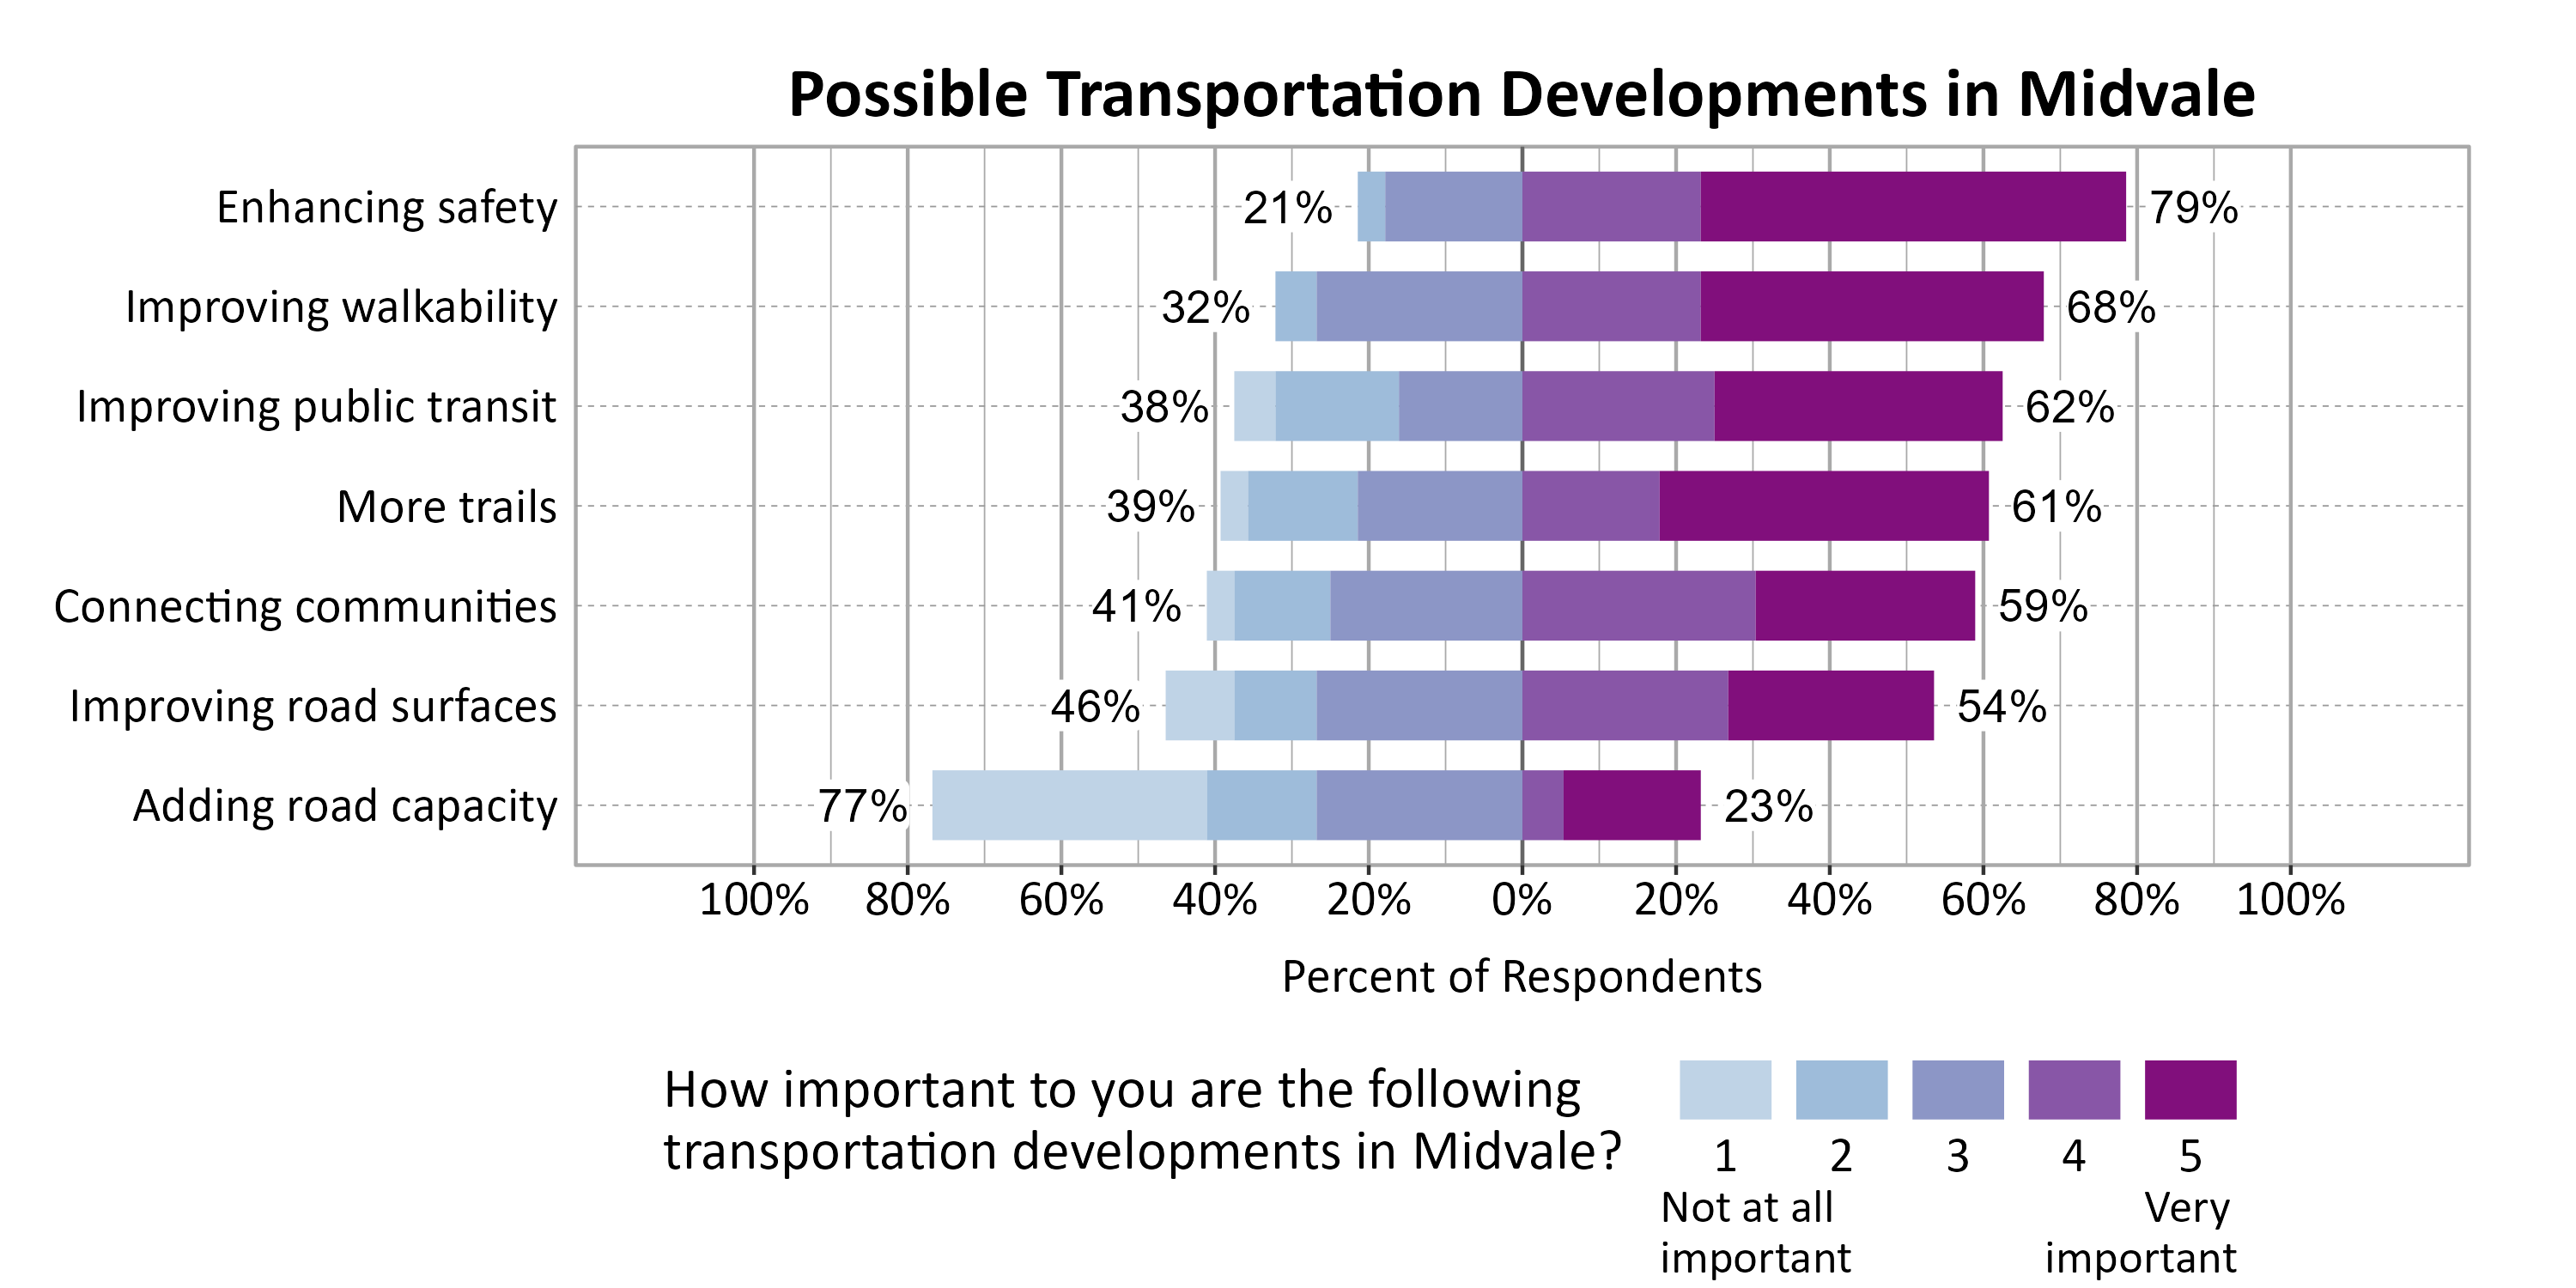
Respondents were asked to indicate the importance of a set of possible transportation developments in Midvale. The most important development to respondents were Enhancing safety (79%), Improving walkability (68%), Improving public transit (62%), and More trails (61%).
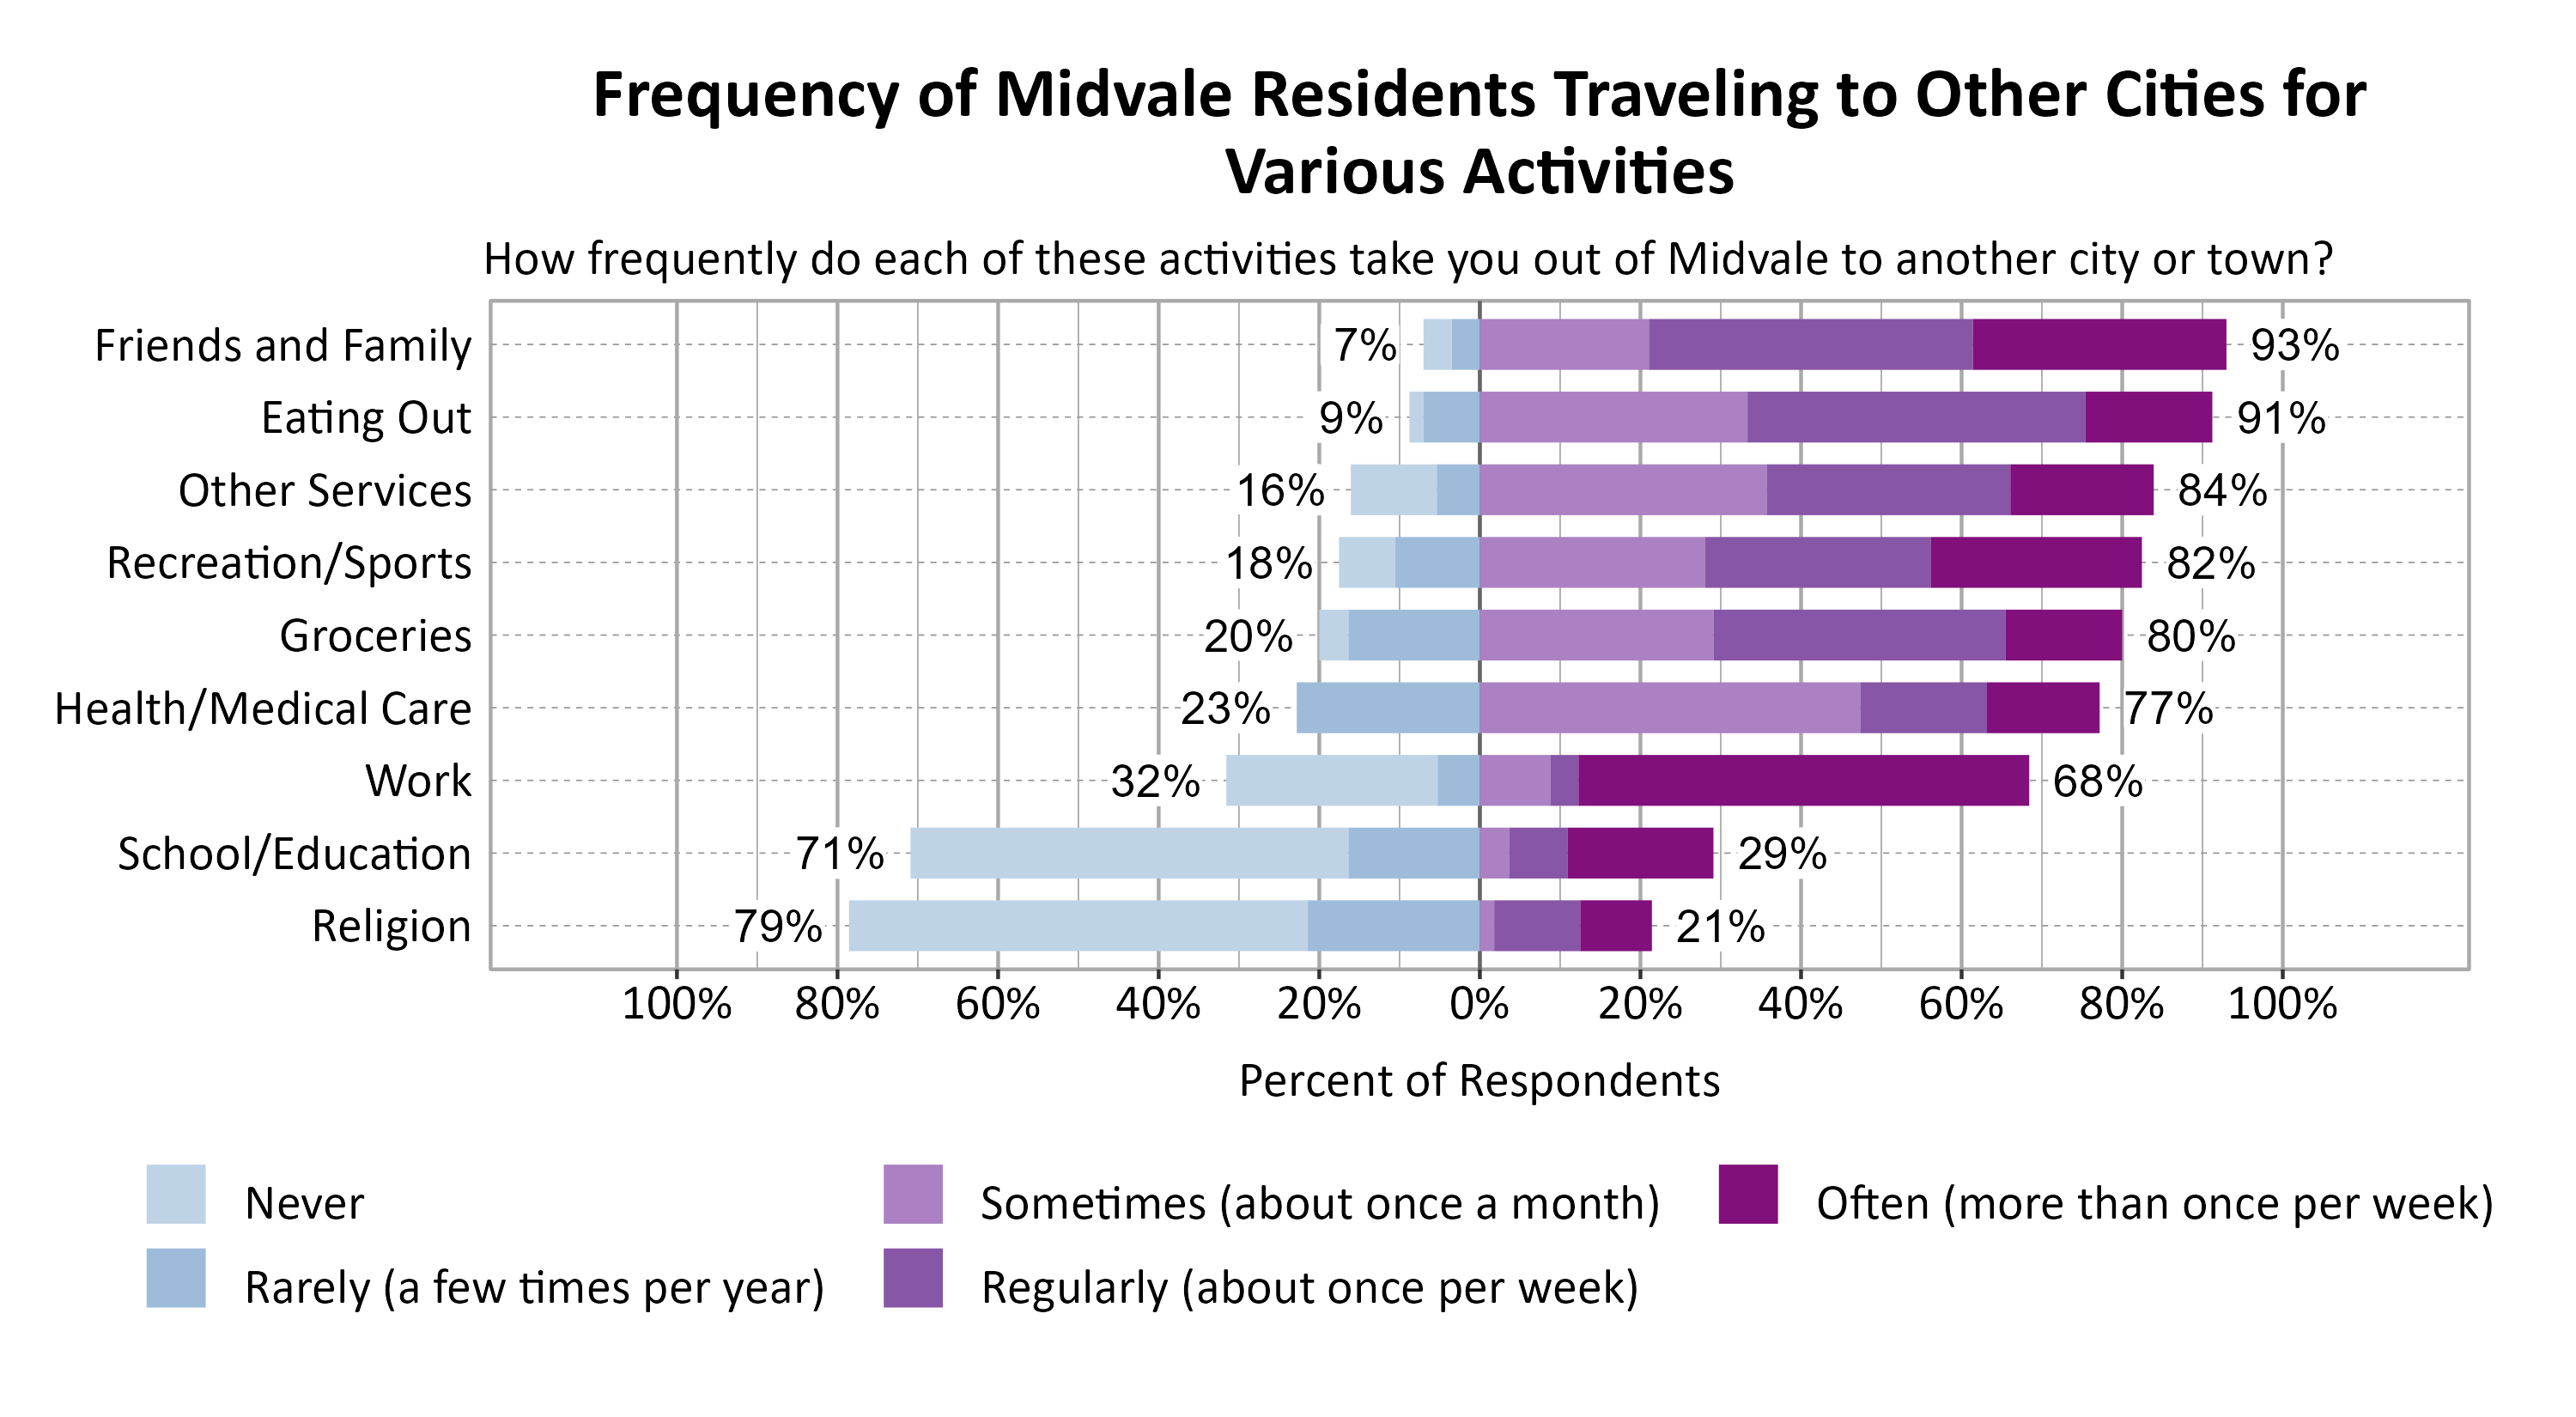
Respondents were asked to indicate how frequently various activities take them out of Midvale to another city or town. The most commonly indicated reasons for traveling to another city or town at least sometimes or once a month were Friends and Family (93%), Eating Out (91%), and Other Services (84%).
Concerns in Midvale
Survey respondents indicated the degree to which a number of possible local issues were a concern as they look to the future of Midvale. Air Quality (93%), Homelessness (87%), and Public Safety (87%) were the top concerns. Since 2022, moderate or major concern about recreation opportunities (+20%) and shopping opportunities (+15%) notably increased, while concern about access to mental health care (-16%), suicide (-12%), employment opportunities (-11%), water supply (-10%), and access to health care (-10%) notably decreased.

Additional Questions for Midvale
Neighbors Taking Action in Midvale
Respondents in Midvale were asked to indicate how likely it is that one of their neighbors would take action given certain scenarios. Their responses are shown in the graph below. Respondents indicated that their neighbors were likely or very likely to take action if someone on their block was firing a gun (78%), there was a fight in front of their house and someone was being beaten or threatened (70%), and if someone was trying to break into a house (67%).

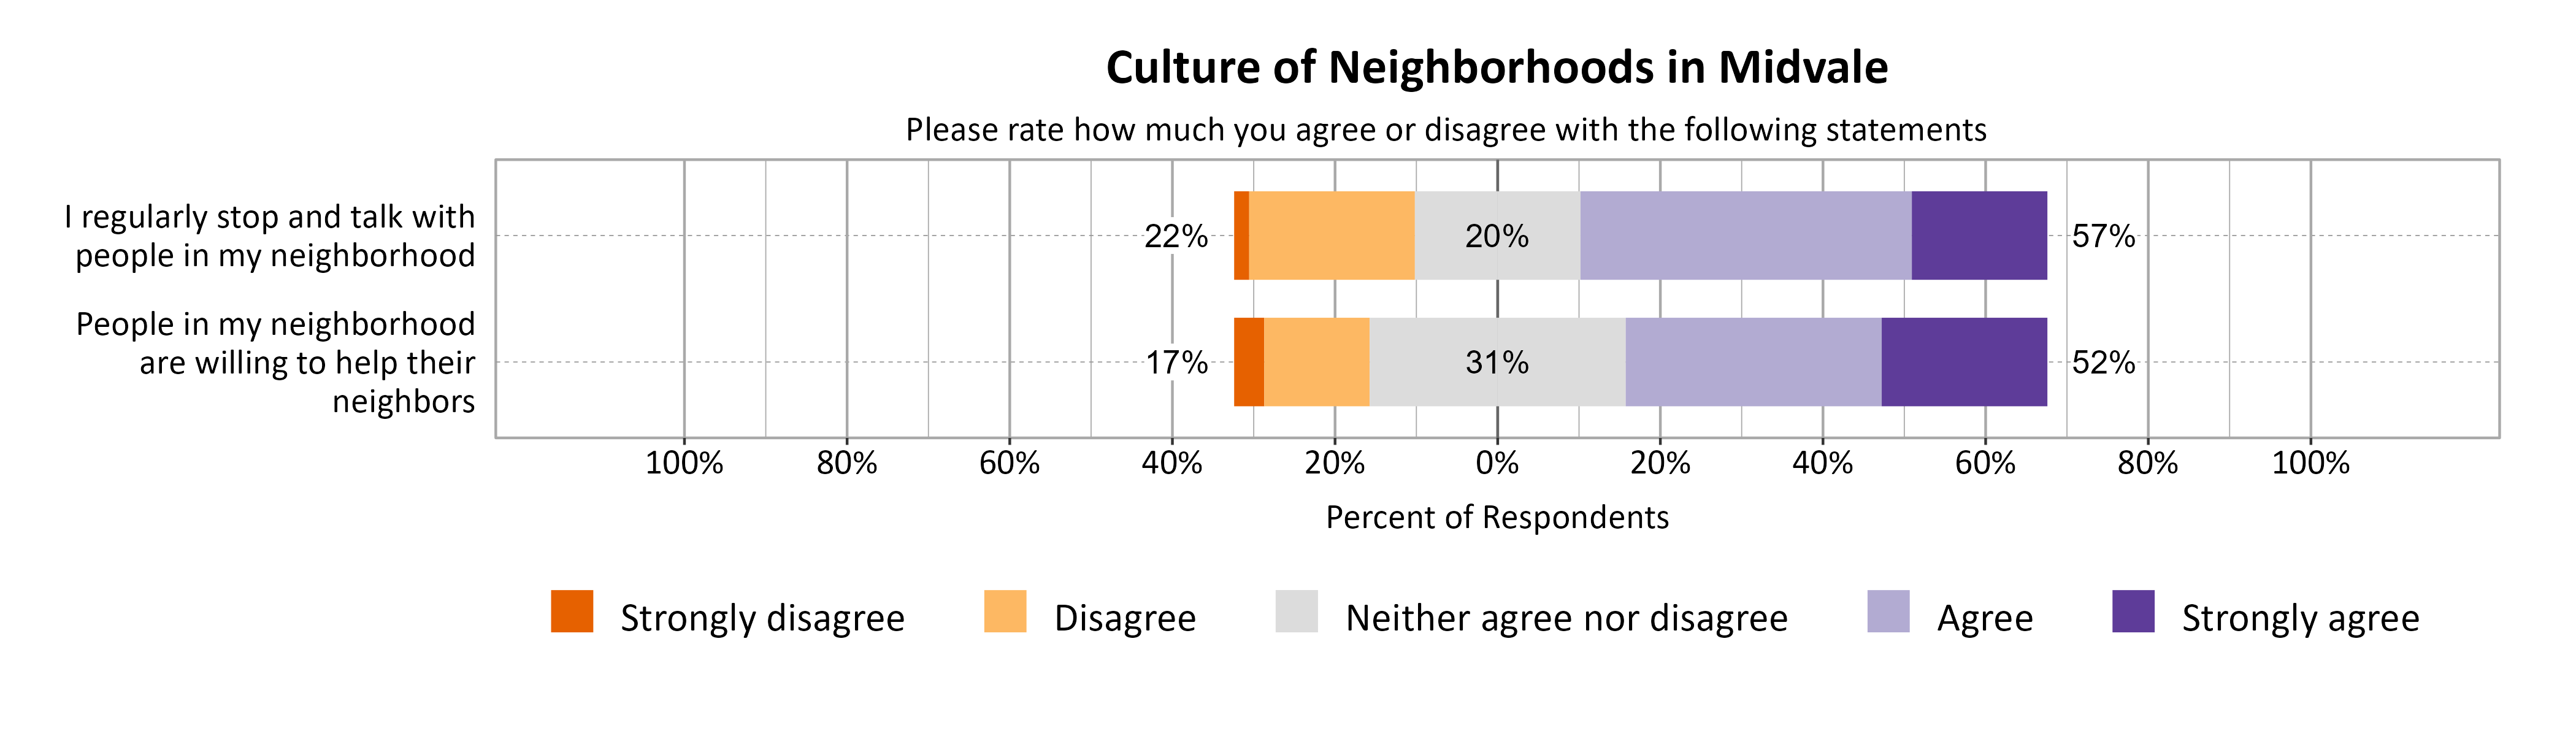
Neighborhood Culture in Midvale
Respondents were also asked to indicate how much they agree with statements regarding neighborhood cultures in Midvale.
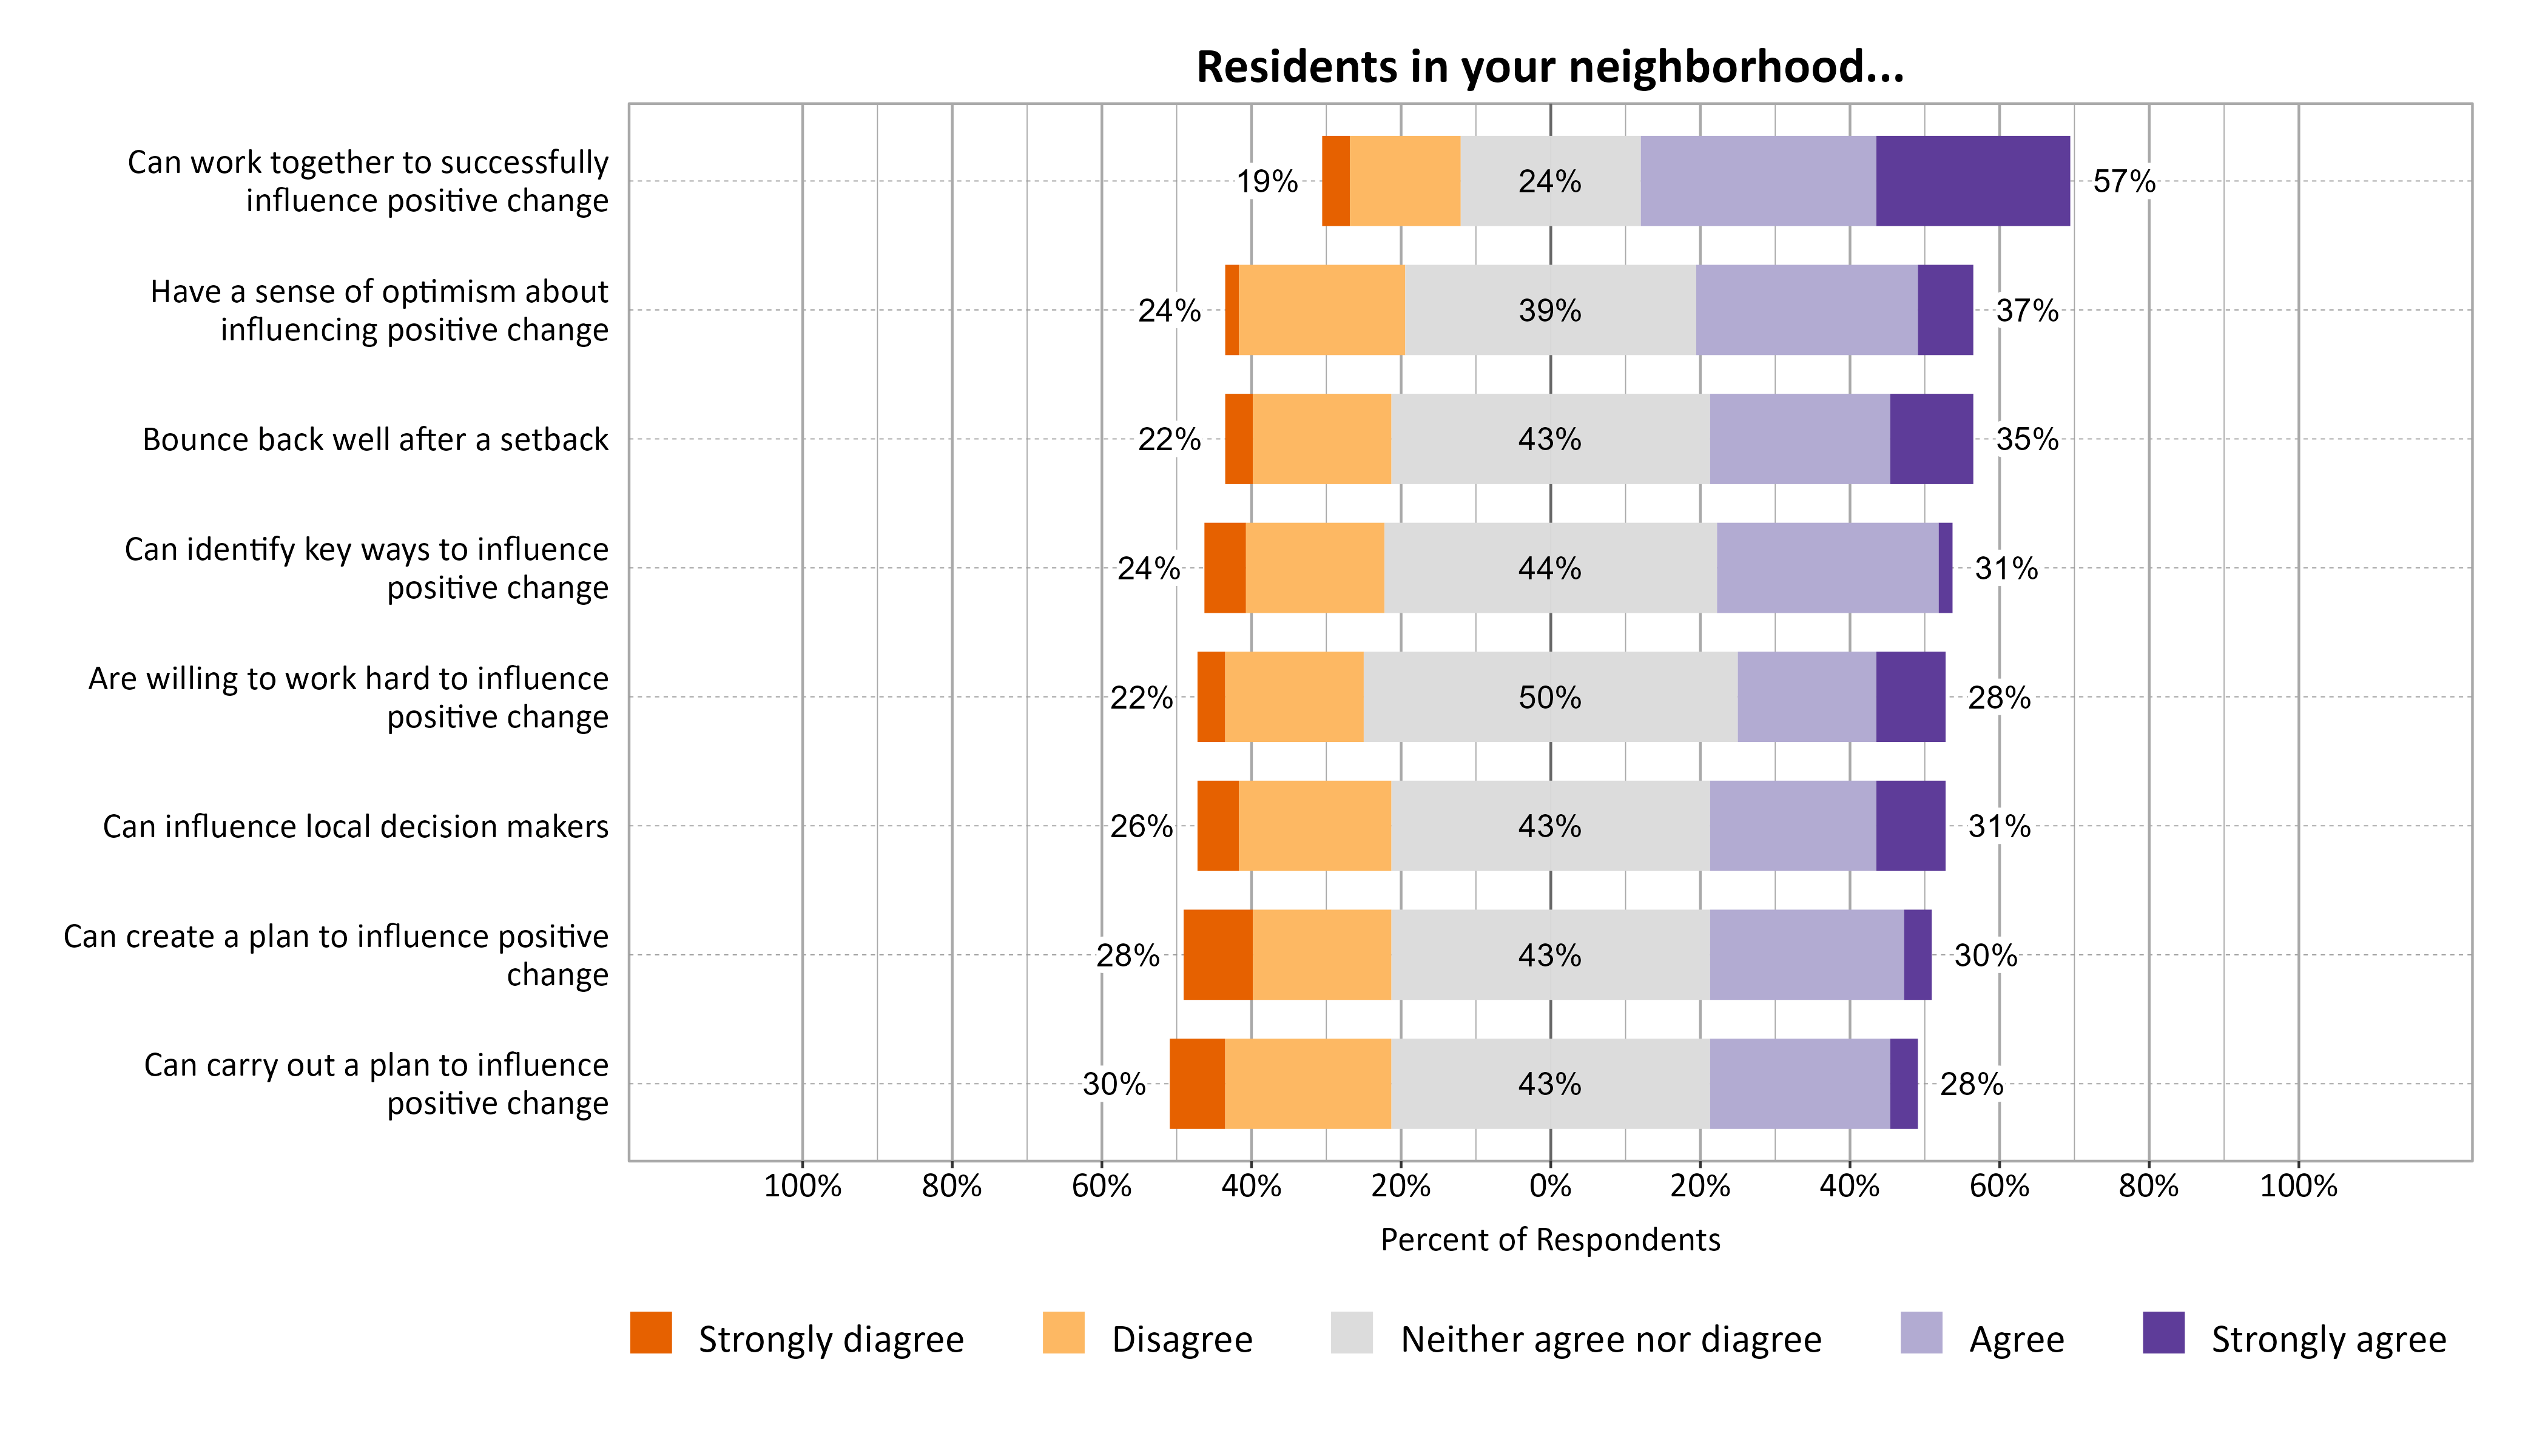
Influence of Residents in Midvale
Residents were also asked to indicate how much they agree with the following statements regarding residents’ influence in their communities. The highest statement that respondents agreed or strongly agreed with was that residents can work together to successfully influence positive change (57%).
Open Comments
All open comments collected in the survey were shared with city leaders. General observations and themes are shared here.
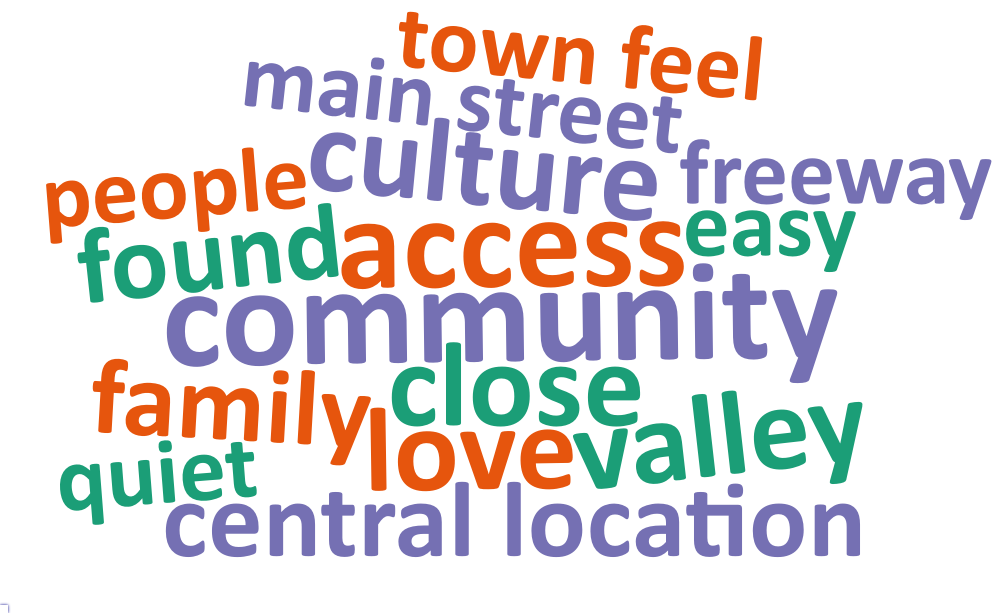
What Respondents Value Most in Midvale
Survey respondents were asked to comment on what they value most about Midvale. The most common words and phrases from all city comments are included in the word cloud below. It is possible that negative or unrelated words may appear since these words have been taken out of context, and they may not indicate the respondent’s intended meaning. Most comments expressed appreciation for the city’s location and its proximity to freeway access. Comments also spoke of Midvale's sense of community.
Local Environmental Quality in Midvale
The 73% of respondents who rated the Local Environmental Quality domain as 1, 2, or 3 (Poor, Fair, or Moderate) were further asked if there are specific aspects of local environmental quality that they feel are problematic. Air quality and water quality were the two most pressing concerns mentioned for Midvale. Trash and noise pollution were also common mentions.
Improving Wellbeing in Midvale
Survey respondents were asked if there is anything that could be done to improve wellbeing in Midvale. Comments expressed concerns about the need for crime prevention in the city and police responsiveness. In addition, some comments noted road issues and desires for enhanced walkability.
Additional Comments
Respondents were also asked if they had any additional comments on wellbeing in Midvale. Most positive comments stated the city is improving over time and expressed excitement for the future. Some comments suggested the need for improvements of the roadways. There were also some critiques about the priorities of local government leaders.