Millcreek Wellbeing Survey Findings 2024
By Dr. Courtney Flint and Team
![]()
Contact Information
Dr. Courtney Flint
courtney.flint@usu.edu
435-797-8635
Summary
Millcreek is one of 51 cities participating in the Utah Wellbeing Survey Project in 2024. This project is designed to assess the wellbeing and local perspectives of city residents and to provide information to city leaders to inform general planning processes. Additional analysis is underway and this report may be updated over time.
We are grateful to all those who took the survey and to our city partners who helped to make this possible. We are grateful to a number of entities for funding: the Utah League of Cities and Towns, USU Extension, USU’s Institute for Land Water and Air, the Wasatch Front Regional Council, Utah Department of Transportation, the Utah Agricultural Experiment Station, and the cities of Alpine, Cedar Hills, Draper, Millcreek, Nephi, North Salt Lake, Ogden, Orem, Pleasant Grove, Providence, Springdale, Tremonton, West Bountiful, and West Valley City.
This report describes findings from the 2024 Millcreek survey and comparative information with other project cities. In March and April 2024, Millcreek City advertised the survey for residents largely through social media and newsletters. All city residents age 18+ were encouraged to take the online Qualtrics survey.
How many people responded?
- 291 viable surveys were recorded in this 2024 survey effort.
- The Millcreek 2022 survey had 274 responses.
- The adult population of Millcreek was estimated at 50,272, based on the American Community Survey by the U.S. Census. The 291 survey responses in 2024 represent 0.6% of the adult population and have a conservative margin of error of 5.73%.
Survey Respondent Characteristics
| Resident Statistics | |
|---|---|
| Full Time Residents of Millcreek | 99.3% |
| Part Time Residents of Millcreek | 0.7% |
| Length of Residency — Range | 0.5-74 years |
| Length of Residency — Average | 21.9 years |
| Length of Residency — Median | 20 years |
| Length of Residency 5 Years or less | 24.5% |
| ZIP Code | Percent |
|---|---|
| 84106 | 27.6% |
| 84107 | 4.1% |
| 84109 | 46.2% |
| 84117 | 2.8% |
| 84123 | 0.3% |
| 84124 | 19.0% |
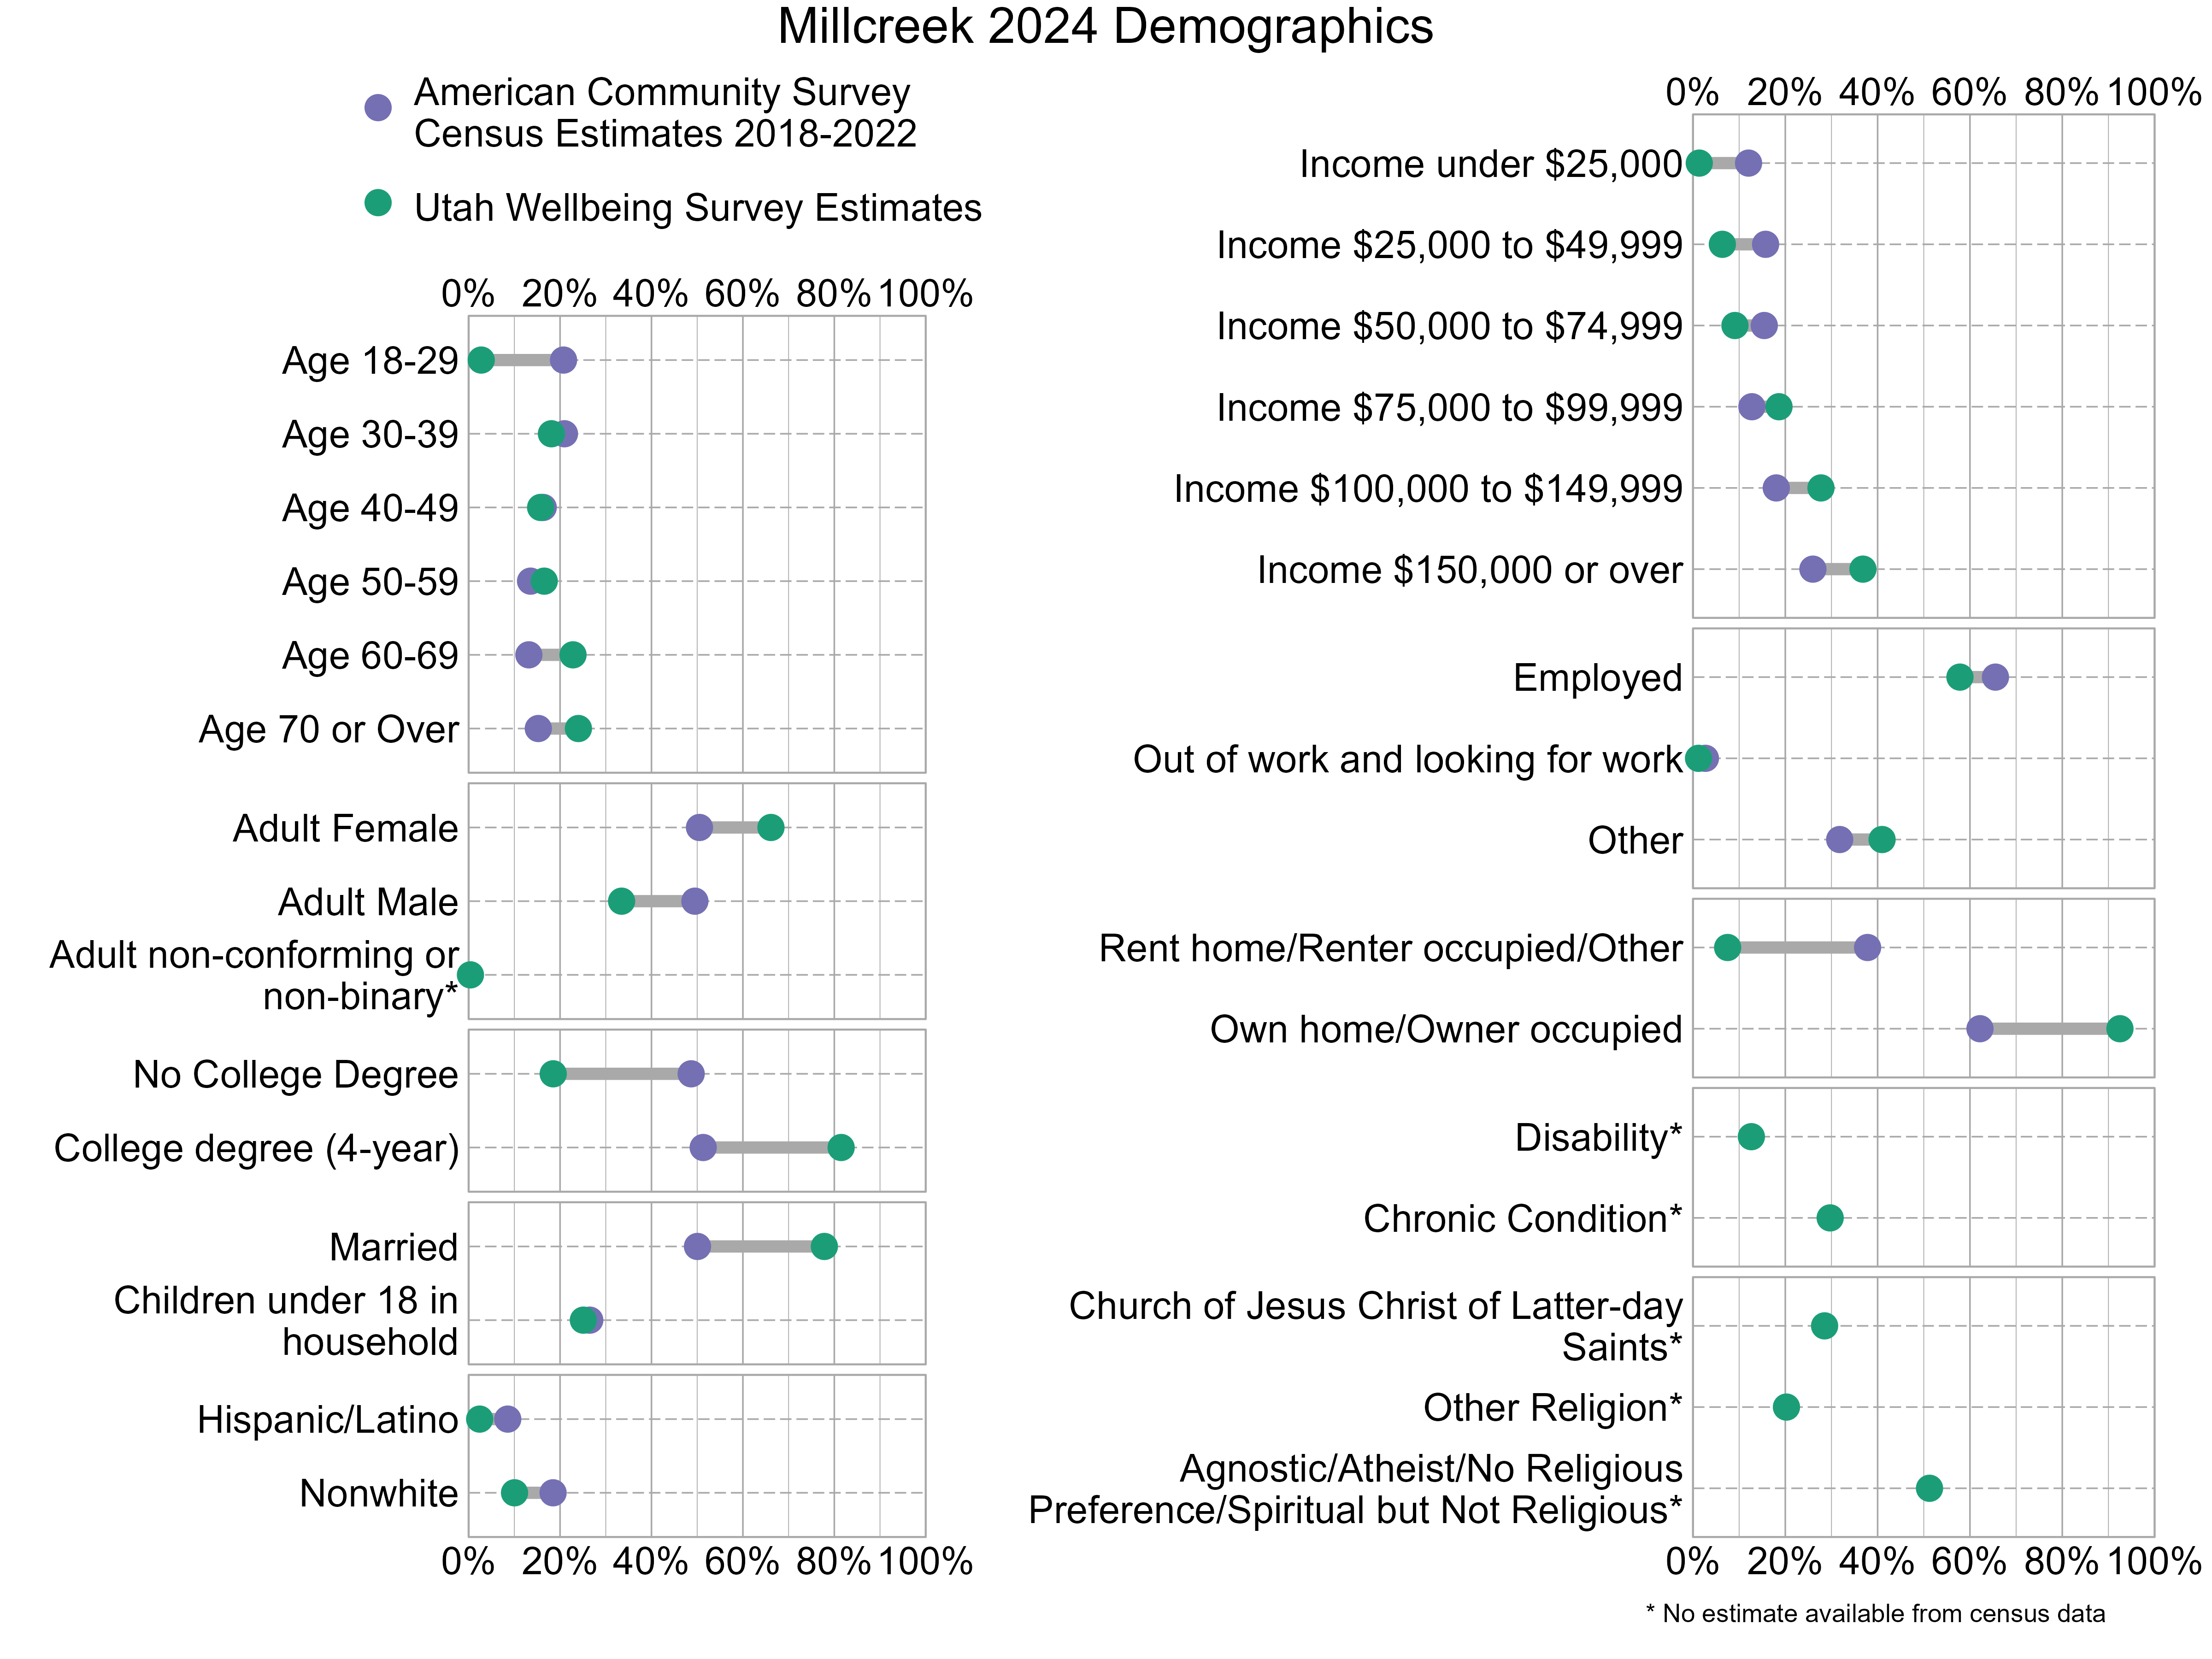
Demographic characteristics of the survey respondents were compared below with U.S. Census information from the 2018-2022 American Community Survey. In the graph below, gray bars indicate differences between the American Community Survey estimates and the Utah Wellbeing Project surveys. The wider the gray bars, the larger the differences. Also note that estimates for religious affiliation, adult non-conforming or non-binary gender, disability, and chronic conditions are unavailable from the census data. There can also be a variable margin of error in the American Community Survey estimates, and caution should be used when comparing estimates. Not all respondents provided demographic information. As the graph shows, 2024 survey respondents were not fully representative of Millcreek. People who are adult females, have at least a 4-year college degree, are married, and own their homes were overrepresented while those who are age 18-29, are adult males, do not have a college degree, and are renters were underrepresented.
Overall Personal Wellbeing and Overall Wellbeing in Millcreek
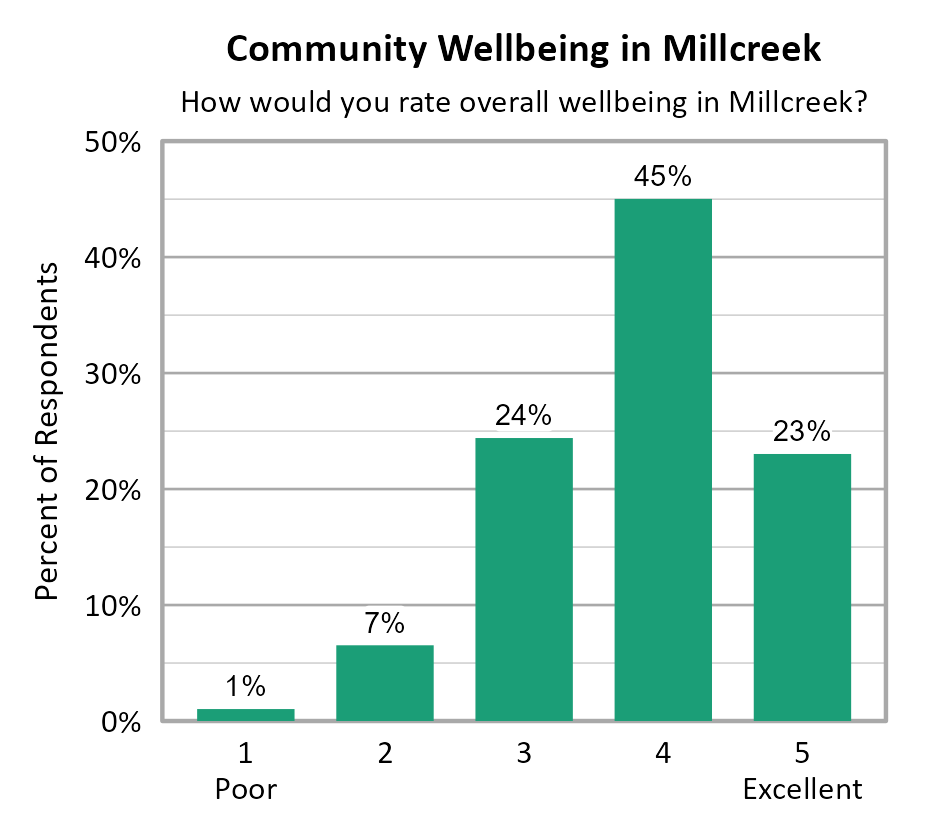
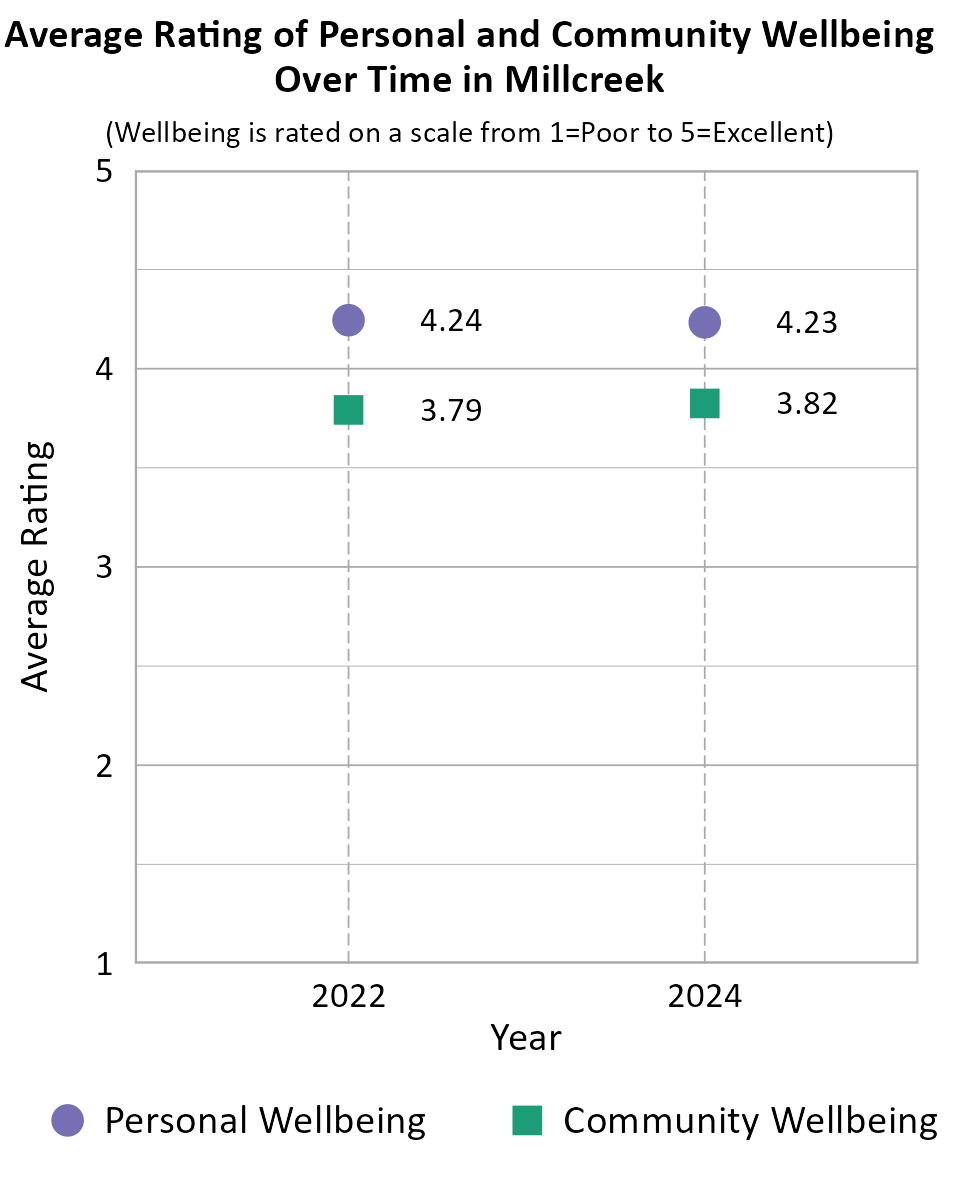
Survey participants were asked about their overall personal wellbeing and overall community wellbeing in Millcreek. These wellbeing indicators were both measured on a 5-point scale from poor (1) to excellent (5). The average personal wellbeing score in Millcreek was 4.23 with 83% of respondents indicating their wellbeing at a 4 or 5 on the 5-point scale. The average score for community wellbeing in Millcreek was 3.82 with 68% of respondents indicating community wellbeing at a 4 or 5 on the 5-point scale. ZIP code 84124 had statistically higher overall personal and community wellbeing scores than ZIP code 84106.

When comparing survey data from Millcreek over the years as shown in the information below, we can see that the average personal wellbeing score and average community wellbeing score remained nearly the same between 2022 and 2024. Note that the number of respondents differed between years, there is no tracking of individuals from one year to the next, and the low end of the scale was "Poor" in 2024 but "Very Poor" in prior years which may account for differences in scores over time.
Comparing Wellbeing Across Utah Cities
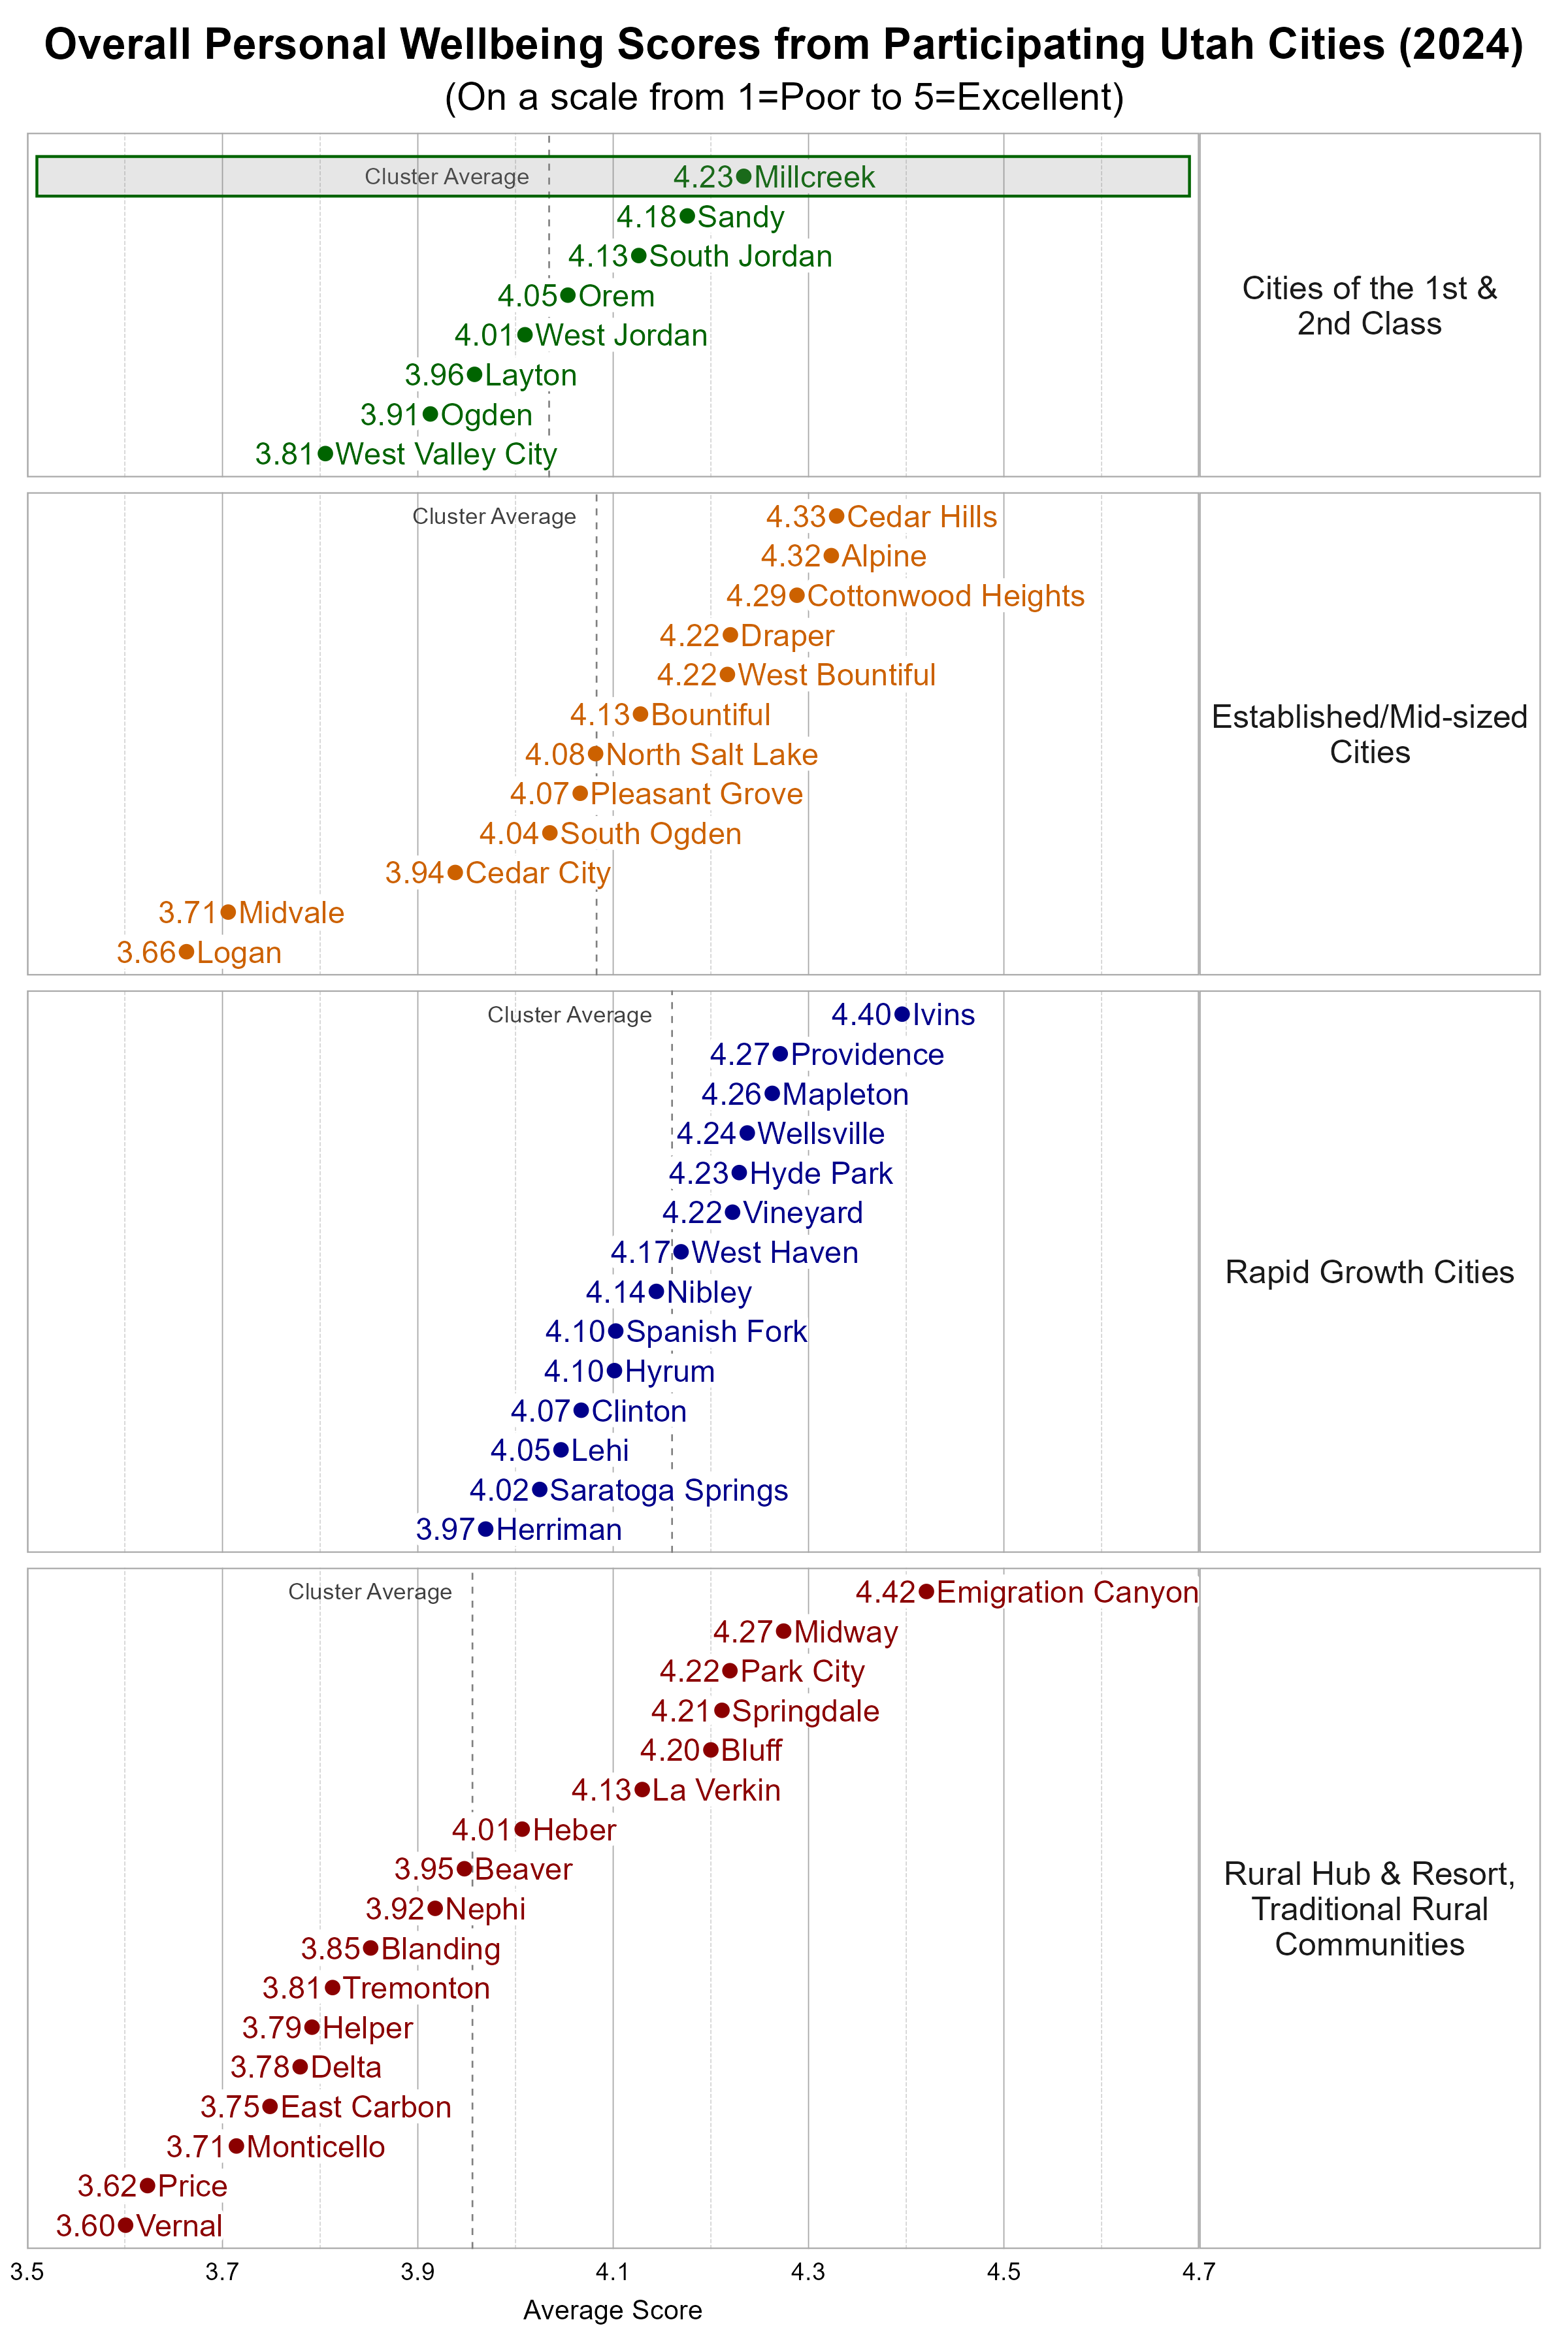
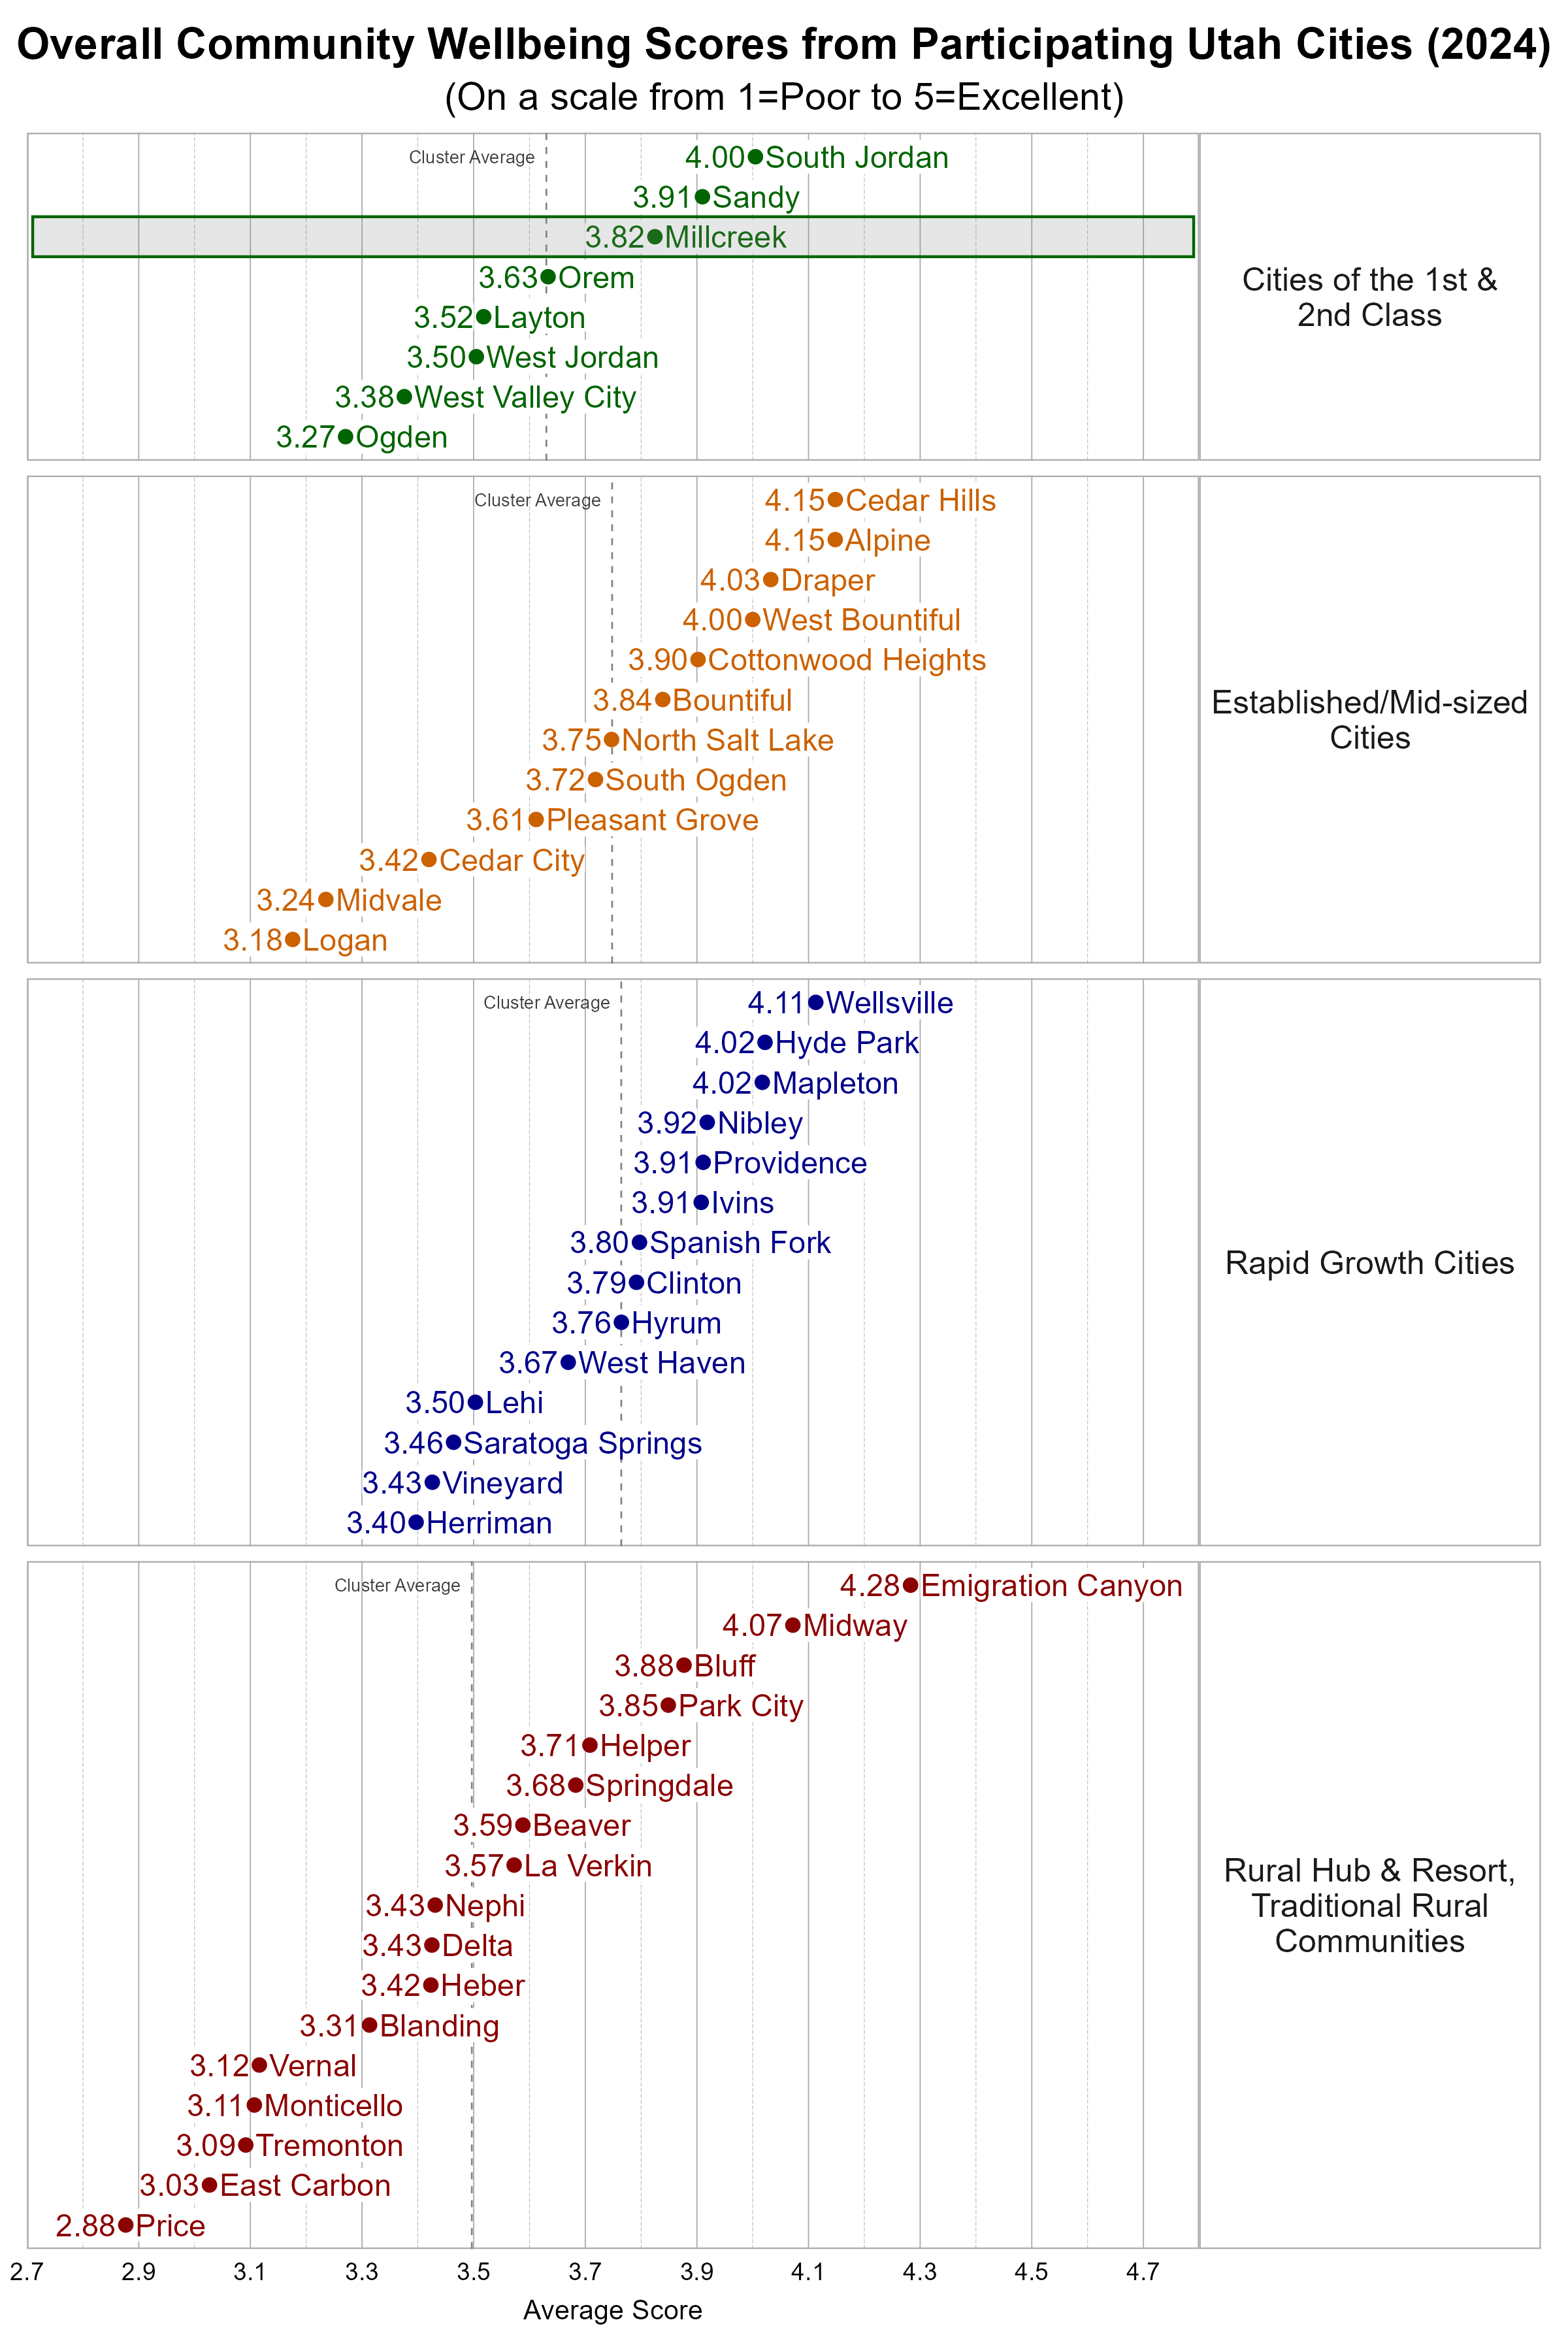
The Utah League of Cities and Towns clusters cities and towns into five different categories based on size and growth rates. We utilize these clusters in our analysis. Millcreek is classified as a City of the 1st and 2nd Class. Some cities may fit within more than one cluster.
Within the more Urban city cluster, Millcreek was well above the average overall personal wellbeing score and slightly above the average overall community wellbeing score.
Wellbeing Domains in Millcreek
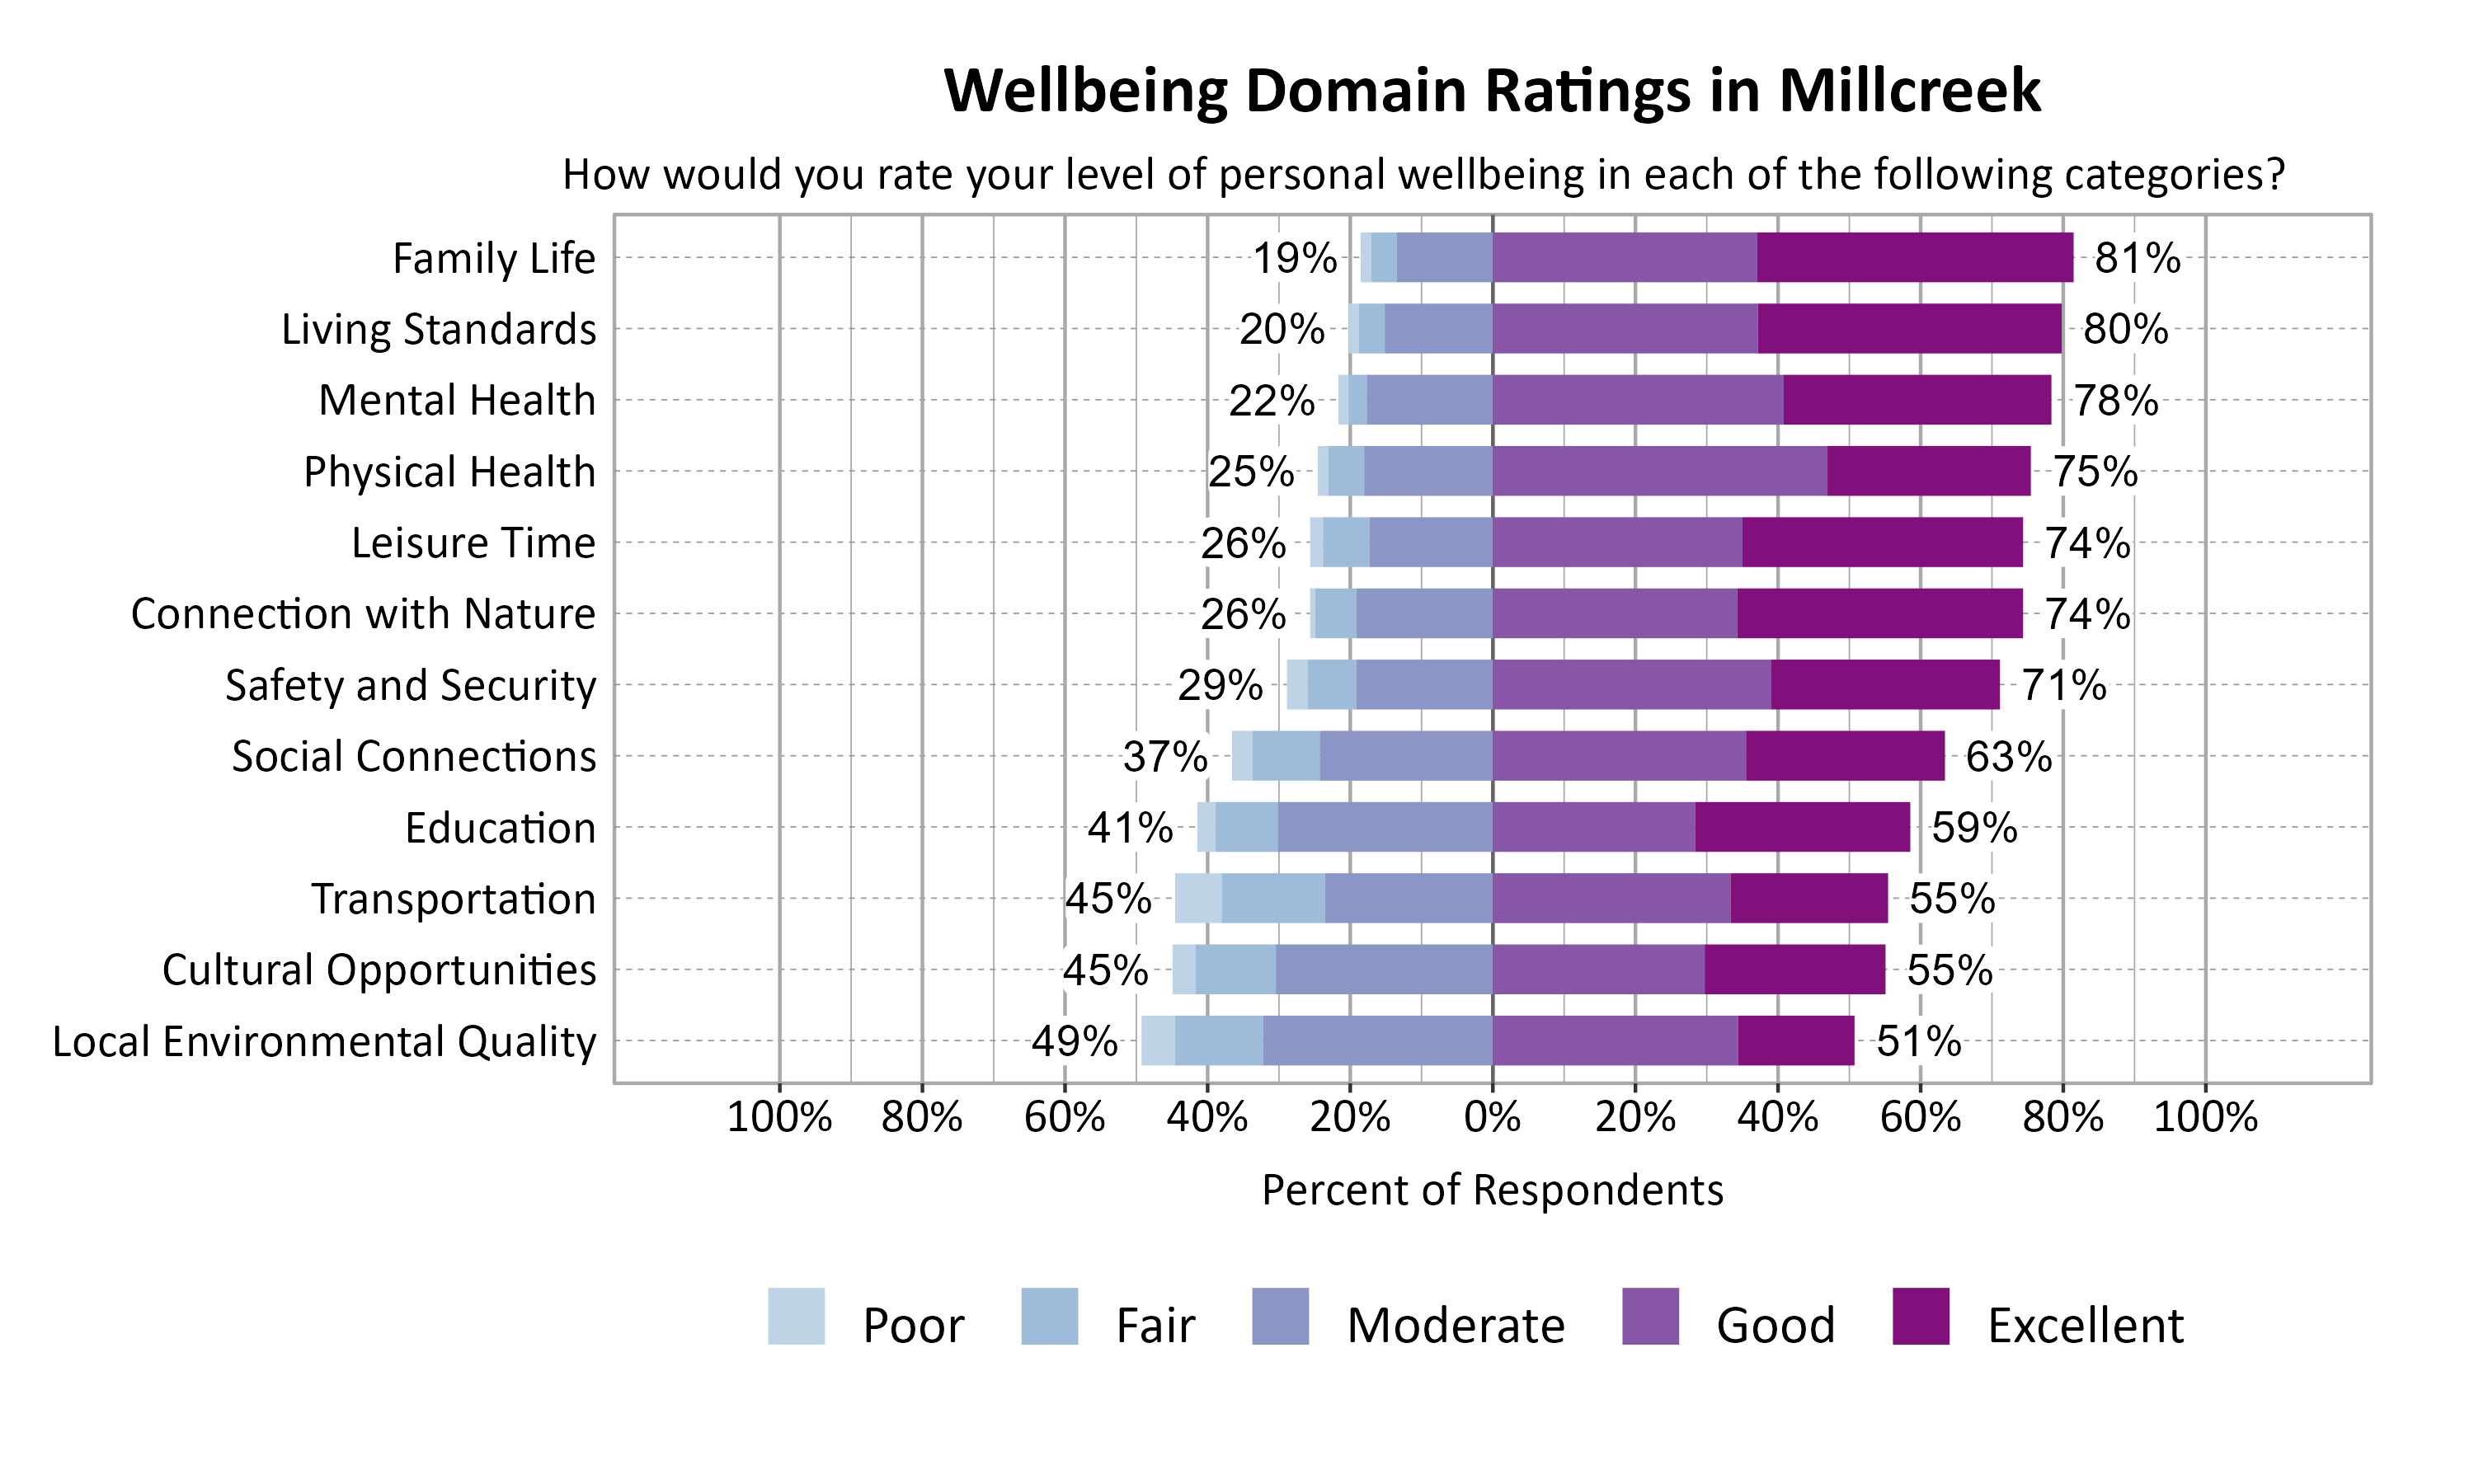
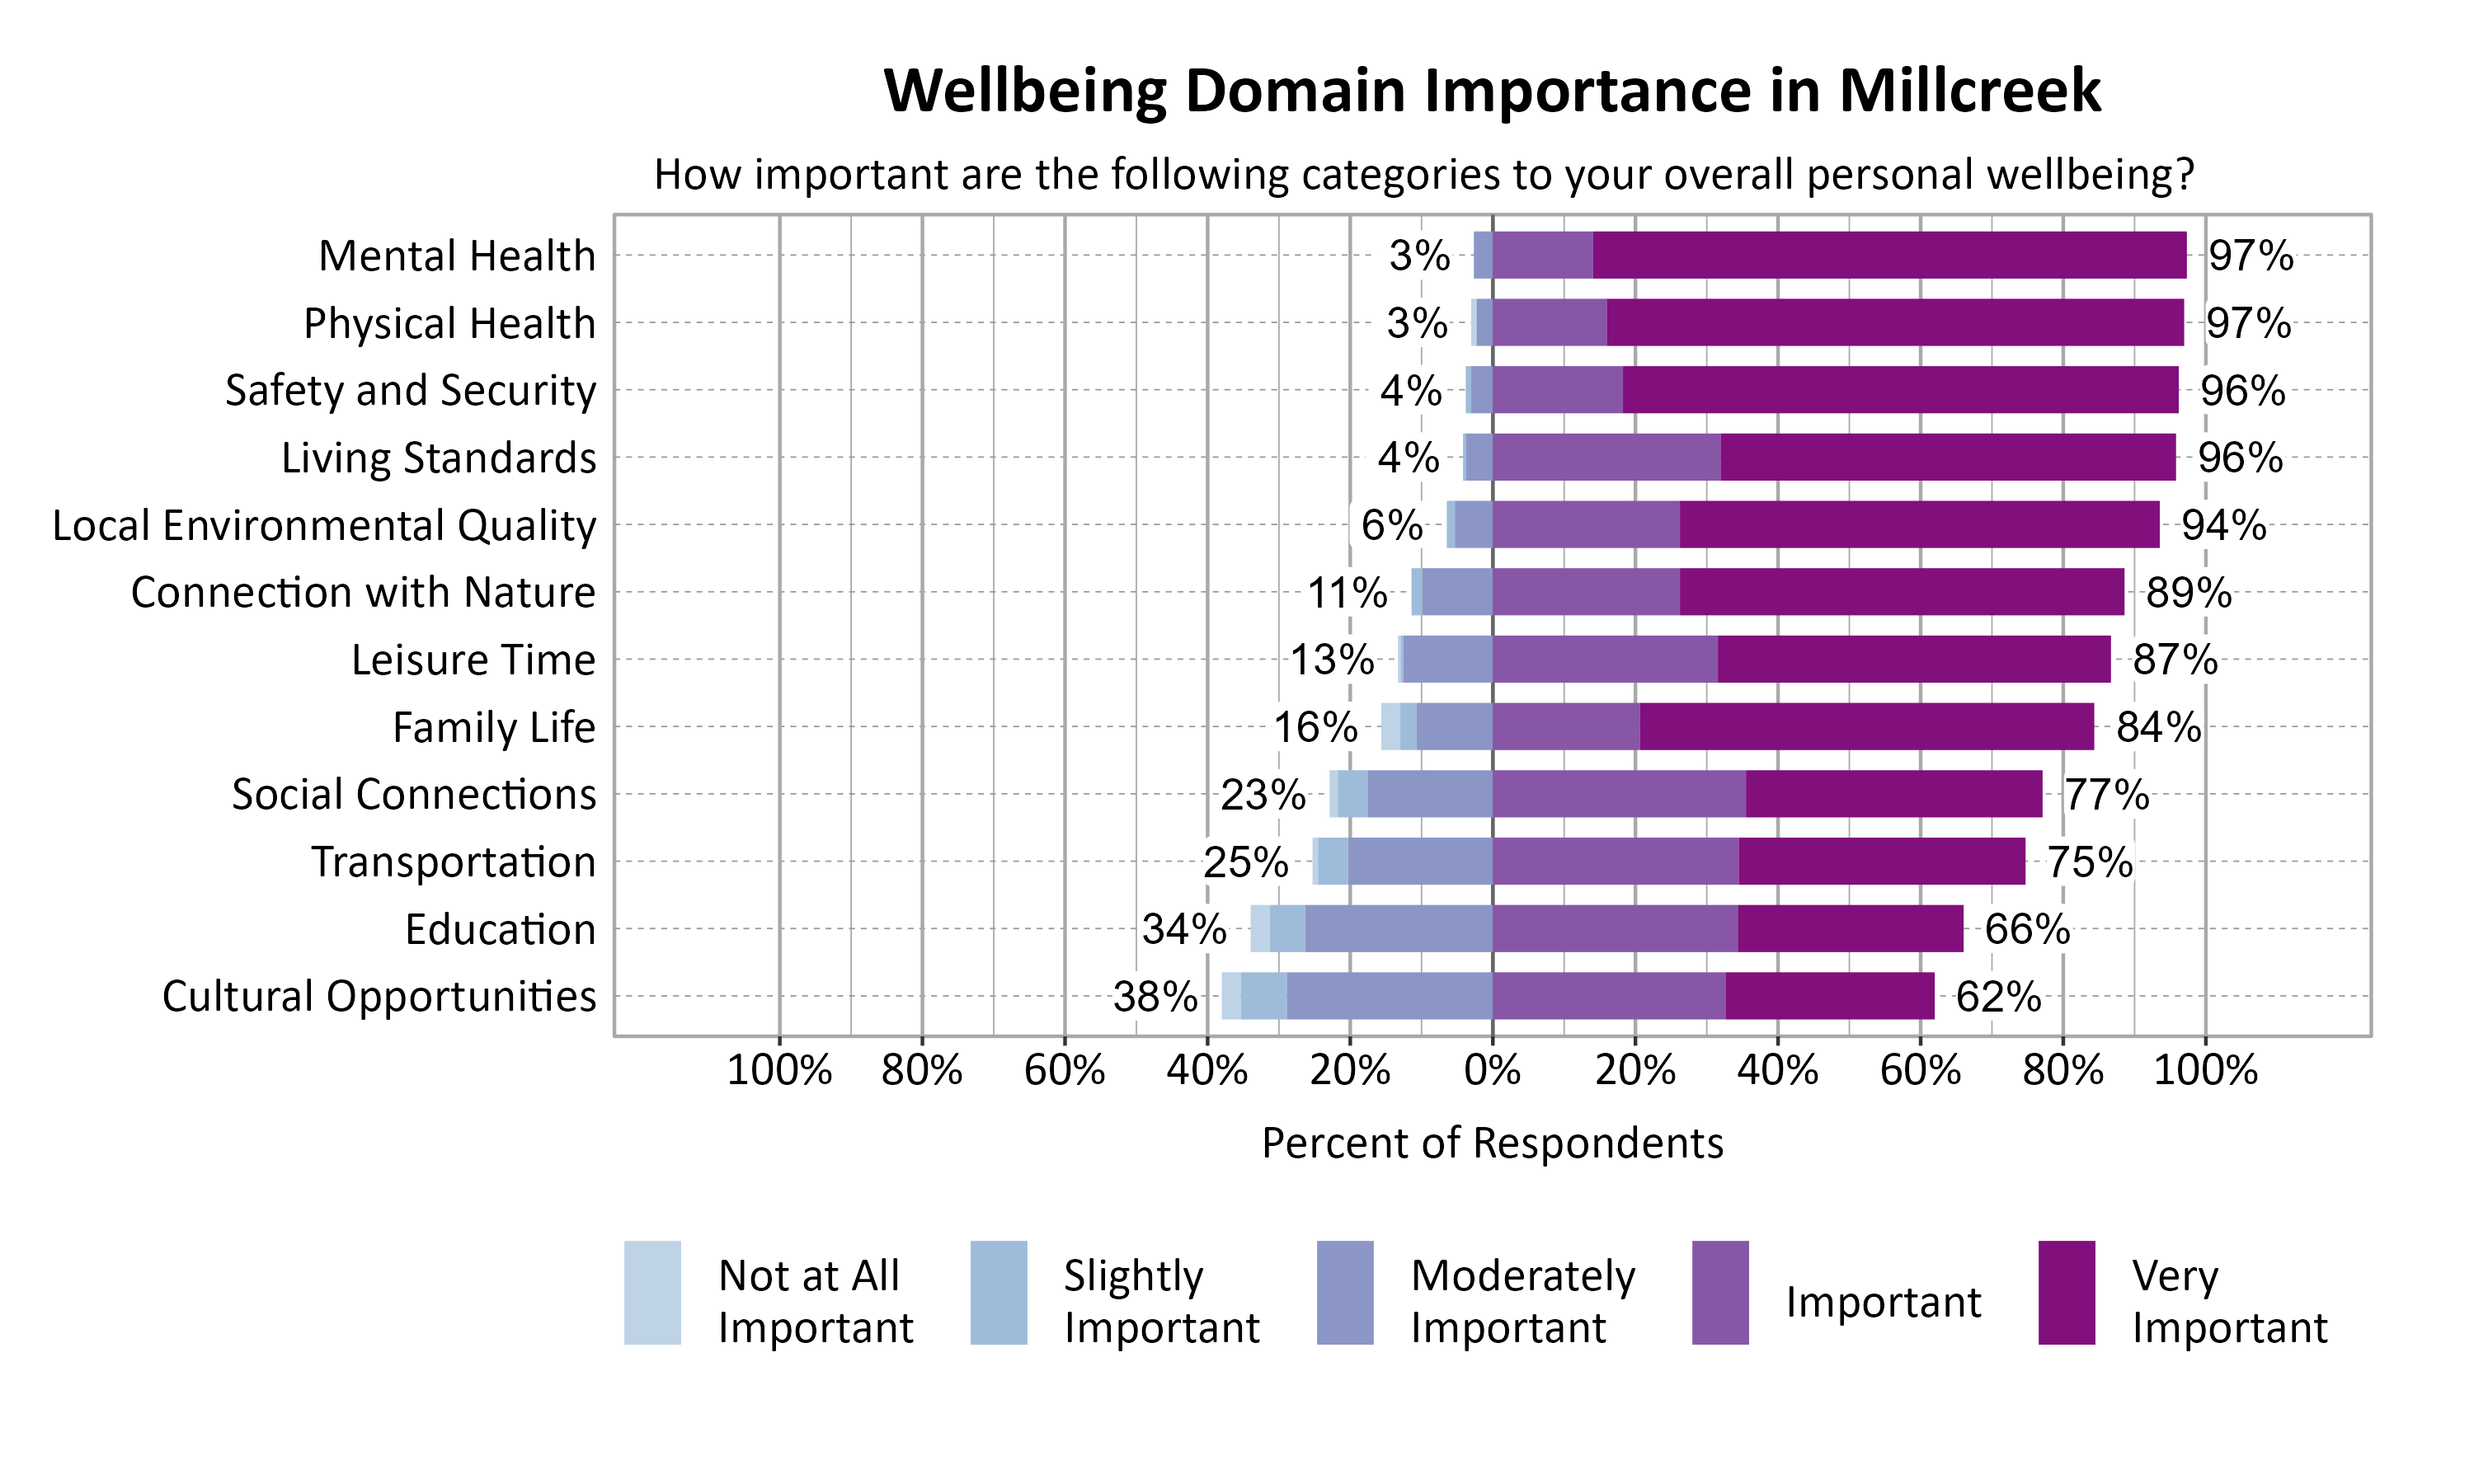
According to national and international entities that track wellbeing, there are a number of common dimensions or domains of wellbeing. Survey respondents rated twelve domains on a 5-point scale from poor to excellent. They were also asked to indicate the importance of each domain to their overall personal wellbeing on a 5-point scale from not at all important to very important. The highest rated wellbeing domains for respondents in Millcreek were Family Life (81%), Living Standards (80%), and Mental Health (78%). The most important wellbeing domains were Mental Health (97%), Physical Health (97%), Safety and Security (96%), and Living Standards (96%).
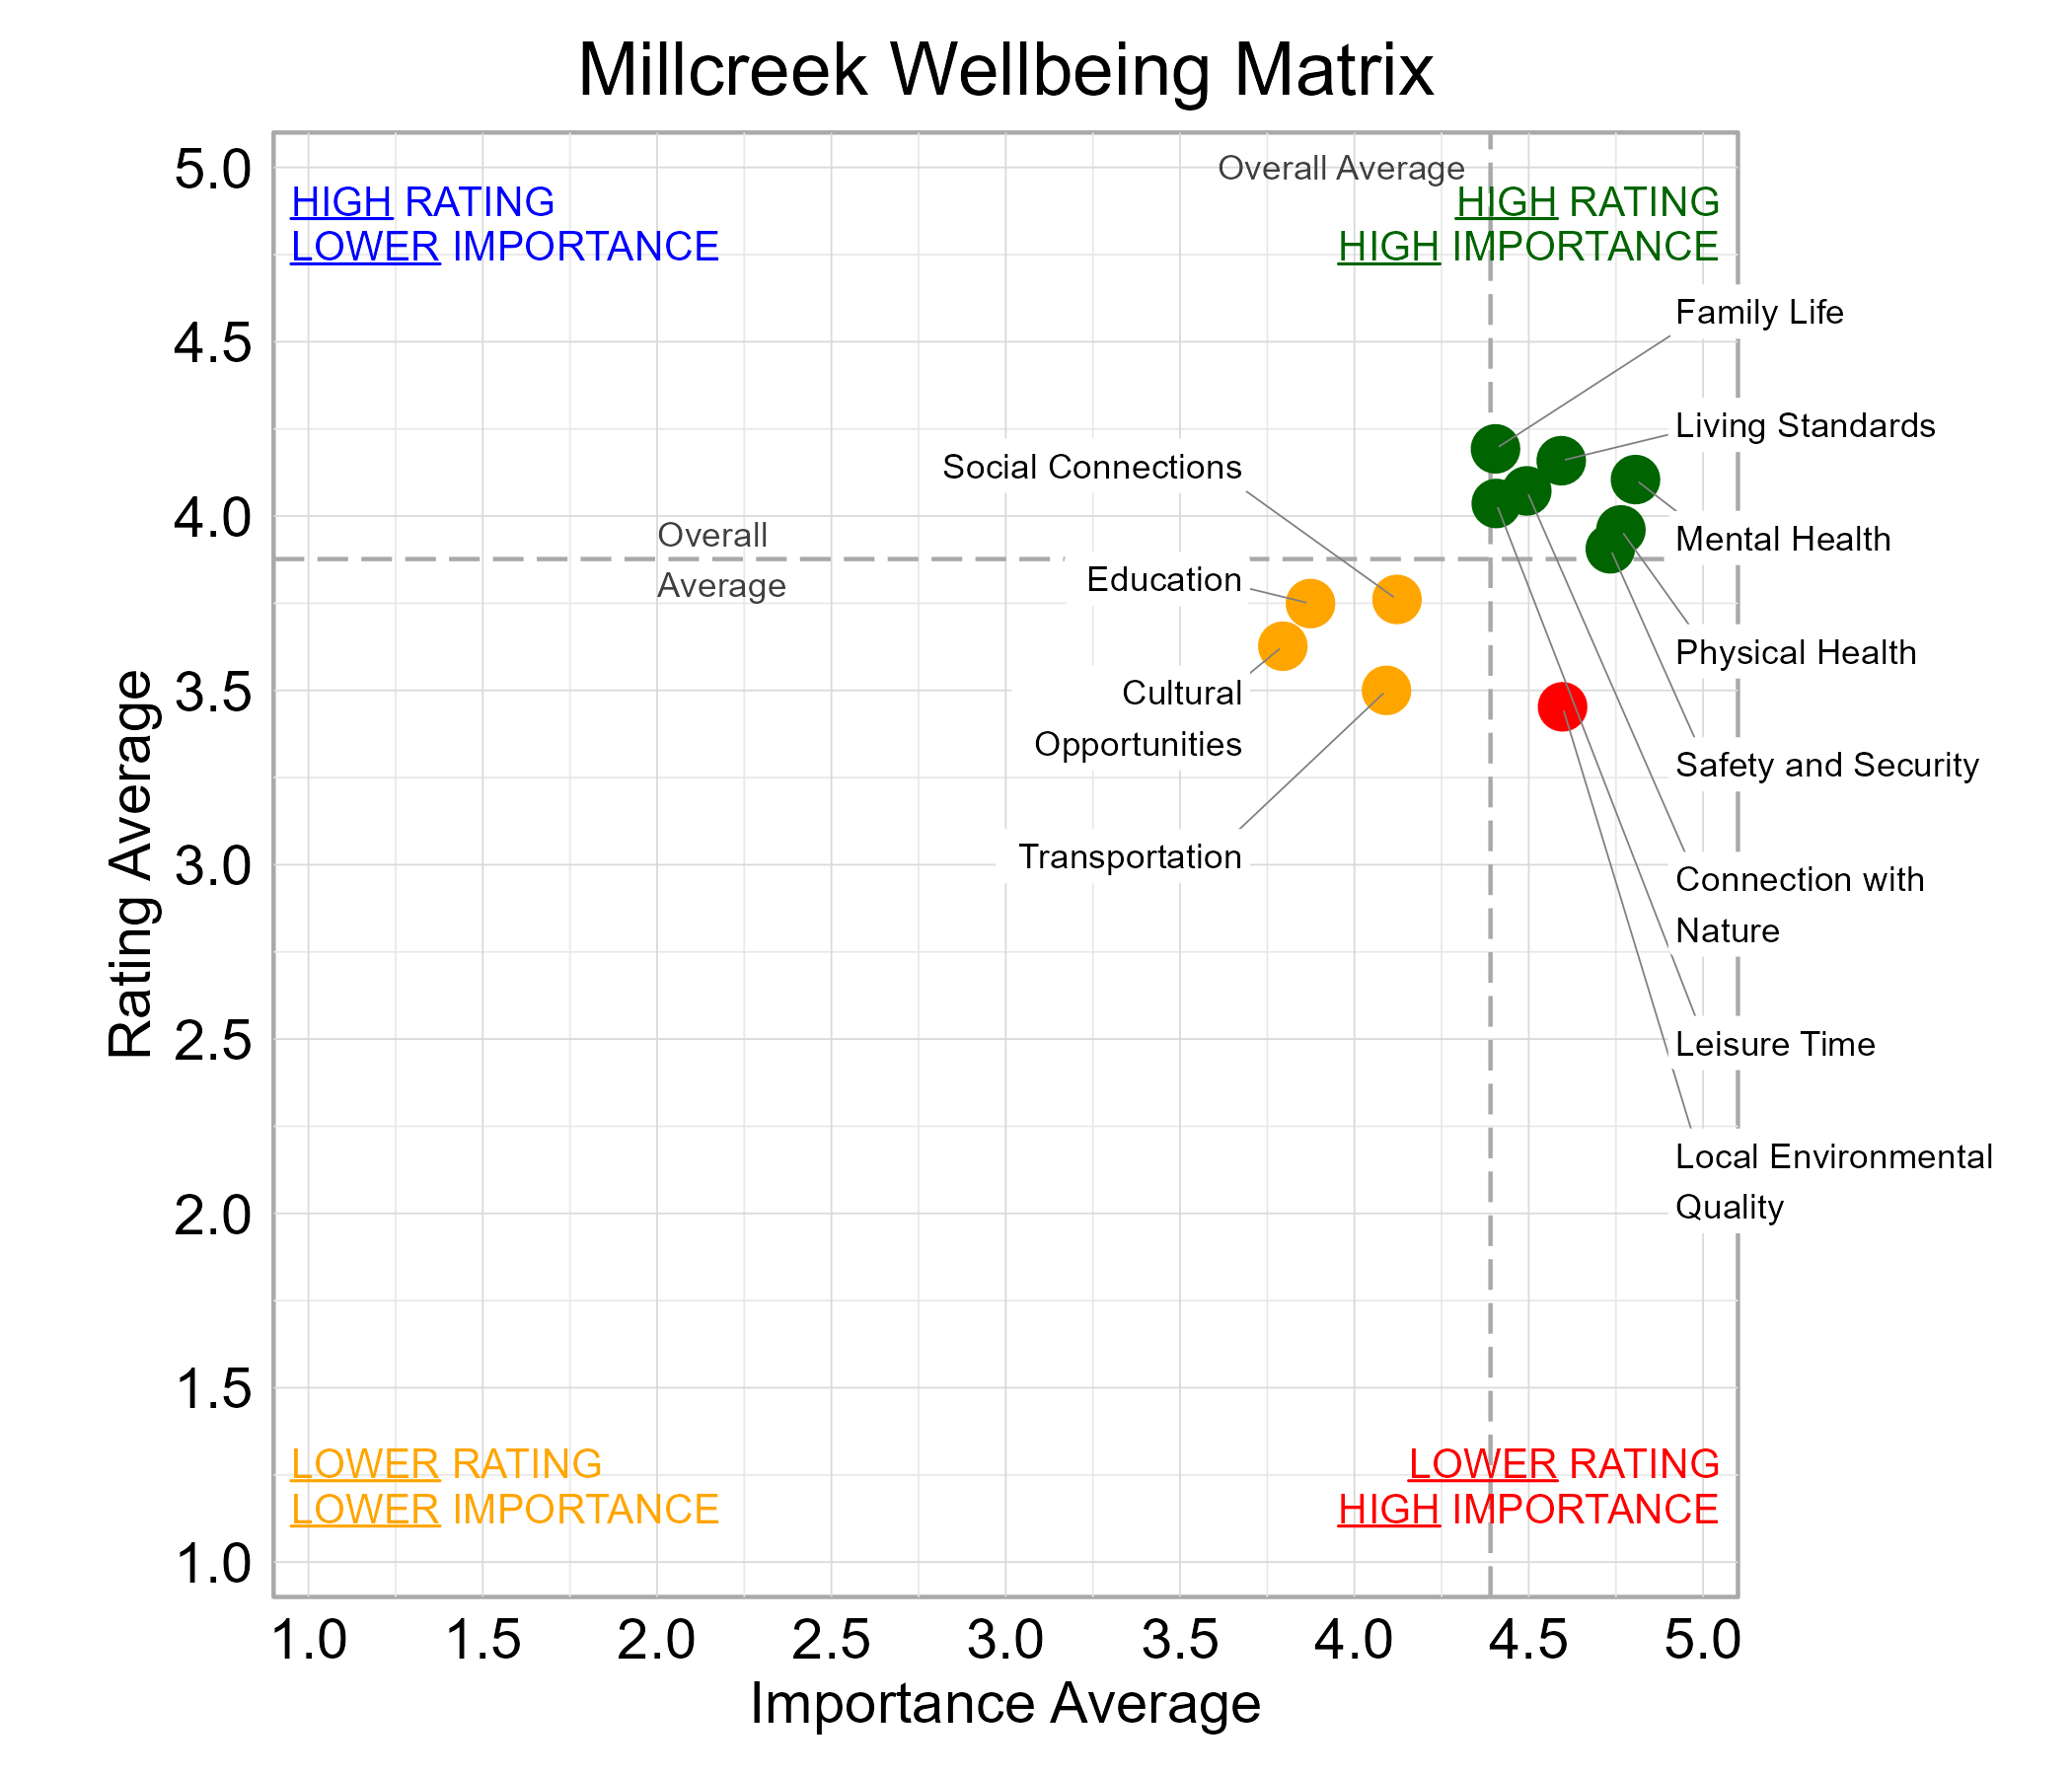
Wellbeing Matrix for Millcreek
The graph below illustrates the relationship between the average rating and the average importance of wellbeing domains for survey respondents from Millcreek. Connection with Nature, Family Life, Leisure Time, Living Standards, Mental Health, Physical Health, and Safety and Security were highly important and rated above average among the domains. Local Environmental Quality fell in the “red zone” of higher importance and lower ratings.
Wellbeing Domains Over Time in Millcreek
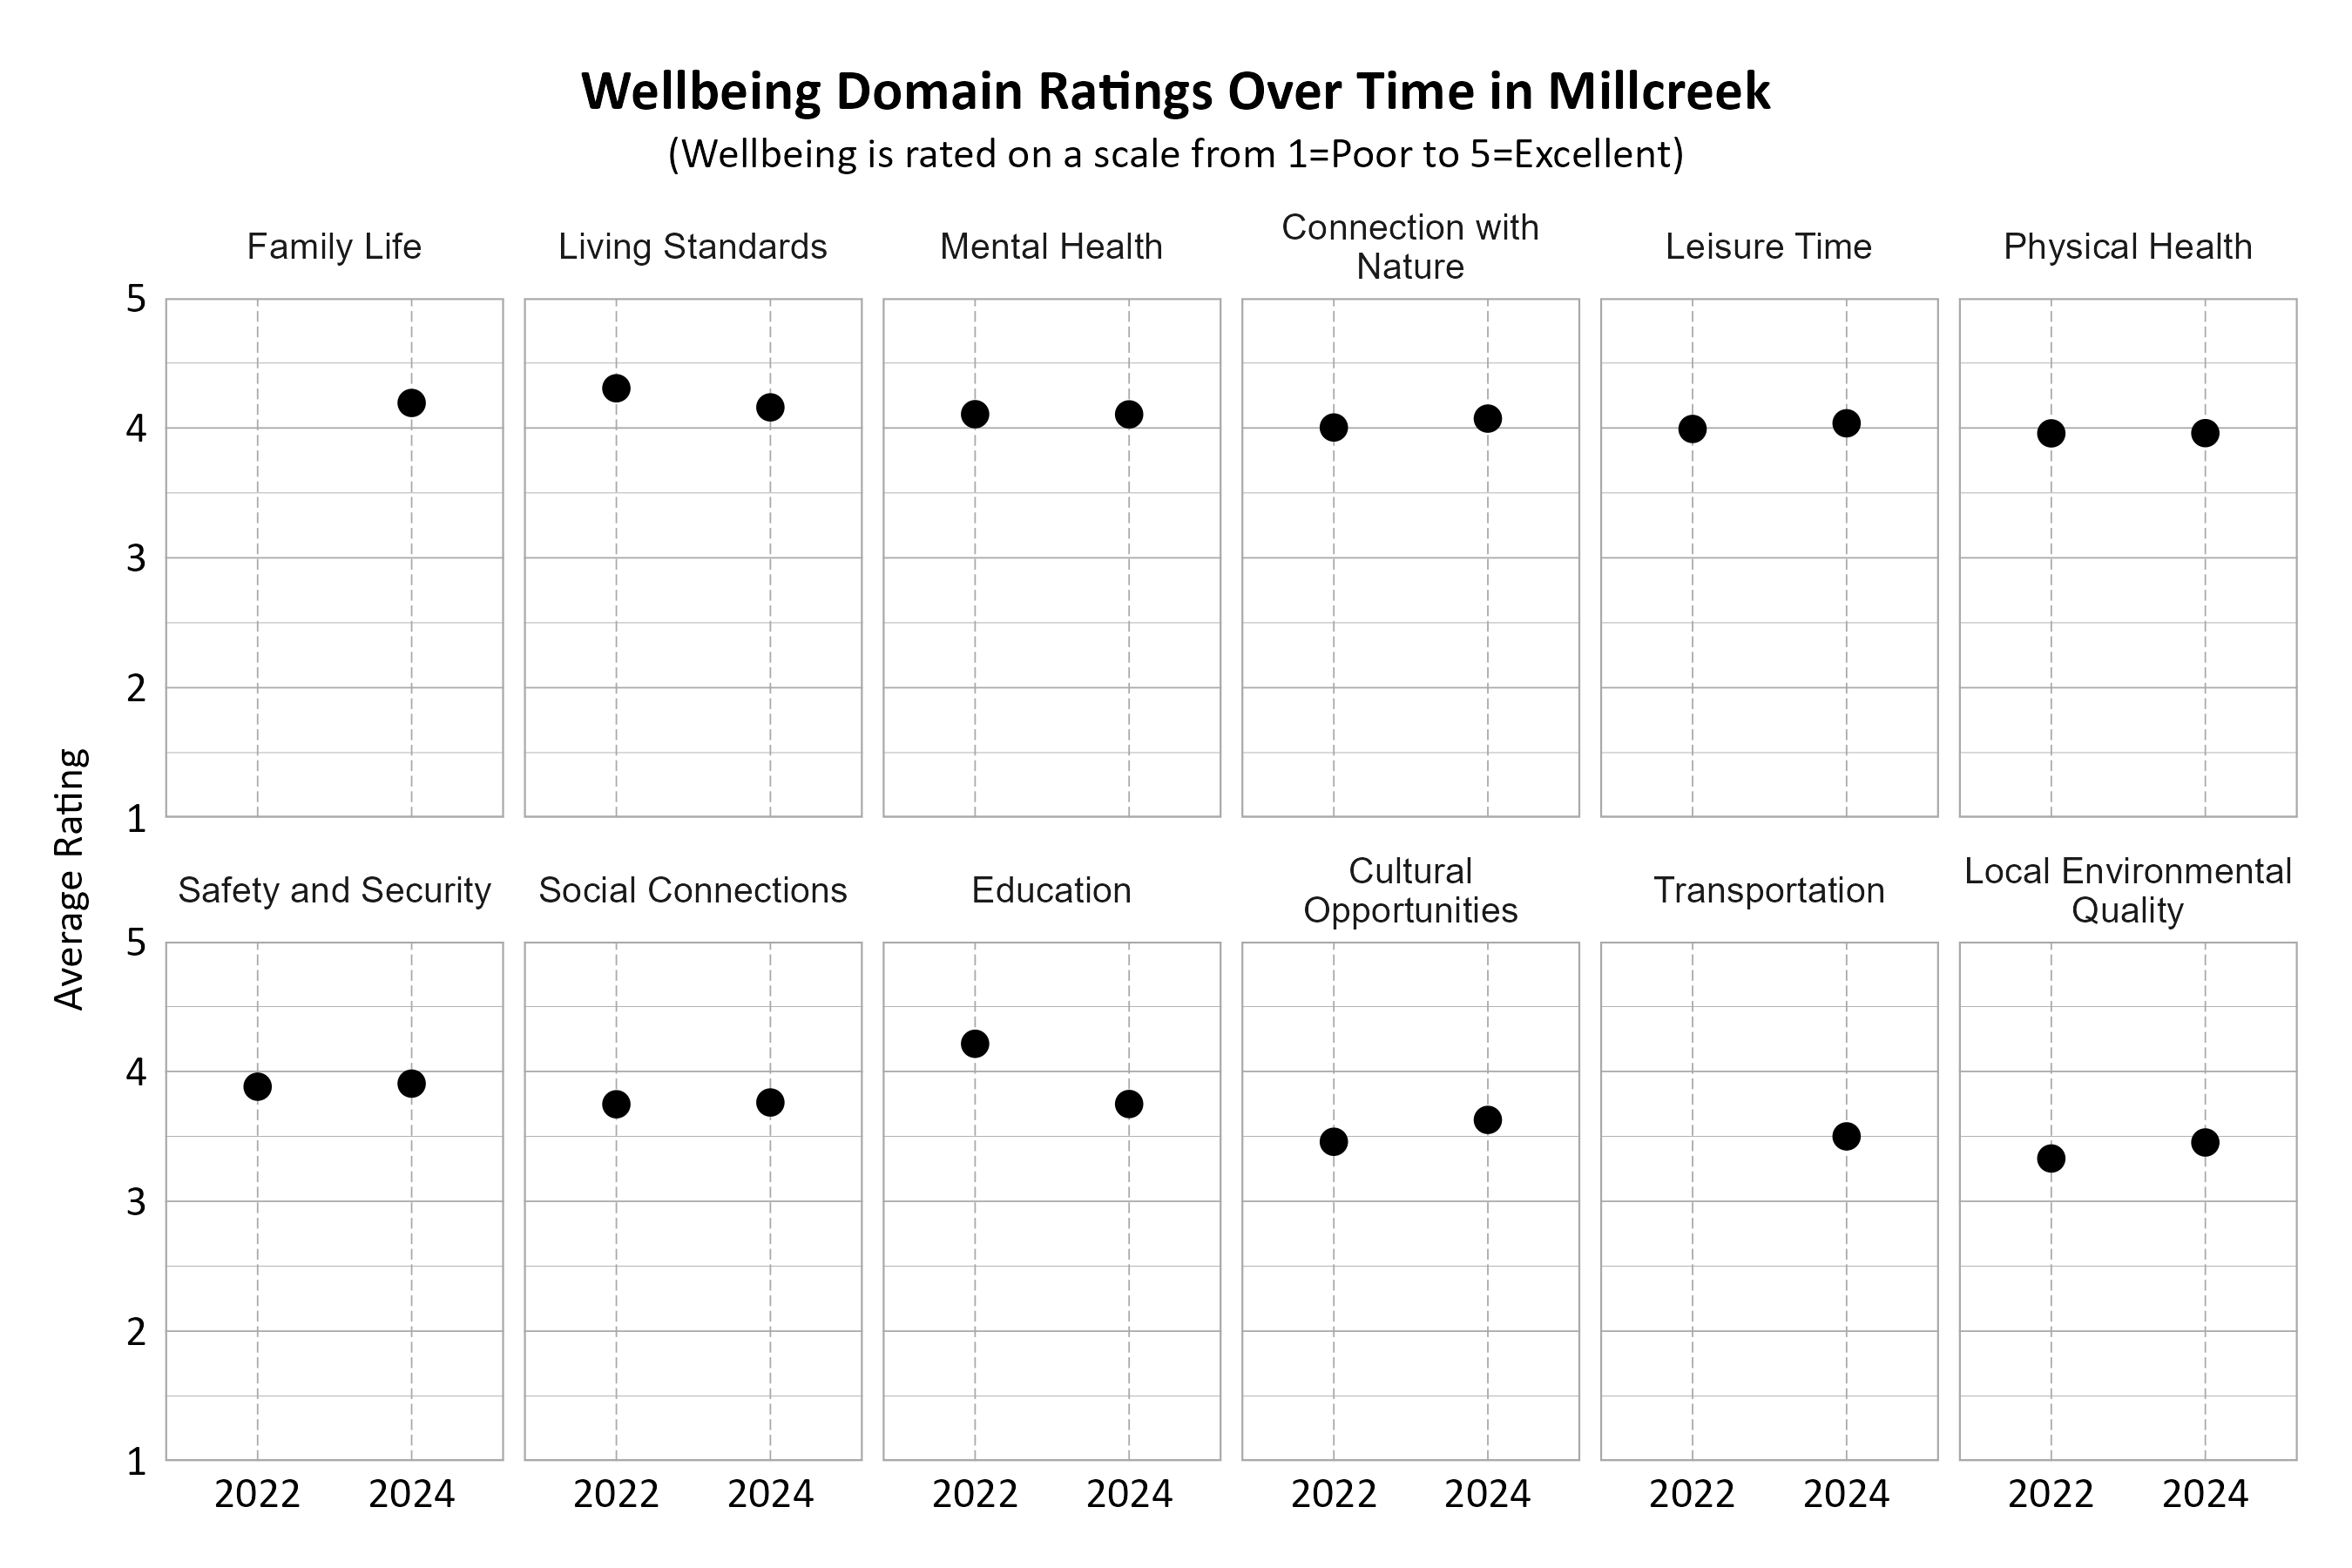
The graphs below show how the domains were rated over the years by Millcreek residents. The number of respondents changed over time. Note that the two domains Family Life and Transportation were new categories in the 2024 survey and were not measured in previous years. Most domains increased in ratings from 2022 to 2024 or remained the same. Education saw the largest drop in its overall rating.
Community Connection in Millcreek
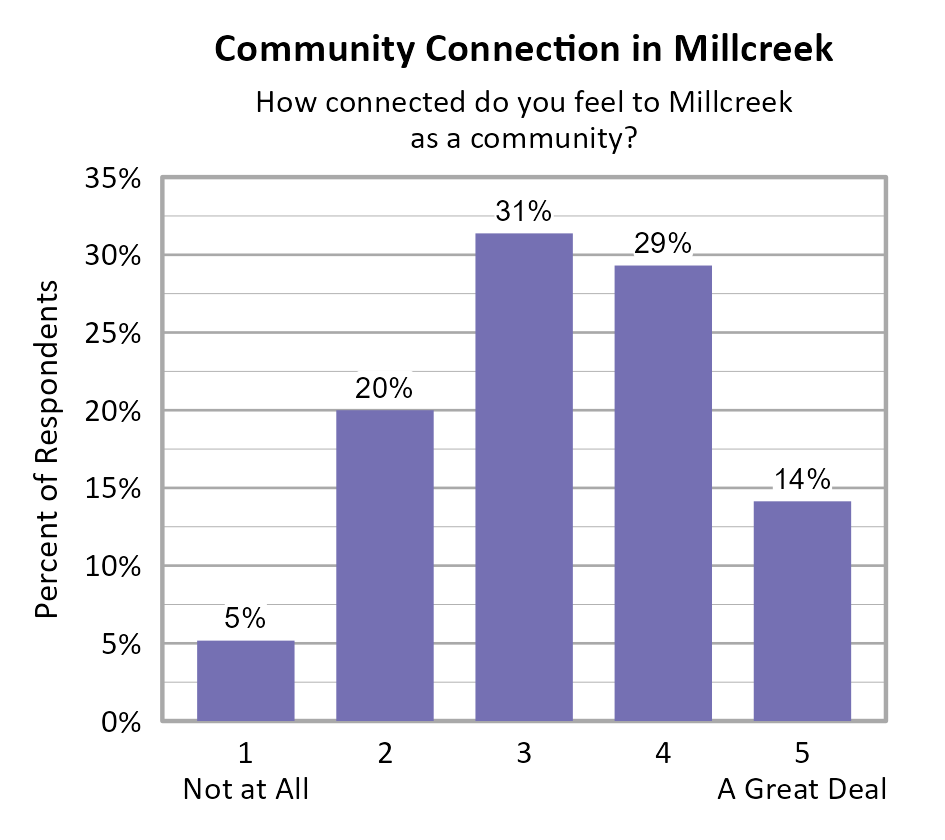
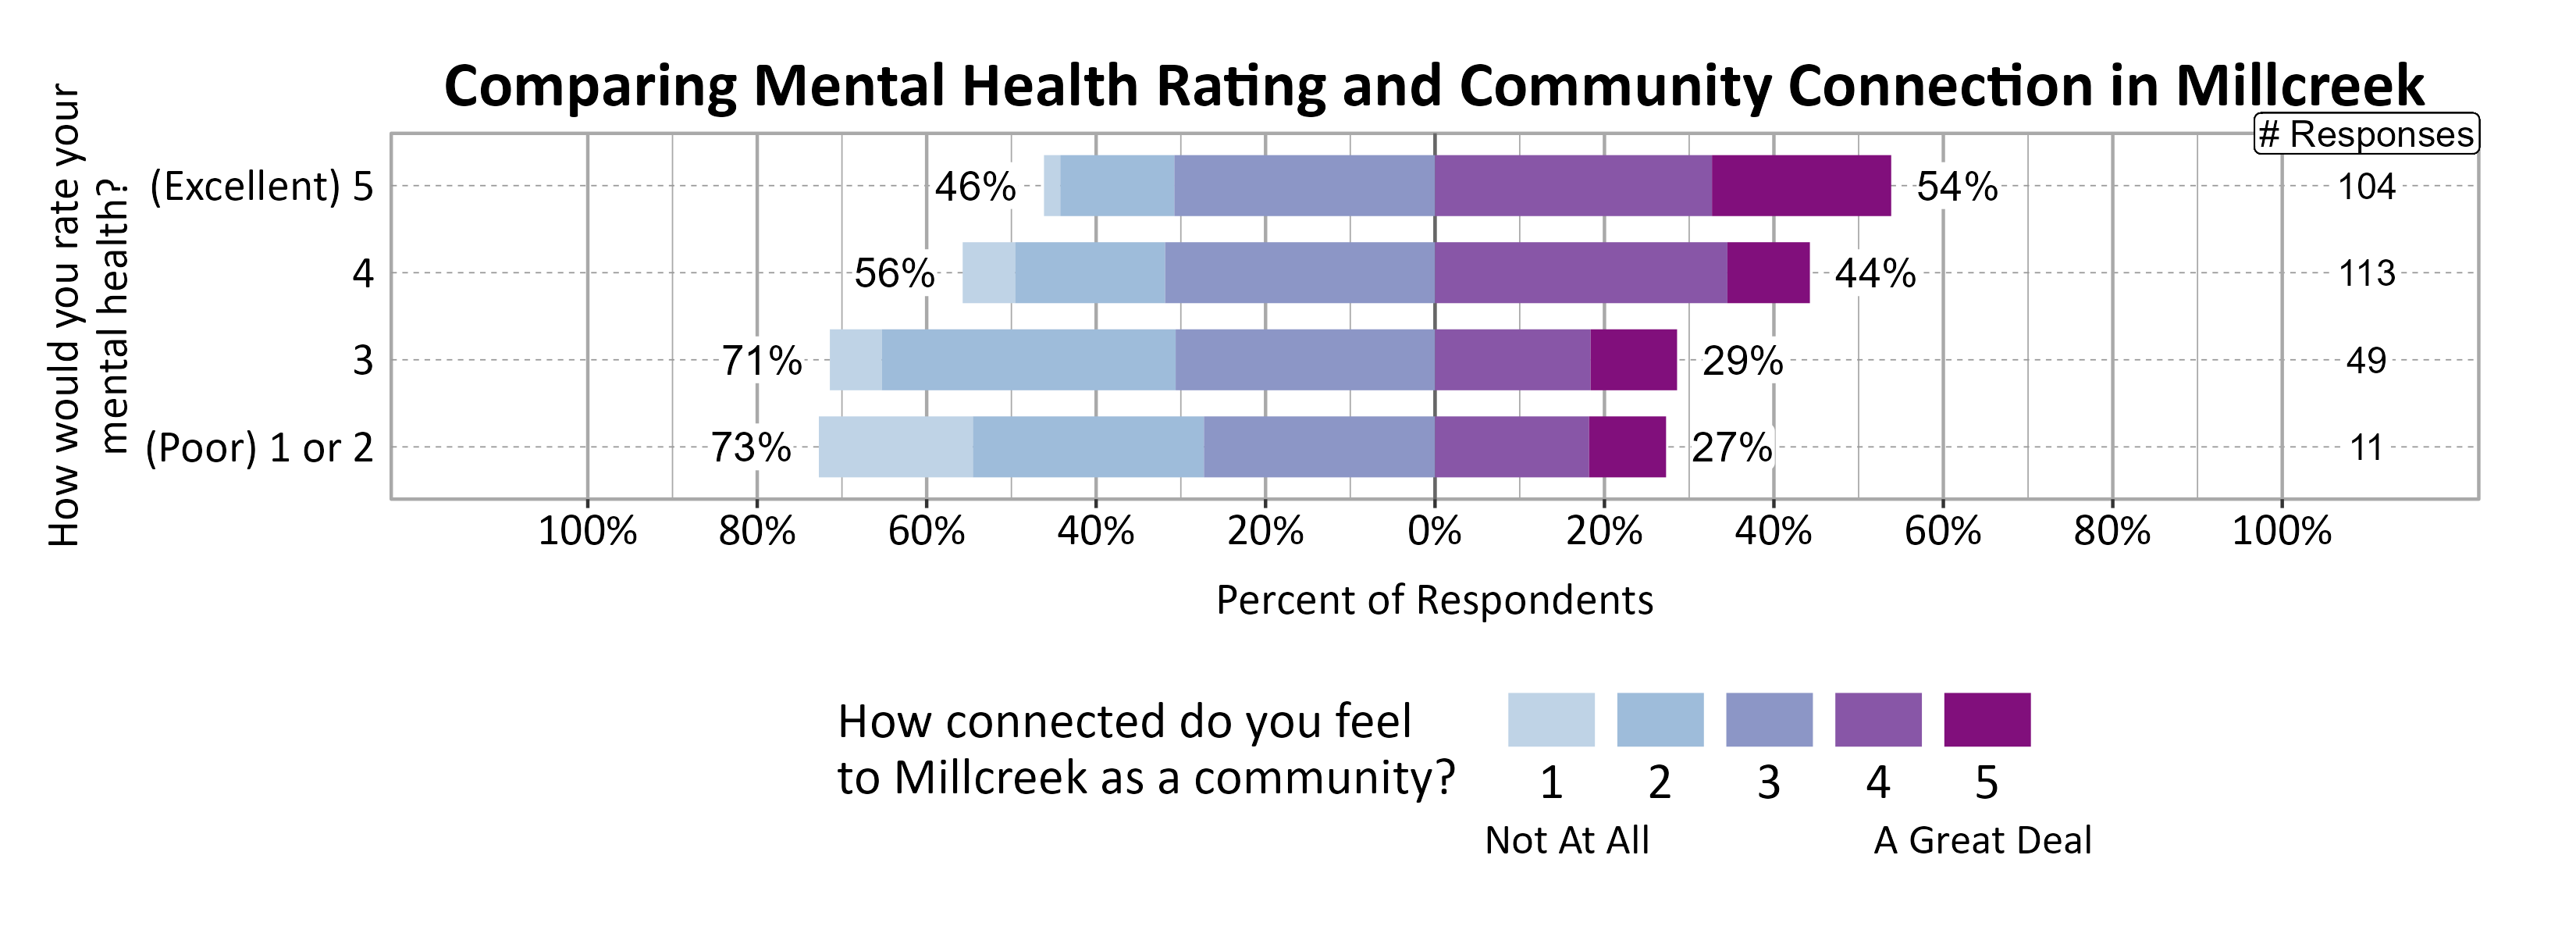
Survey participants were asked about how connected they feel to Millcreek on a 5-point scale from not at all (1) to a great deal (5), and the average score of all respondents was 3.27. There was no significant difference in the community connection scores across ZIP codes in Millcreek.
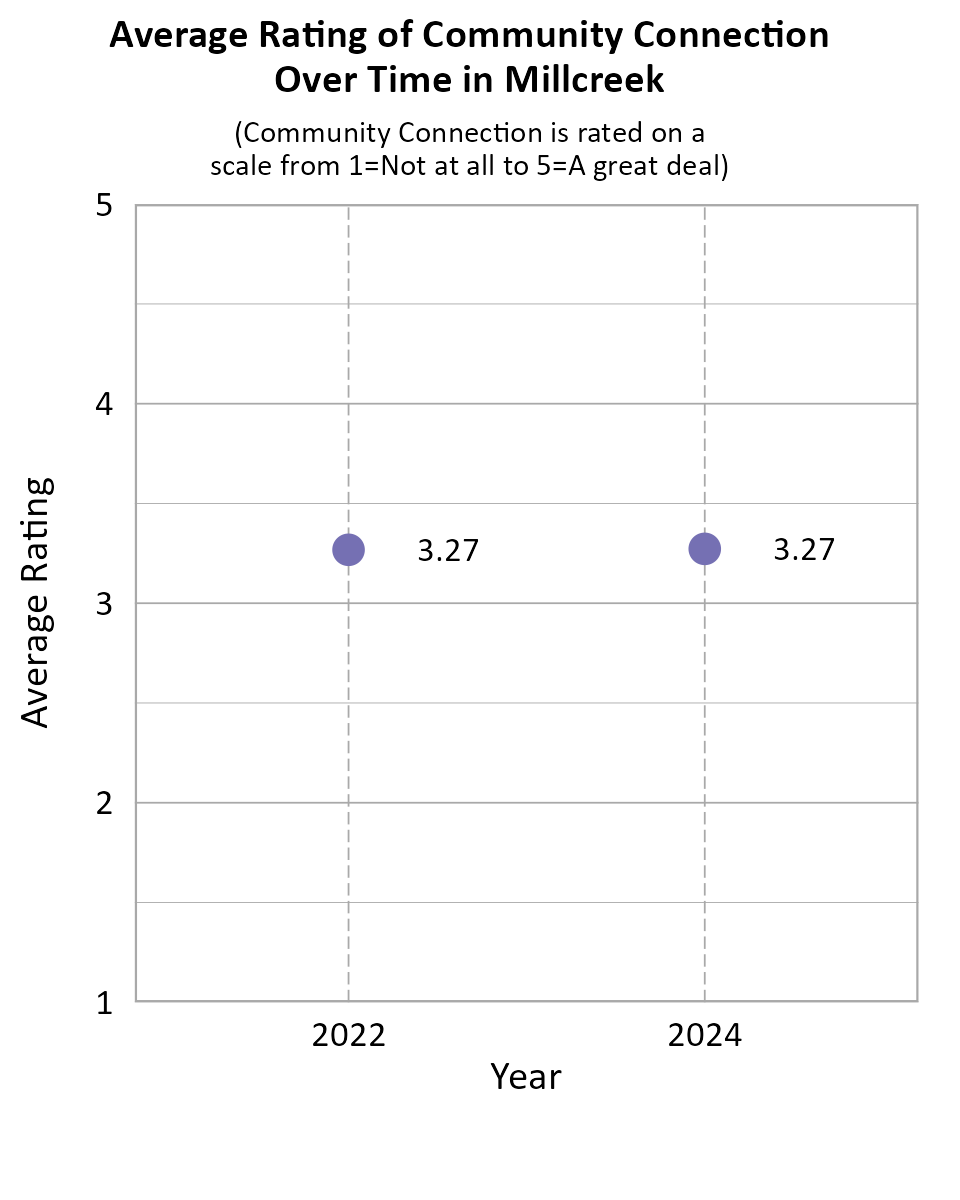
When comparing survey data from Millcreek over the years as shown in the information below, we can see that the average community connection score remained nearly the same between 2022 and 2024.
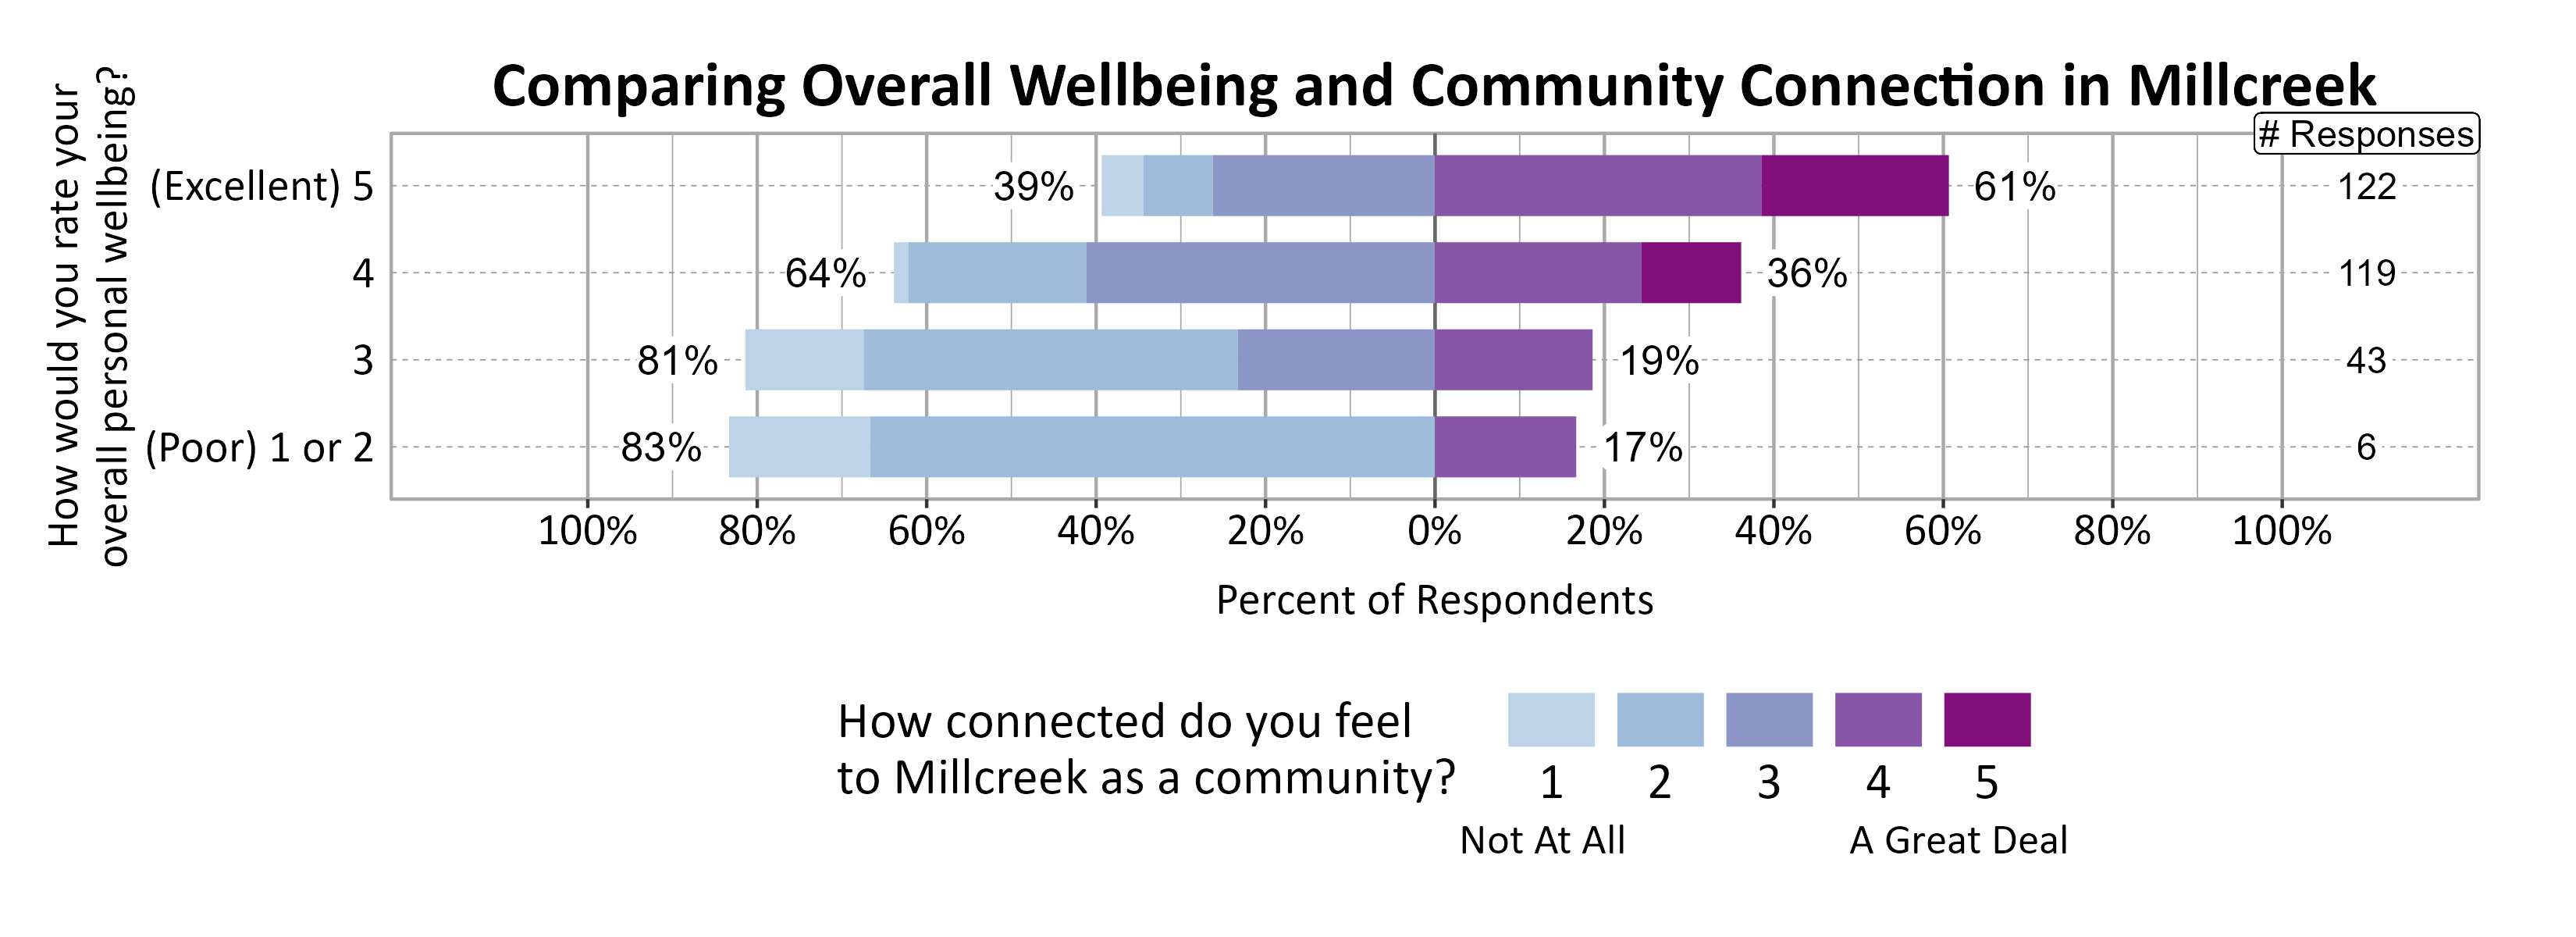
A positive relationship was found between individuals’ community connection and overall personal wellbeing as well as mental health.
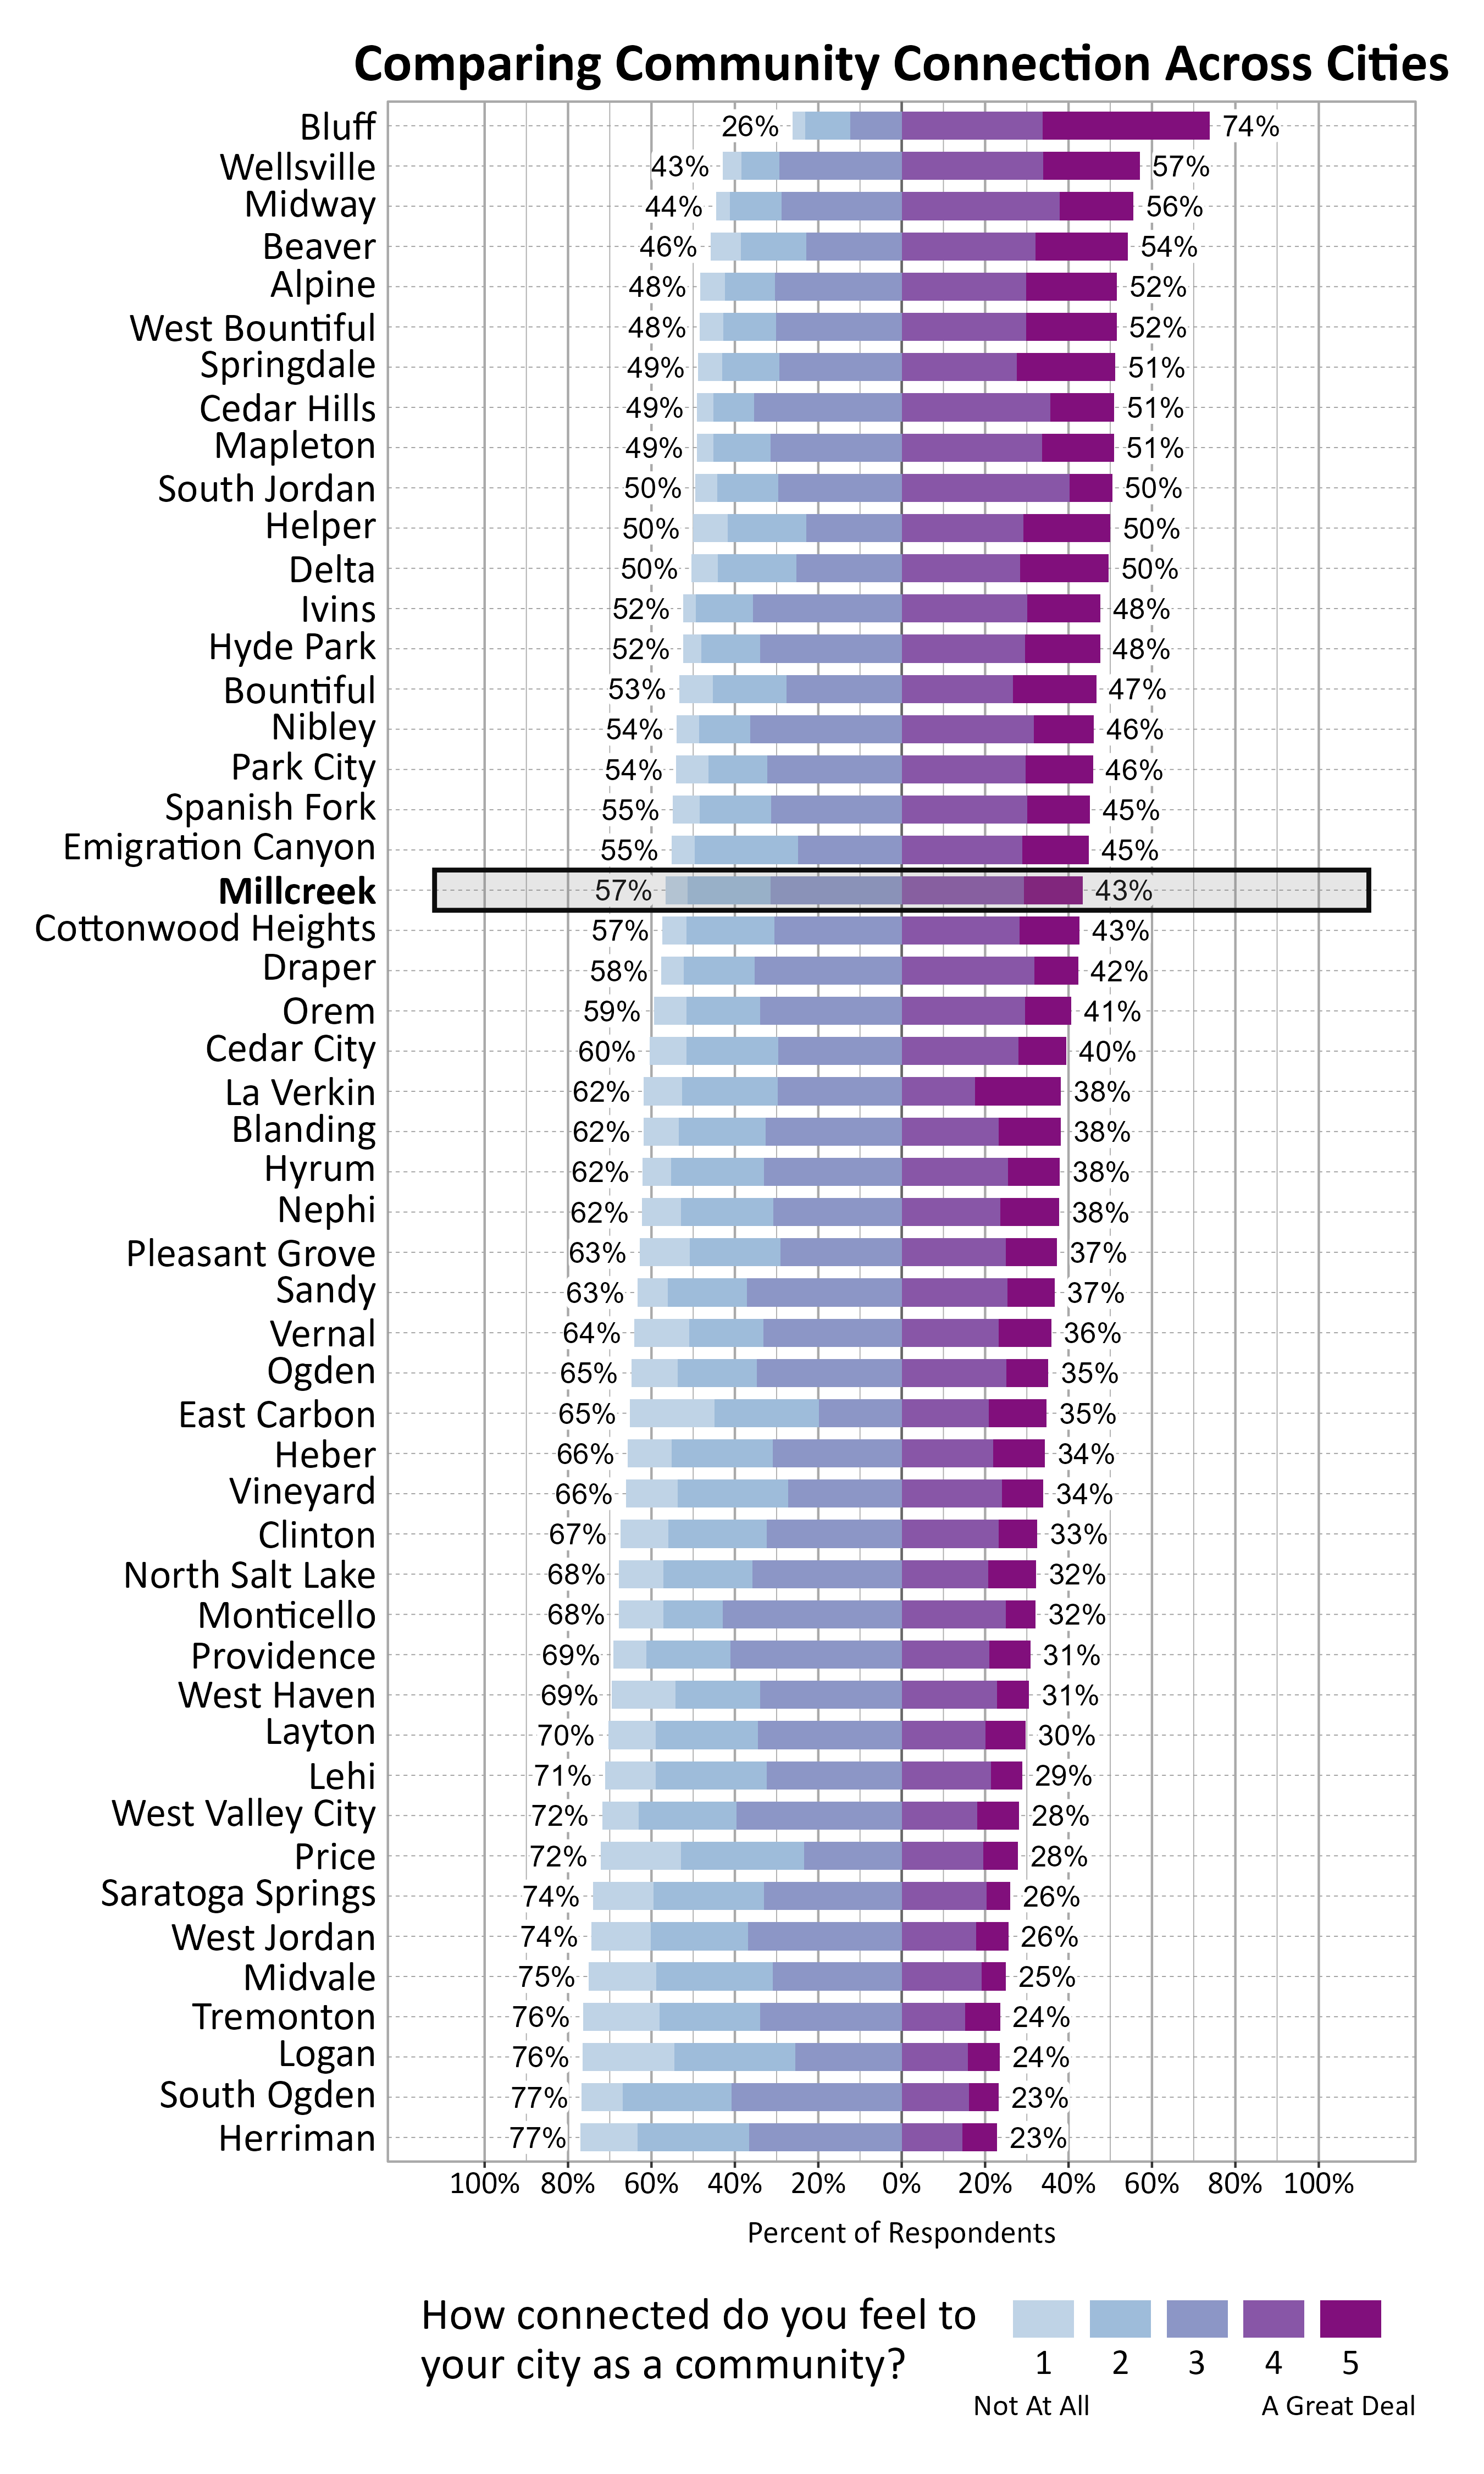
The graph below shows how Wellbeing Project cities and towns compare on feelings of community connection based on the percentage of respondents who answered 4 or a 5 on a 5-point scale from “not at all” to “a great deal” connected to their city or town. Millcreek ranked 20 out of the 51 cities that participated.
Participation in Recreation and Nature-Related Activities
Respondents were asked to indicate whether or not they participated in various activities in the last 12 months. The most popular activities were walking or biking in your neighborhood or city (94%), gardening at home (89%), and recreating in parks in your city (85%).
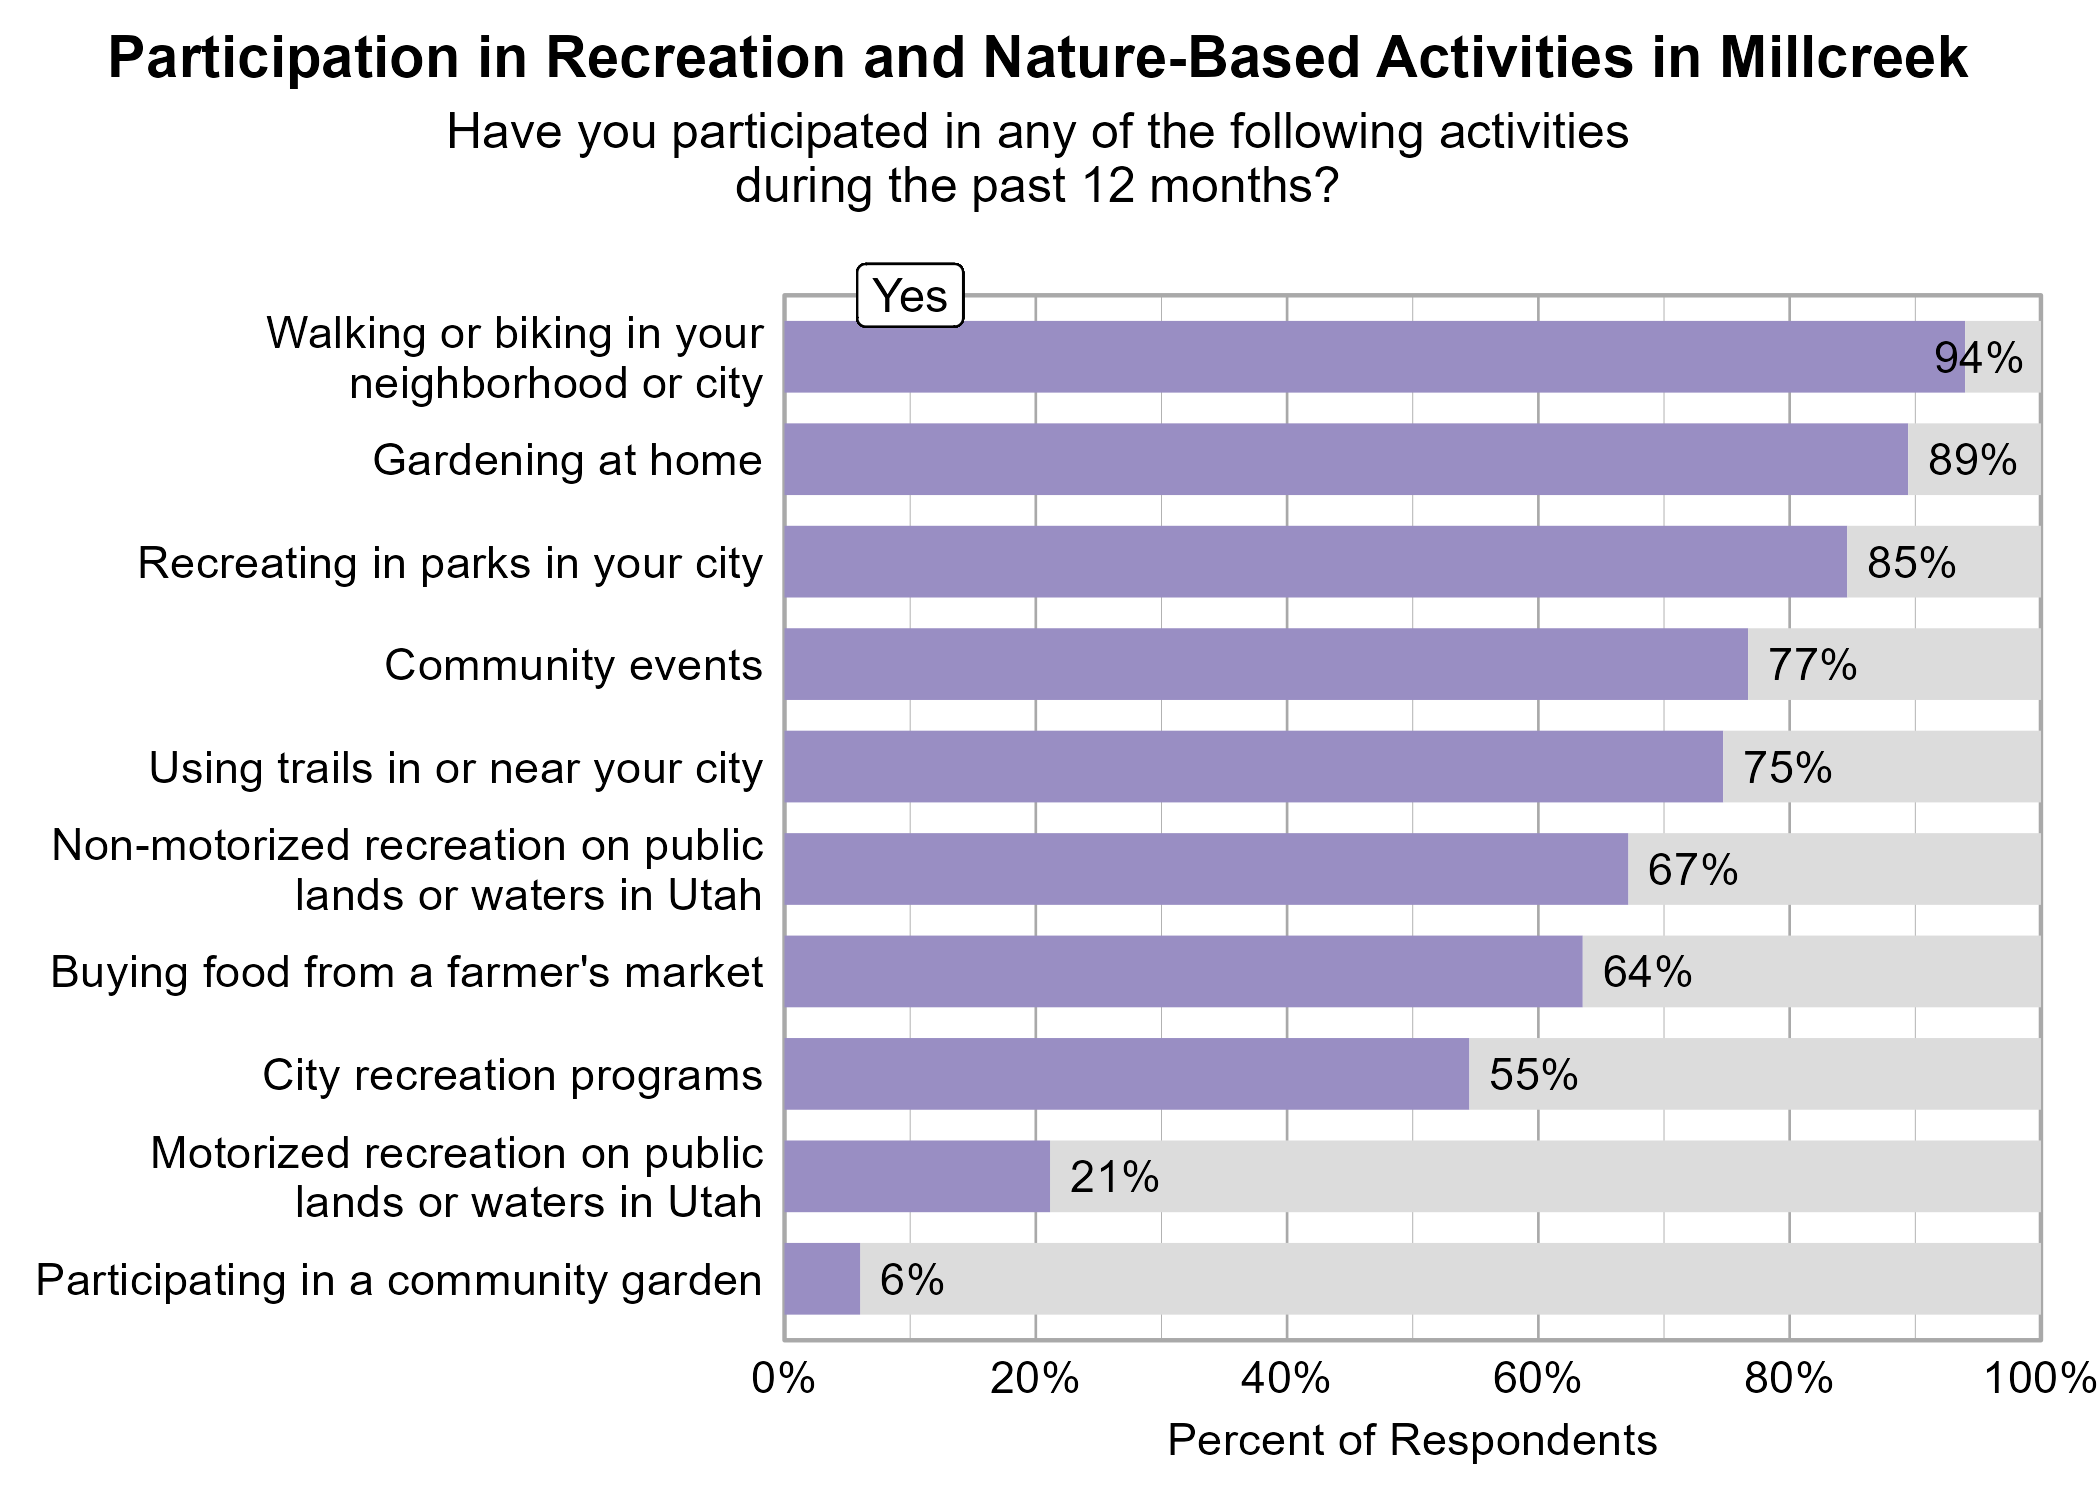
Participating in community events and non-motorized recreation on public lands or waters in Utah were significantly related to higher ratings of personal wellbeing.
Recreating in parks in your city was significantly related to higher ratings of community wellbeing.
Participating in city recreation programs, participating in community events, non-motorized recreation on public lands or waters in Utah, recreating in parks in your city, and using trails in or near your city were significantly related to higher ratings of community connection.
Perspectives on Population Growth and Economic Development
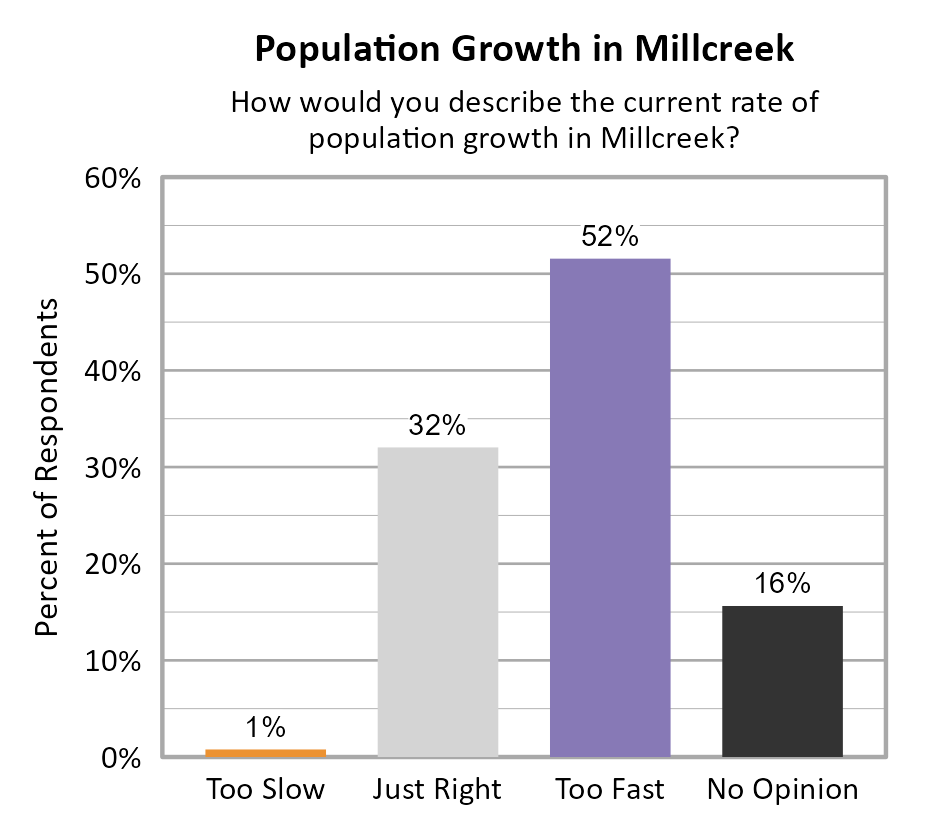
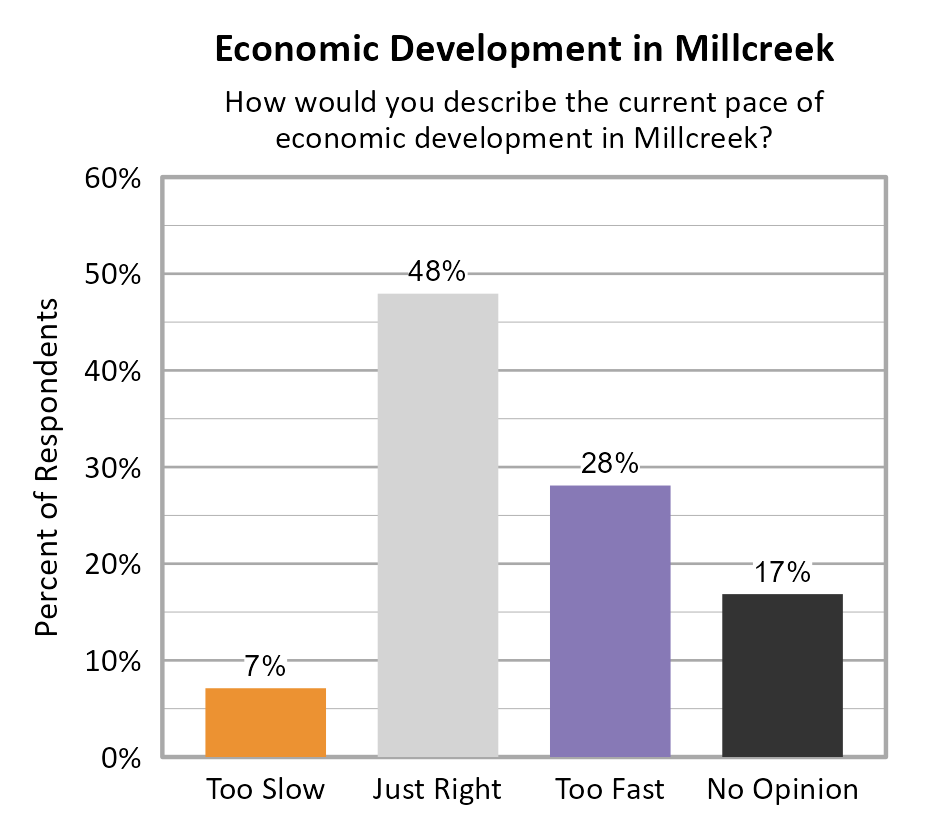
The majority of respondents in Millcreek indicated that they felt the population growth was too fast (52%). For the pace of economic development, the largest proportion of respondents indicated that it was just right (48%).
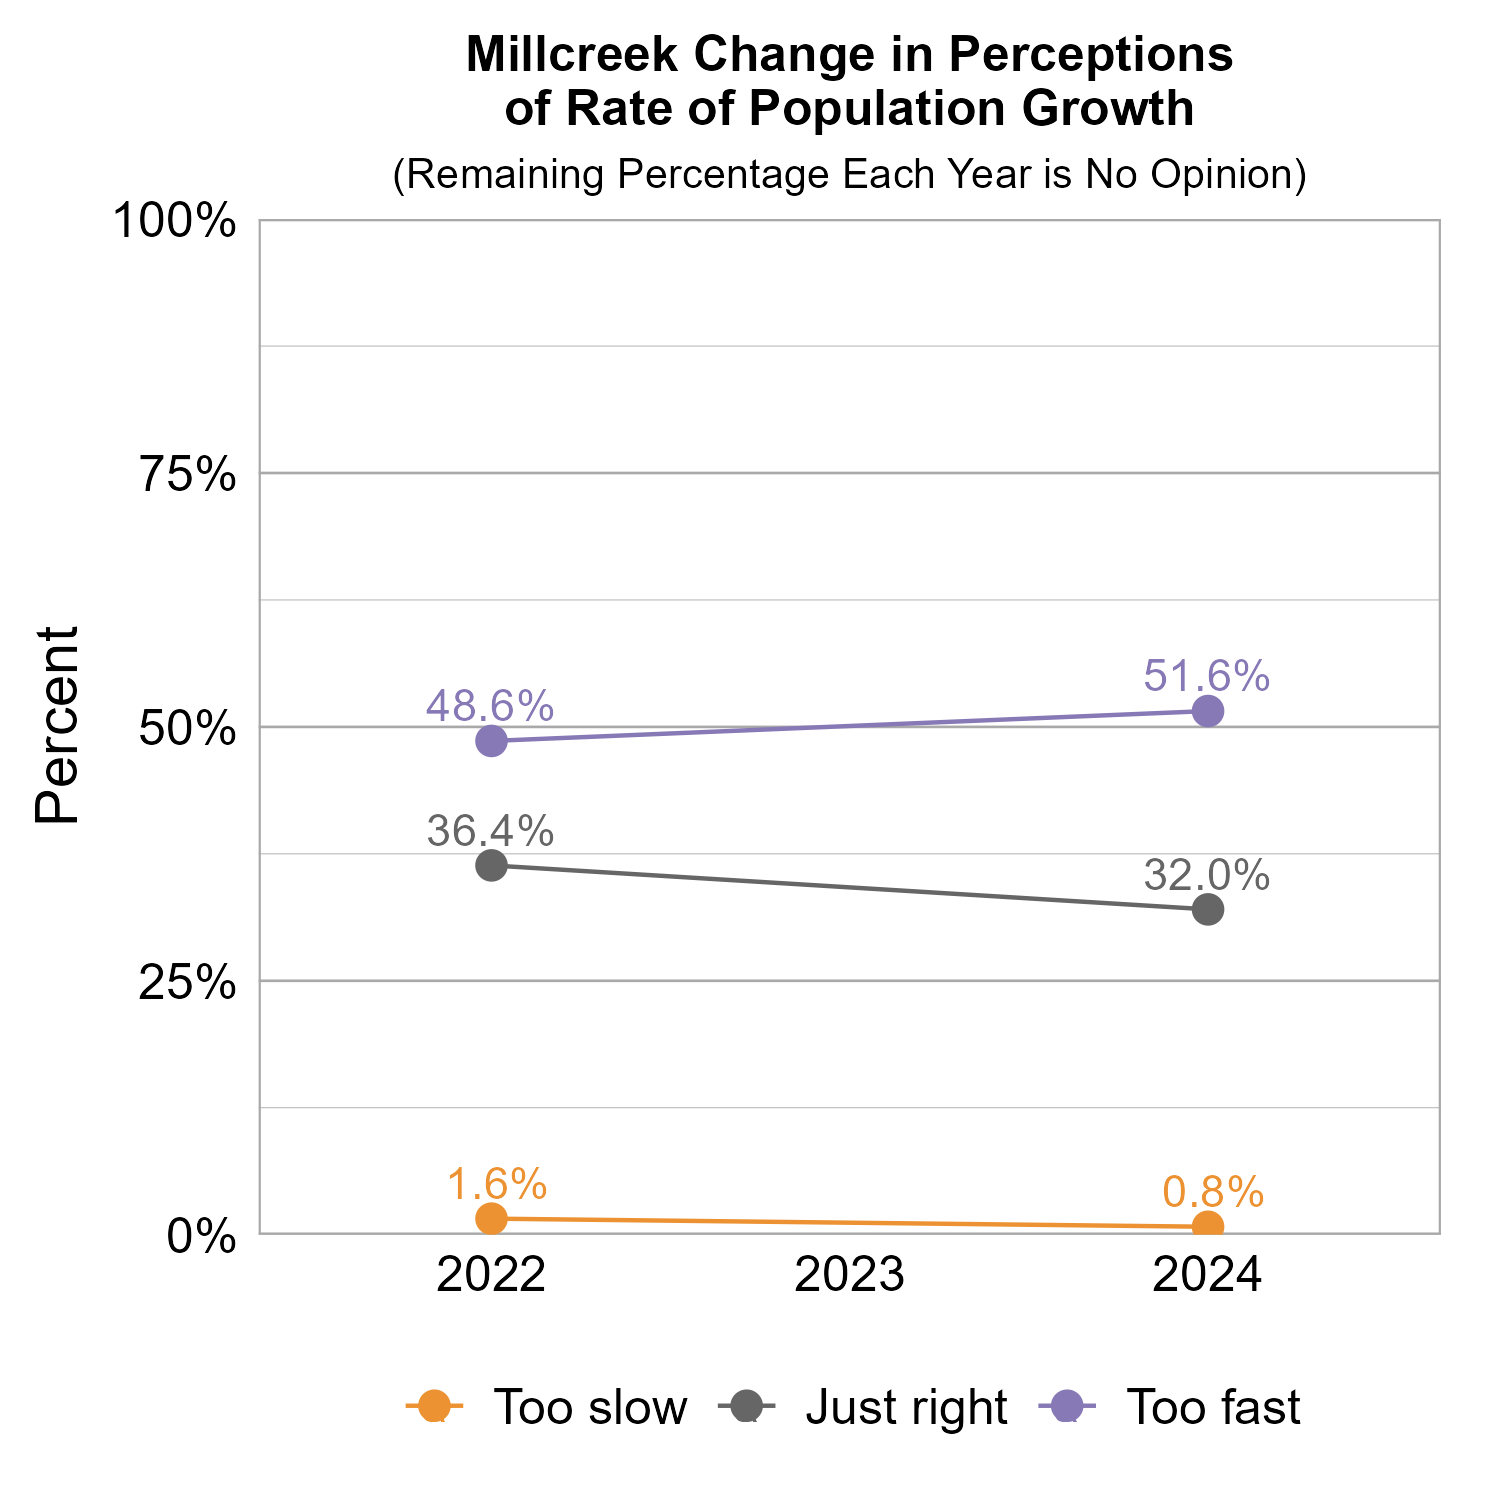
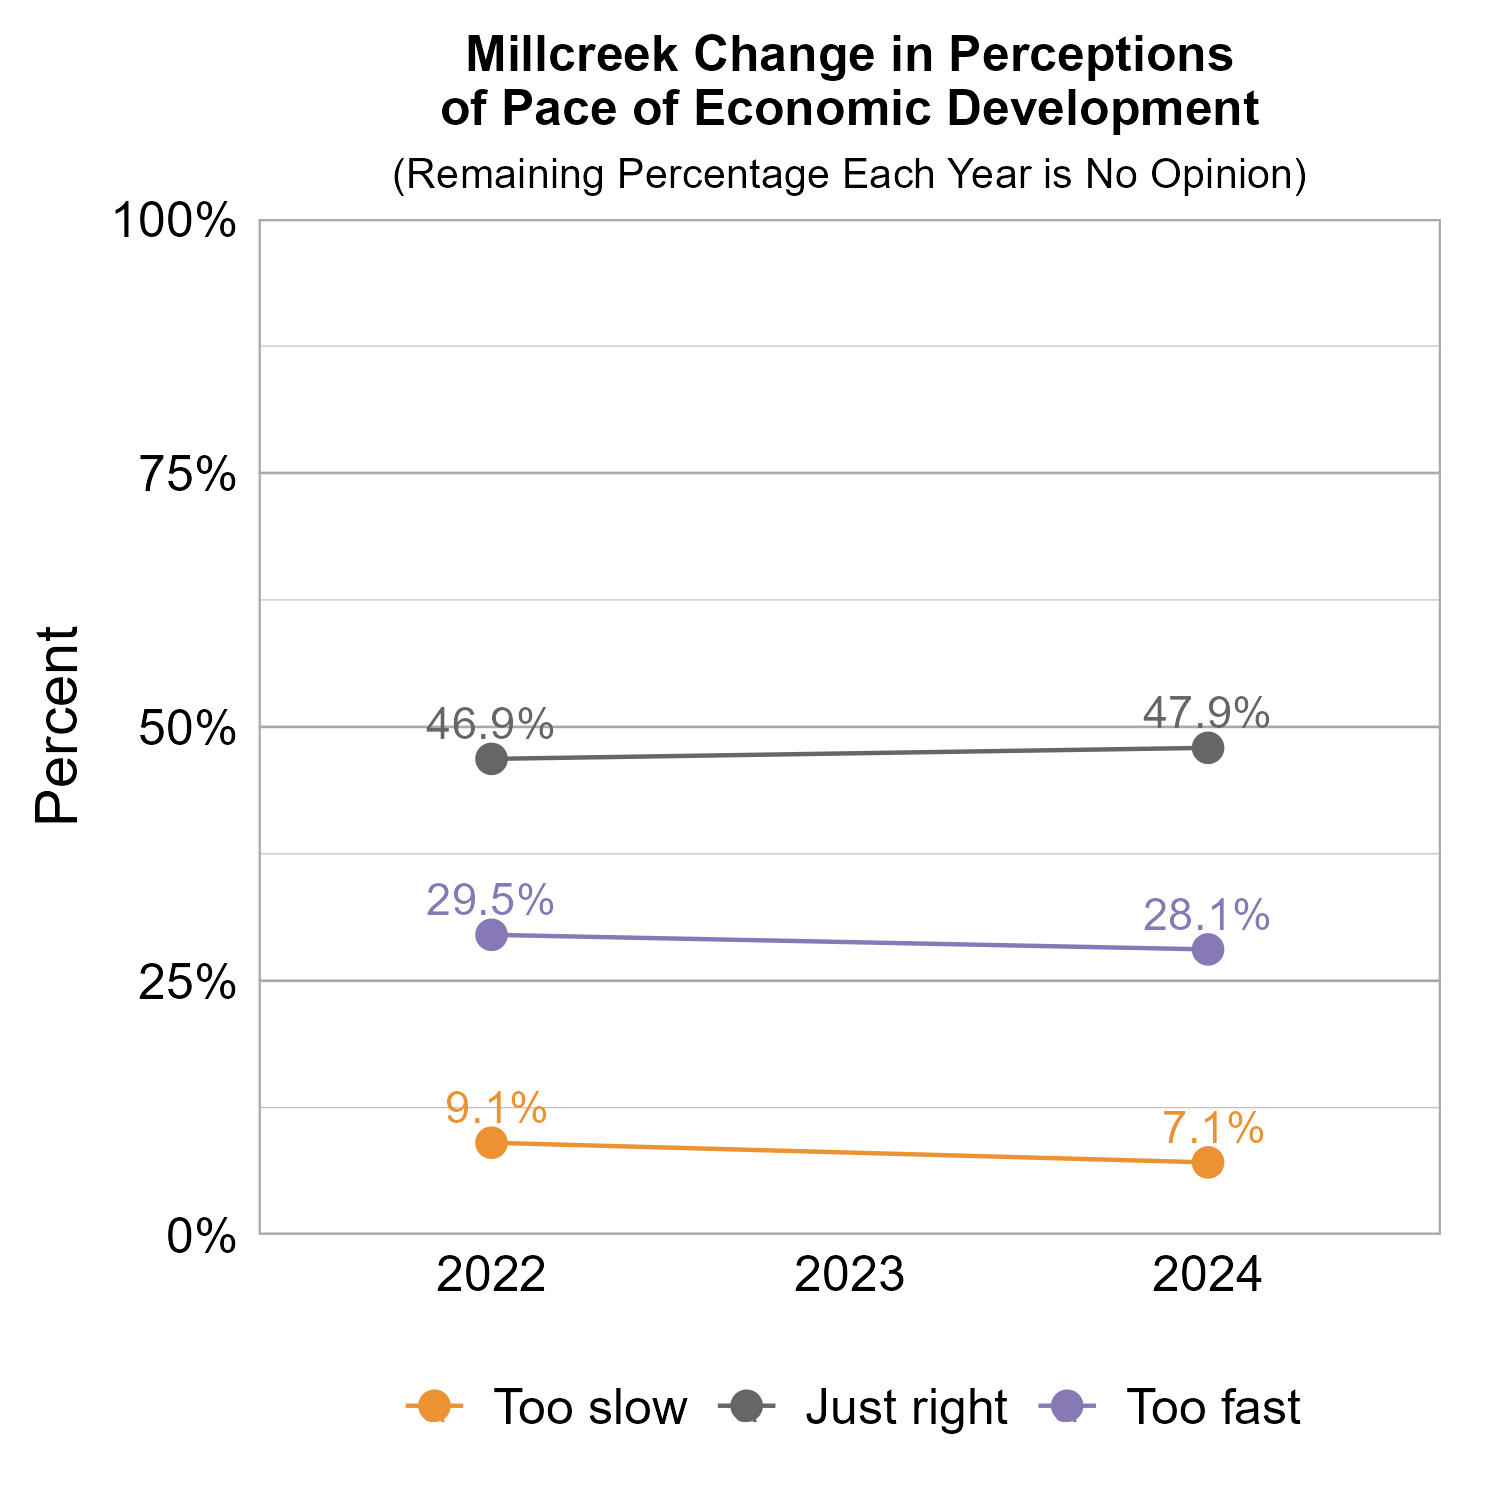
The graphs below show how perceptions of population growth and economic development in Millcreek have varied across recent years of Wellbeing Surveys. Perceptions for both the rate of population growth and the pace of economic development stayed fairly consistent from 2022 to 2024.
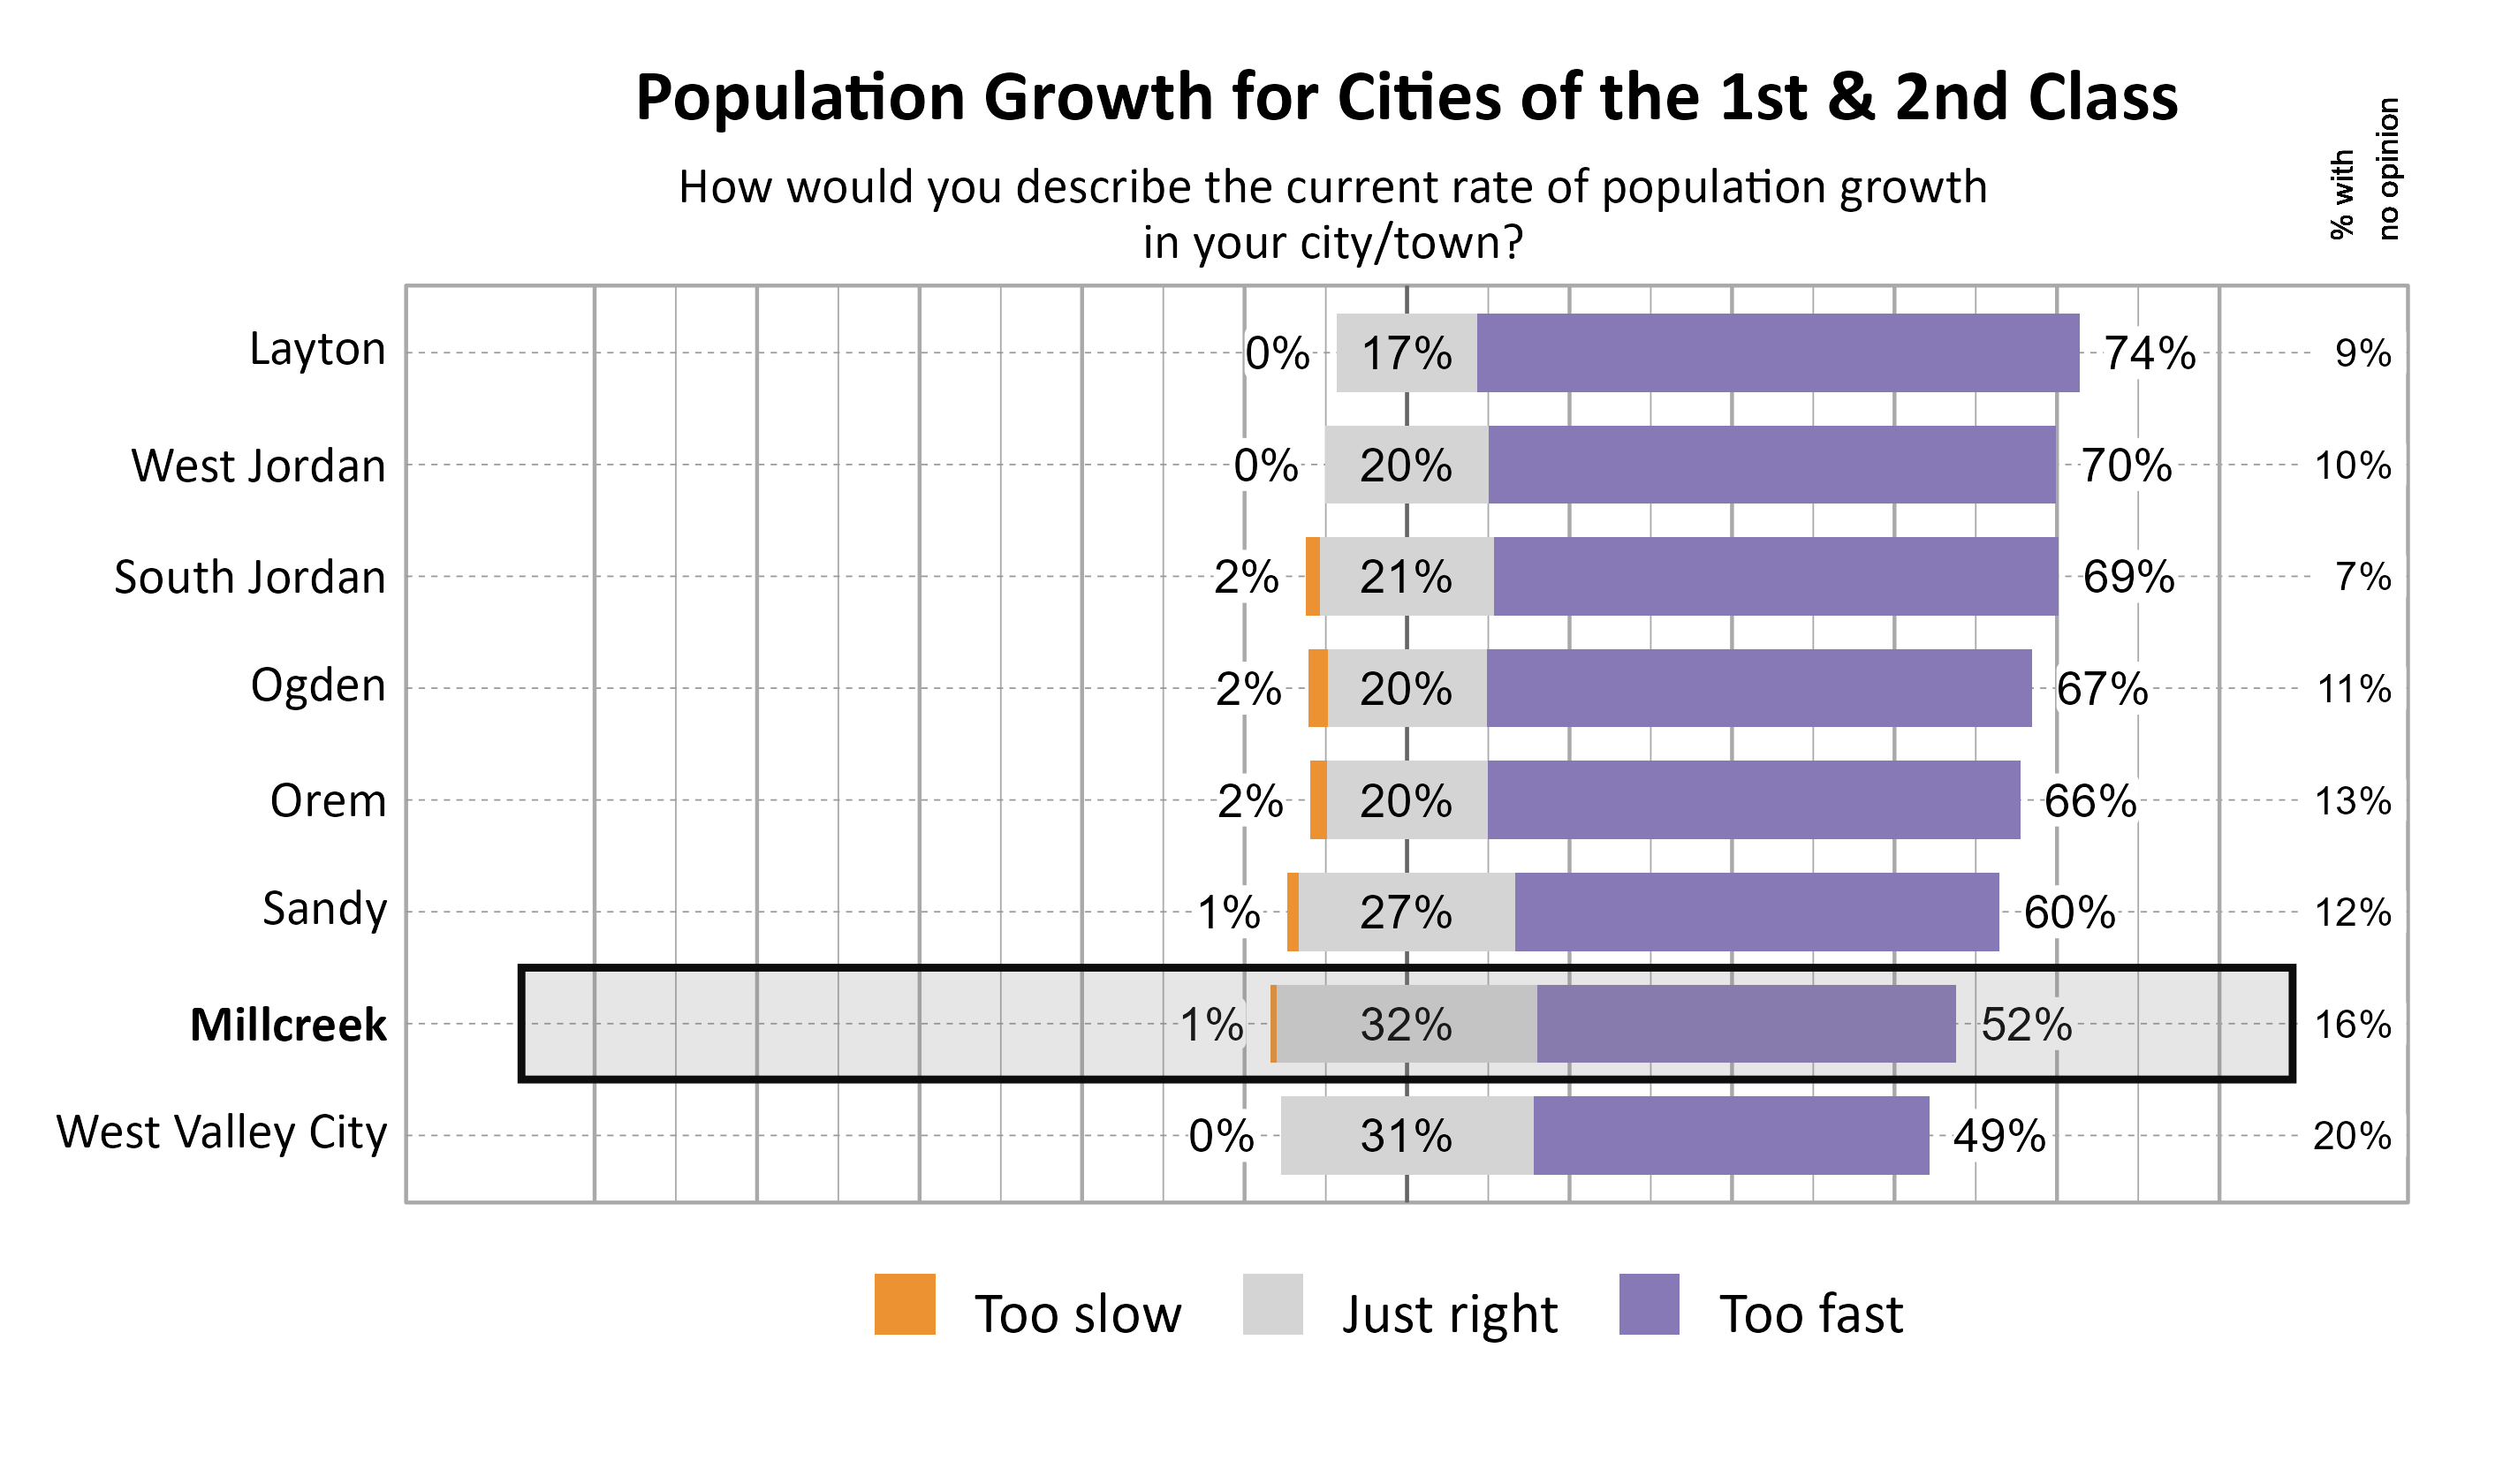
The graphs below show perceptions of population growth and economic development for Millcreek compared to other participating cities and towns in the Cities of the 1st & 2nd Class cluster.
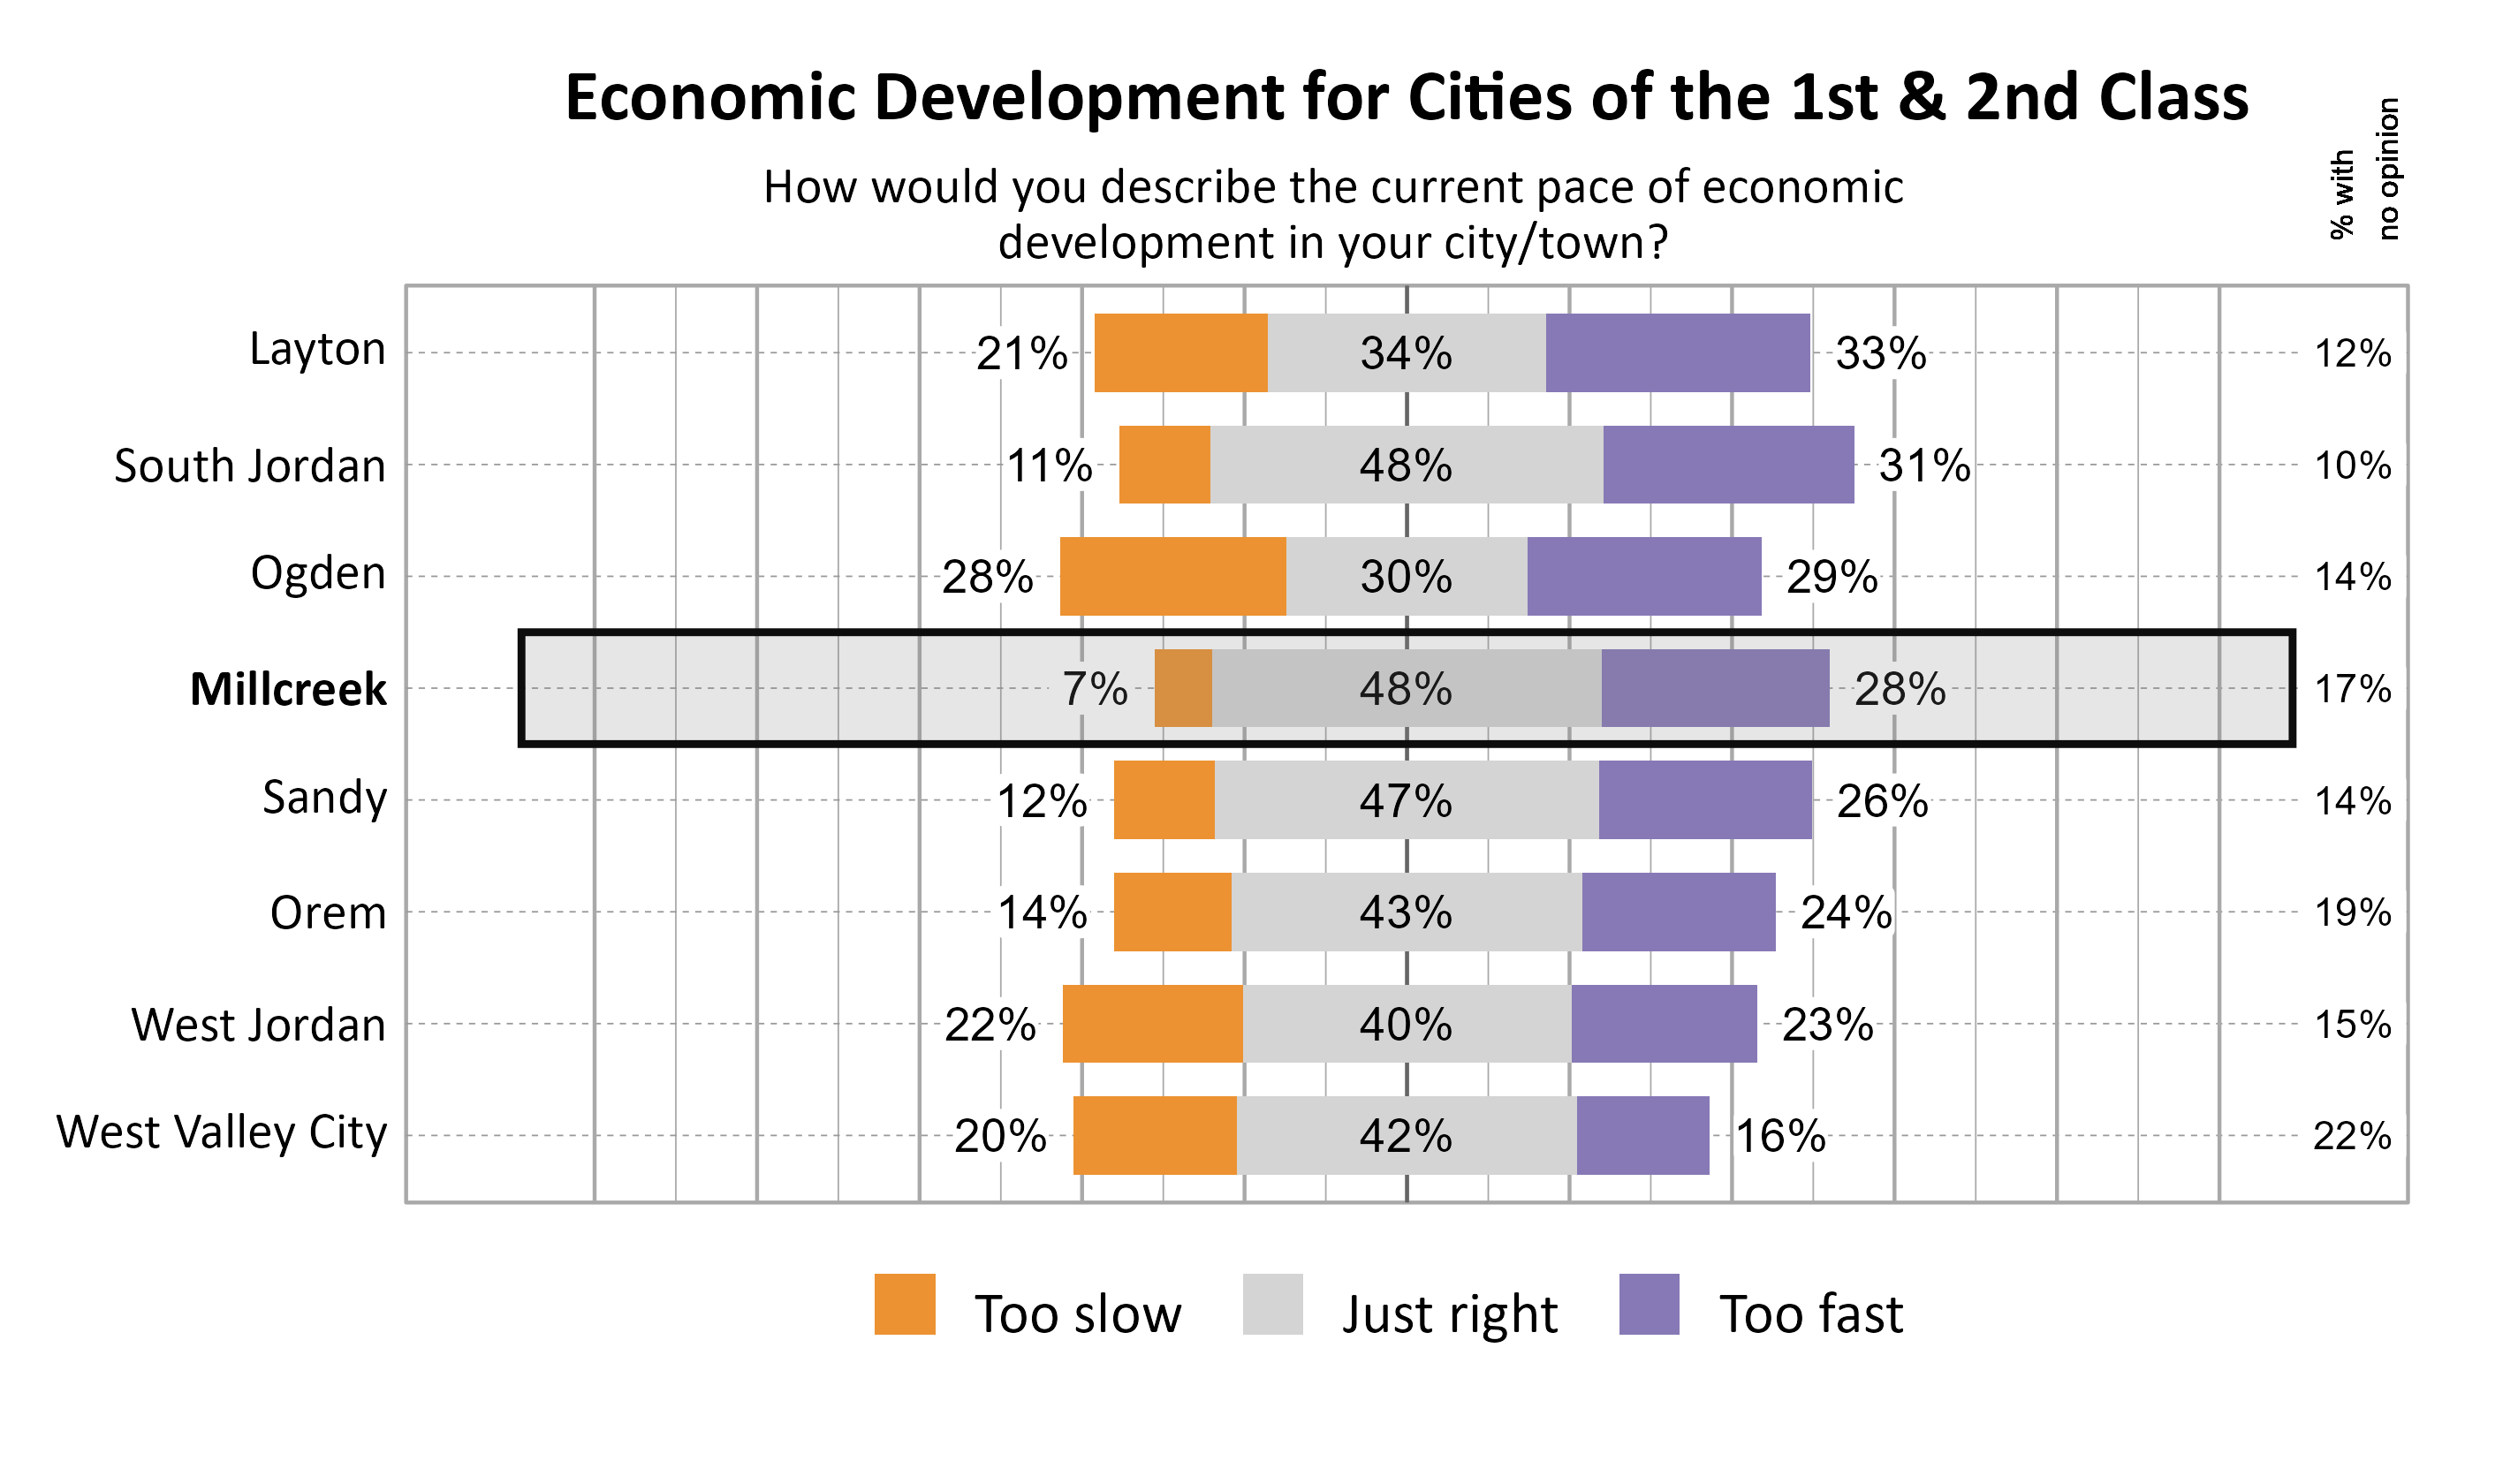
The graph below illustrates how many respondents perceived the pace of economic development as too slow, just right, too fast, or had no opinion, with additional breakdowns for the number of respondents who provided comments.
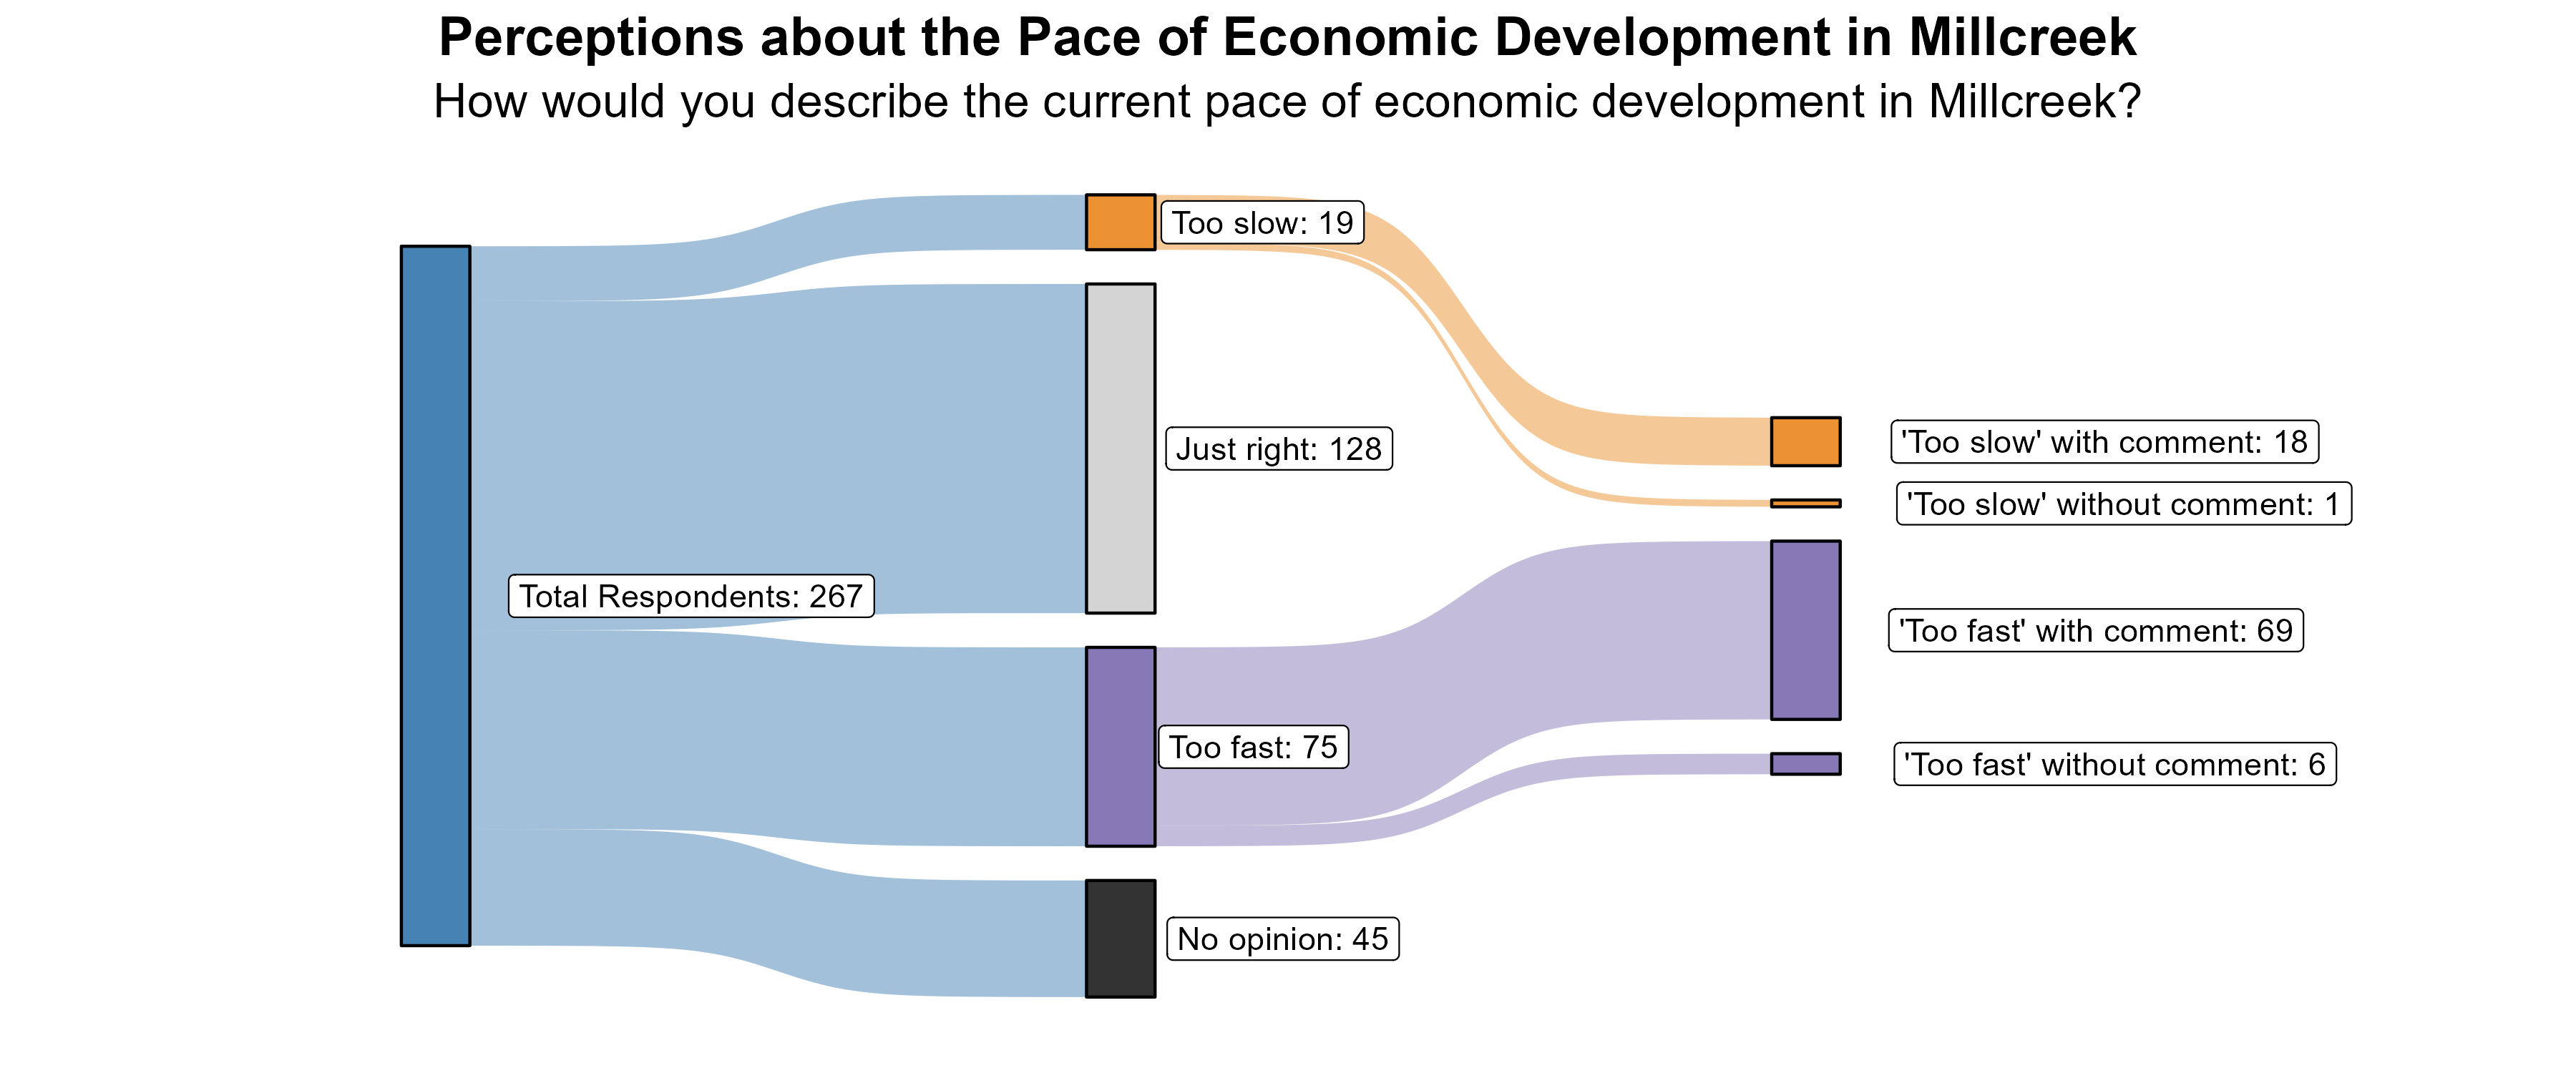
The 7% of respondents who rated the pace of economic growth as “too slow” were further asked what aspects of the local economy they would like to see more of in Millcreek. Many respondents mentioned they would like to see more restaurants and shopping options. There were also multiple comments about vacant business and rundown strip malls that could be revitalized.
Additionally, the 28% of respondents who rated the pace of economic growth as “too fast” were further asked what aspects of the local economy they feel are growing too quickly in Millcreek. The main theme focused on apartment complexes and high density housing. Respondents indicated they would like to see improved roads and other infrastructure. There was some concern over loss of open space and use of resources. There were also some mixed feelings about the city center development and whether that is a good thing or not.
Transportation in Millcreek
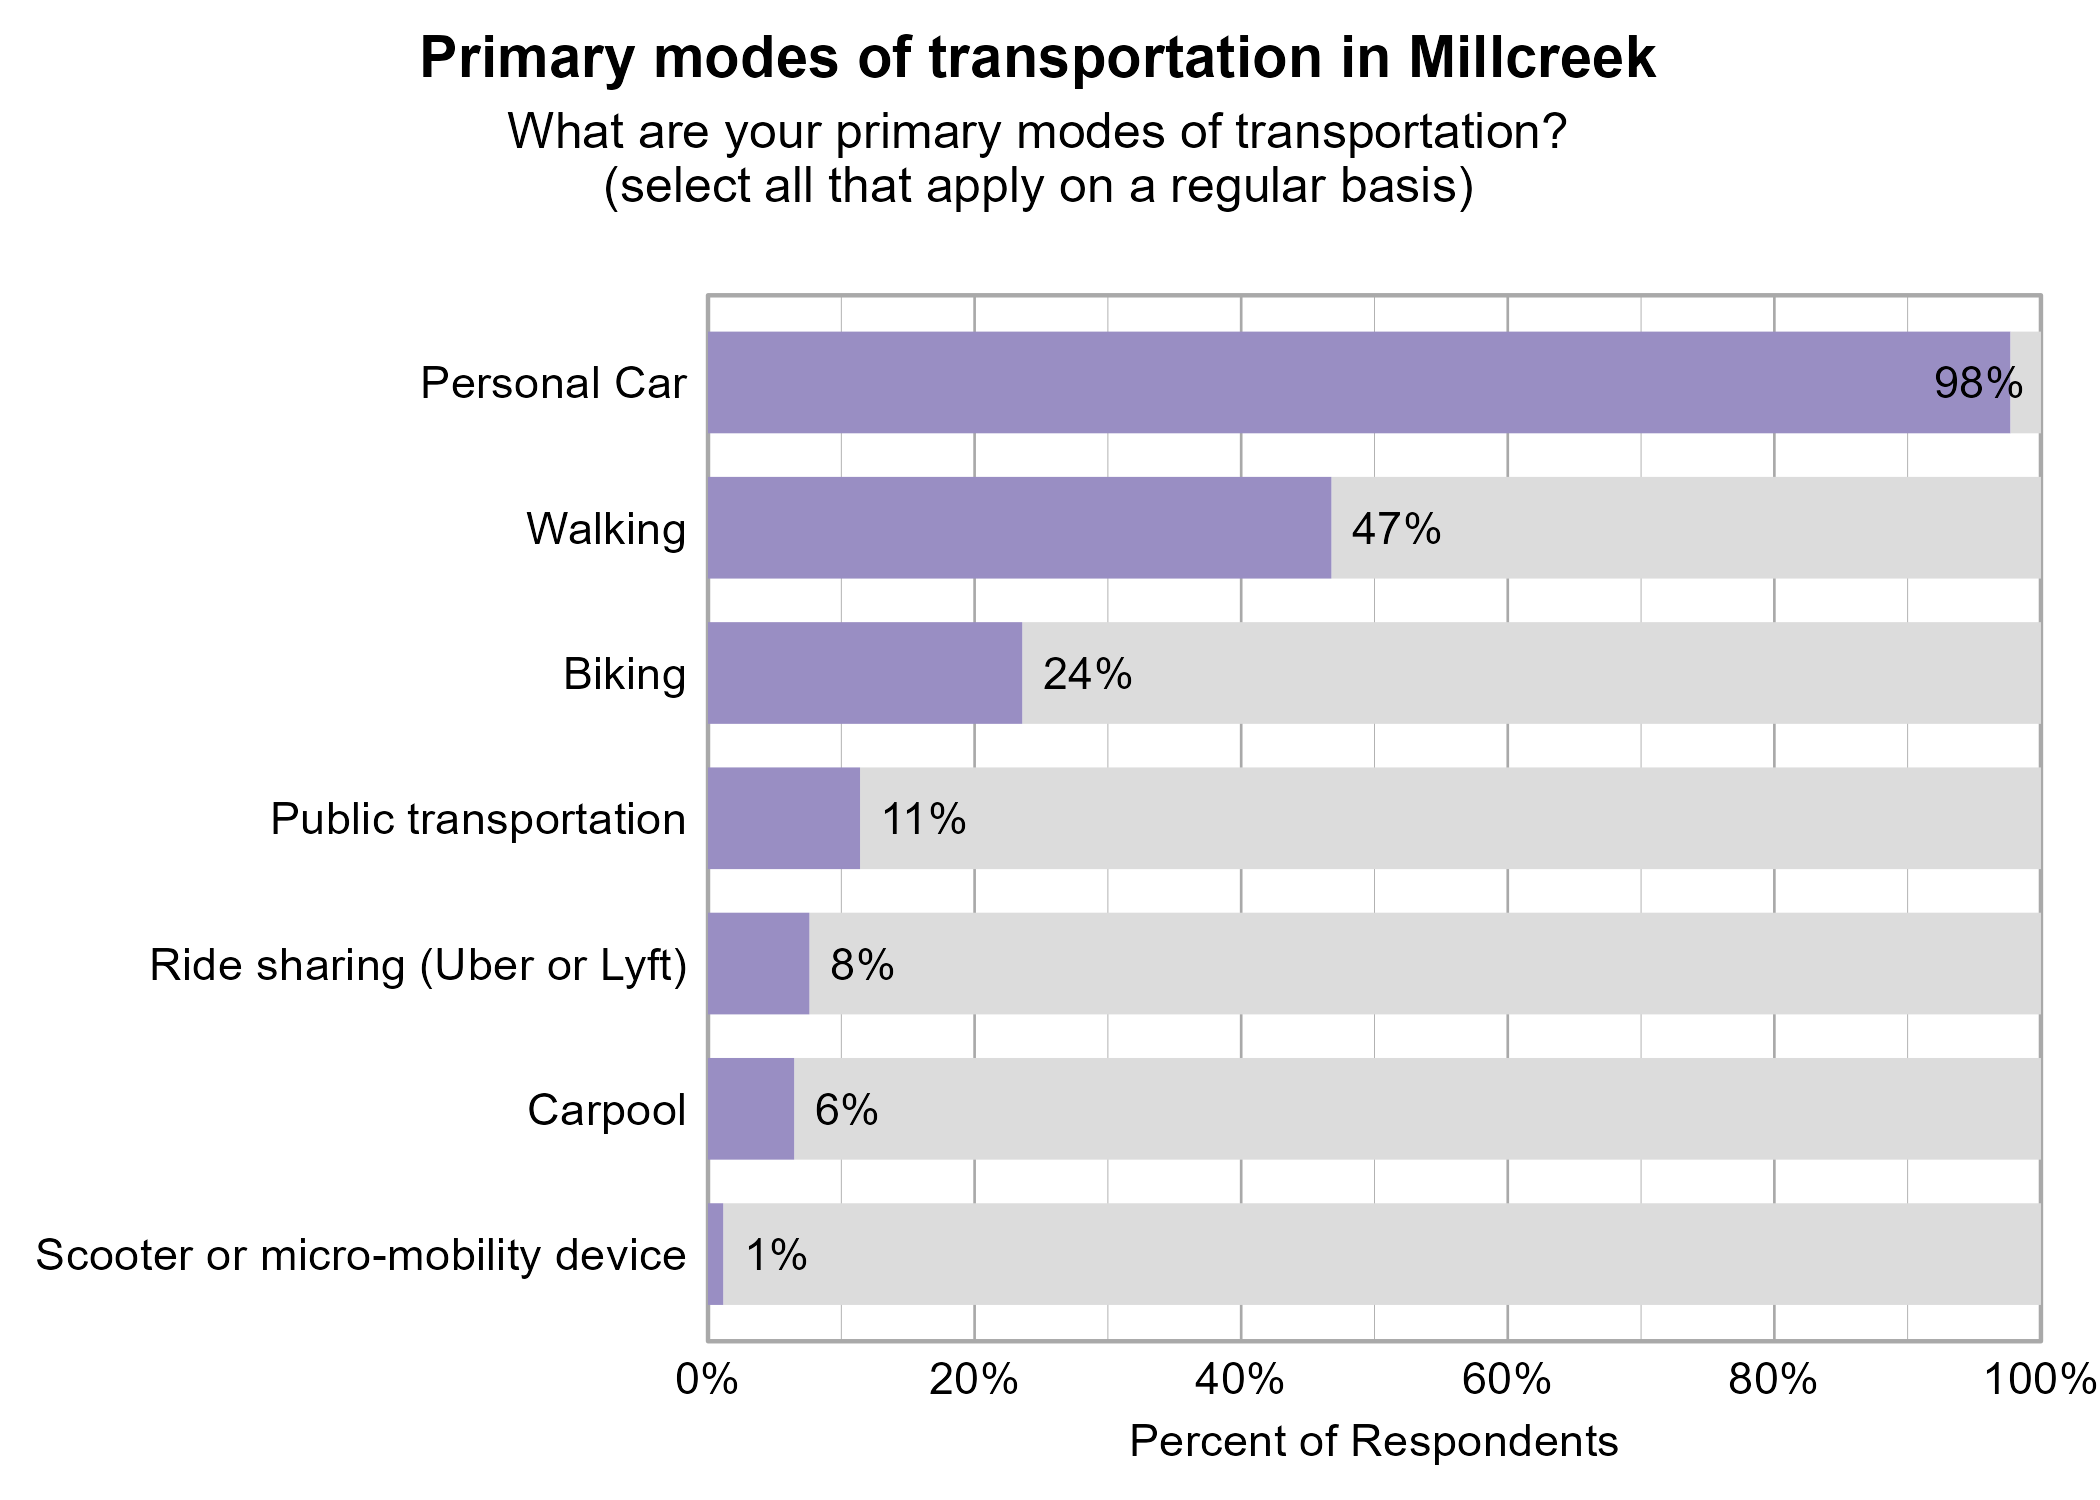
Respondents were asked to indicate all of their primary modes of transportation on a regular basis in Millcreek. The most popular modes of transportation were personal car (98%) and walking (47%).
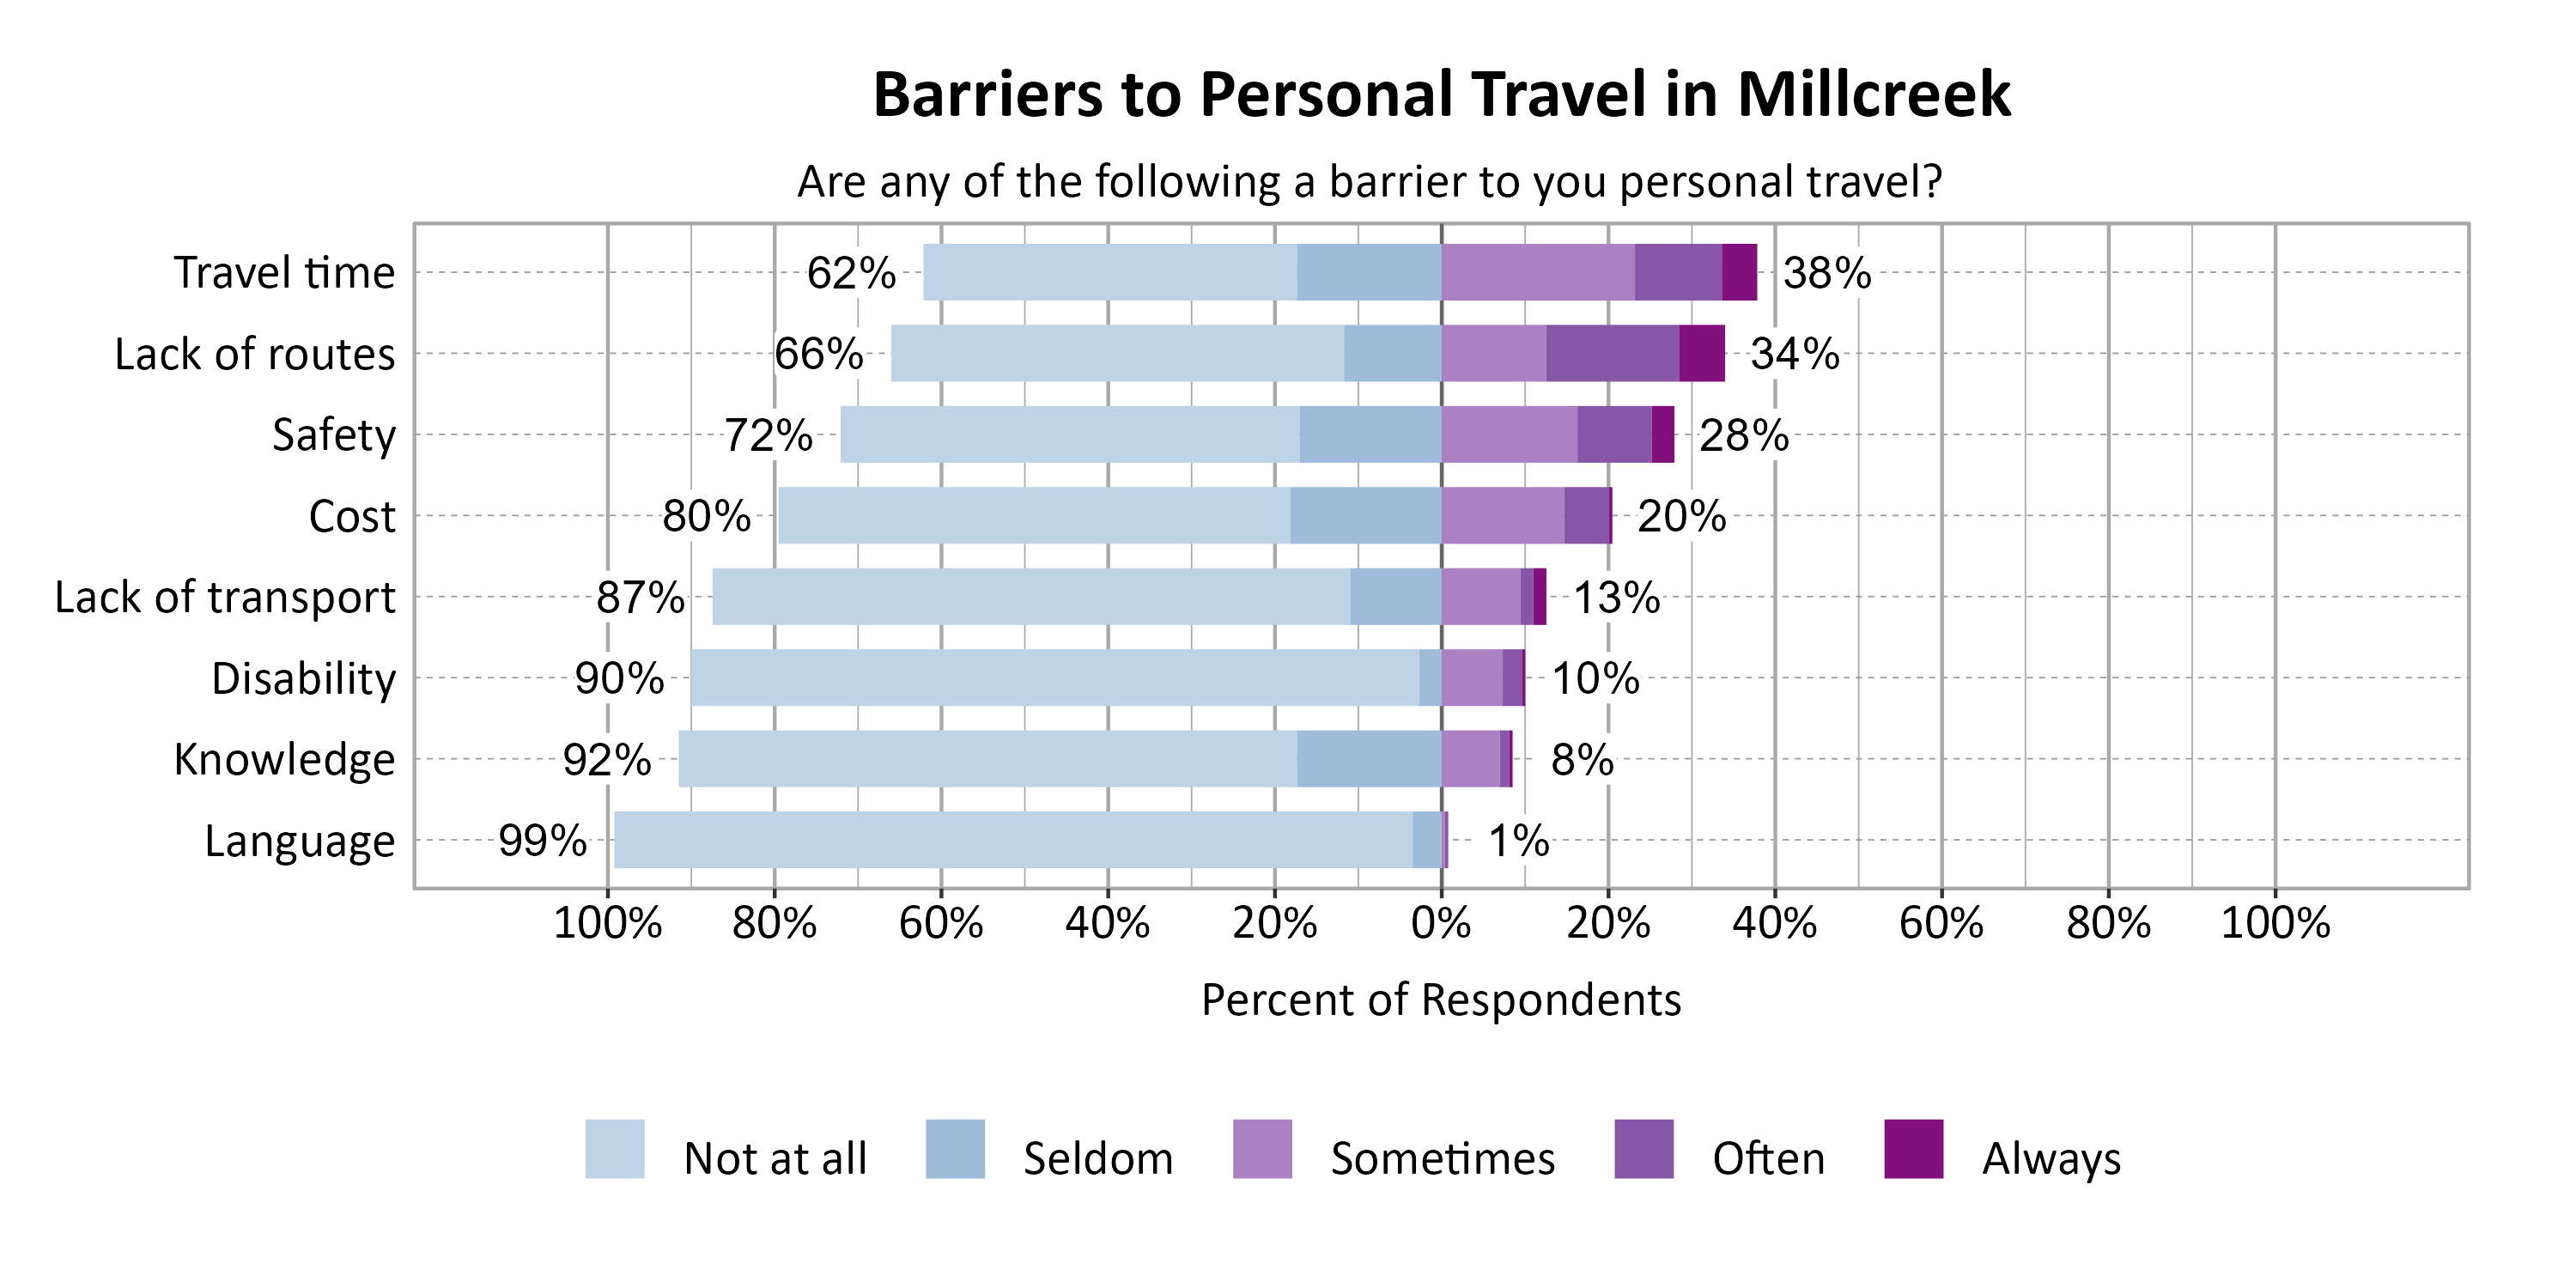
Respondents were asked to indicate the most common barriers to transportation in Millcreek. The most problematic barriers were Travel time (38%) and Lack of routes (34%).
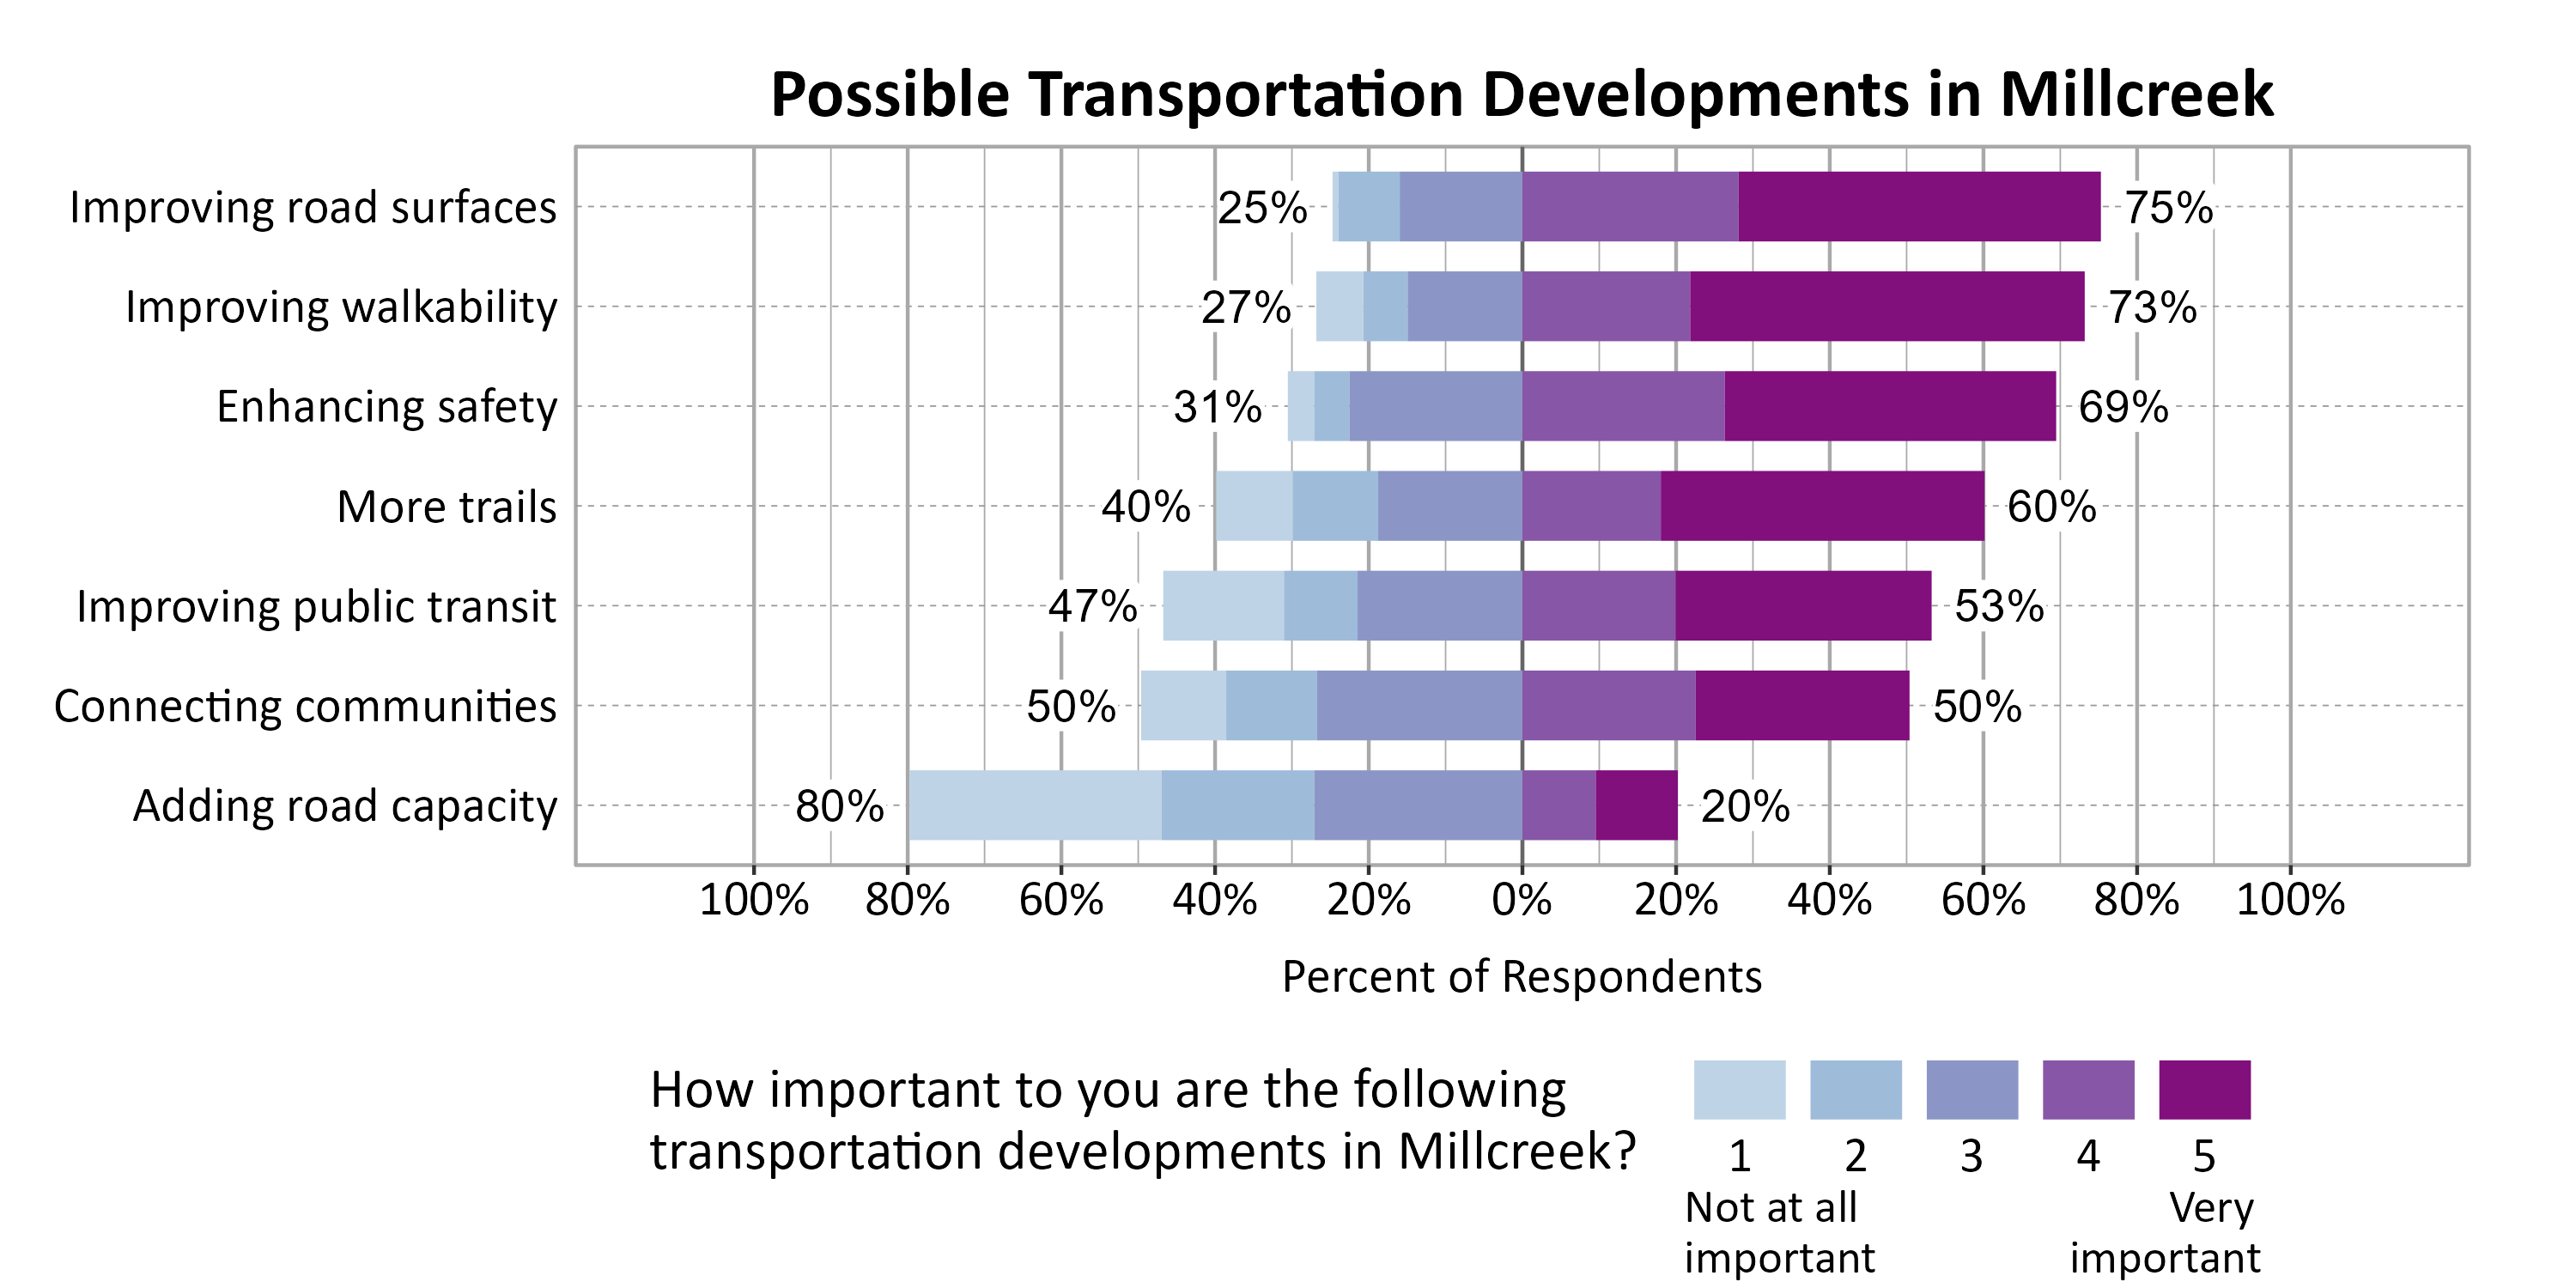
Respondents were asked to indicate the importance of a set of possible transportation developments in Millcreek. The most important development to respondents were Improving road surfaces (75%), Improving walkability (73%), and Enhancing safety (69%).
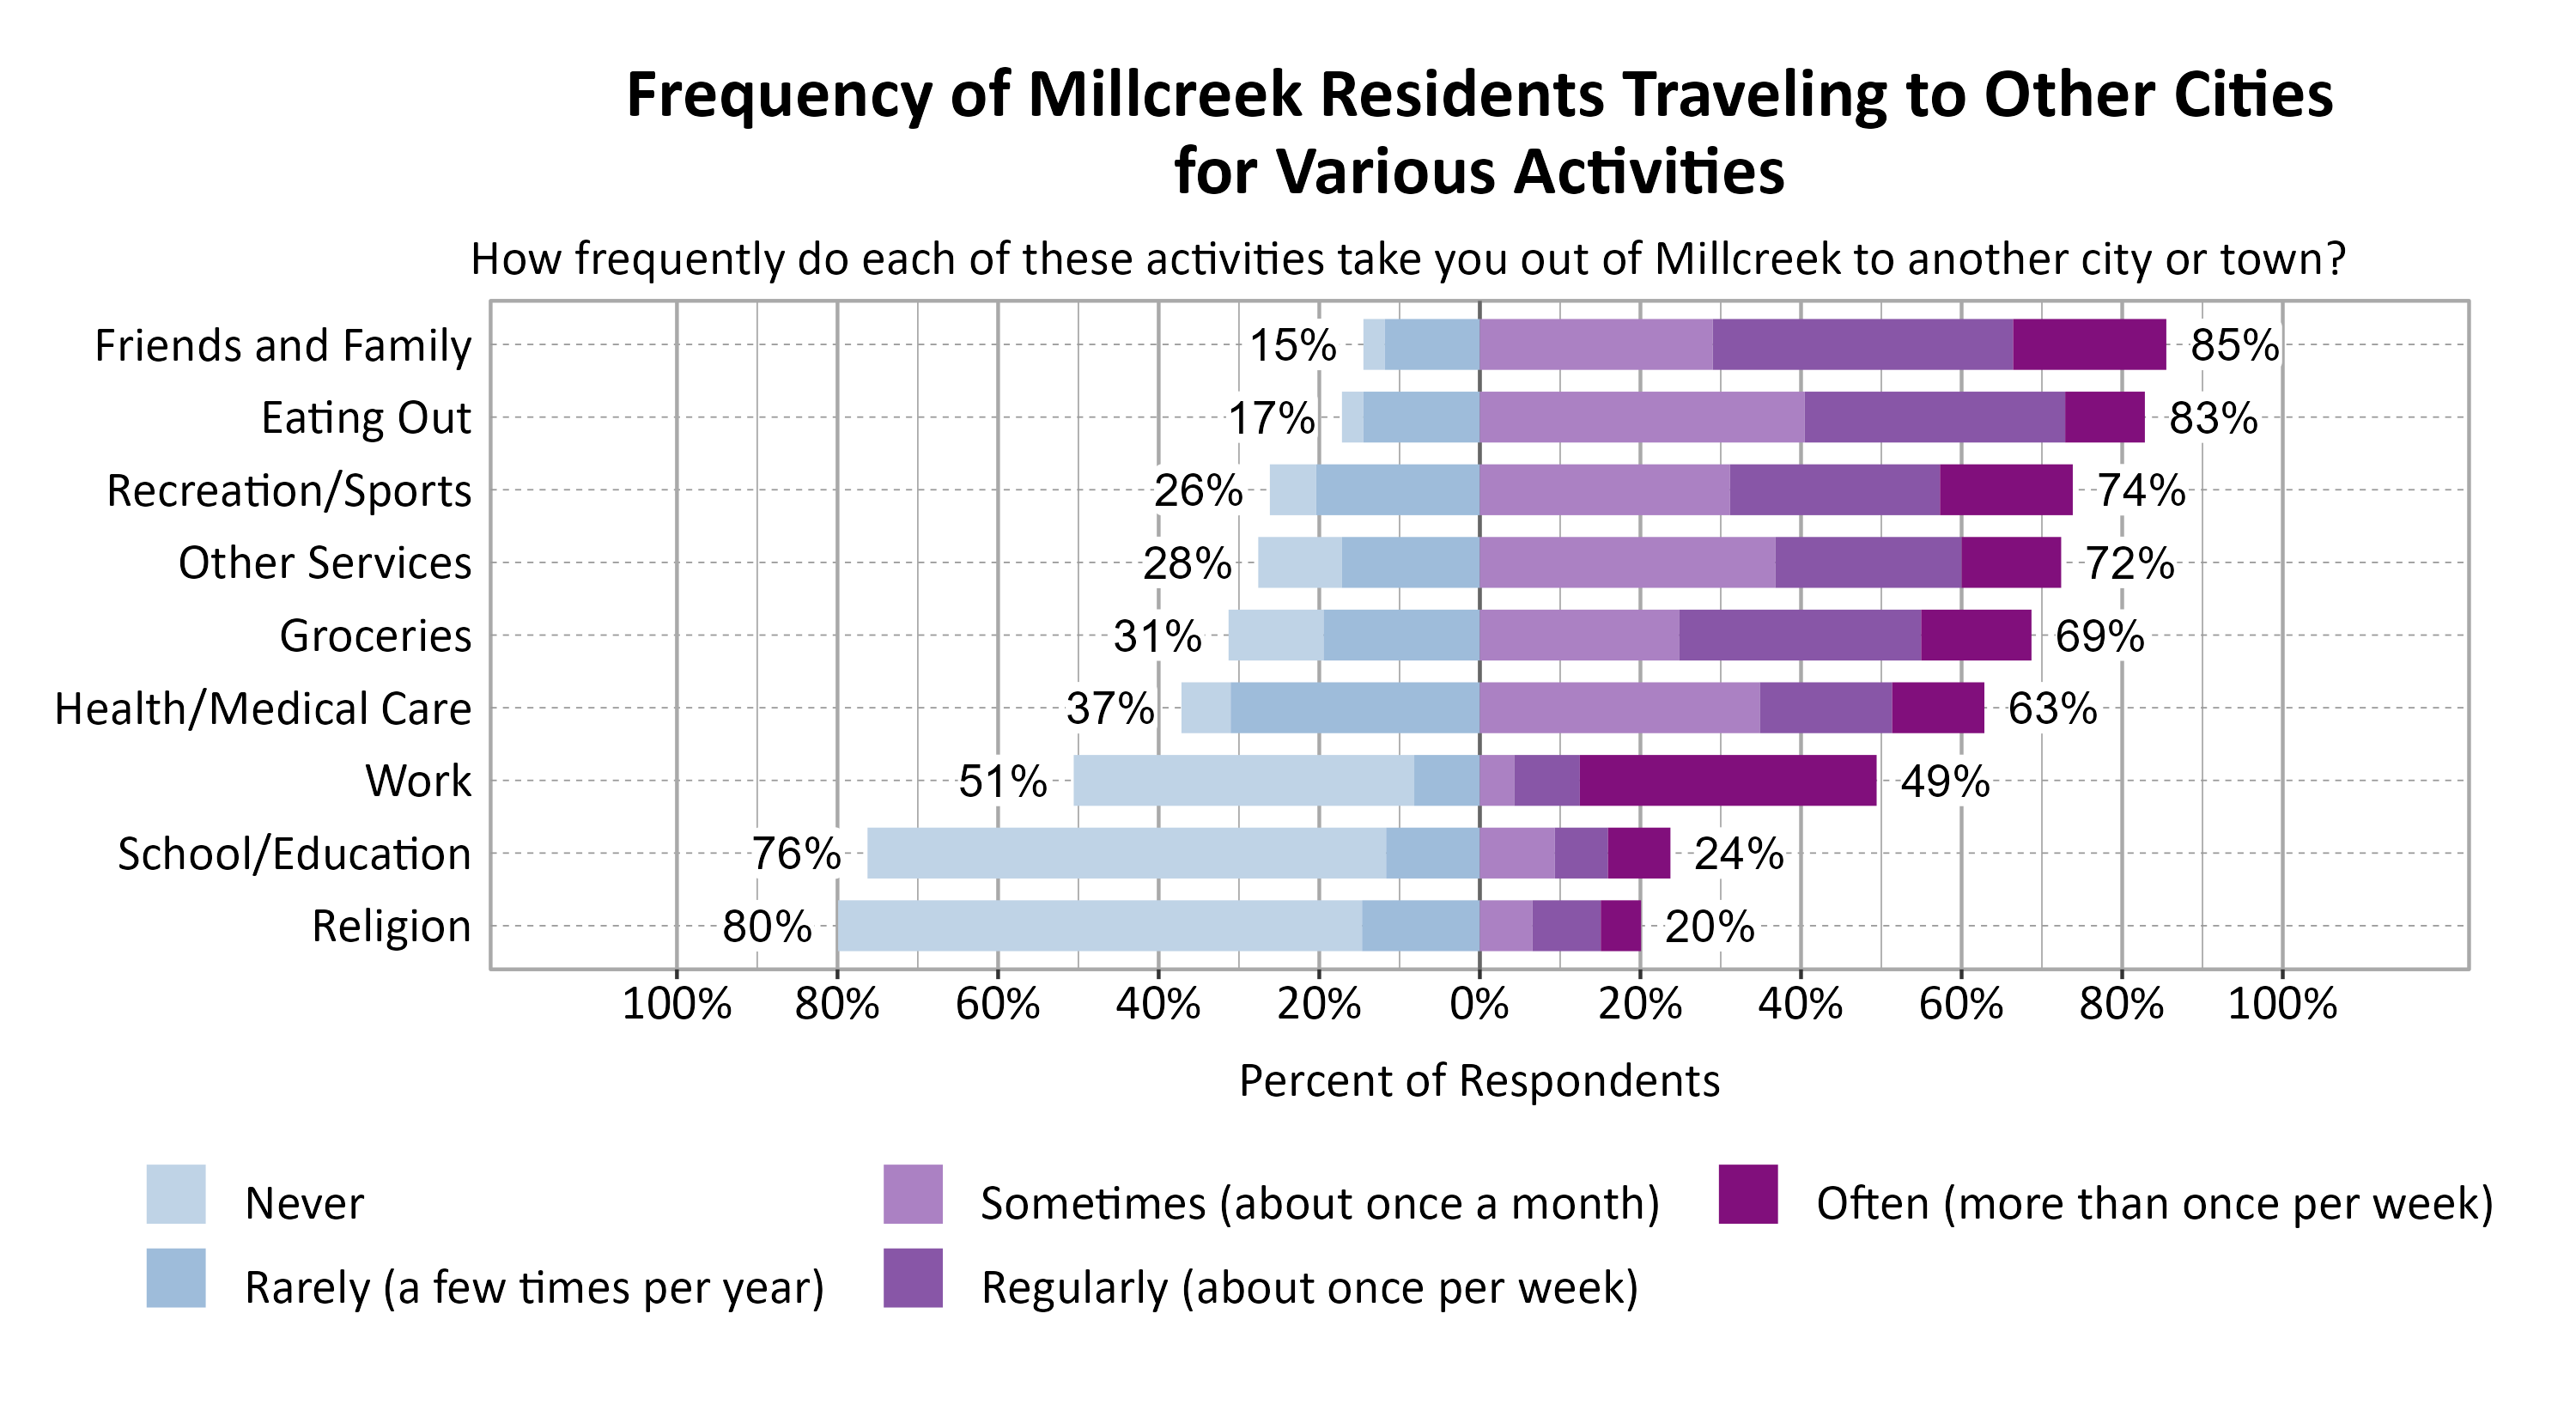
Respondents were asked to indicate how frequently various activities take them out of Millcreek to another city or town. The most commonly indicated reasons for traveling to another city or town at least sometimes or once a month were Friends and Family (85%), Eating Out (83%), and Recreation/Sports (74%).
Concerns in Millcreek
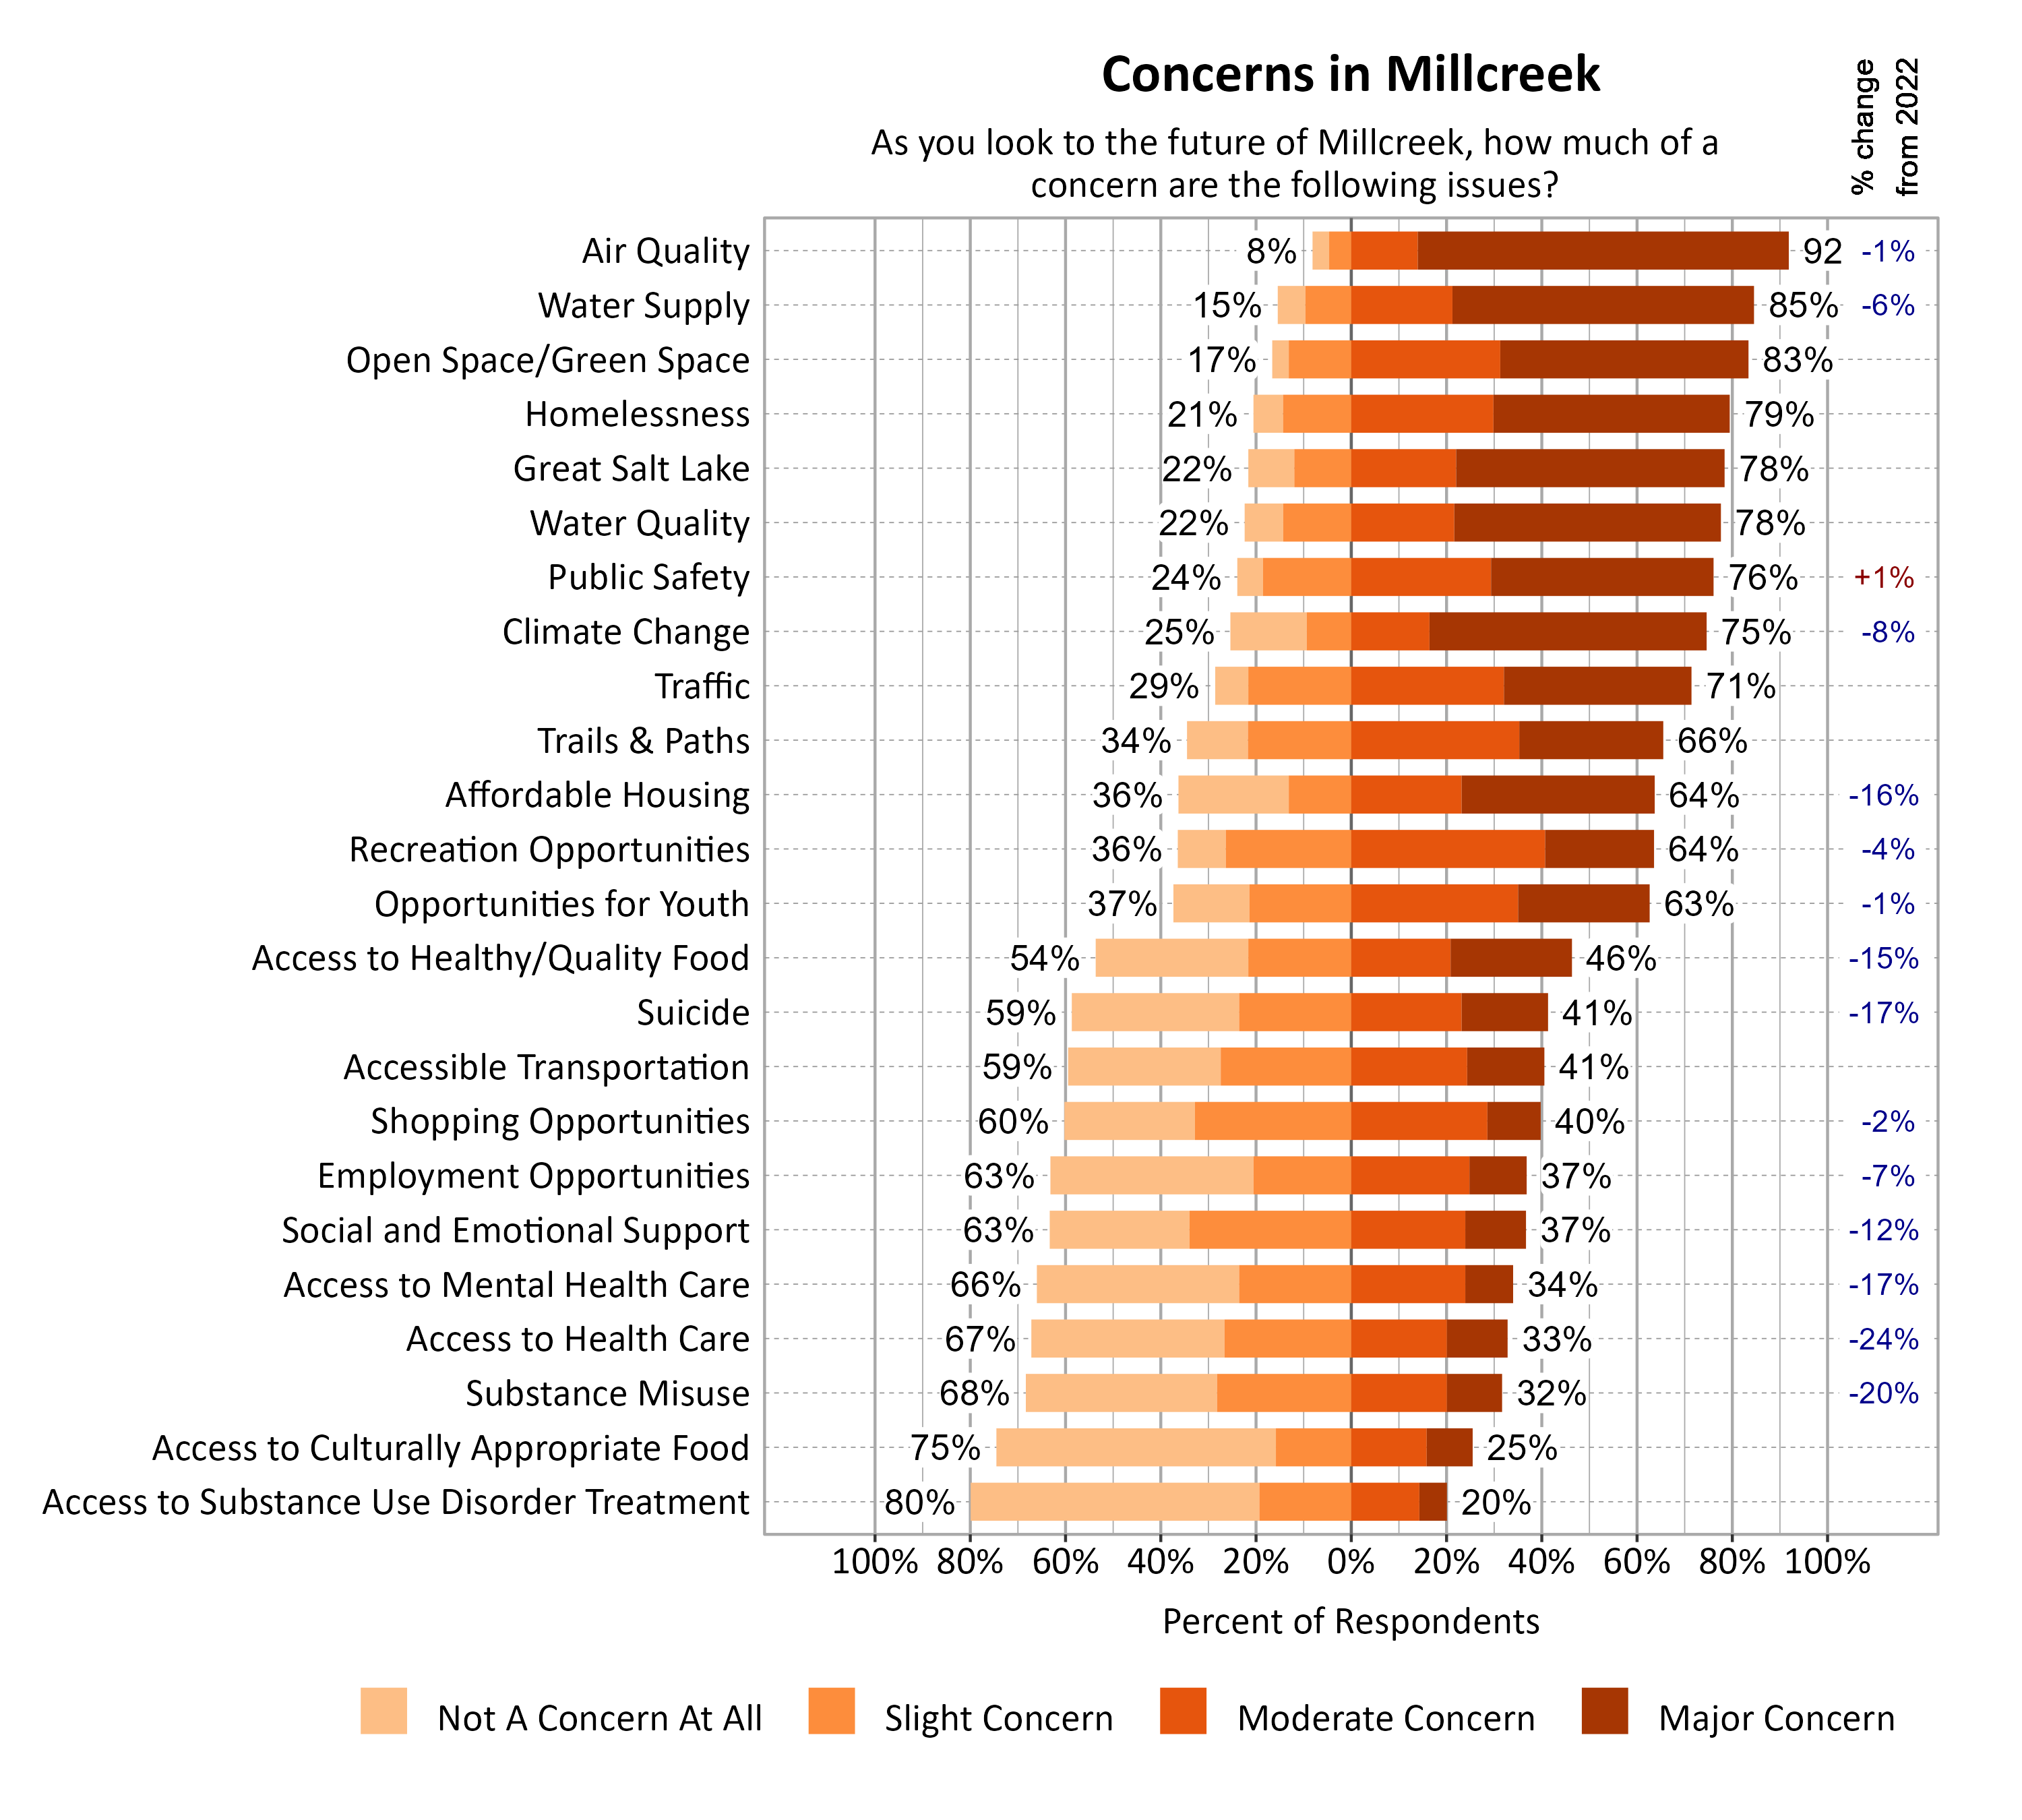
Survey respondents indicated the degree to which a number of possible local issues were a concern as they look to the future of Millcreek. Air Quality (92%), Water Supply (85%), and Open Space/Green Space (83%) were the top concerns. Since 2022, moderate or major concern about access to health care (-24%), substance misuse (-20%), access to mental health care (-17%), suicide (-17%), affordable housing (-16%), access to healthy/quality food (-15%), and social and emotional support (-12%) notably decreased.
Open Comments
All open comments collected in the survey were shared with city leaders. General observations and themes are shared here.
What Respondents Value Most in Millcreek
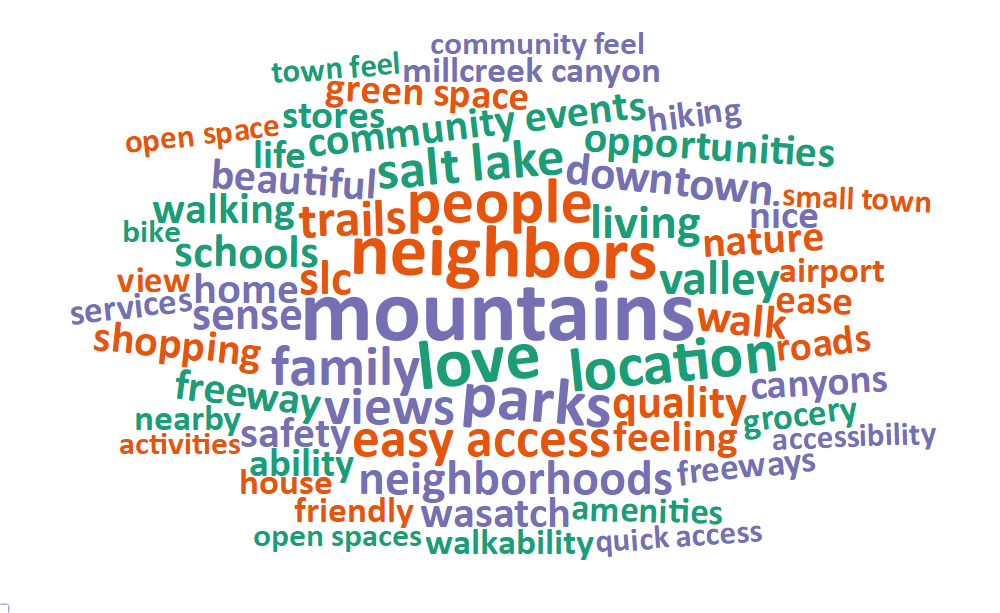
Survey respondents were asked to comment on what they value most about Millcreek. The most common words and phrases from all city comments are included in the word cloud below. It is possible that negative or unrelated words may appear since these words have been taken out of context, and they may not indicate the respondent’s intended meaning. Many comments expressed value for Millcreek’s location, particularly being close to work and centrally located in Valley and close to neighboring bigger cities. Comments also mentioned accessibility to mountains and parks. Many respondents wrote that they value their friendly neighbors and sense of community. Nature and beauty were also valued, with comments about scenic views, green spaces, and the area’s proximity to the mountains.
Local Environmental Quality in Millcreek
The 49% of respondents who rated the Local Environmental Quality domain as 1, 2, or 3 (Poor, Fair, or Moderate) were further asked if there are specific aspects of local environmental quality that they feel are problematic. Air quality was a primary concern, particularly related to traffic and the Great Salt Lake. Traffic was also highly mentioned in general by Millcreek respondents. Cleanliness of roads, sidewalks, and green spaces were also notable concerns. Construction in the area was said to cause dust to fill the air and leave trash on the road. Comments mentioned a lack of green space due to new apartment buildings and developments.
Improving Wellbeing in Millcreek
Survey respondents were asked if there is anything that could be done to improve wellbeing in Millcreek. A large majority of comments expressed the need for better public transit, more sidewalks, and protected bike lanes to enhance safety and accessibility. There was also a desire for less high-density development, as many felt it leads to overcrowding and deteriorates the quality of life. Concerns about air quality, traffic speed, and the upkeep of parks and roads were prevalent, with many residents advocating for more green spaces and improved infrastructure. There were also comments on the need to address homelessness and related safety concerns. There was a significant push for more community amenities such as local restaurants, affordable housing, and better maintenance of existing public spaces. Many urged city officials to focus on long-term sustainability, equitable development across different neighborhoods, and greater support for the underprivileged.
Additional Comments
Respondents were also asked if they had any additional comments on wellbeing in Millcreek. Praise was given to the local government for their communication efforts, particularly through newsletters and community events. Some comments reflected dissatisfaction with city leadership, saying they are disconnected from residents’ needs and prioritizing development over community wellbeing. There were also many requests for better road conditions, more sidewalks, safer biking paths, and more public transit options. There were some concerns about housing affordability, air quality and environmental sustainability, safety (homelessness and unleashed dogs), and the need for more recreational activities.