Nephi Wellbeing Survey Findings 2024
By Dr. Courtney Flint and Team
![]()
Contact Information
Dr. Courtney Flint
courtney.flint@usu.edu
435-797-8635
Summary
Nephi is one of 51 cities participating in the Utah Wellbeing Survey Project in 2024. This project is designed to assess the wellbeing and local perspectives of city residents and to provide information to city leaders to inform general planning processes. Additional analysis is underway and this report may be updated over time.
We are grateful to all those who took the survey and to our city partners who helped to make this possible. We are grateful to a number of entities for funding: the Utah League of Cities and Towns, USU Extension, USU’s Institute for Land Water and Air, the Wasatch Front Regional Council, Utah Department of Transportation, the Utah Agricultural Experiment Station, and the cities of Alpine, Cedar Hills, Draper, Millcreek, Nephi, North Salt Lake, Ogden, Orem, Pleasant Grove, Providence, Springdale, Tremonton, West Bountiful, and West Valley City.
This report describes findings from the 2024 Nephi survey and comparative information with other project cities. In March 2024, Nephi City advertised the survey for residents through the utility bill newsletter, social media, city council announcements, and flyers in public buildings. All city residents age 18+ were encouraged to take the online Qualtrics survey.
How many people responded?
- 450 viable surveys were recorded in this 2024 survey effort.
- The Nephi 2022 survey had 250 responses and the Nephi 2021 survey had 144 responses and the Nephi 2020 survey had 275 responses.
- The adult population of Nephi was estimated at 4,432, based on the American Community Survey by the U.S. Census. The 450 survey responses in 2024 represent 10.2% of the adult population and have a conservative margin of error of 4.38%.
Survey Respondent Characteristics
| Resident Statistics | |
|---|---|
| Full Time Residents of Nephi | 98.4% |
| Part Time Residents of Nephi | 1.6% |
| Length of Residency — Range | 0.5-84 years |
| Length of Residency — Average | 20.8 years |
| Length of Residency — Median | 15 years |
| Length of Residency 5 Years or less | 30.1% |
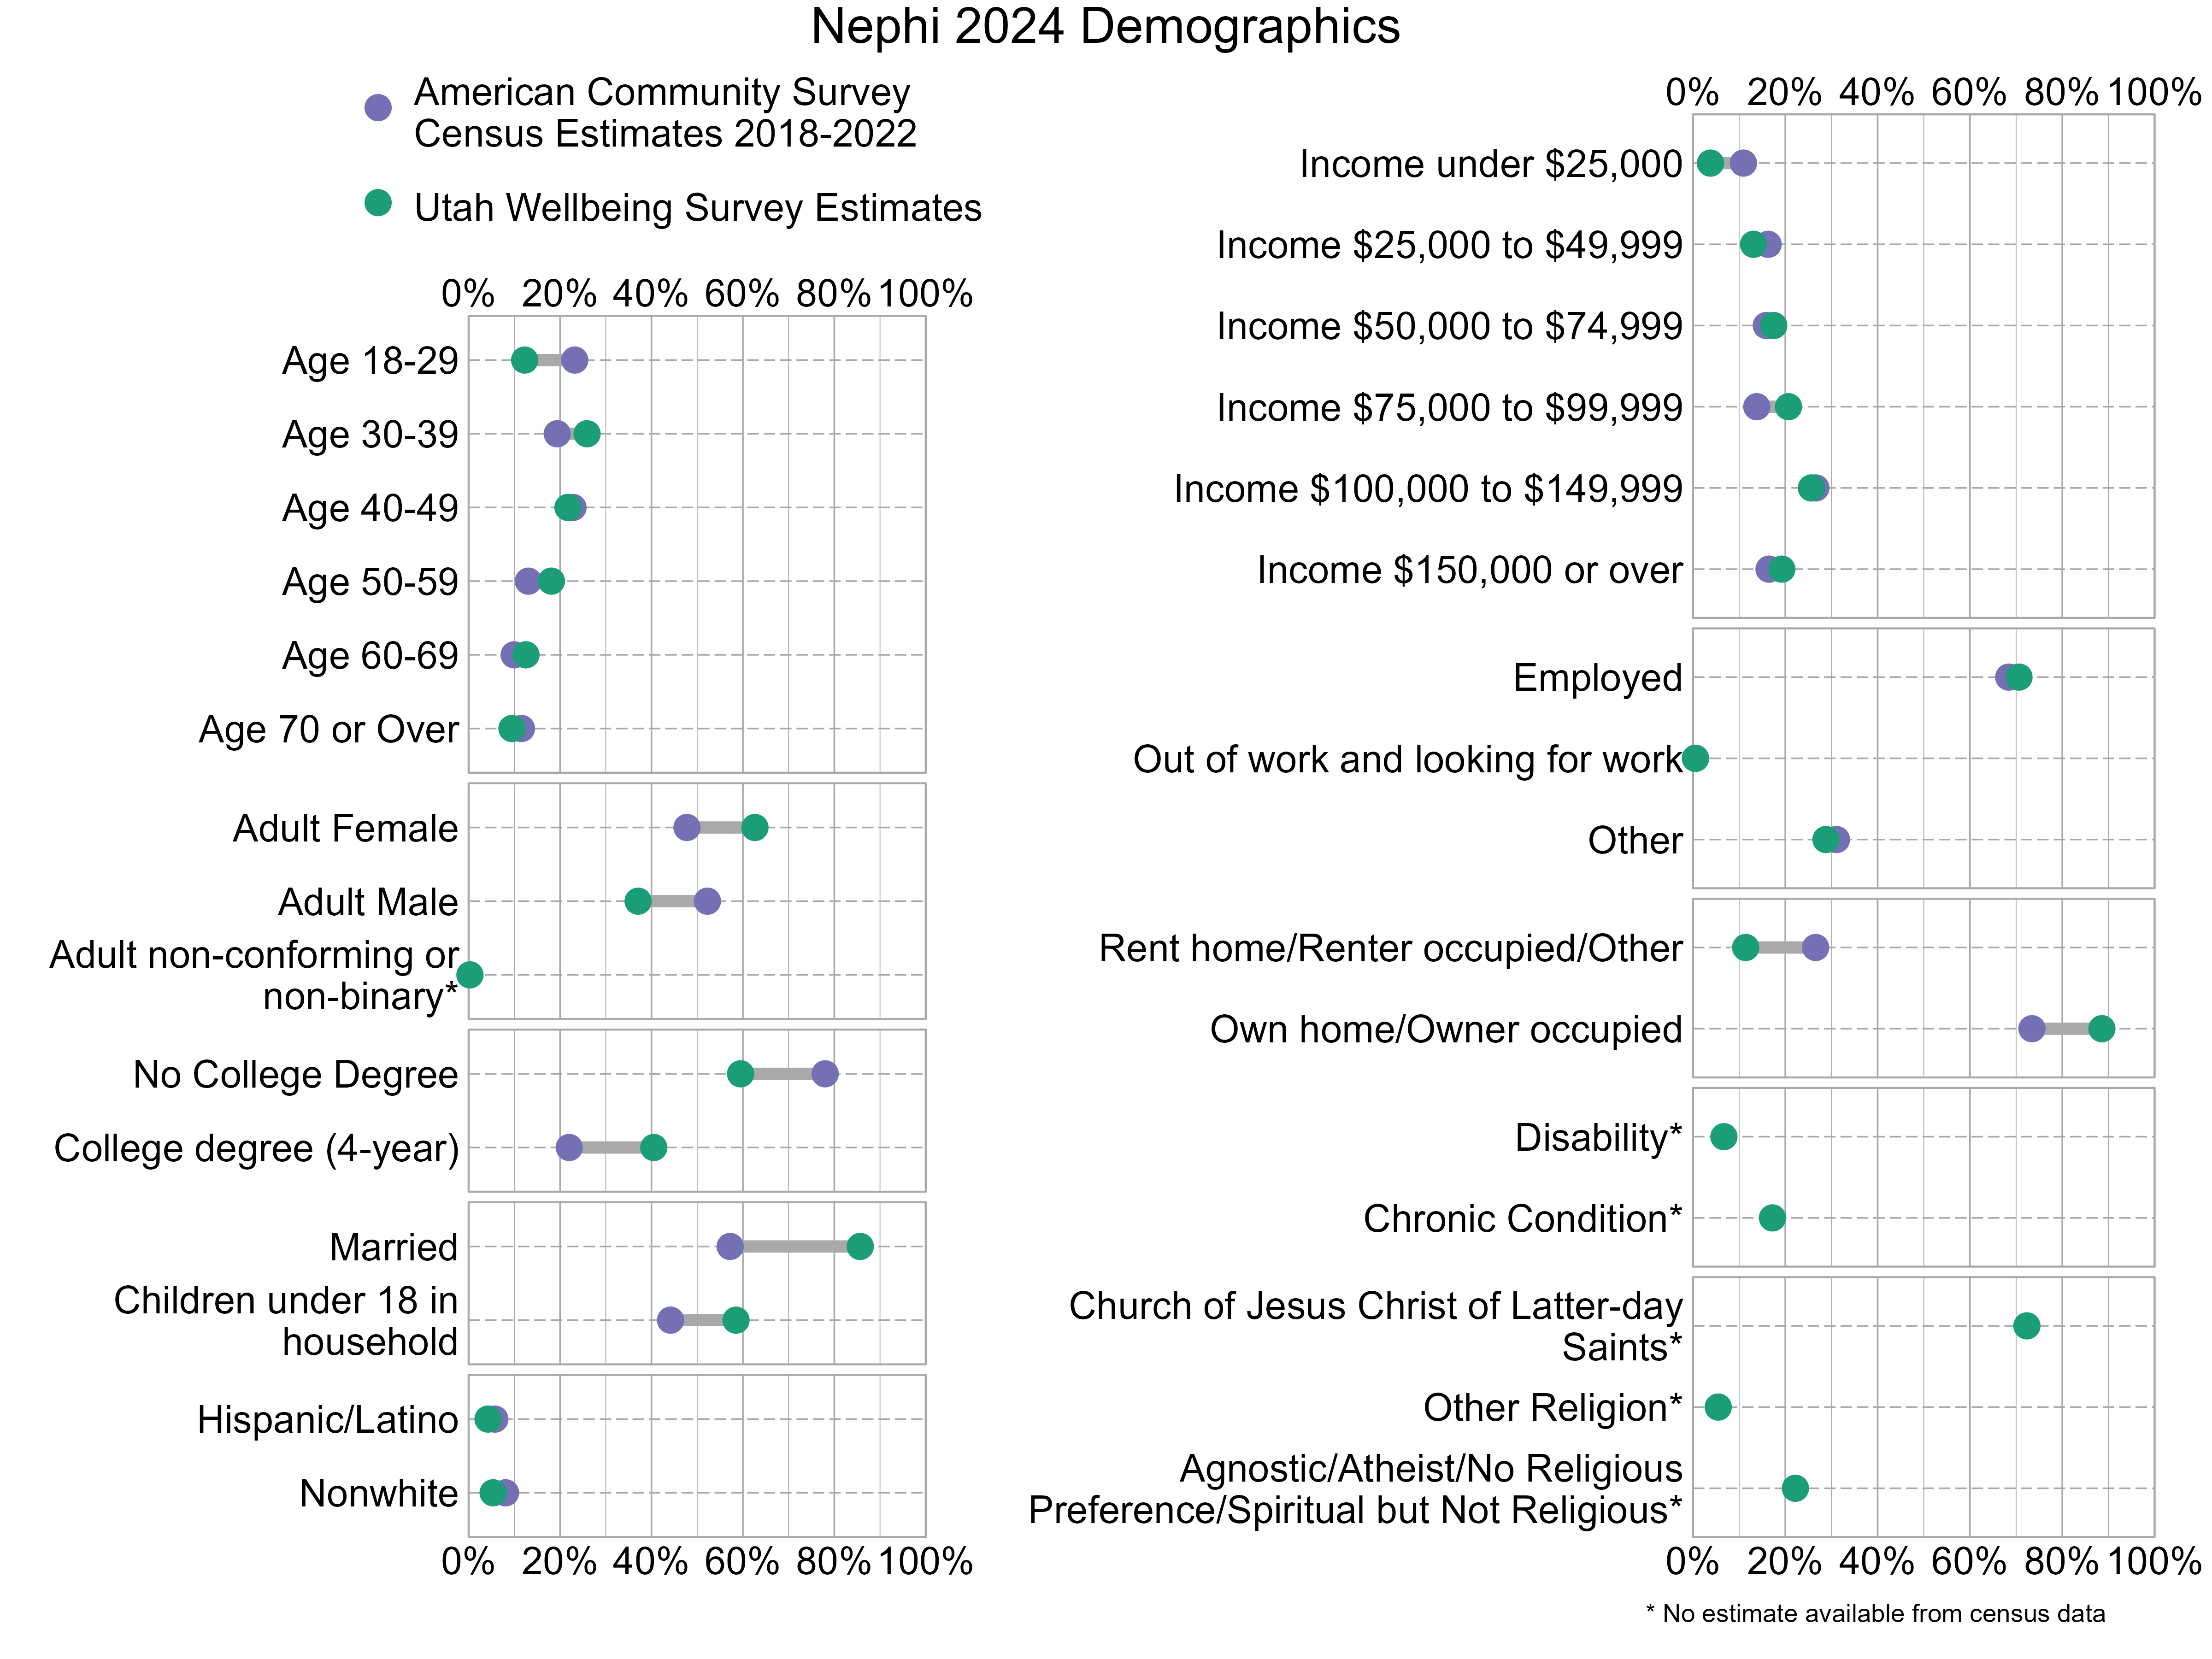
Demographic characteristics of the survey respondents were compared below with U.S. Census information from the 2018-2022 American Community Survey. In the graph below, gray bars indicate differences between the American Community Survey estimates and the Utah Wellbeing Project surveys. The wider the gray bars, the larger the differences. Also note that estimates for religious affiliation, adult non-conforming or non-binary gender, disability, and chronic conditions are unavailable from the census data. There can also be a variable margin of error in the American Community Survey estimates, and caution should be used when comparing estimates. Not all respondents provided demographic information. As the graph shows, 2024 survey respondents were not fully representative of Nephi. People who have at least a 4-year college degree, are married, and own their homes were overrepresented while those who are adult males, do not have a college degree, and are renters were underrepresented.
Overall Personal Wellbeing and Overall Wellbeing in Nephi
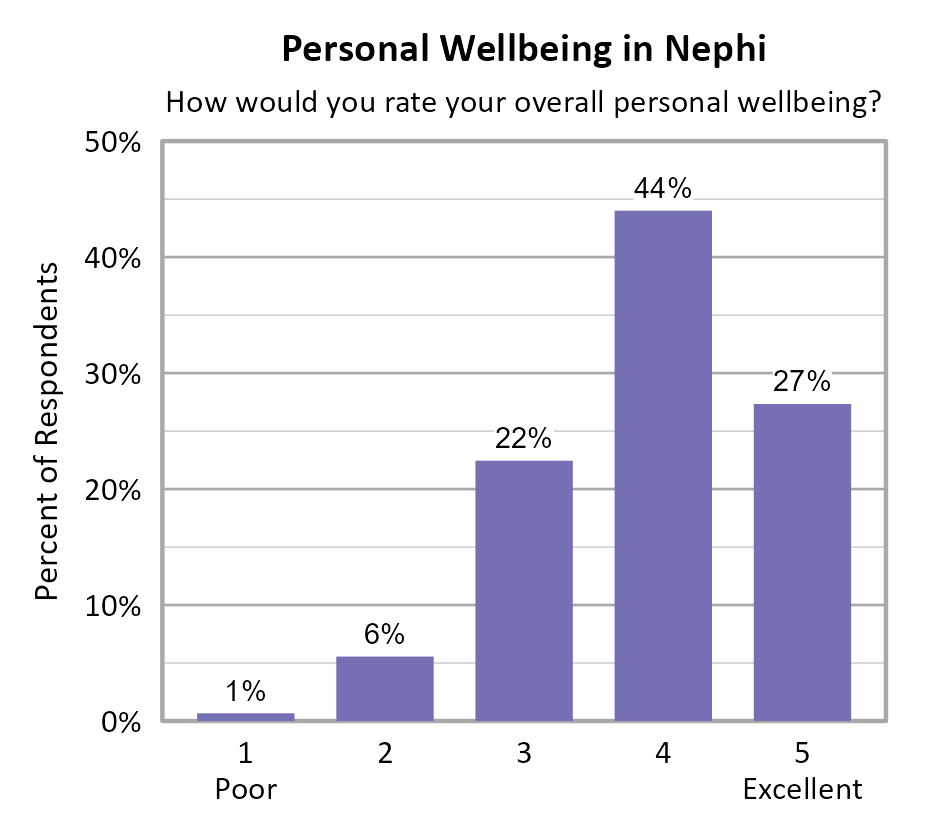
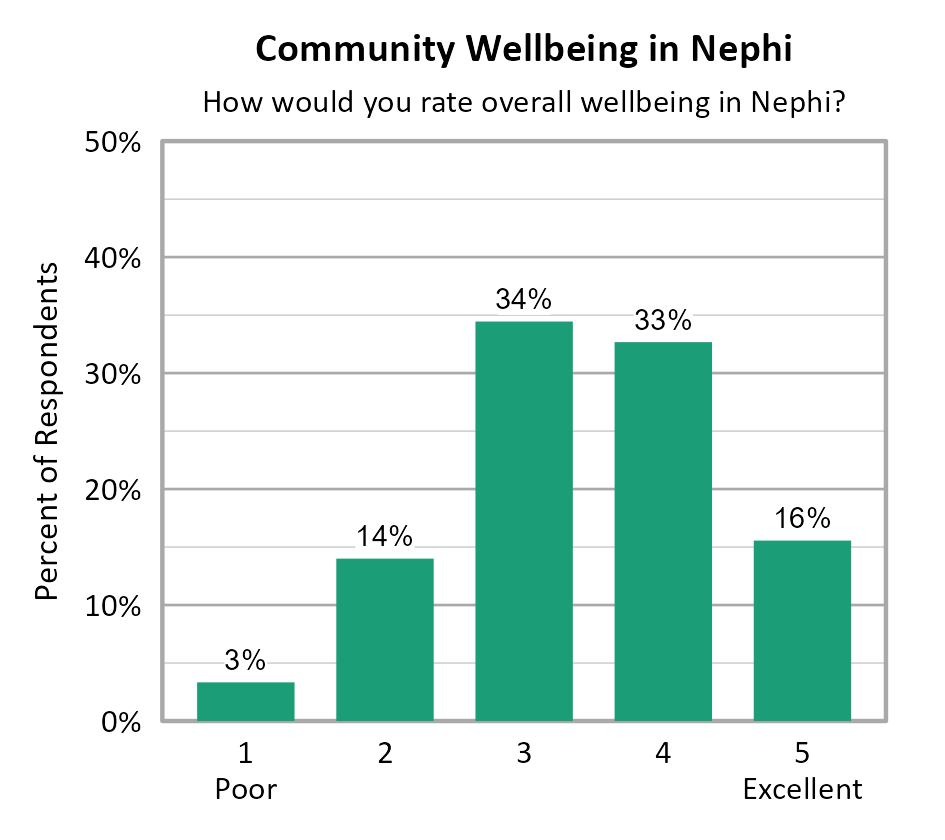
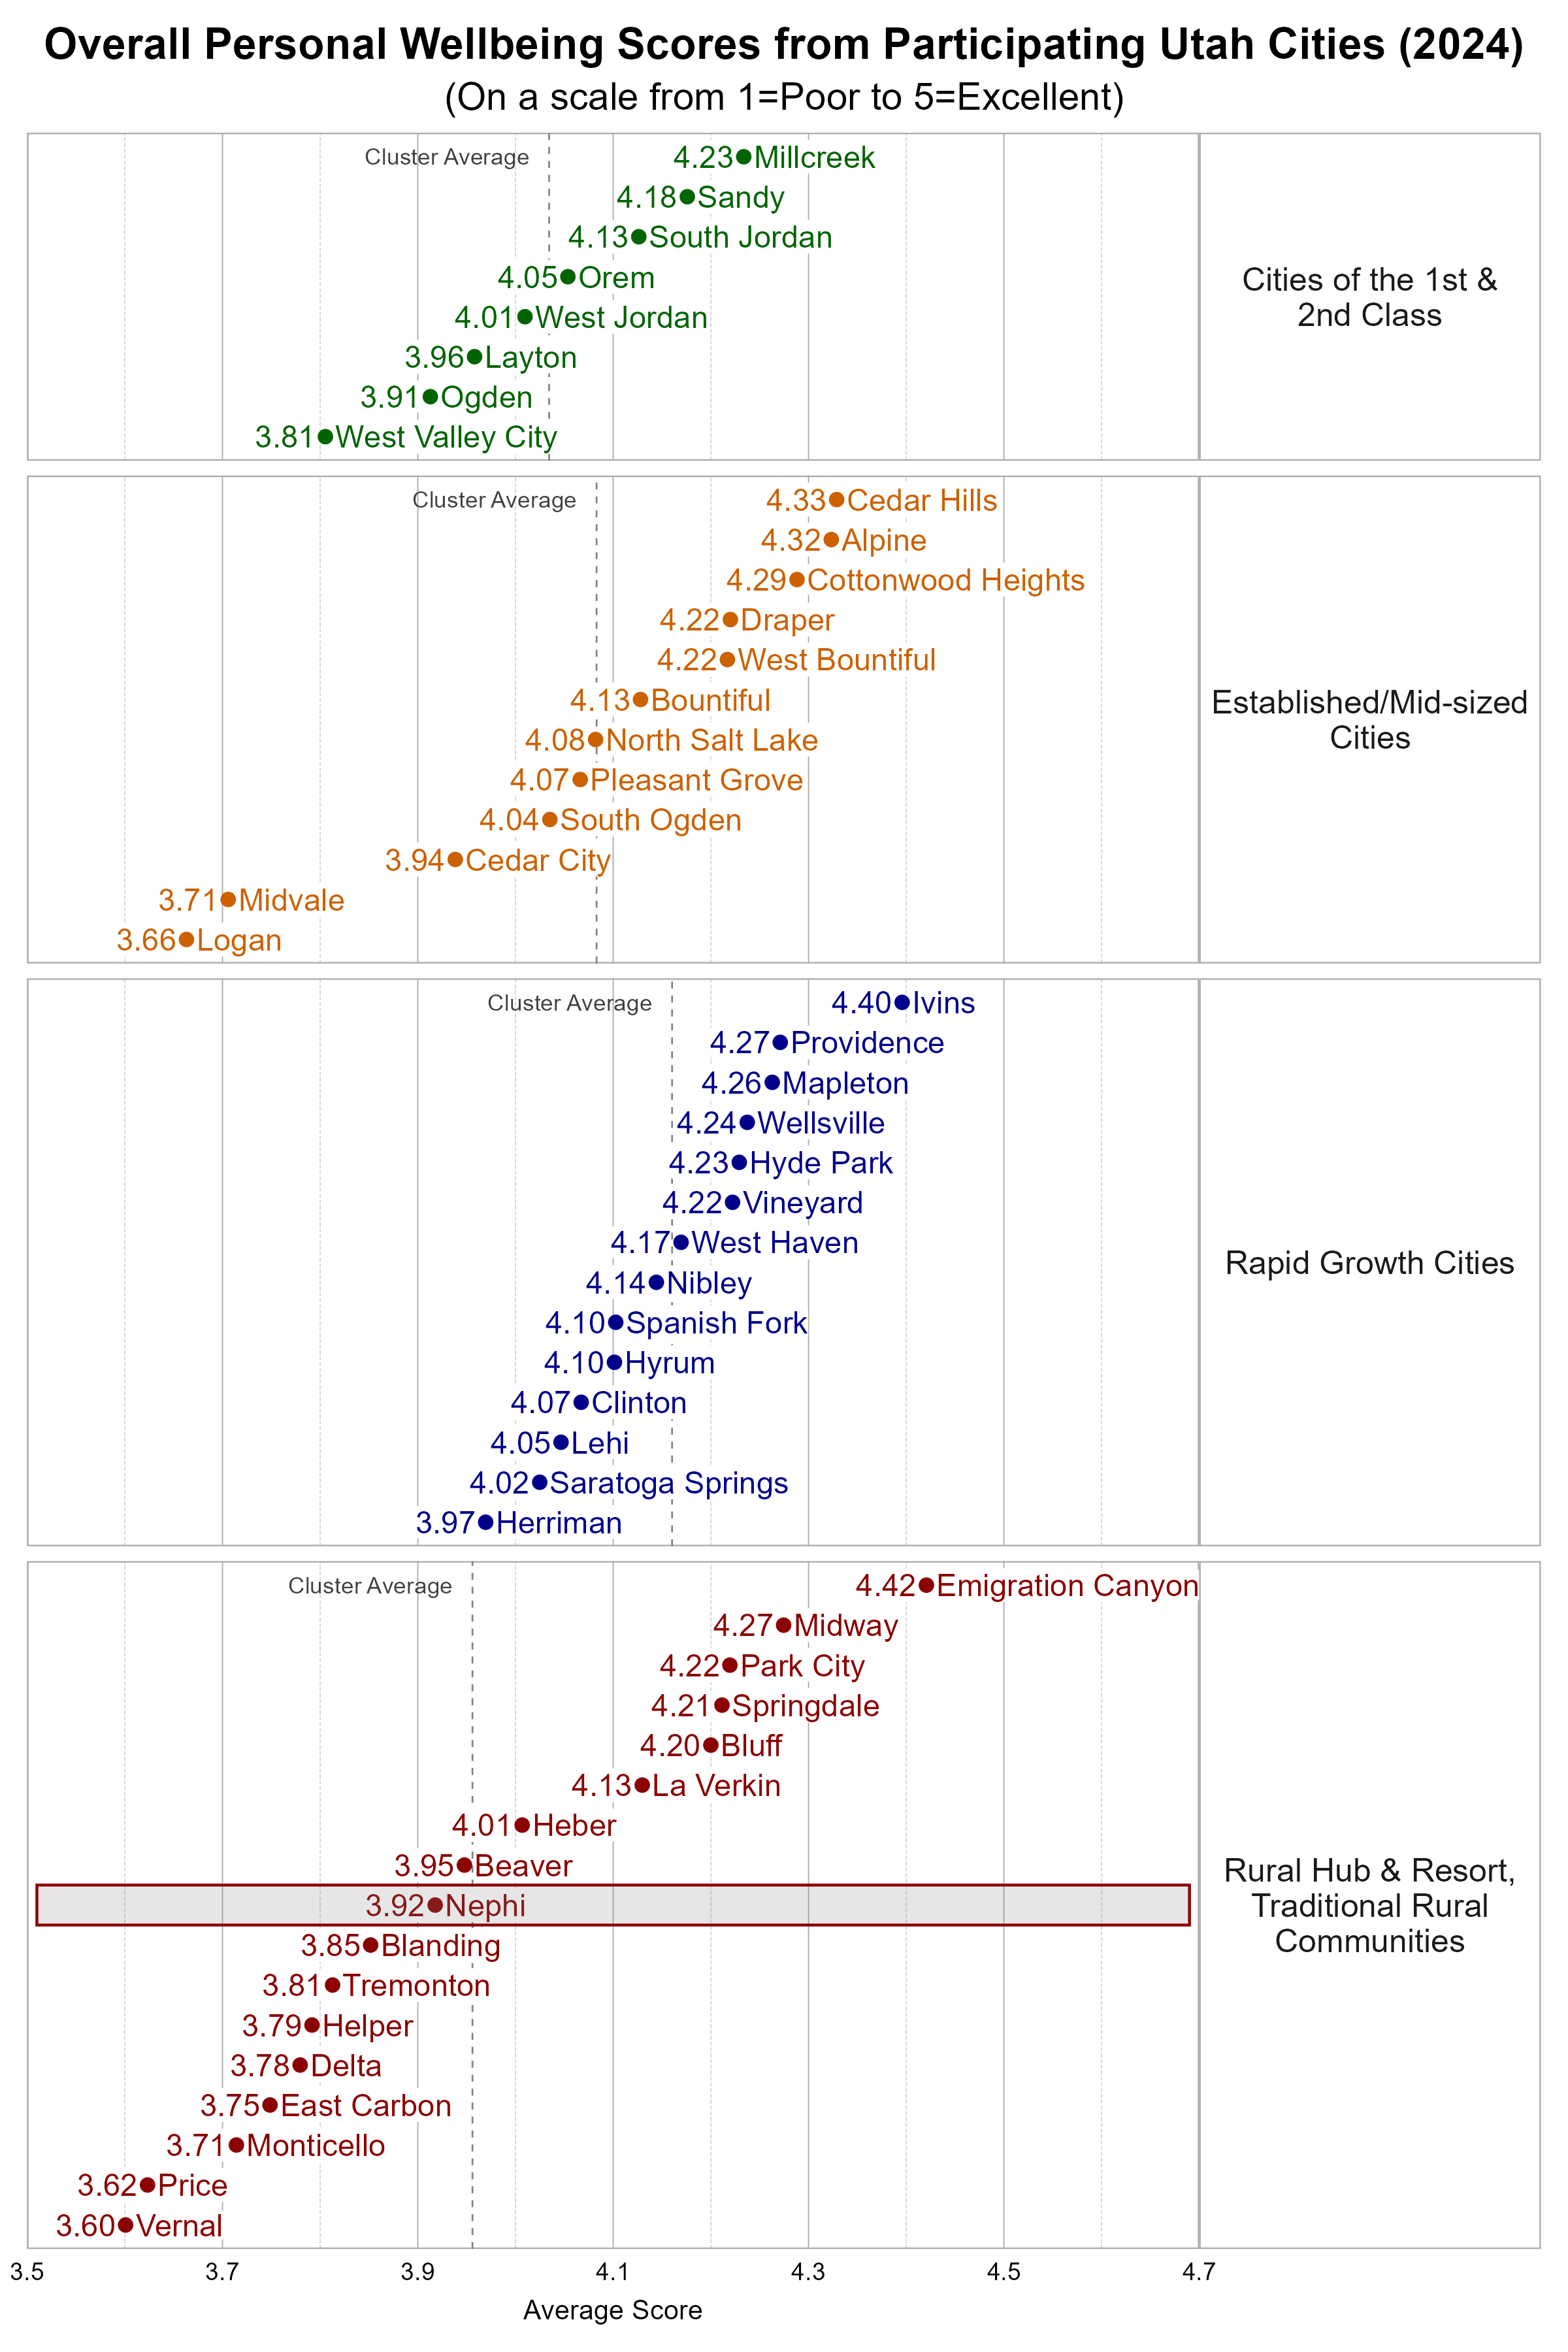
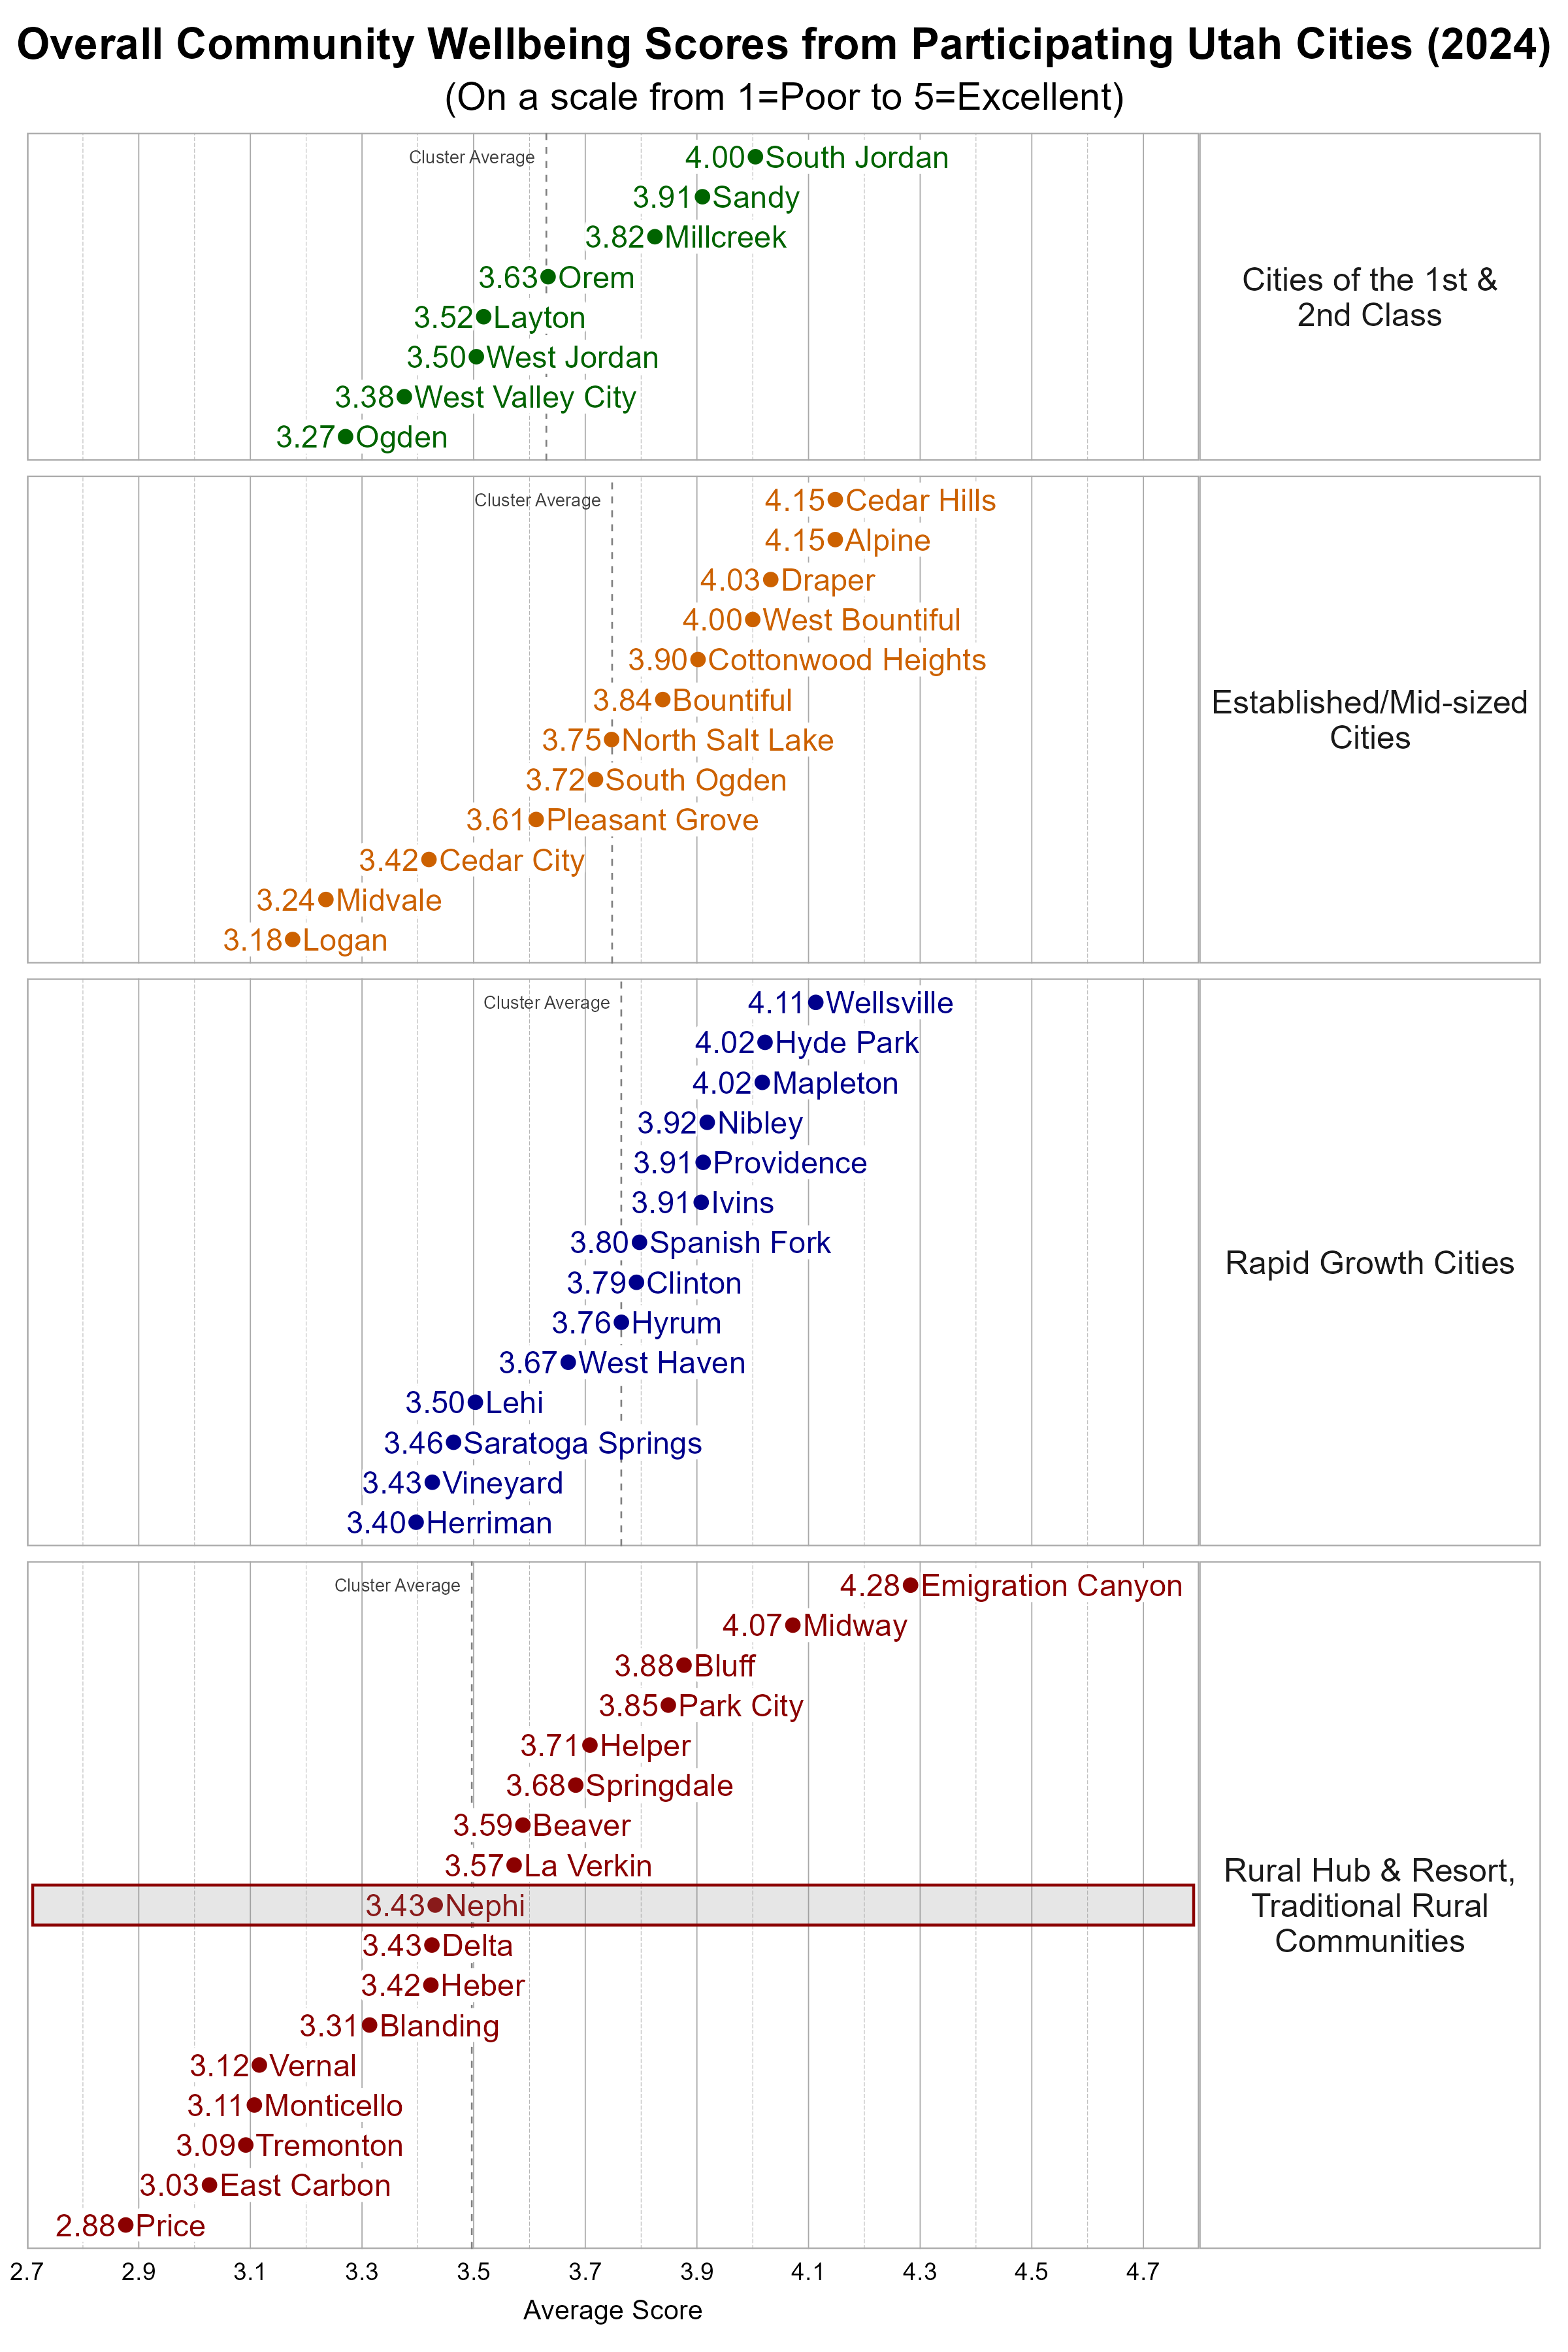
Survey participants were asked about their overall personal wellbeing and overall community wellbeing in Nephi. These wellbeing indicators were both measured on a 5-point scale from poor (1) to excellent (5). The average personal wellbeing score in Nephi was 3.92 with 71% of respondents indicating their wellbeing at a 4 or 5 on the 5-point scale. The average score for community wellbeing in Nephi was 3.43 with 48% of respondents indicating community wellbeing at a 4 or 5 on the 5-point scale.
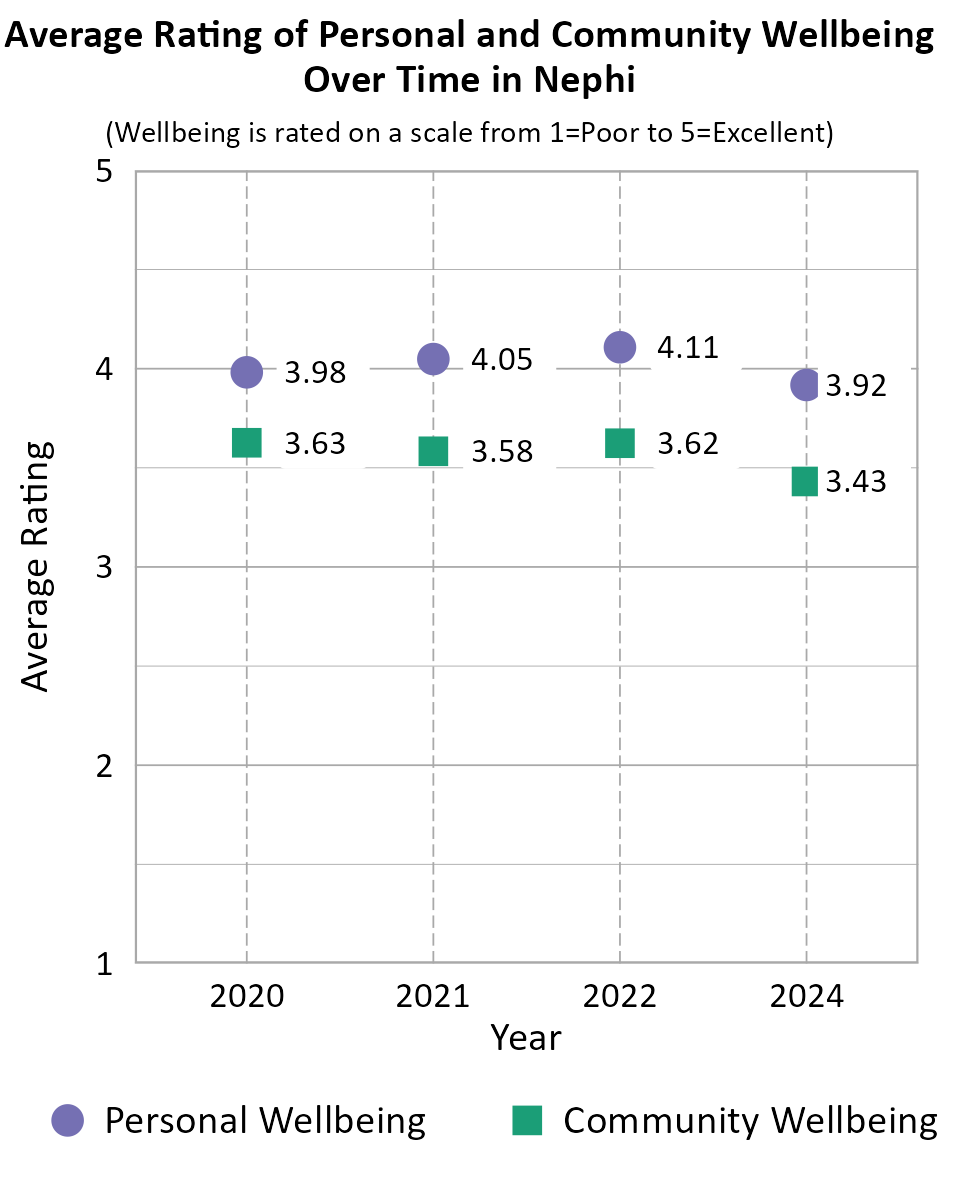
When comparing survey data from Nephi over the years as shown in the information below, we can see that the average personal wellbeing score increased from 2020 to 2022, and declined from 2022 to 2024. The average community wellbeing score remained fairly consistent from 2020 to 2022, with a decrease from 2022 to 2024. Note that the number of respondents differed between years, there is no tracking of individuals from one year to the next, and the low end of the scale was "Poor" in 2024 but "Very Poor" in prior years which may account for differences in scores over time.
Comparing Wellbeing Across Utah Cities
The Utah League of Cities and Towns clusters cities and towns into five different categories based on size and growth rates. We utilize these clusters in our analysis. Nephi is classified as a Rural Hub/Resort Community (and we have combined these with the Traditional Rural Communities). Some cities may fit within more than one cluster.
Within the Rural city cluster, Nephi was close to the average overall personal wellbeing score and close to the average overall community wellbeing score.
Wellbeing Domains in Nephi
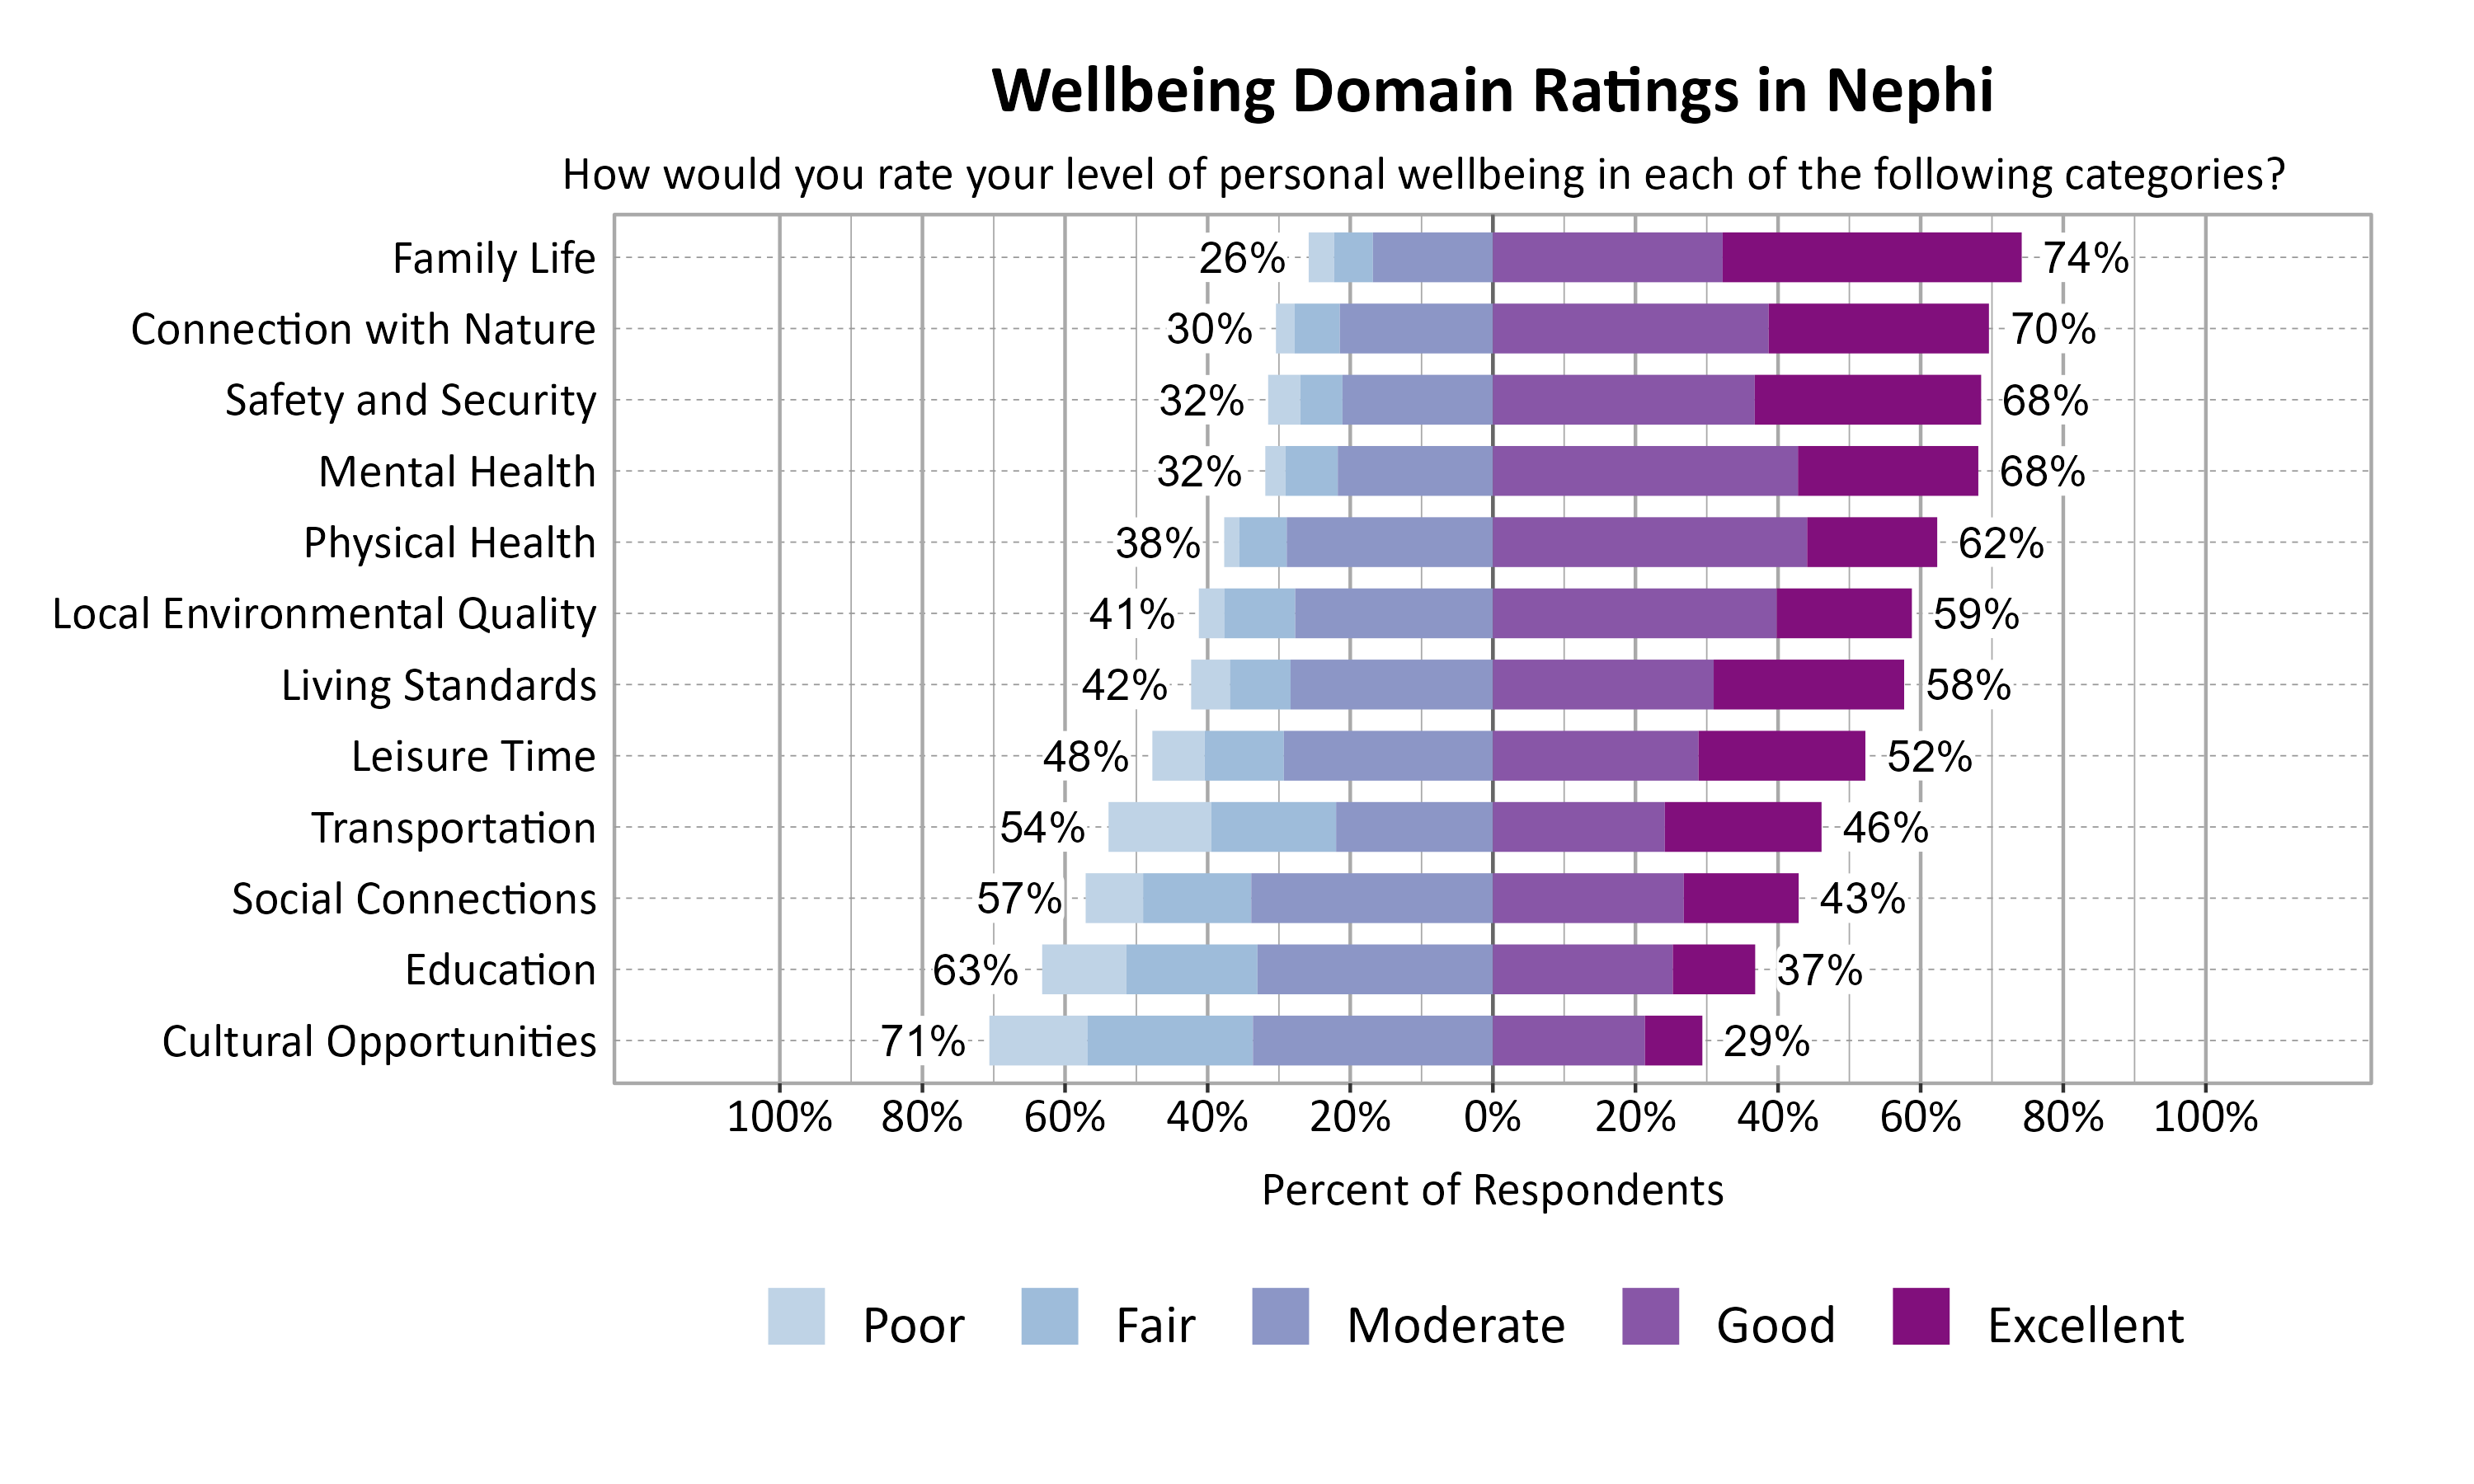
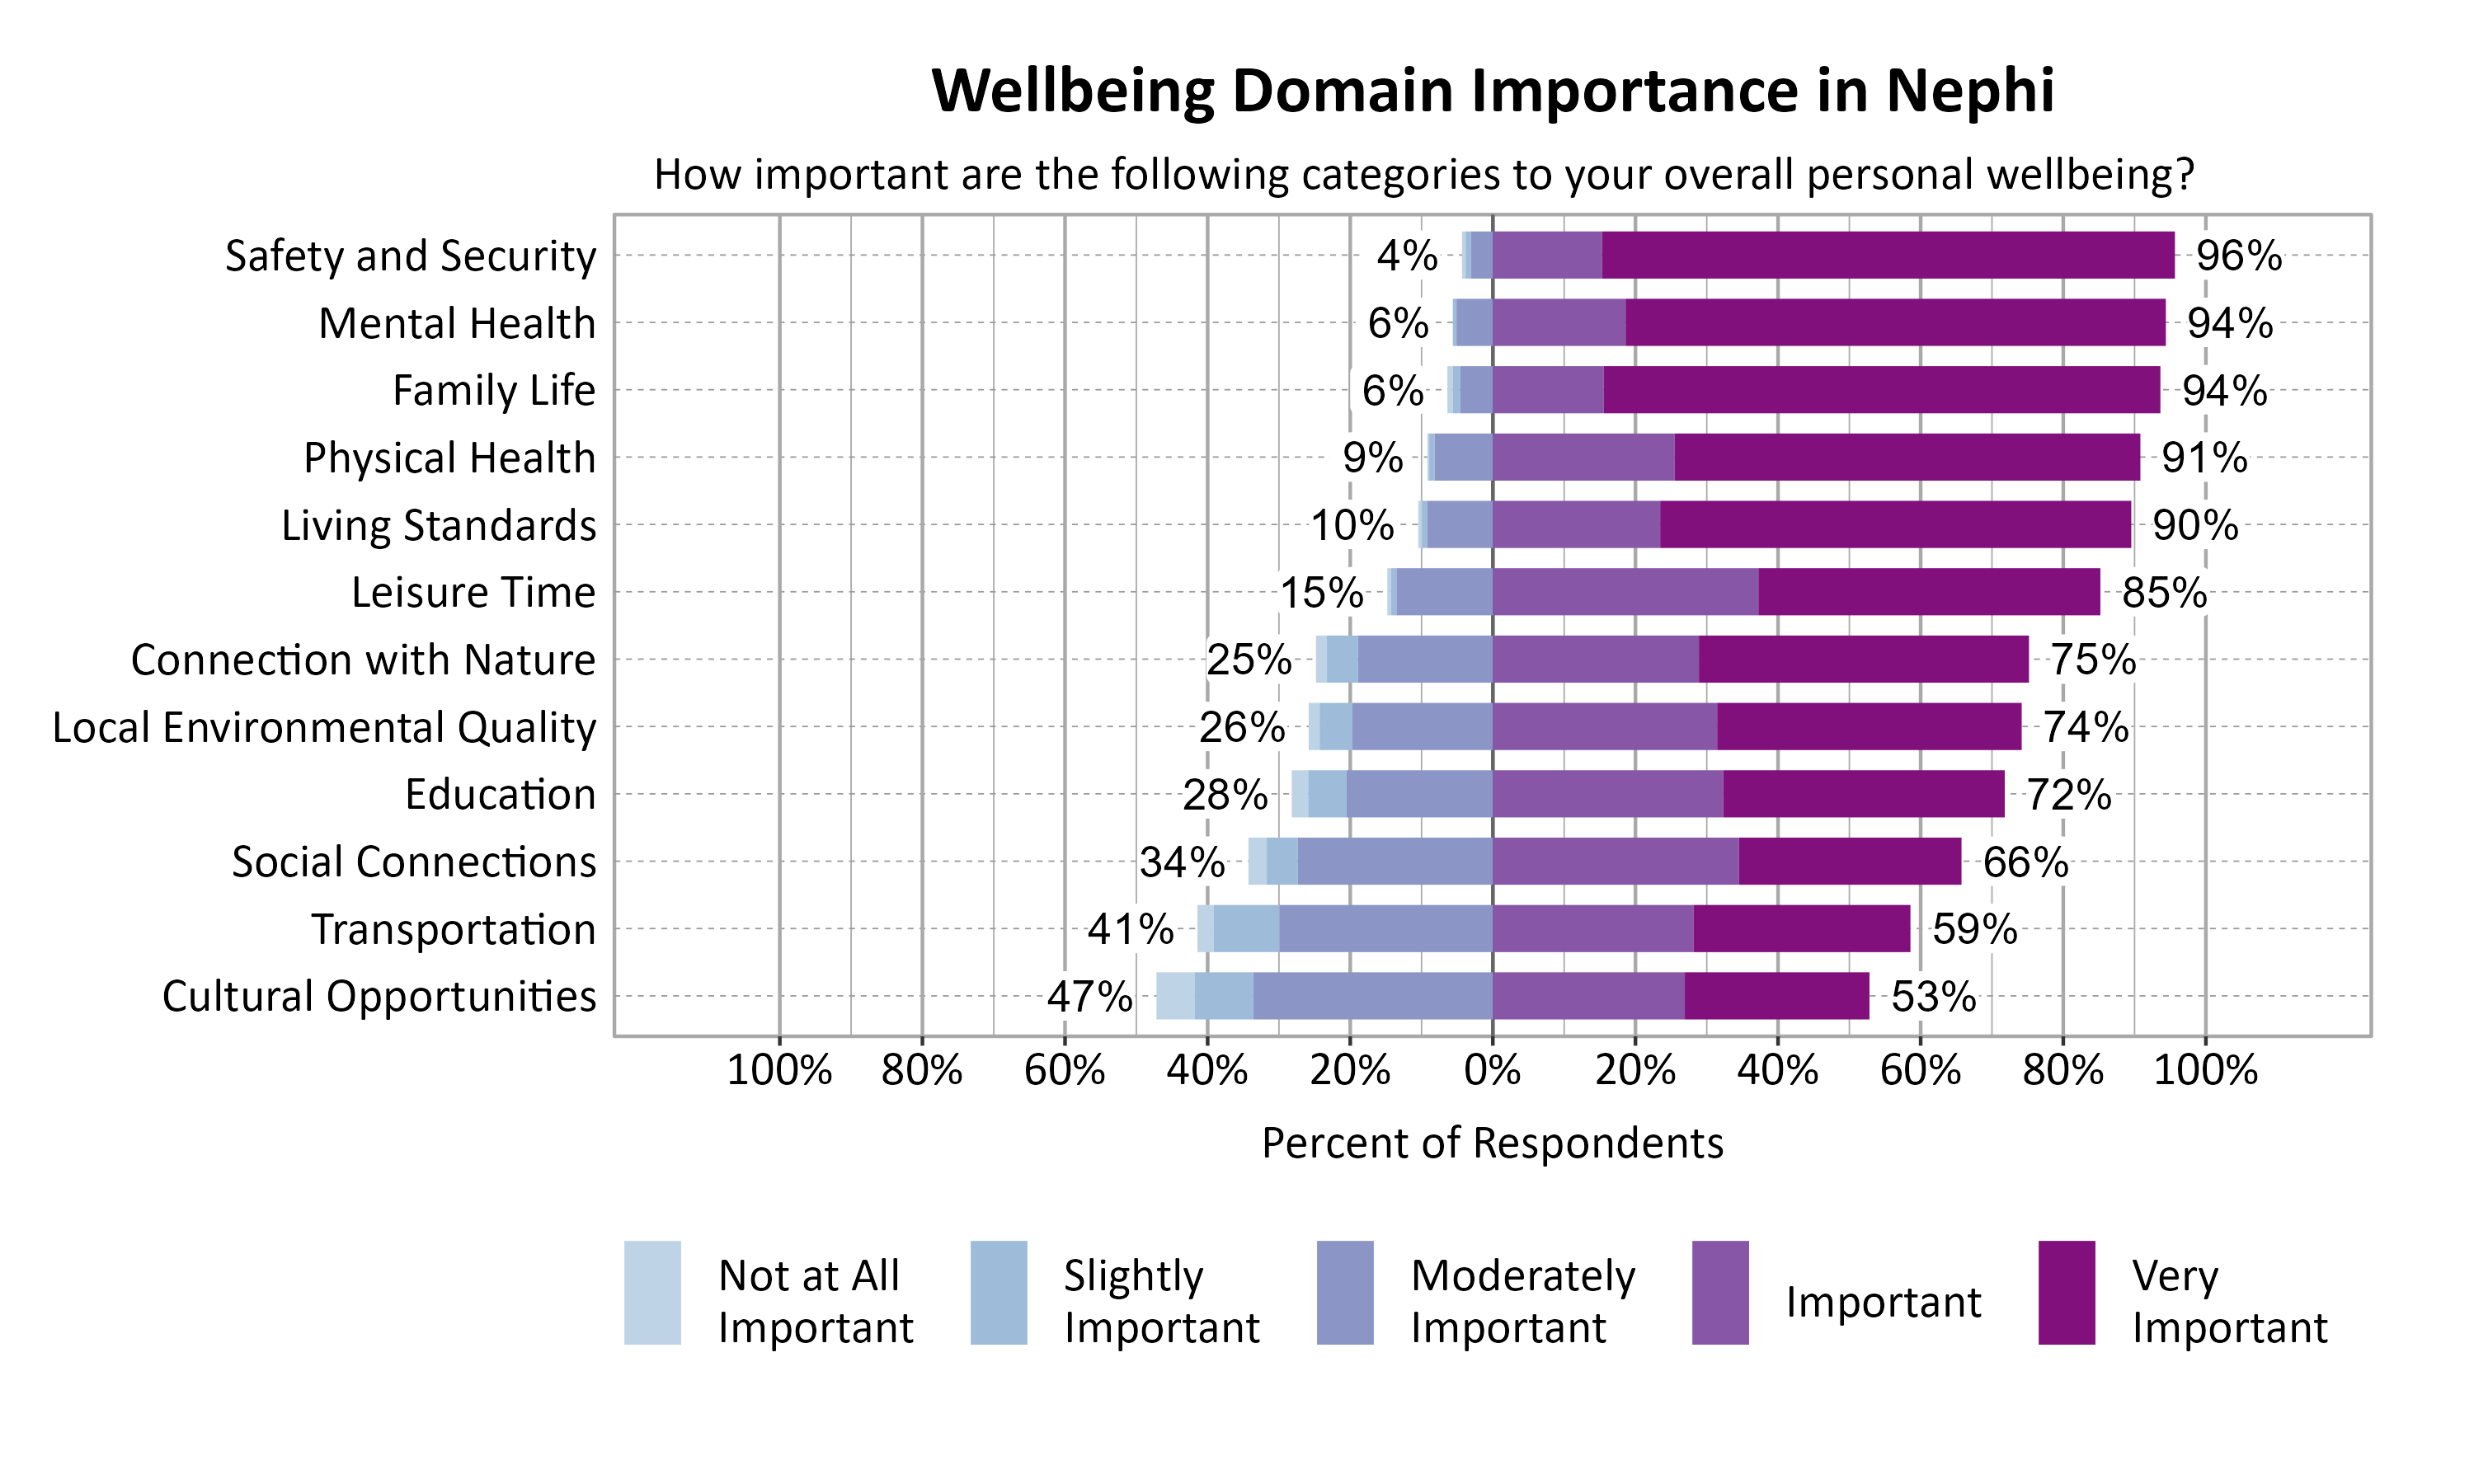
According to national and international entities that track wellbeing, there are a number of common dimensions or domains of wellbeing. Survey respondents rated twelve domains on a 5-point scale from poor to excellent. They were also asked to indicate the importance of each domain to their overall personal wellbeing on a 5-point scale from not at all important to very important. The highest rated wellbeing domains for respondents in Nephi were Family Life (74%), Connection with Nature (70%), Safety and Security (68%), and Mental Health (68%). The most important wellbeing domains were Safety and Security (96%), Mental Health (94%), and Family Life (94%).
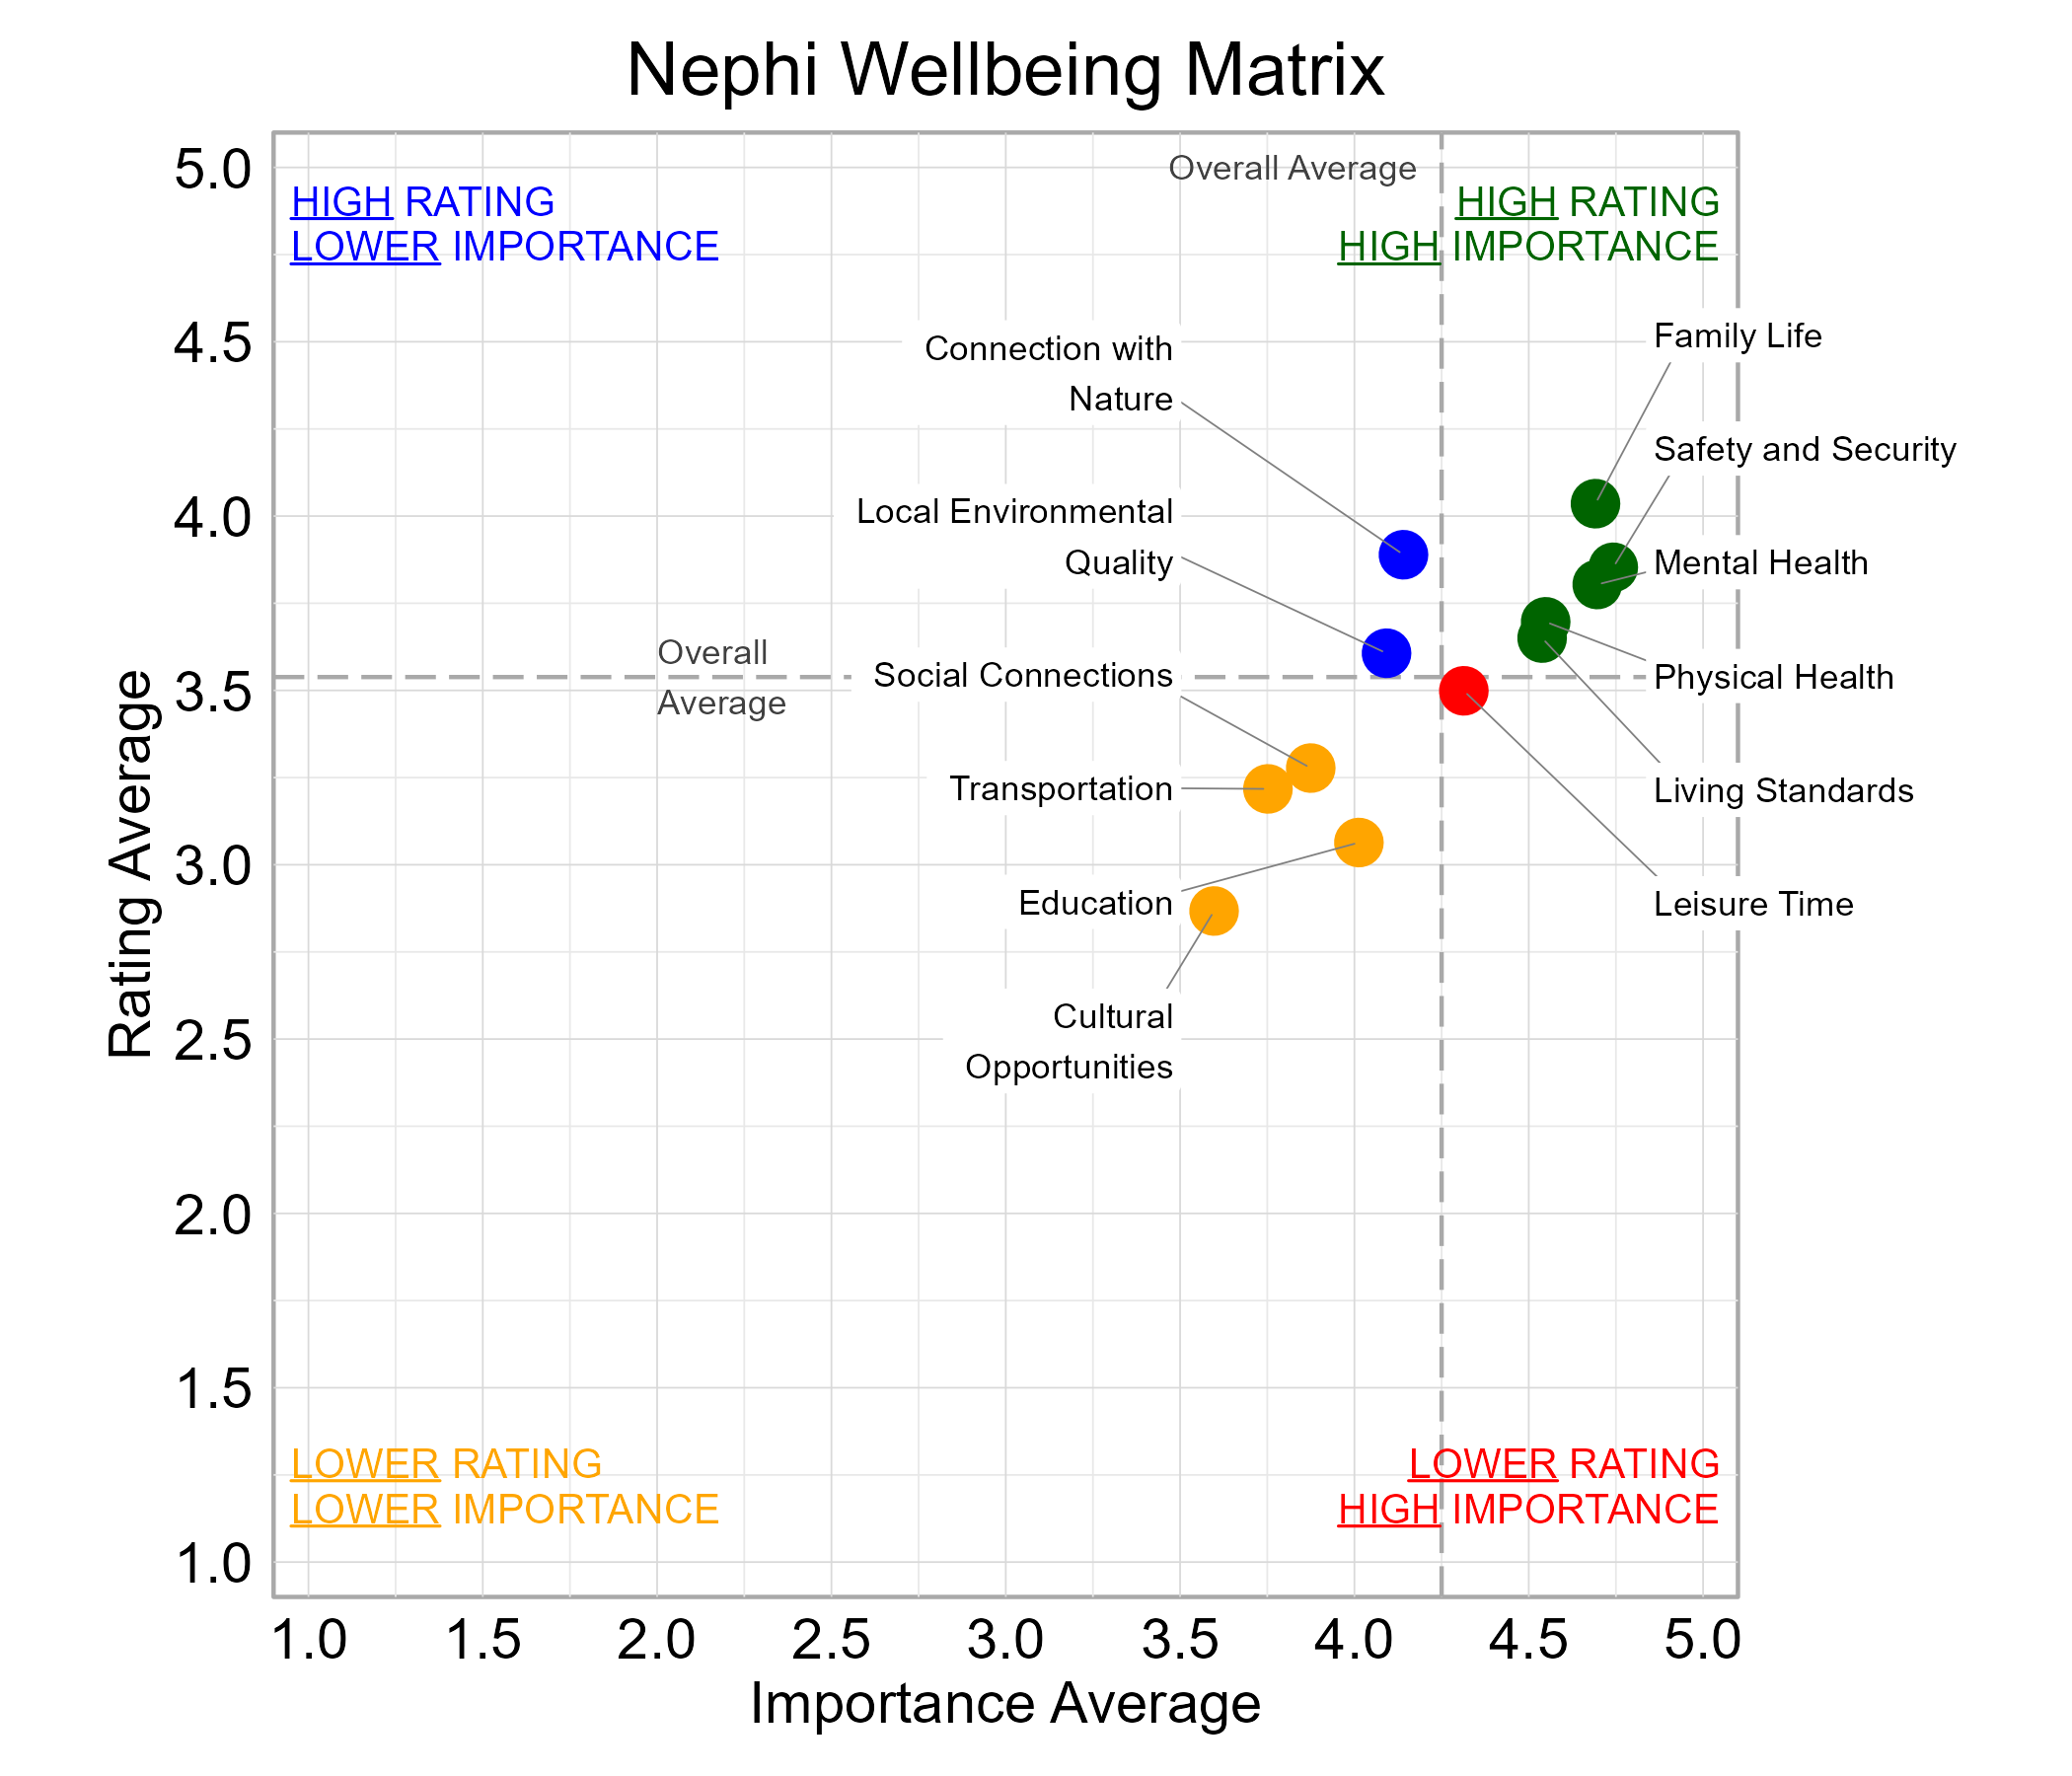
Wellbeing Matrix for Nephi
The graph below illustrates the relationship between the average rating and the average importance of wellbeing domains for survey respondents from Nephi. Family Life, Living Standards, Mental Health, Physical Health, and Safety and Security were highly important and rated above average among the domains. Leisure Time fell in the “red zone” of higher importance and lower ratings.
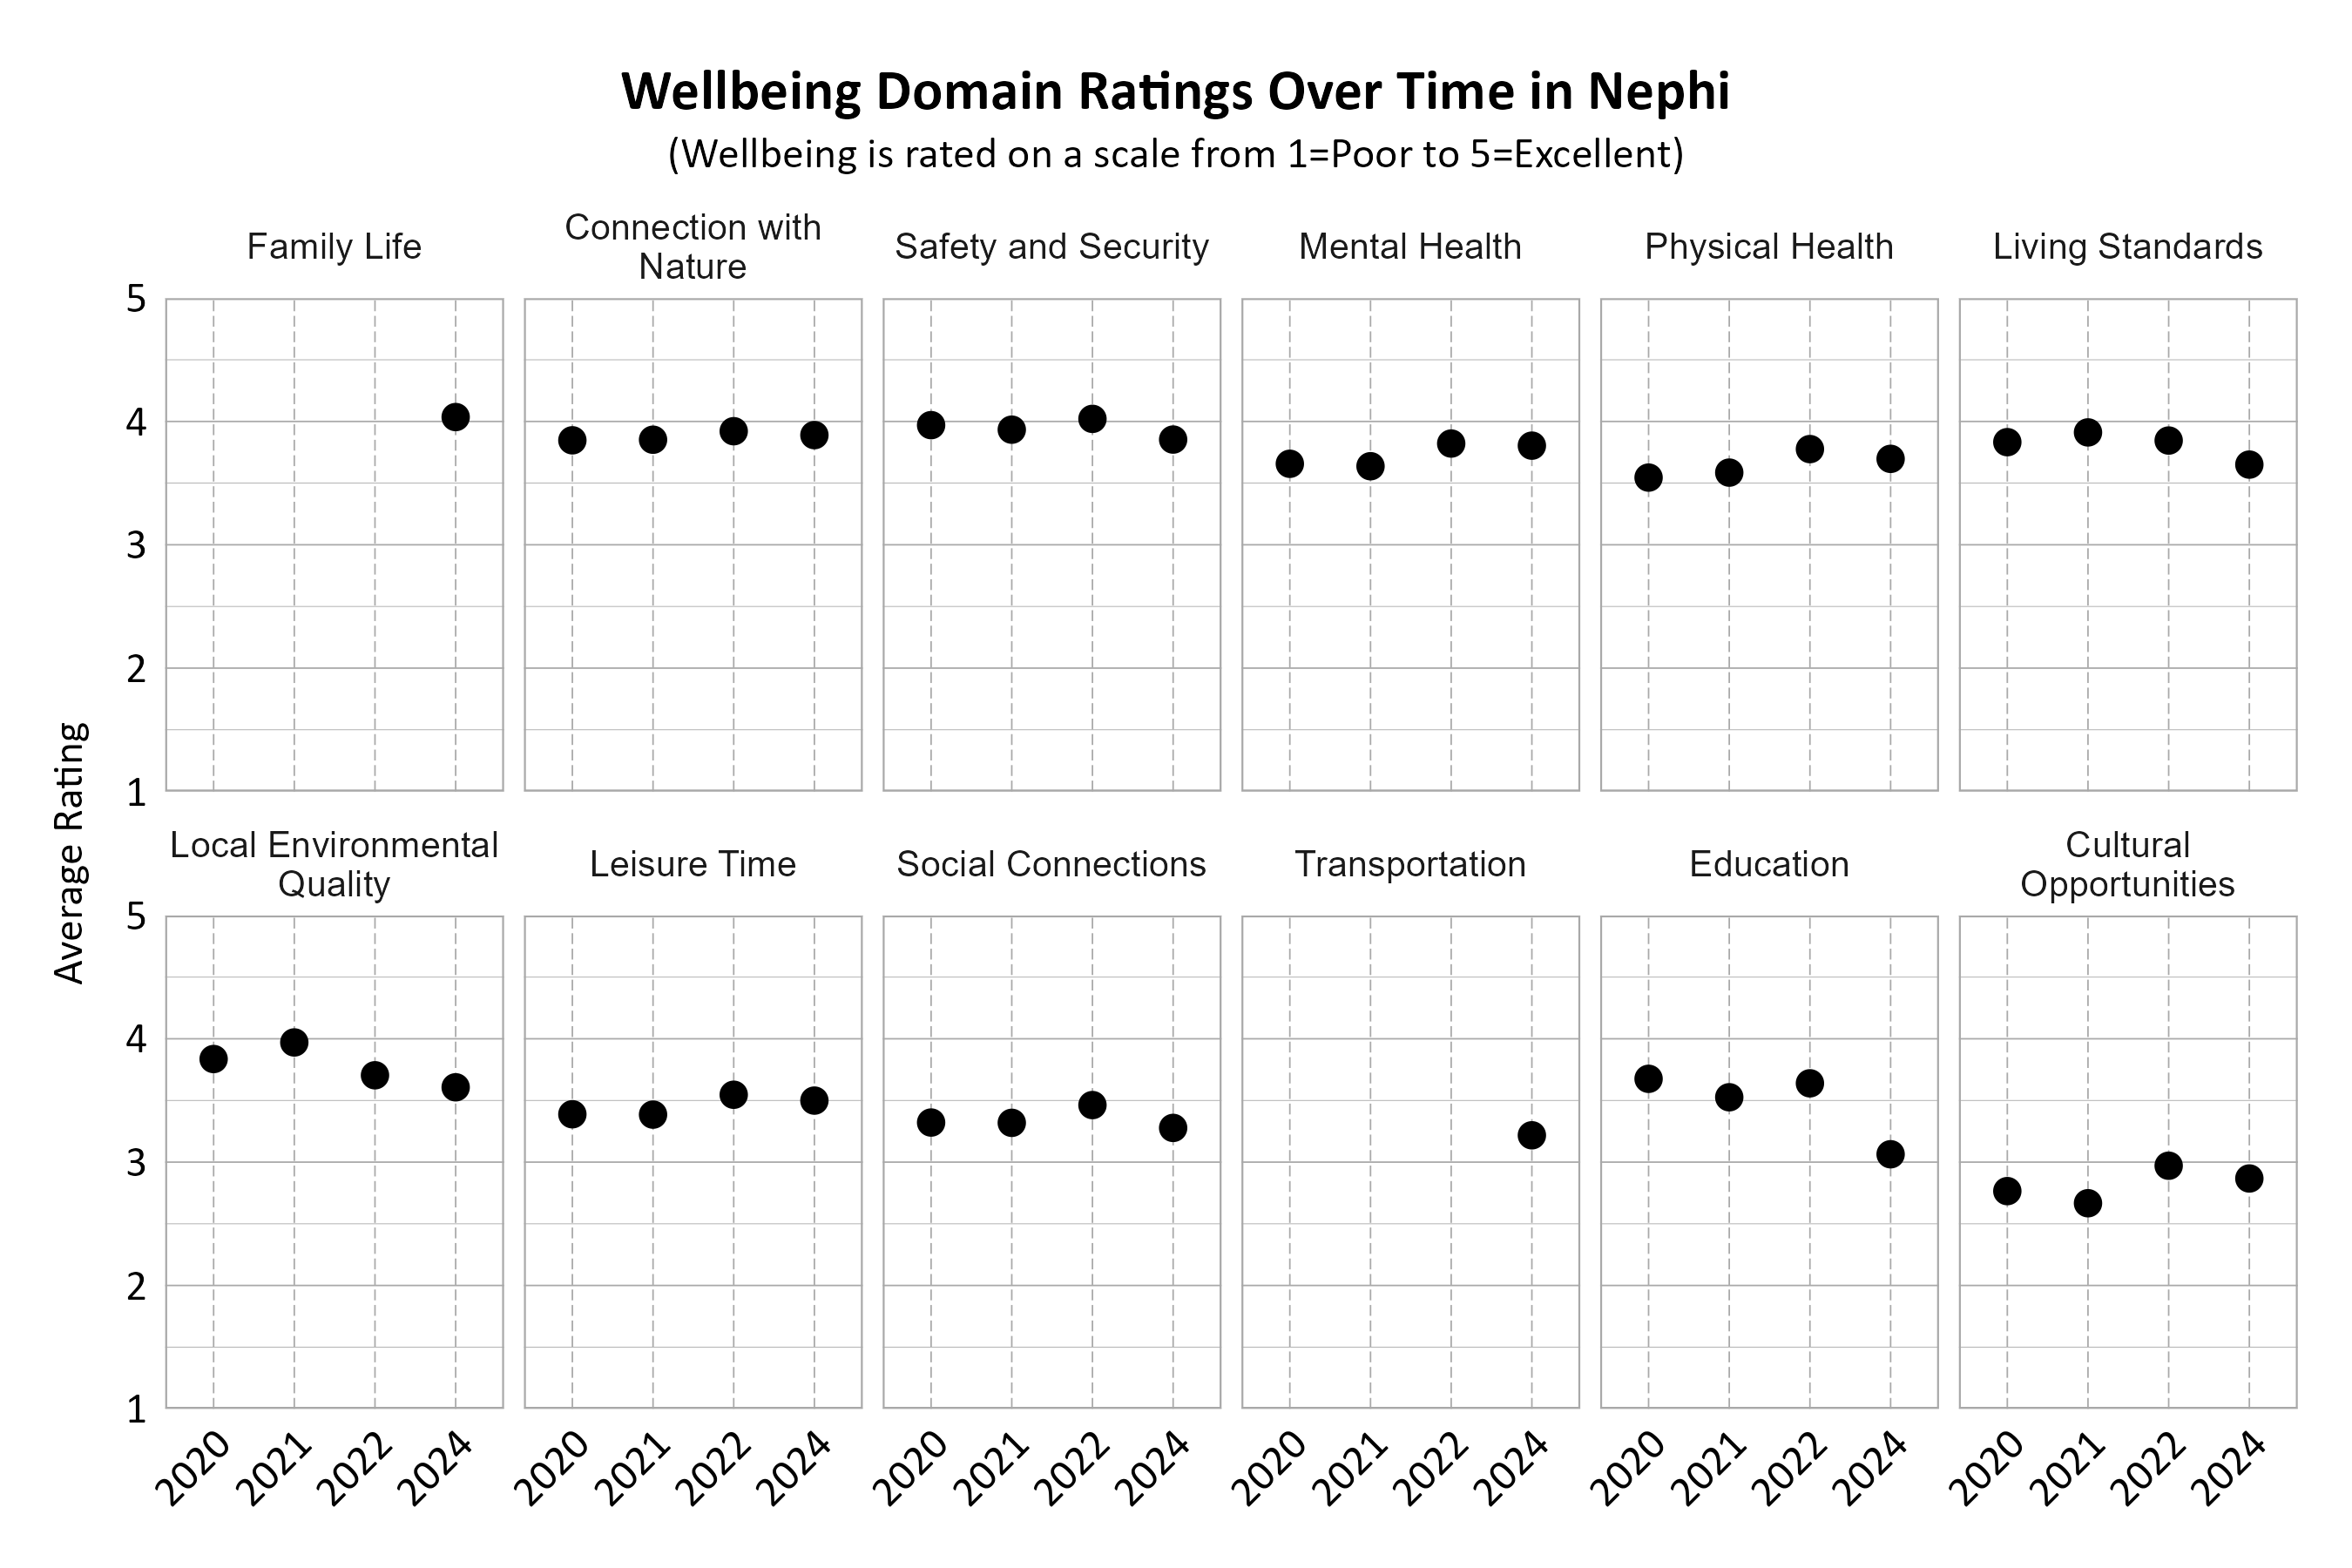
Wellbeing Domains Over Time in Nephi
The graphs below show how the domains were rated over the years by Nephi residents. The number of respondents changed over time. Note that the two domains Family Life and Transportation were new categories in the 2024 survey and were not measured in previous years. Most domains remained the same from 2022 or saw a small drop, except for Education, which saw a larger drop in its overall rating. Connection with Nature, Safety and Security were consistently among the top rated domains in each survey year, while Cultural Opportunities was among the lowest.
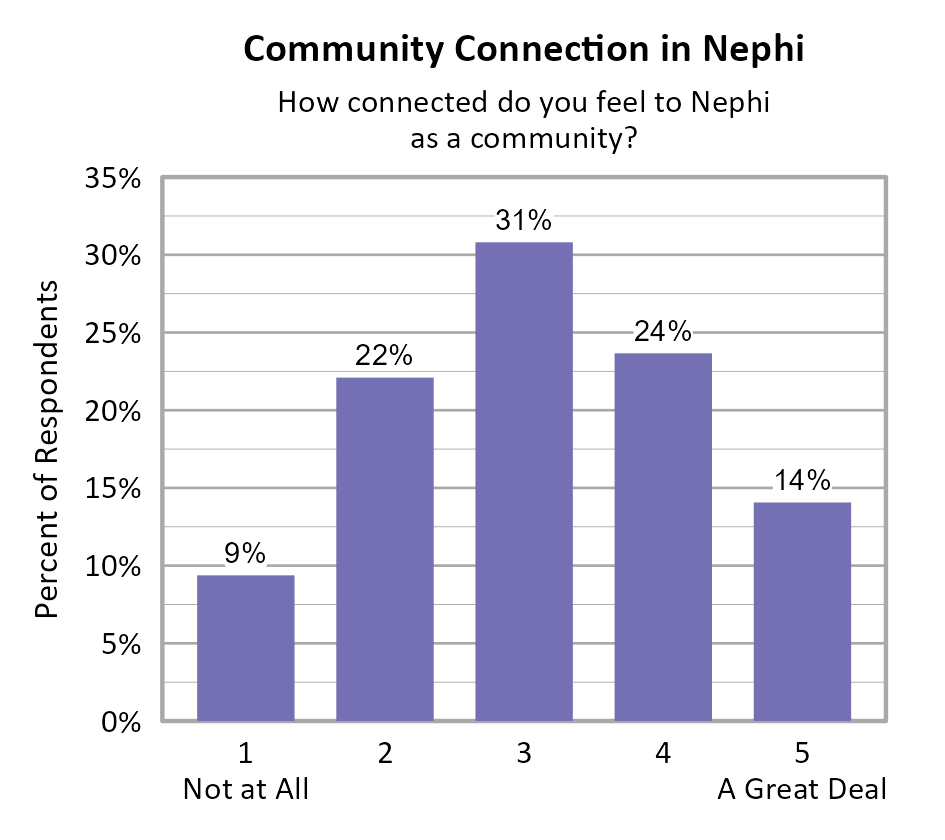
Community Connection in Nephi
Survey participants were asked about how connected they feel to Nephi on a 5-point scale from not at all (1) to a great deal (5), and the average score of all respondents was 3.11.
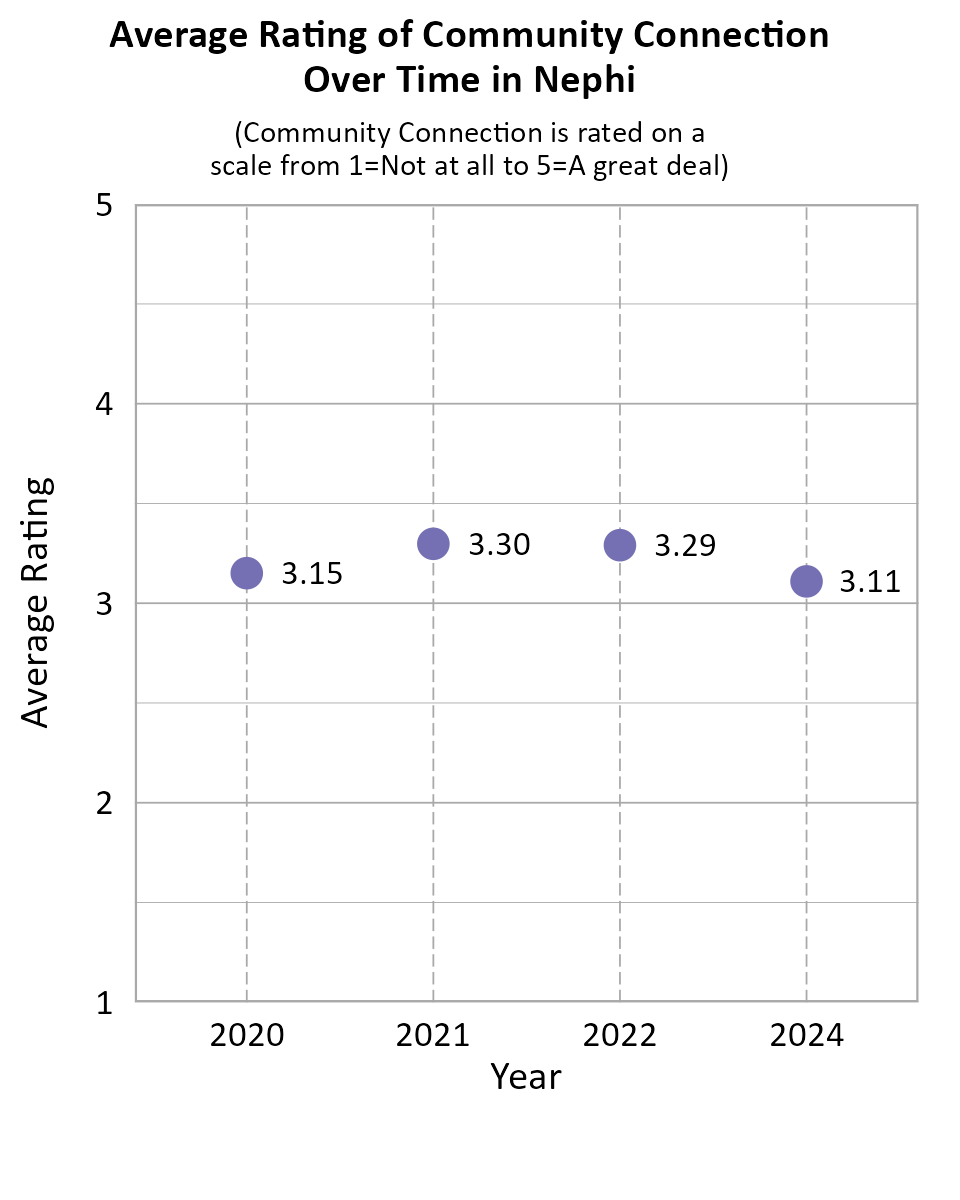
When comparing survey data from Nephi over the years as shown in the information below, we can see that the average community connection score improved between 2020 and 2021, and remained nearly the same between 2021 and 2022, and declined between 2022 and 2024.
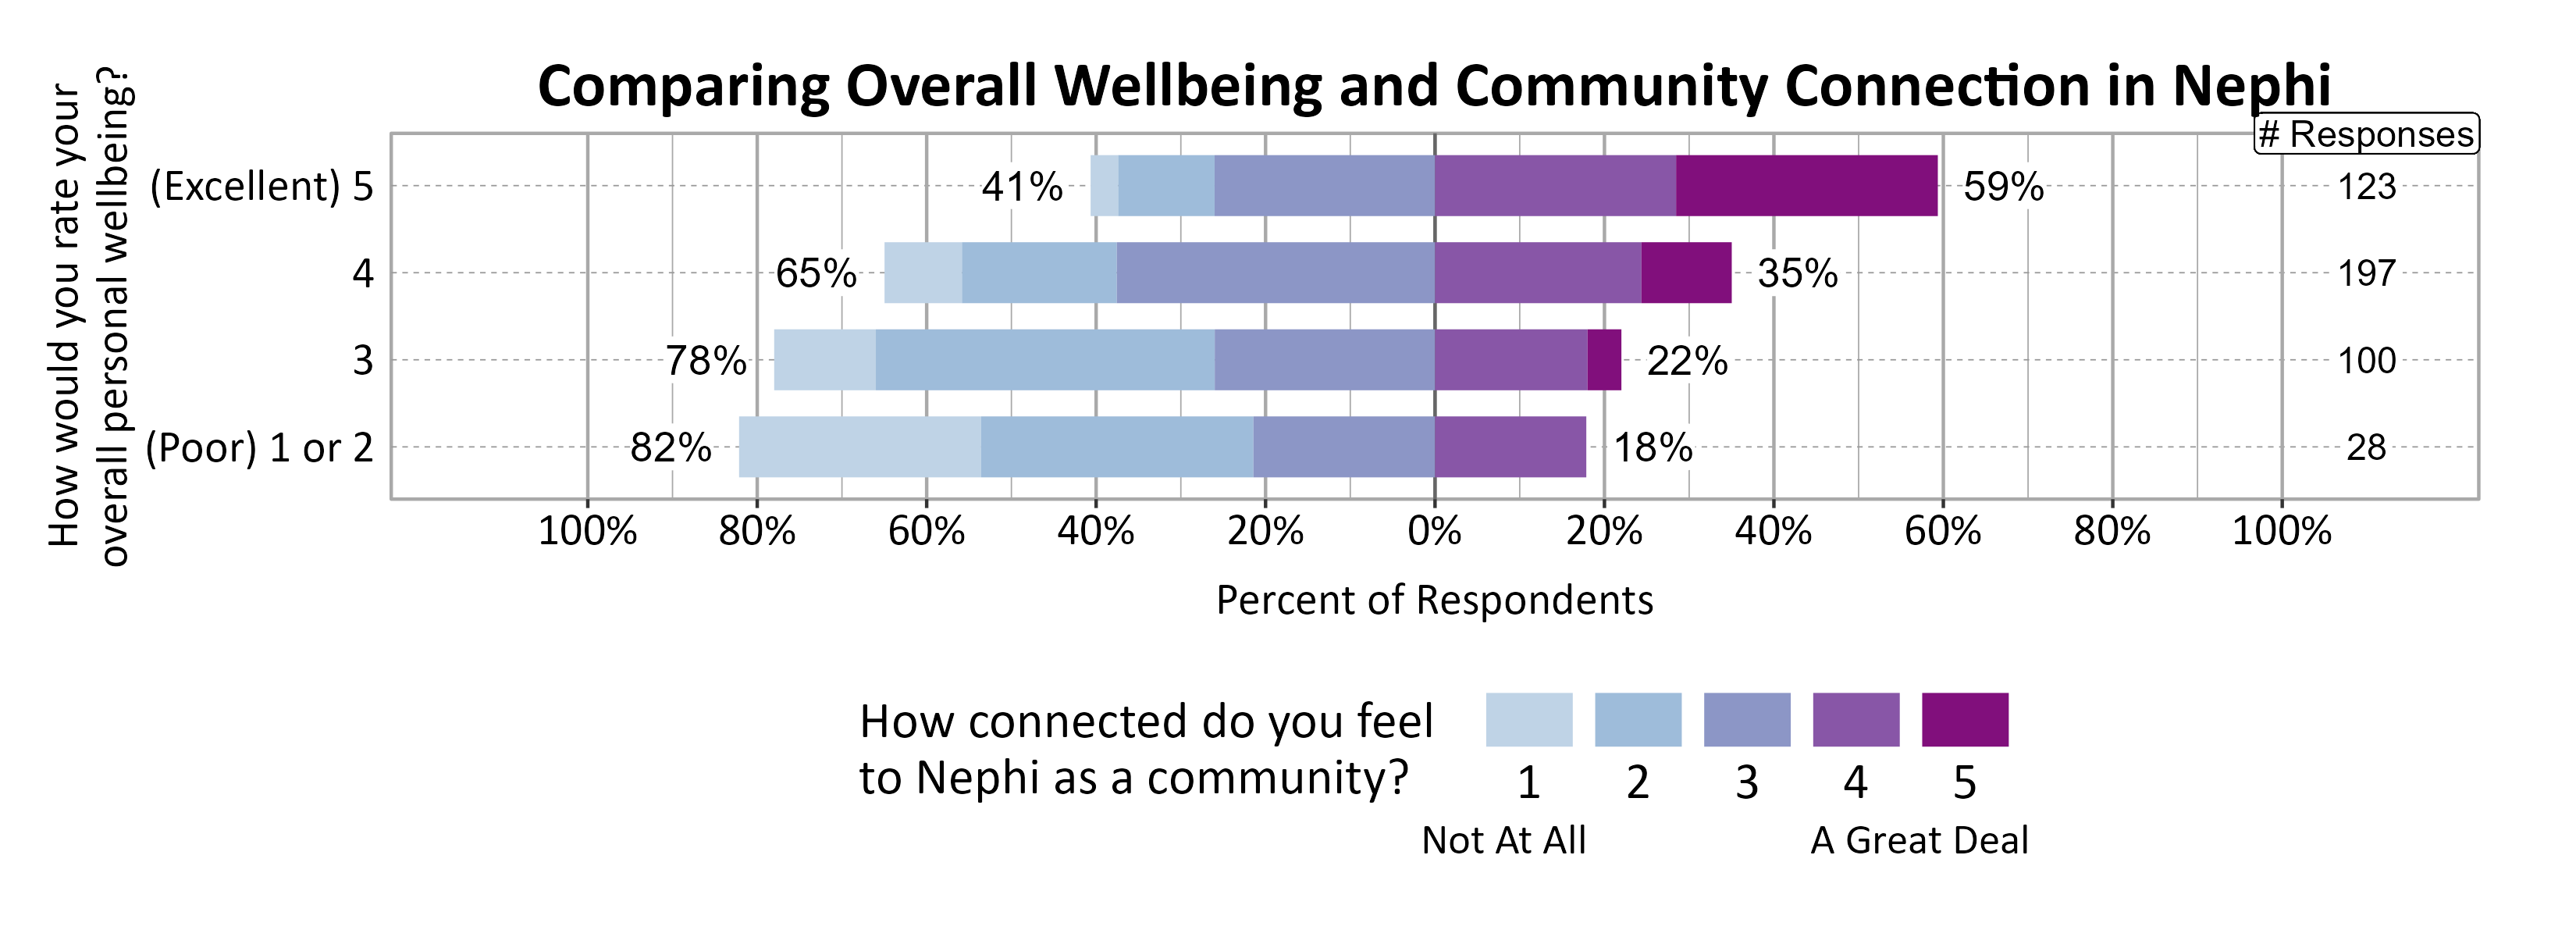
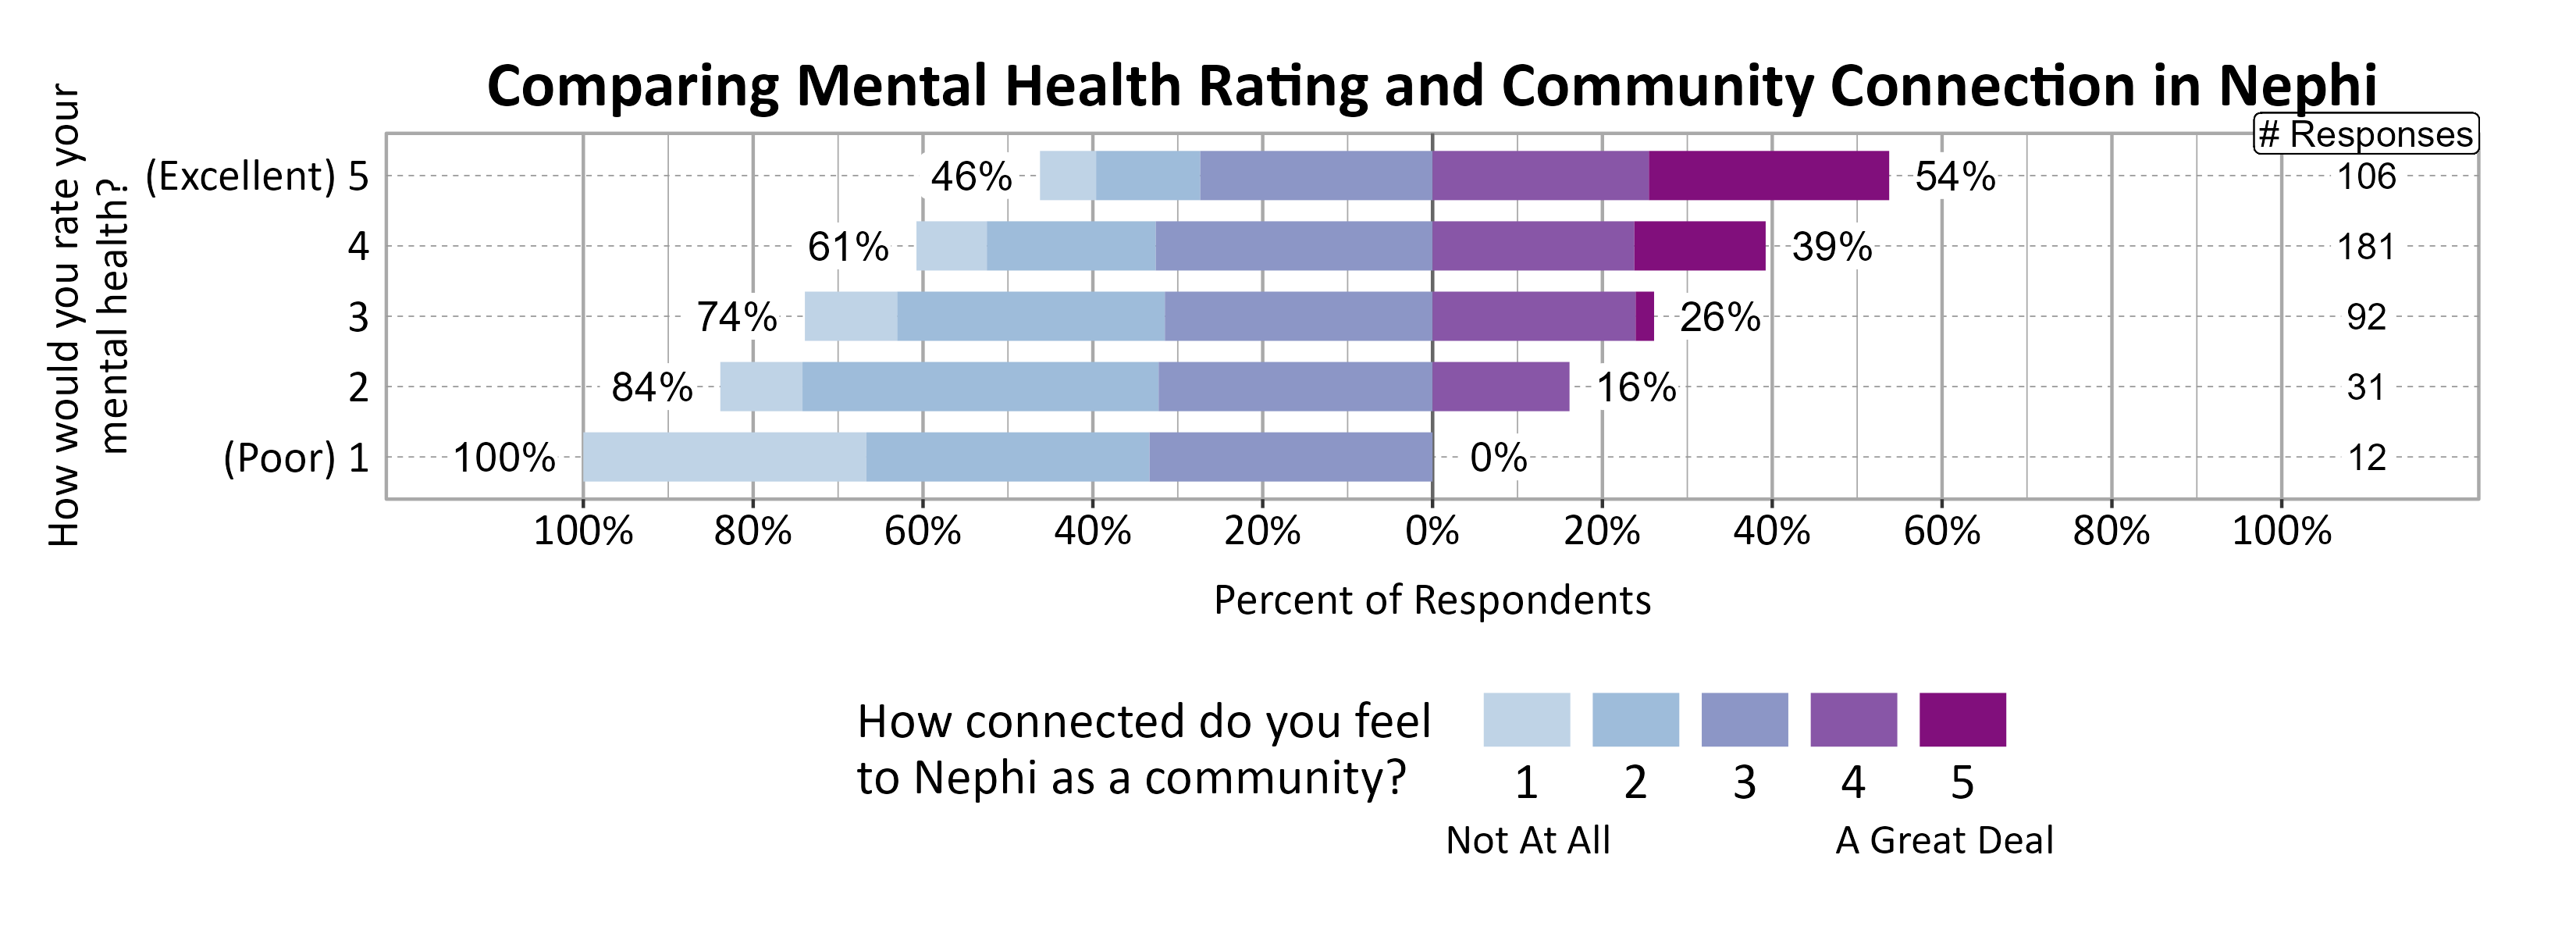
A positive relationship was found between individuals’ community connection and overall personal wellbeing as well as mental health.
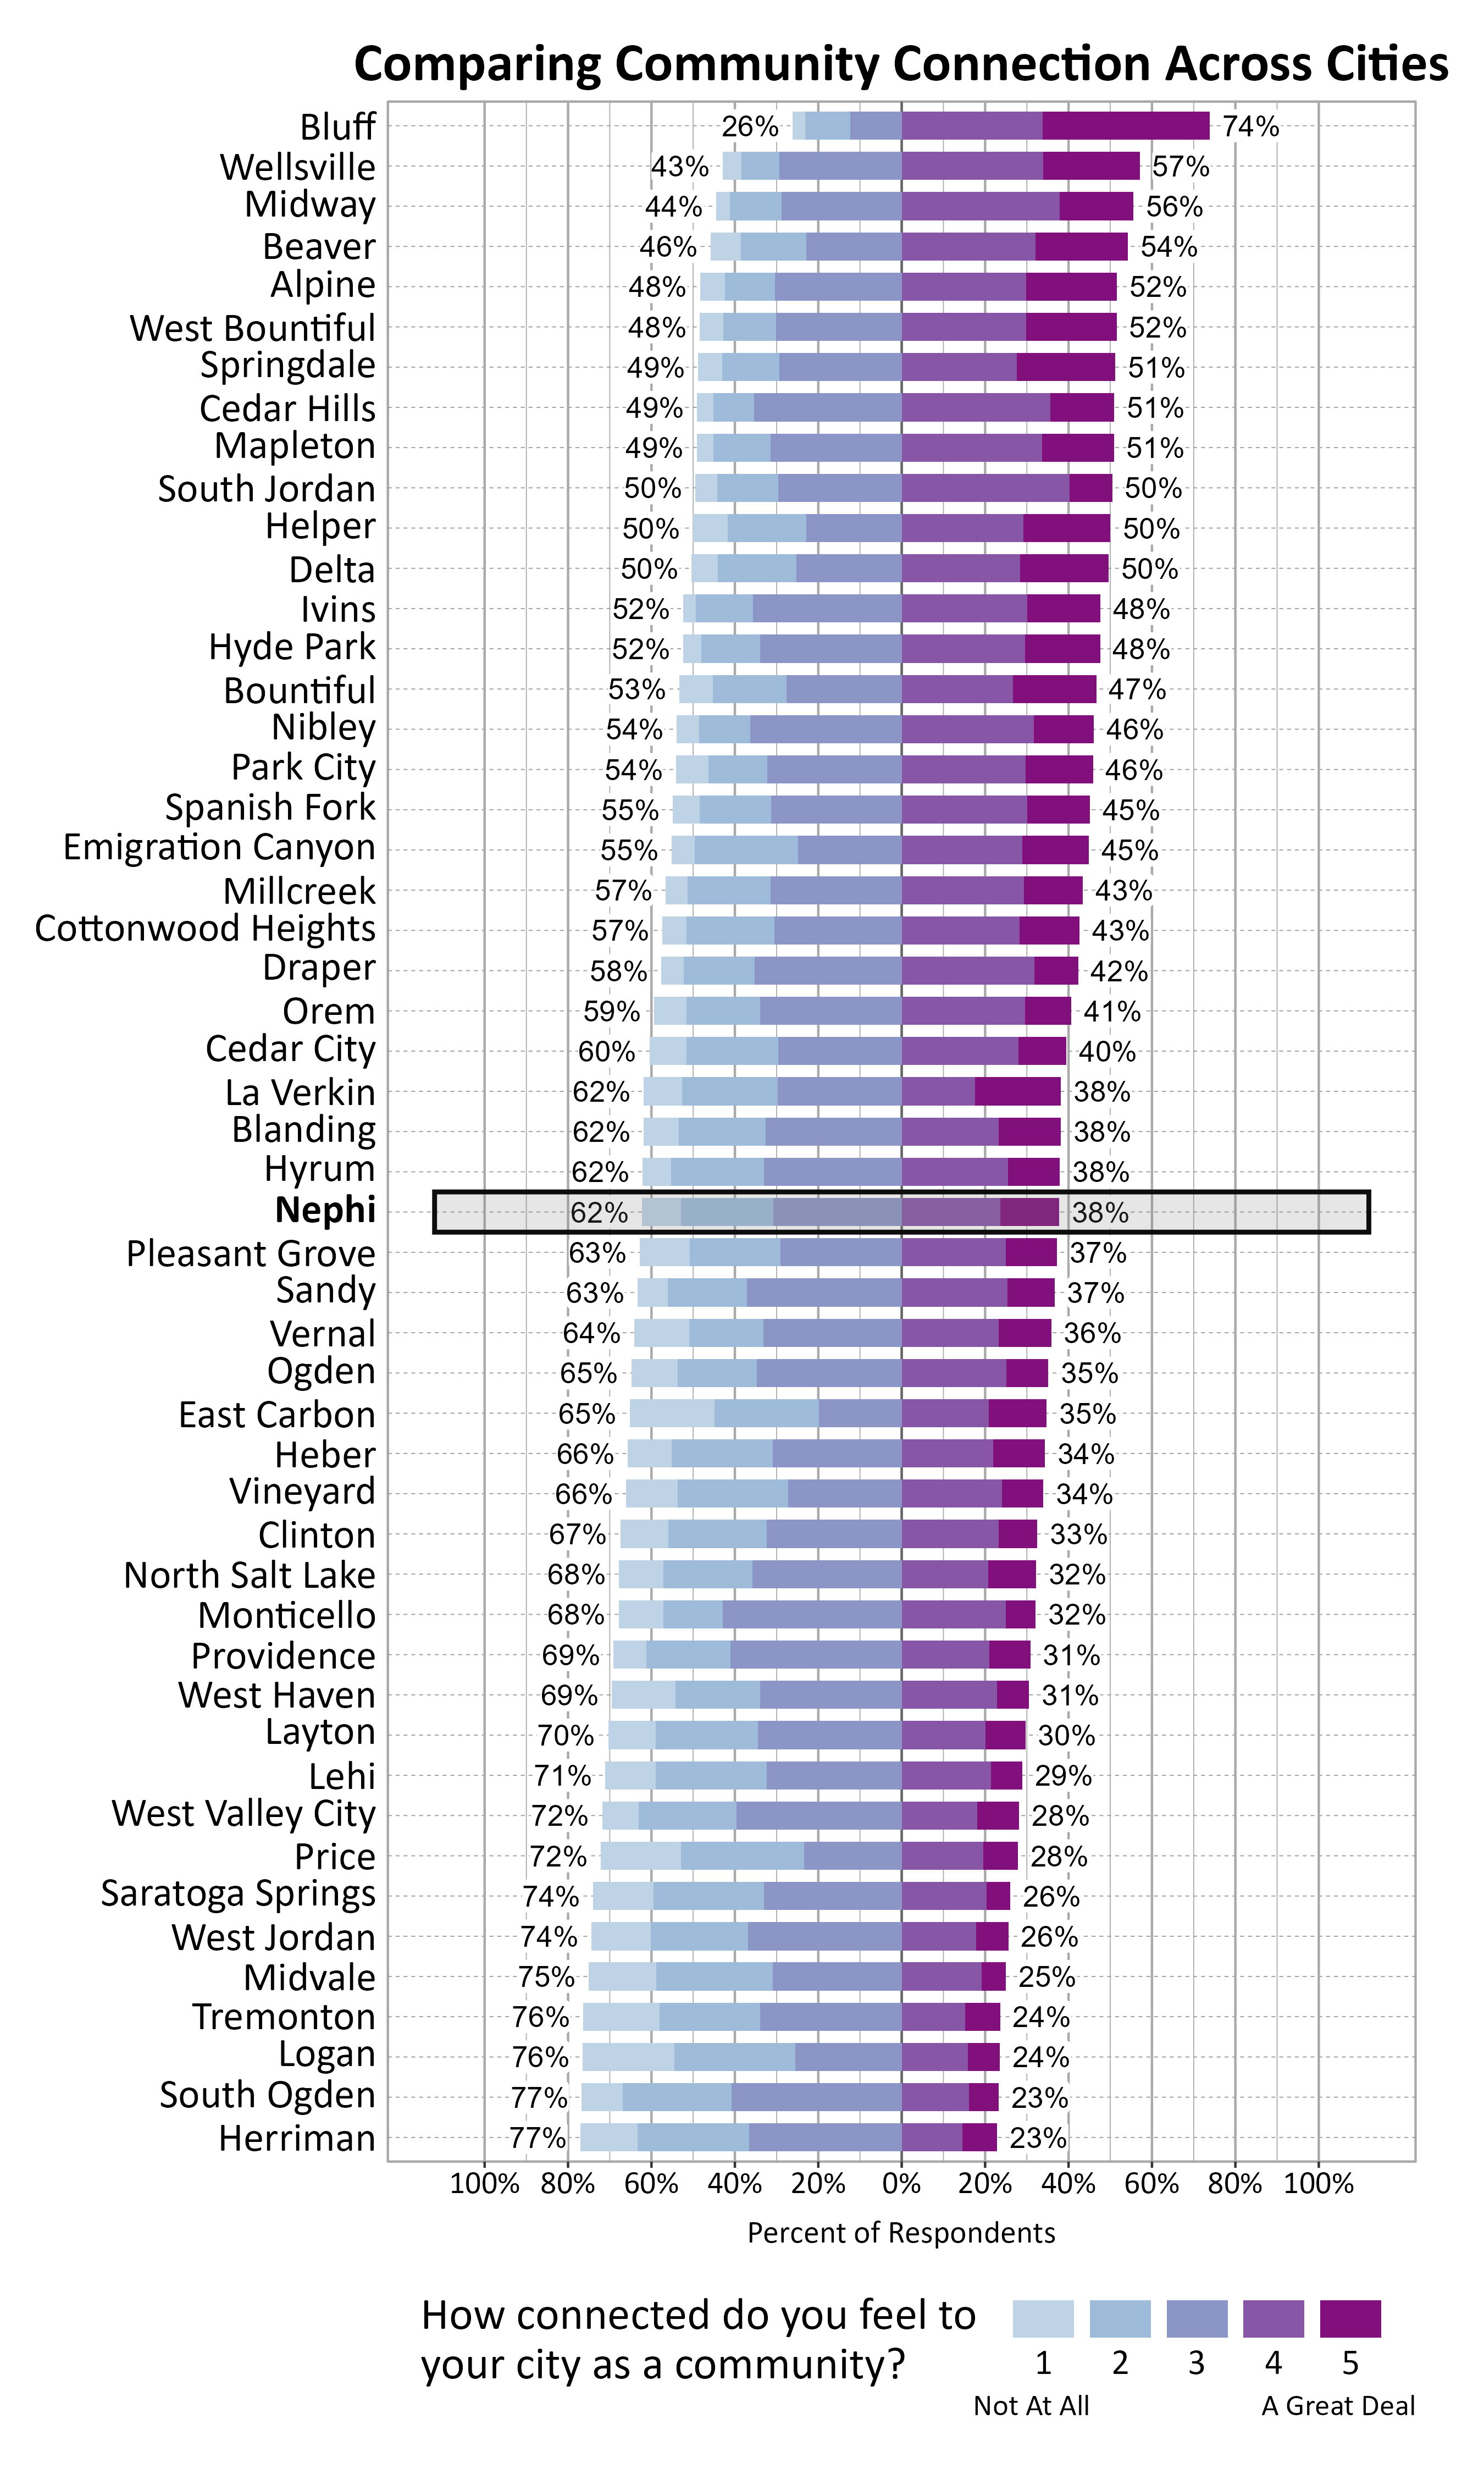
The graph below shows how Wellbeing Project cities and towns compare on feelings of community connection based on the percentage of respondents who answered 4 or a 5 on a 5-point scale from “not at all” to “a great deal” connected to their city or town. Nephi ranked 28 out of the 51 cities that participated.
Participation in Recreation and Nature-Related Activities
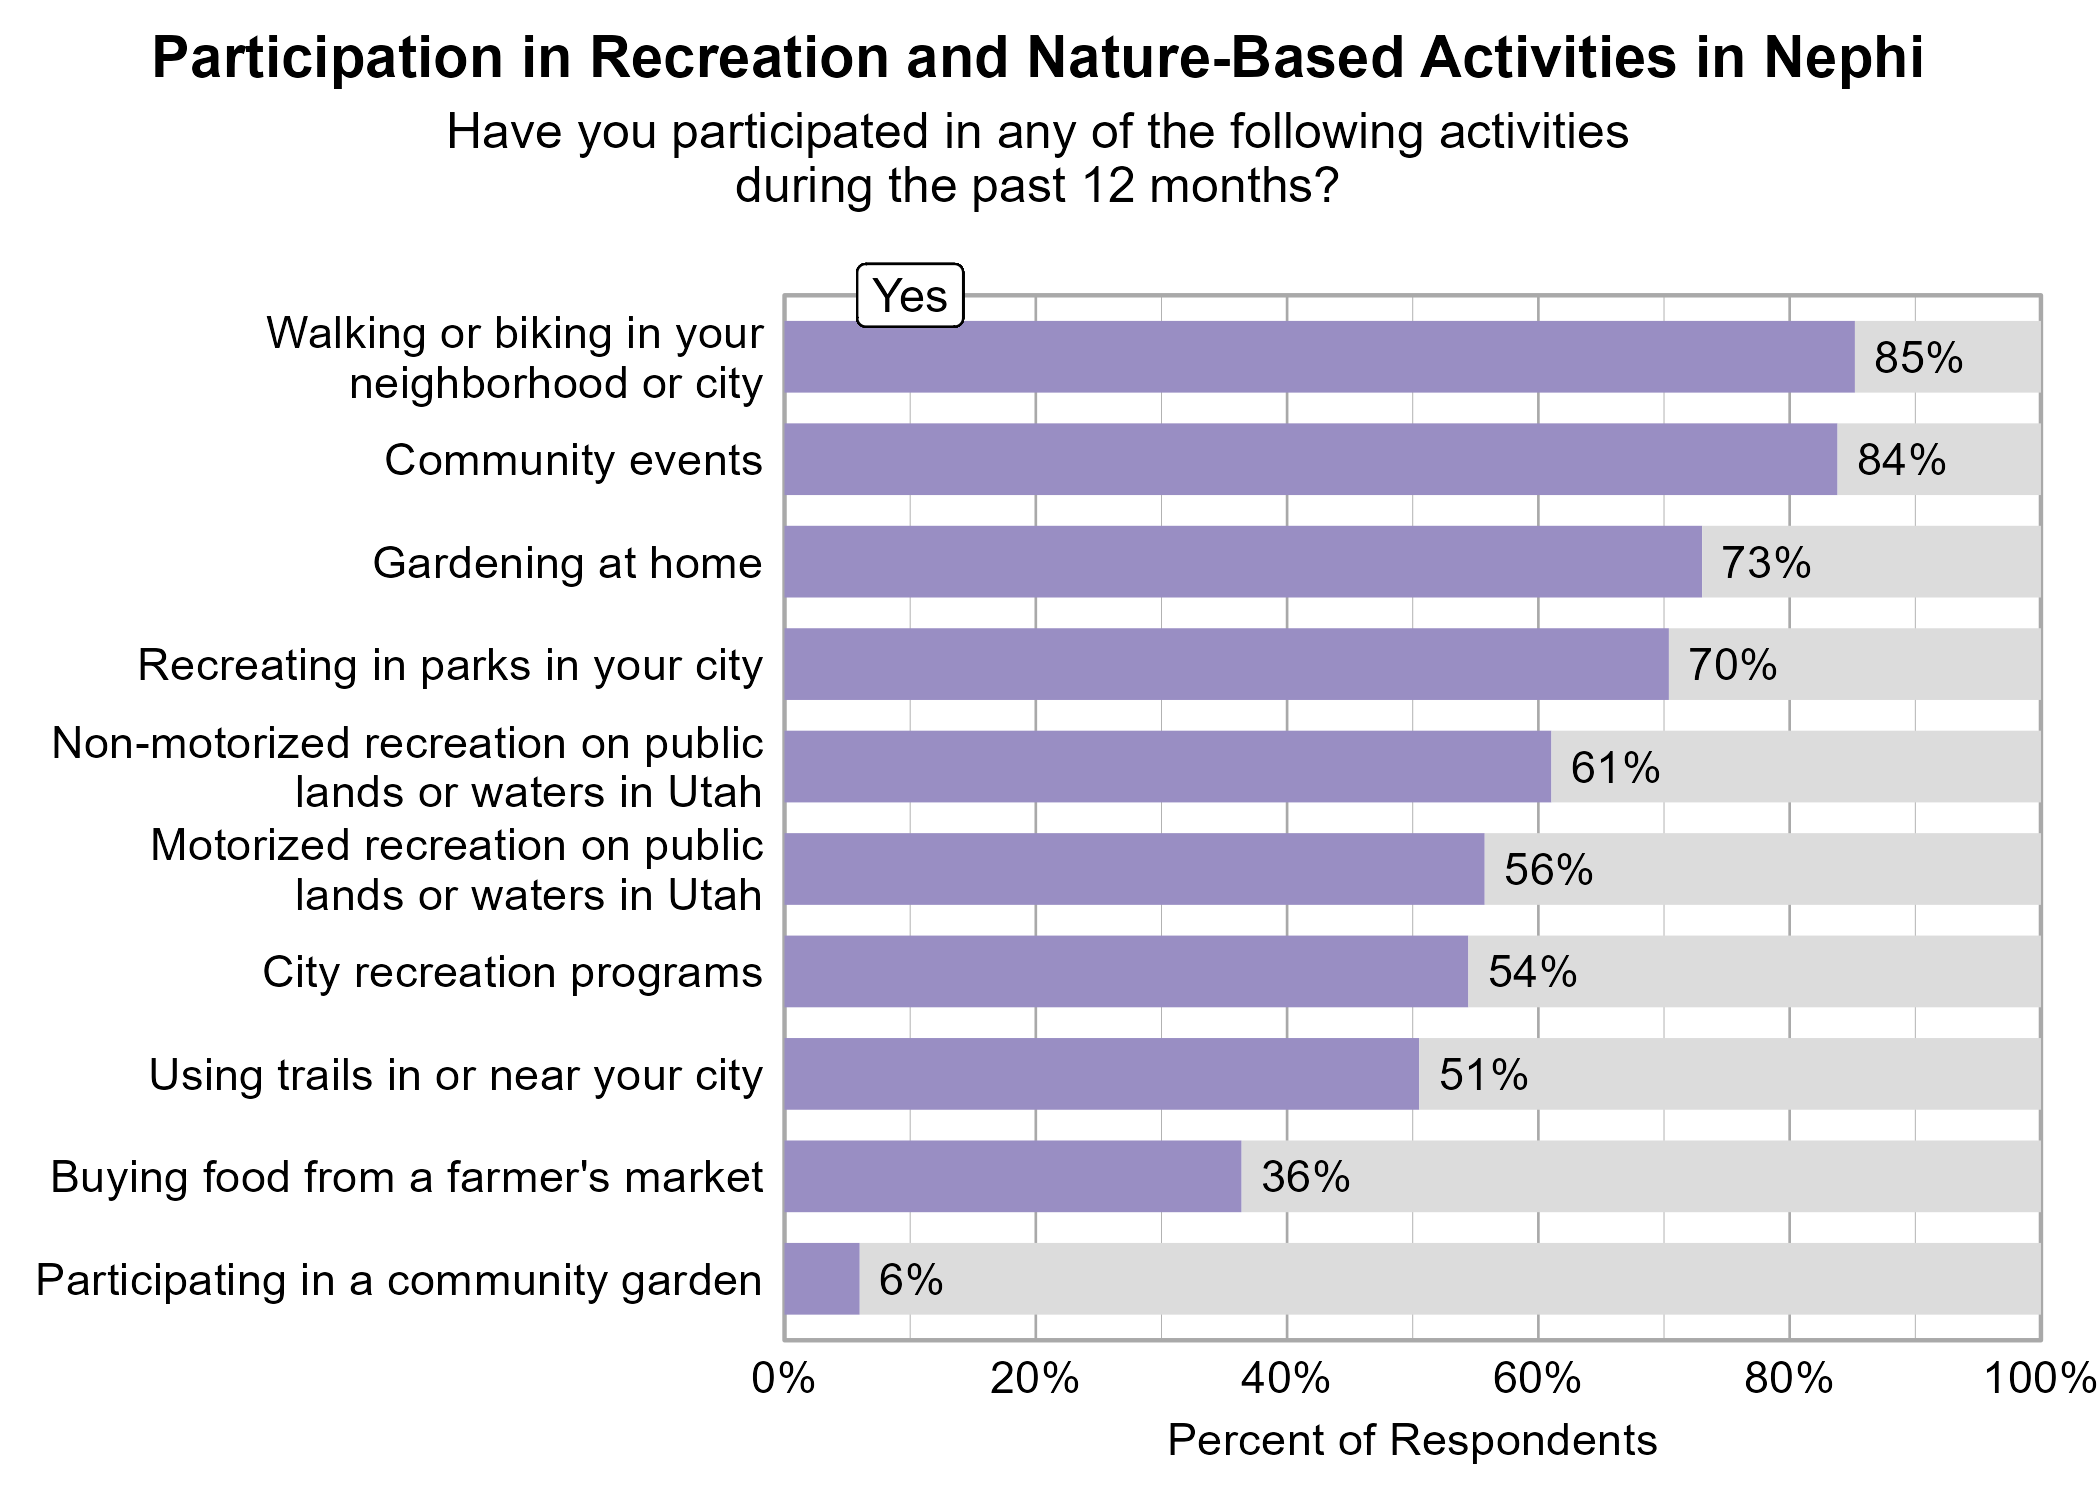
Respondents were asked to indicate whether or not they participated in various activities in the last 12 months. The most popular activities were walking or biking in your neighborhood or city (85%), community events (84%), and gardening at home (73%).
Participating in city recreation programs, participating in community events, non-motorized recreation on public lands or waters in Utah, recreating in parks in your city, using trails in or near your city, and walking or biking in your neighborhood or city were significantly related to higher ratings of personal wellbeing.
Participating in community events, recreating in parks in your city, and walking or biking in your neighborhood or city were significantly related to higher ratings of community wellbeing.
Participating in city recreation programs, participating in community events, non-motorized recreation on public lands or waters in Utah, recreating in parks in your city, and walking or biking in your neighborhood or city were significantly related to higher ratings of community connection.
Perspectives on Population Growth and Economic Development
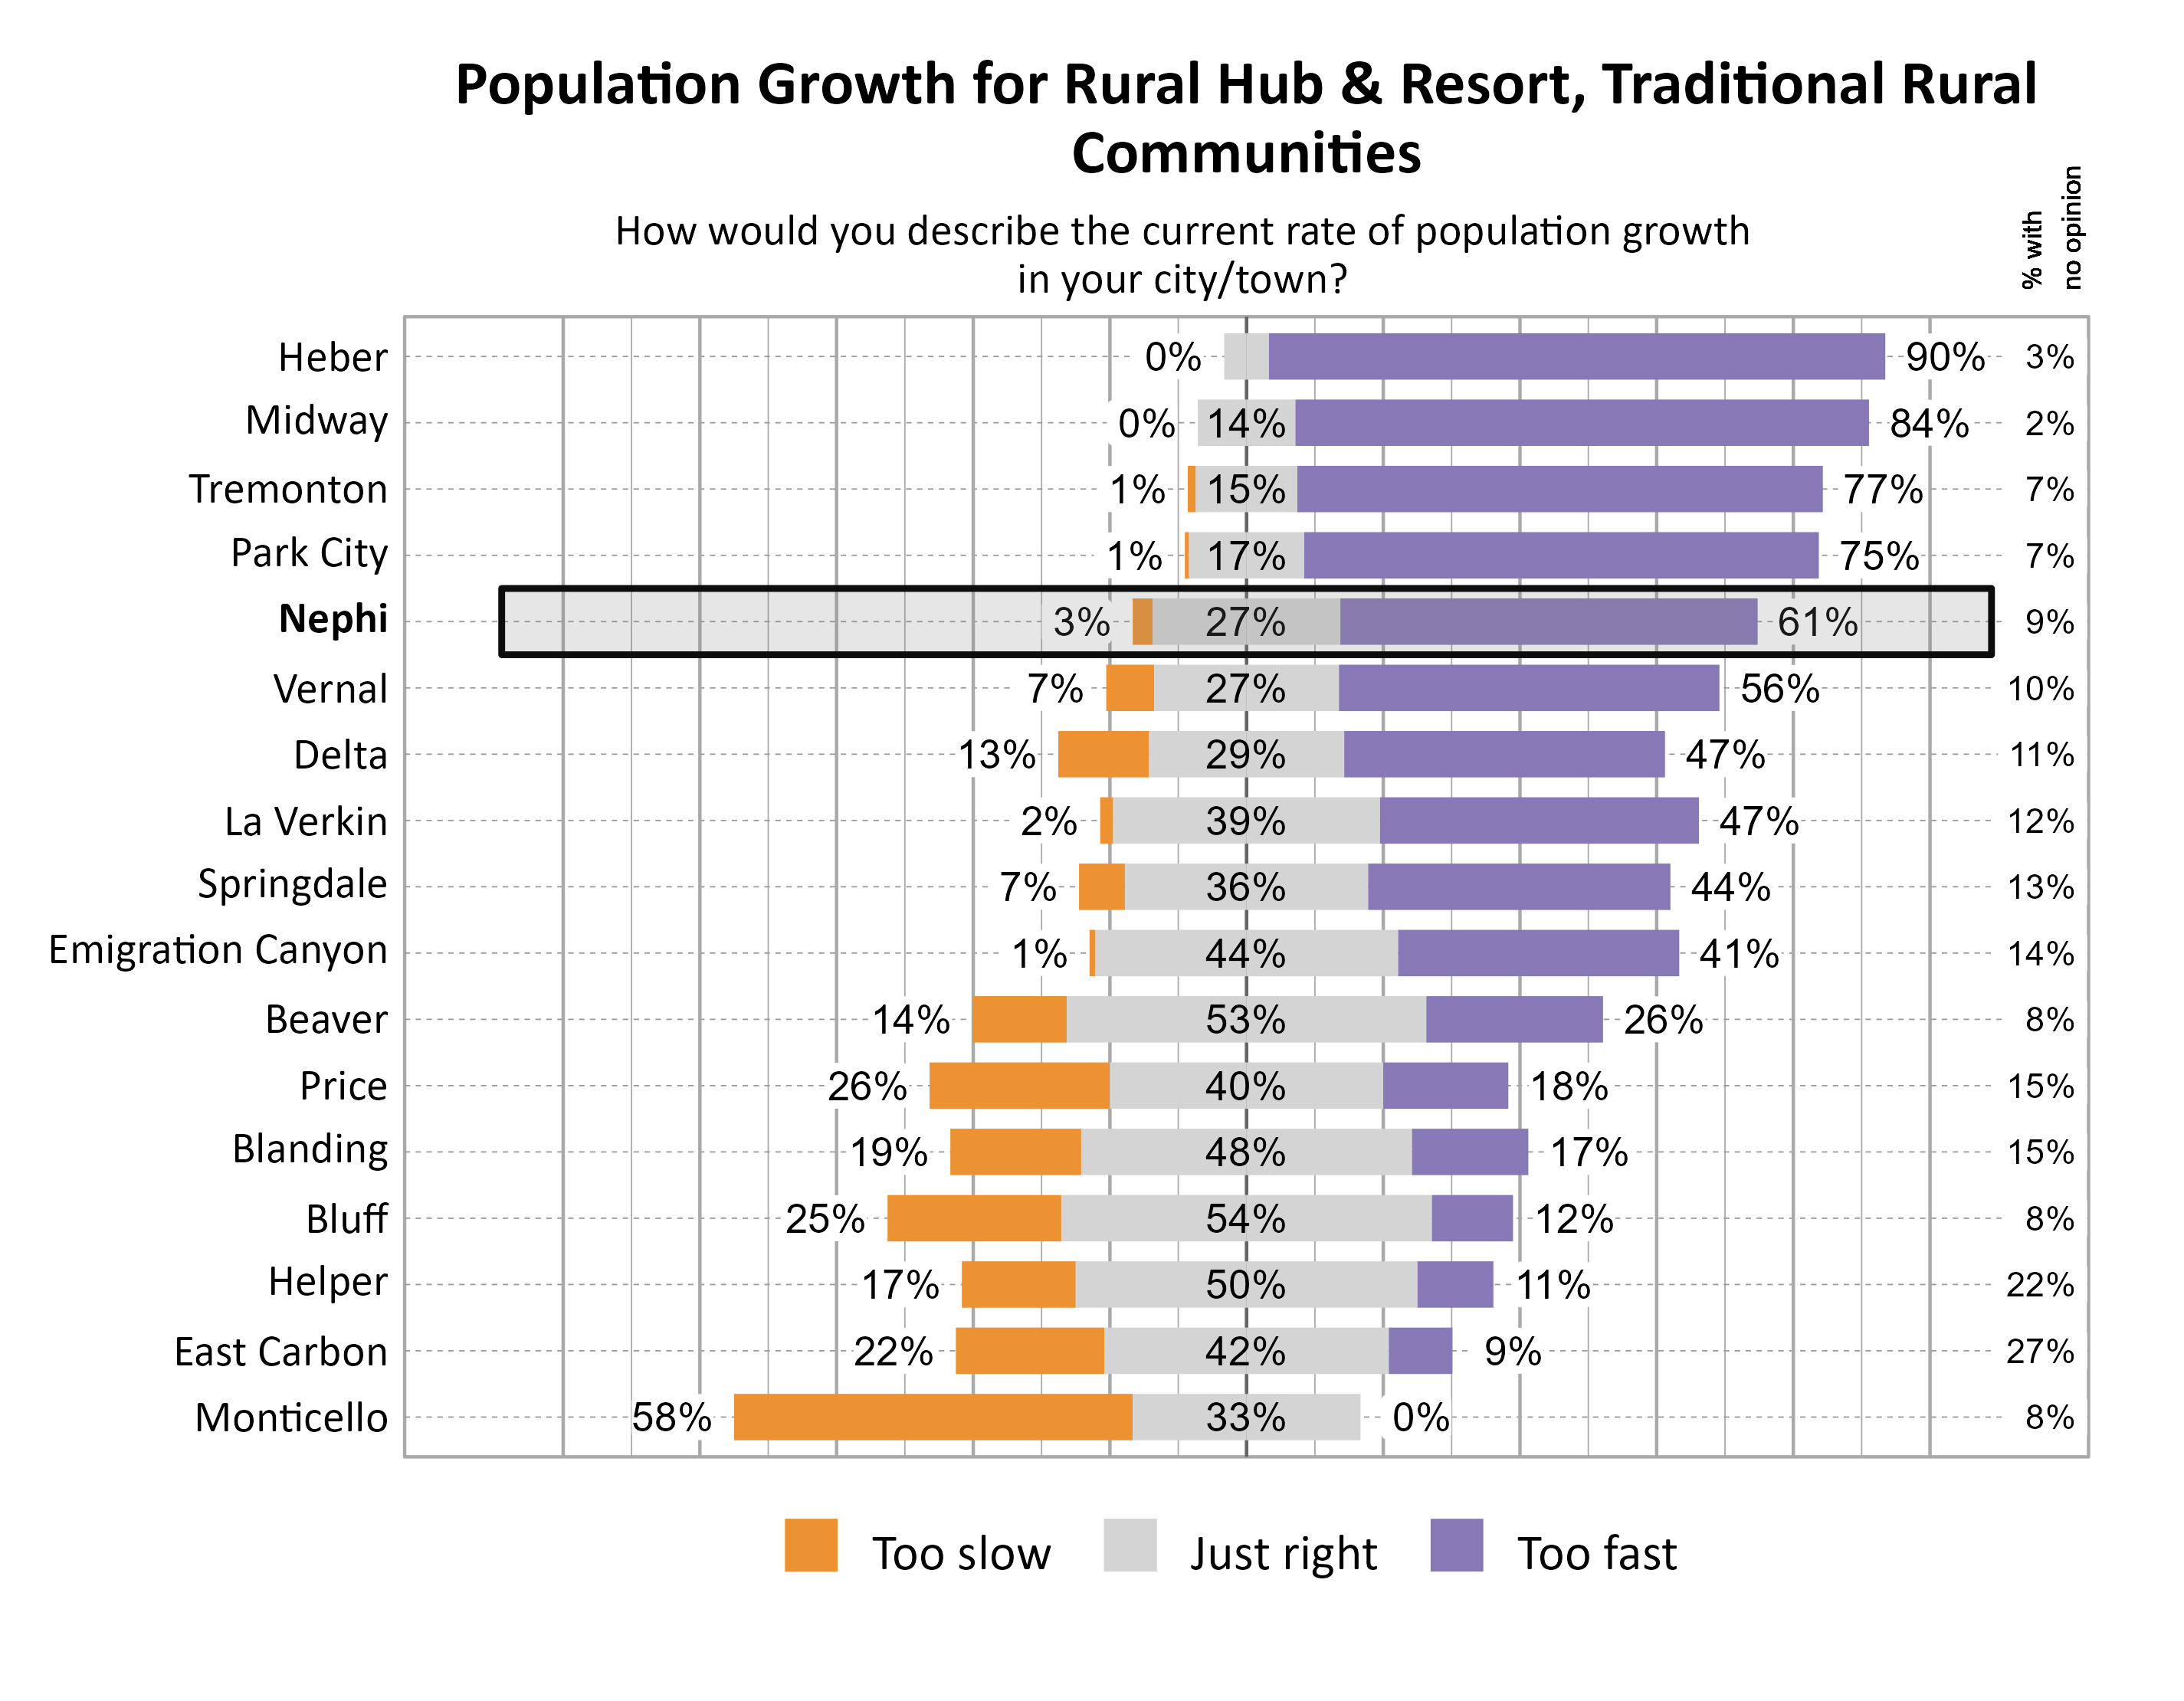
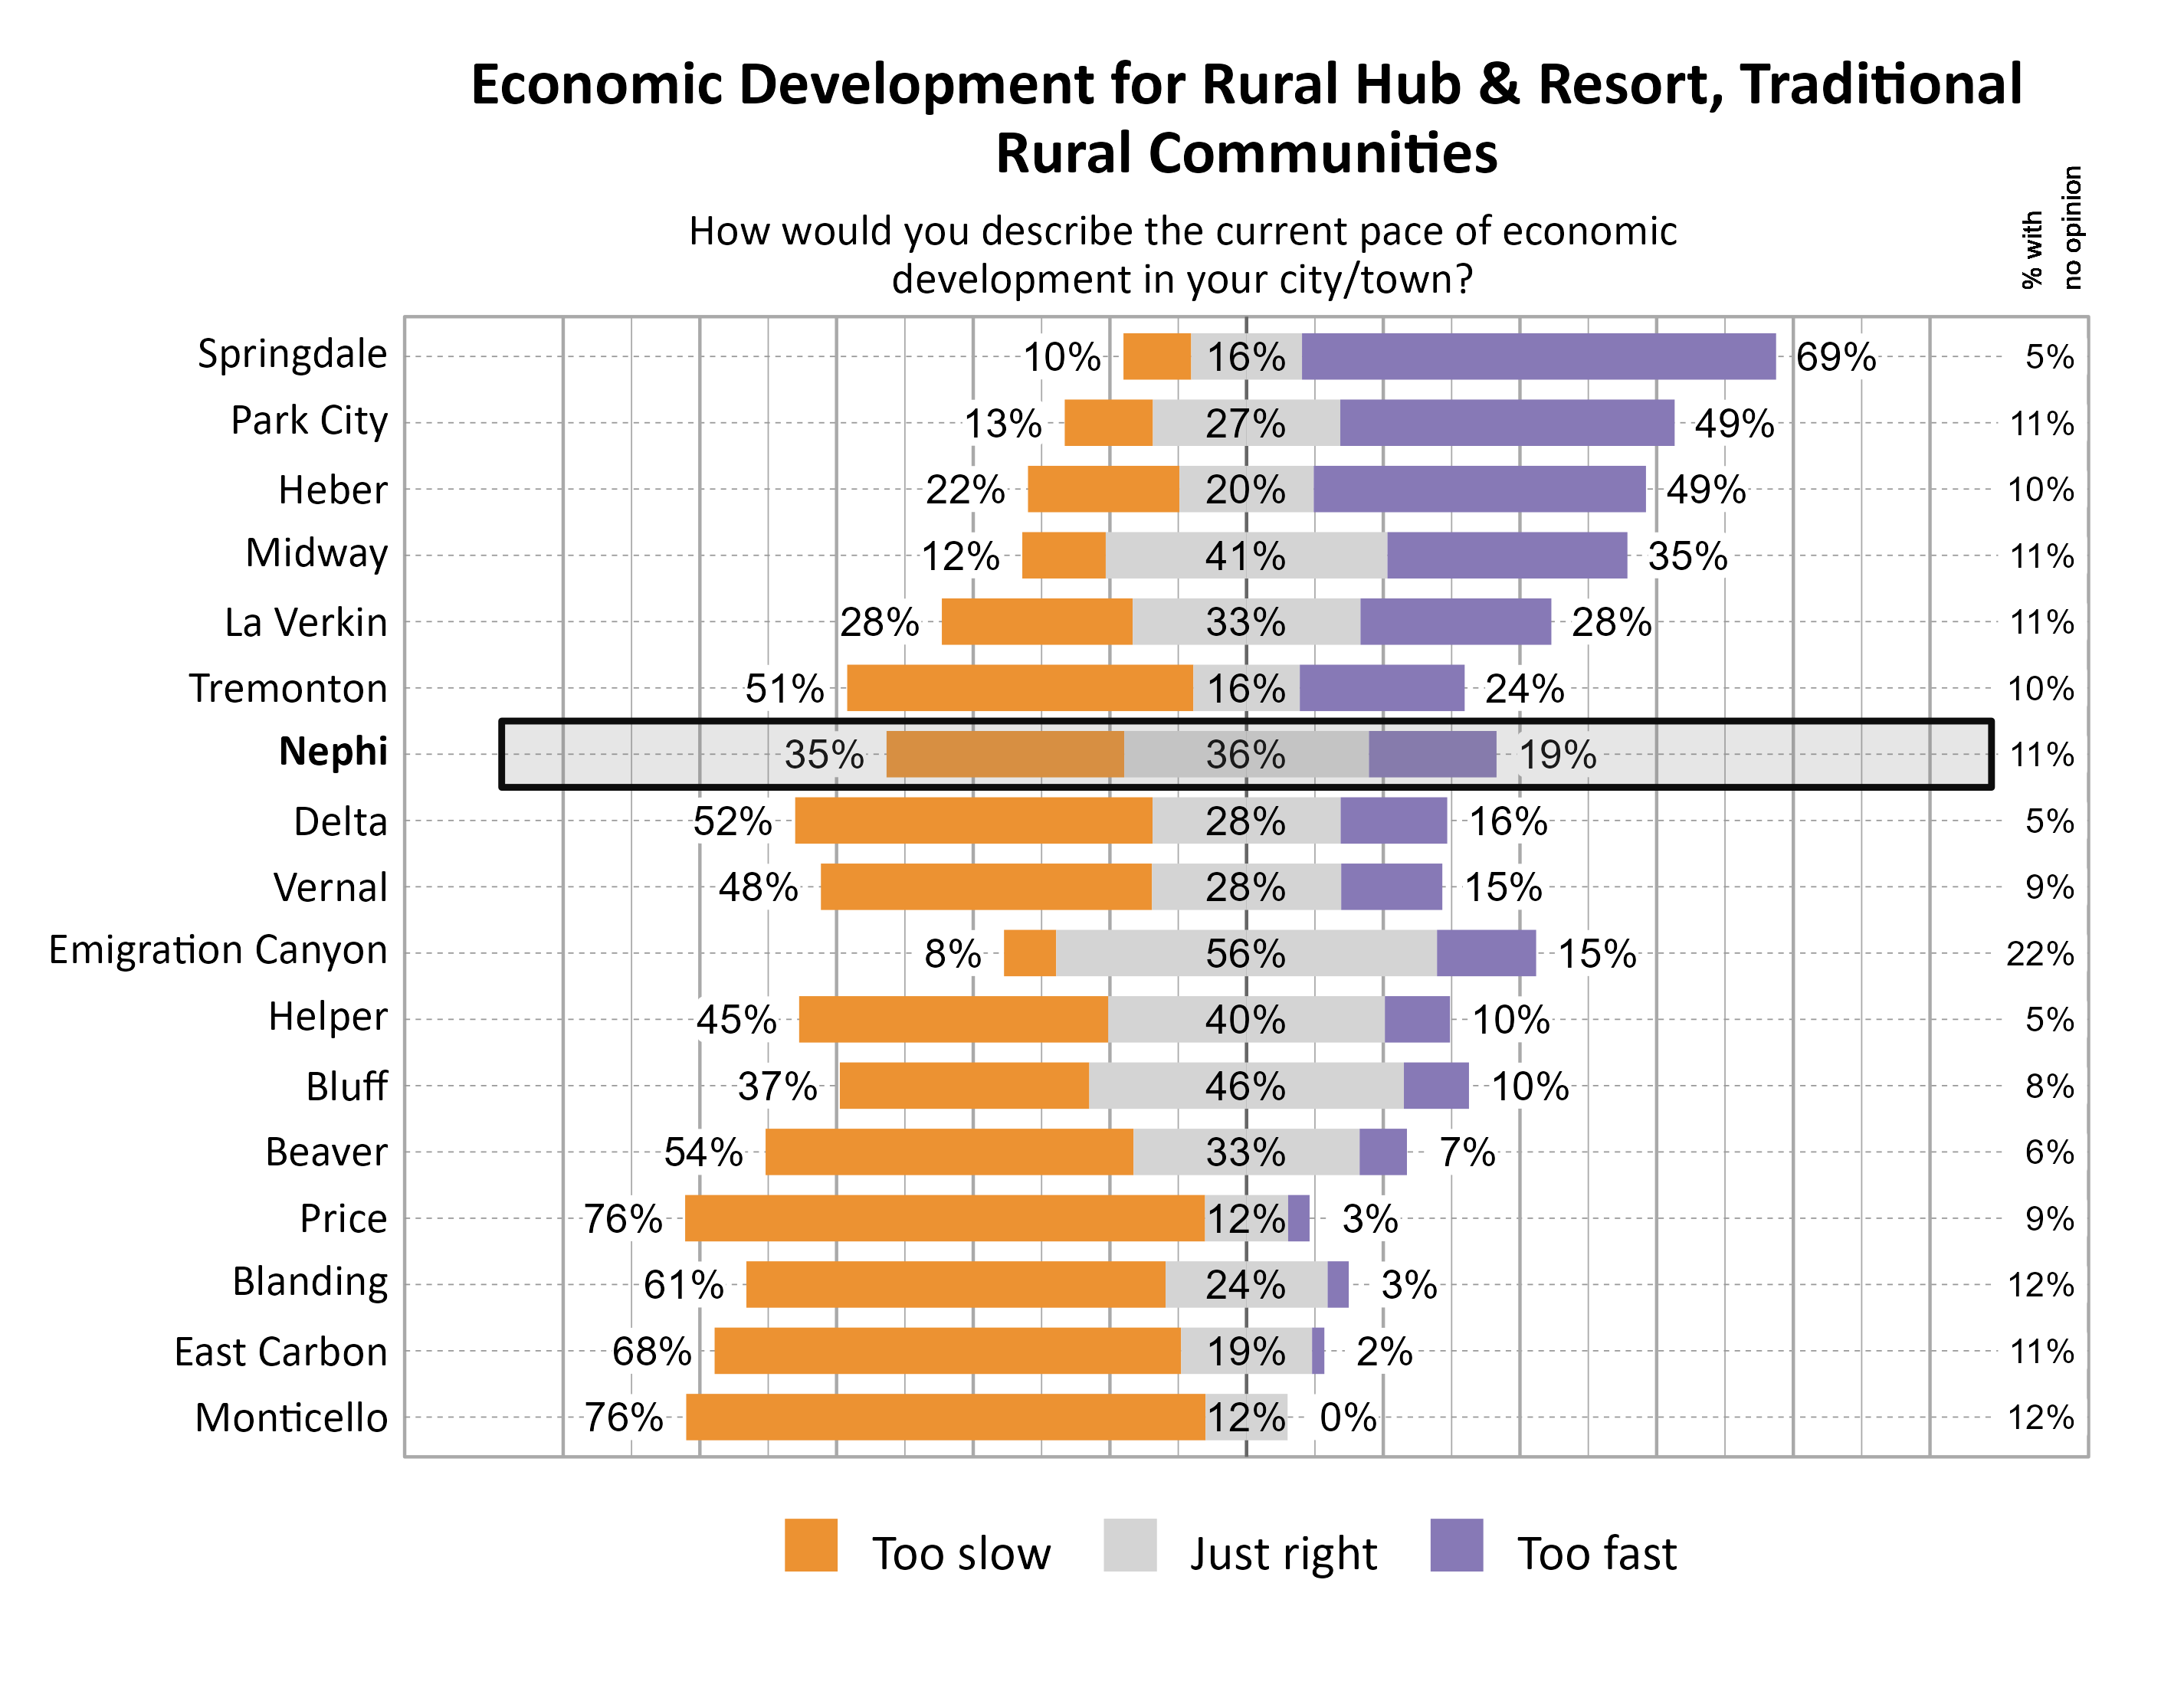
The majority of respondents in Nephi indicated that they felt the population growth was too fast (61%). For the pace of economic development, respondents were split between opinions that it was just right (36%) and too slow (35%).
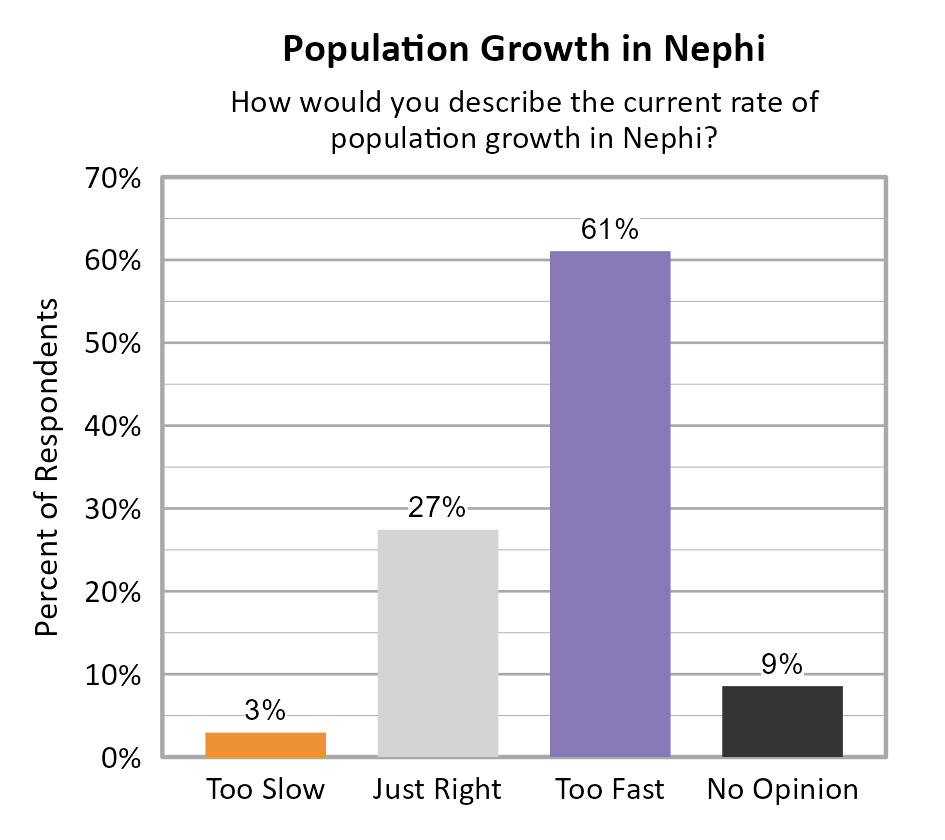
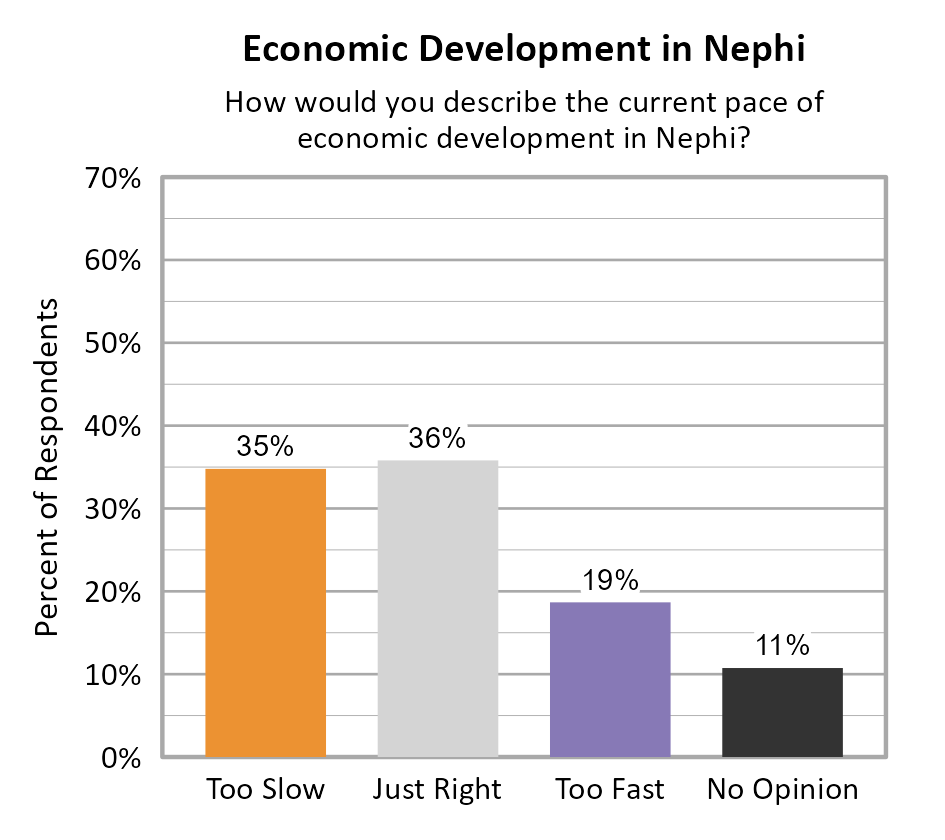
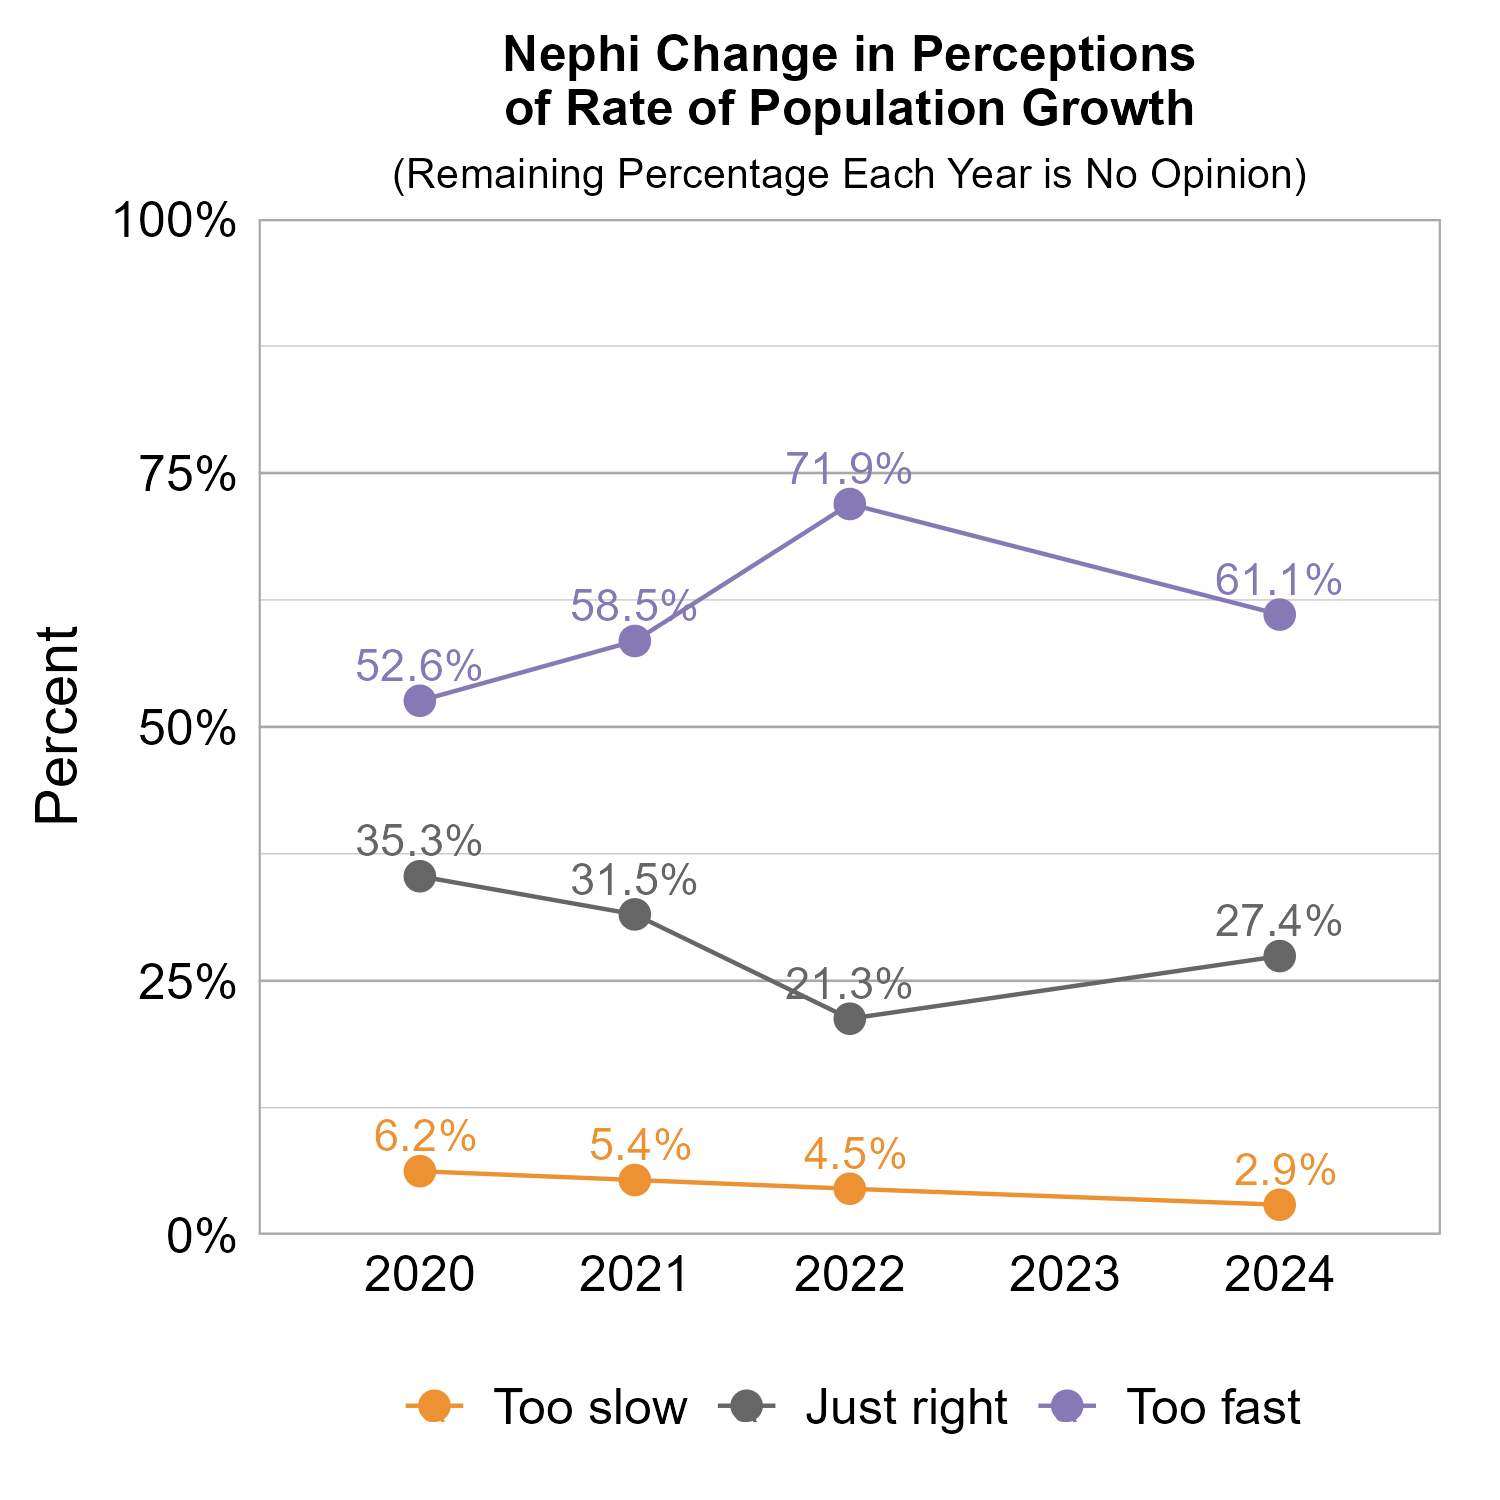
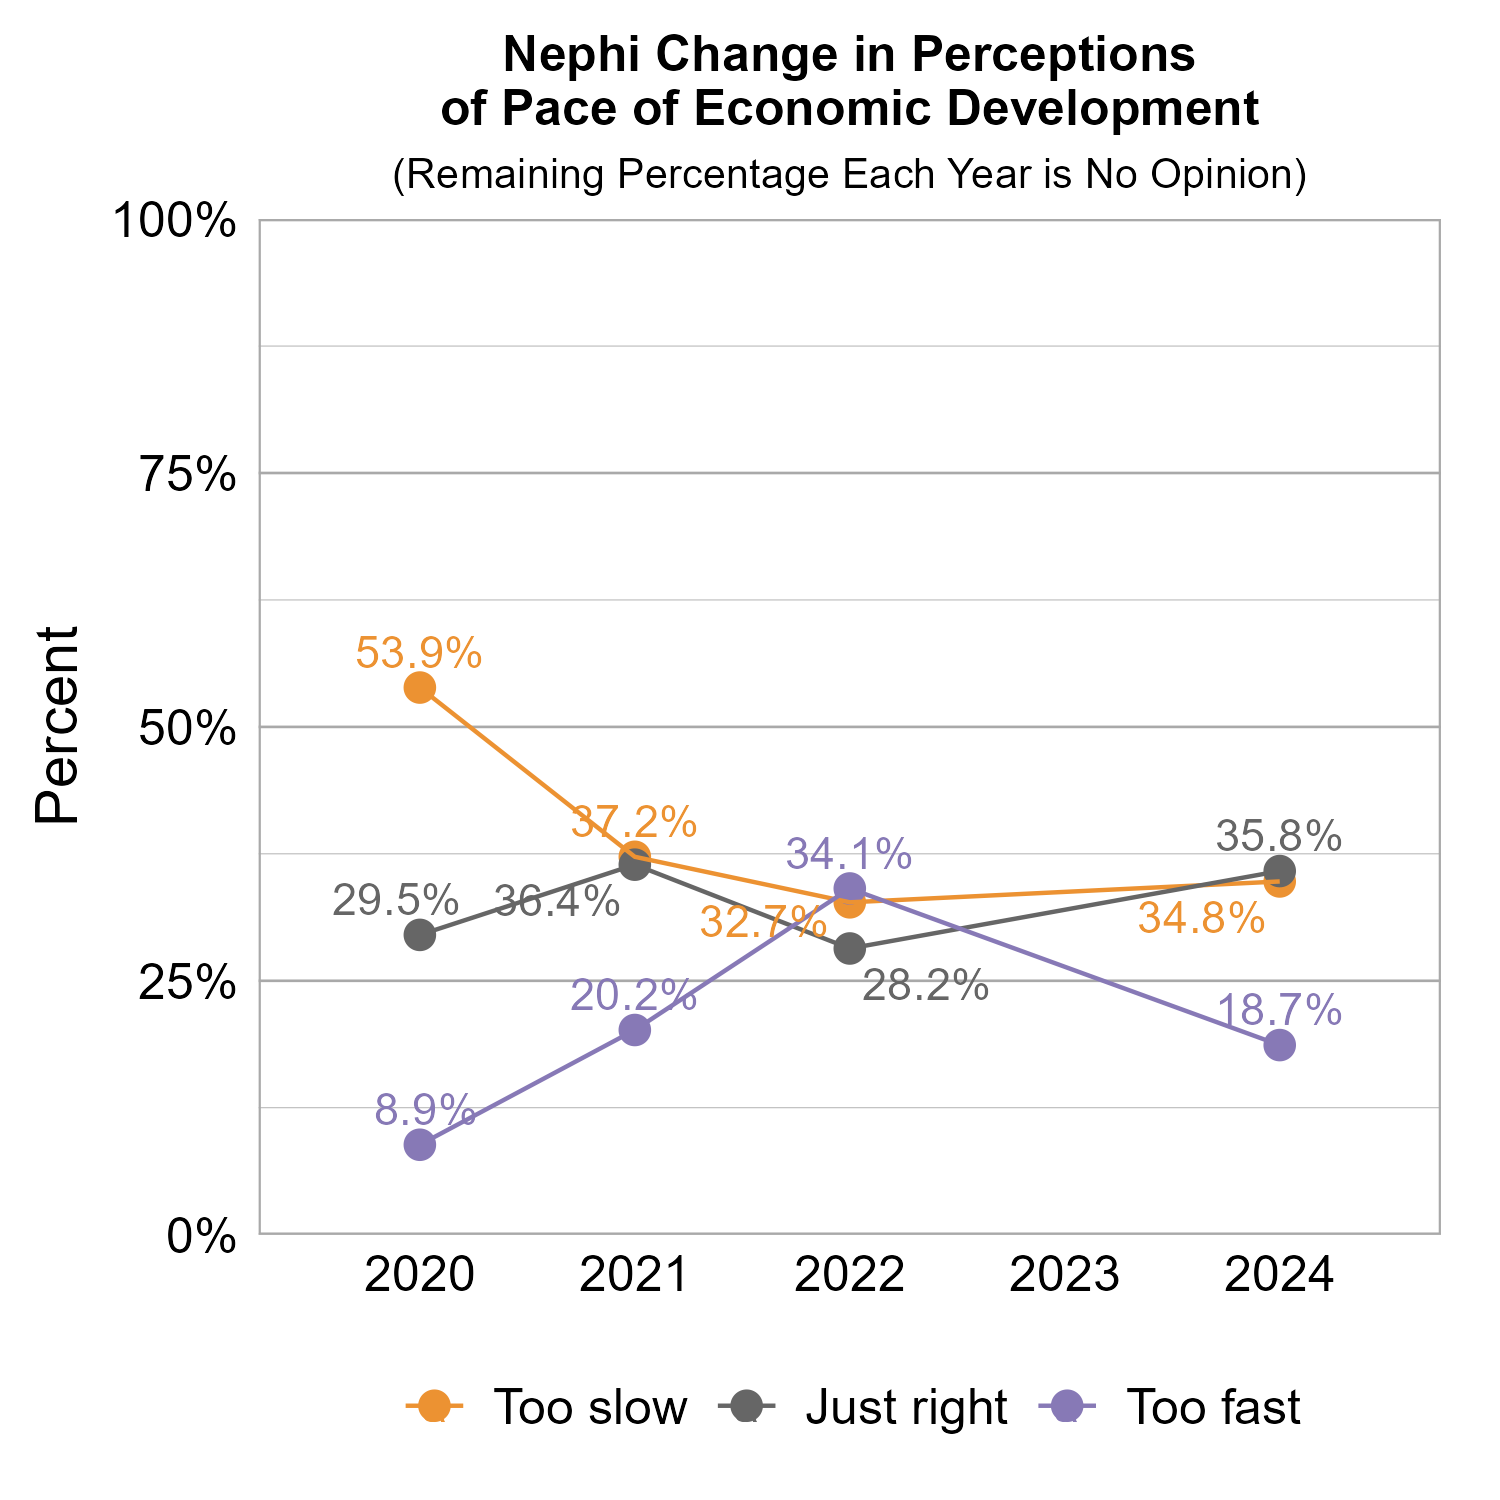
The graphs below show how perceptions of population growth and economic development in Nephi have varied across recent years of Wellbeing Surveys. The majority of respondents have consistently indicated that the rate of population growth is too fast, with a decrease from 2022 to 2024. Perceptions of the pace of economic development have changed significantly over the years, with a decrease in the perception that it is too fast from 2022 to 2024.
The graphs below show perceptions of population growth and economic development for Nephi compared to other participating cities and towns in the Rural cluster.
The graph below illustrates how many respondents perceived the pace of economic development as too slow, just right, too fast, or had no opinion, with additional breakdowns for the number of respondents who provided comments.
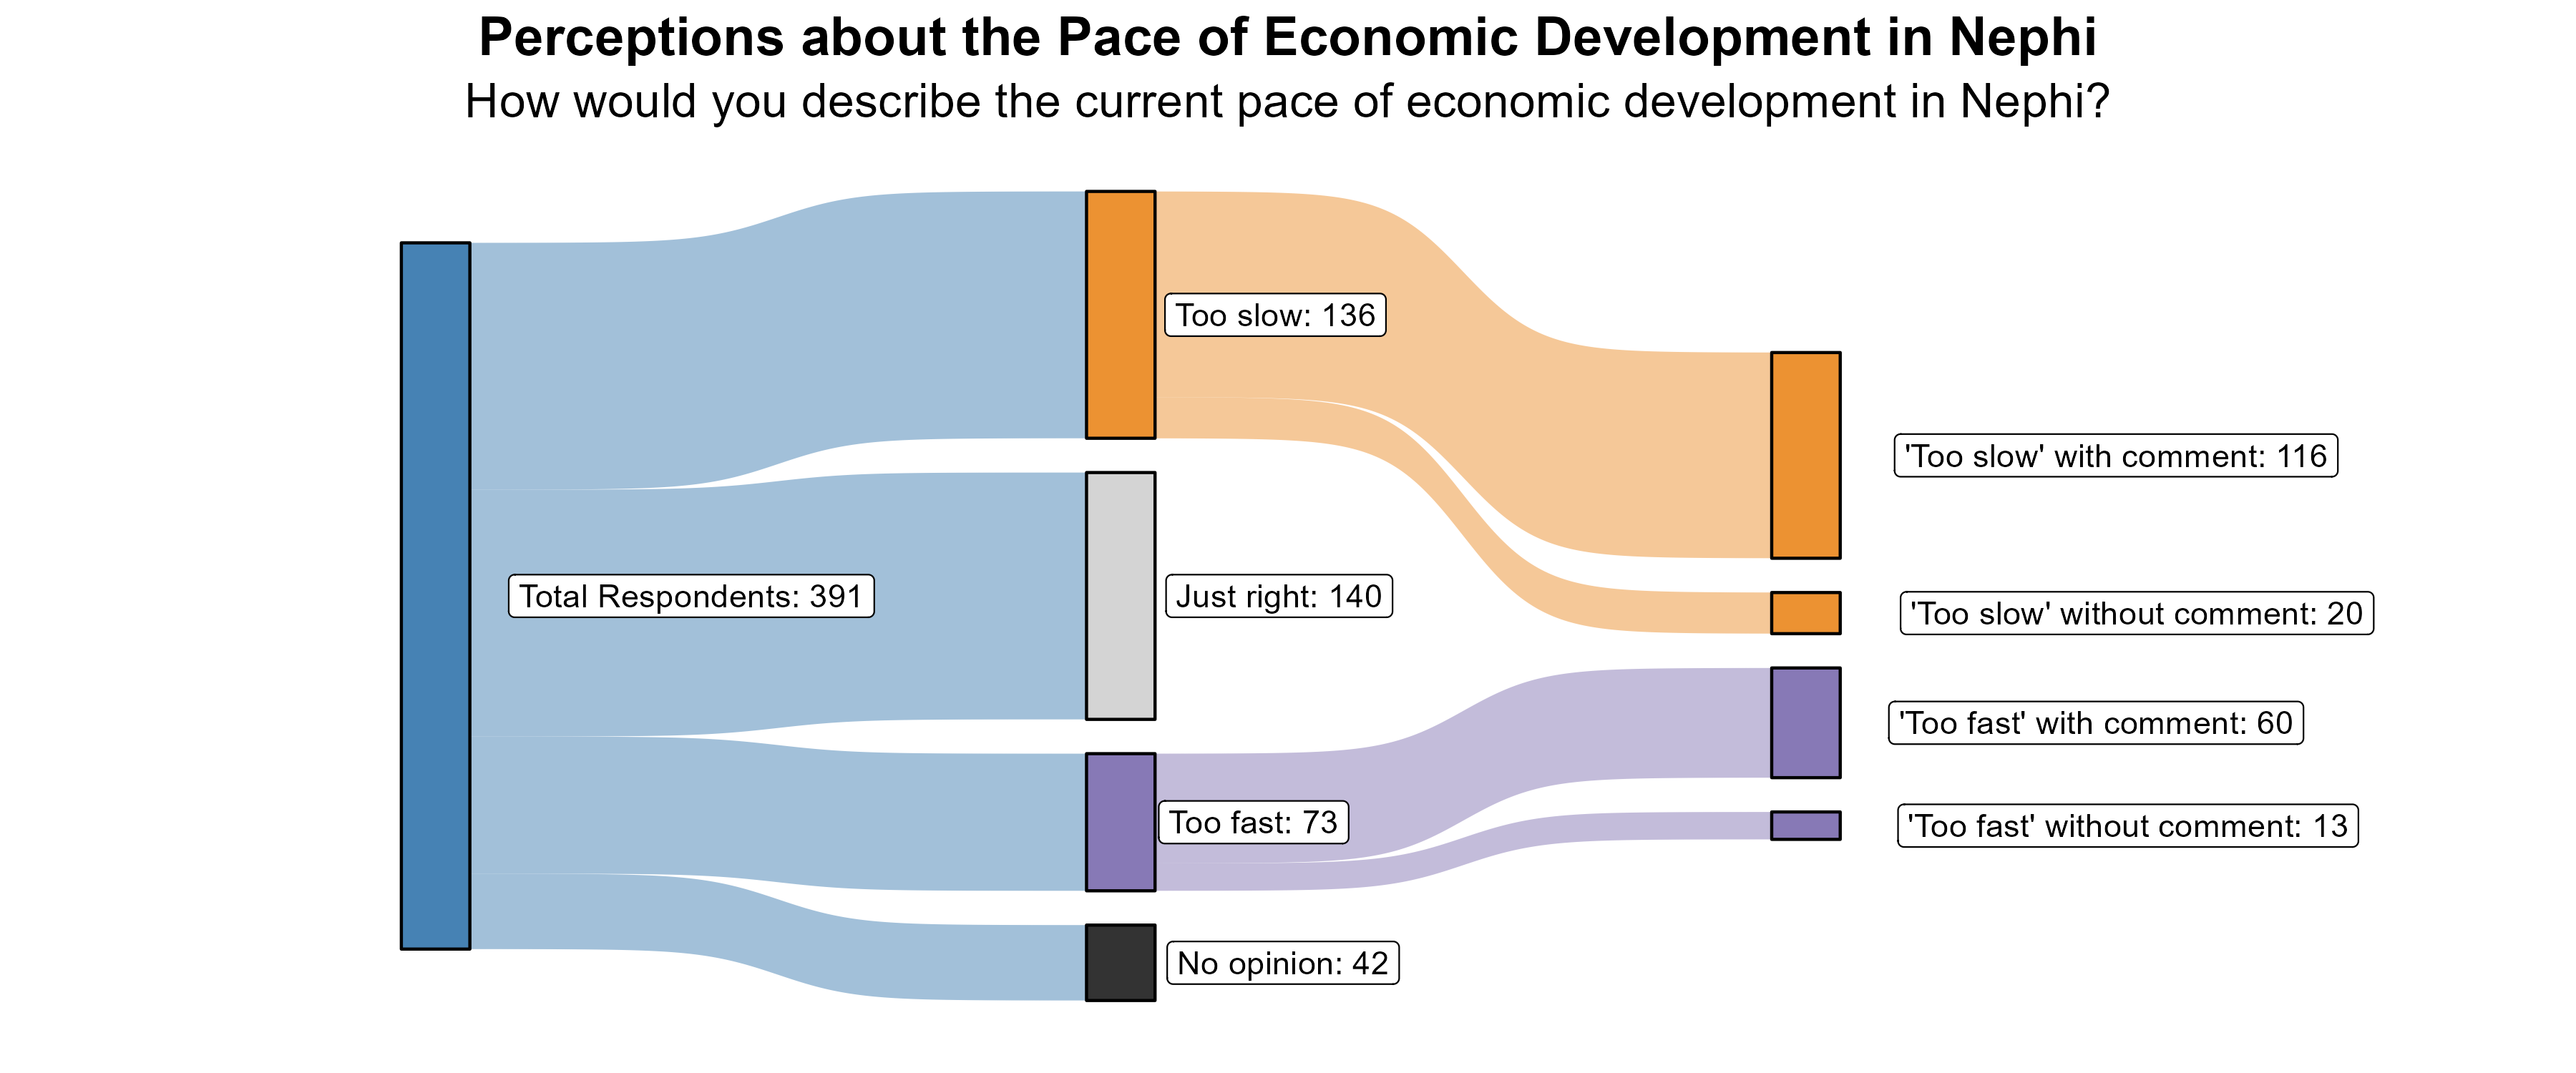
The 35% of respondents who rated the pace of economic growth as “too slow” were further asked what aspects of the local economy they would like to see more of in Nephi. A common theme among respondents was the request for another grocery store as well as other types of shopping and restaurants that differ from the current options. Many brought up the need for more job opportunities, especially within town. Comments suggested that people have to leave Nephi for many of their needs, particularly shopping and work.
Additionally, the 19% of respondents who rated the pace of economic growth as “too fast” were further asked what aspects of the local economy they feel are growing too quickly in Nephi. Many concerns focused on the fast-paced building of housing and apartments and how that adds to crowding, traffic, and impacts on the small town feel of Nephi. There were also concerns about affordability and jobs paying too little and the high cost of housing.
Transportation in Nephi
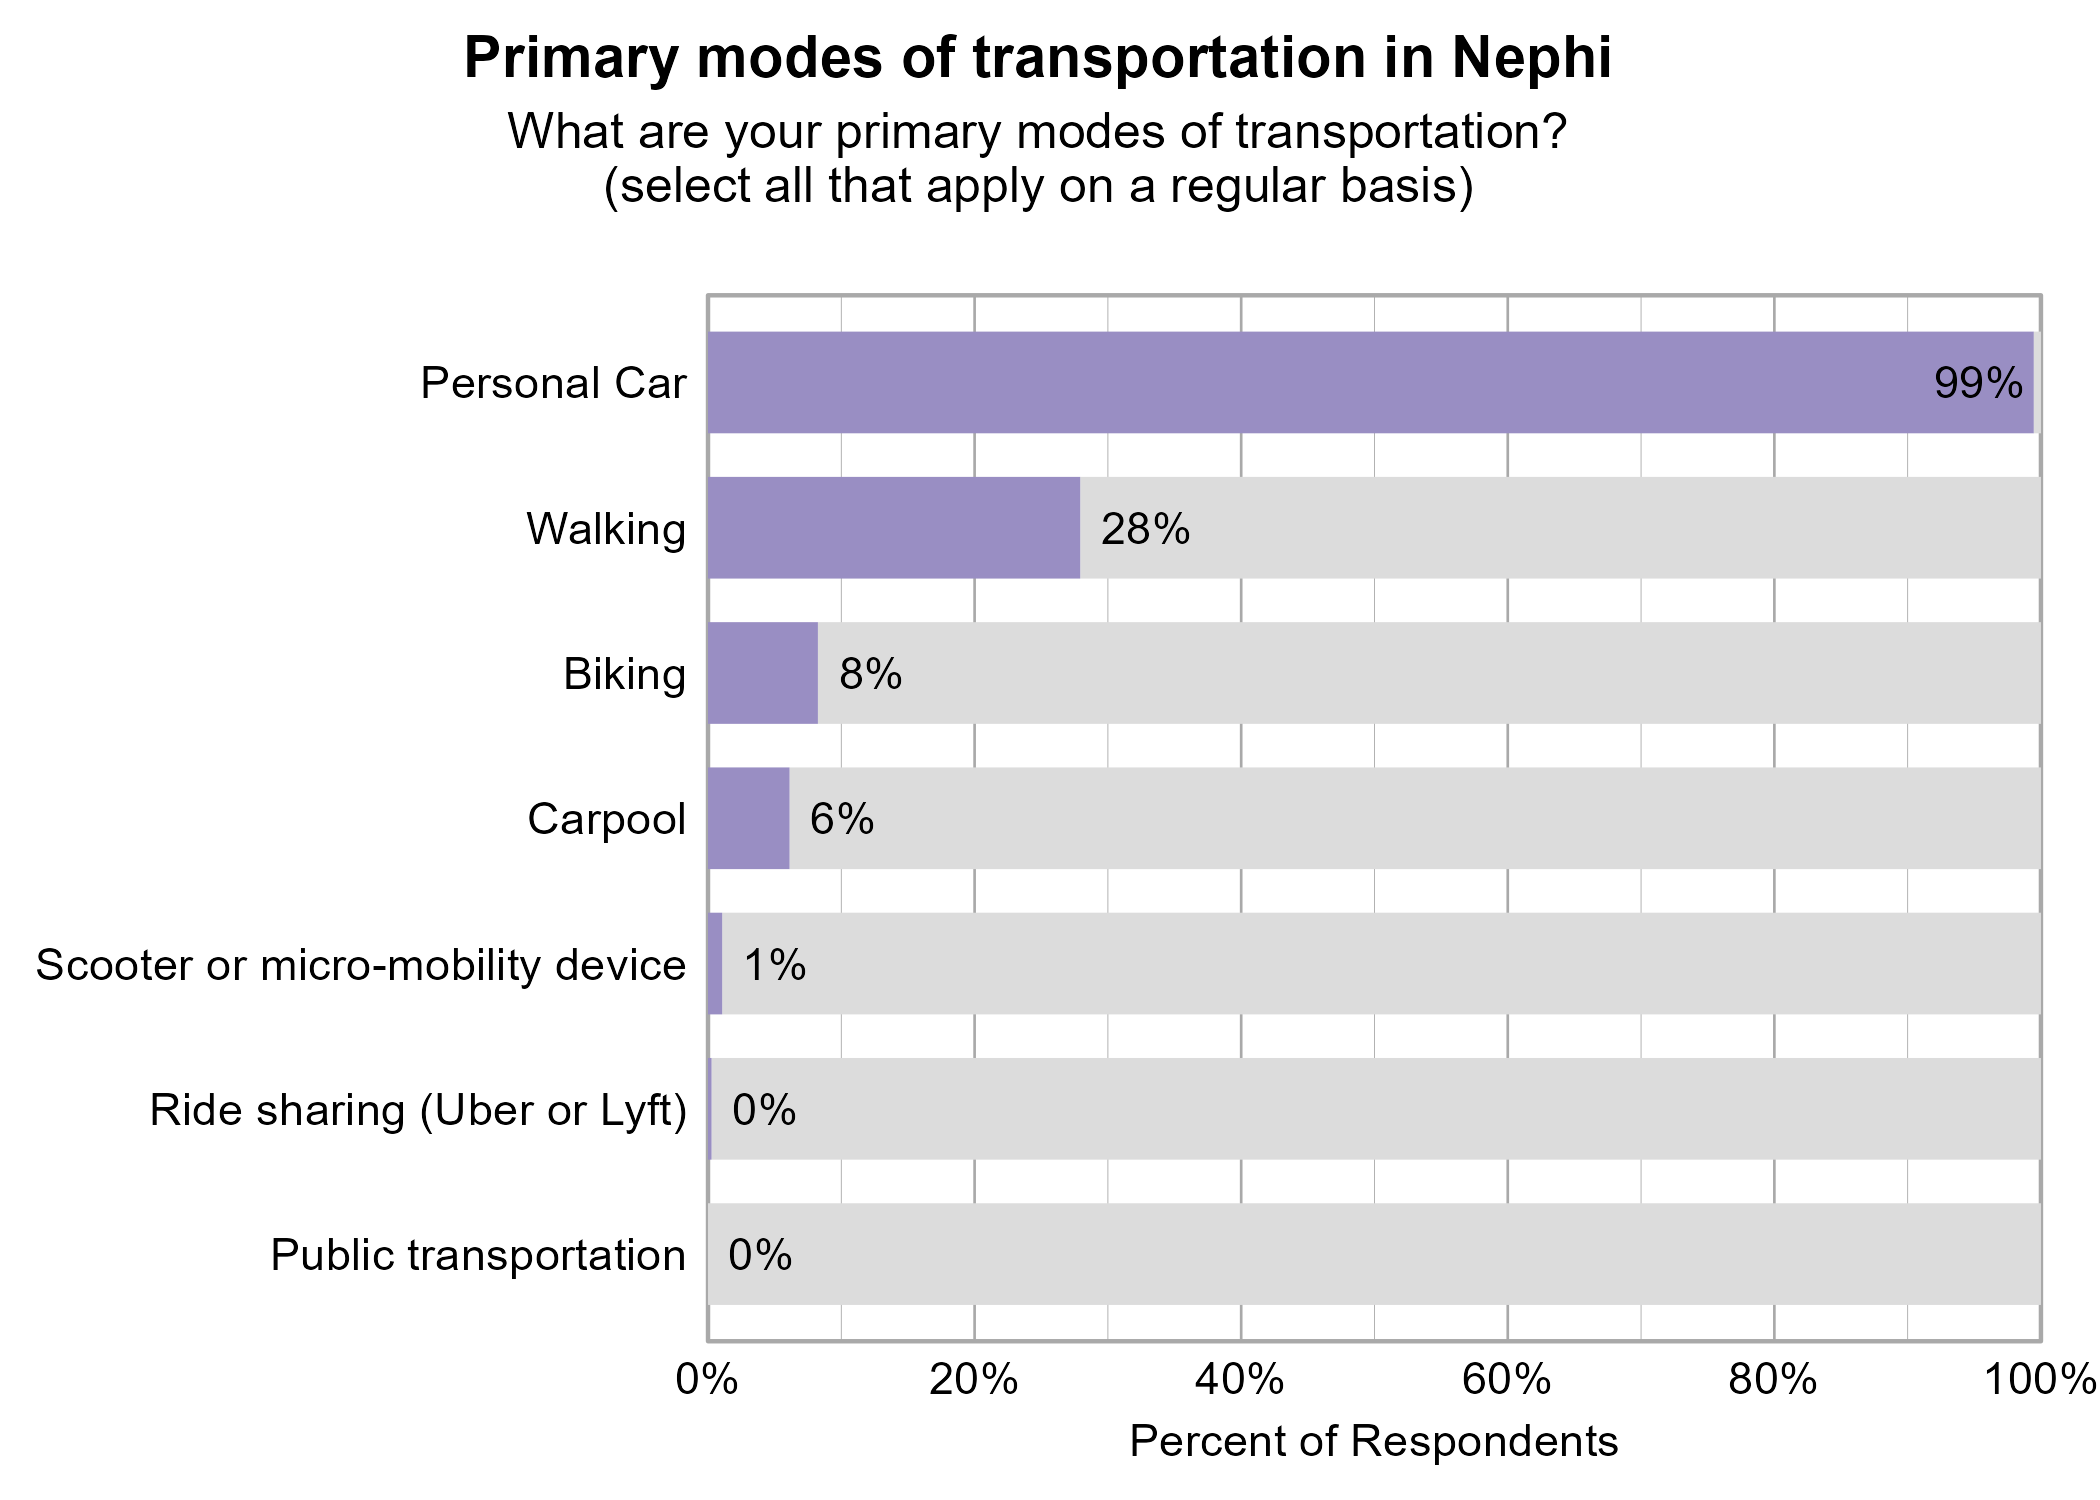
Respondents were asked to indicate all of their primary modes of transportation on a regular basis in Nephi. The most popular modes of transportation were personal car (99%) and walking (28%).
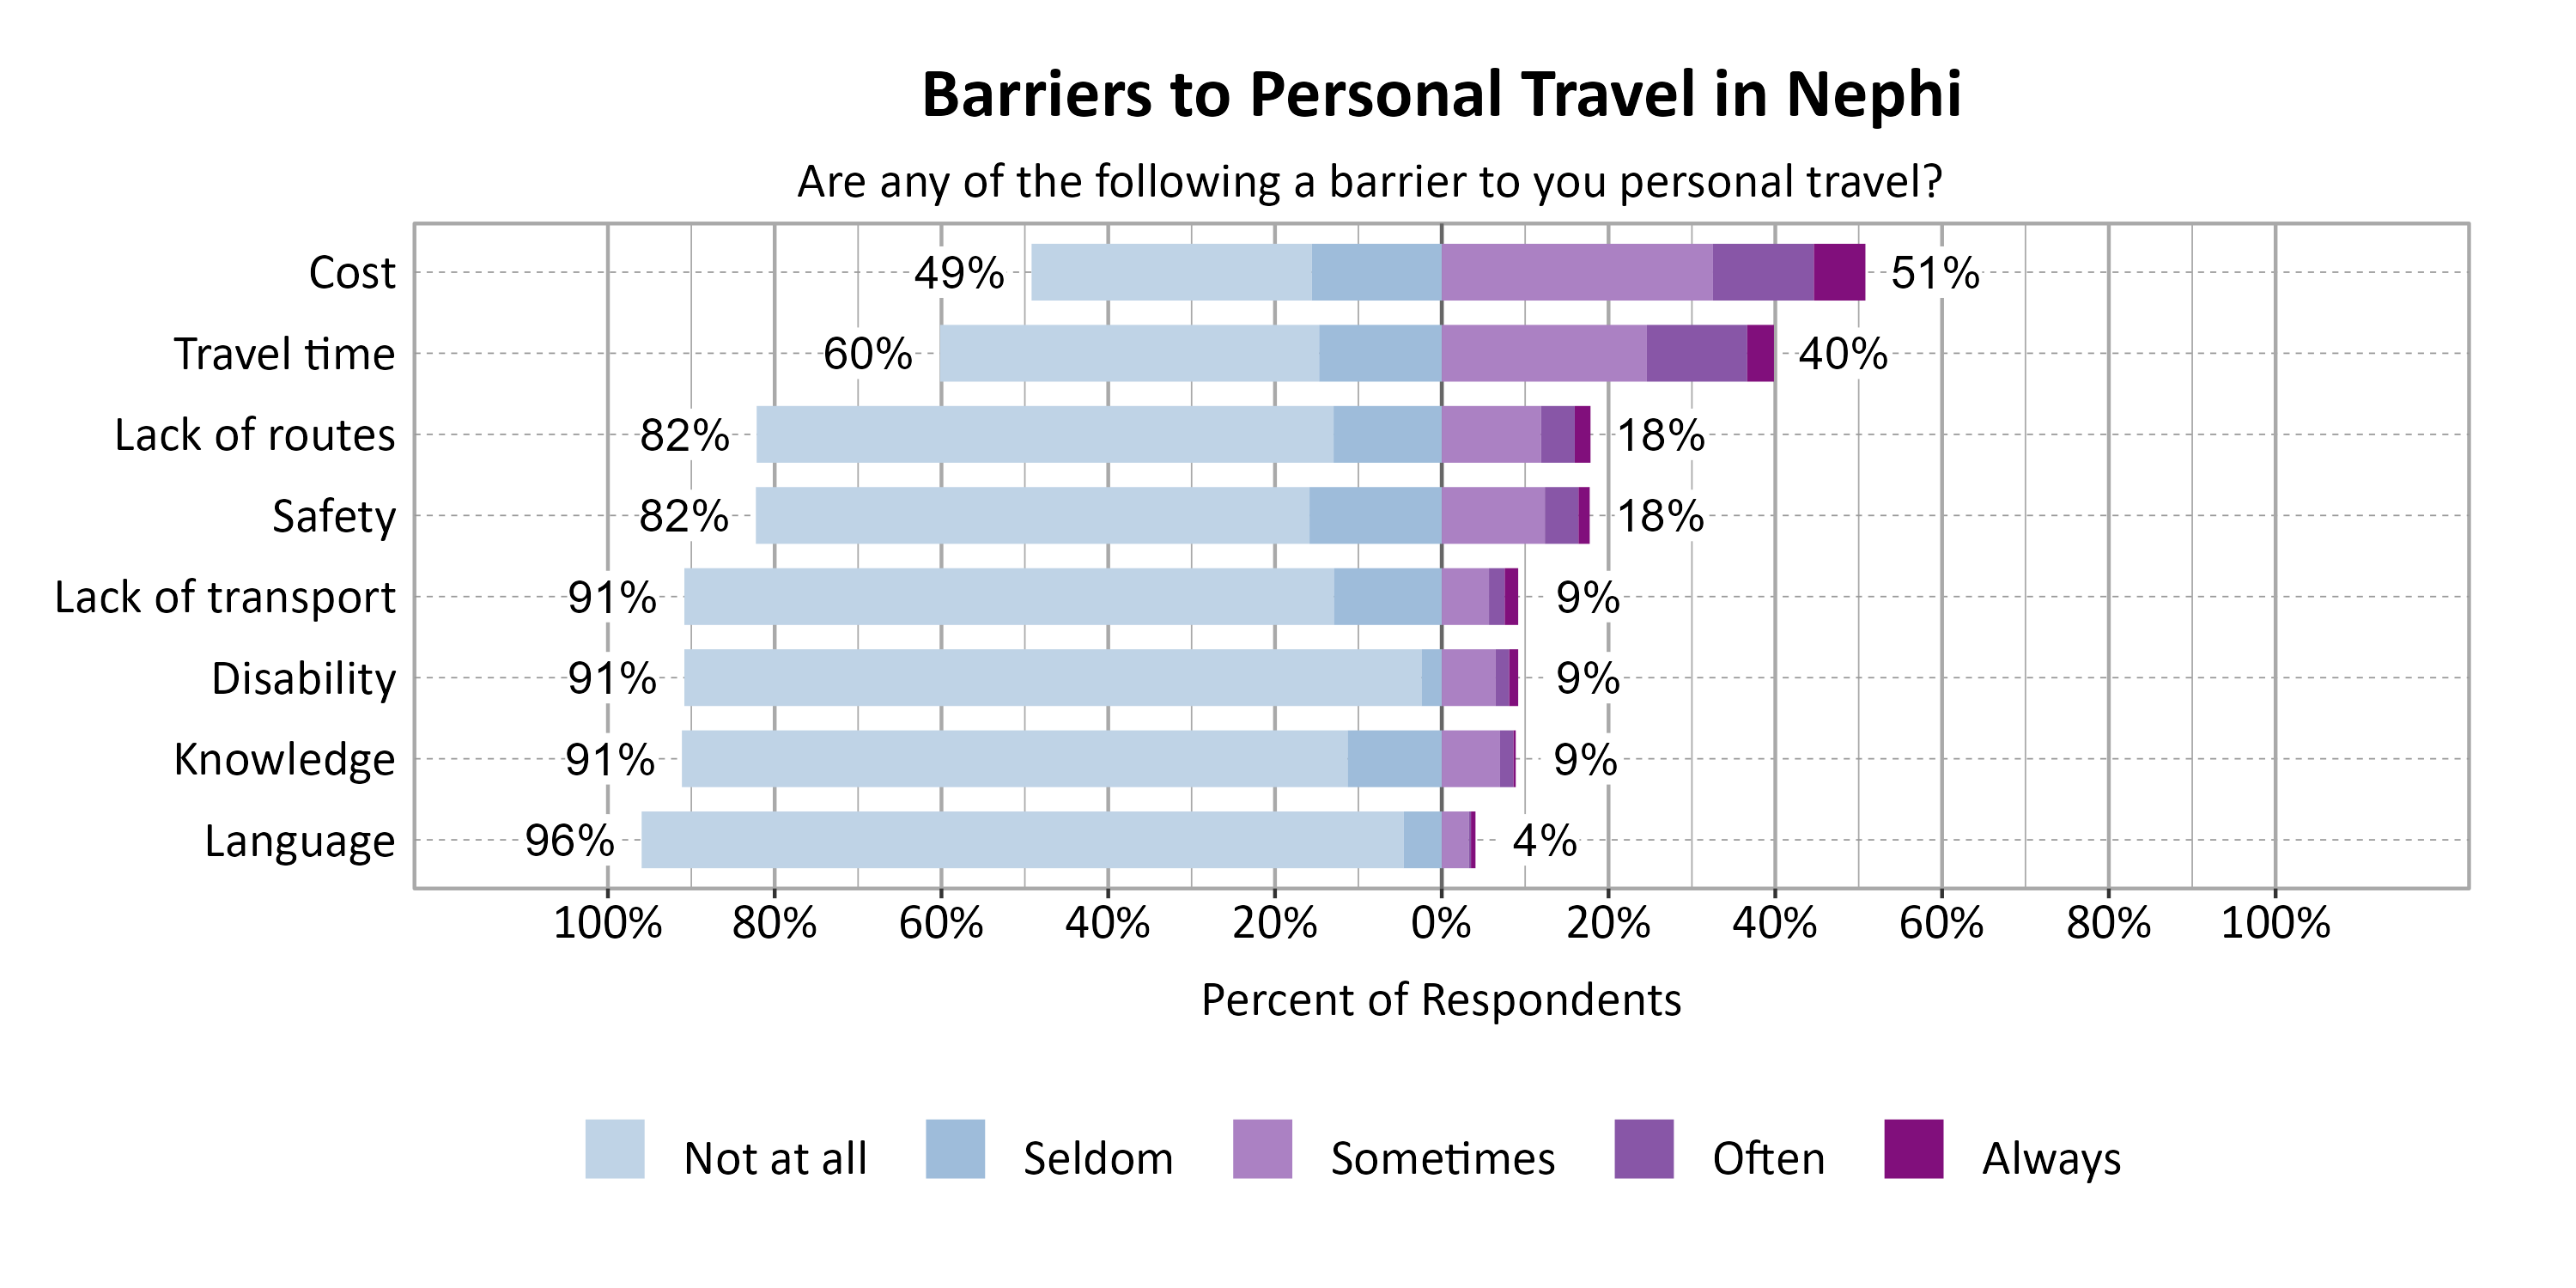
Respondents were asked to indicate the most common barriers to transportation in Nephi. The most problematic barriers were Cost (51%) and Travel time (40%).
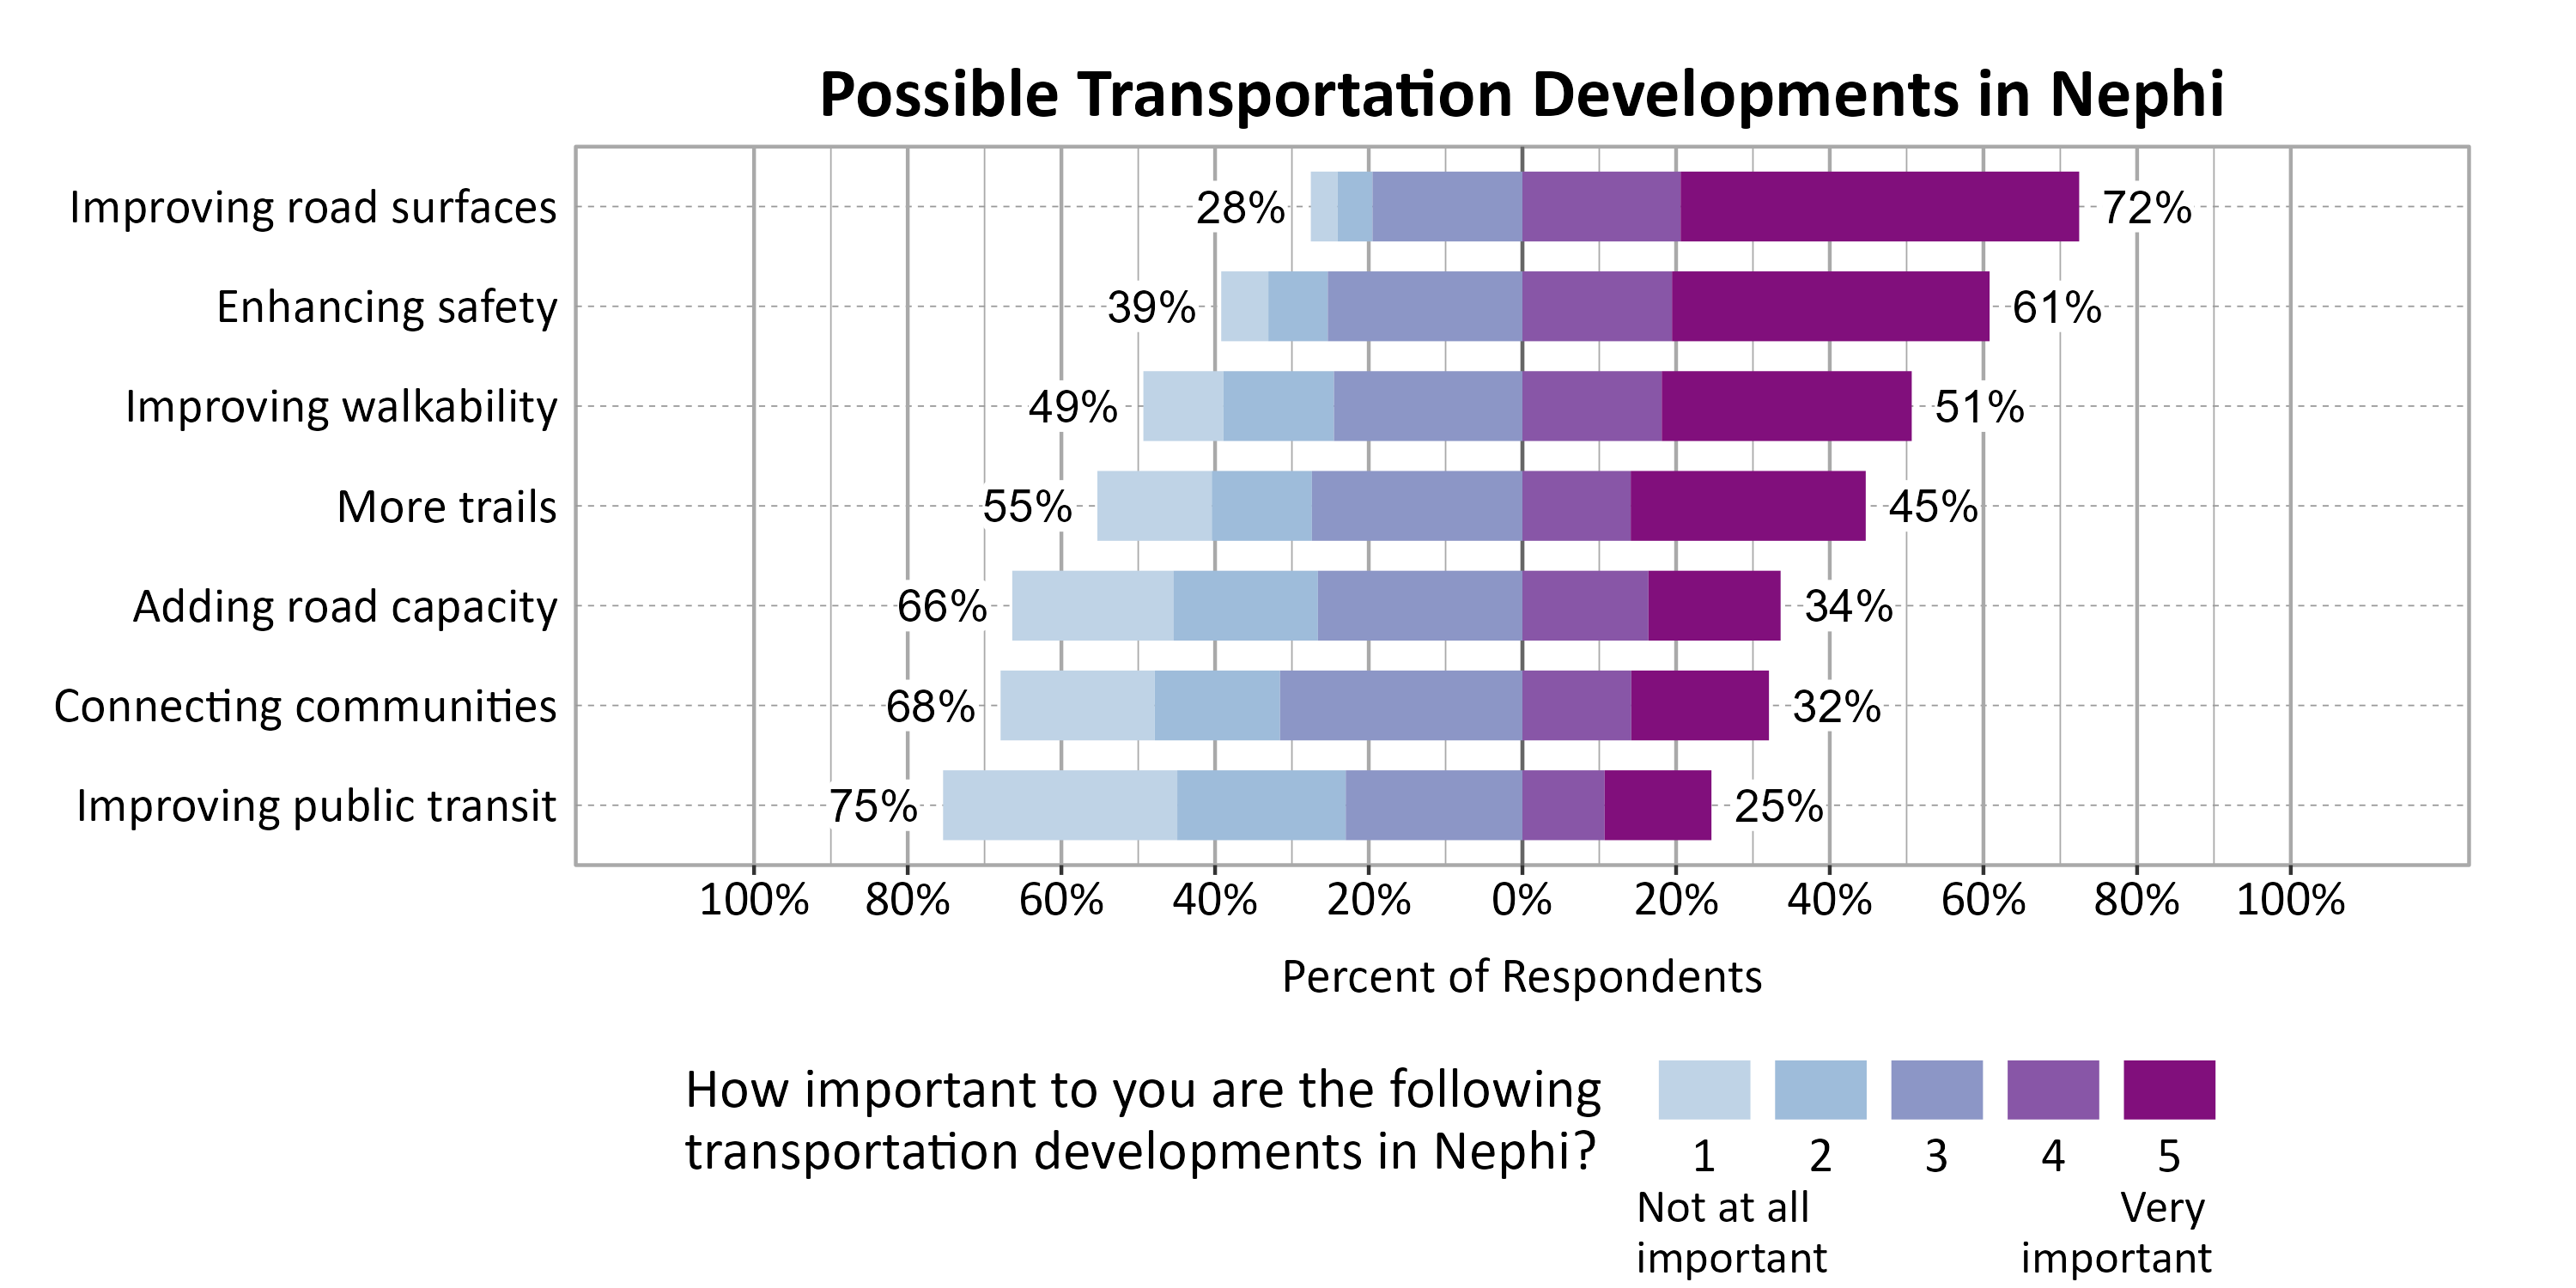
Respondents were asked to indicate the importance of a set of possible transportation developments in Nephi. The most important development to respondents were Improving road surfaces (72%), Enhancing safety (61%), and Improving walkability (51%).
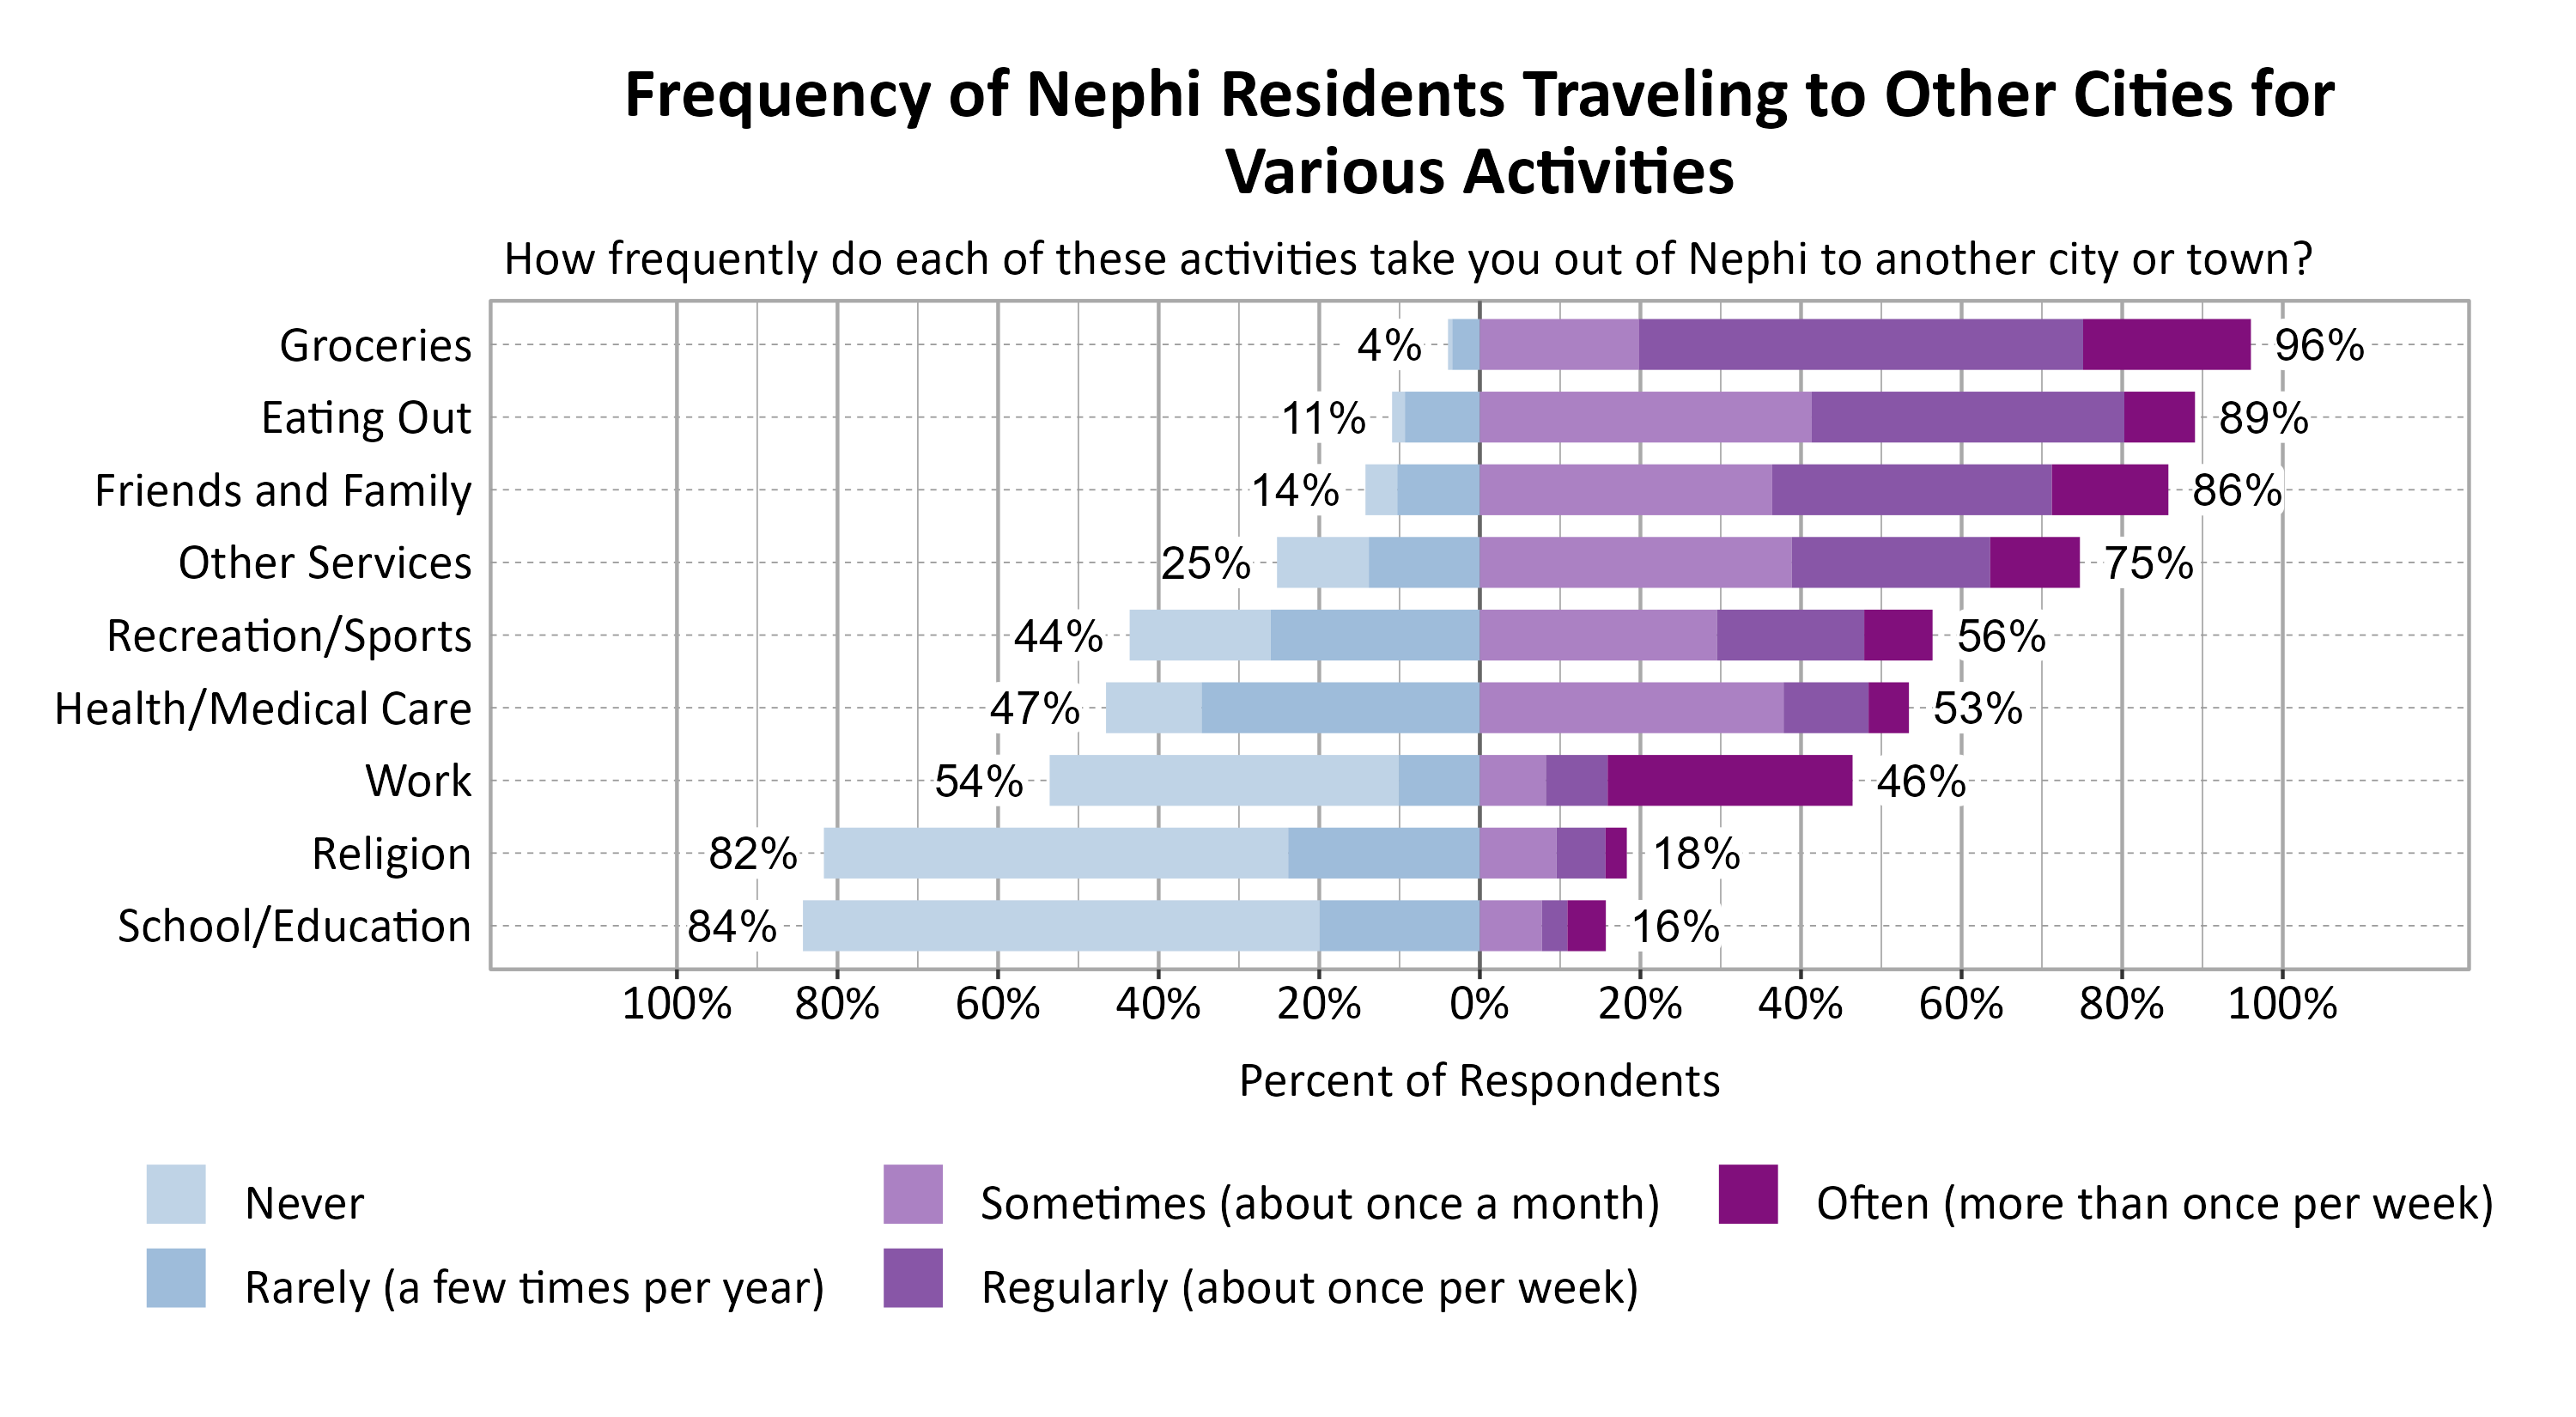
Respondents were asked to indicate how frequently various activities take them out of Nephi to another city or town. The most commonly indicated reasons for traveling to another city or town at least sometimes or once a month were Groceries (96%), Eating Out (89%), and Friends and Family (86%).
Concerns in Nephi
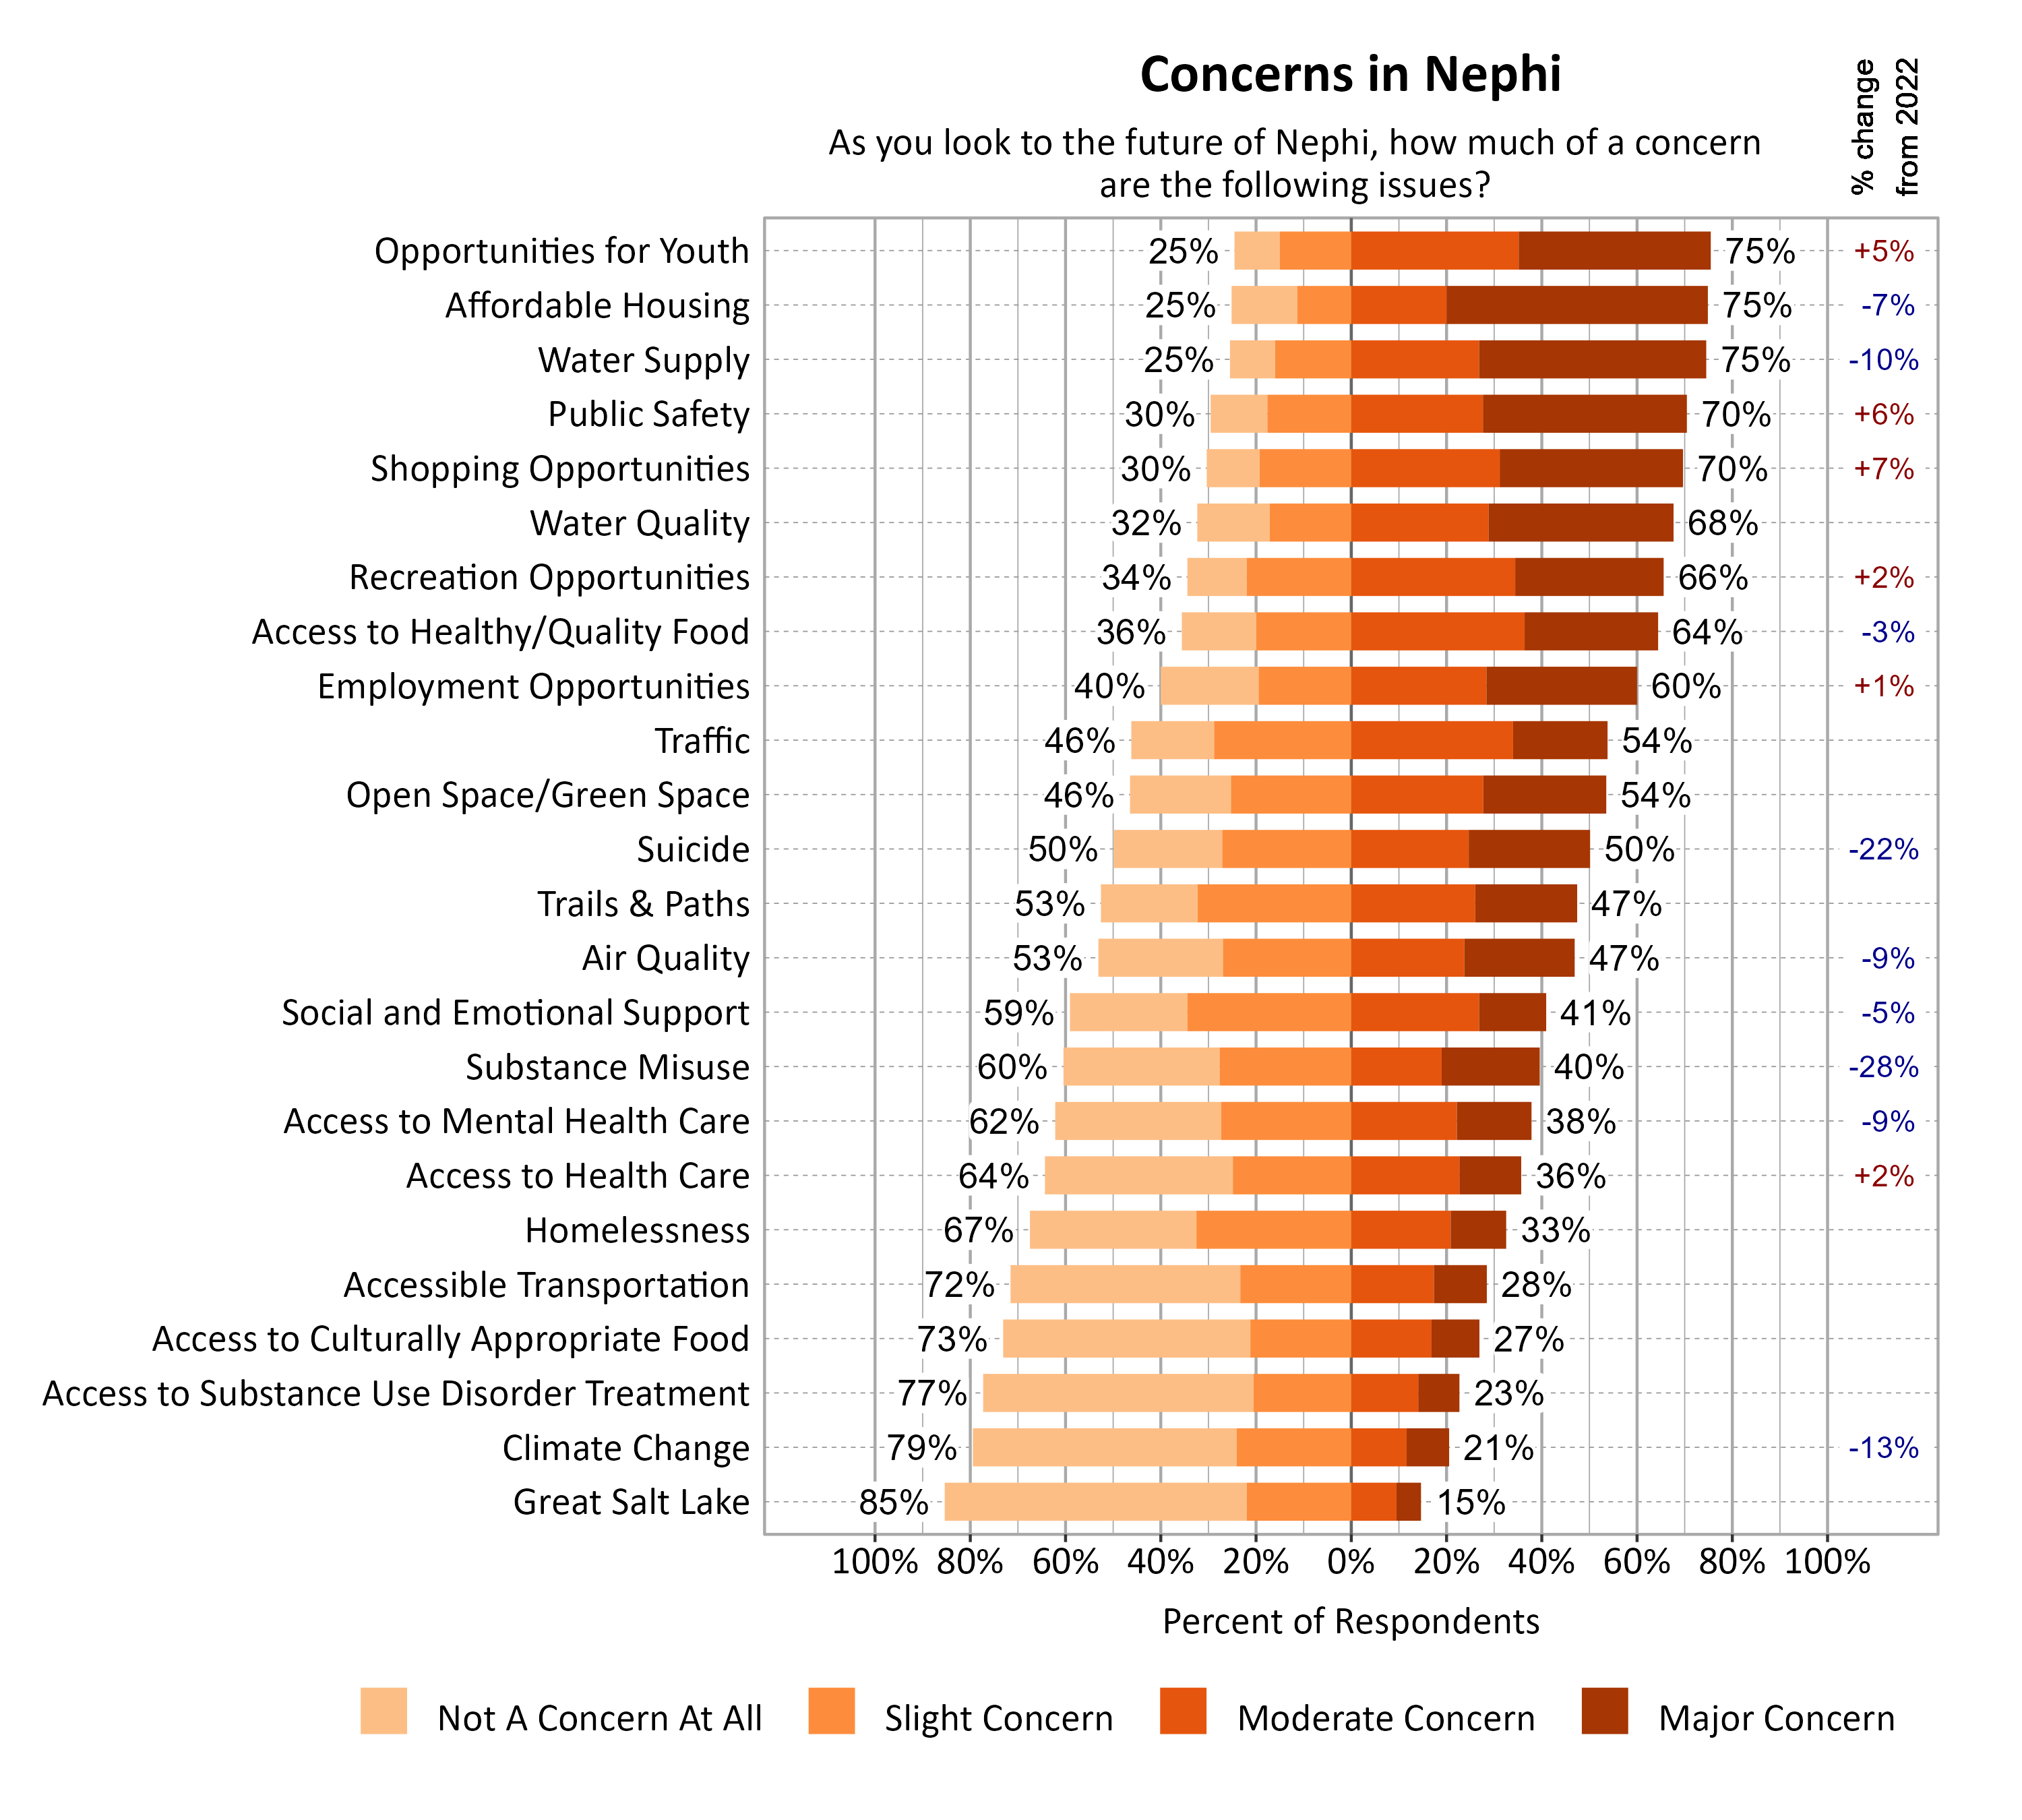
Survey respondents indicated the degree to which a number of possible local issues were a concern as they look to the future of Nephi. Opportunities for Youth (75%), Affordable Housing (75%), and Water Supply (75%) were the top concerns. Since 2022, moderate or major concern about substance misuse (-28%), suicide (-22%), climate change (-13%), and water supply (-10%) notably decreased.
Additional Questions for Nephi
Communication Methods in Nephi
Respondents were asked to indicate any/all tools they use to receive information from Nephi City. The most popular tools were the Nephi City Facebook Page (71%), Family, Friends, and Neighbors (64%), and the Utility Bill Newsletter (54%). Other tools mentioned by respondents included the Library bulletin board, the school districts, and the Greater Nephi Chamber of Commerce.

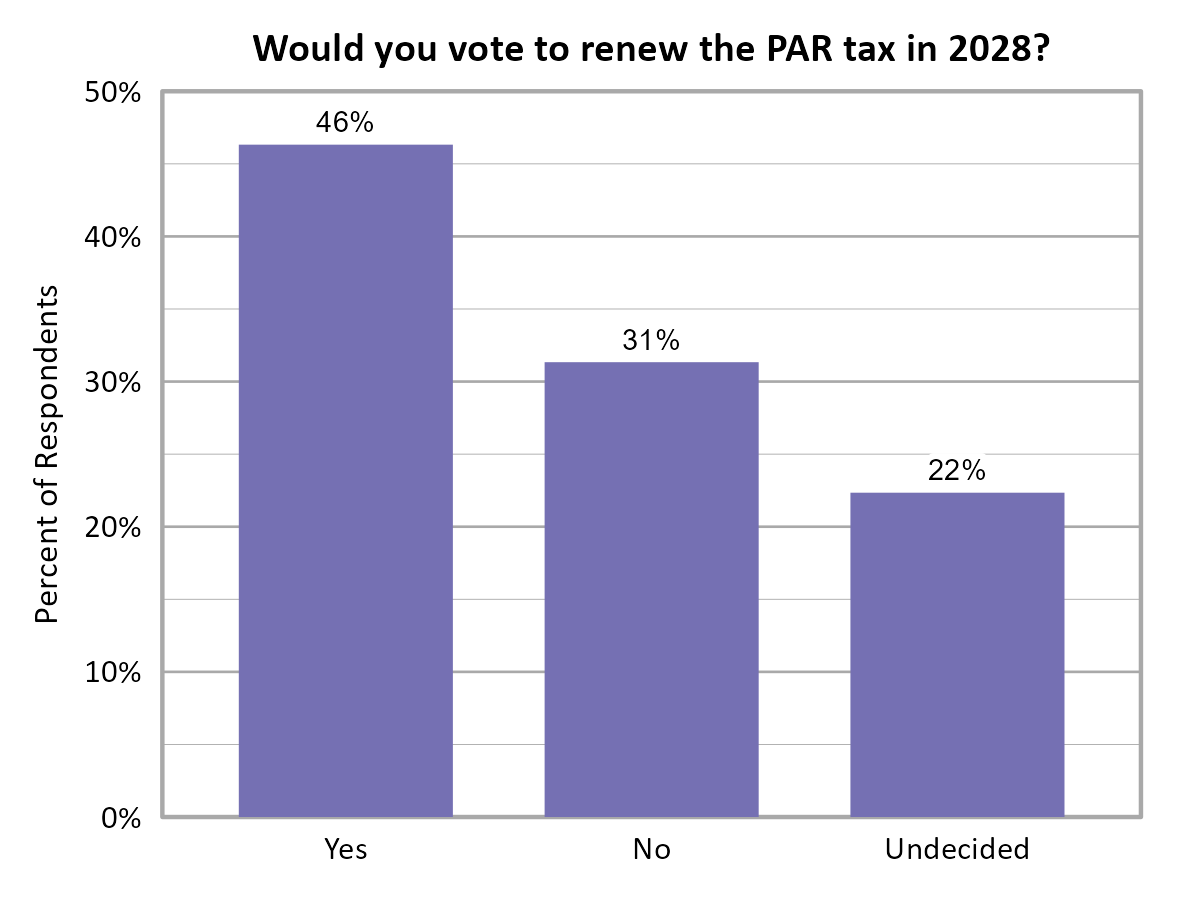
Parks, Arts, and Recreation Tax
Respondents were given the following information and question regarding the Parks, Arts, and Recreation tax: In 2018, Nephi City instituted the Parks, Arts, and Recreation tax (PAR tax) to help fund projects like the Town Square soccer fields and the Hive Recreation Center. The tax is a 0.1% sales tax and will need to be renewed through a vote in 2028. Would you vote to renew this tax in 2028? Their responses are shown in the graph below. The largest proportion of respondents indicated Yes (46%).
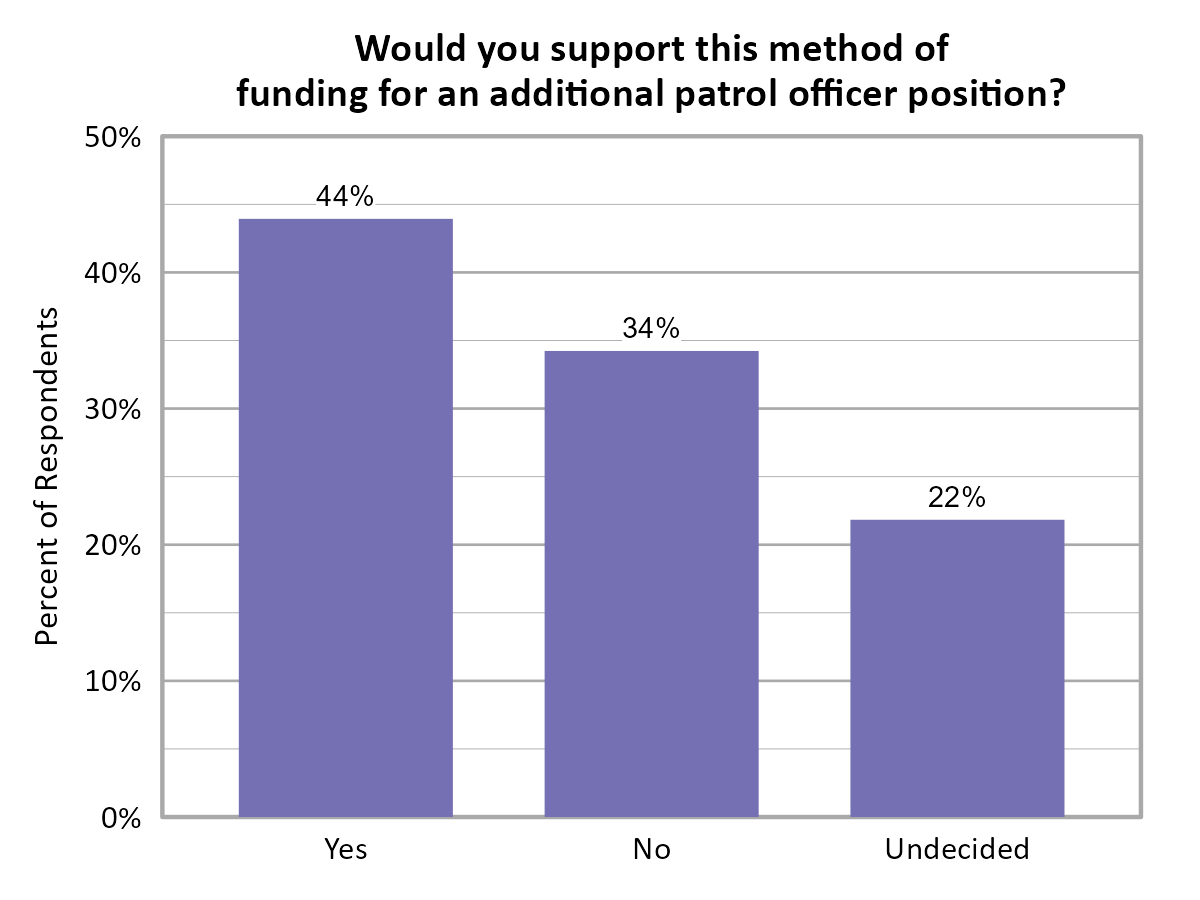
Additional Patrol Officer Funding
Respondents were also given the following information and question regarding funding for an additional patrol officer: Through grants and creative fiscal management, the Nephi City Police Department has been able to add several new positions like a Drug Task Force Officer, a second School Resource Officer, a Code Enforcement Officer and a Records Technician. A patrol officer has not been added to the department for several decades but is sorely needed due to increased service requests. In order to afford a new patrol officer, the City Council would need to look at a property tax increase of approximately $3.00 to $7.00/month depending on the assessed value of a home. Would you support this method of funding for an additional patrol officer position? The largest proportion of respondents indicated Yes (44%).
Open Comments
All open comments collected in the survey were shared with city leaders. General observations and themes are shared here.
What Respondents Value Most in Nephi
Survey respondents were asked to comment on what they value most about Nephi. The most common words and phrases from all city comments are included in the word cloud below. It is possible that negative or unrelated words may appear since these words have been taken out of context, and they may not indicate the respondent’s intended meaning. Respondents indicated that they highly value the peace and quiet and safety they experience in Nephi as well as the friendliness and closeness of the community. The most commonly mentioned aspect of value is that Nephi is a small town.

Local Environmental Quality in Nephi
The 41% of respondents who rated the Local Environmental Quality domain as 1, 2, or 3 (Poor, Fair, or Moderate) were further asked if there are specific aspects of local environmental quality that they feel are problematic. Overall, trash and upkeep were a major concern. Run down roads, street signs, sidewalks, etc. were all points that impact local environmental quality. Air quality was mentioned as a major concern as well, with pollution getting notably worse. There were frustrations expressed with loss of green space due to new developments.
Improving Wellbeing in Nephi
Survey respondents were asked if there is anything that could be done to improve wellbeing in Nephi. Respondents focused on wanting additional recreational opportunities such as a pool and increased access to the Hive, better sidewalks and walking paths, and more shopping and general retail. People would also like to see controlled growth, affordable housing, more community events and things to do, and attention to safety especially in schools.
Additional Comments
Respondents were also asked if they had any additional comments on wellbeing in Nephi. Comments expressed wariness about growth and that people would like to see thoughtful development and maintenance of the small-town feel. There were several comments made about high property taxes. Additional community events, recreation opportunities, and things to do were common requests. There were also mixed feelings on the performance of the police department.