Nibley Wellbeing Survey Findings 2024
By Dr. Courtney Flint and Team
![]()
Contact Information
Dr. Courtney Flint
courtney.flint@usu.edu
435-797-8635
Summary
Nibley is one of 51 cities participating in the Utah Wellbeing Survey Project in 2024. This project is designed to assess the wellbeing and local perspectives of city residents and to provide information to city leaders to inform general planning processes. Additional analysis is underway and this report may be updated over time.
We are grateful to all those who took the survey and to our city partners who helped to make this possible. We are grateful to a number of entities for funding: the Utah League of Cities and Towns, USU Extension, USU’s Institute for Land Water and Air, the Wasatch Front Regional Council, Utah Department of Transportation, the Utah Agricultural Experiment Station, and the cities of Alpine, Cedar Hills, Draper, Millcreek, Nephi, North Salt Lake, Ogden, Orem, Pleasant Grove, Providence, Springdale, Tremonton, West Bountiful, and West Valley City.
This report describes findings from the 2024 Nibley survey and comparative information with other project cities. In April and May 2024, Nibley City advertised the survey for residents through newsletters, emails, texts, social media, City Council meetings, flyers, and through other surveys. All city residents age 18+ were encouraged to take the online Qualtrics survey.
How many people responded?
- 319 viable surveys were recorded in this 2024 survey effort.
- The Nibley 2022 survey had 457 responses and the Nibley 2021 survey had 305 responses and the Nibley 2020 survey had 62 responses.
- The adult population of Nibley was estimated at 4,394, based on the American Community Survey by the U.S. Census. The 319 survey responses in 2024 represent 7.3% of the adult population and have a conservative margin of error of 5.28%.
Survey Respondent Characteristics
| Resident Statistics | |
|---|---|
| Full Time Residents of Nibley | 97.5% |
| Part Time Residents of Nibley | 2.5% |
| Length of Residency — Range | 0.1-60 years |
| Length of Residency — Average | 11.2 years |
| Length of Residency — Median | 8 years |
| Length of Residency 5 Years or less | 39.9% |
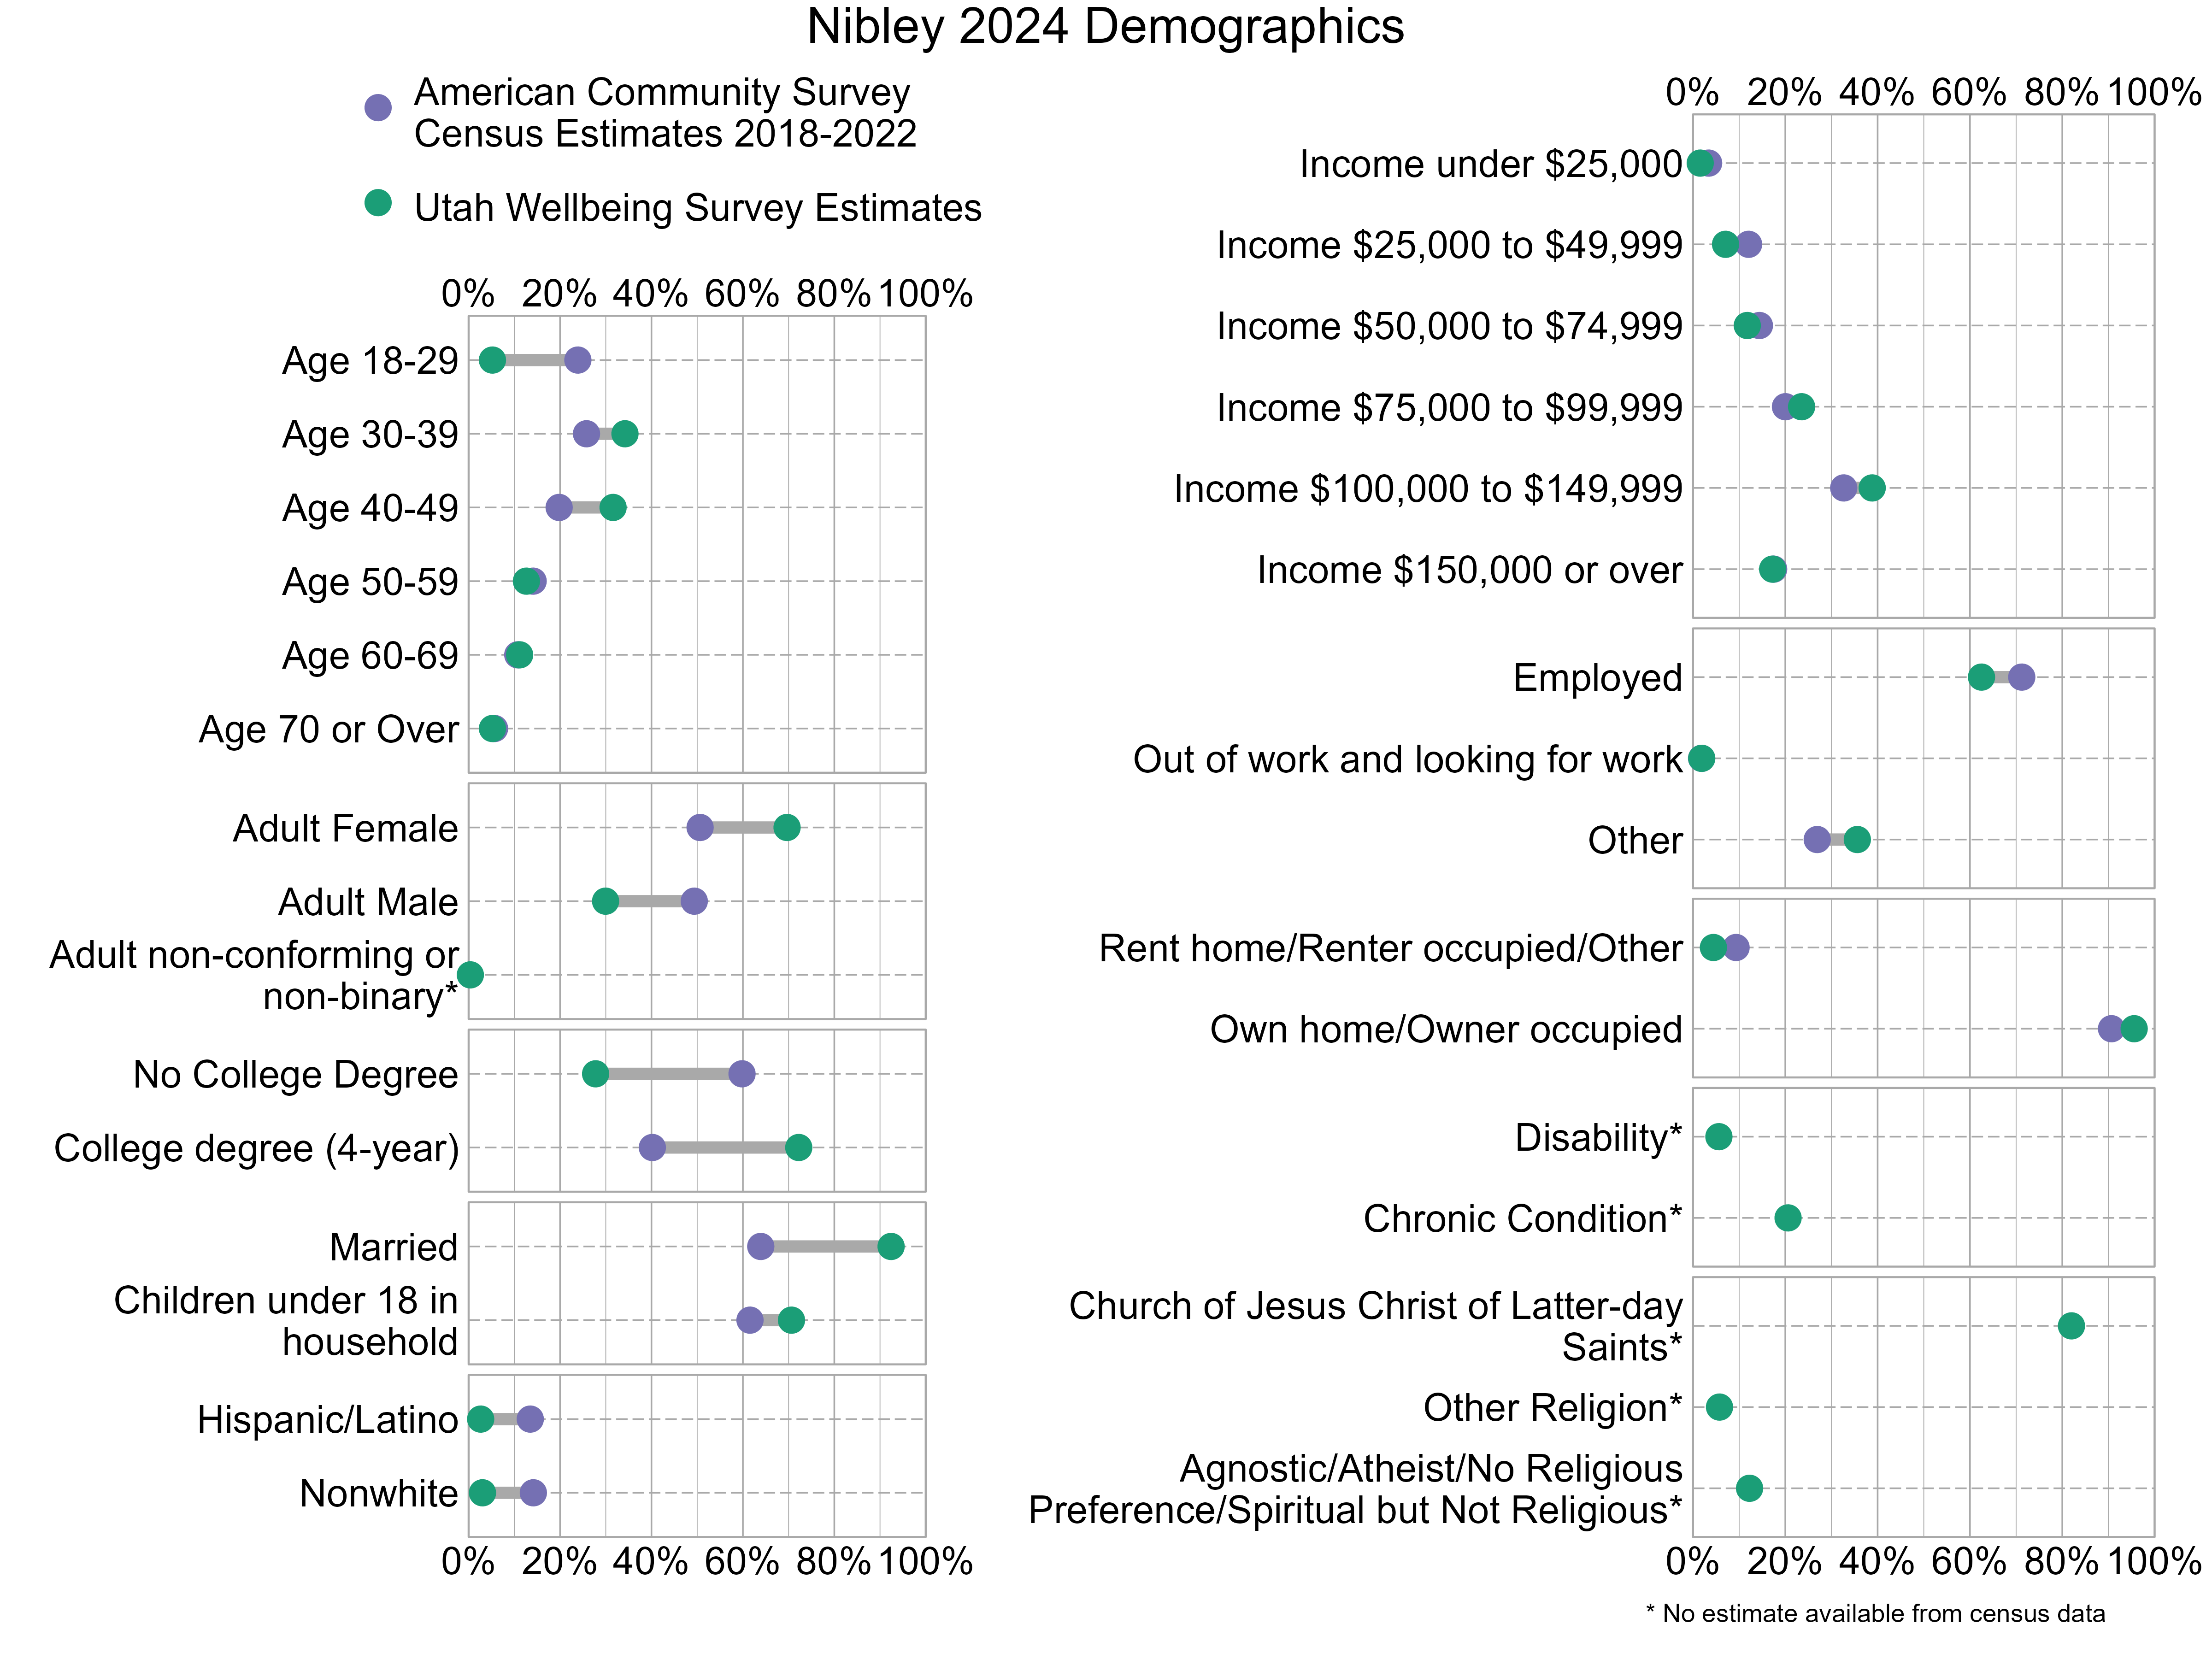
Demographic characteristics of the survey respondents were compared below with U.S. Census information from the 2018-2022 American Community Survey. In the graph below, gray bars indicate differences between the American Community Survey estimates and the Utah Wellbeing Project surveys. The wider the gray bars, the larger the differences. Also note that estimates for religious affiliation, adult non-conforming or non-binary gender, disability, and chronic conditions are unavailable from the census data. There can also be a variable margin of error in the American Community Survey estimates, and caution should be used when comparing estimates. Not all respondents provided demographic information. As the graph shows, 2024 survey respondents were not fully representative of Nibley. People who are adult females, have at least a 4-year college degree, and are married were overrepresented while those who are age 18-29, are adult males, and do not have a college degree were underrepresented.
Overall Personal Wellbeing and Overall Wellbeing in Nibley
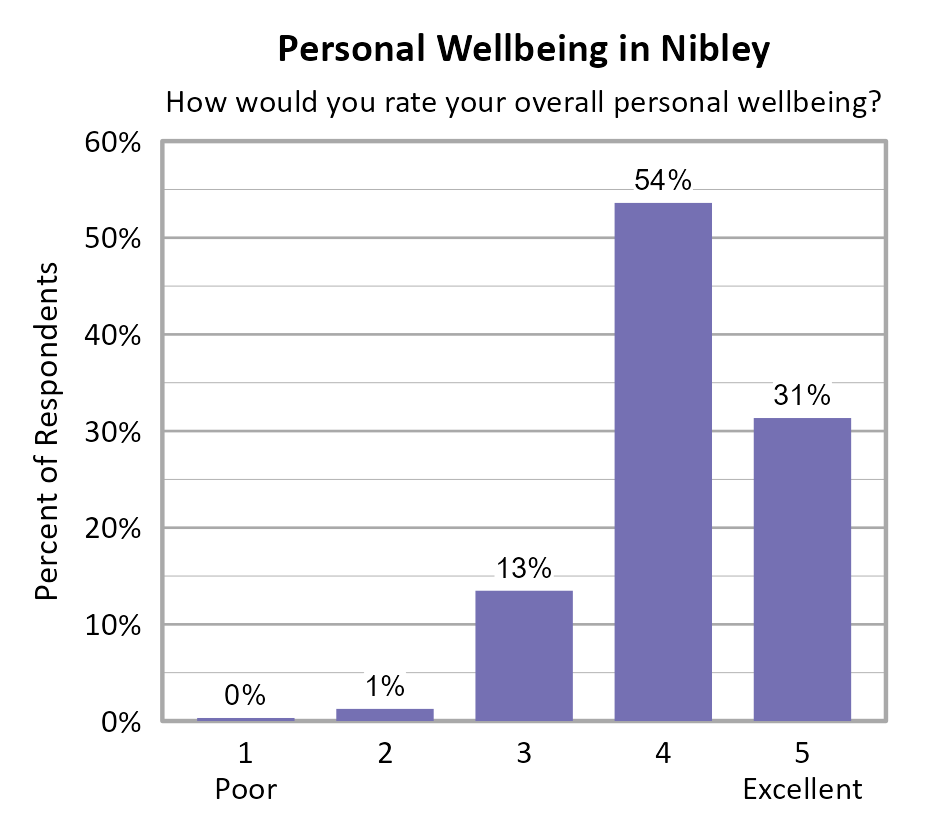
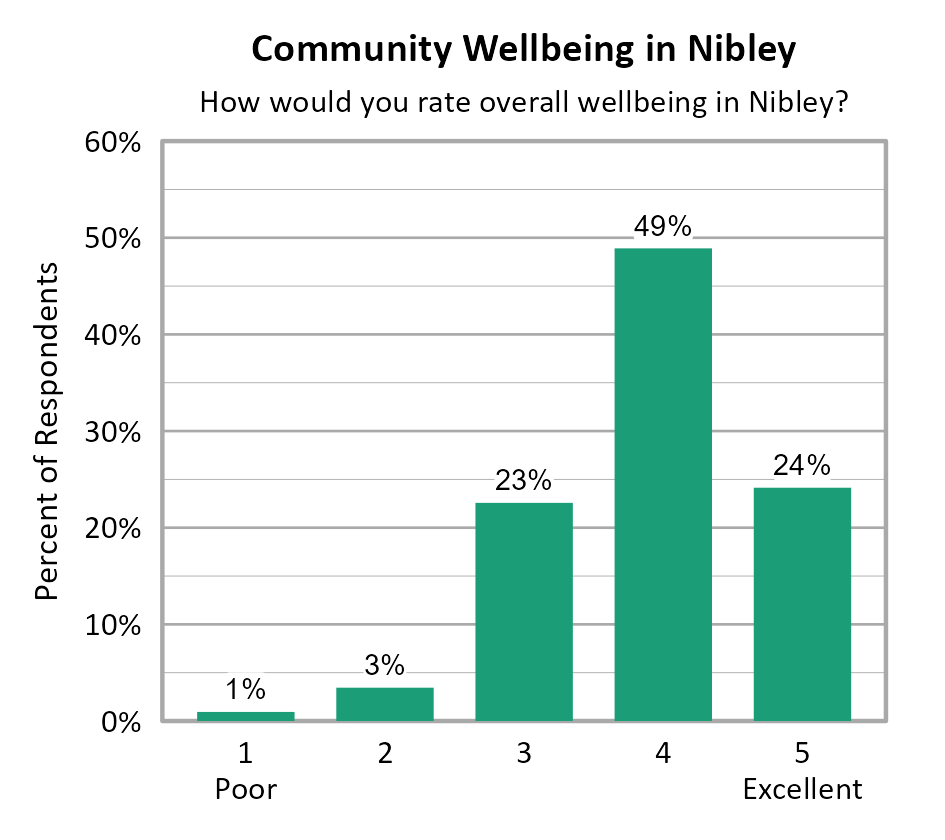
Survey participants were asked about their overall personal wellbeing and overall community wellbeing in Nibley. These wellbeing indicators were both measured on a 5-point scale from poor (1) to excellent (5). The average personal wellbeing score in Nibley was 4.14 with 85% of respondents indicating their wellbeing at a 4 or 5 on the 5-point scale. The average score for community wellbeing in Nibley was 3.92 with 73% of respondents indicating community wellbeing at a 4 or 5 on the 5-point scale.
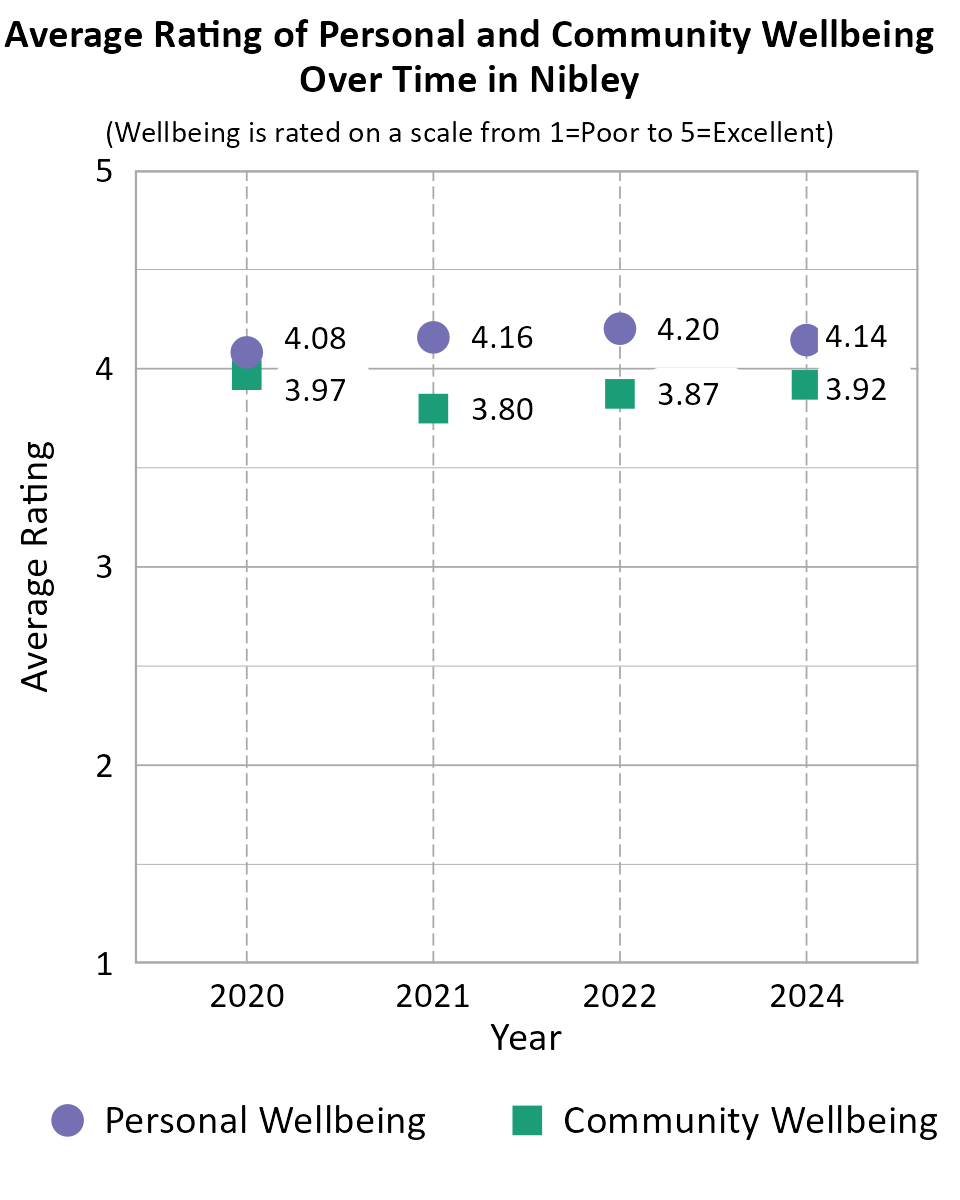
When comparing survey data from Nibley over the years as shown in the information below, we can see that the average personal wellbeing score increased from 2020 to 2022, and saw a small decline from 2022 to 2024. The average community wellbeing score saw a decline from 2020 to 2021, but has increased since then. Note that the number of respondents differed between years, there is no tracking of individuals from one year to the next, and the low end of the scale was "Poor" in 2024 but "Very Poor" in prior years which may account for differences in scores over time.
Comparing Wellbeing Across Utah Cities
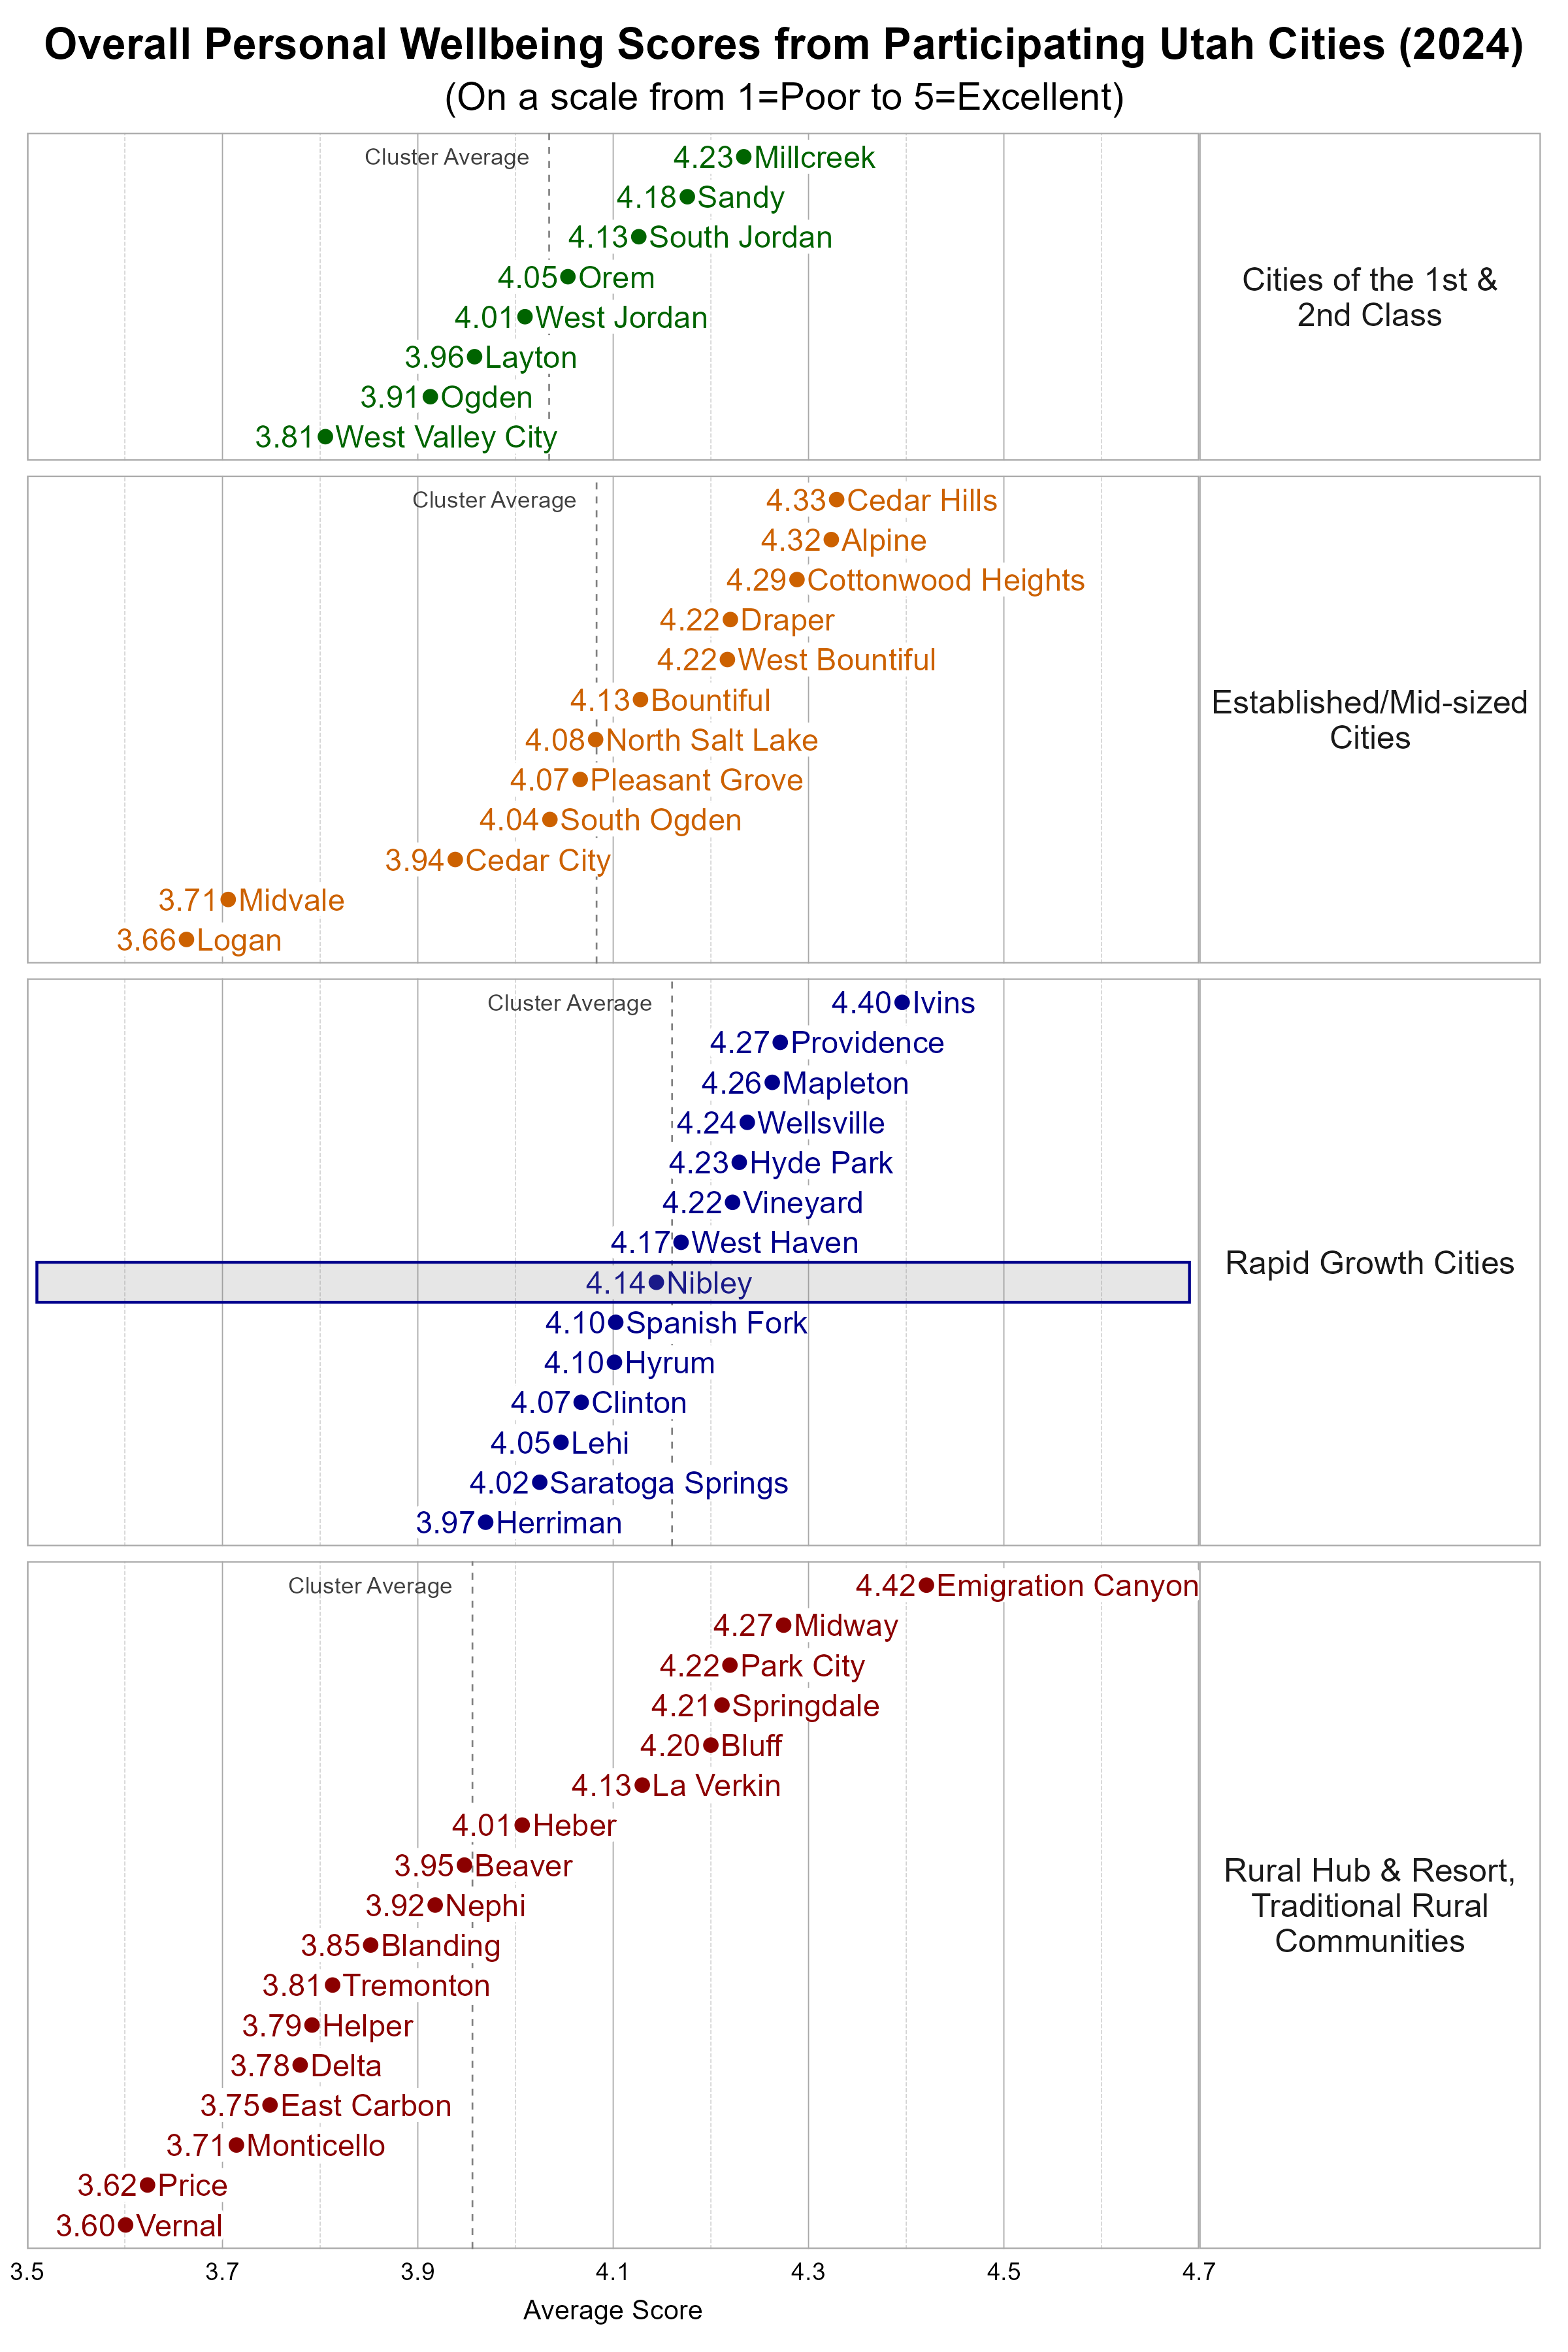
The Utah League of Cities and Towns clusters cities and towns into five different categories based on size and growth rates. We utilize these clusters in our analysis. Nibley is classified as a Rapid Growth City. Some cities may fit within more than one cluster.
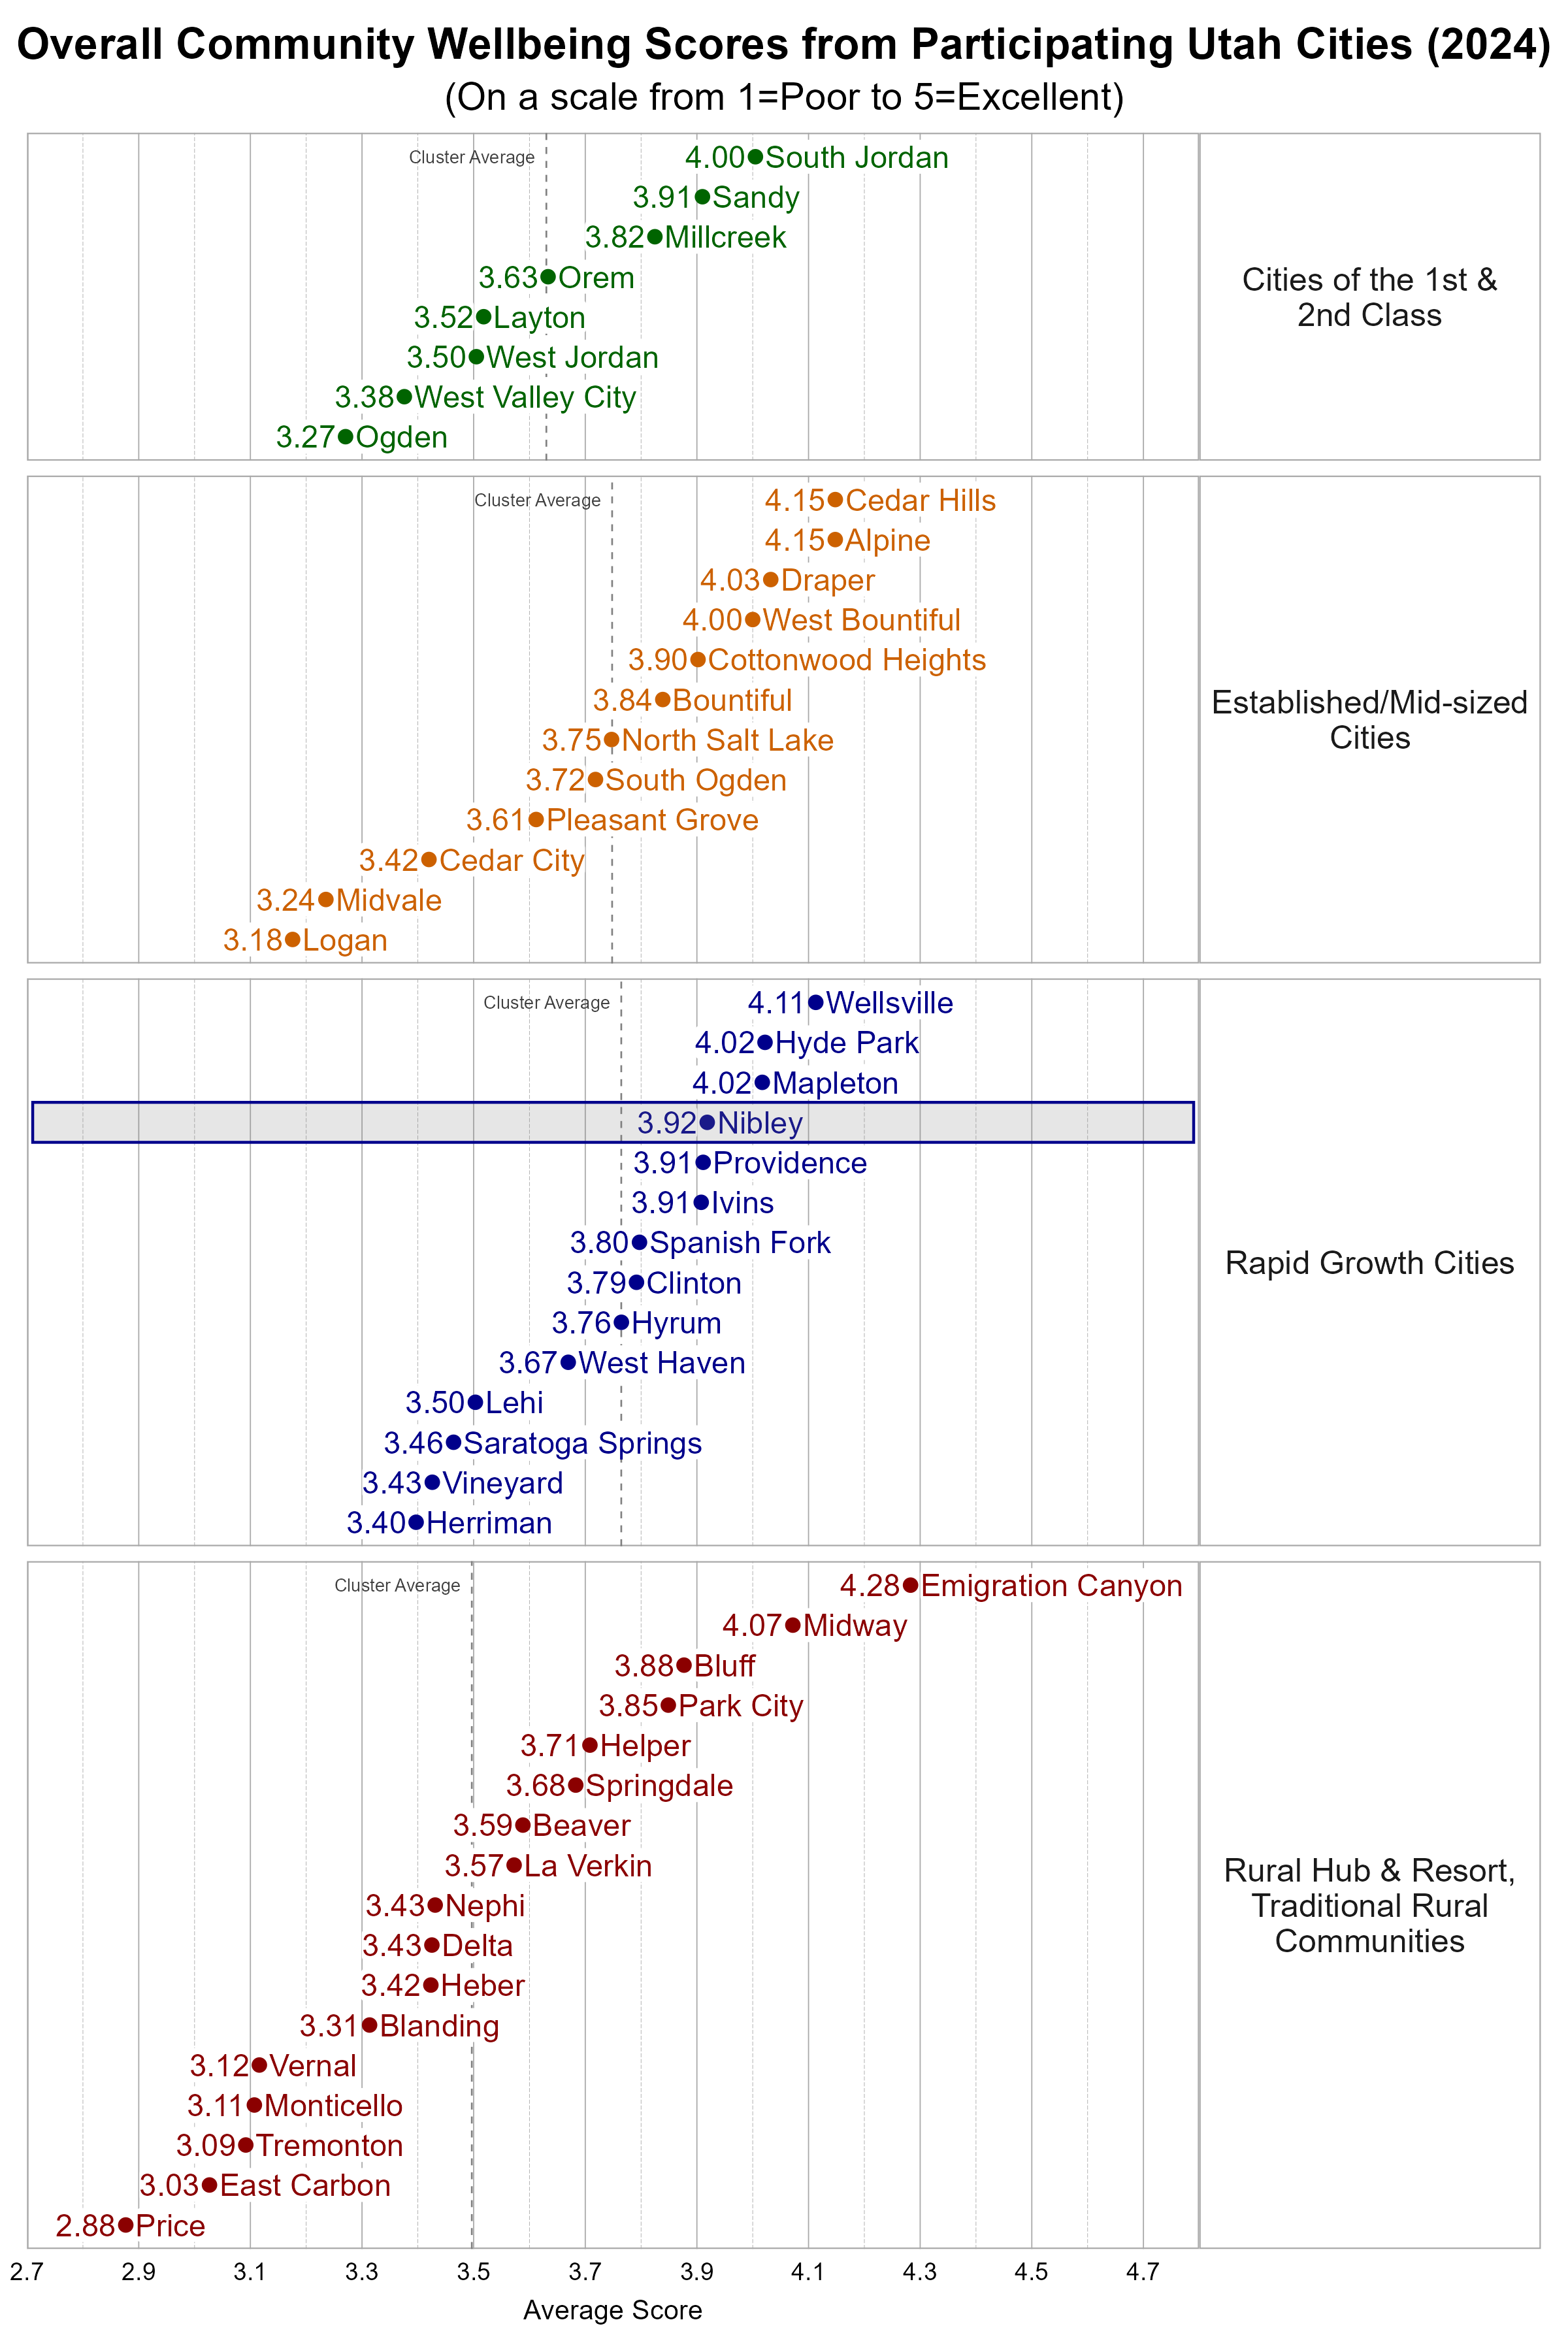
Within the Rapid Growth city cluster, Nibley was close to the average overall personal wellbeing score and above the average overall community wellbeing score.
Wellbeing Domains in Nibley
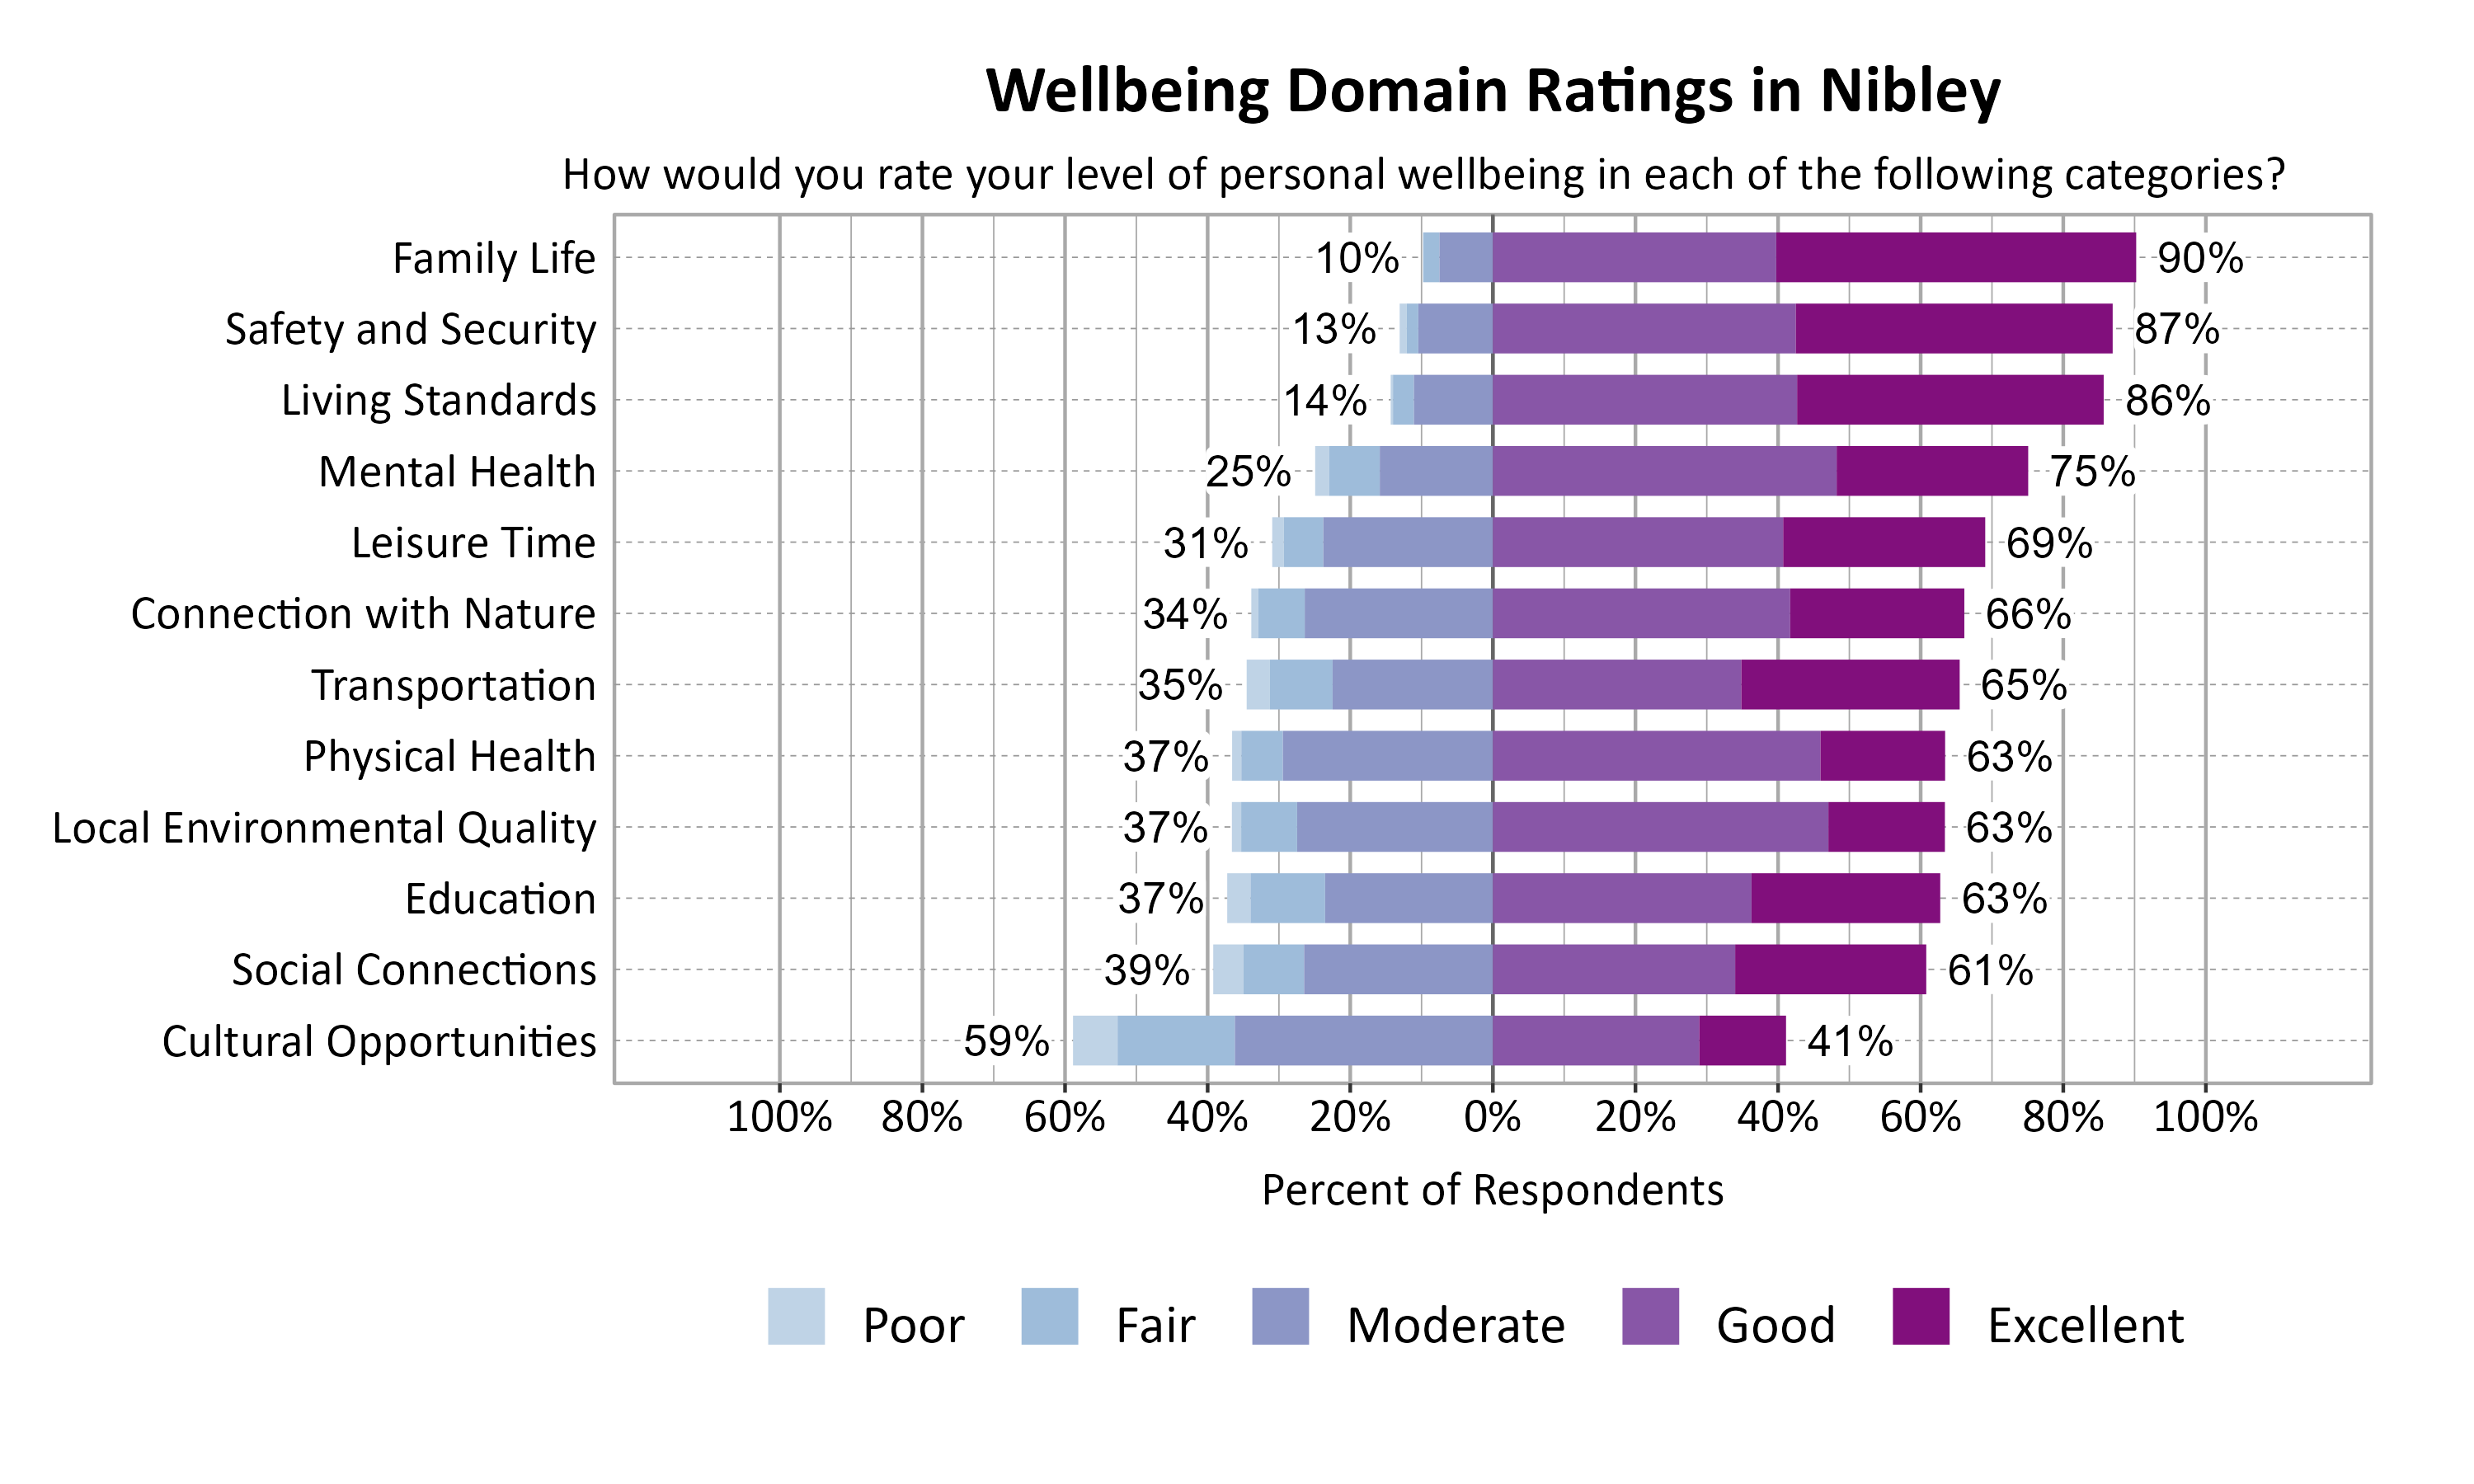
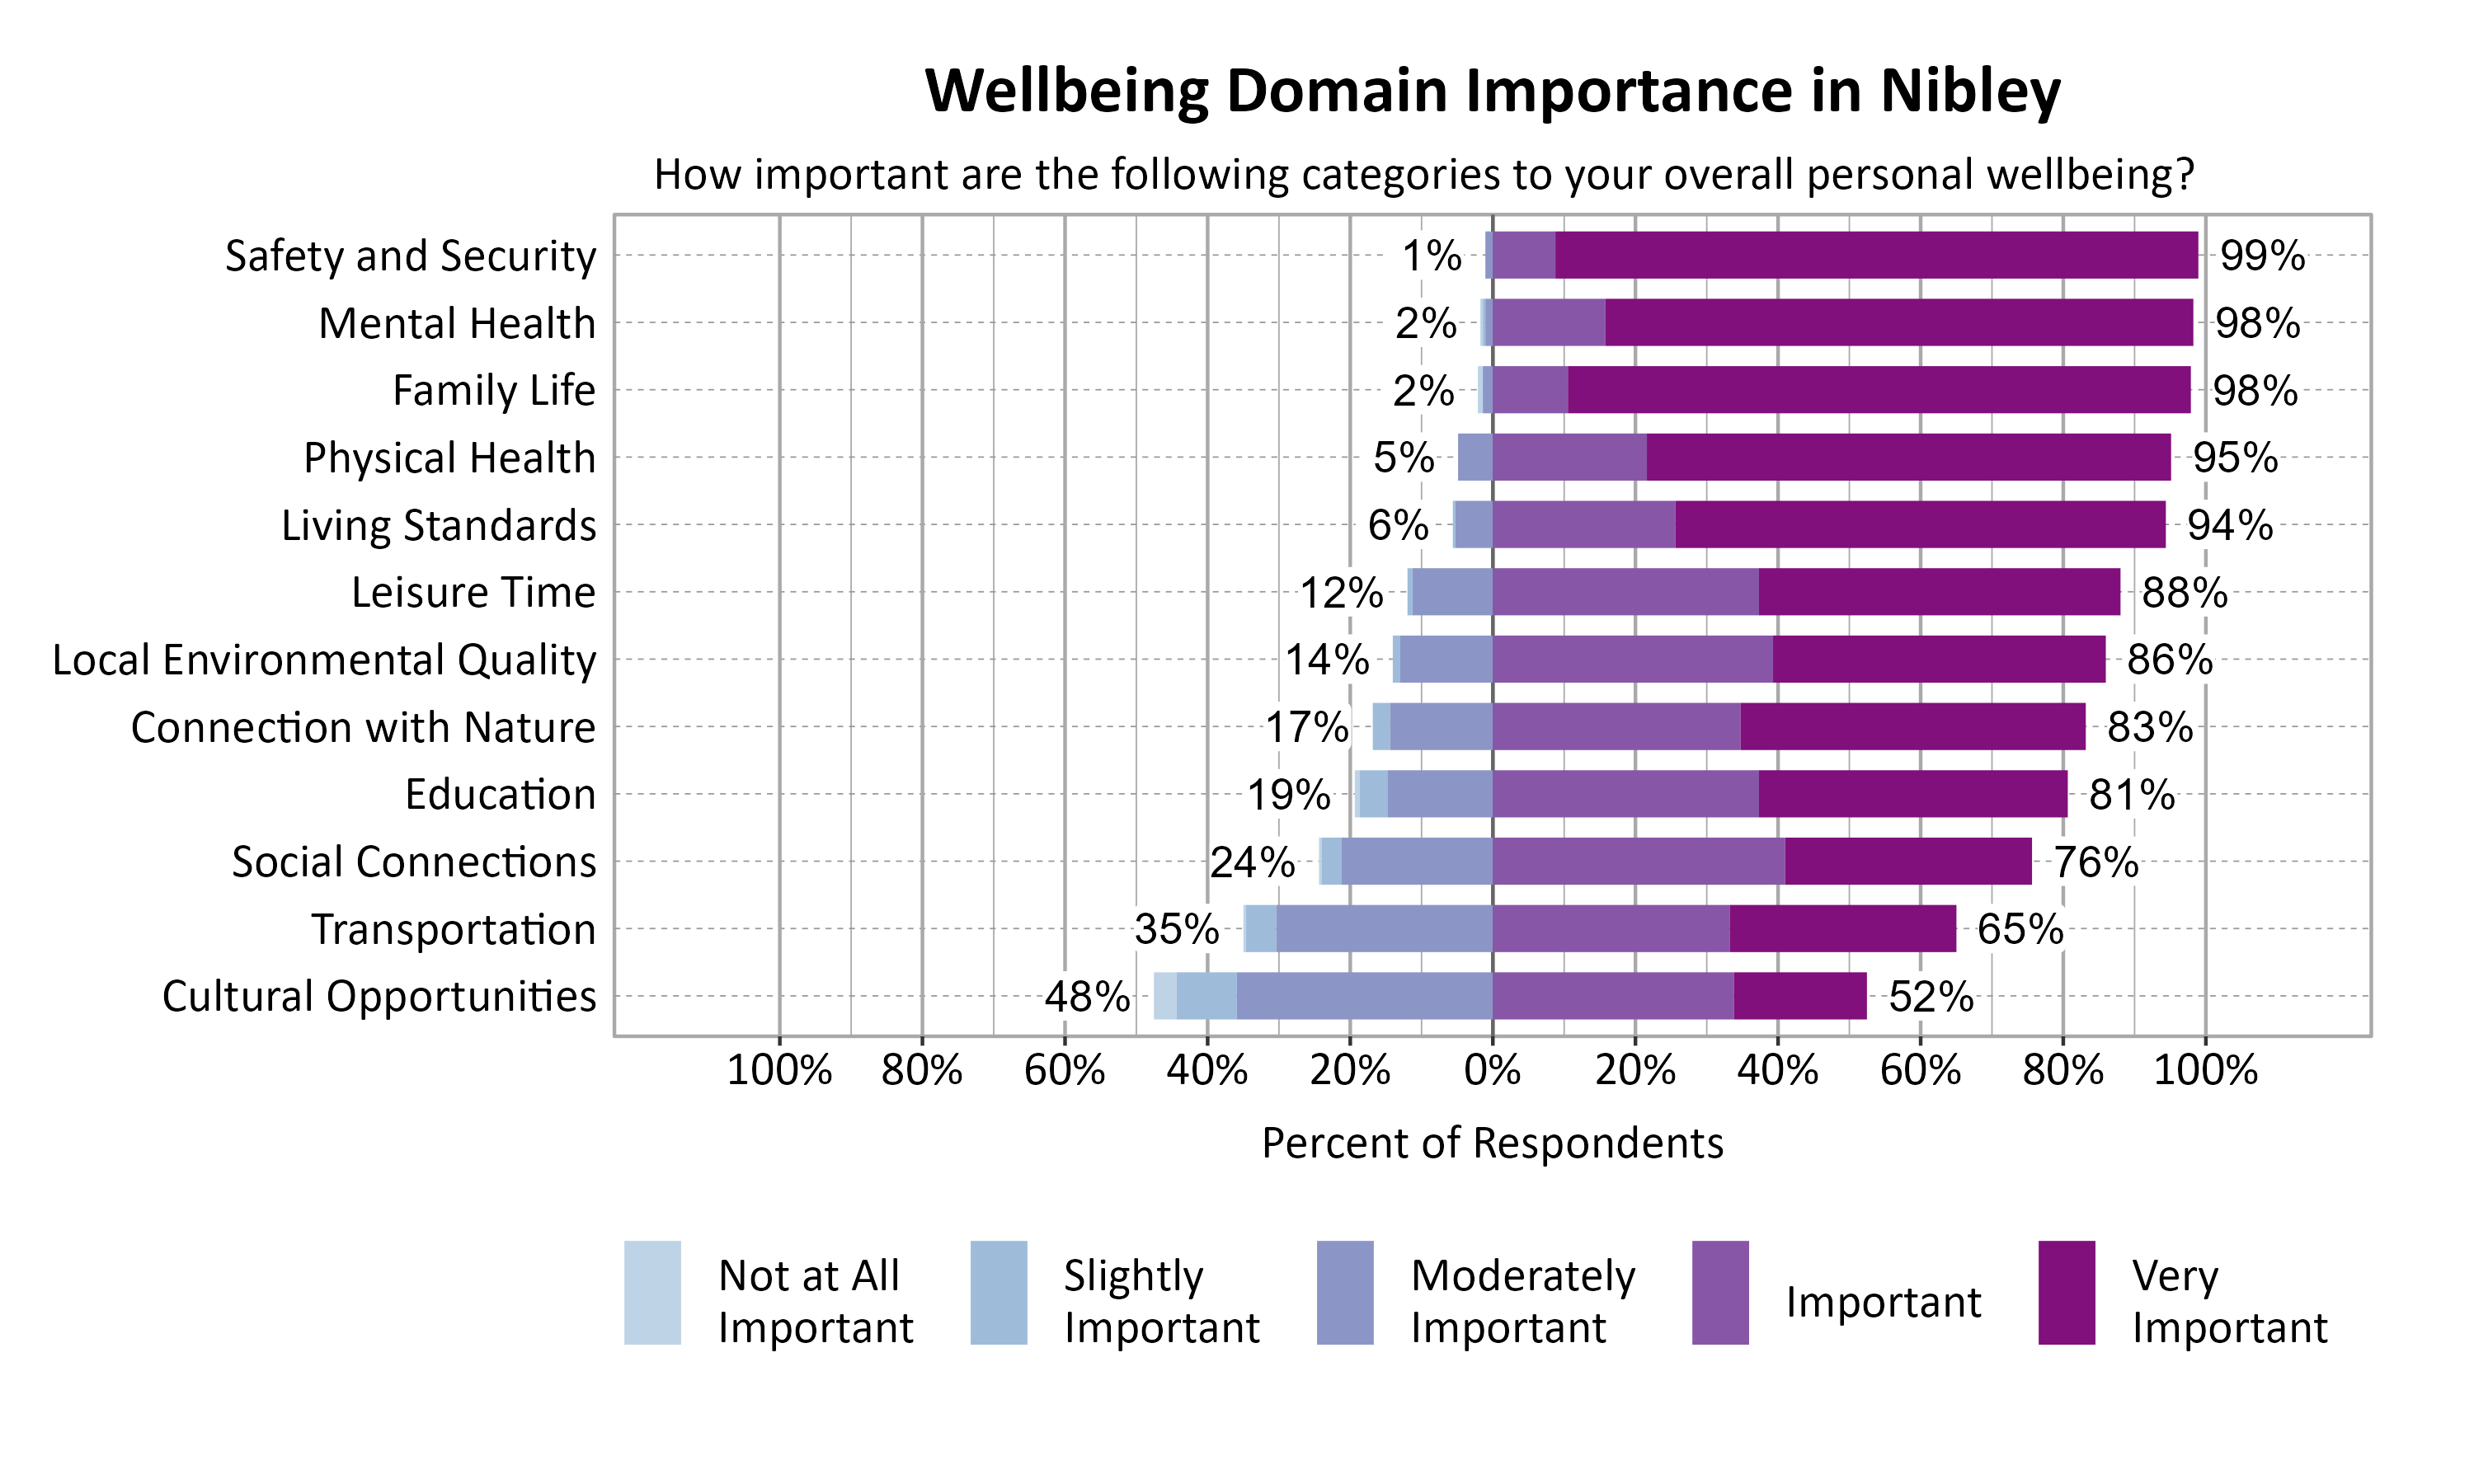
According to national and international entities that track wellbeing, there are a number of common dimensions or domains of wellbeing. Survey respondents rated twelve domains on a 5-point scale from poor to excellent. They were also asked to indicate the importance of each domain to their overall personal wellbeing on a 5-point scale from not at all important to very important. The highest rated wellbeing domains for respondents in Nibley were Family Life (90%), Safety and Security (87%), and Living Standards (86%). The most important wellbeing domains were Safety and Security (99%), Mental Health (98%), and Family Life (98%).
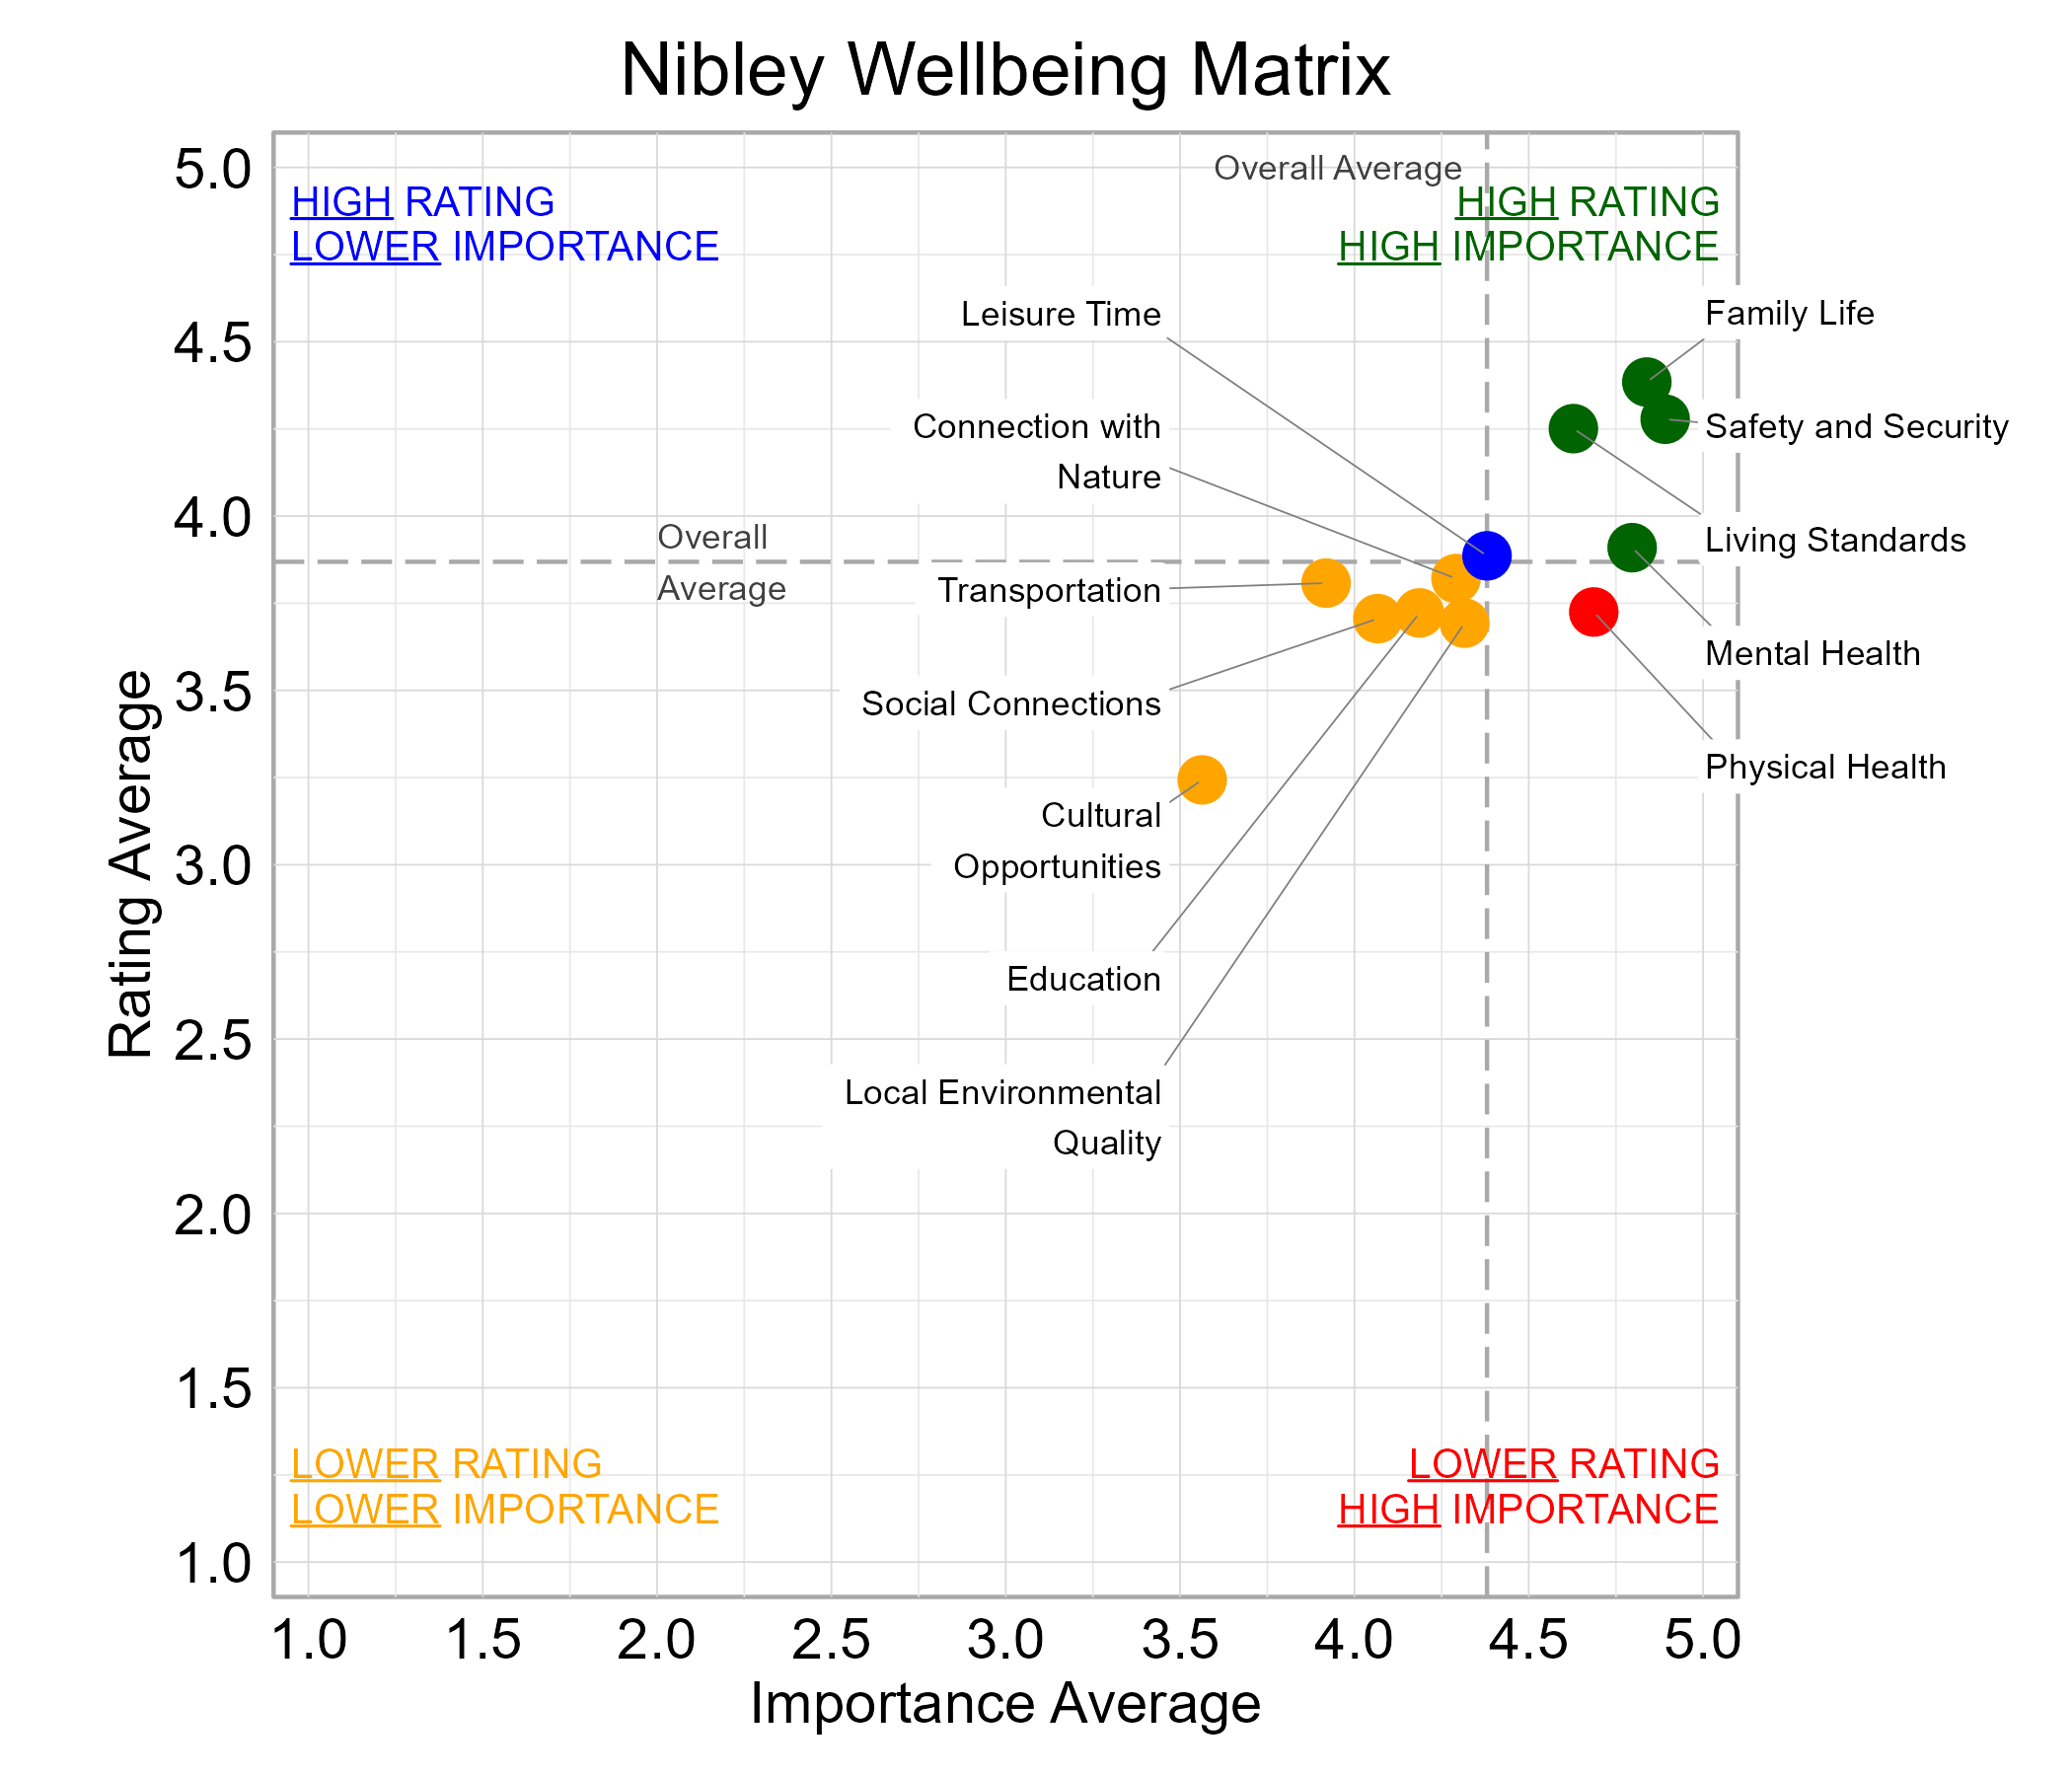
Wellbeing Matrix for Nibley
The graph below illustrates the relationship between the average rating and the average importance of wellbeing domains for survey respondents from Nibley. Family Life, Living Standards, Mental Health, and Safety and Security were highly important and rated above average among the domains. Physical Health fell in the “red zone” of higher importance and lower ratings.
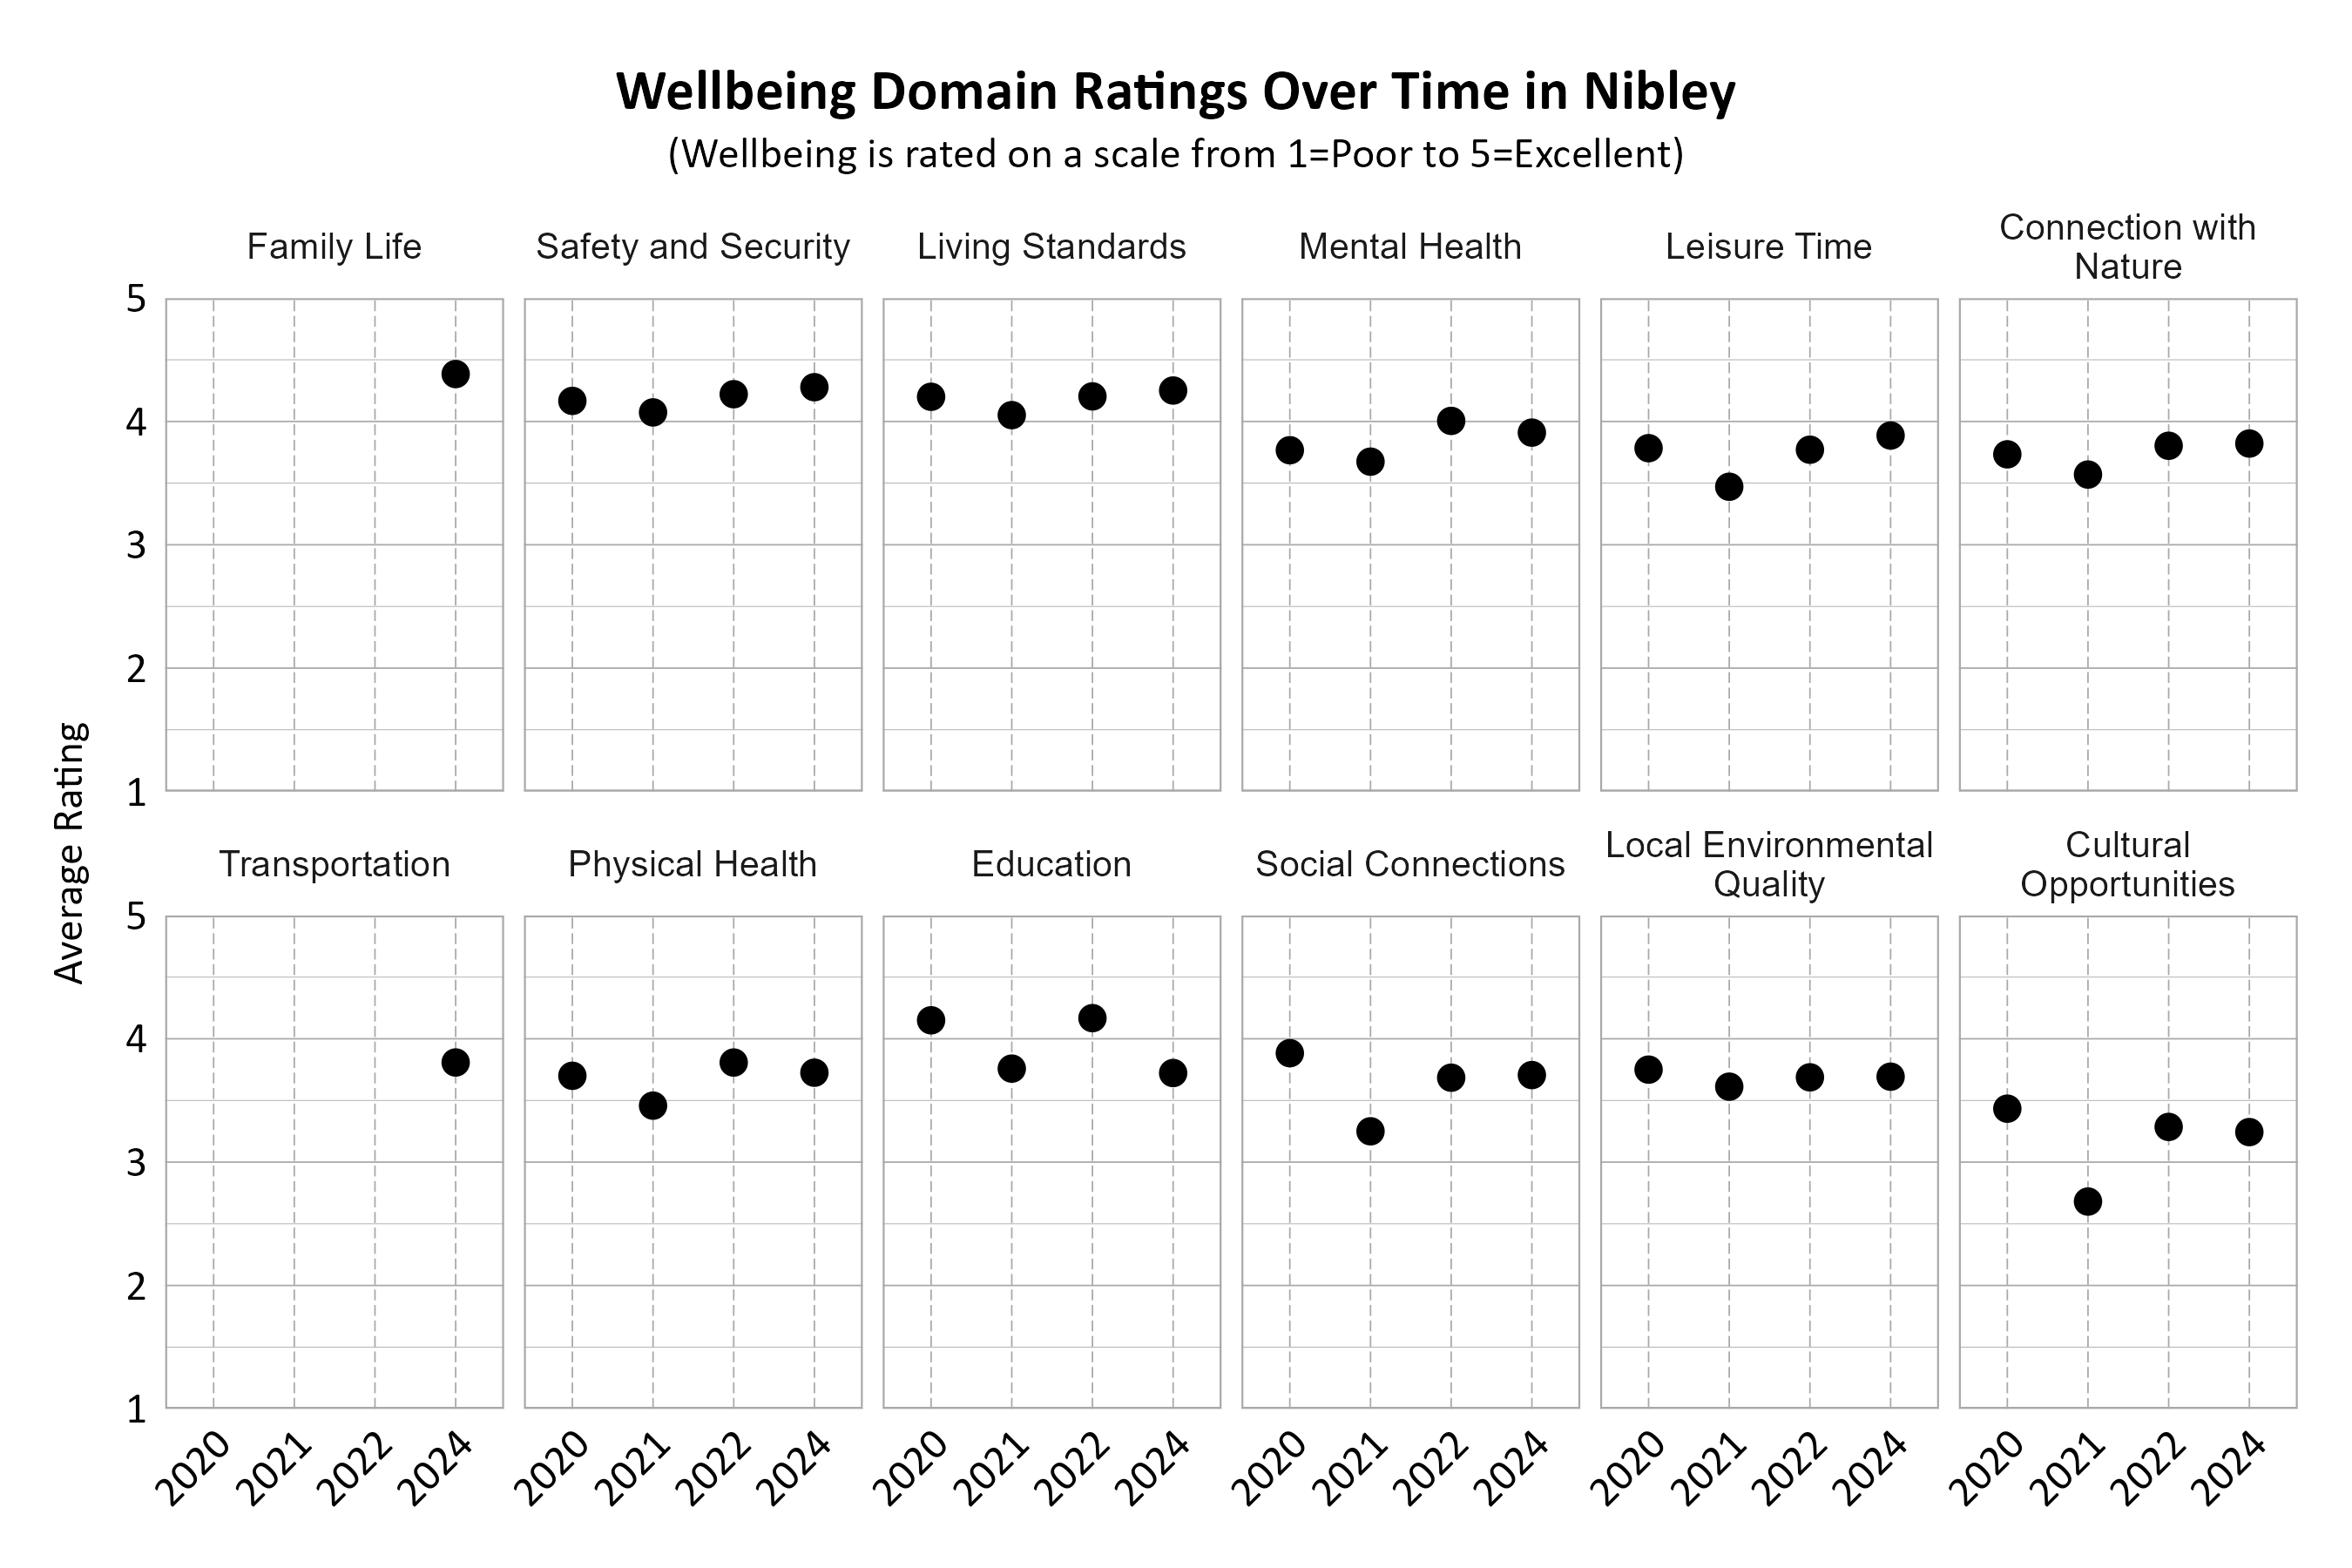
Wellbeing Domains Over Time in Nibley
The graphs below show how the domains were rated over the years by Nibley residents. The number of respondents changed over time. Note that the two domains Family Life and Transportation were new categories in the 2024 survey and were not measured in previous years. Safety and Security and Living Standards were consistently highly rated across the years, while Cultural Opportunities was among the lowest.
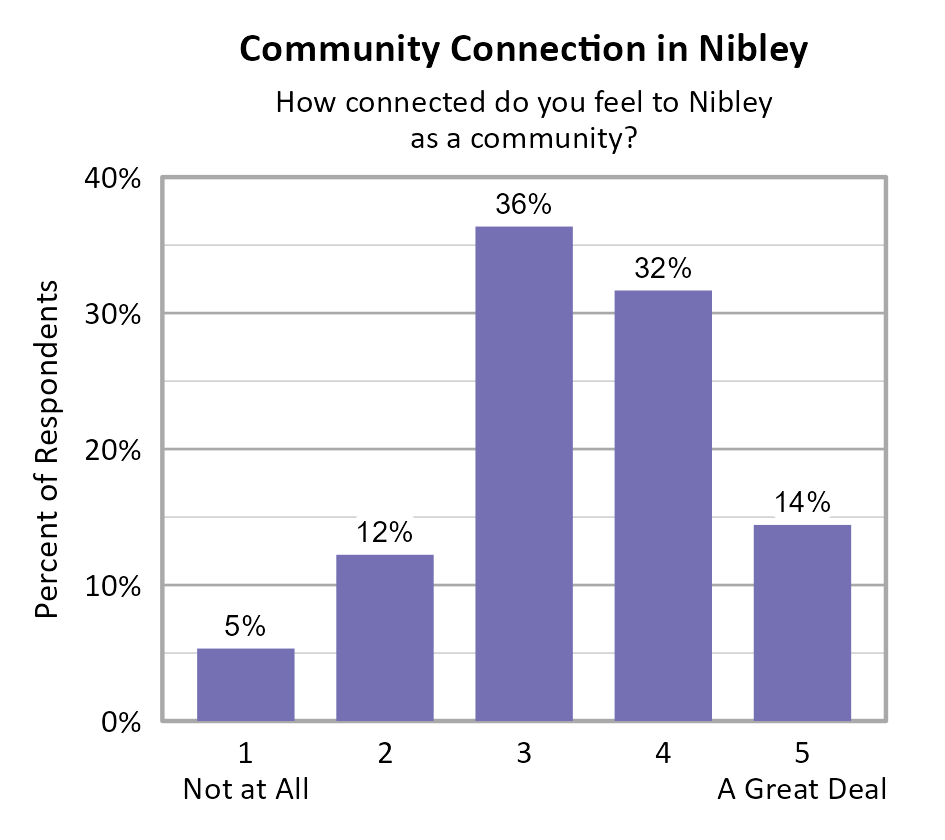
Community Connection in Nibley
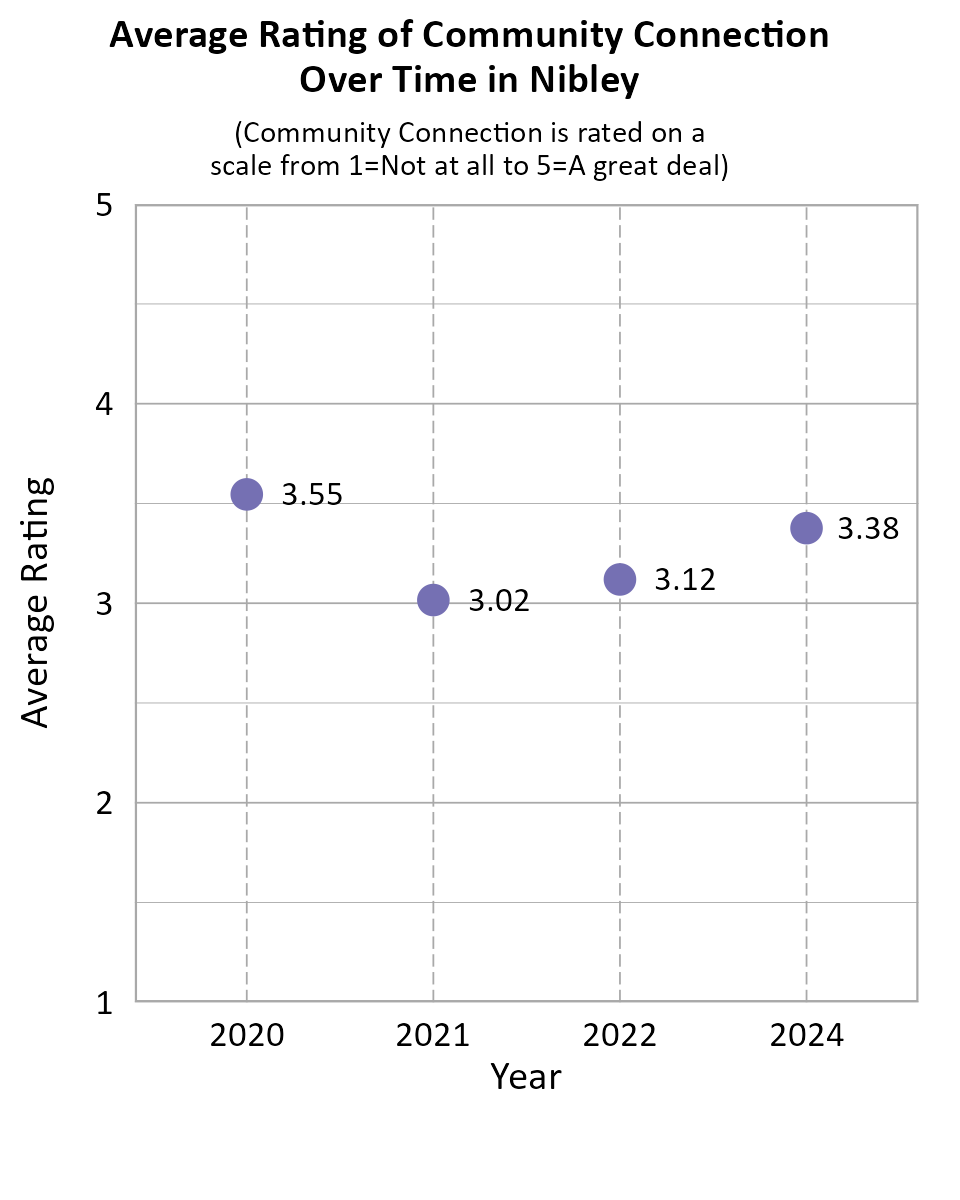
Survey participants were asked about how connected they feel to Nibley on a 5-point scale from not at all (1) to a great deal (5), and the average score of all respondents was 3.38.
When comparing survey data from Nibley over the years as shown in the information below, we can see that the average community connection score saw a decrease from 2020 to 2021, but has increased in each survey year since then.
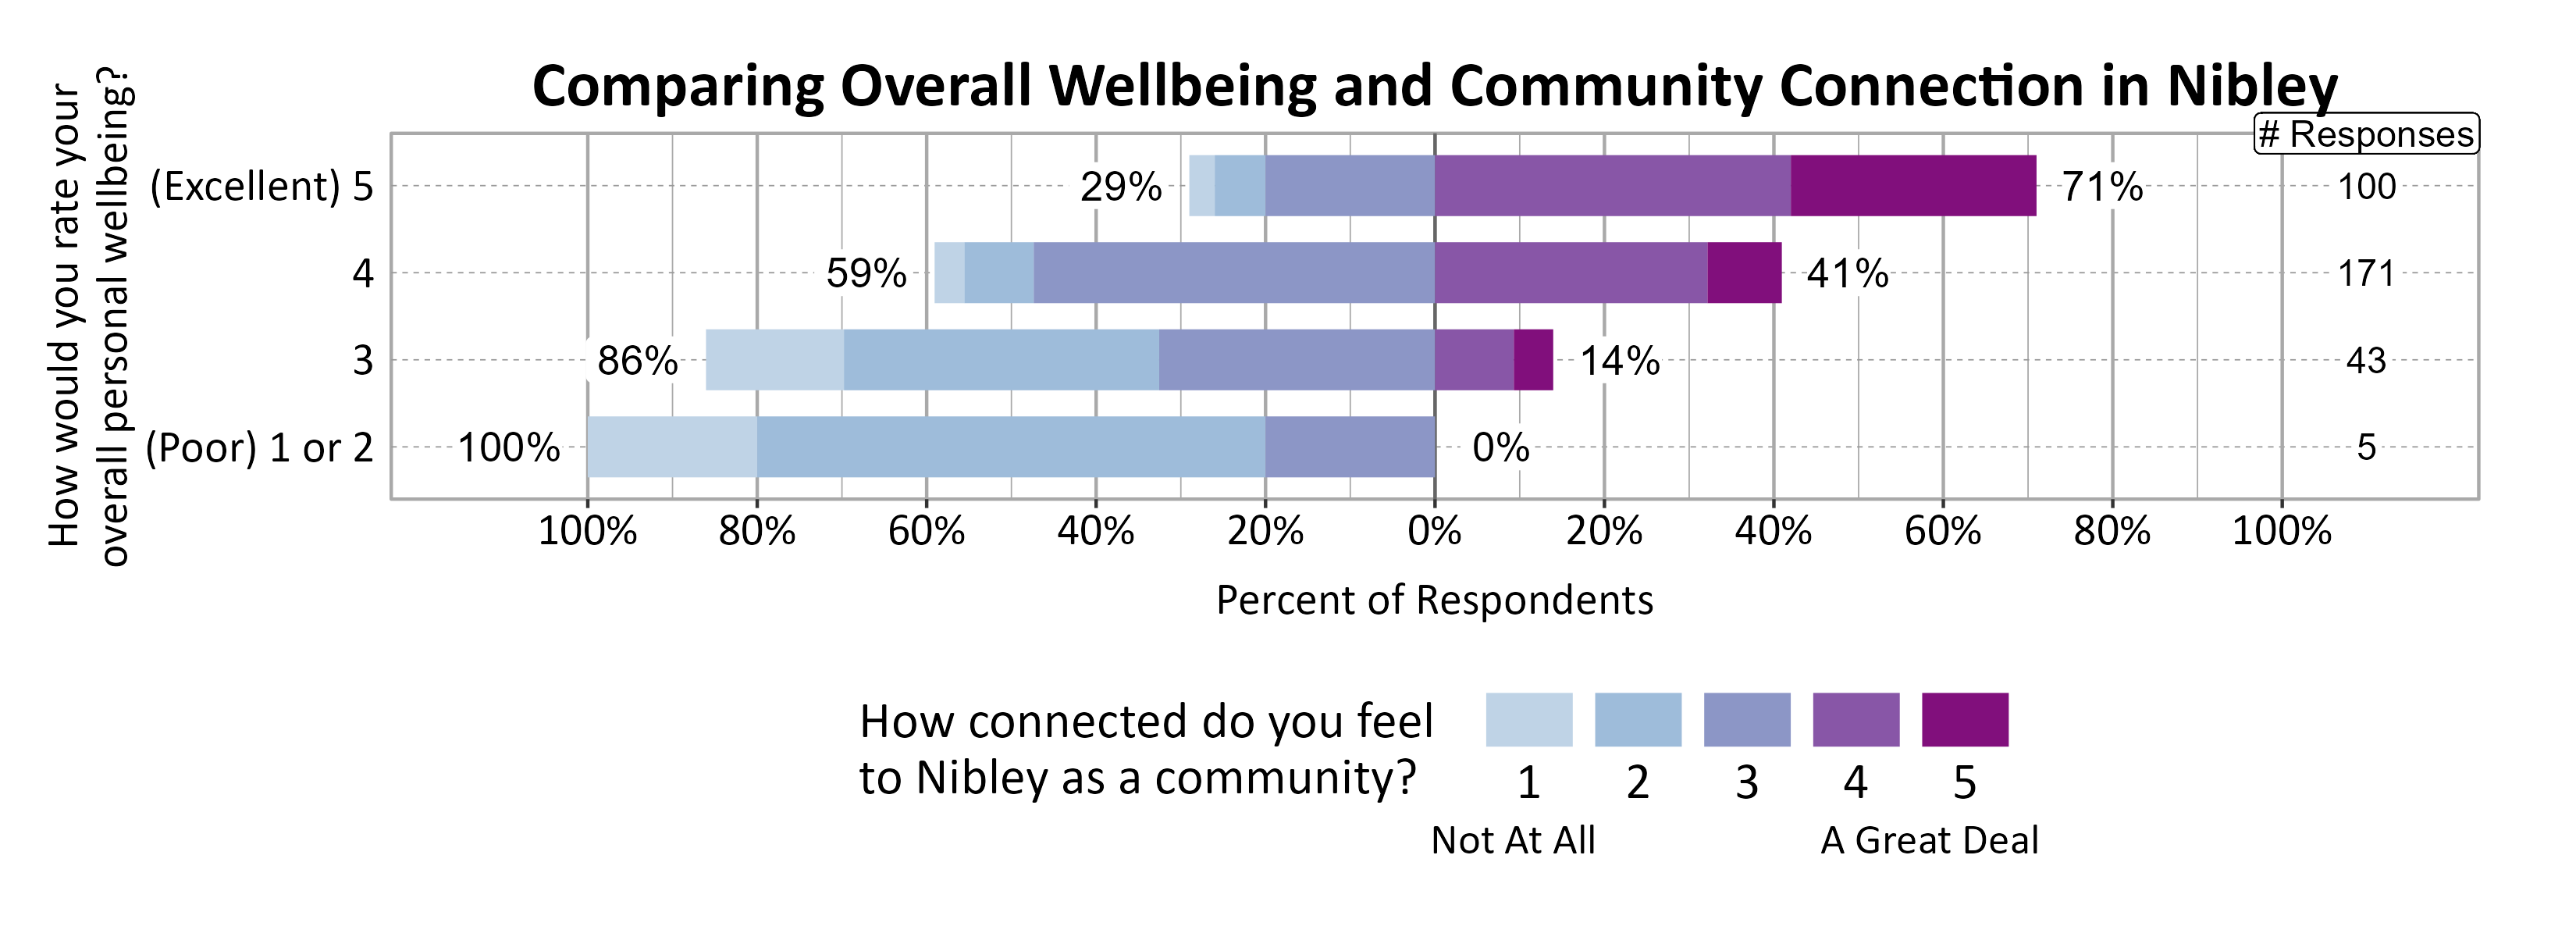
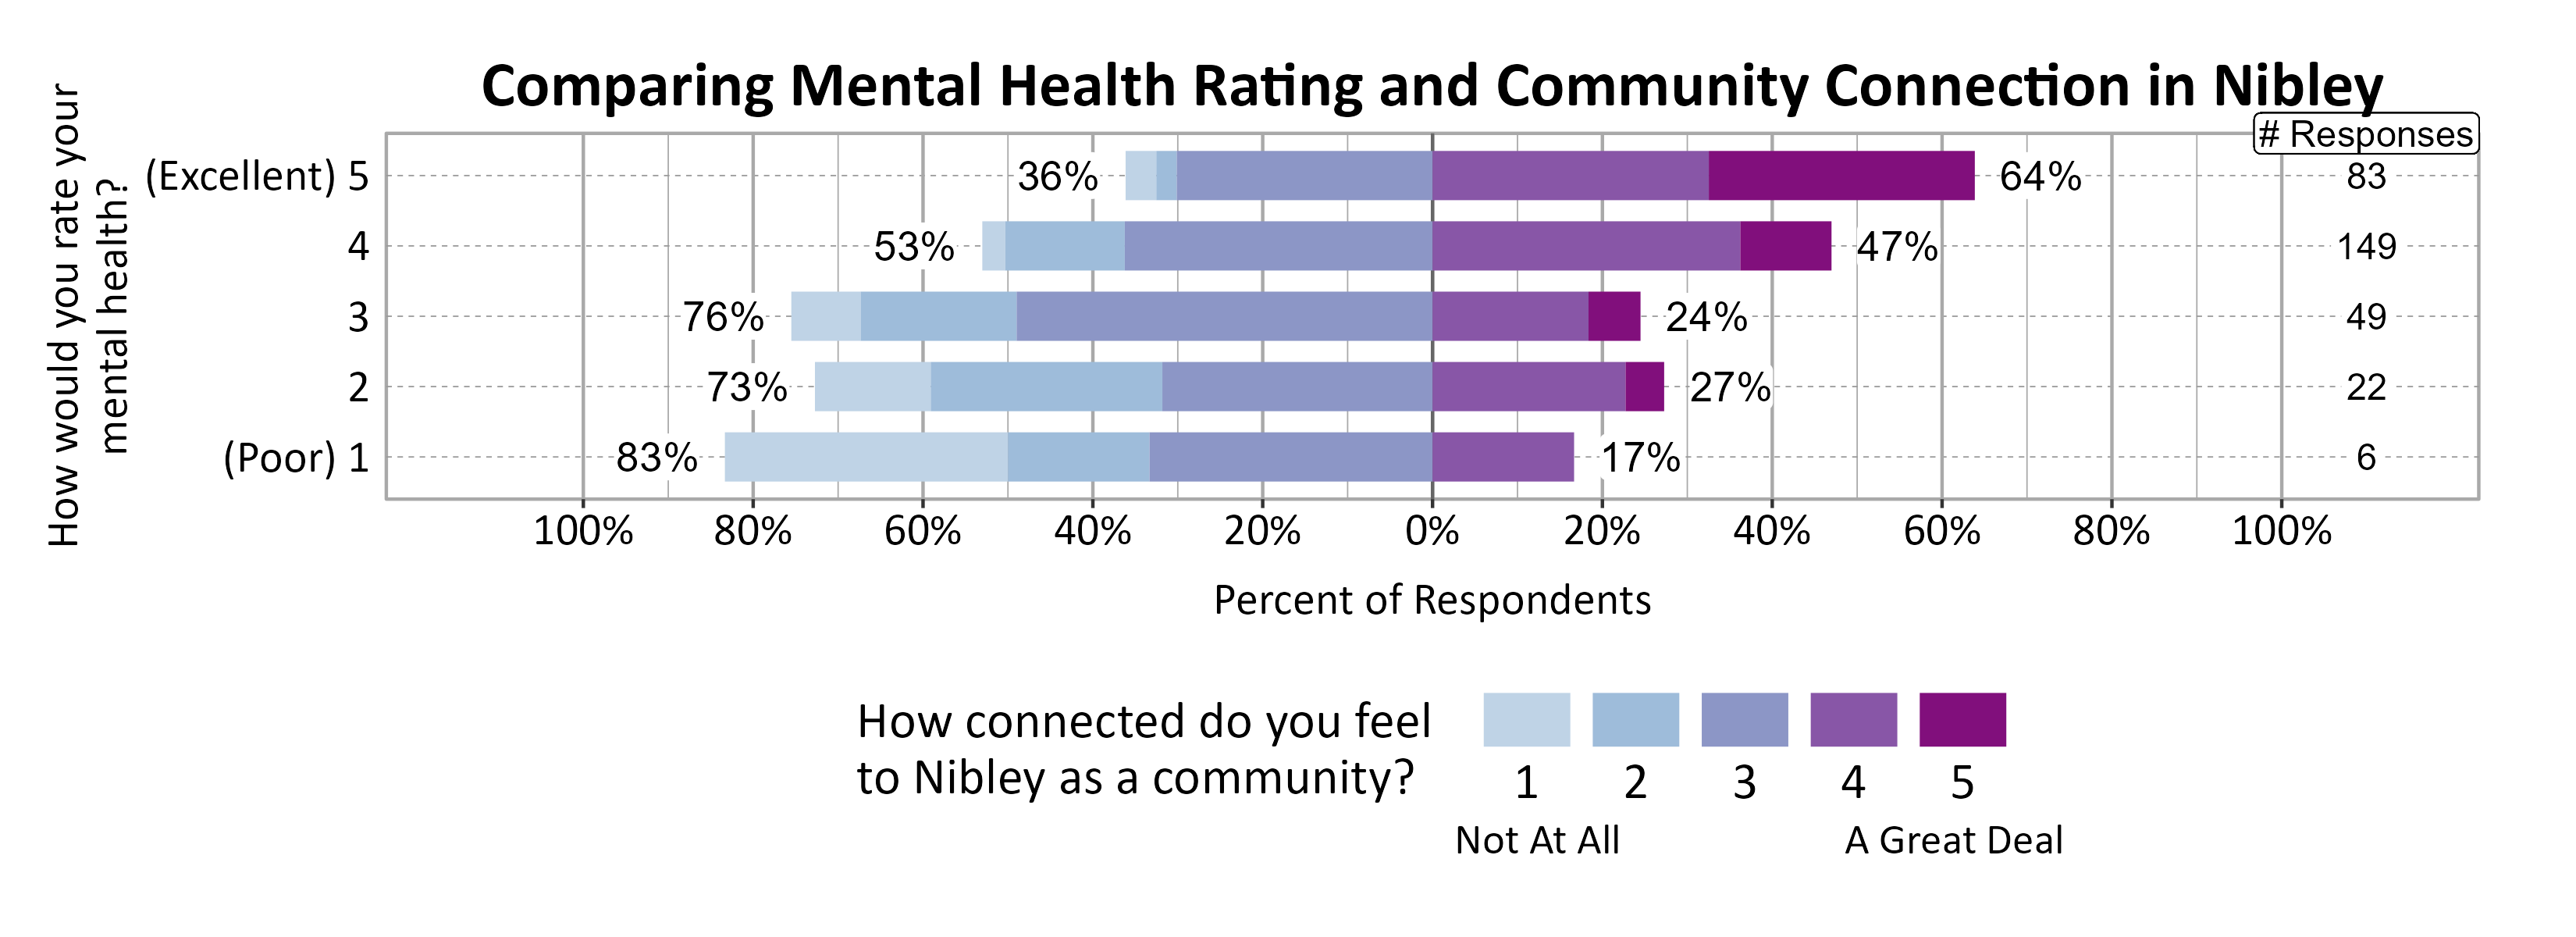
A positive relationship was found between individuals’ community connection and overall personal wellbeing, and to some extent between community connection and mental health.
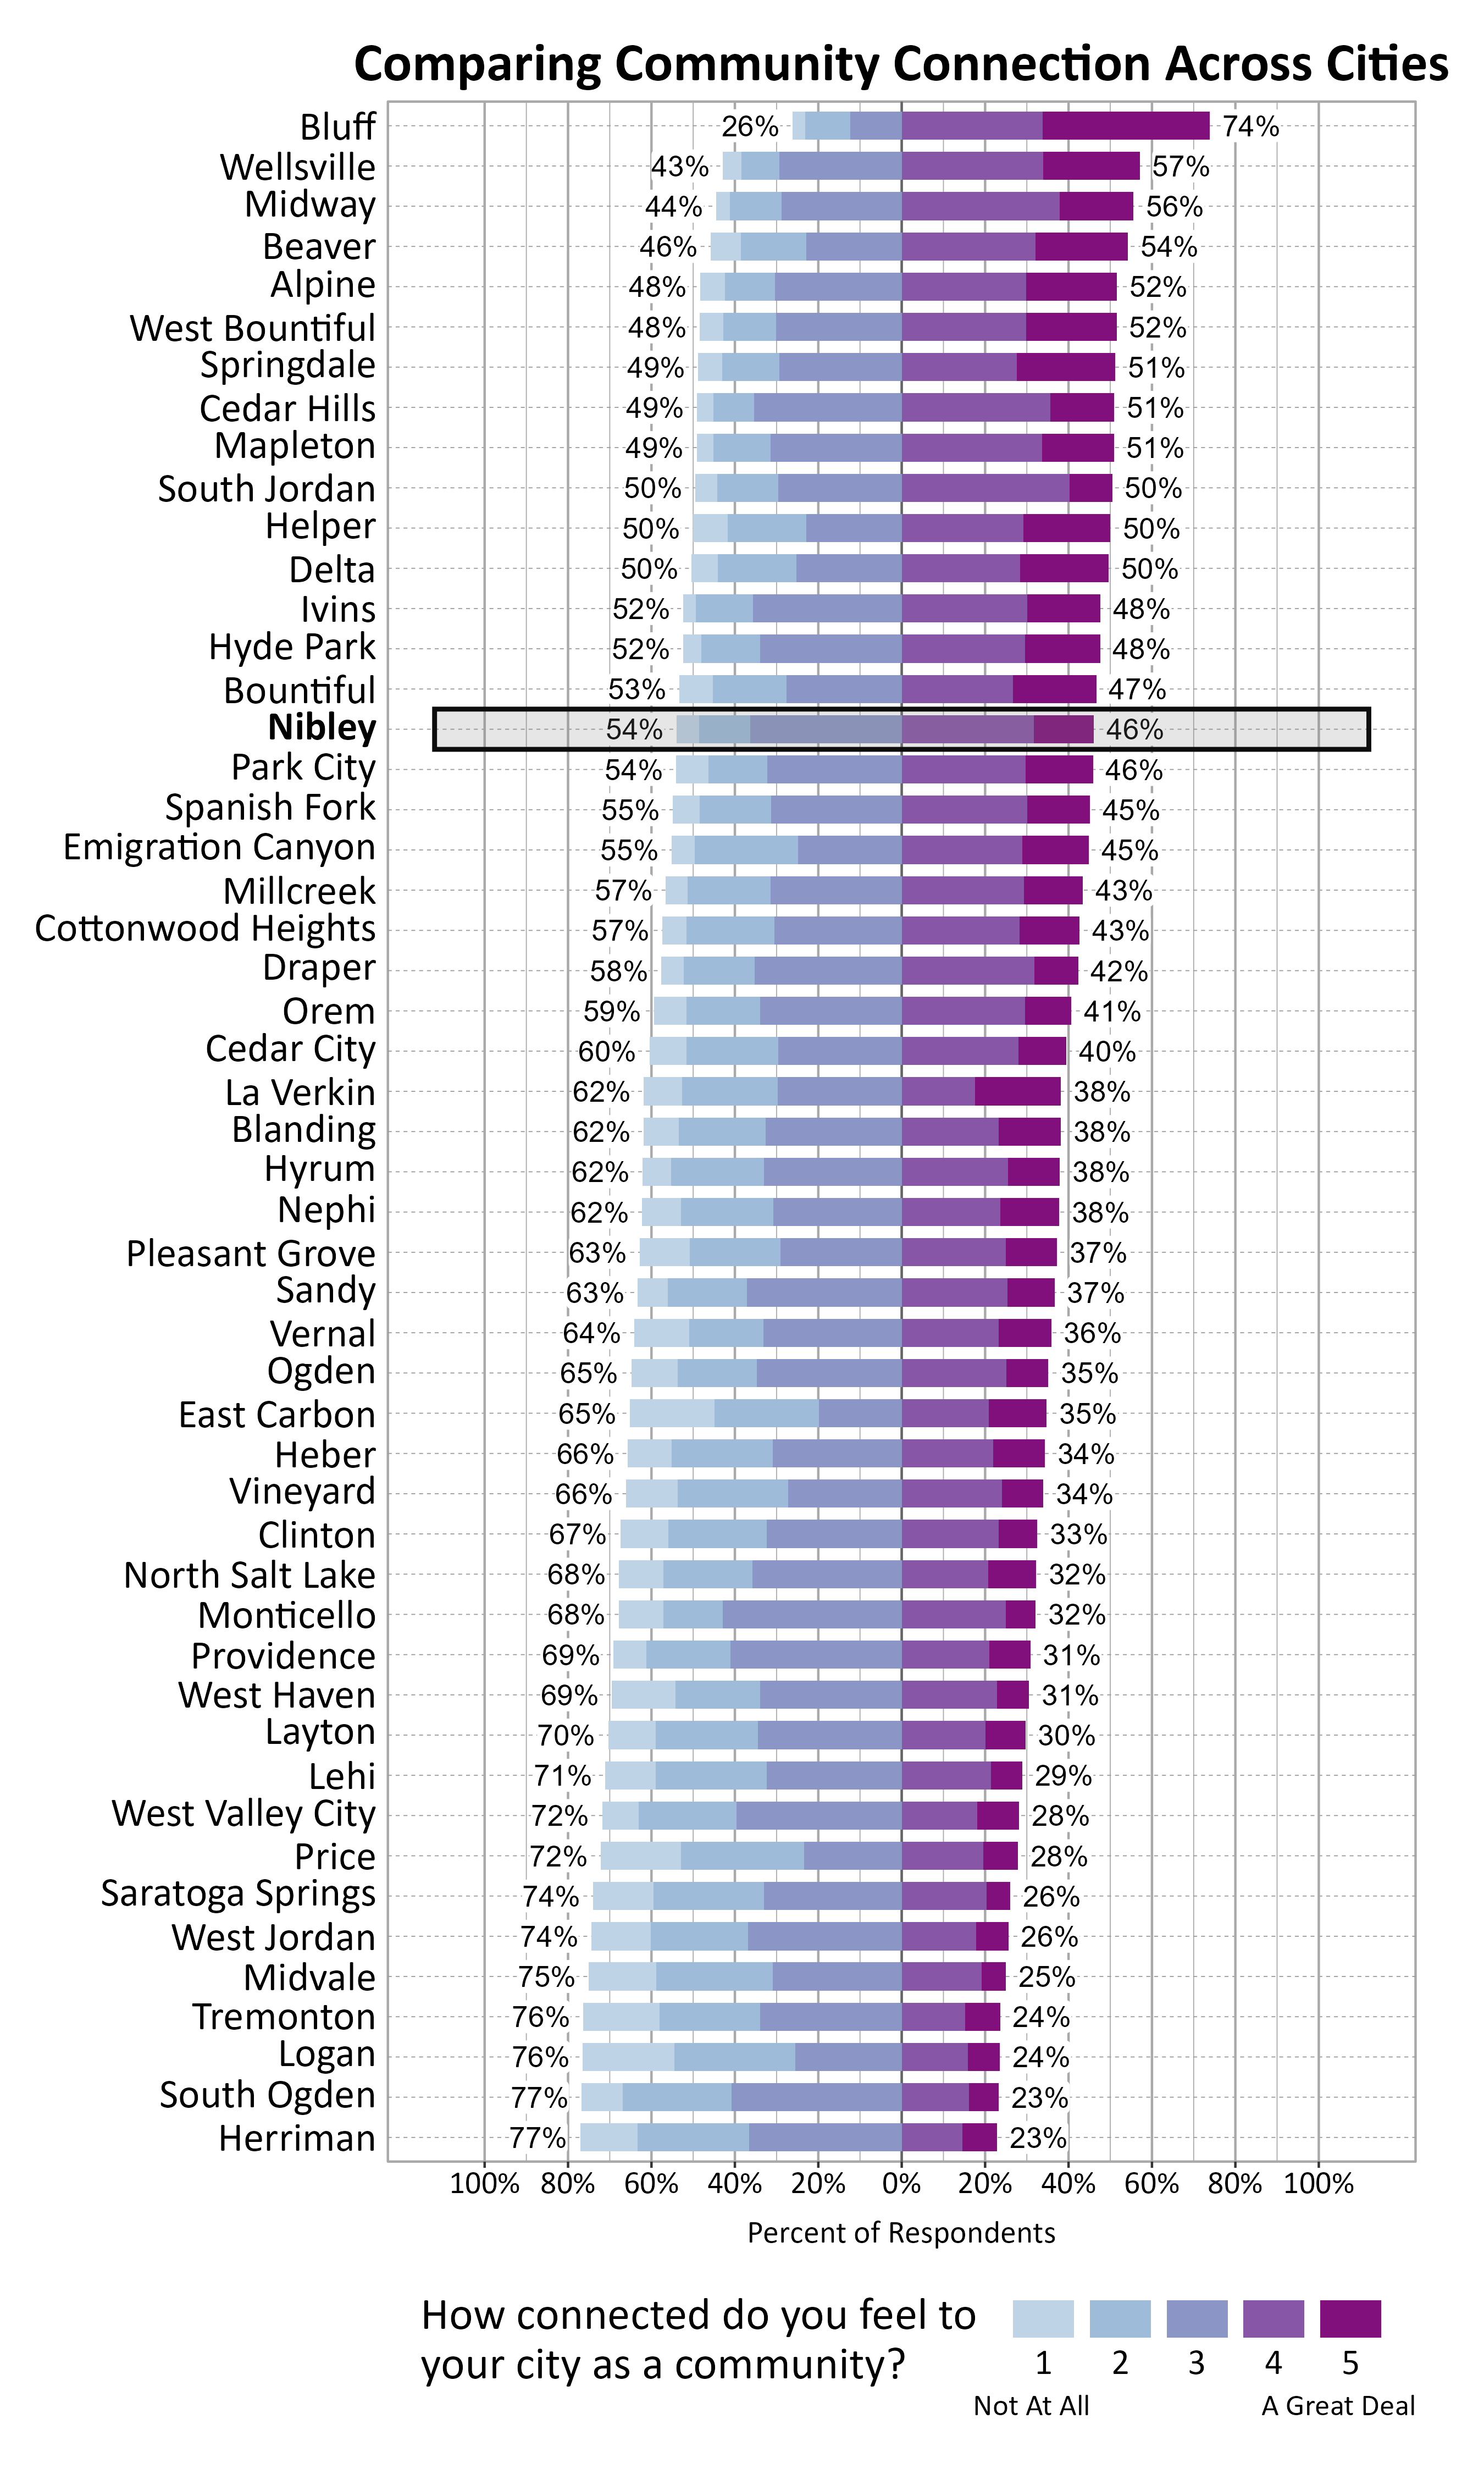
The graph below shows how Wellbeing Project cities and towns compare on feelings of community connection based on the percentage of respondents who answered 4 or a 5 on a 5-point scale from “not at all” to “a great deal” connected to their city or town. Nibley ranked 16 out of the 51 cities that participated.
Participation in Recreation and Nature-Related Activities
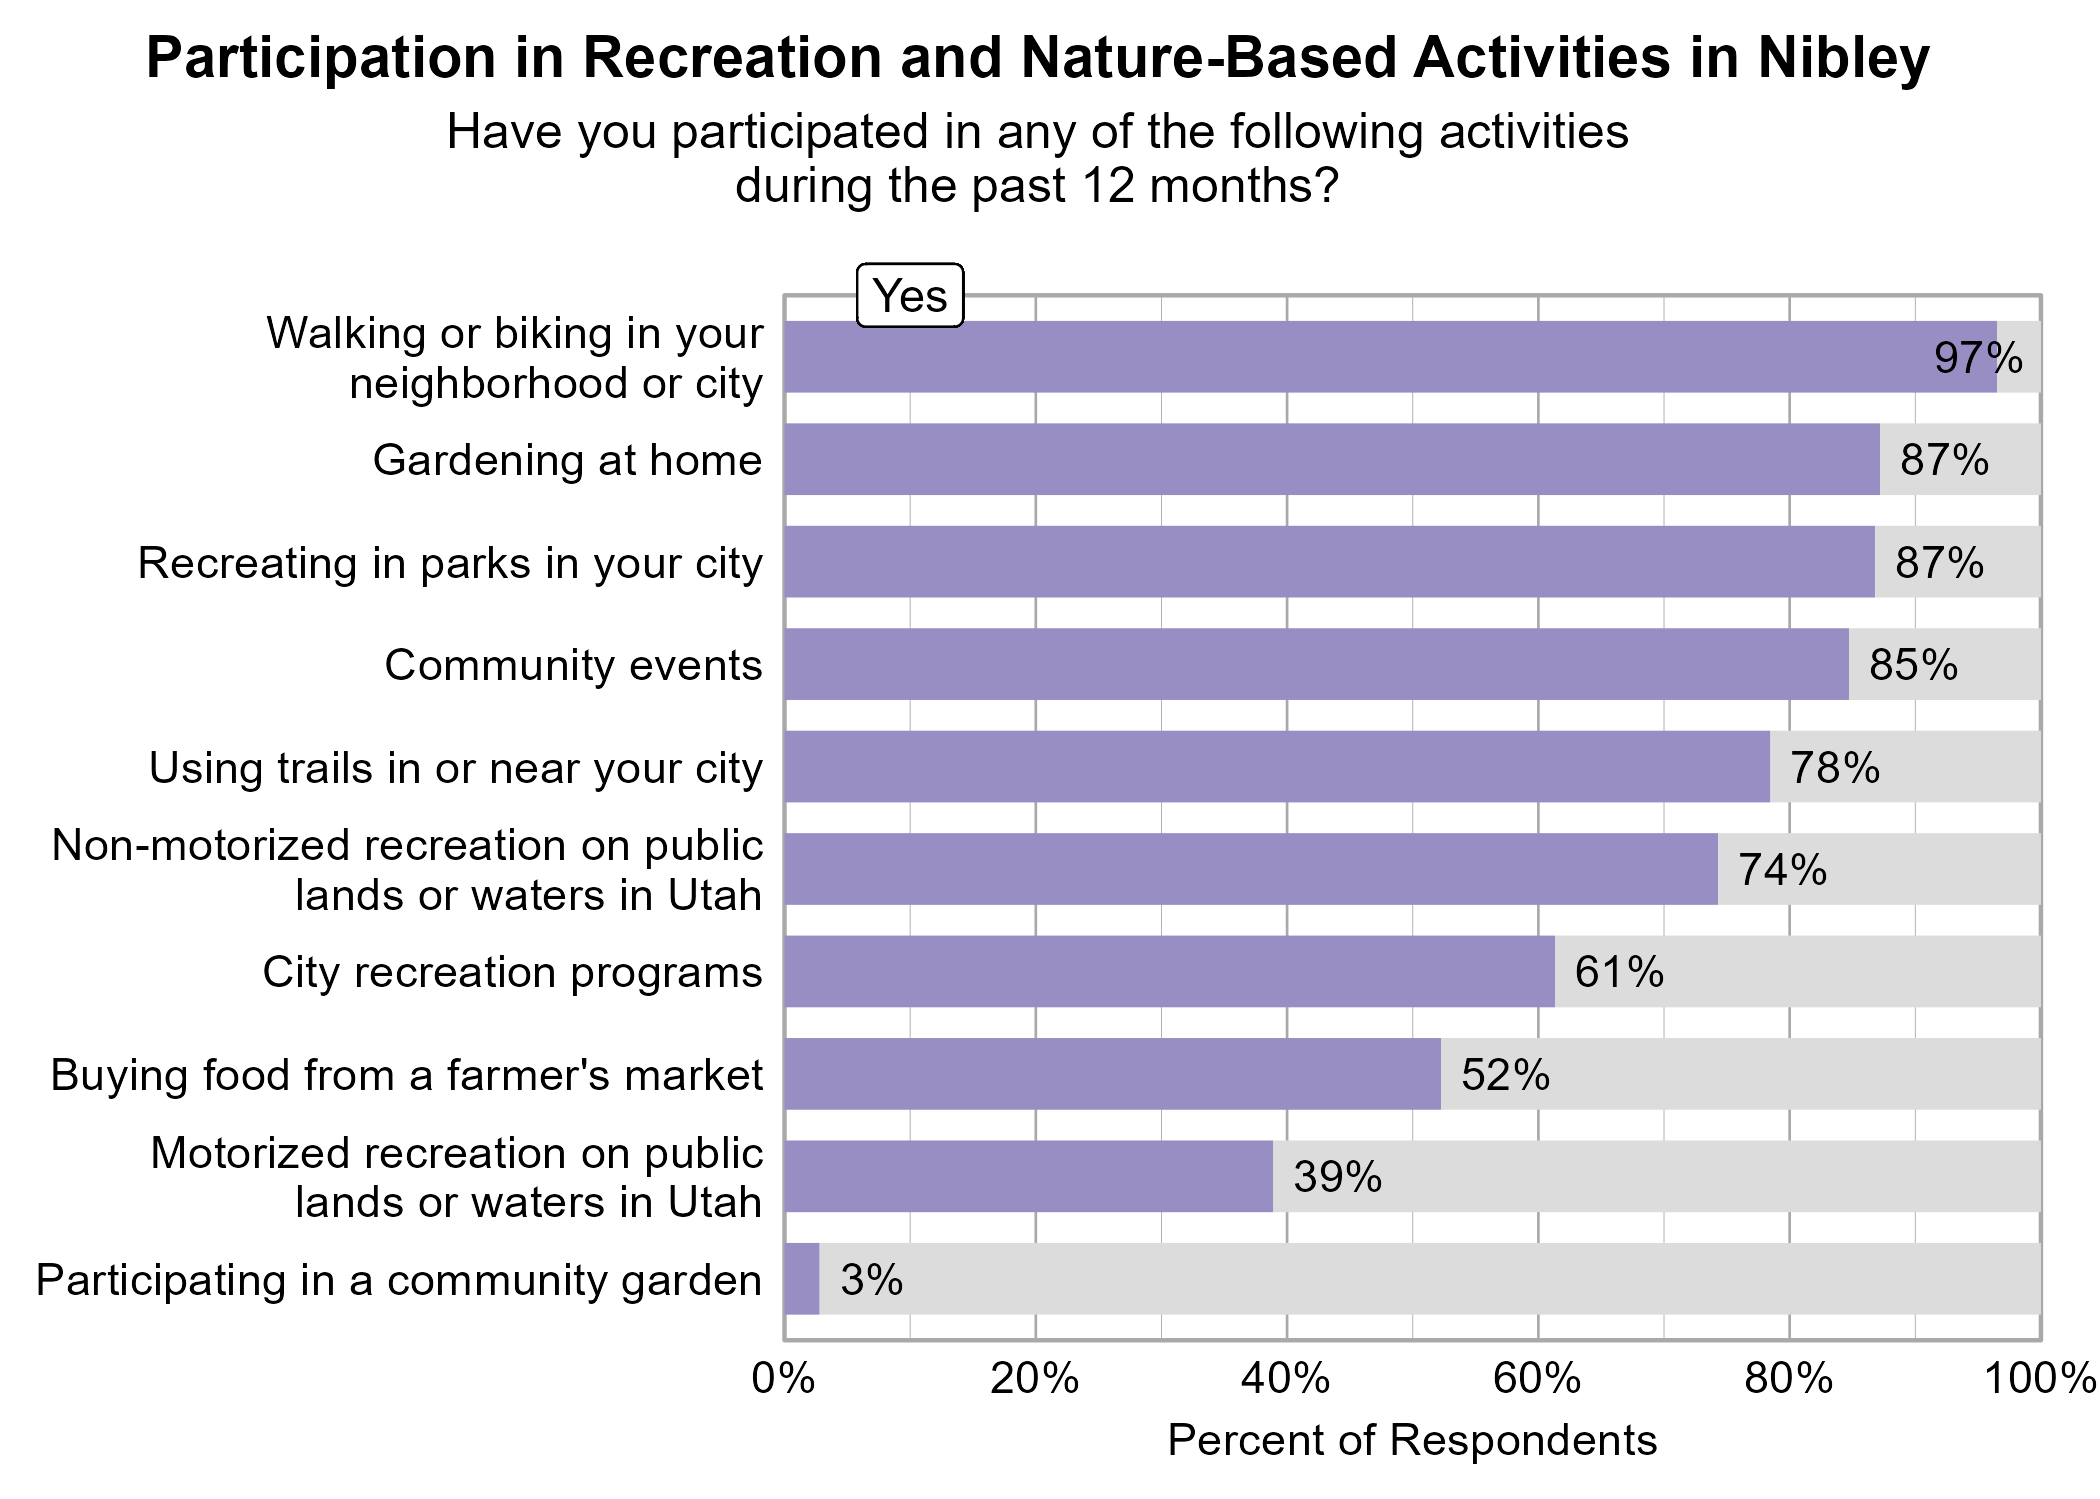
Respondents were asked to indicate whether or not they participated in various activities in the last 12 months. The most popular activities were walking or biking in your neighborhood or city (97%), gardening at home (87%), recreating in parks in your city (87%), and community events (85%).
Participating in city recreation programs, participating in community events, and recreating in parks in your city were significantly related to higher ratings of personal wellbeing.
Participating in city recreation programs was significantly related to higher ratings of community wellbeing.
Participating in city recreation programs, participating in community events, gardening at home, recreating in parks in your city, and using trails in or near your city were significantly related to higher ratings of community connection.
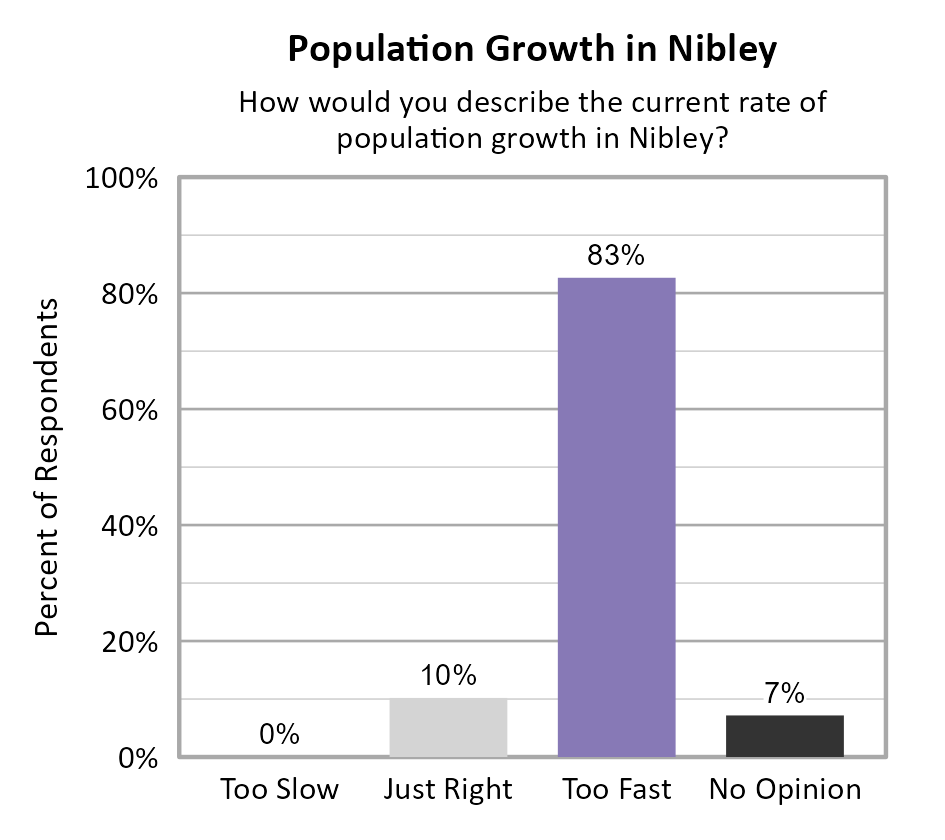
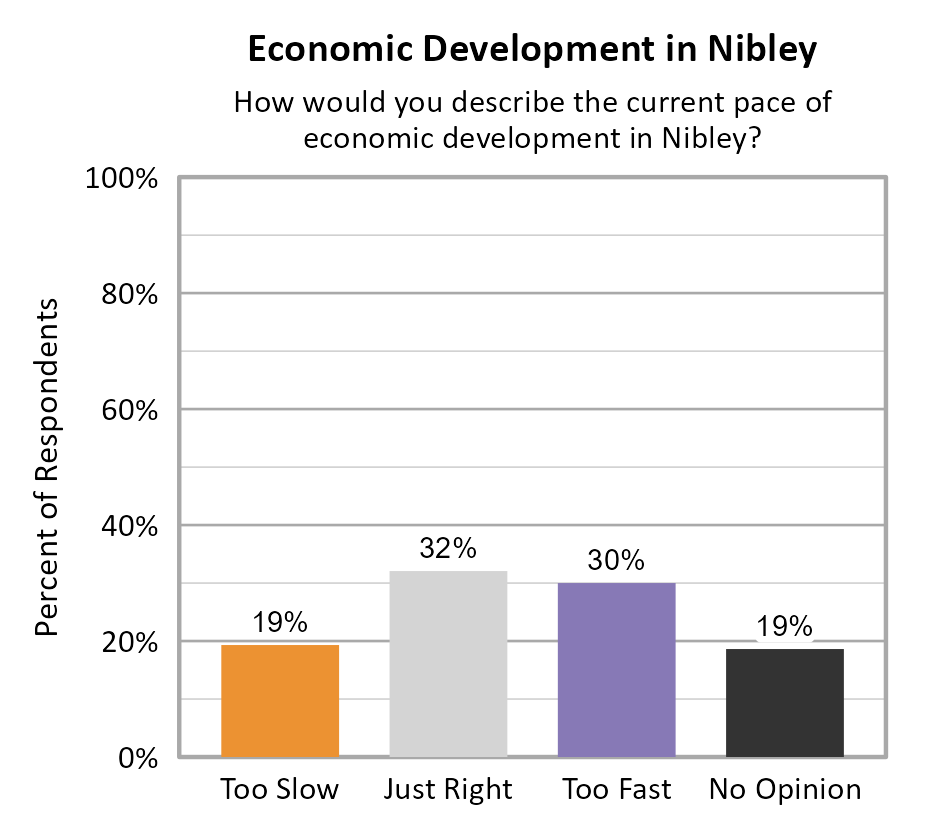
Perspectives on Population Growth and Economic Development
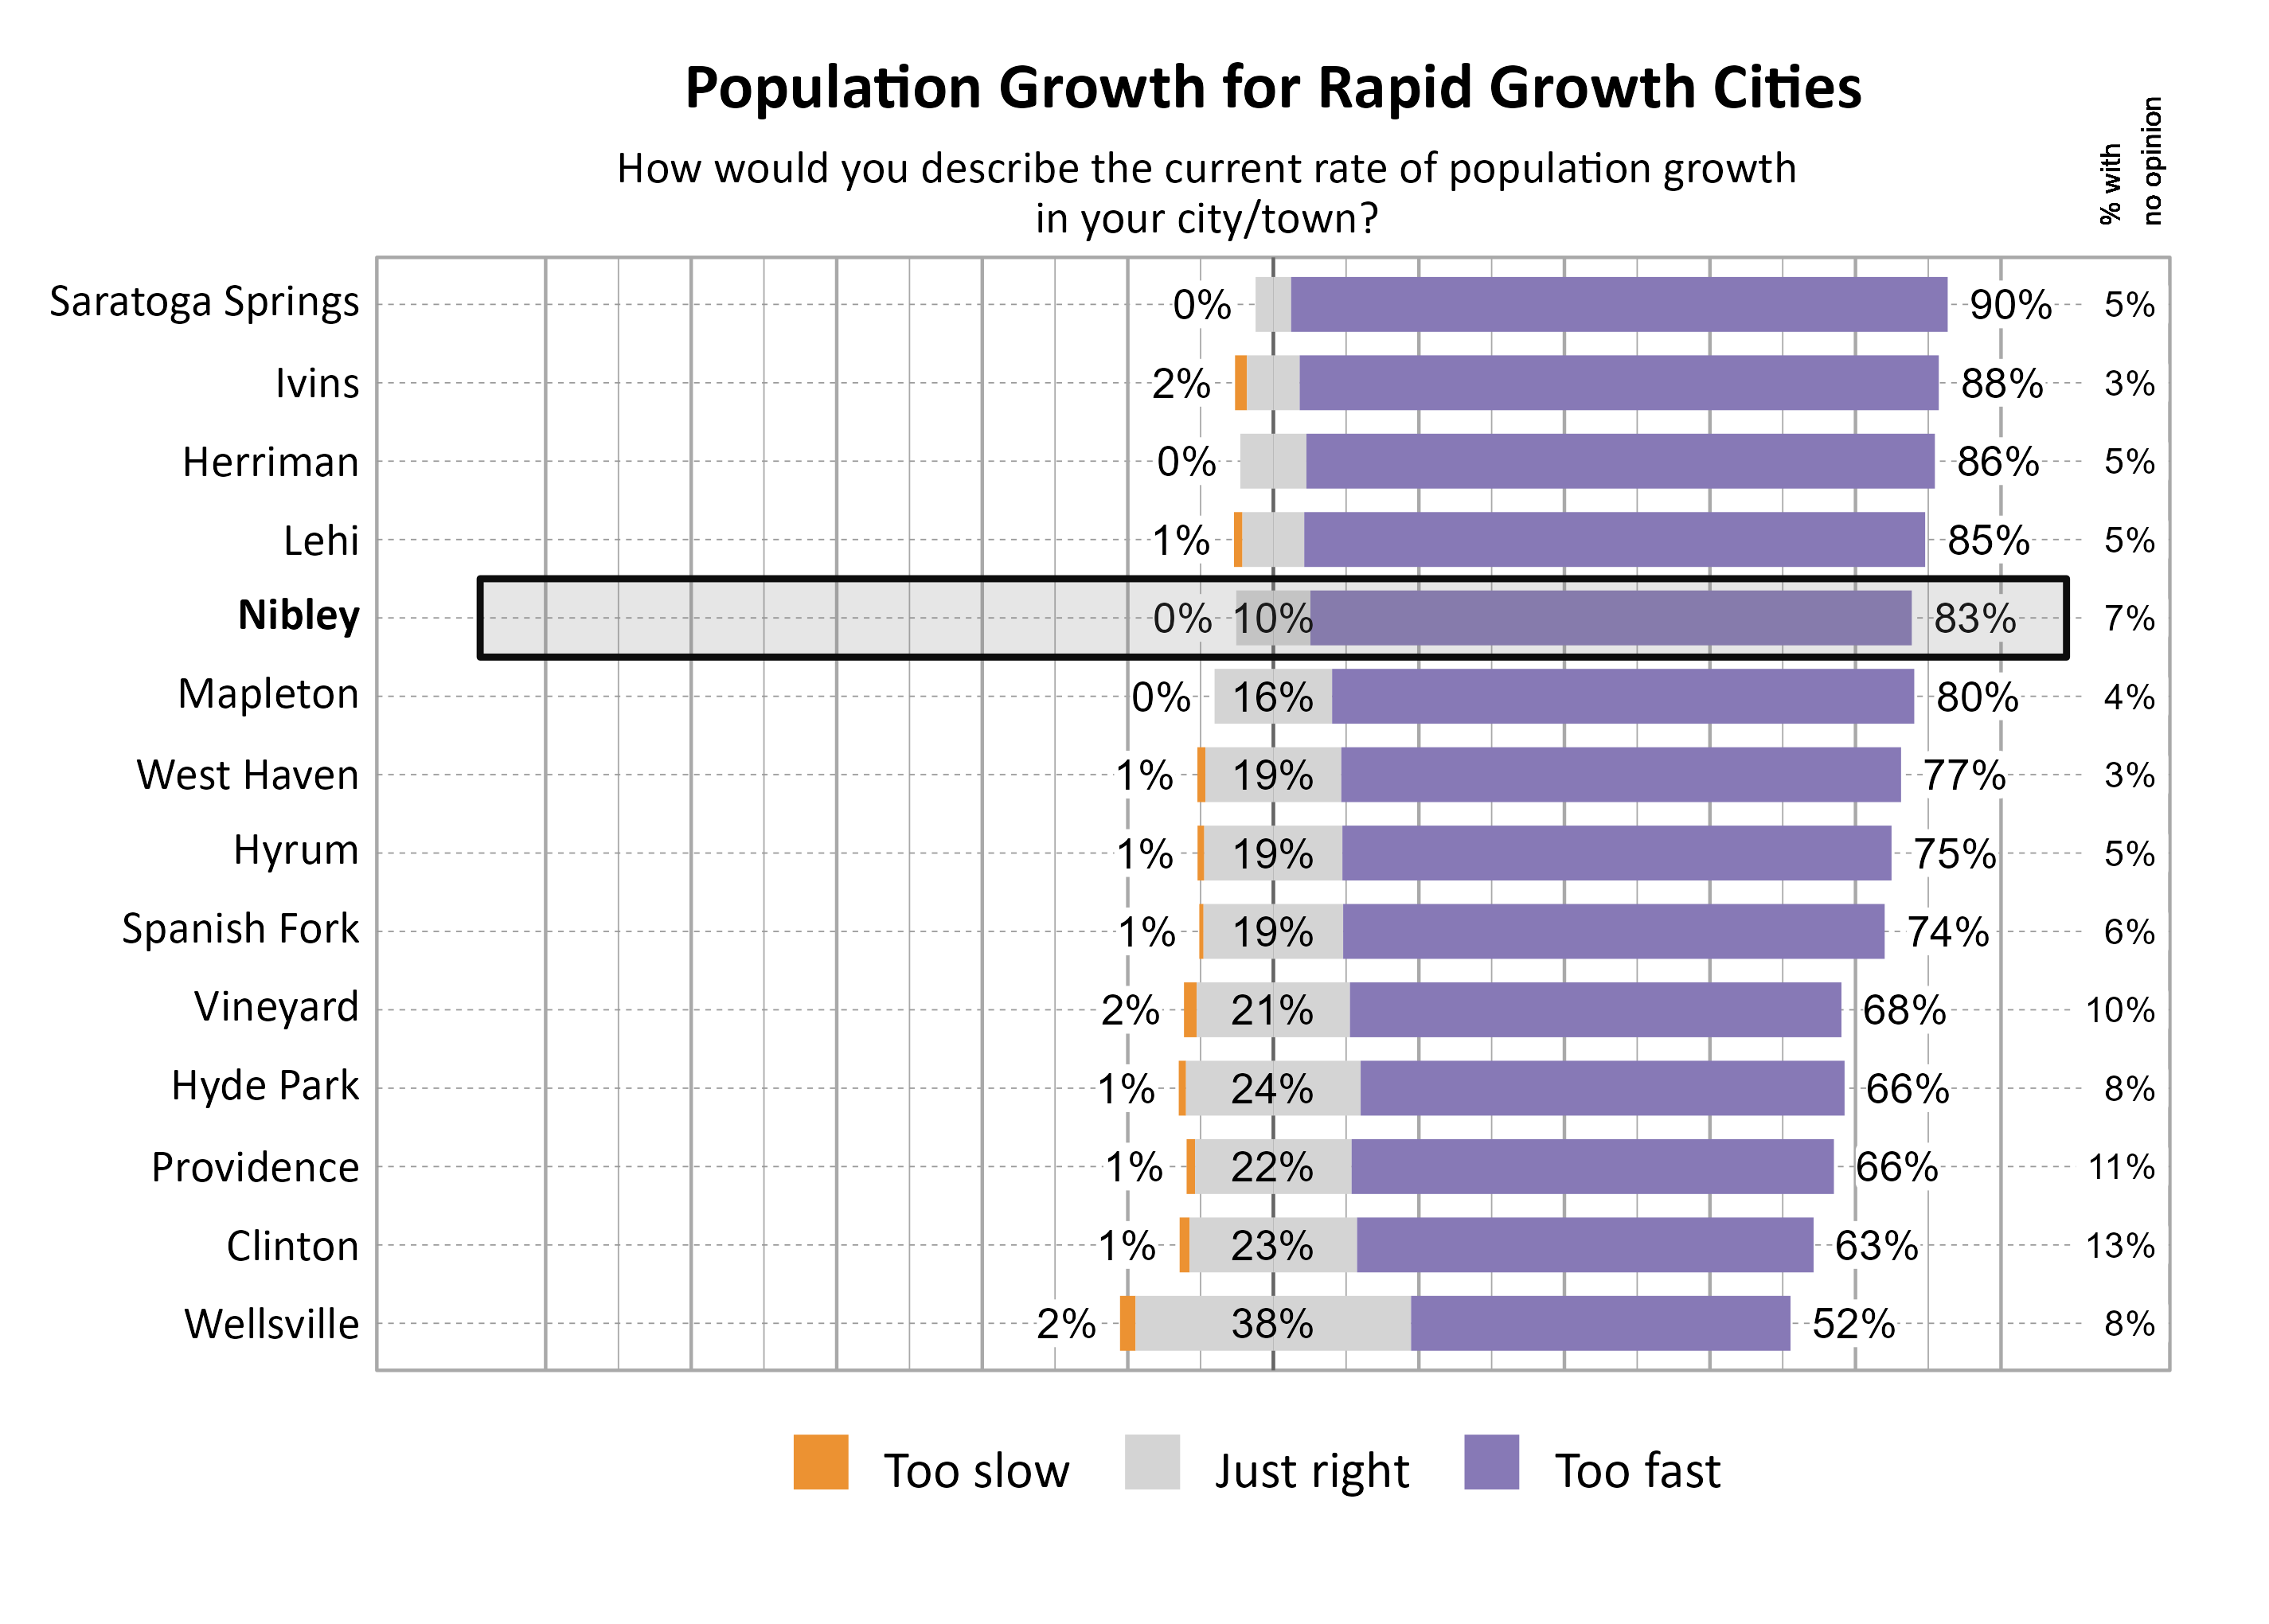
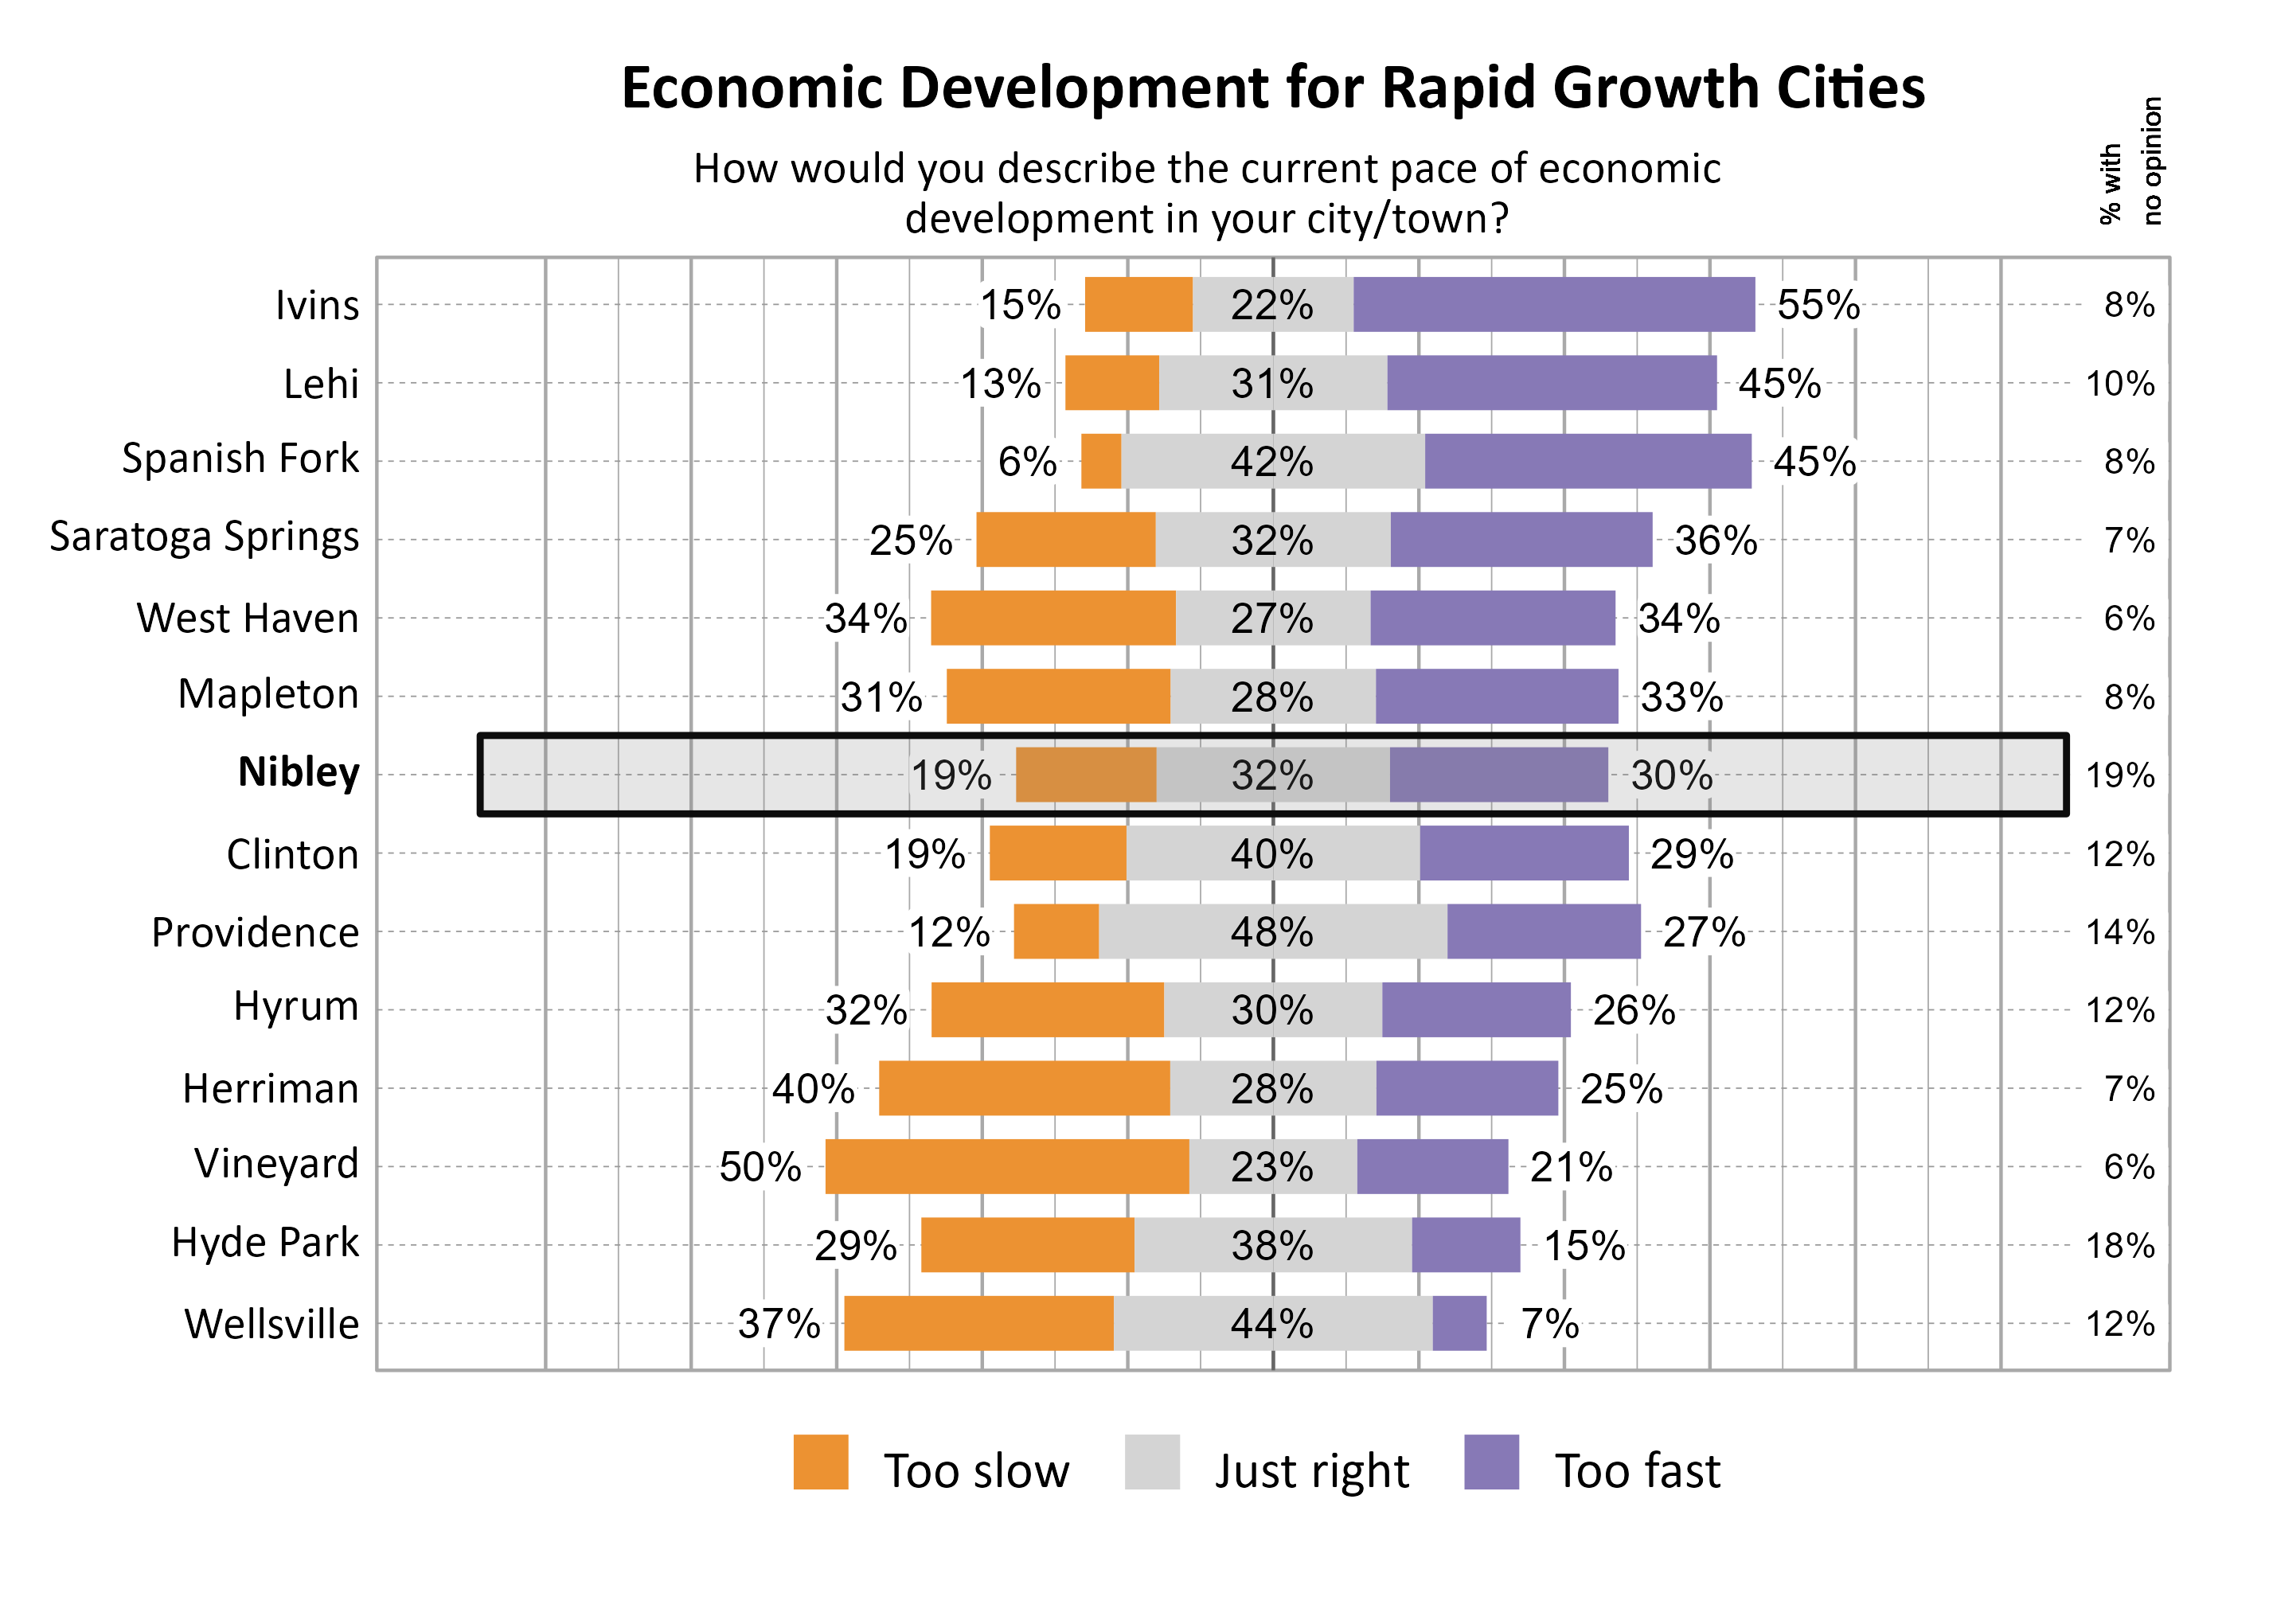
The majority of respondents in Nibley indicated that they felt the population growth was too fast (83%). For the pace of economic development, respondents were split between opinions that it was just right (32%) and too fast (30%).
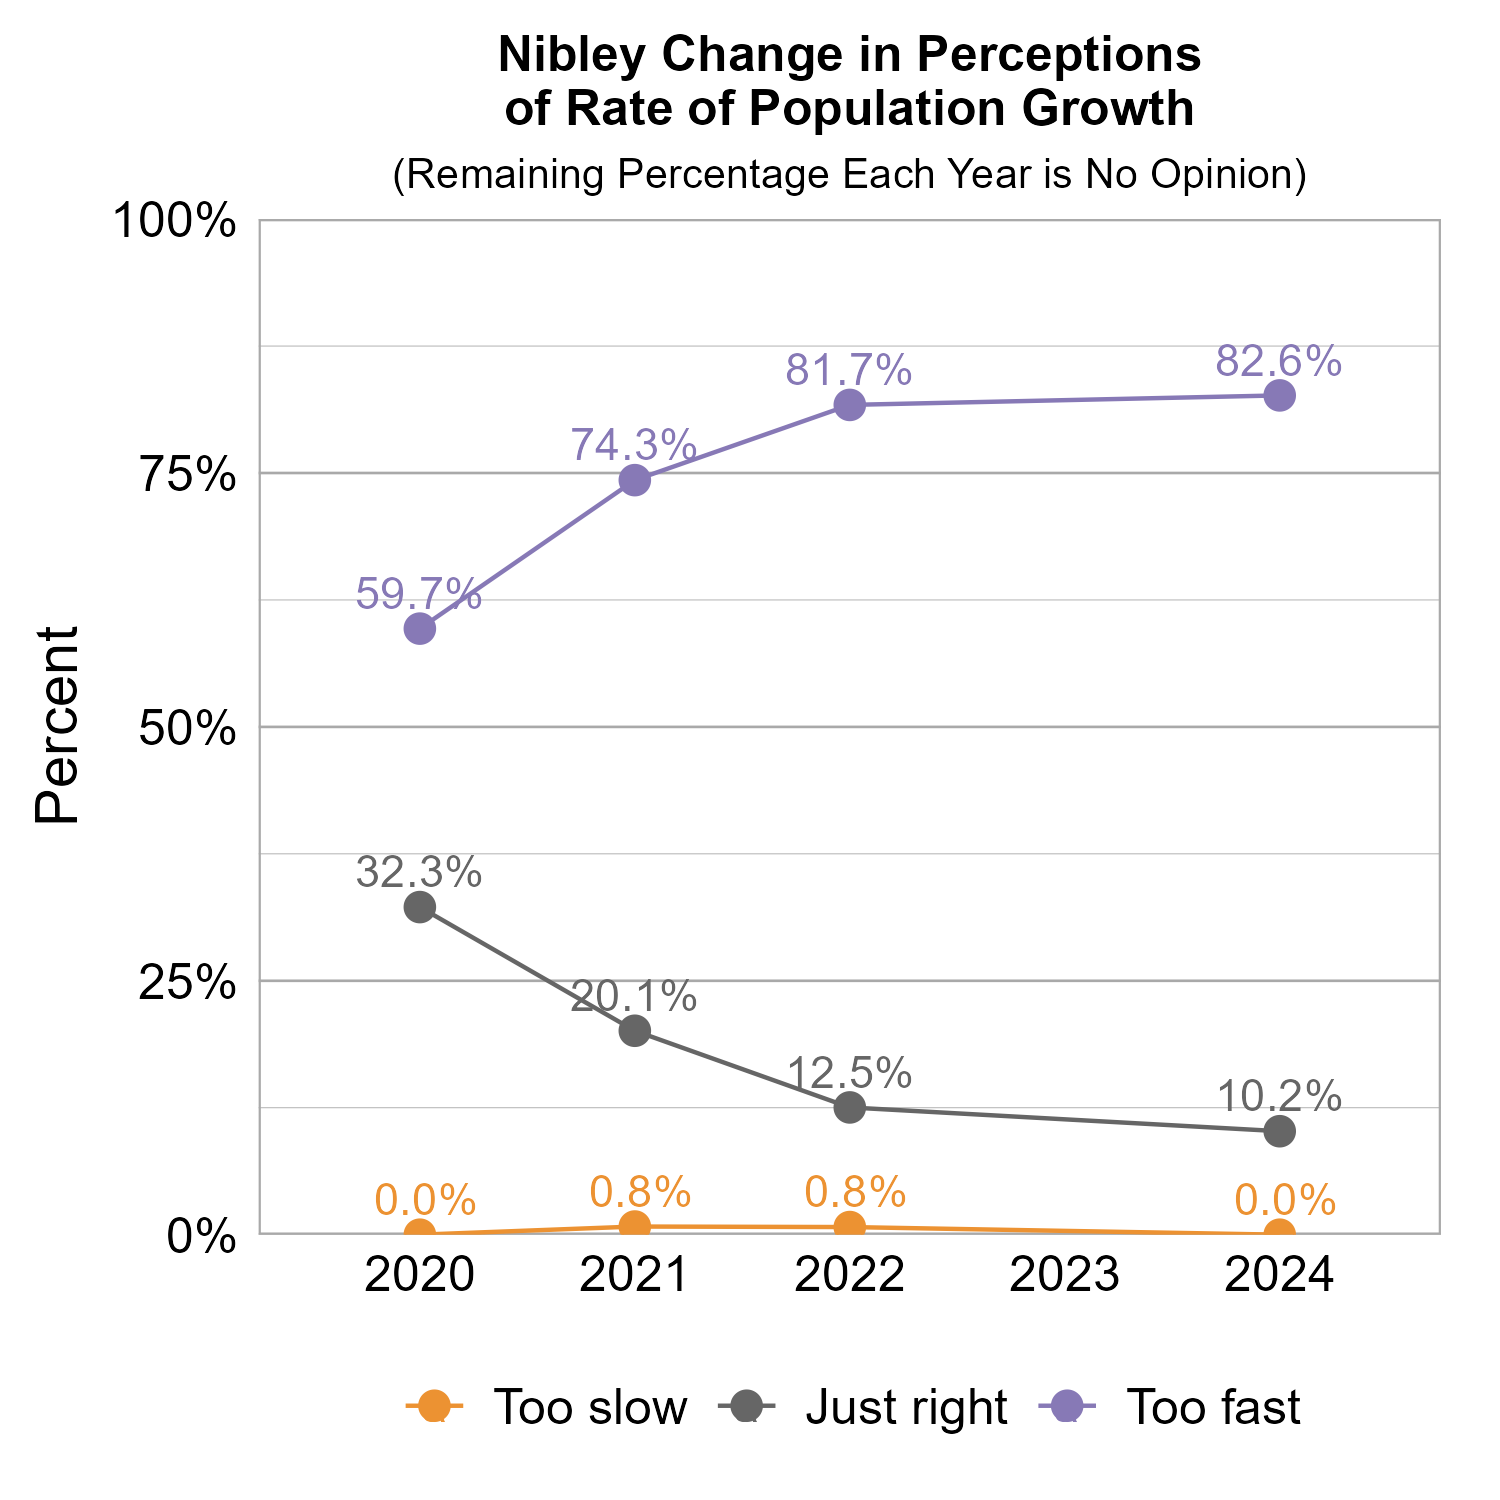
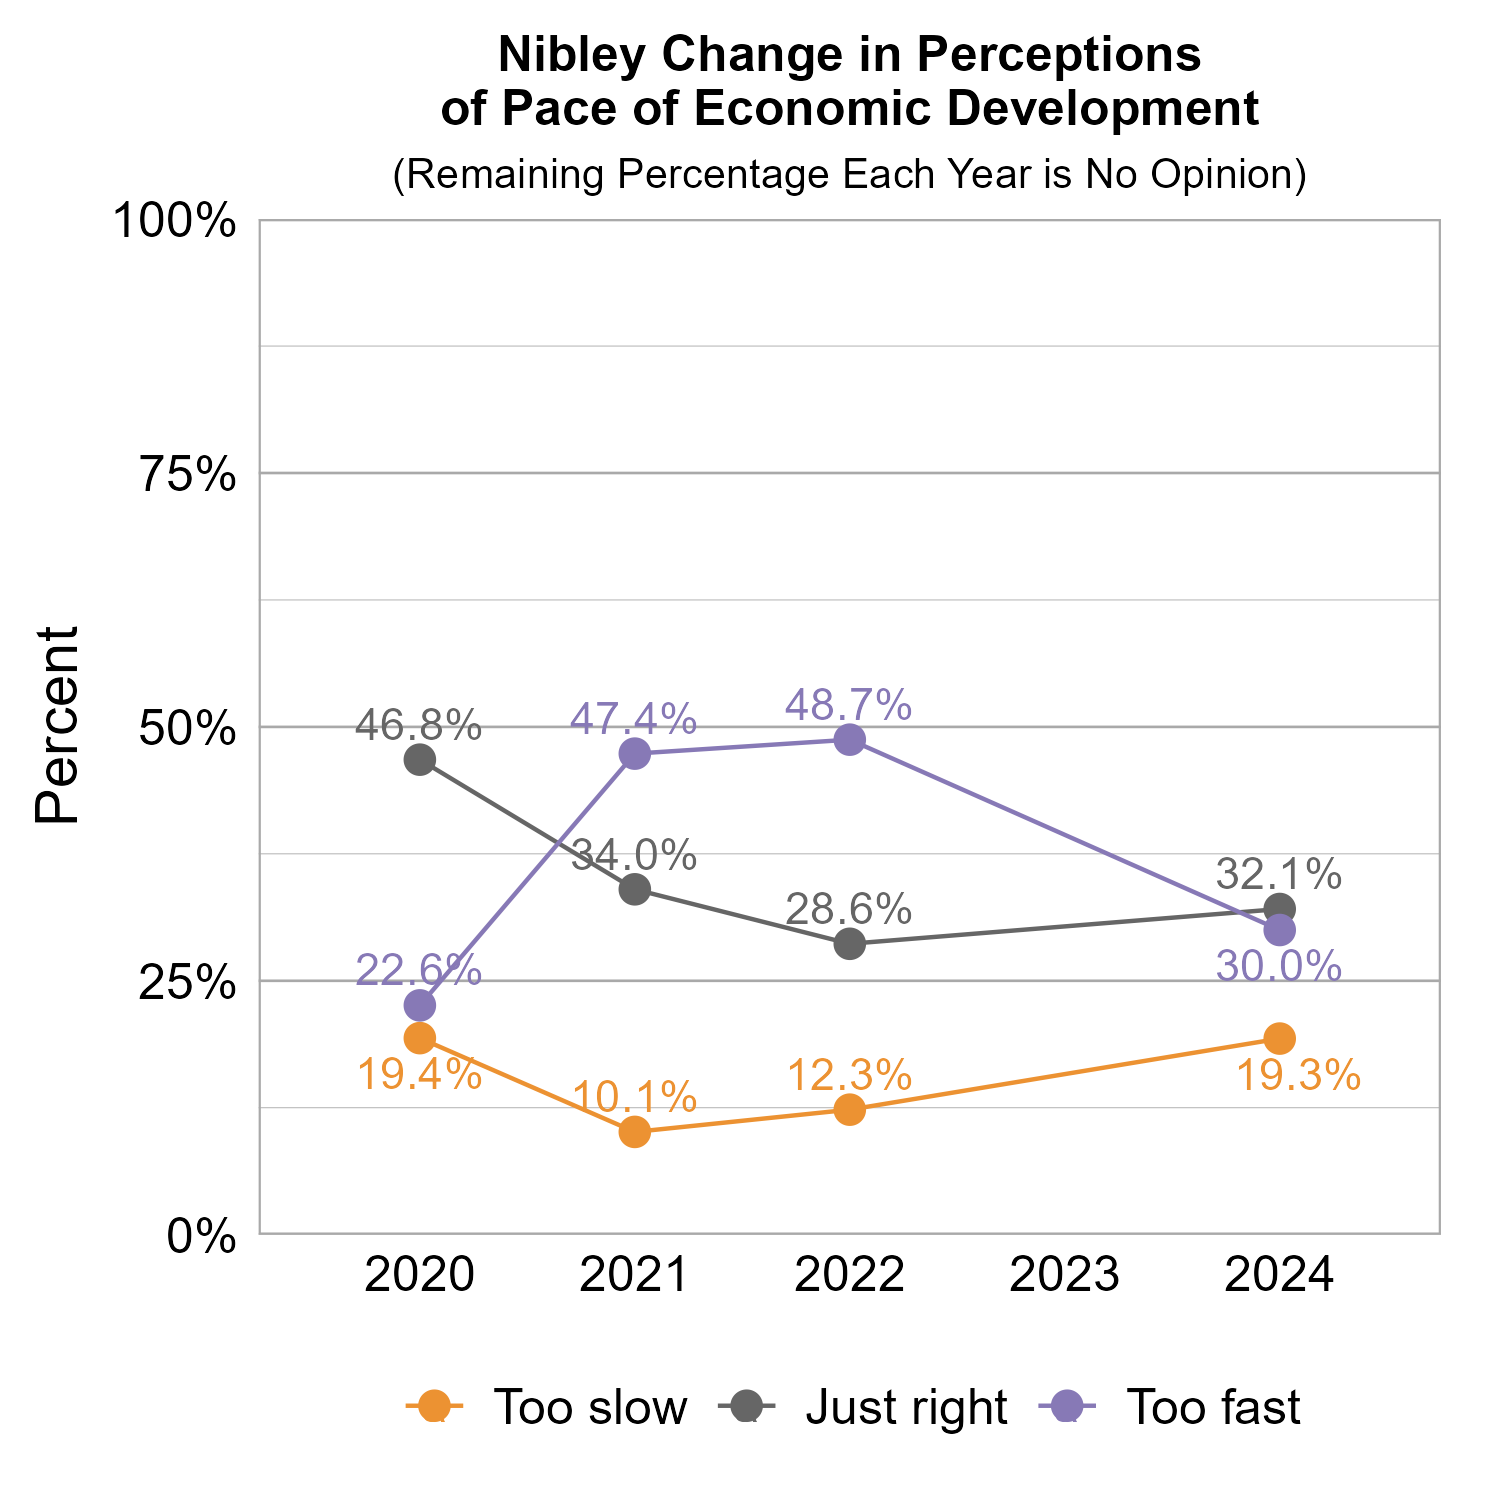
The graphs below show how perceptions of population growth and economic development in Nibley have varied across recent years of Wellbeing Surveys. The majority of respondents have consistently indicated that the rate of population growth is too fast, with a upward trend over the survey years. Perception that the pace of economic development is too fast decreased considerably from 2022 to 2024.
The graphs below show perceptions of population growth and economic development for Nibley compared to other participating cities and towns in the Rapid Growth Cities cluster.
The graph below illustrates how many respondents perceived the pace of economic development as too slow, just right, too fast, or had no opinion, with additional breakdowns for the number of respondents who provided comments.
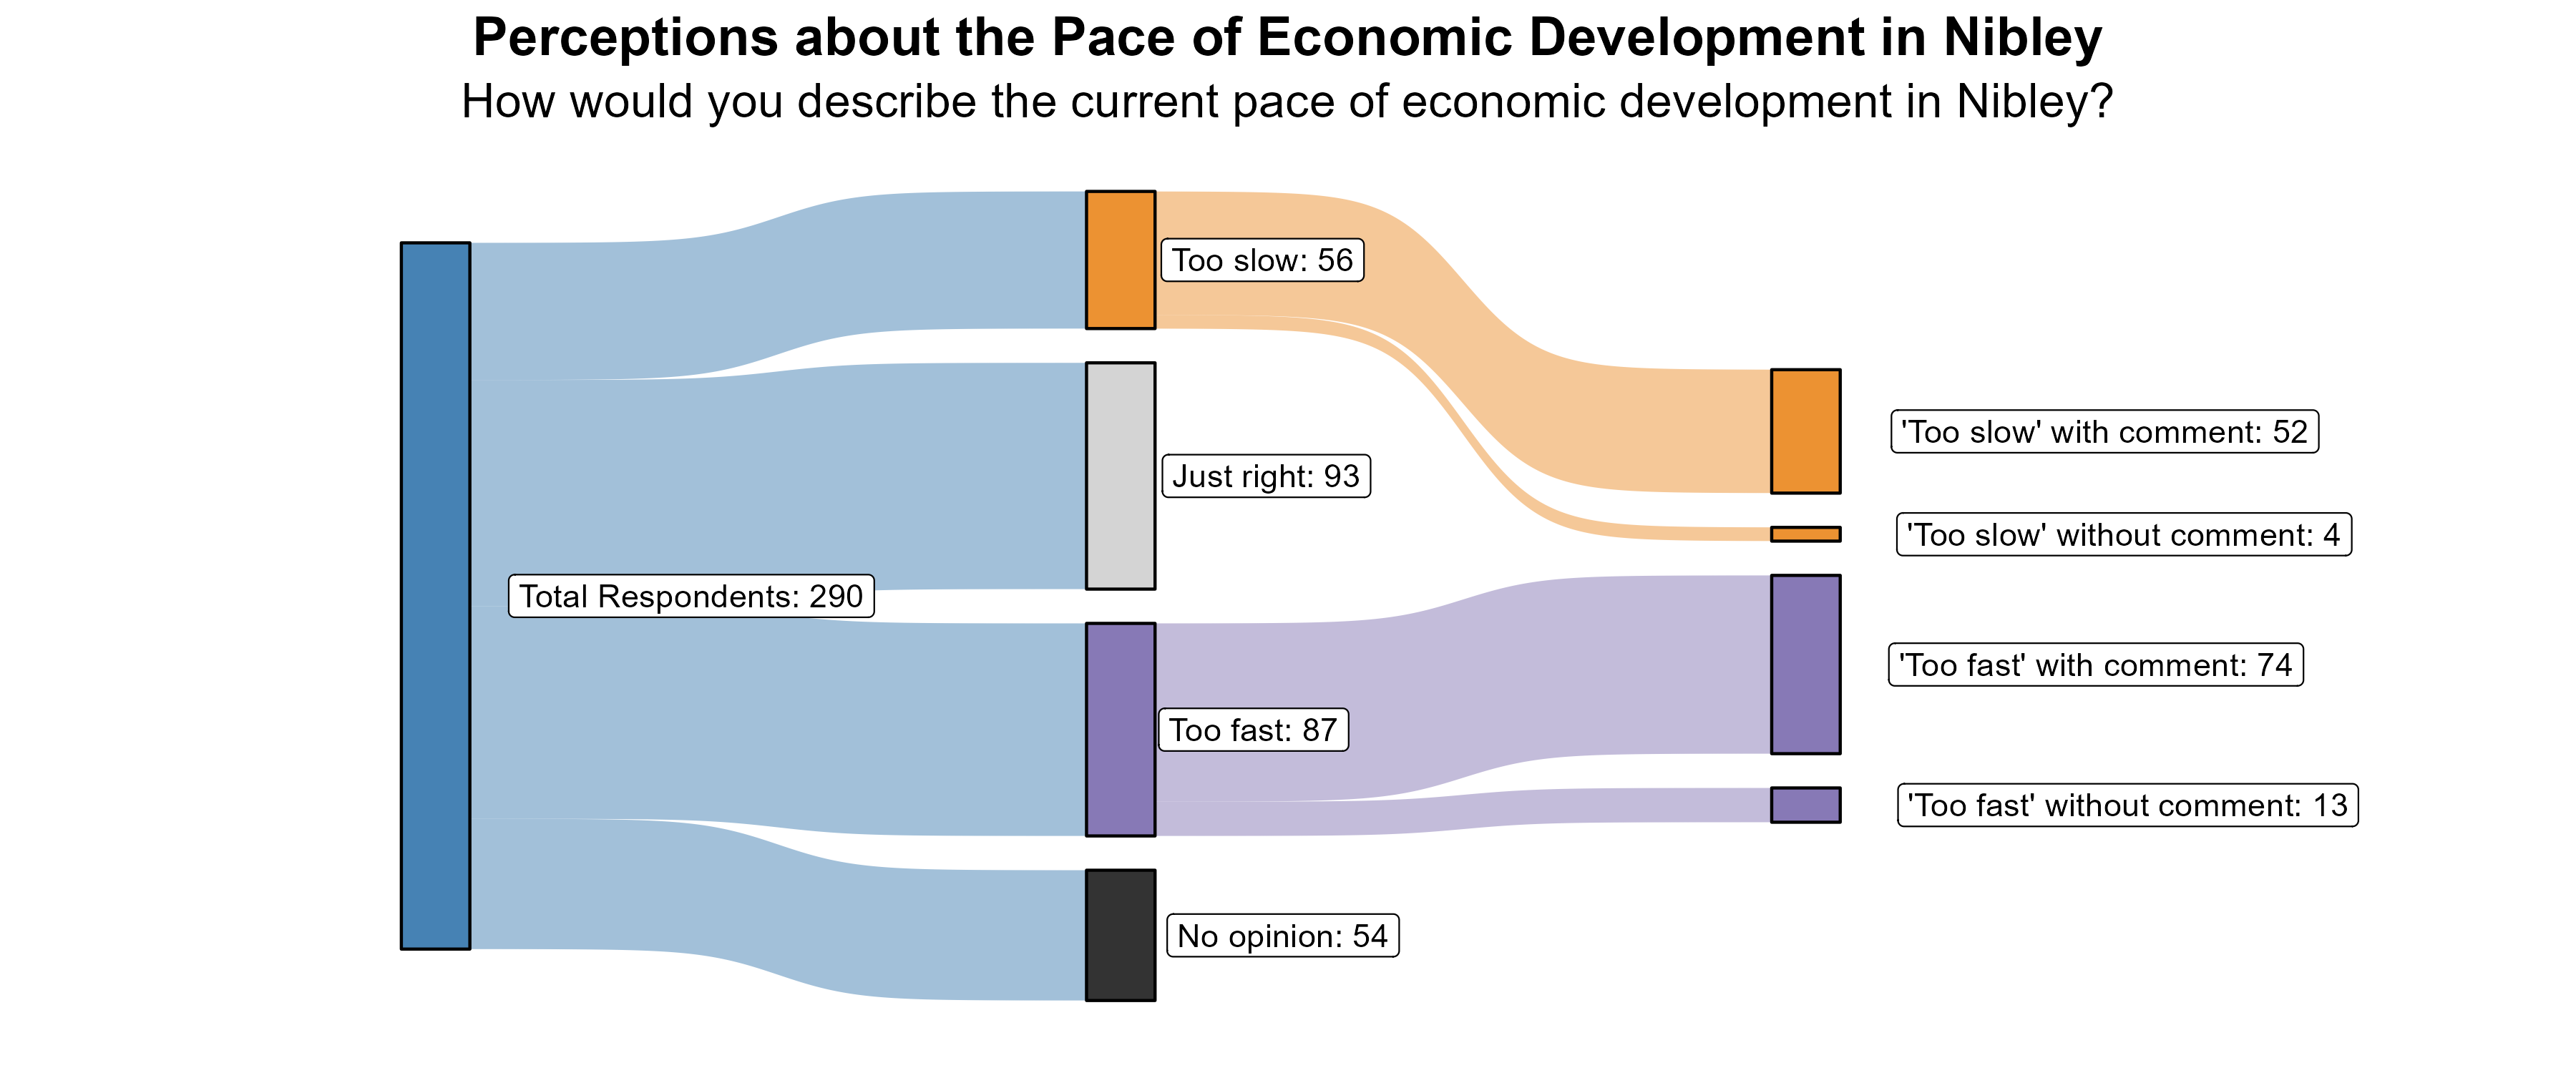
The 19% of respondents who rated the pace of economic growth as “too slow” were further asked what aspects of the local economy they would like to see more of in Nibley. A majority of the comments expressed a request for retail such as a grocery store or restaurants. Many respondents wanted close options for shopping that don’t involve going to Logan.
Additionally, the 30% of respondents who rated the pace of economic growth as “too fast” were further asked what aspects of the local economy they feel are growing too quickly in Nibley. Comments expressed that development of housing is too fast and outpacing infrastructure, resources, and school capacity. Many people were also frustrated about the loss of farms, open space, and the small town feeling of Nibley.
Transportation in Nibley
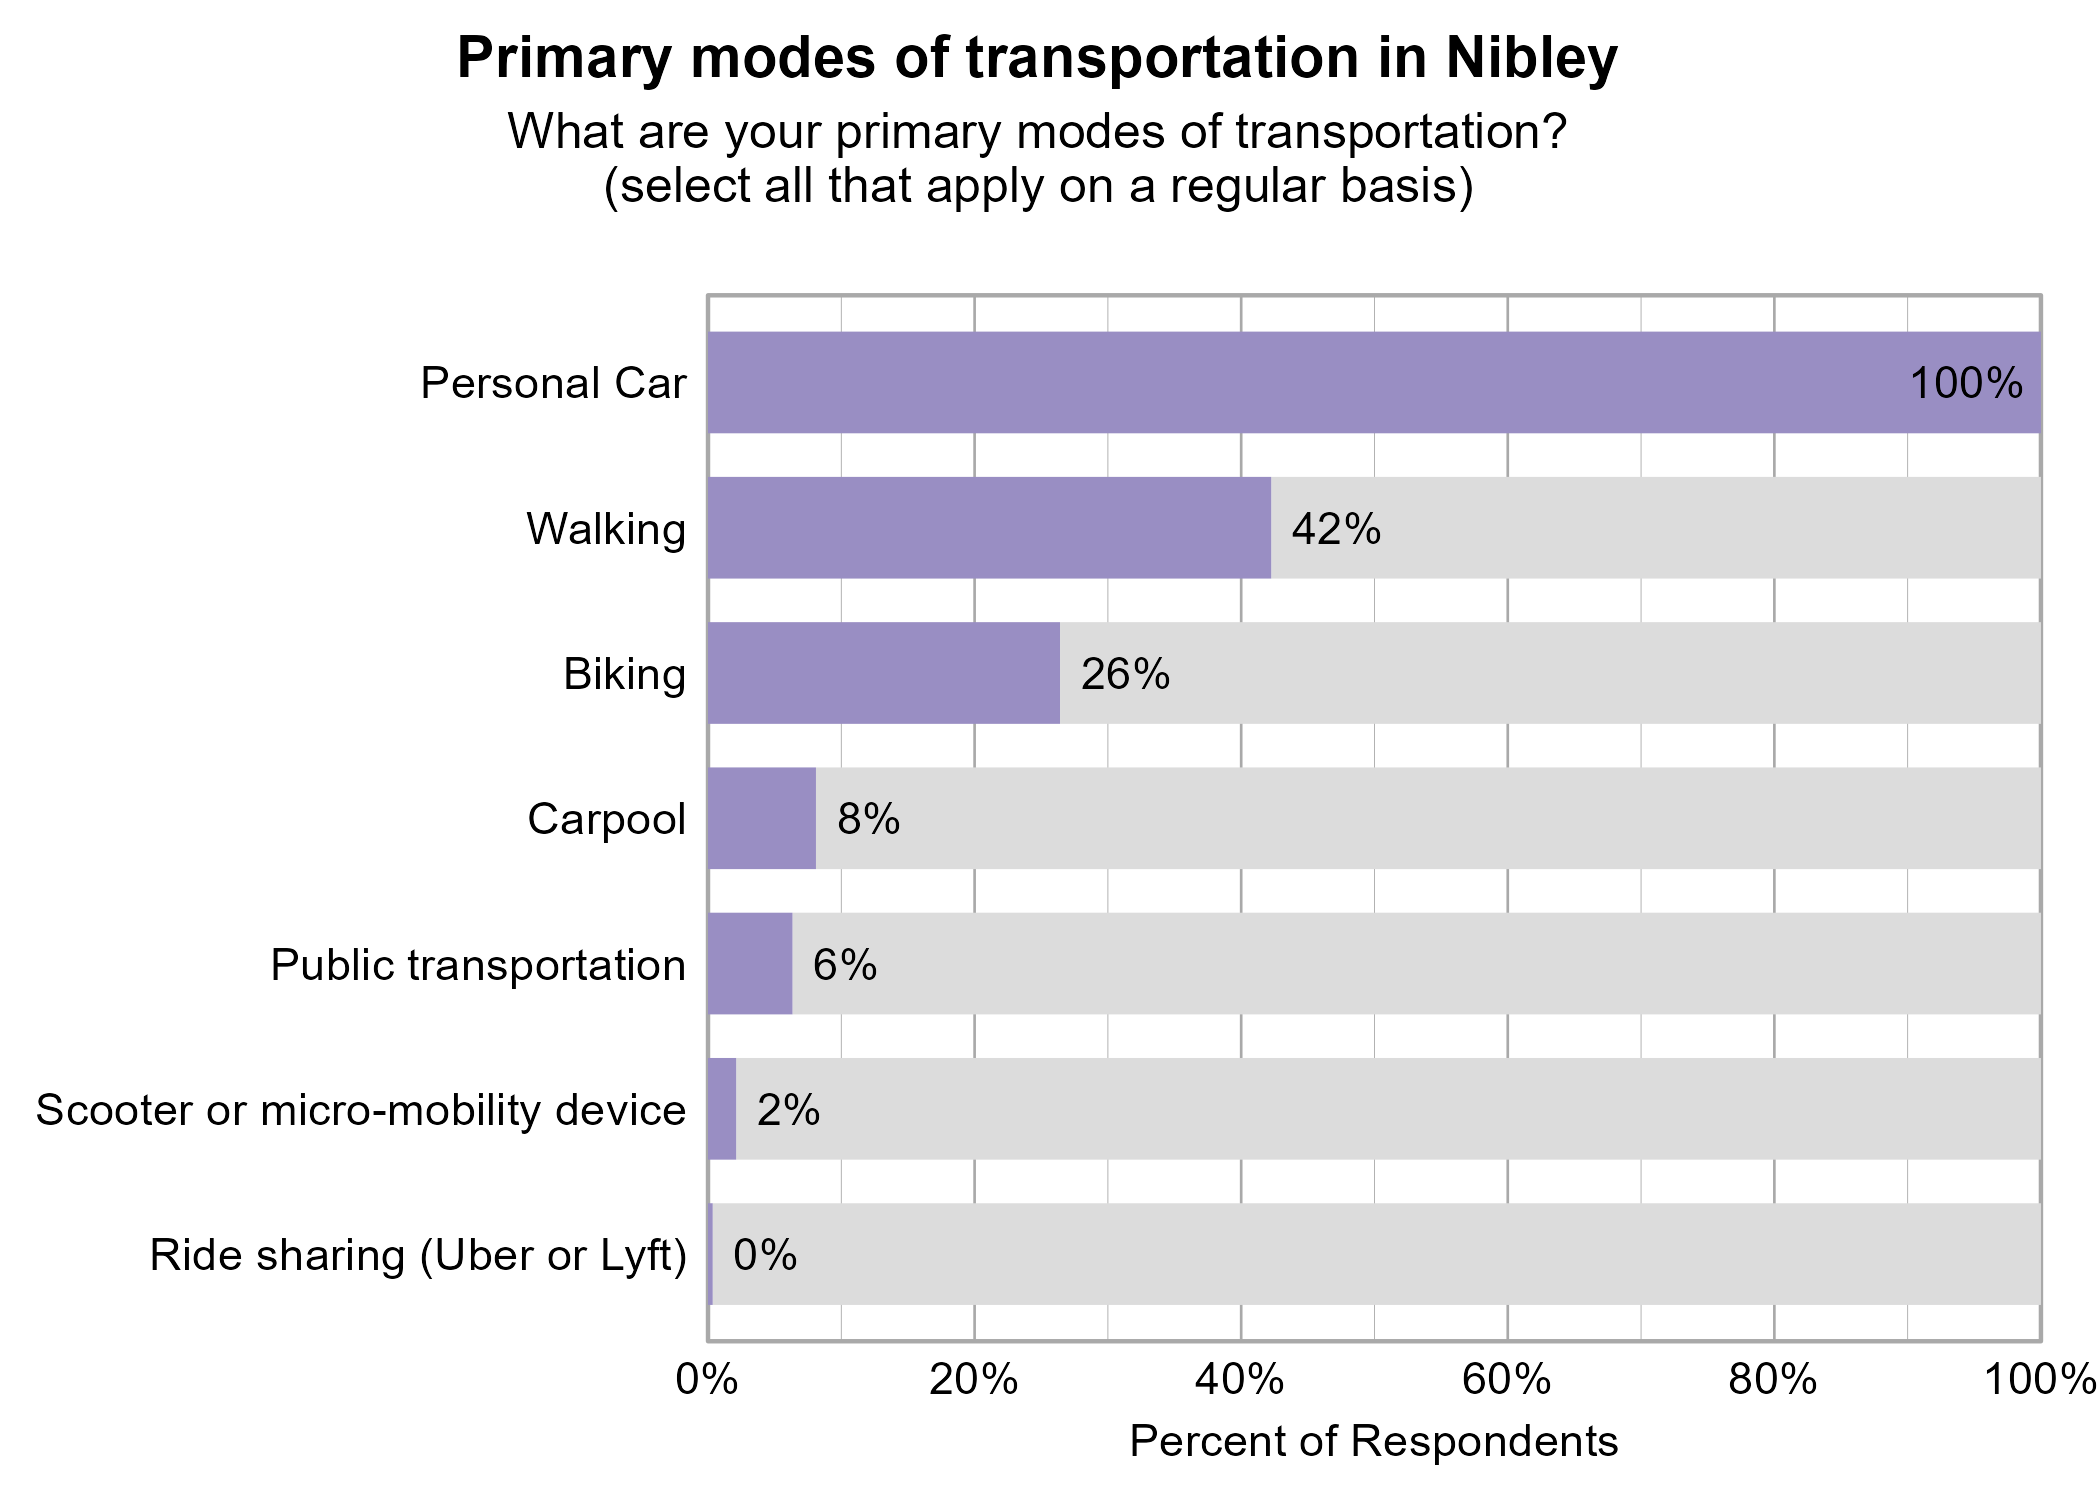
Respondents were asked to indicate all of their primary modes of transportation on a regular basis in Nibley. The most popular modes of transportation were personal car (100%) and walking (42%).
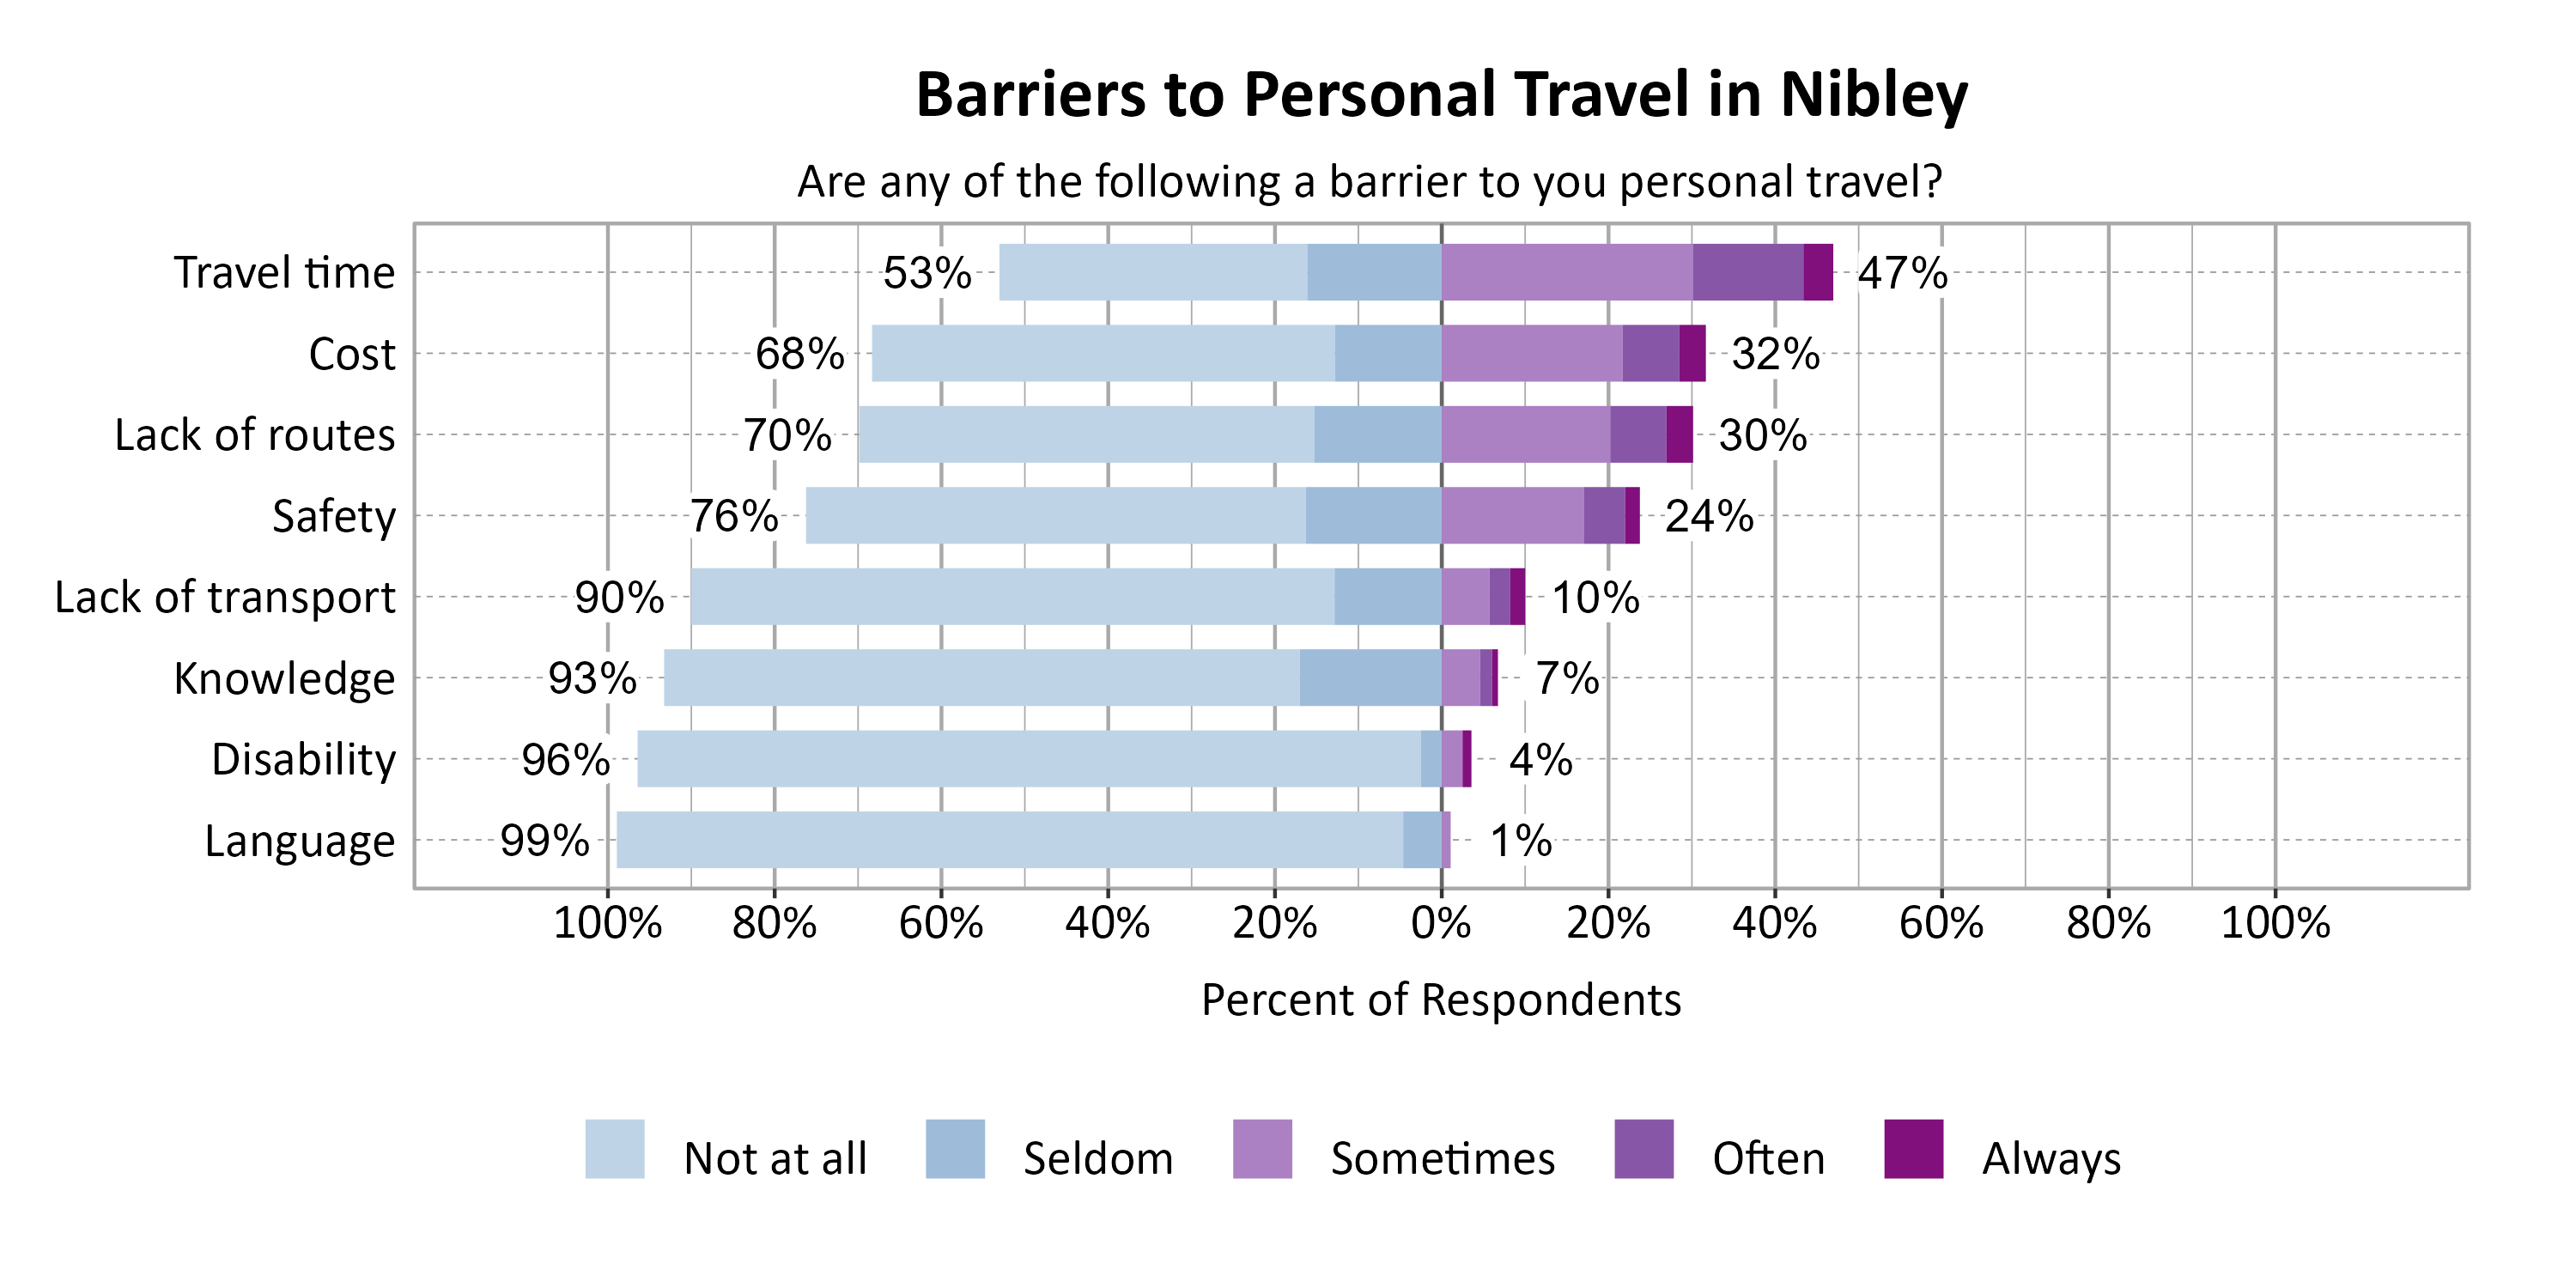
Respondents were asked to indicate the most common barriers to transportation in Nibley. The most problematic barriers were Travel time (47%) and Cost (32%).
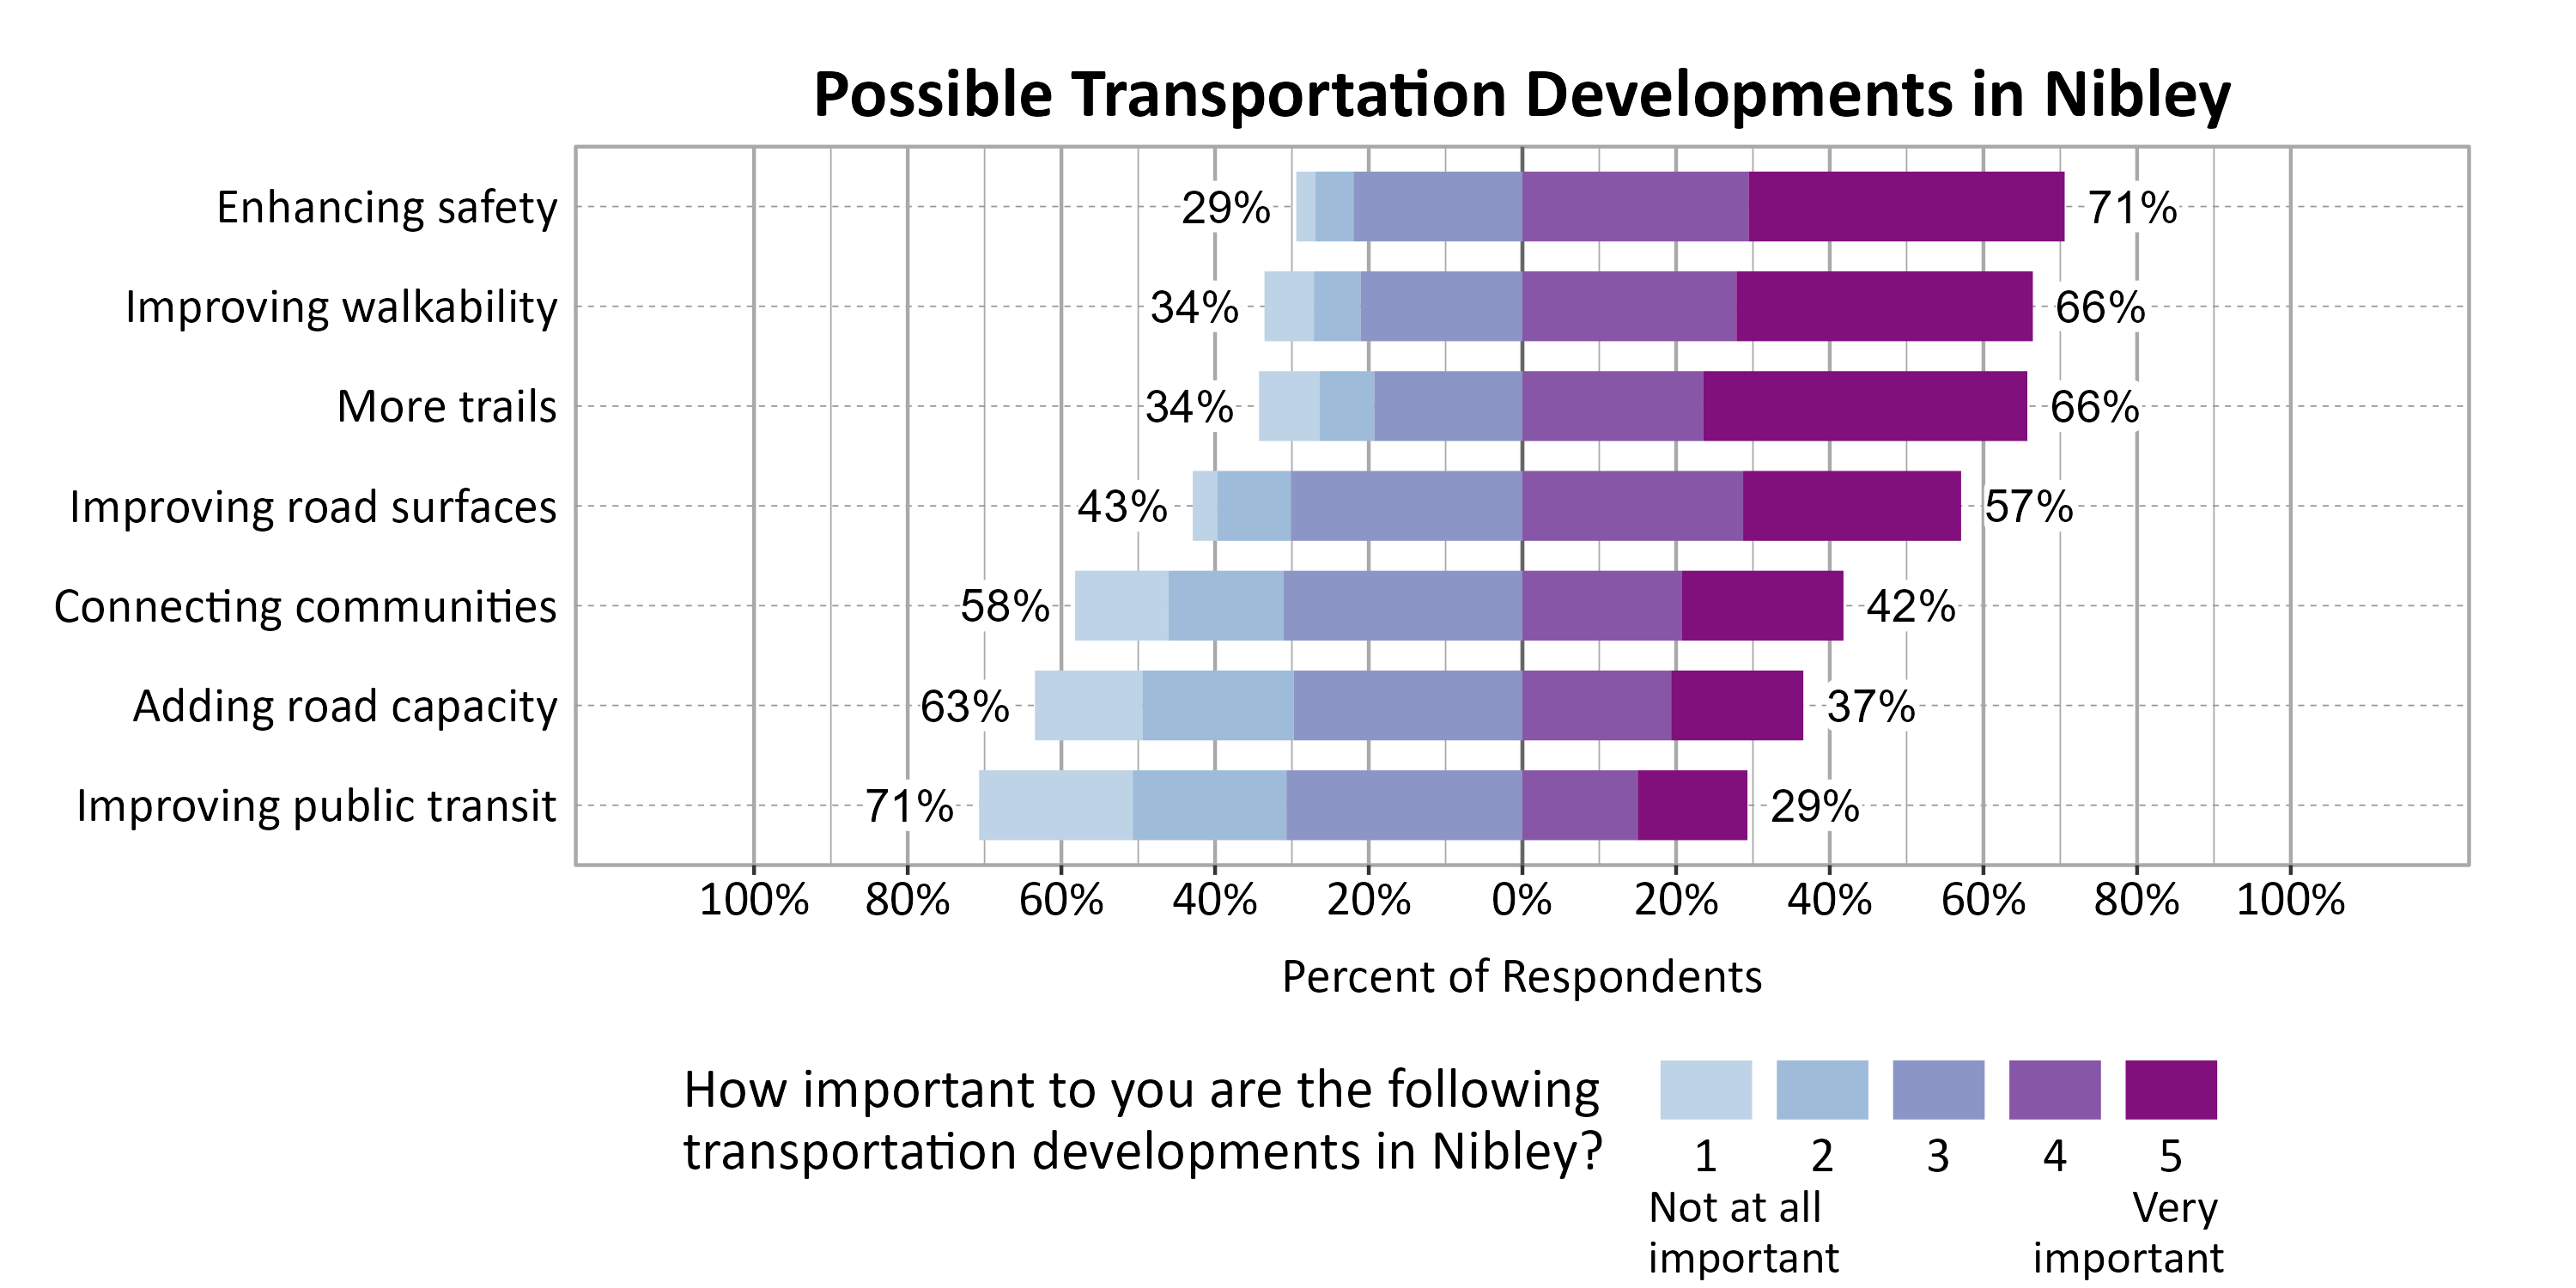
Respondents were asked to indicate the importance of a set of possible transportation developments in Nibley. The most important development to respondents were Enhancing safety (71%), Improving walkability (66%), and More trails (66%).
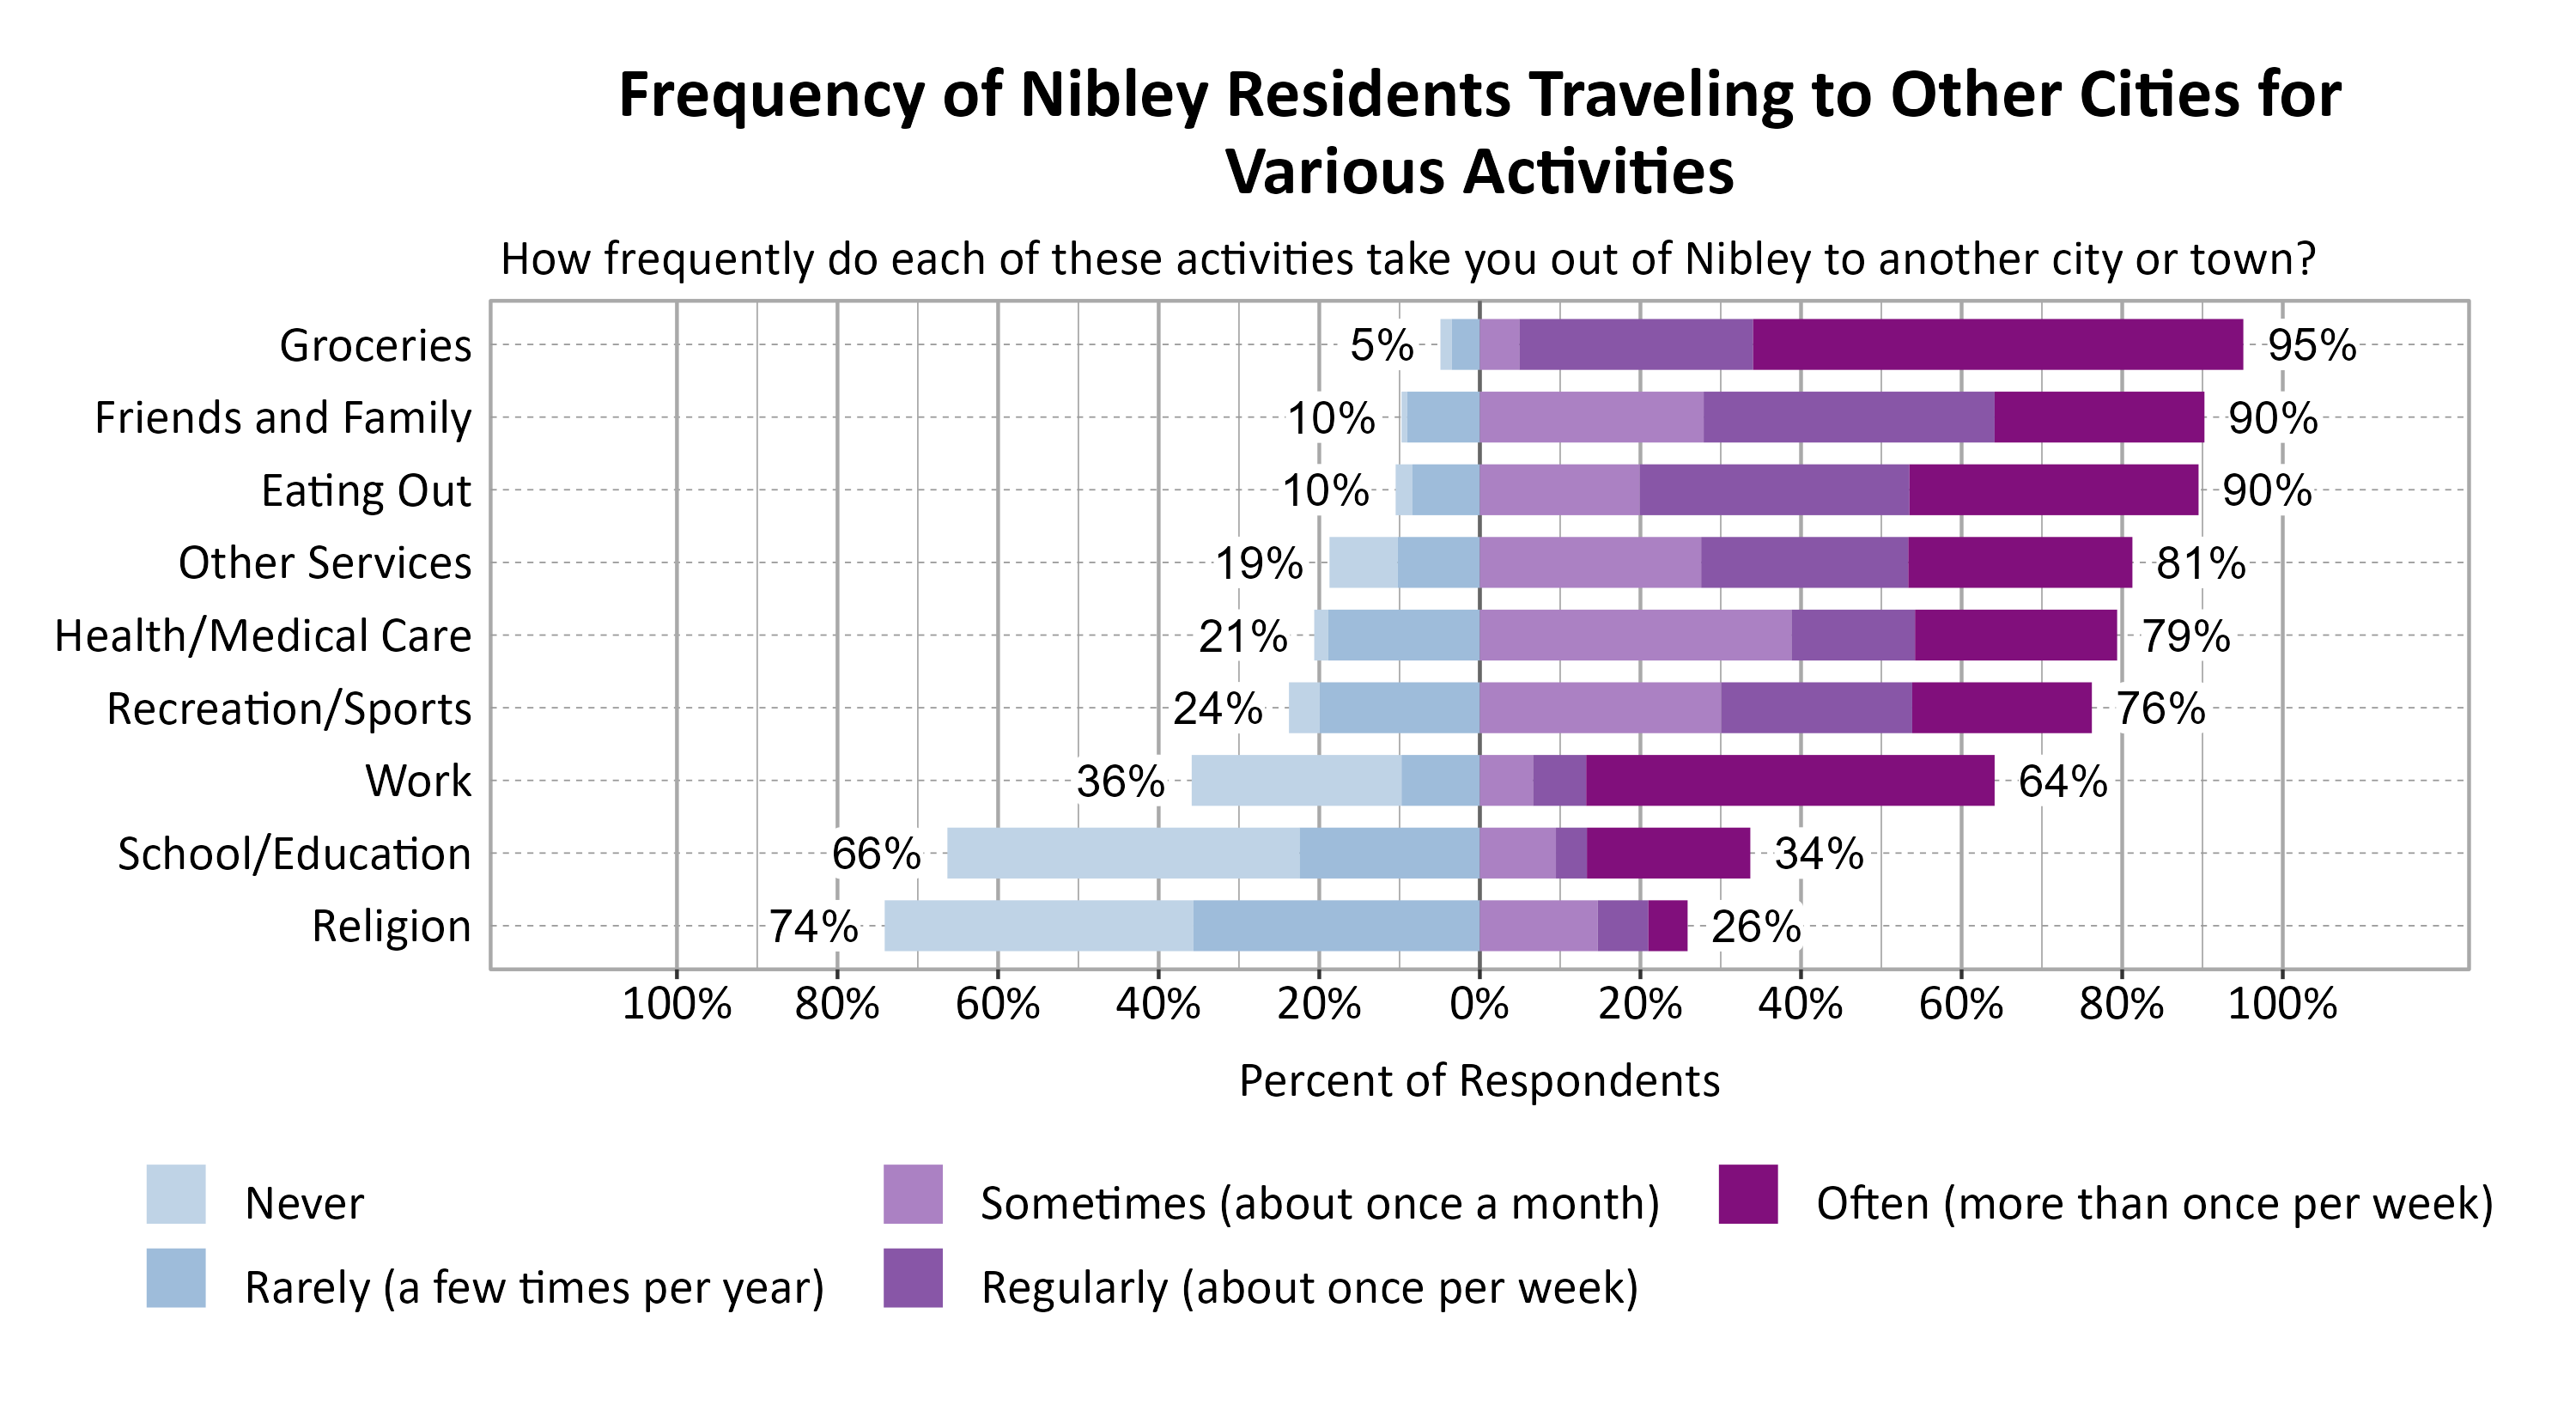
Respondents were asked to indicate how frequently various activities take them out of Nibley to another city or town. The most commonly indicated reasons for traveling to another city or town at least sometimes or once a month were Groceries (95%), Friends and Family (90%), and Eating Out (90%).
Concerns in Nibley
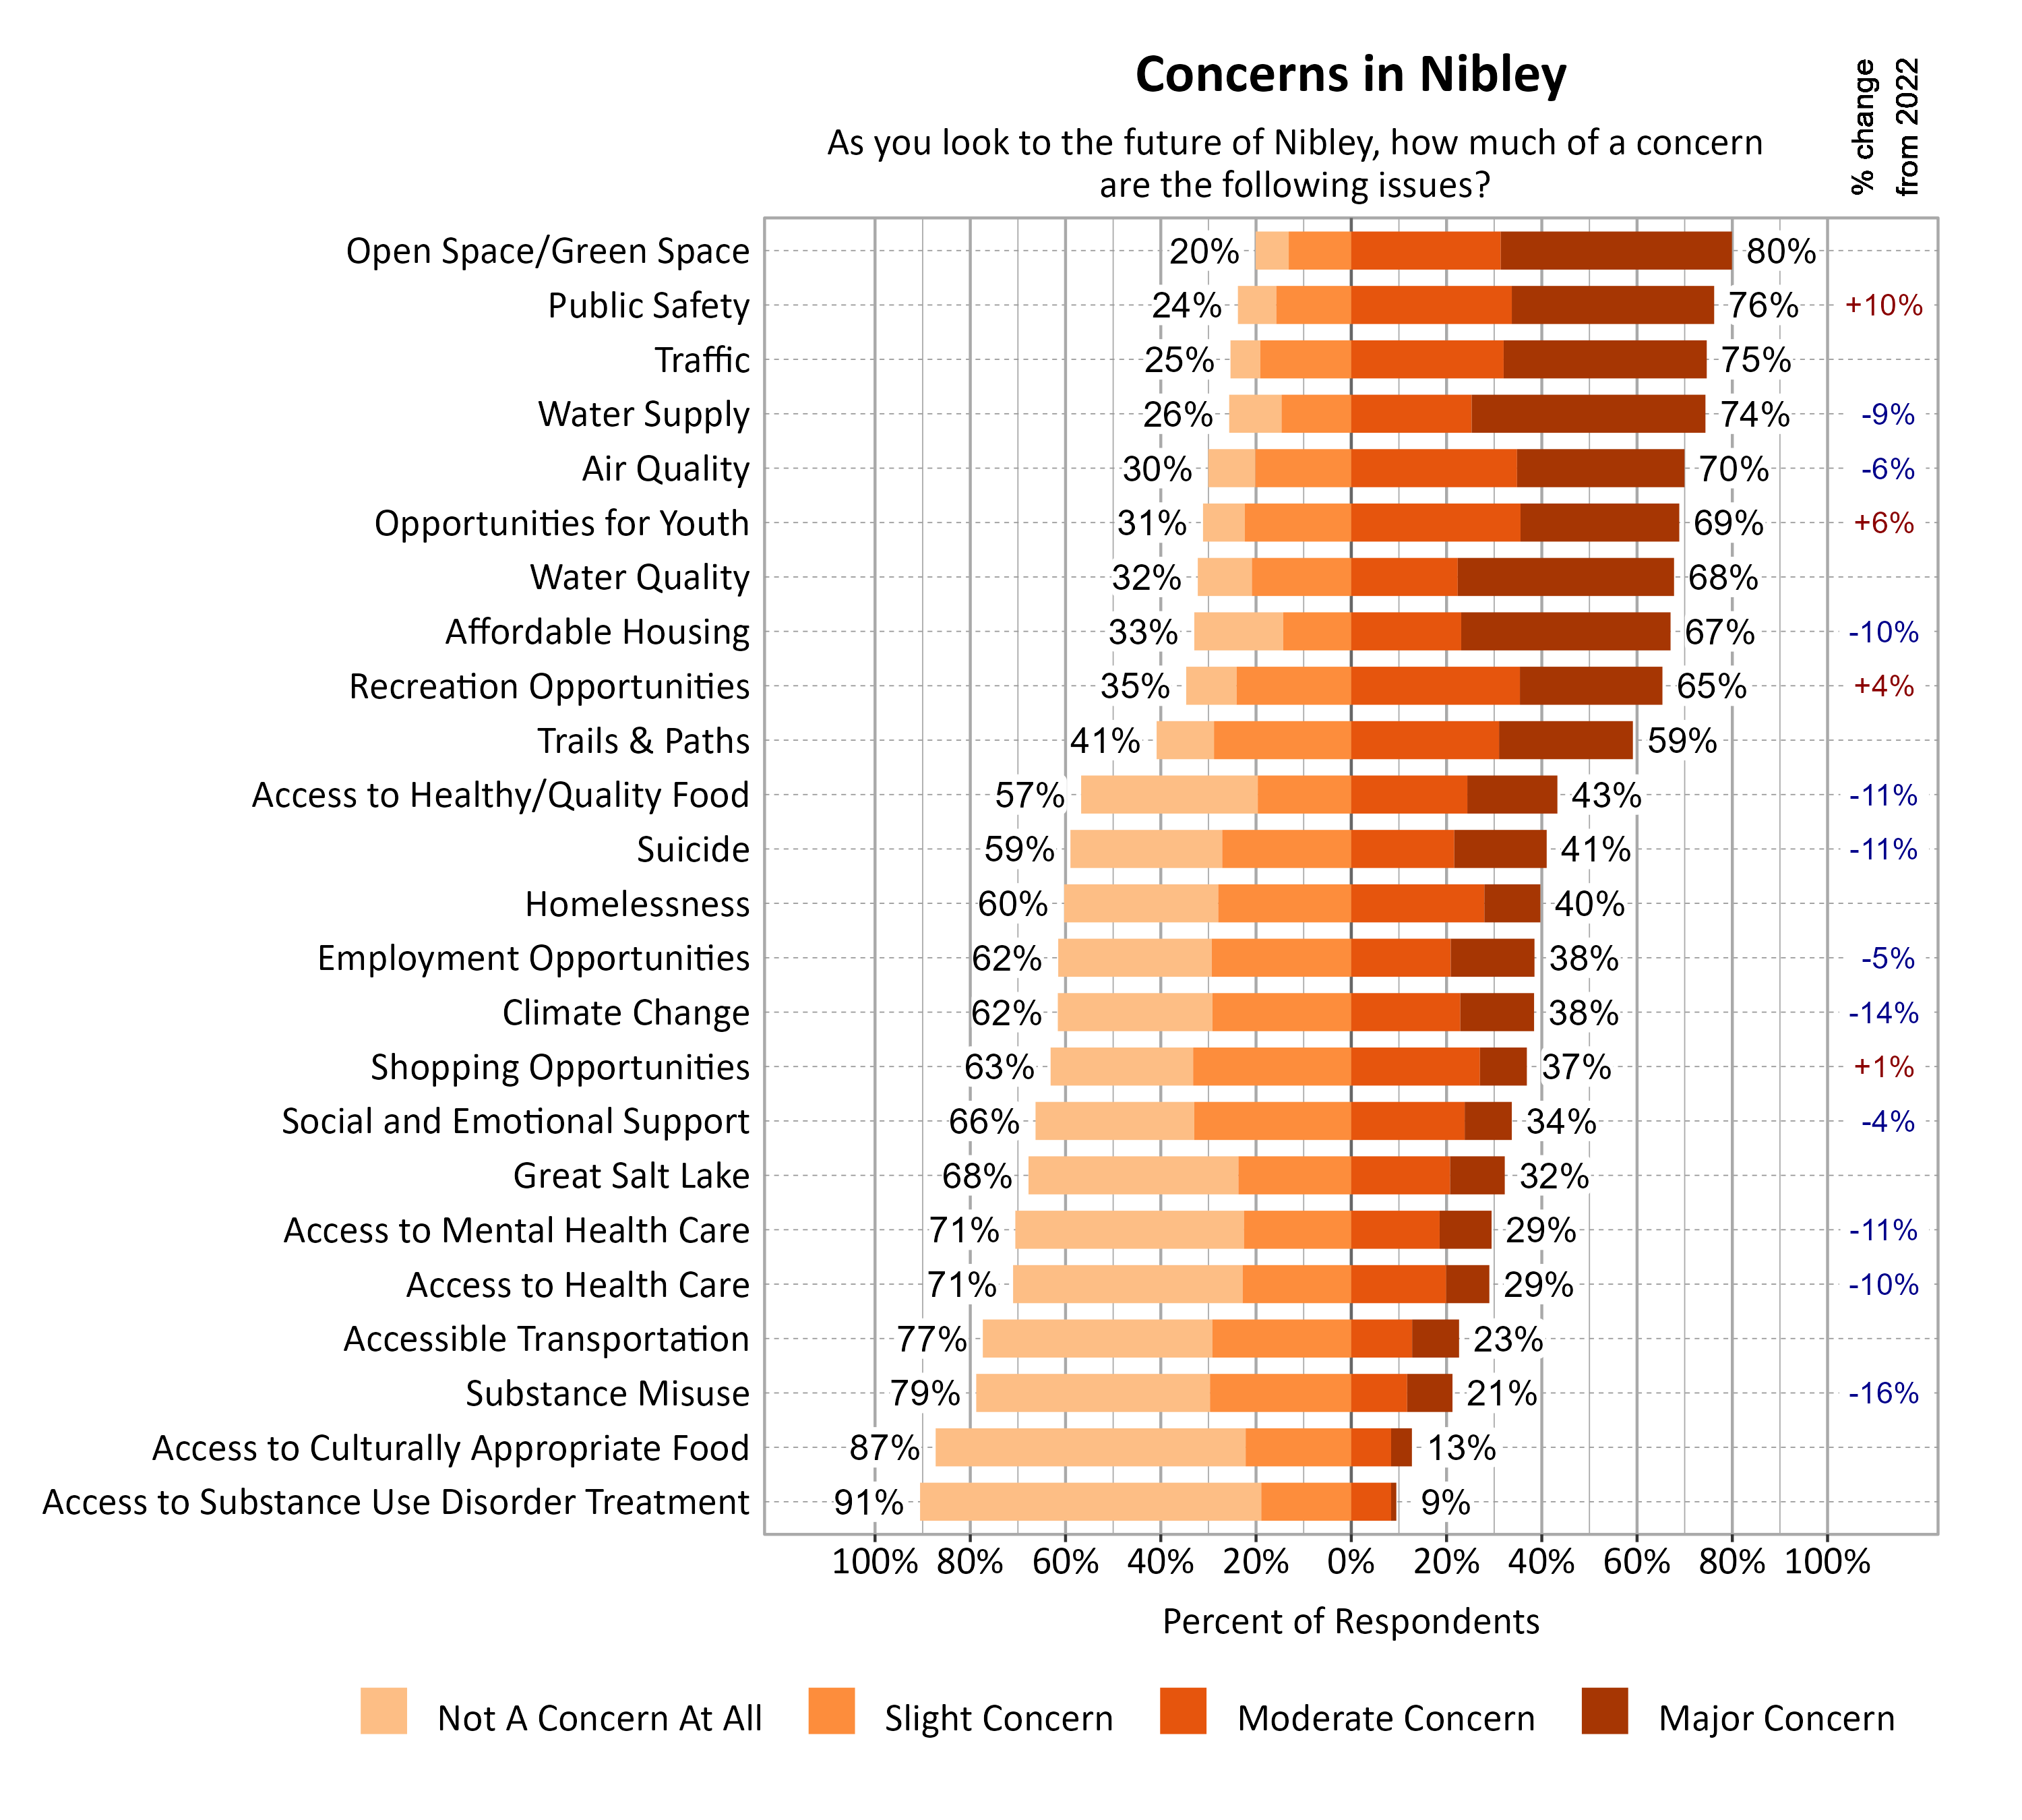
Survey respondents indicated the degree to which a number of possible local issues were a concern as they look to the future of Nibley. Open Space/Green Space (80%), Public Safety (76%), Traffic (75%), and Water Supply (74%) were the top concerns. Since 2022, moderate or major concern about public safety (+10%) notably increased, while concern about substance misuse (-16%), climate change (-14%), access to healthy/quality food (-11%), suicide (-11%), access to mental health care (-11%), affordable housing (-10%), and access to health care (-10%) notably decreased.
Additional Questions for Nibley
Amenities in Nibley (2024)
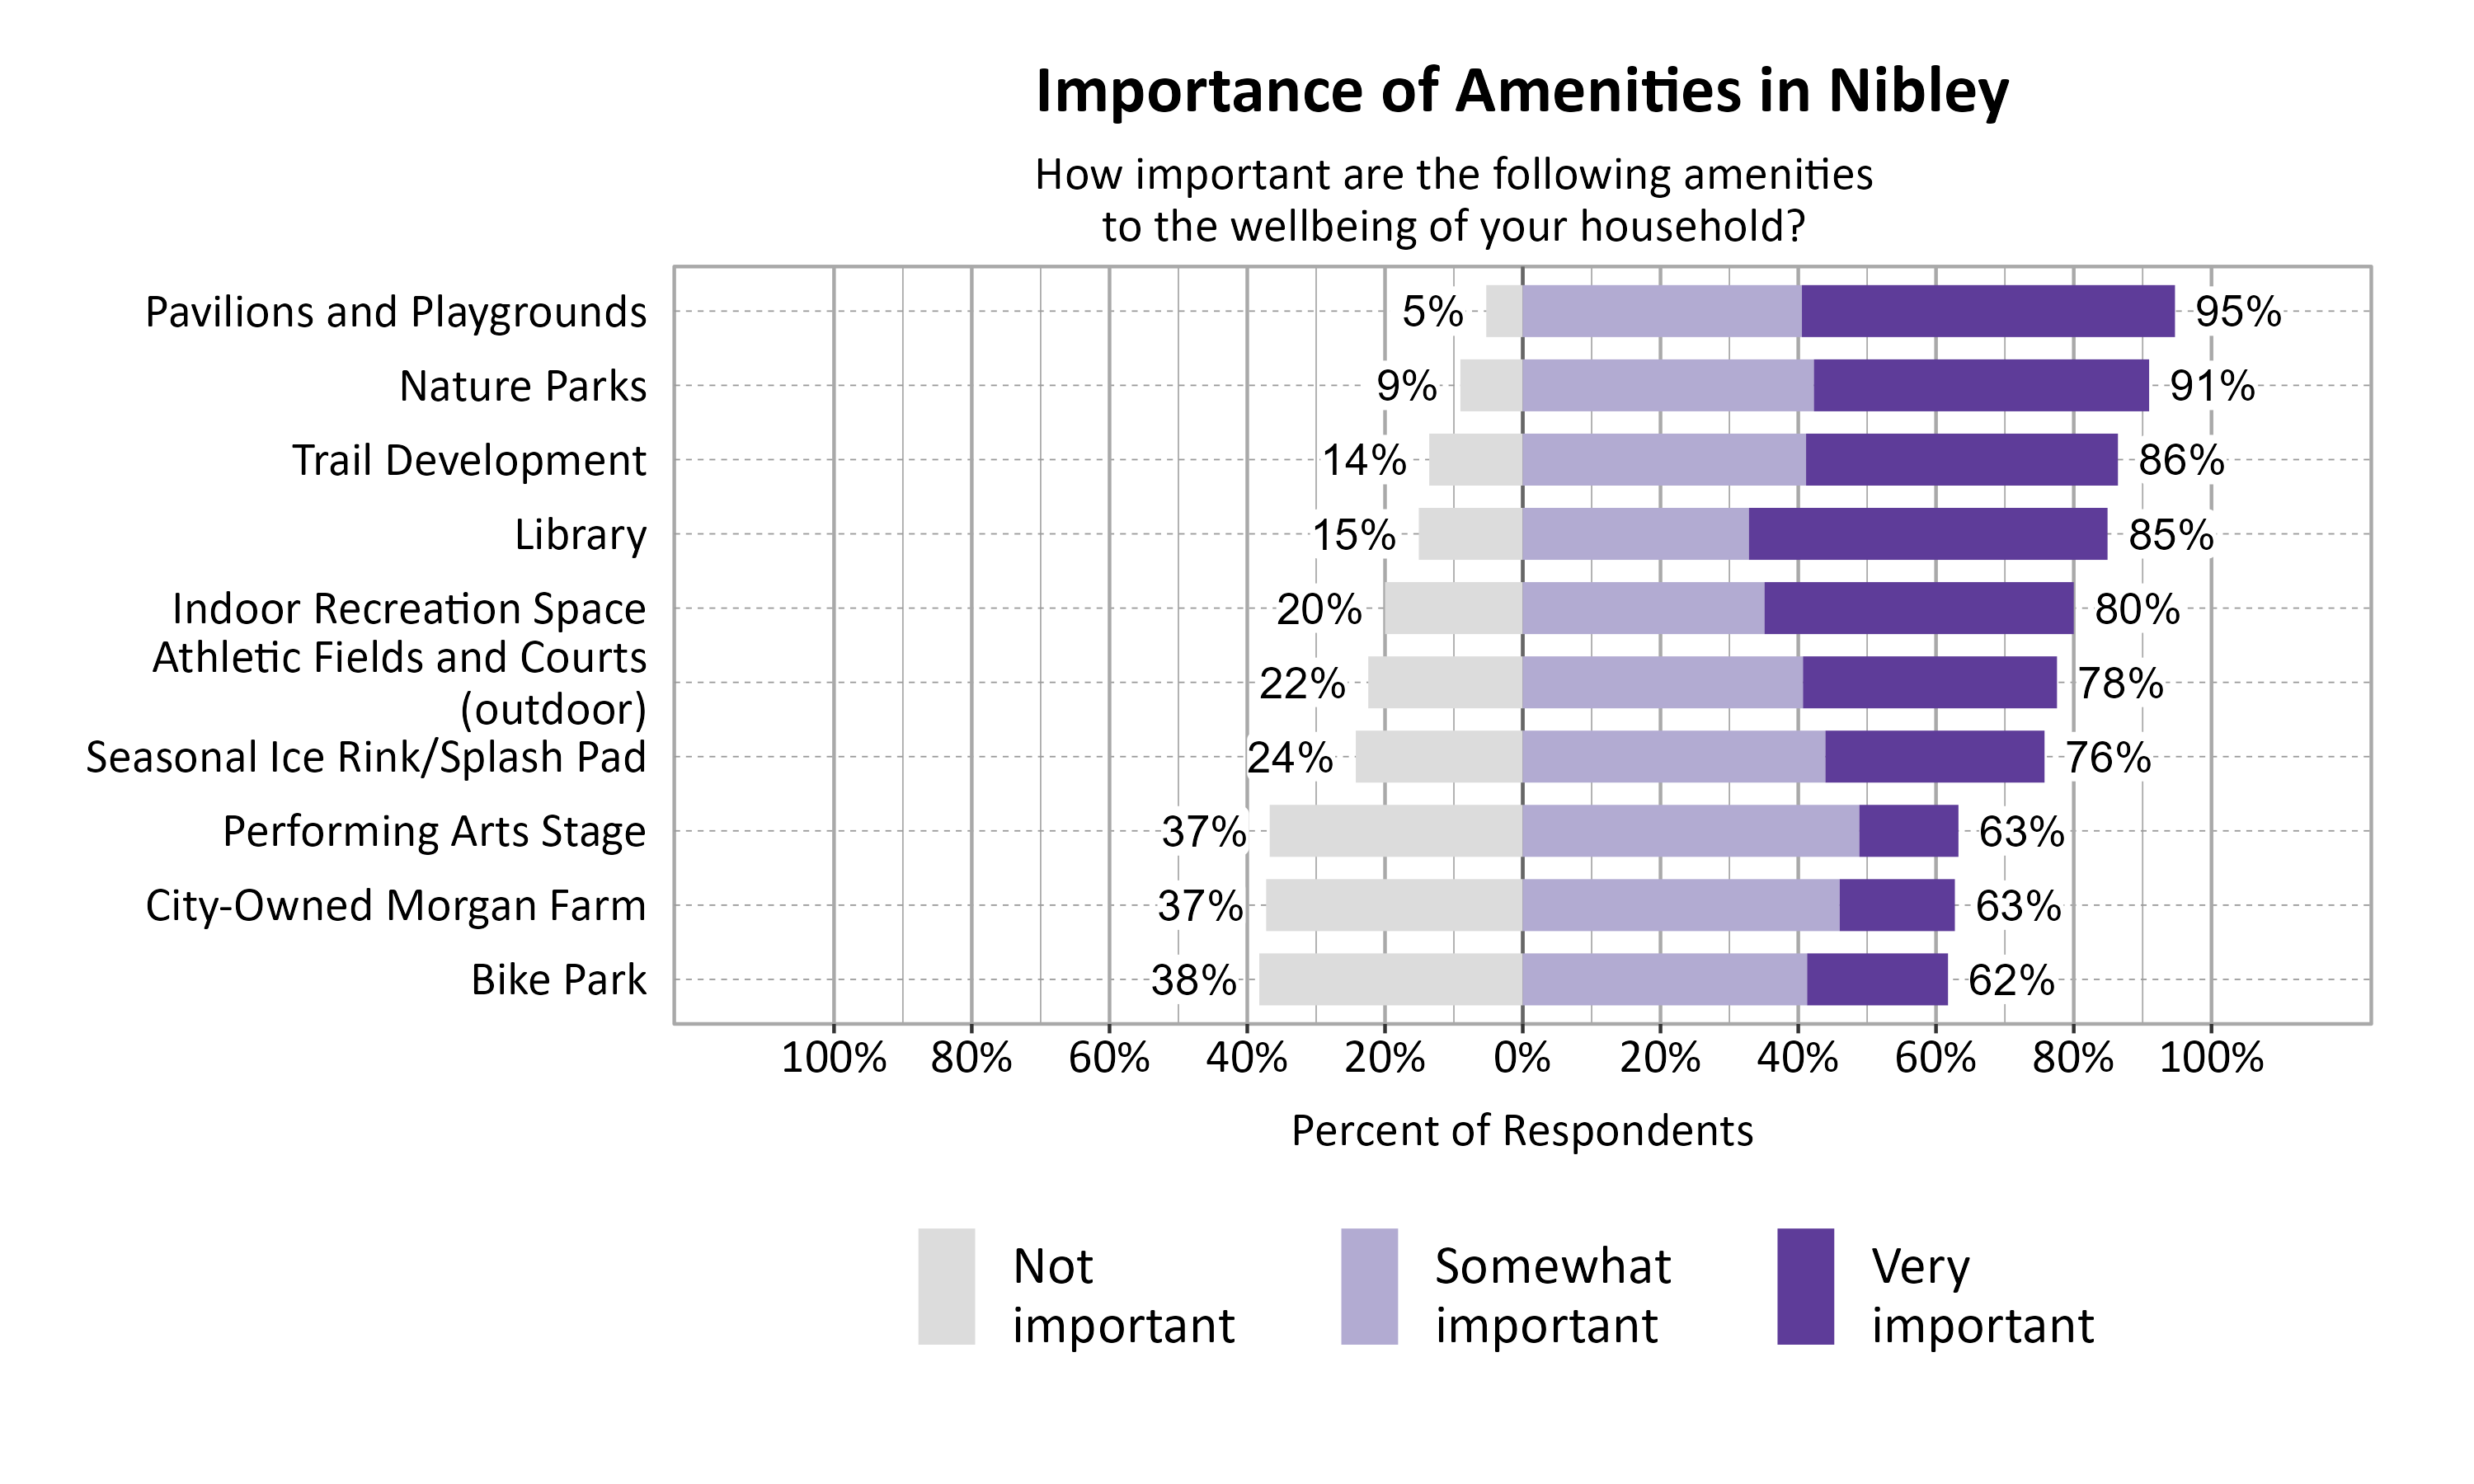
When asked how important a set of amenities were to household wellbeing, the most important were pavilions and playgrounds, nature parks, trail development, and a library. An indoor recreation space, outdoor athletic fields and courts, and a seasonal ice rink/splash pad were also notably important.
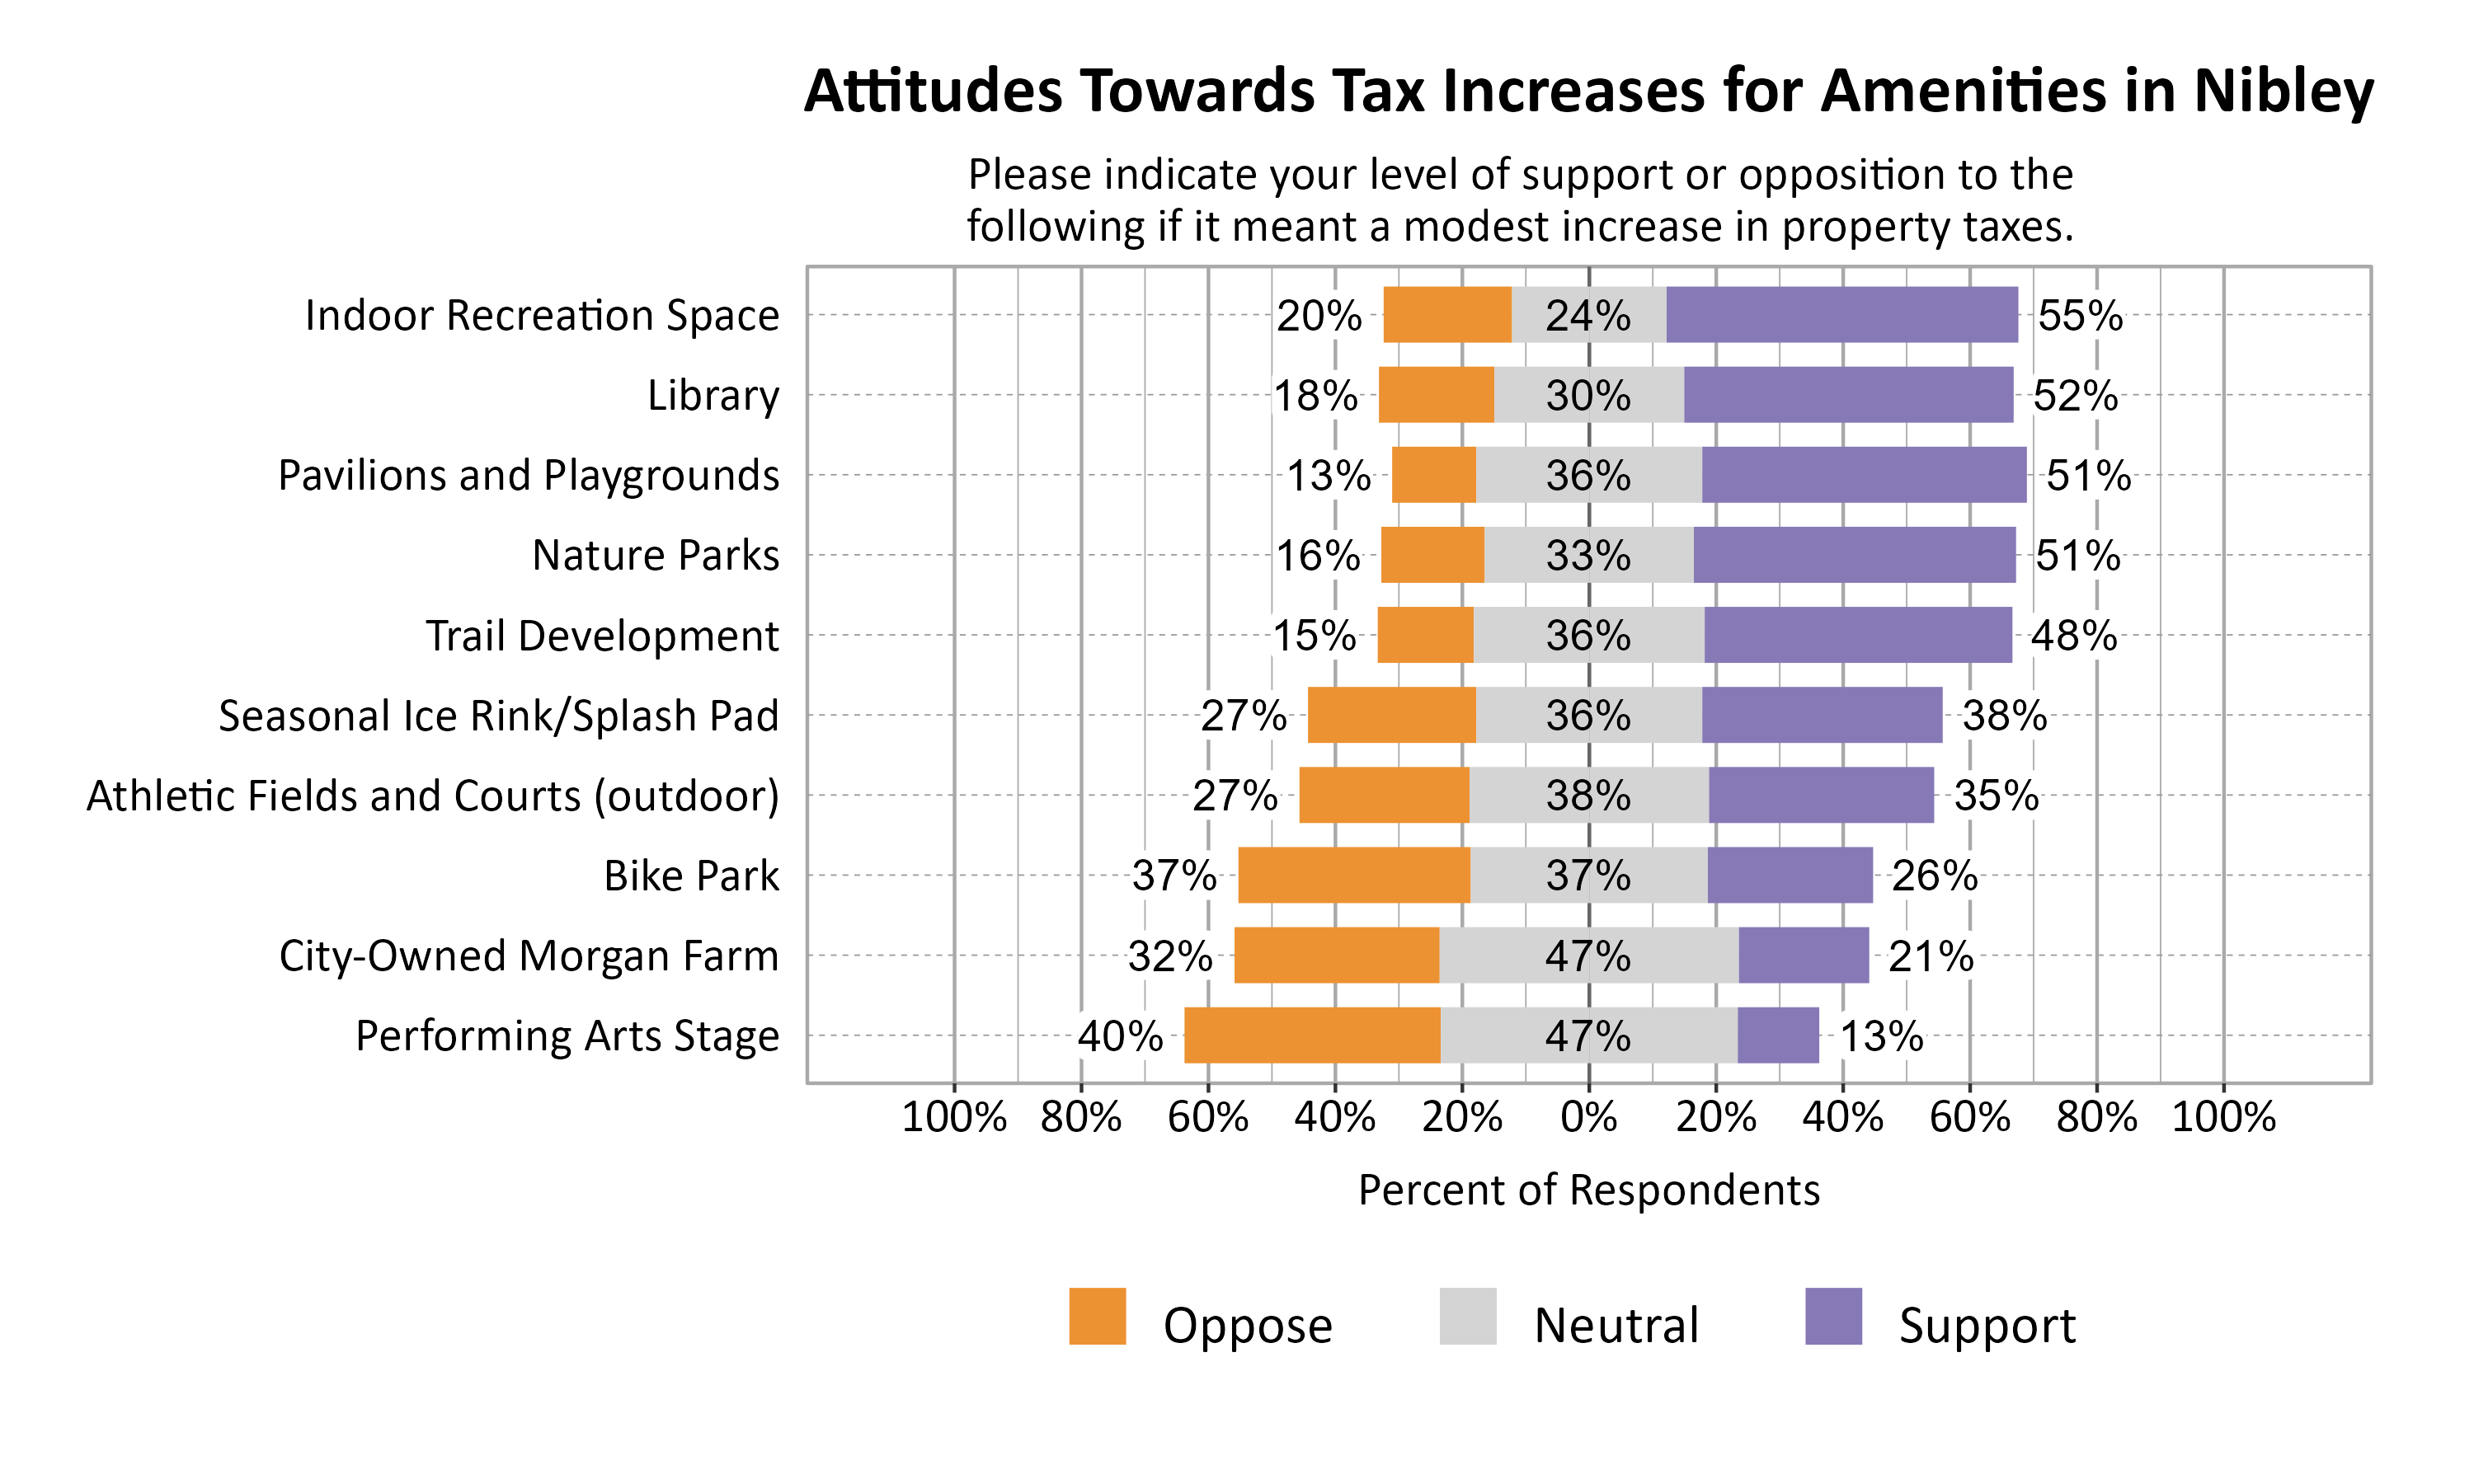
When asked about support or opposition to the above amenities if it meant a modest increase in property taxes, support was highest for an indoor recreation space, library, pavilions and playgrounds, and nature parks.
Respondents were asked if they had any additional comments about Nibley City amenities or services. Recreation related comments focused largely on the need for indoor recreation space, more parks and playgrounds, outdoor fields, a splash pad, pickleball courts, walking/biking trails, and a dog park. There were some comments against building an indoor recreation facility. Other comments were diverse and emphasized some satisfaction regarding Nibley services as well as the need for attention to sidewalks and road safety, housing density, taxes and affordability, protecting green spaces and open spaces and a few other concerns.
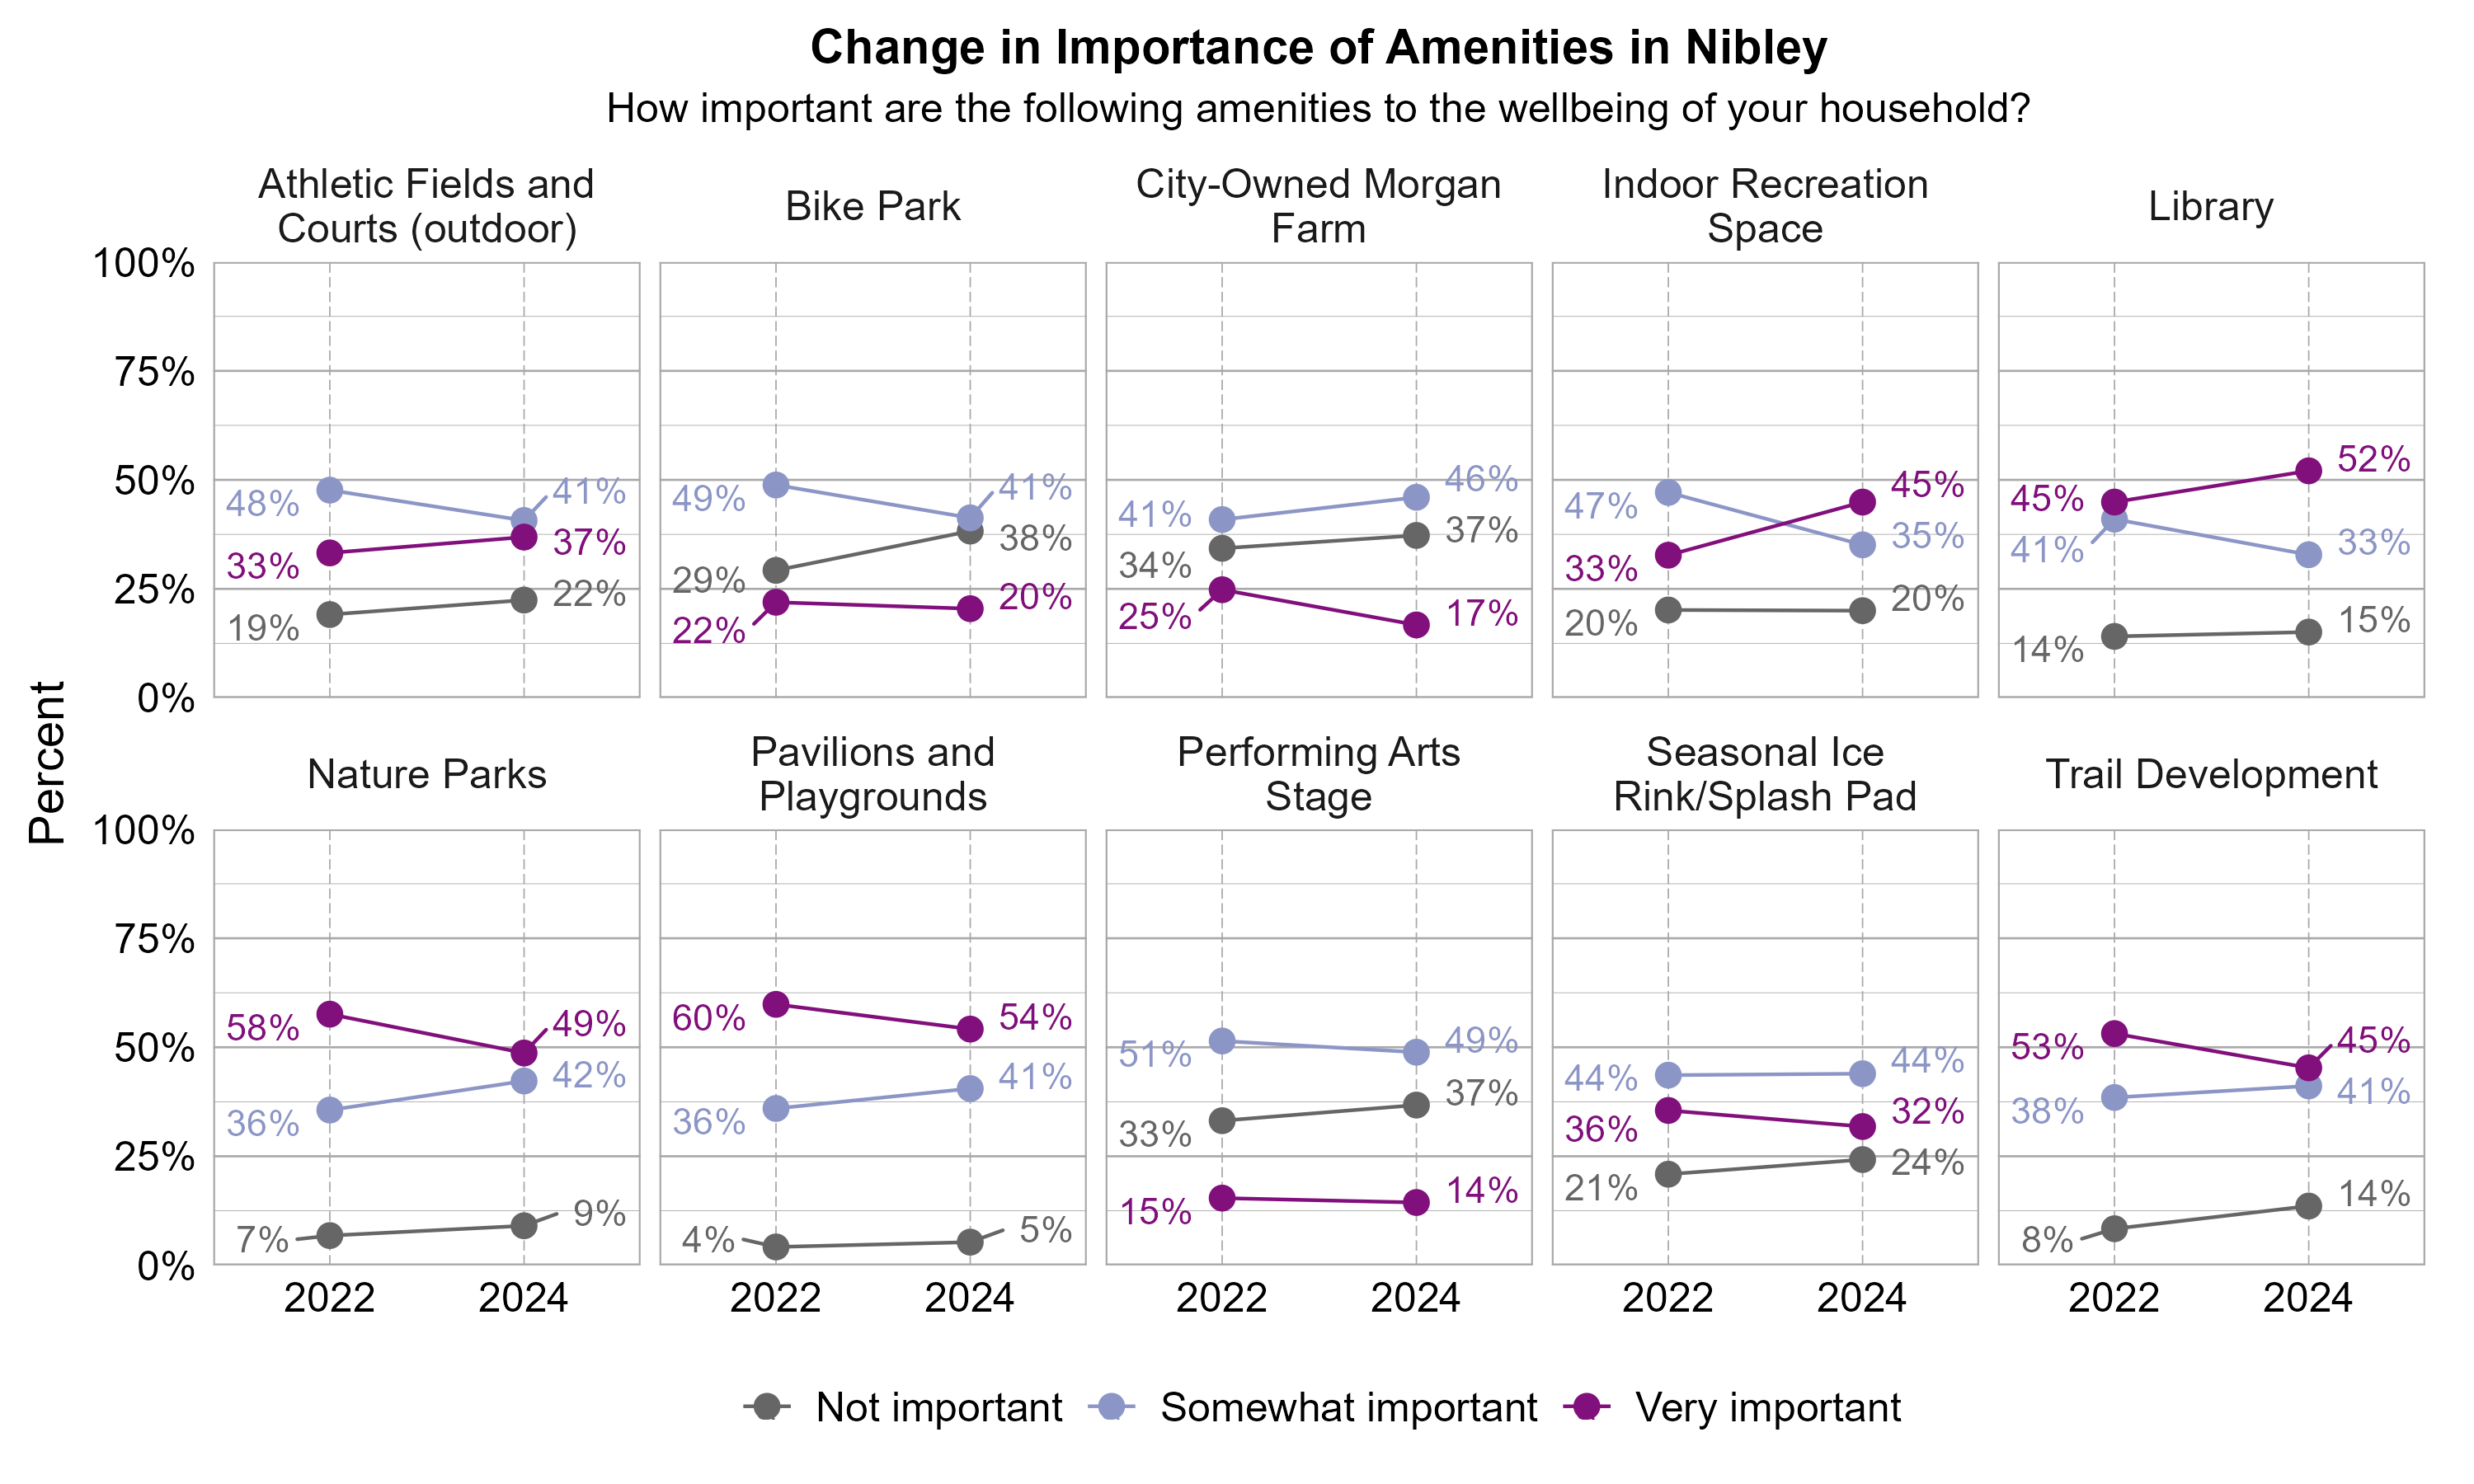
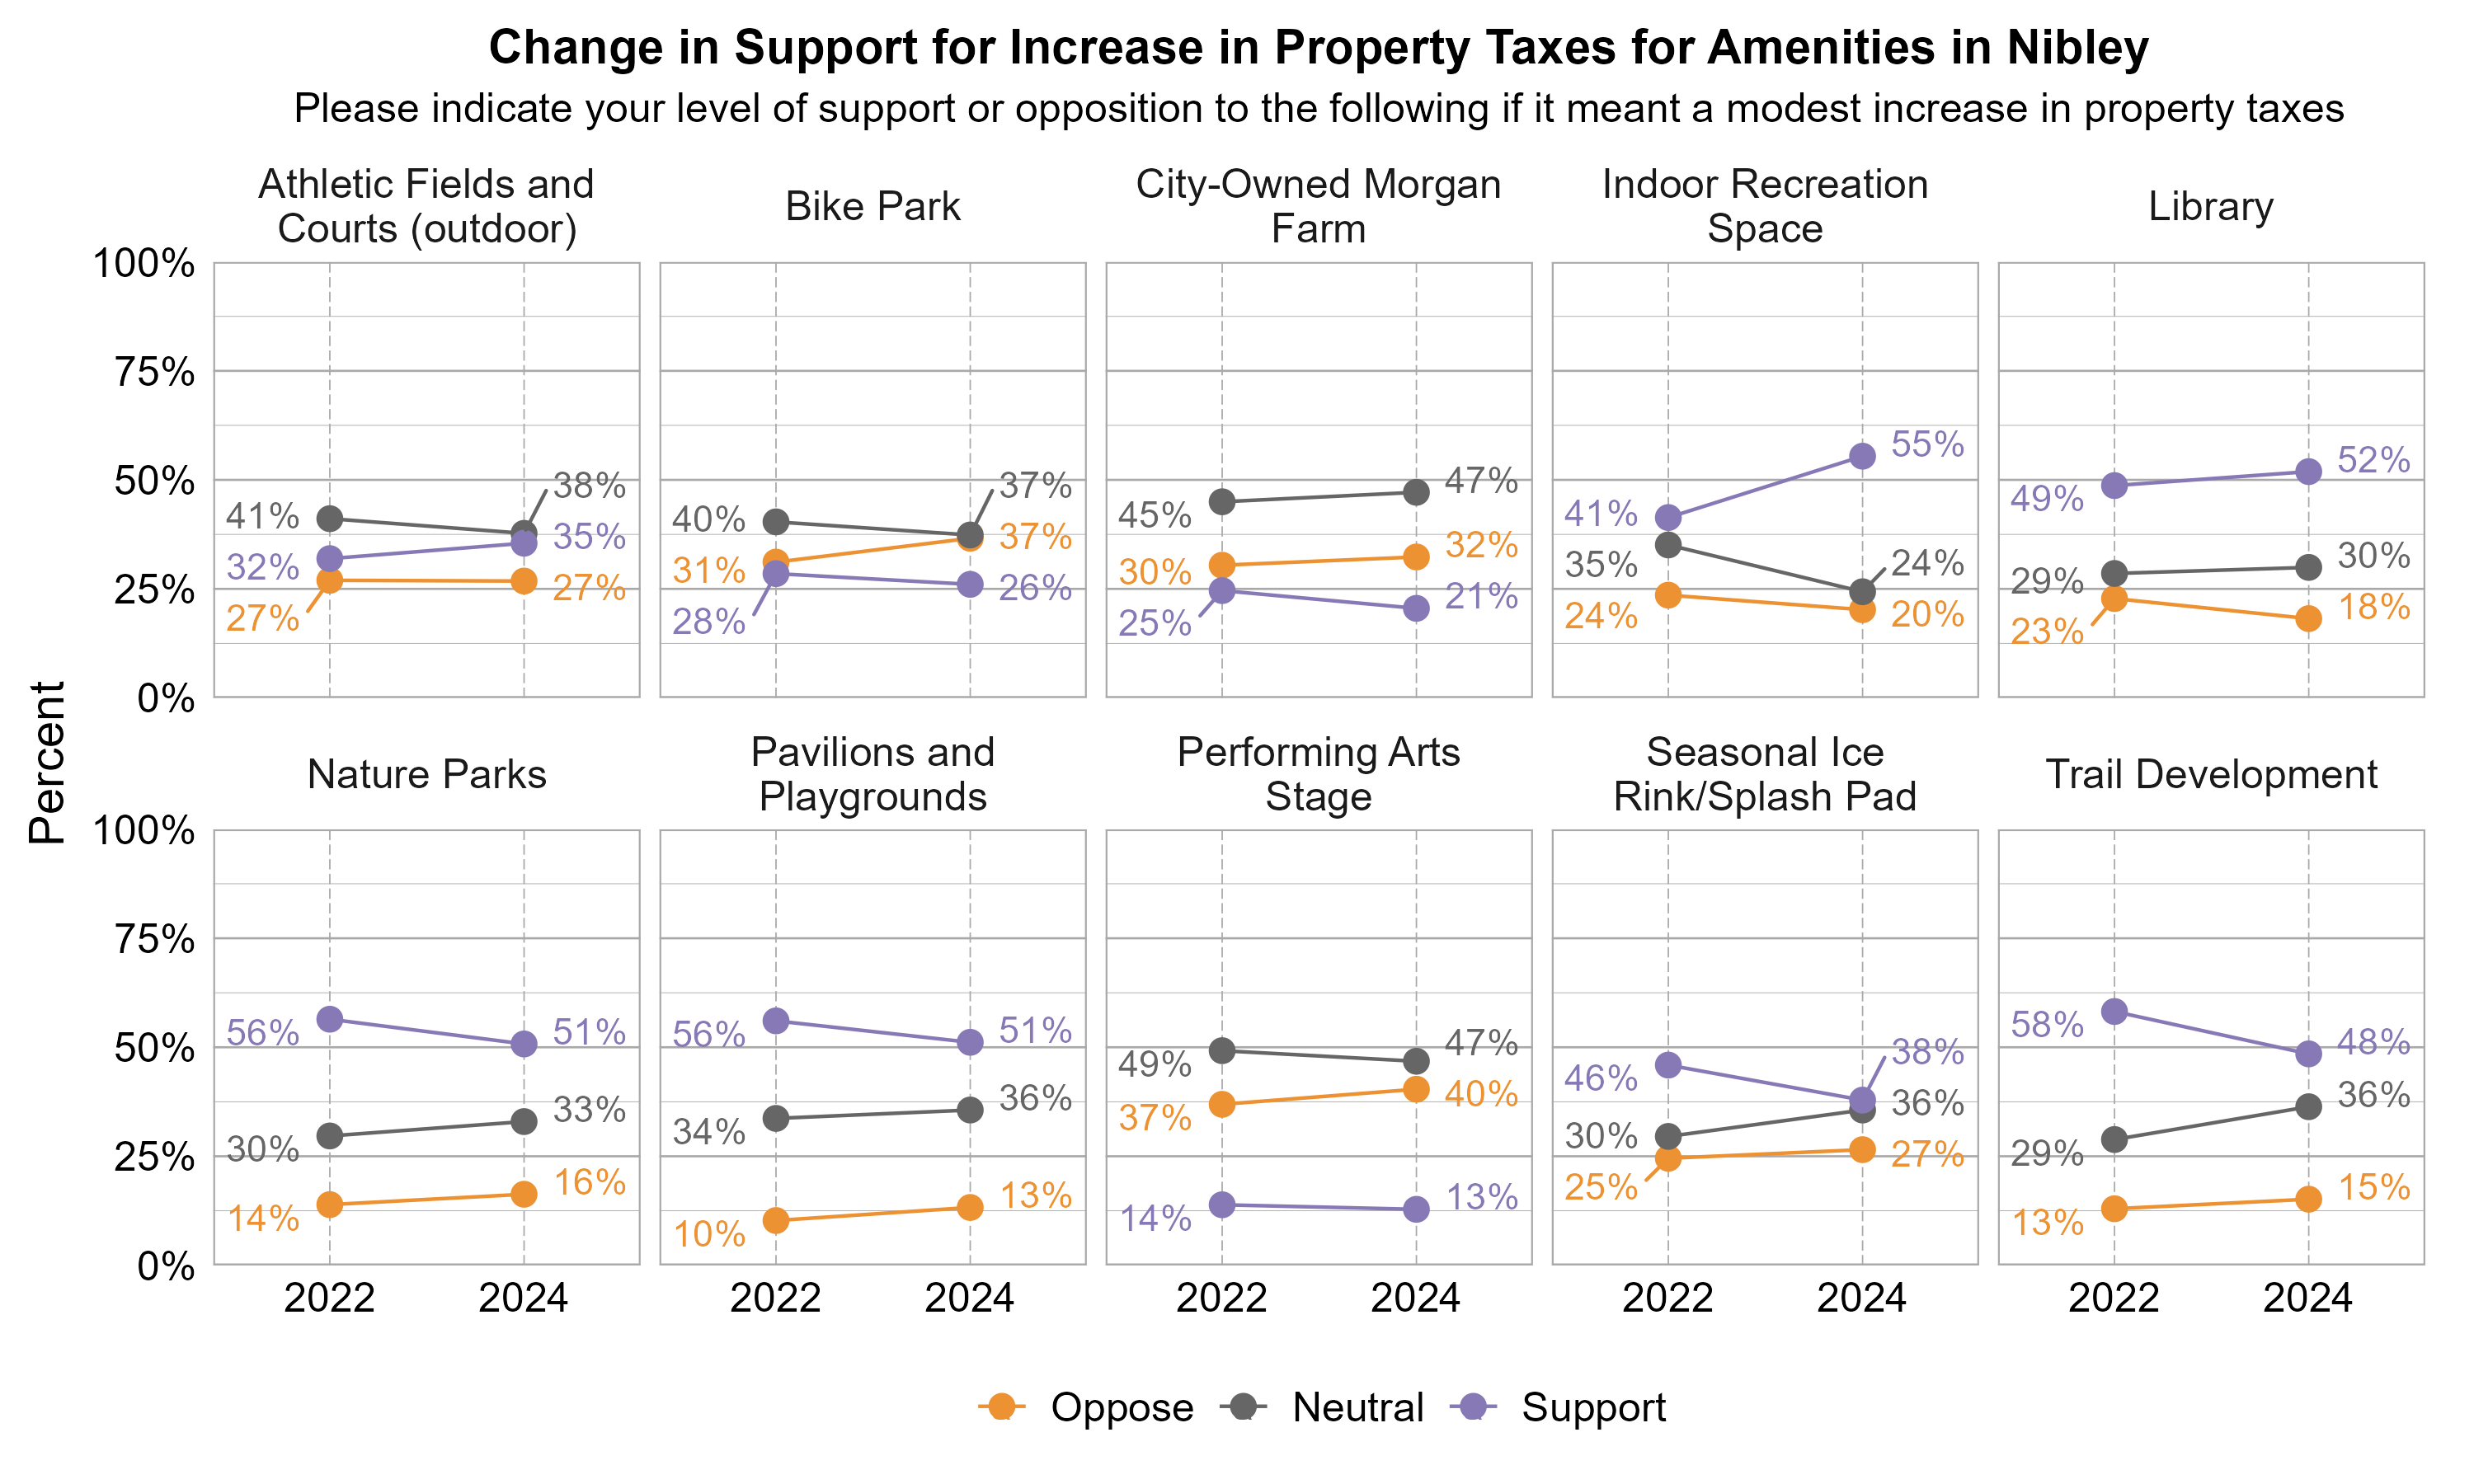
Amenities in Nibley Over Time
Nibley also asked about amenity importance and support for their taxes in 2022. The changes in opinion from 2022 to 2024 are shown in the following two plots. The proportion indicating athletic fields and courts, indoor recreation space, and library were very important increased from 2022 to 2024. Support, even if it meant a modest increase in taxes, also increased for these three amenities from 2022 to 2024.
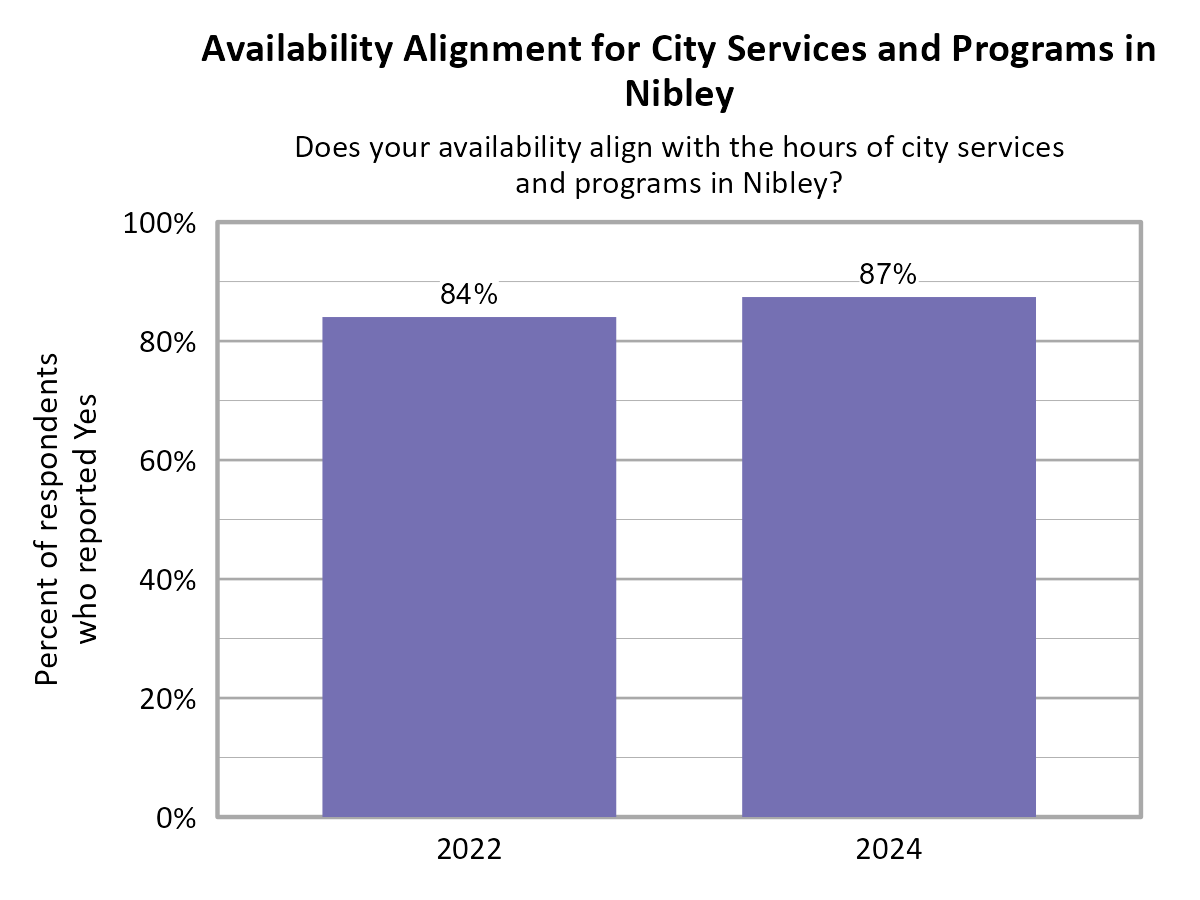
Availability of City Services and Programs in Nibley
The alignment of availability of city services and programs for respondents in Nibley for both 2022 and 2024 is shown below. For 2024, availability aligns with the hours of city services and programs in Nibley for 87% of respondents.
Respondents were also asked if there are any changes in the hours of city services and programs that would be helpful to them or their household. There were a number of comments suggesting no changes needed. For others, there were requests for hours and activities beyond traditional work hours and weekdays.
Open Comments
All open comments collected in the survey were shared with city leaders. General observations and themes are shared here.
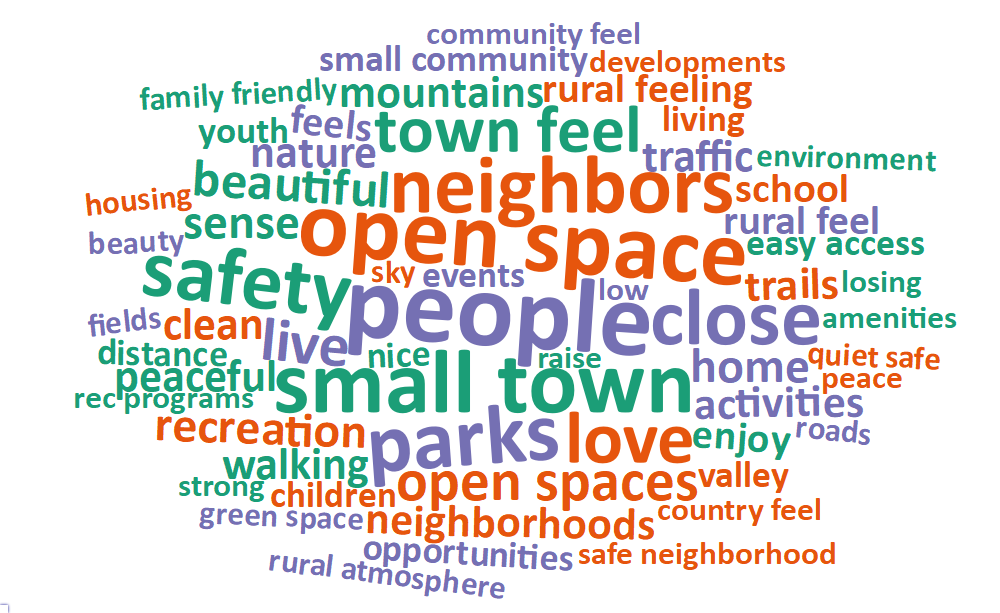
What Respondents Value Most in Nibley
Survey respondents were asked to comment on what they value most about Nibley. The most common words and phrases from all city comments are included in the word cloud below. It is possible that negative or unrelated words may appear since these words have been taken out of context, and they may not indicate the respondent’s intended meaning. Respondents mentioned that they value the social cohesion and connectivity with neighbors and friends in Nibley. The second most mentioned topic related to open space. Respondents also appreciated the recreation opportunities and access to nature.
Local Environmental Quality in Nibley
The 37% of respondents who rated the Local Environmental Quality domain as 1, 2, or 3 (Poor, Fair, or Moderate) were further asked if there are specific aspects of local environmental quality that they feel are problematic. Many comments focused on air quality and inversions in the winter. Many comments also noted the loss of open space due to housing developments and how they would like more areas for trails and revitalization of what open space they have left. A number of comments mentioned that open space is dirty and unkept, and trash is a common theme related to sidewalks and neighboring houses.
Improving Wellbeing in Nibley
Survey respondents were asked if there is anything that could be done to improve wellbeing in Nibley. Many comments centered around transportation, asking for better walking paths and sidewalks, school crossing infrastructure, and reduced traffic. Respondents were also very vocal about growth and feel that there is too much housing development going on and are worried about losing their rural atmosphere. Increased recreation opportunities, especially indoor ones, were also mentioned.
Additional Comments
Respondents were also asked if they had any additional comments on wellbeing in Nibley. The topic of transportation was most prevalent, with people asking for decreased traffic, increased walkability, and the completion of certain road projects. Comments on growth and recreation were also mentioned frequently.