Ogden Wellbeing Survey Findings 2024
By Dr. Courtney Flint and Team
![]()
Contact Information
Dr. Courtney Flint
courtney.flint@usu.edu
435-797-8635
Summary
Ogden is one of 51 cities participating in the Utah Wellbeing Survey Project in 2024. This project is designed to assess the wellbeing and local perspectives of city residents and to provide information to city leaders to inform general planning processes. Additional analysis is underway and this report may be updated over time.
We are grateful to all those who took the survey and to our city partners who helped to make this possible. We are grateful to a number of entities for funding: the Utah League of Cities and Towns, USU Extension, USU’s Institute for Land Water and Air, the Wasatch Front Regional Council, Utah Department of Transportation, the Utah Agricultural Experiment Station, and the cities of Alpine, Cedar Hills, Draper, Millcreek, Nephi, North Salt Lake, Ogden, Orem, Pleasant Grove, Providence, Springdale, Tremonton, West Bountiful, and West Valley City.
This report describes findings from the 2024 Ogden survey and comparative information with other project cities. In October and November 2024, Ogden City advertised the survey for residents largely through social media, newsletters, emails, and utility bills. All city residents age 18+ were encouraged to take the online Qualtrics survey.
How many people responded?
- 780 viable surveys were recorded in this 2024 survey effort.
- The adult population of Ogden was estimated at 66,129, based on the American Community Survey by the U.S. Census. The 780 survey responses in 2024 represent 1.2% of the adult population and have a conservative margin of error of 3.49%.
Survey Respondent Characteristics
| Resident Statistics | |
|---|---|
| Full Time Residents of Ogden | 96.8% |
| Part Time Residents of Ogden | 3.2% |
| Length of Residency — Range | 0.1-82 years |
| Length of Residency — Average | 23.3 years |
| Length of Residency — Median | 19 years |
| Length of Residency 5 Years or less | 22.3% |
| ZIP Code | Percent |
|---|---|
| 84401 | 26.9% |
| 84403 | 36.8% |
| 84404 | 32.6% |
| 84405 | 1.2% |
| 84414 | 2.2% |
| Other | 0.4% |
| City Area | Percent |
|---|---|
| District 1 | 19.9% |
| District 2 | 16.1% |
| District 3 | 27.1% |
| District 4 | 36.9% |

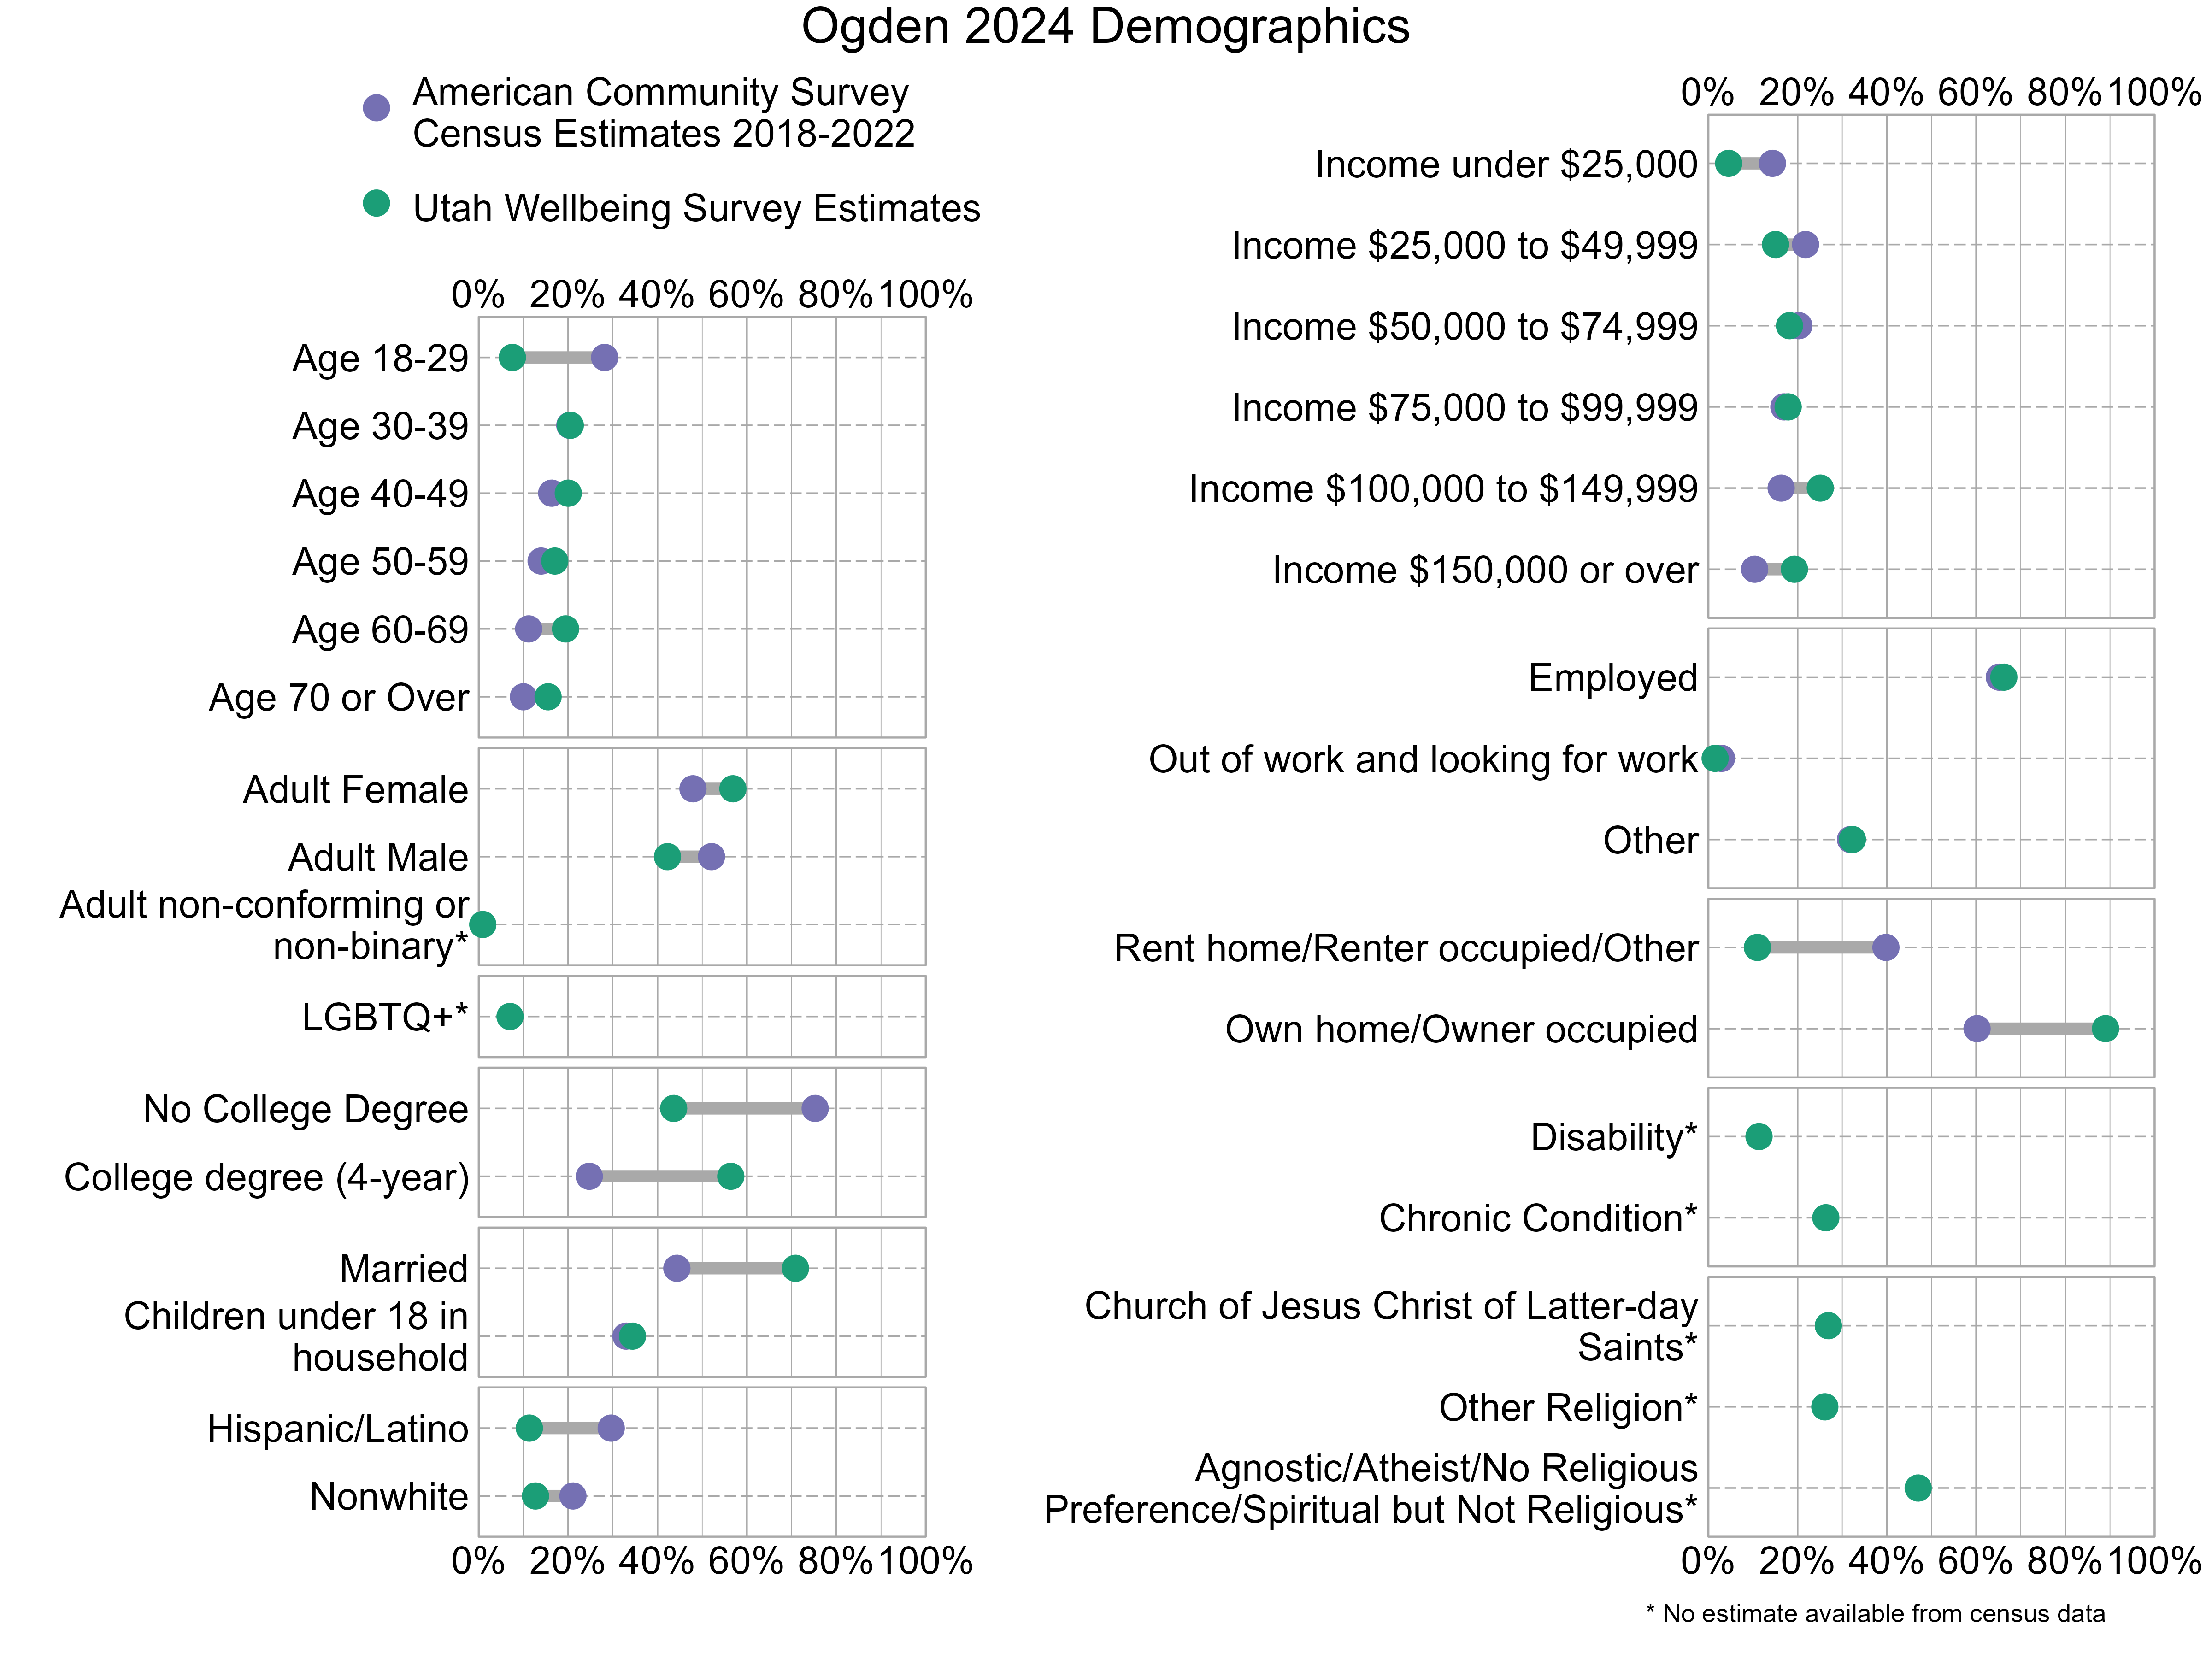
Demographic characteristics of the survey respondents were compared below with U.S. Census information from the 2018-2022 American Community Survey. In the graph below, gray bars indicate differences between the American Community Survey estimates and the Utah Wellbeing Project surveys. The wider the gray bars, the larger the differences. Also note that estimates for religious affiliation, adult non-conforming or non-binary gender, LGBTQ+, disability, and chronic conditions are unavailable from the census data. There can also be a variable margin of error in the American Community Survey estimates, and caution should be used when comparing estimates. Not all respondents provided demographic information. As the graph shows, 2024 survey respondents were not fully representative of Ogden. People who have at least a 4-year college degree, are married, and own their homes were overrepresented while those who are age 18-29, do not have a college degree, are Hispanic or latino, and are renters were underrepresented.
Overall Personal Wellbeing and Overall Wellbeing in Ogden
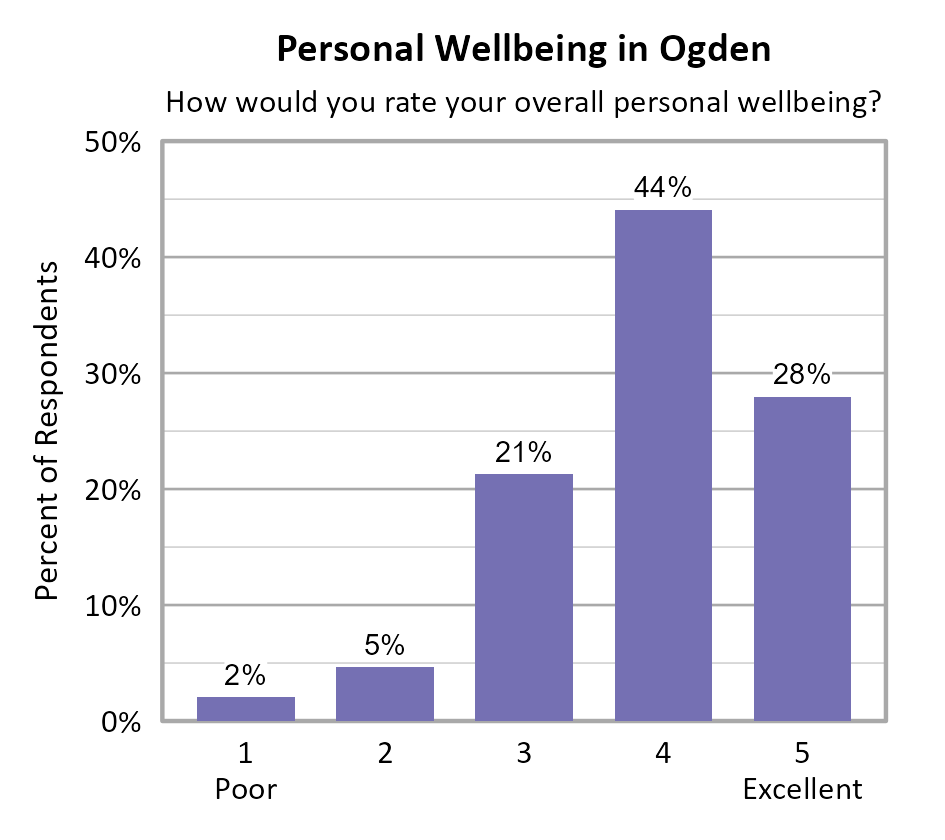
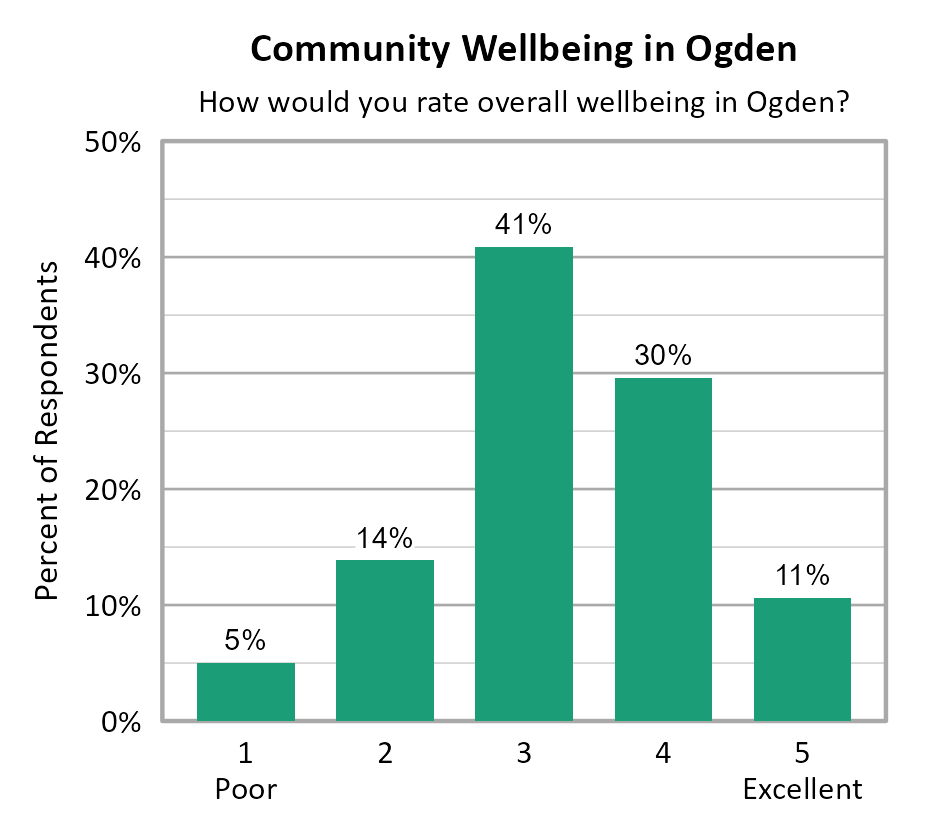
Survey participants were asked about their overall personal wellbeing and overall community wellbeing in Ogden. These wellbeing indicators were both measured on a 5-point scale from poor (1) to excellent (5). The average personal wellbeing score in Ogden was 3.91 with 72% of respondents indicating their wellbeing at a 4 or 5 on the 5-point scale. The average score for community wellbeing in Ogden was 3.27 with 40% of respondents indicating community wellbeing at a 4 or 5 on the 5-point scale. The 4 Municipal Districts in Ogden (see map at the top of the report) had statistically different personal and community wellbeing scores, with District 4 having the highest scores followed by Districts 3, 2, and then 1.
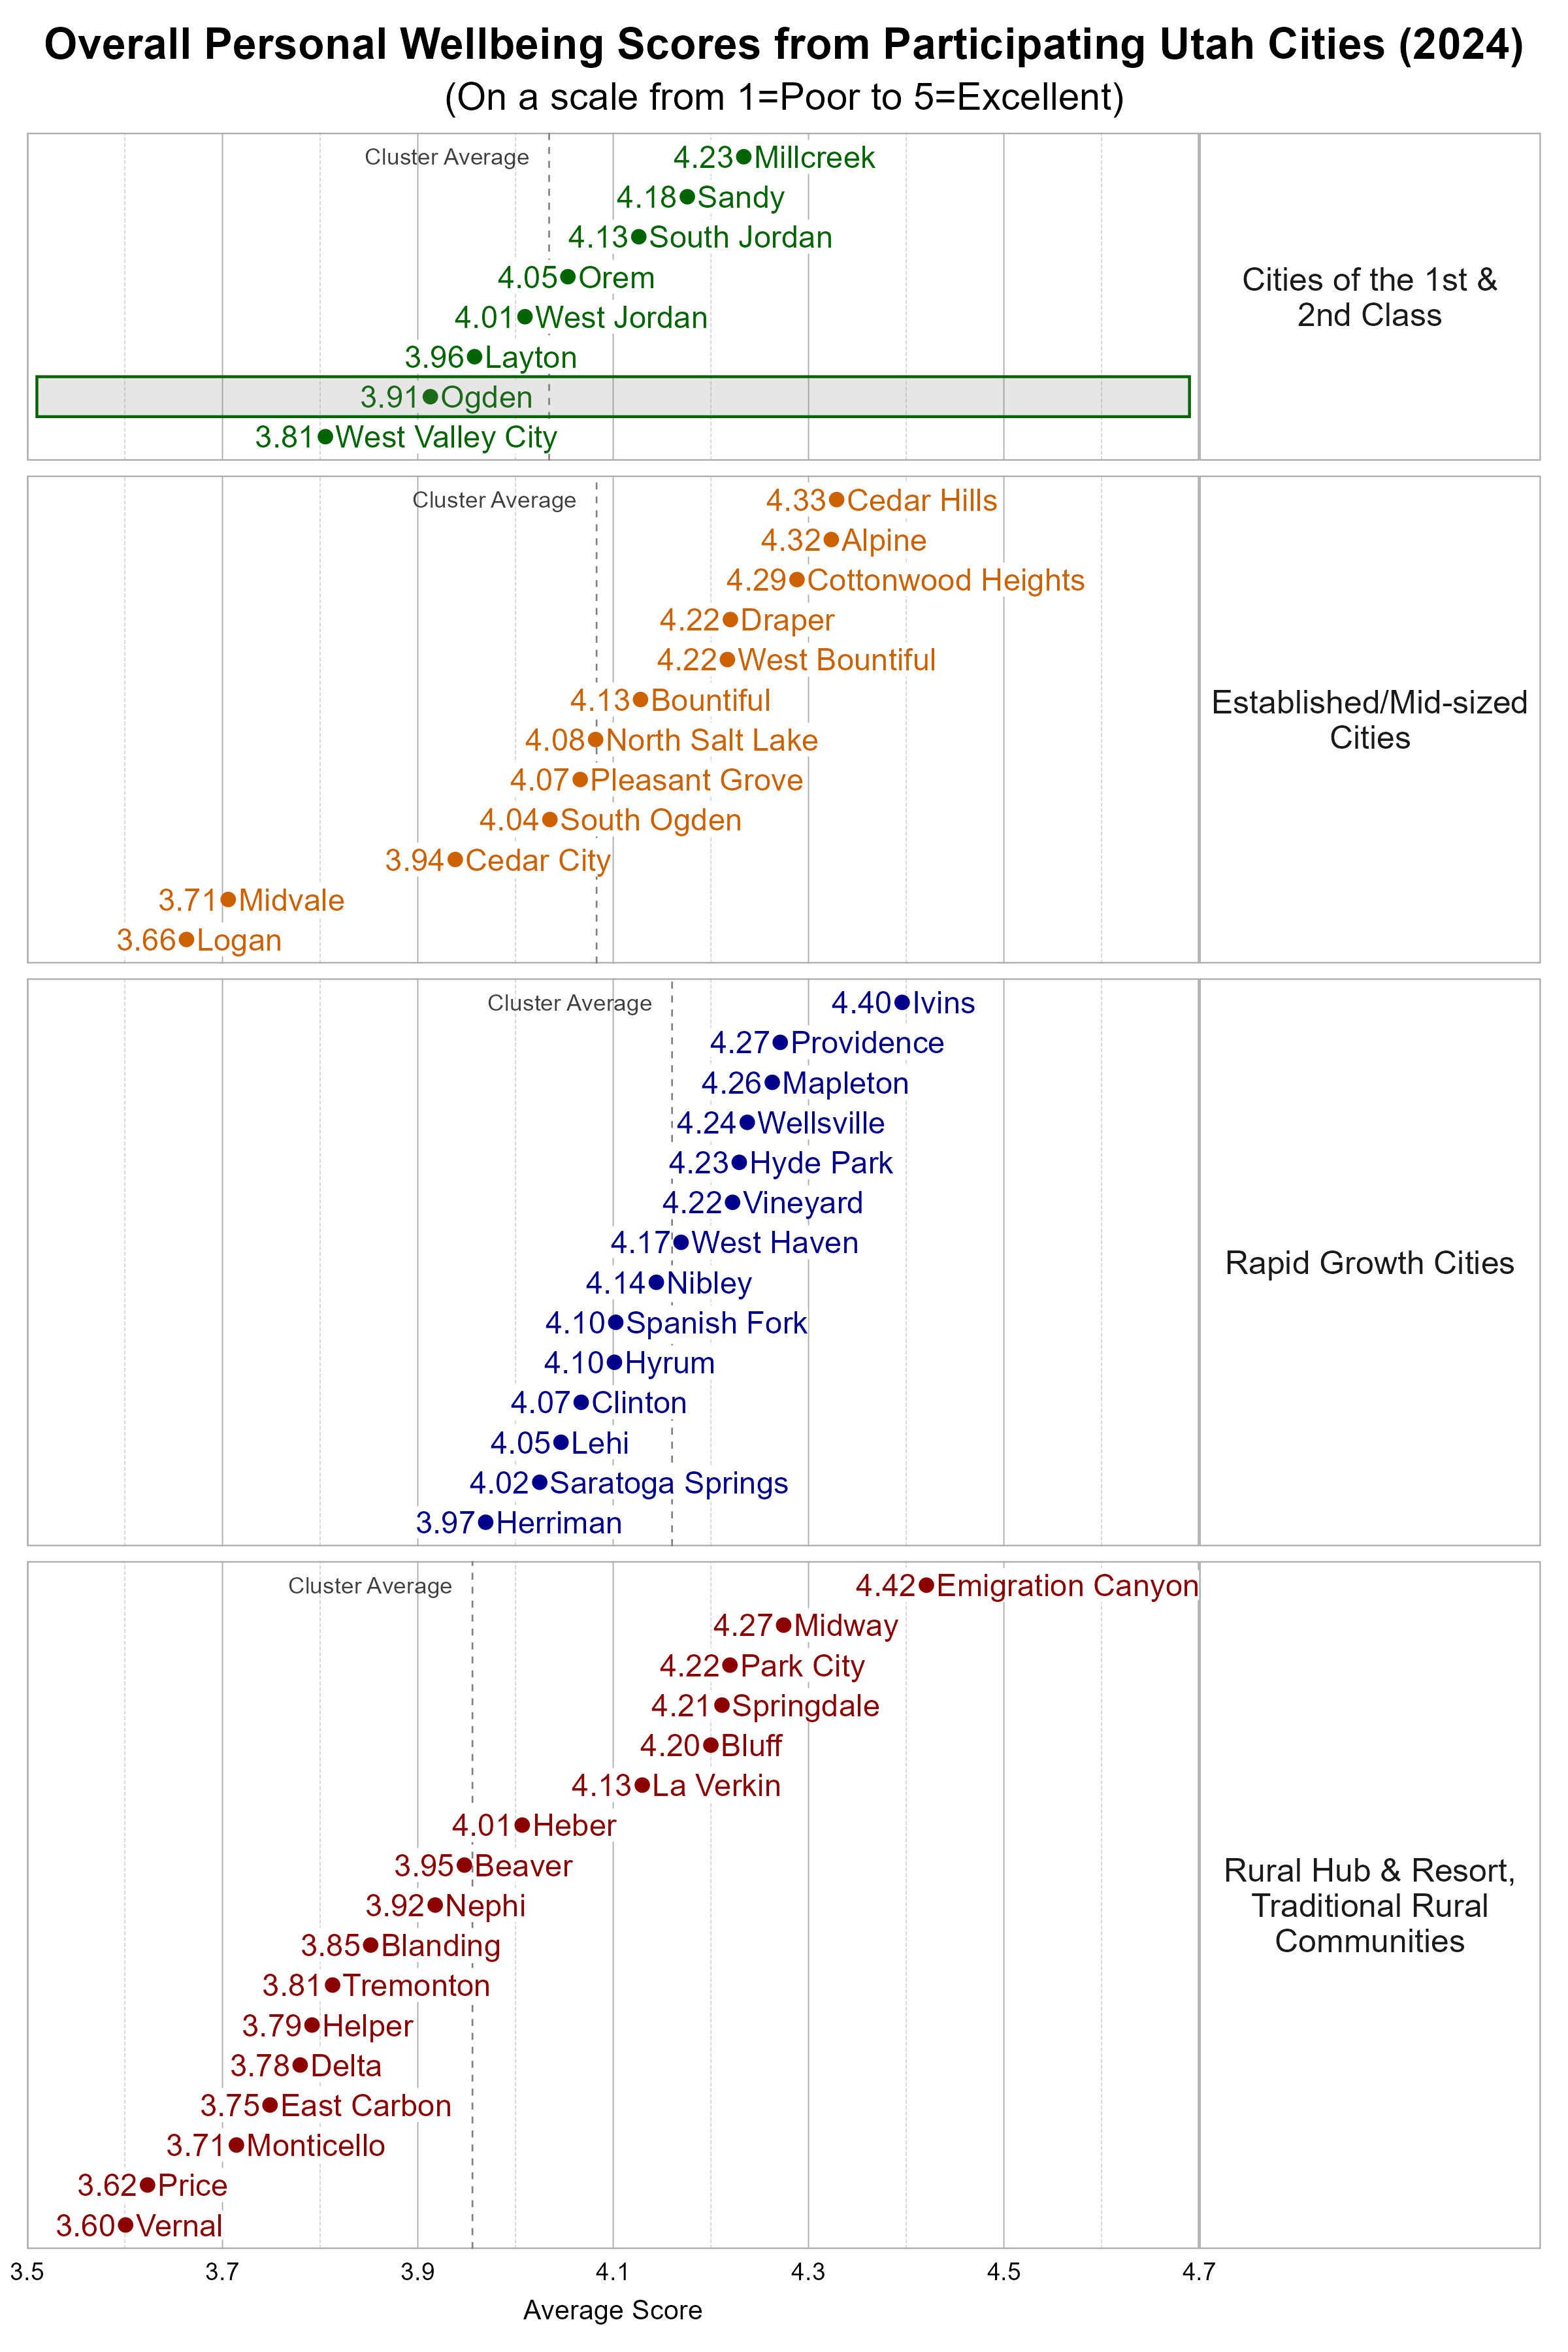
Comparing Wellbeing Across Utah Cities
The Utah League of Cities and Towns clusters cities and towns into five different categories based on size and growth rates. We utilize these clusters in our analysis. Ogden is classified as a City of the 1st and 2nd Class. Some cities may fit within more than one cluster.
Within the more Urban city cluster, Ogden was below the average overall personal wellbeing score and below the average overall community wellbeing score.

Wellbeing Domains in Ogden
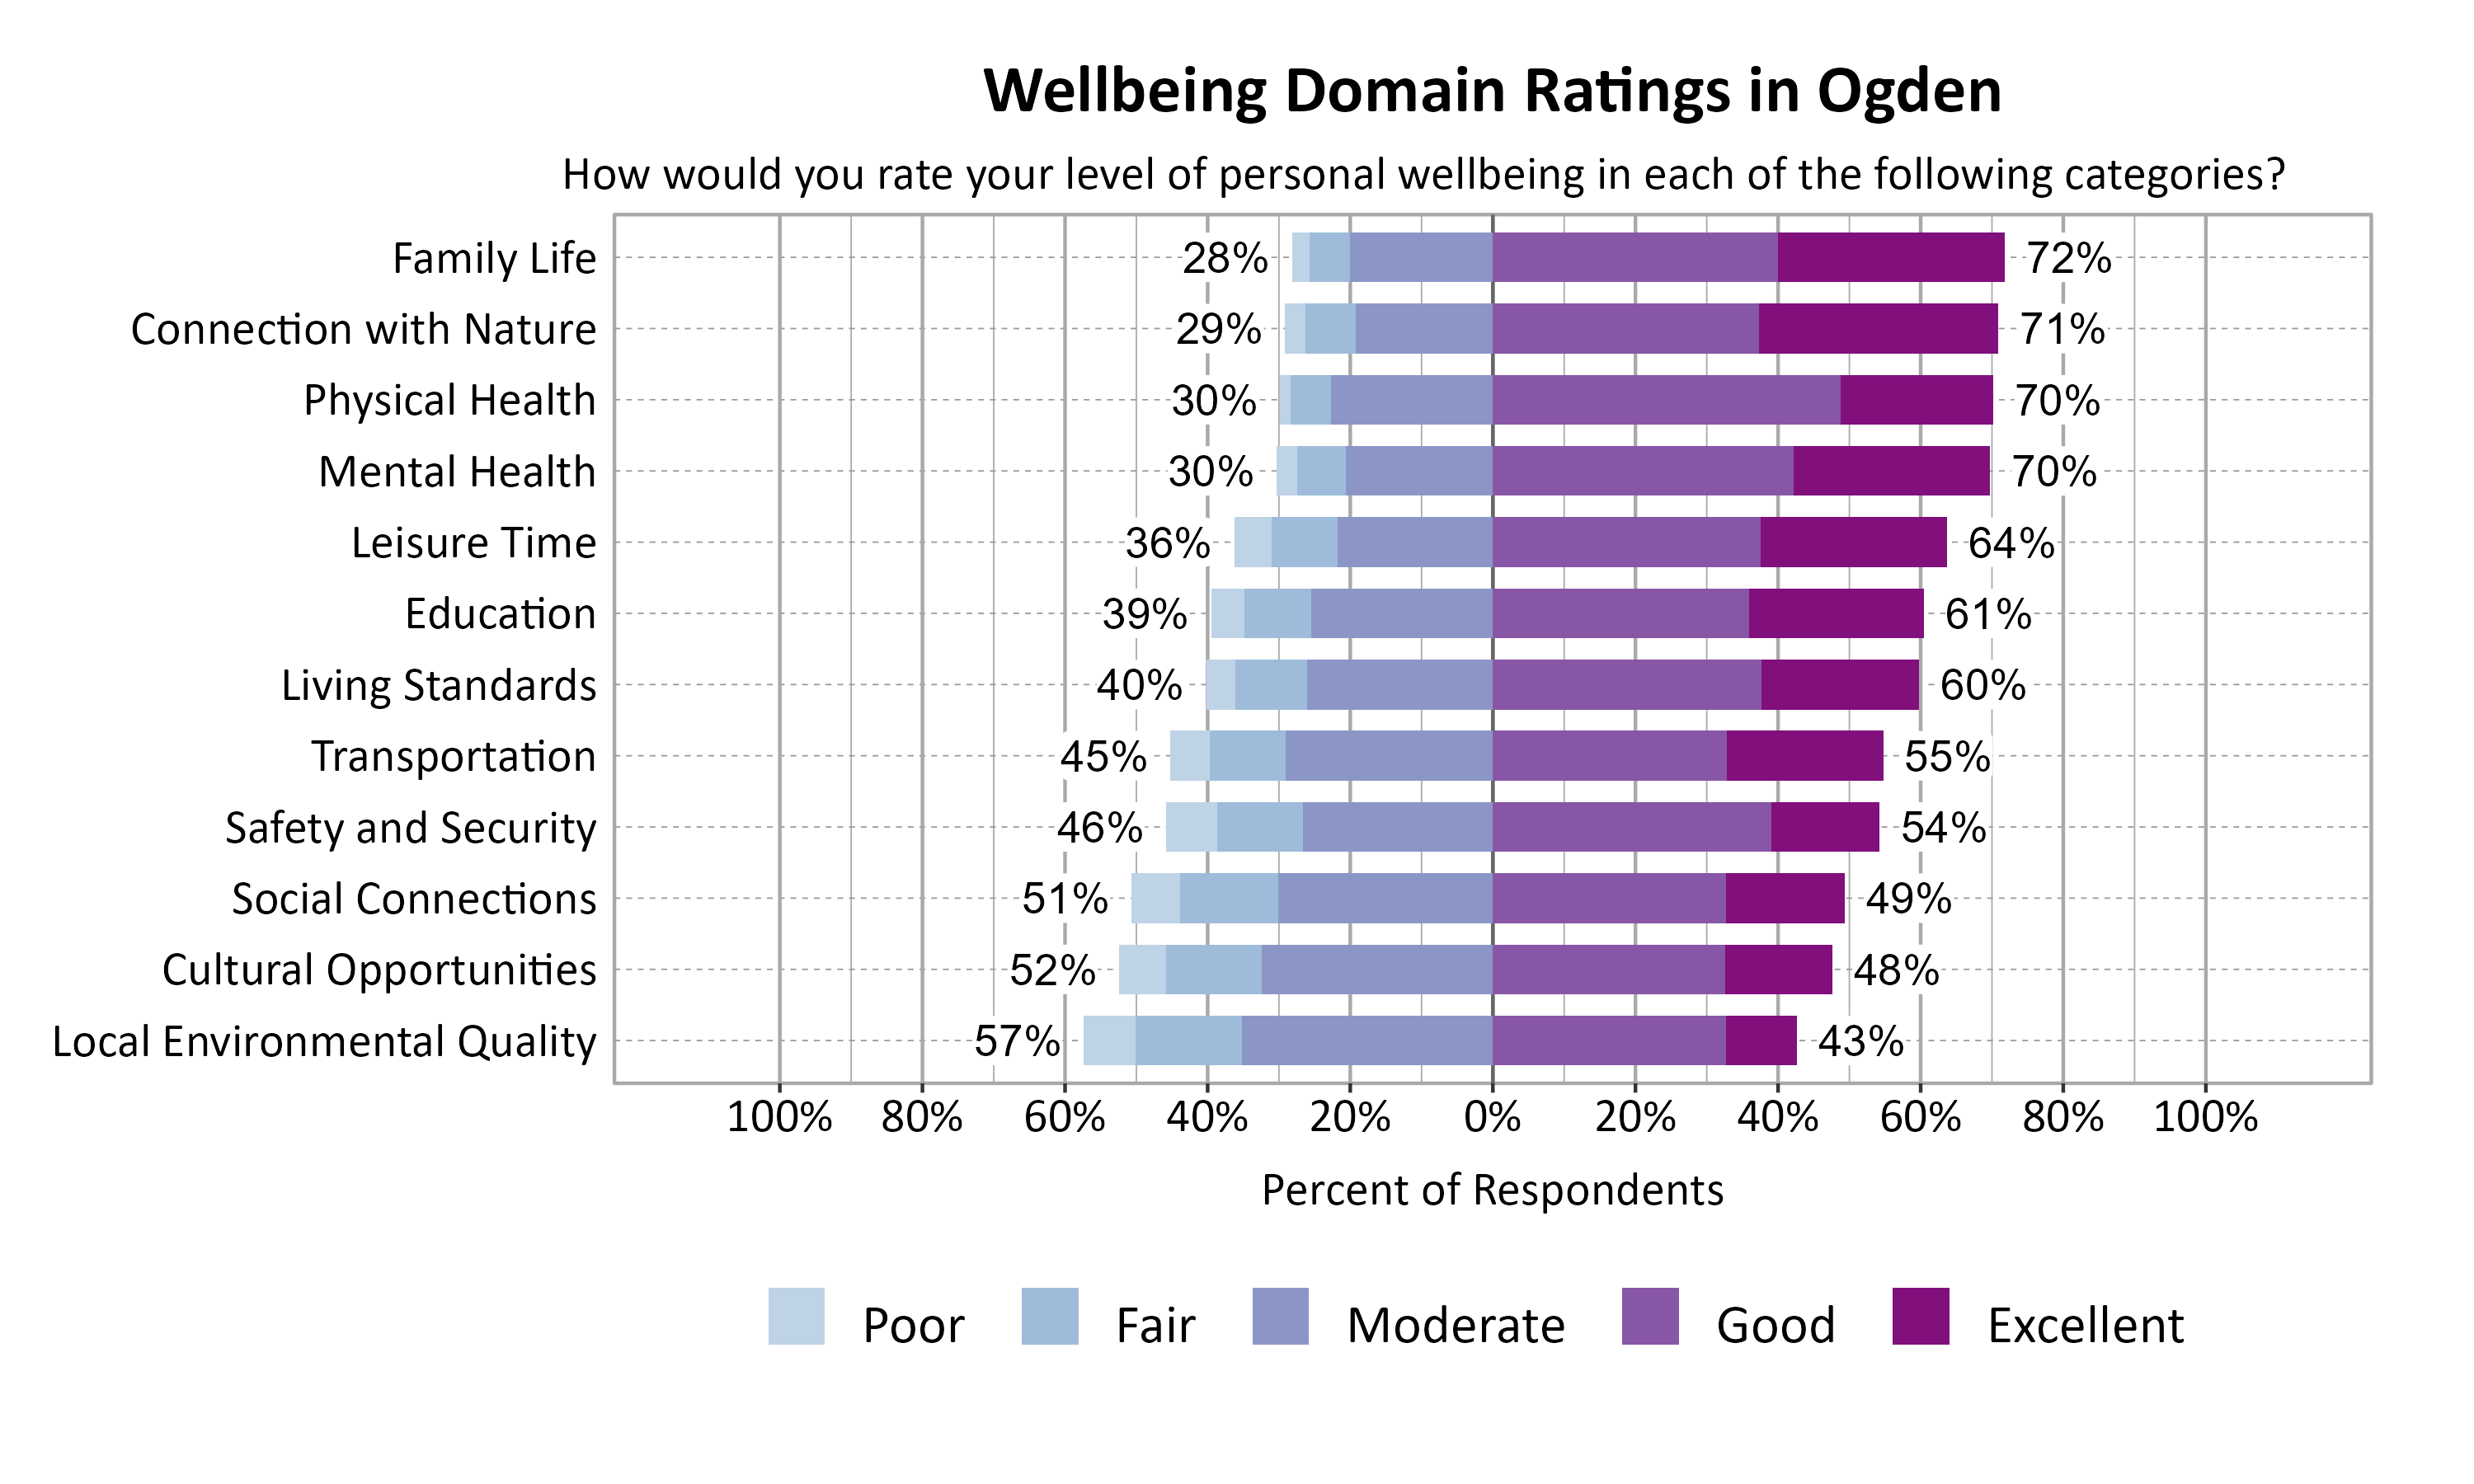
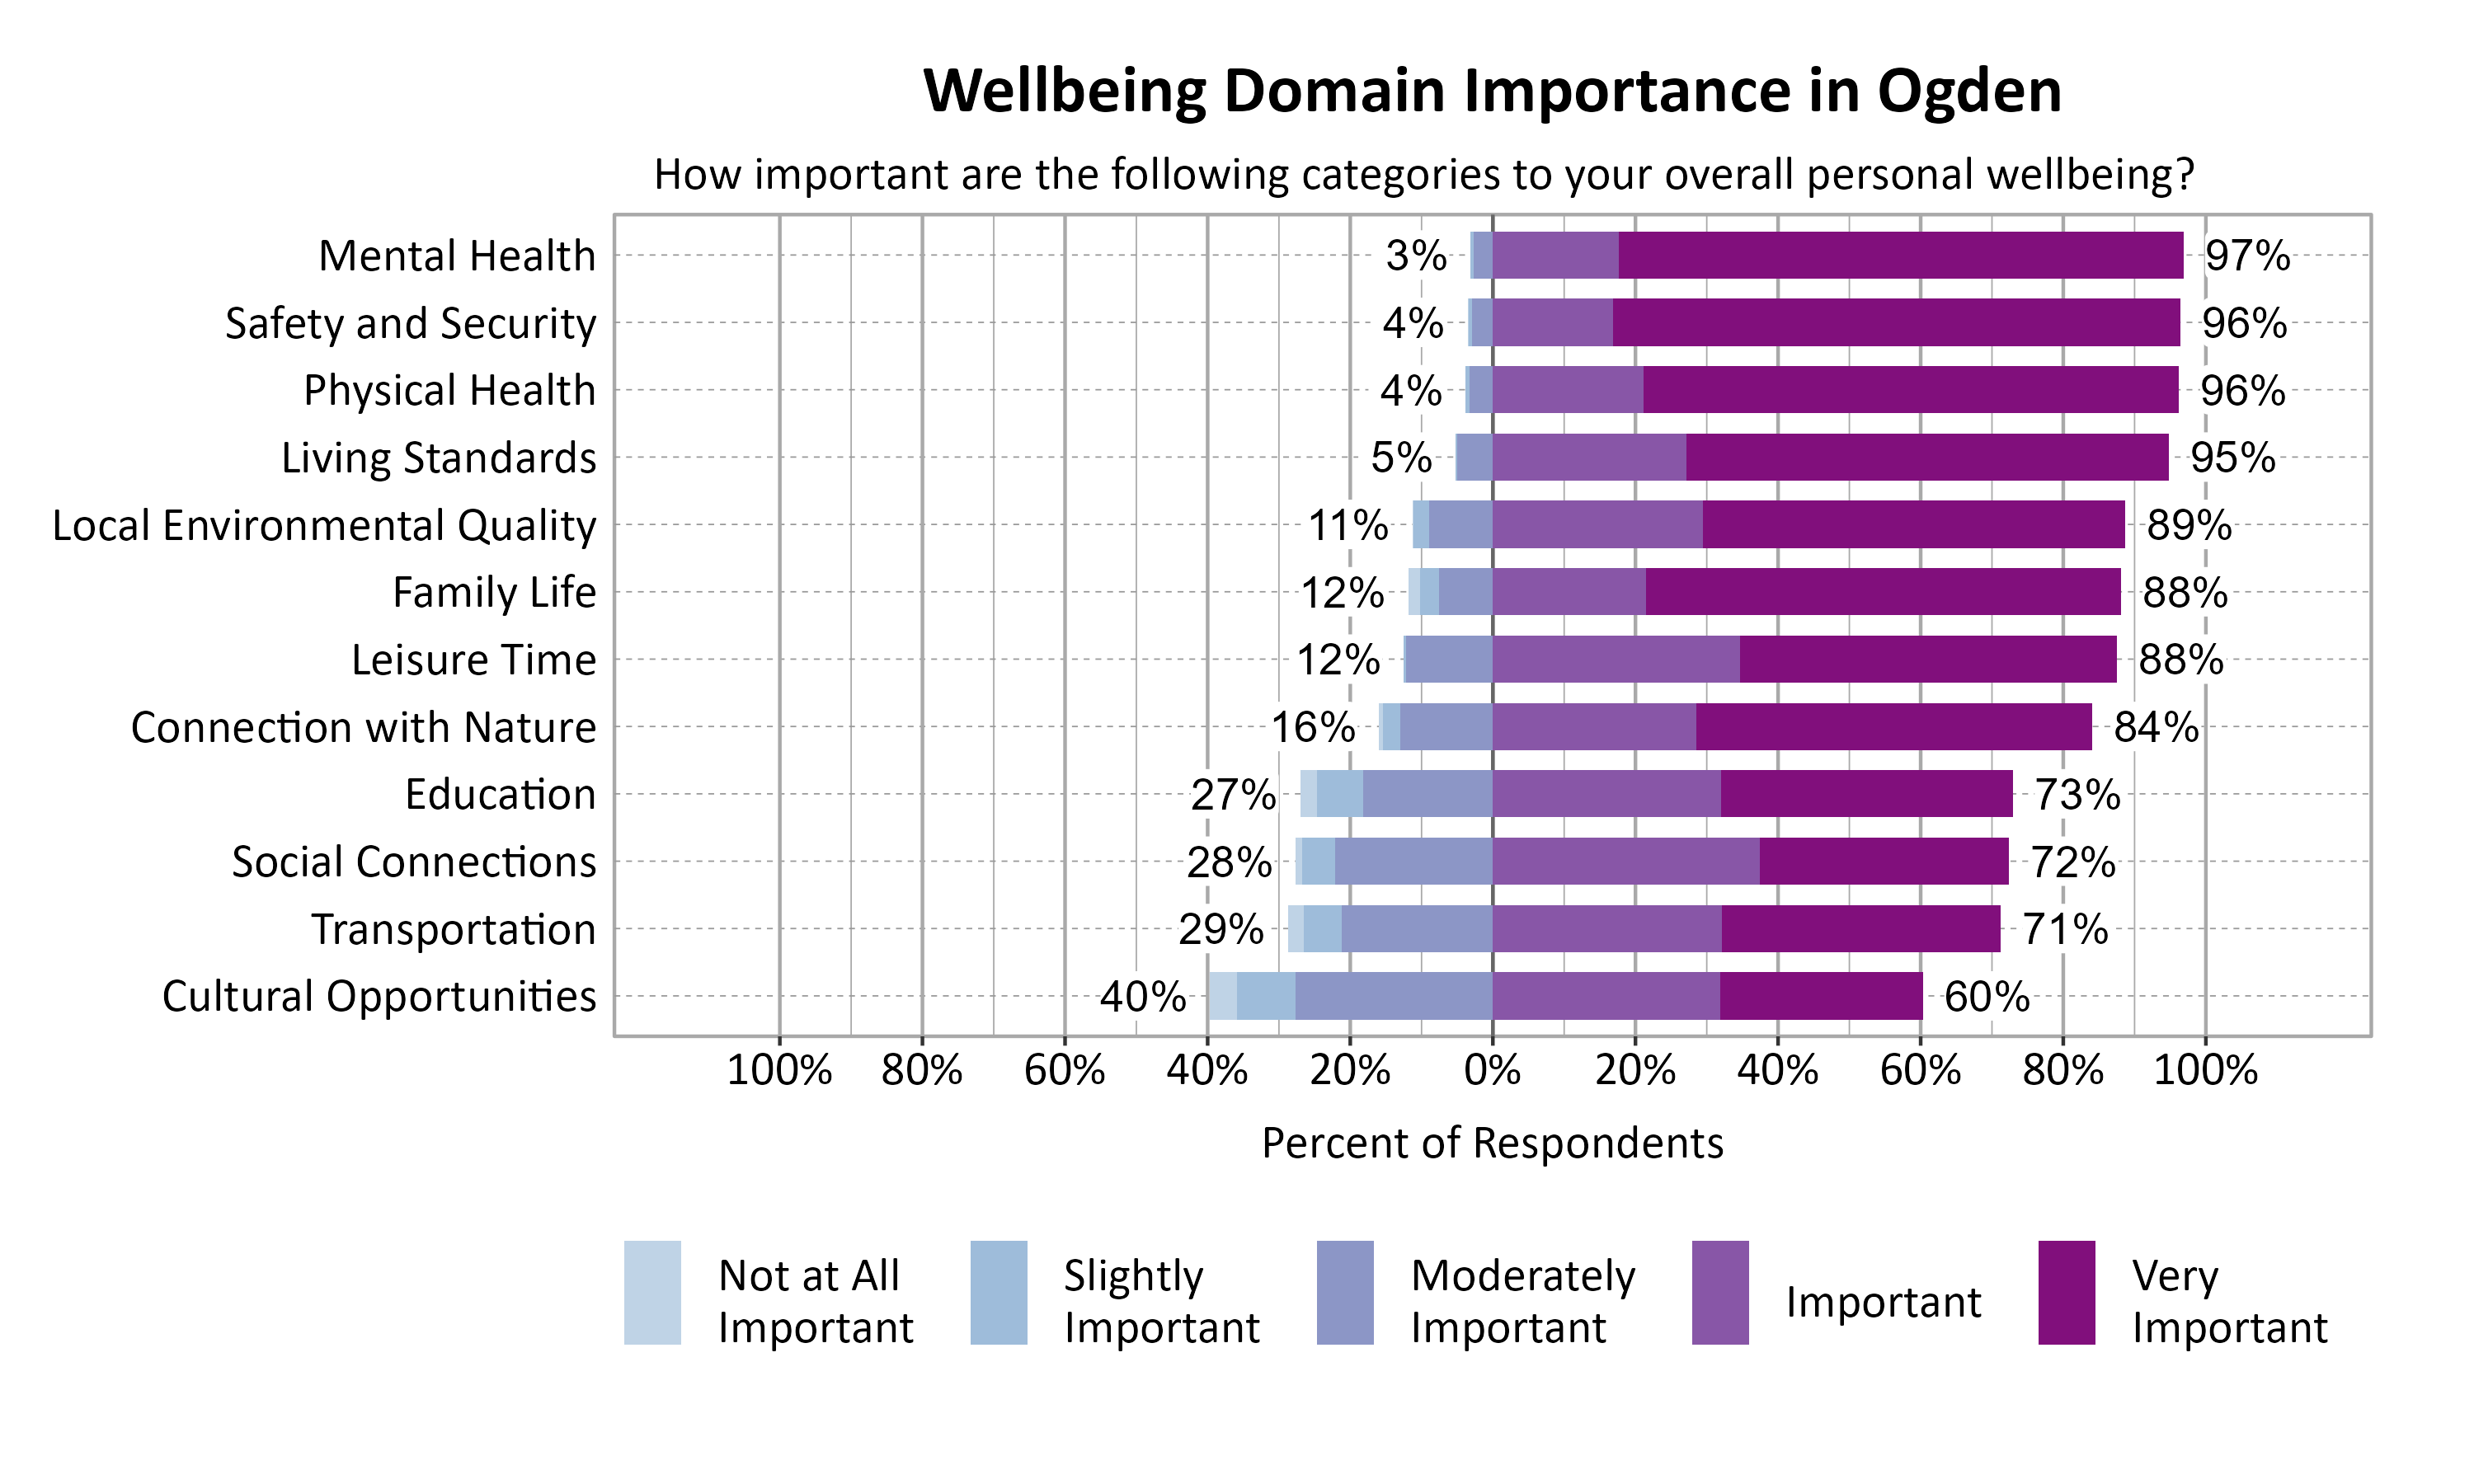
According to national and international entities that track wellbeing, there are a number of common dimensions or domains of wellbeing. Survey respondents rated twelve domains on a 5-point scale from poor to excellent. They were also asked to indicate the importance of each domain to their overall personal wellbeing on a 5-point scale from not at all important to very important. The highest rated wellbeing domains for respondents in Ogden were Family Life (72%), Connection with Nature (71%), Physical Health (70%), and Mental Health (70%). The most important wellbeing domains were Mental Health (97%), Safety and Security (96%), Physical Health (96%), and Living Standards (95%).
Wellbeing Matrix for Ogden
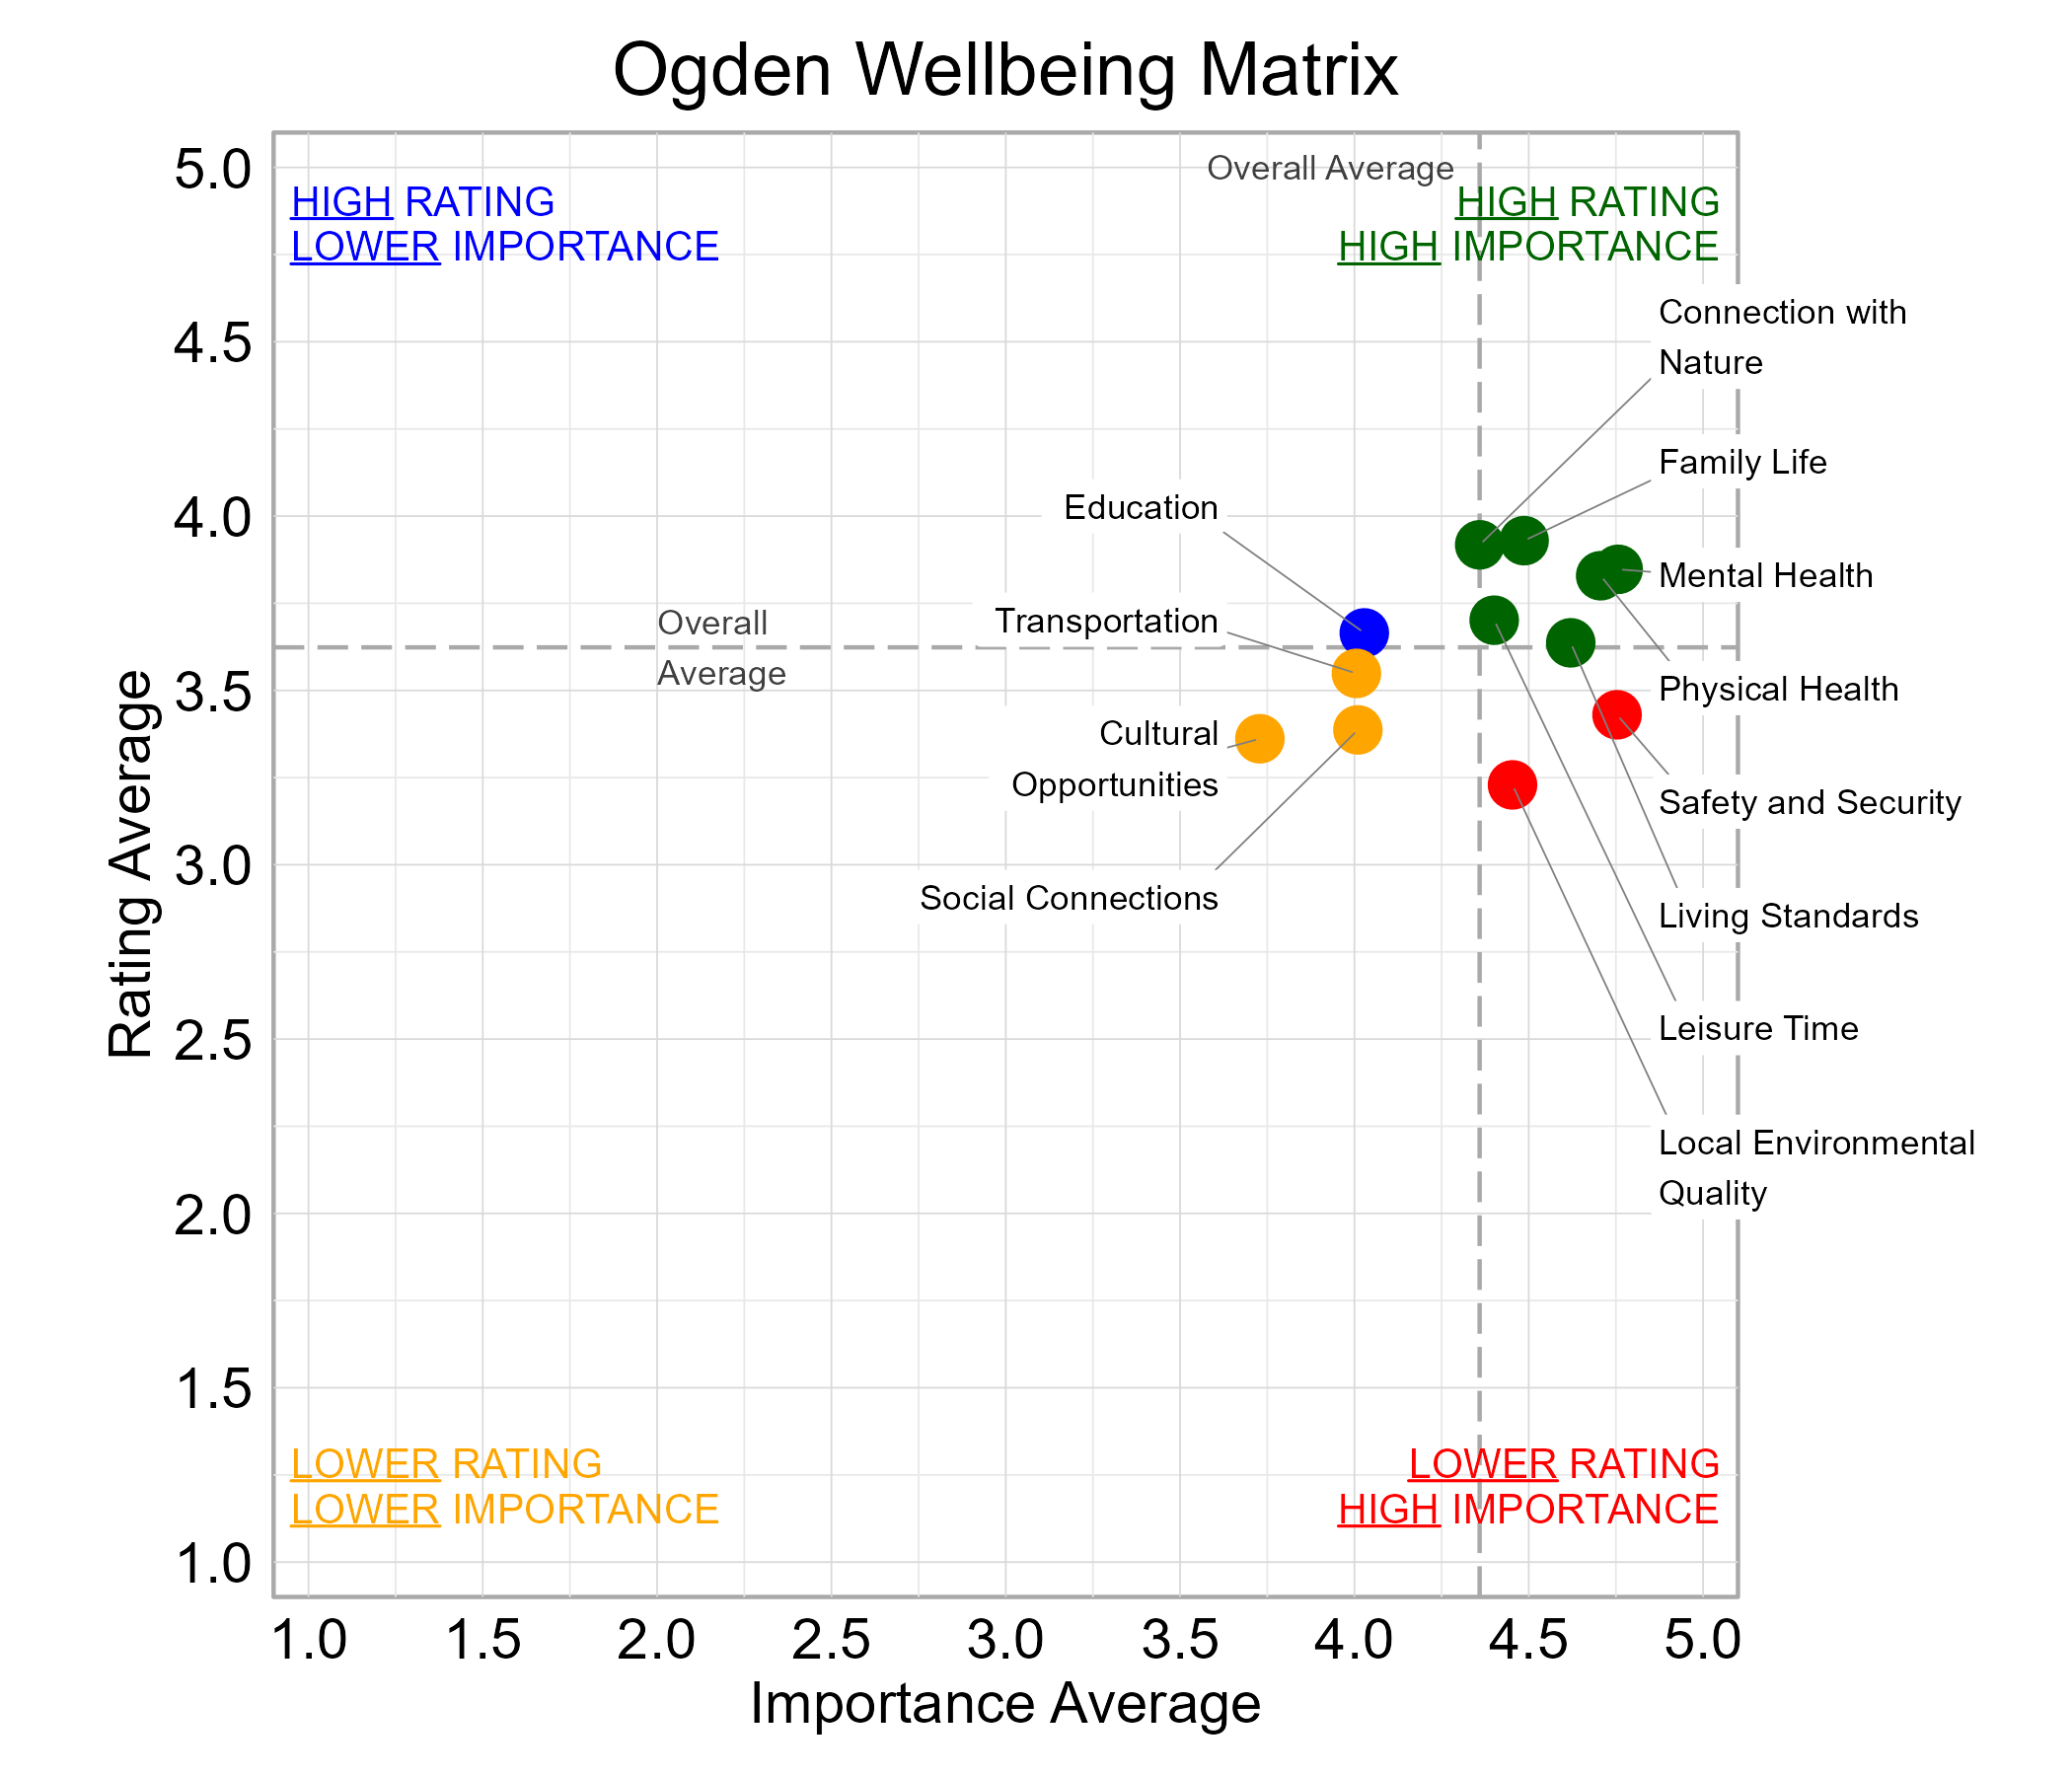
The graph below illustrates the relationship between the average rating and the average importance of wellbeing domains for survey respondents from Ogden. Connection with Nature, Family Life, Leisure Time, Living Standards, Mental Health, and Physical Health were highly important and rated above average among the domains. Local Environmental Quality and Safety and Security fell in the “red zone” of higher importance and lower ratings.
Community Connection in Ogden
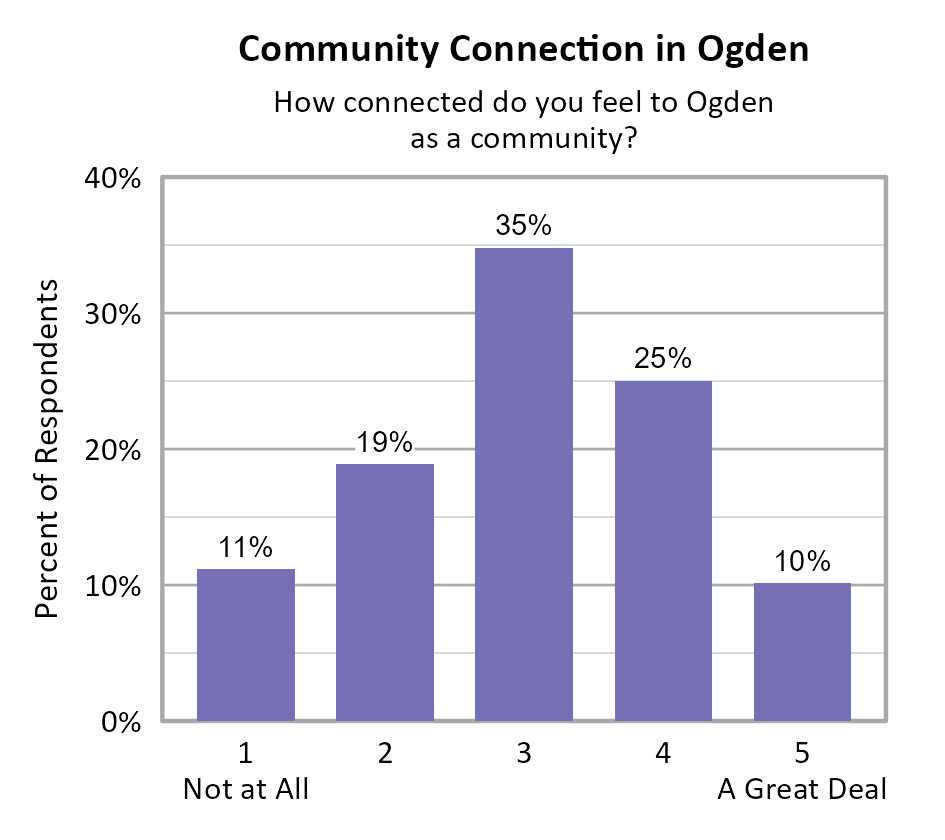
Survey participants were asked about how connected they feel to Ogden on a 5-point scale from not at all (1) to a great deal (5), and the average score of all respondents was 3.04. The 4 Municipal Districts in Ogden had statistically different community connection scores, with District 4 having the highest scores, followed by Districts 3, 1, and then 2.
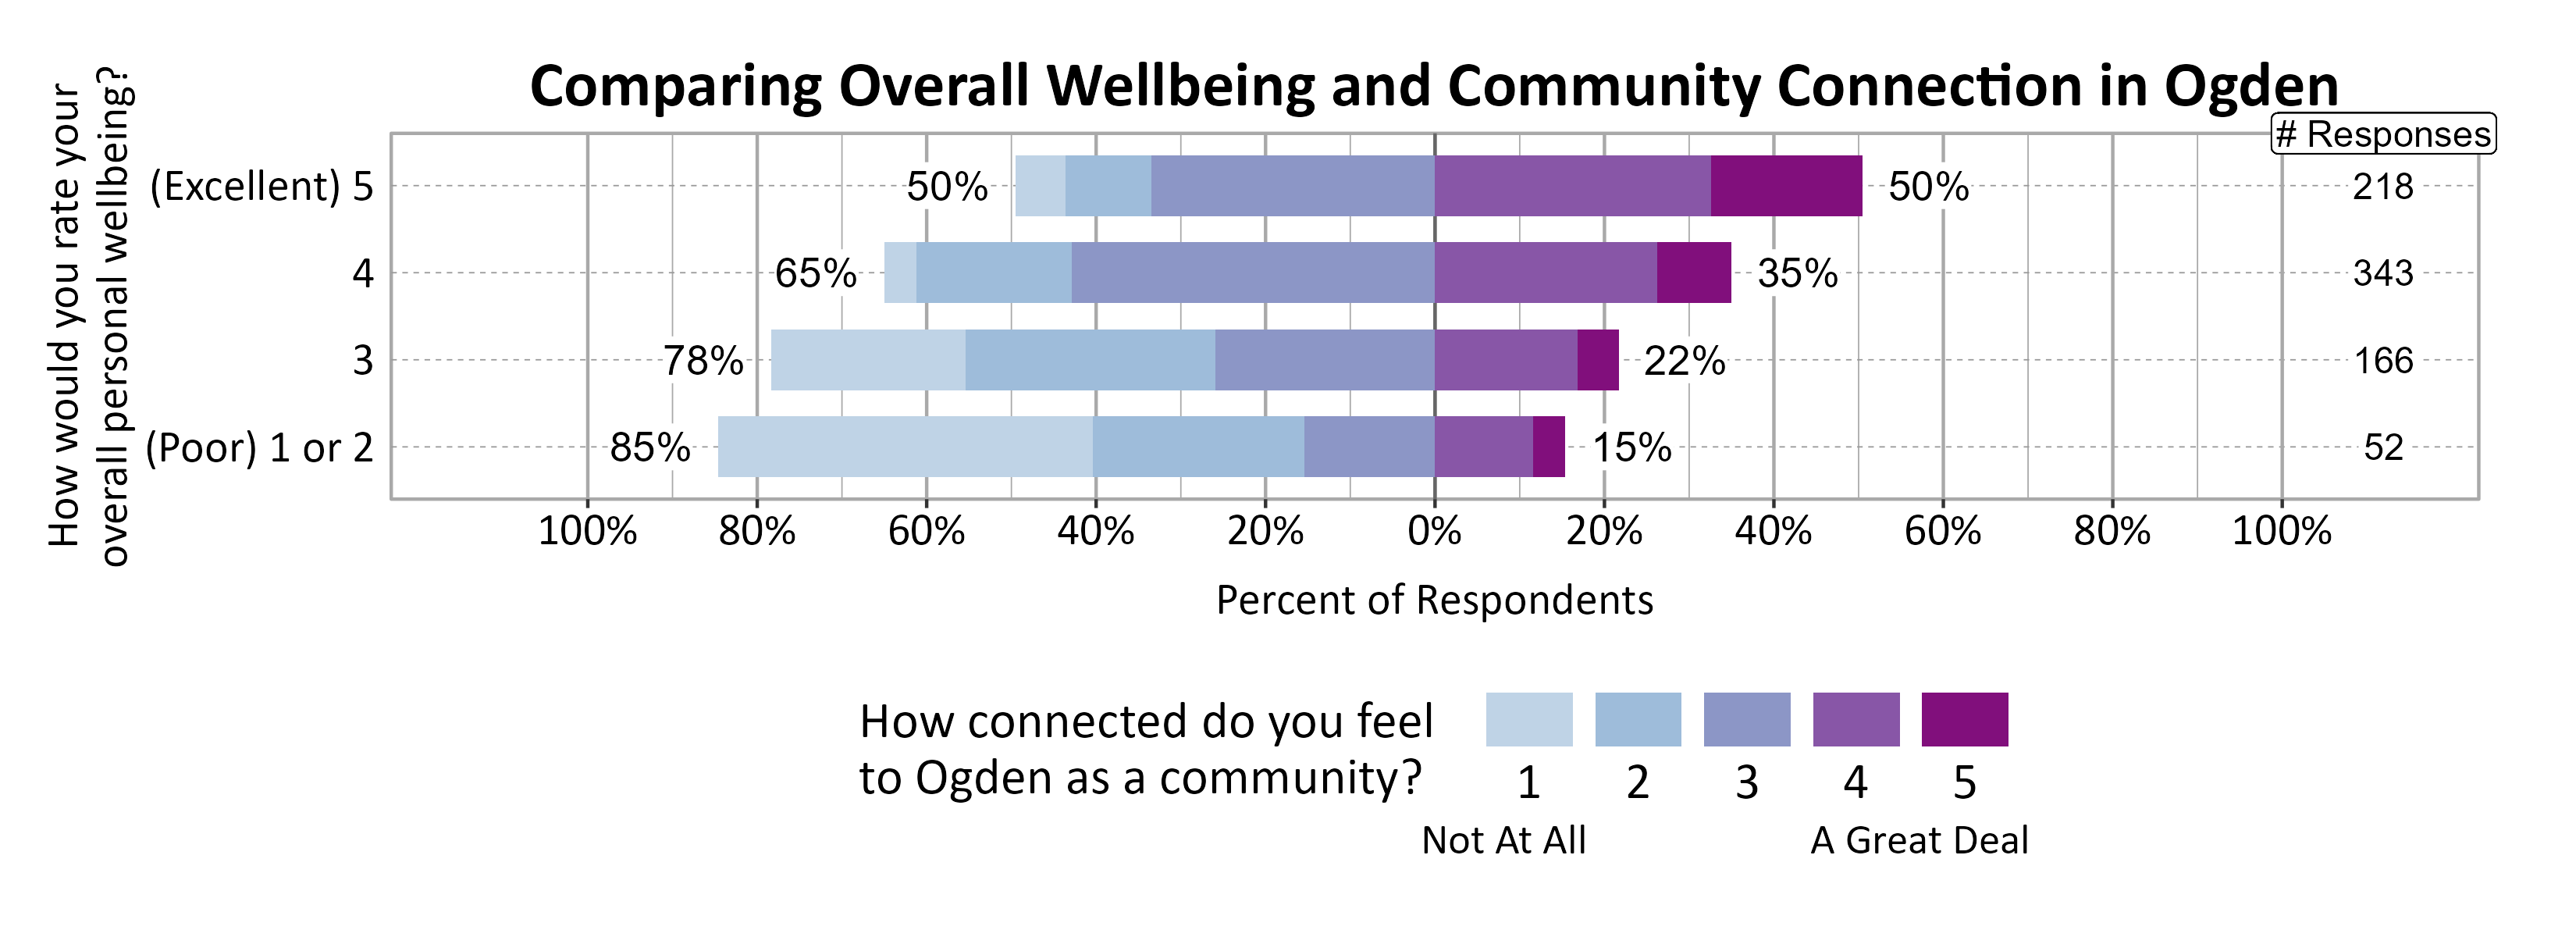
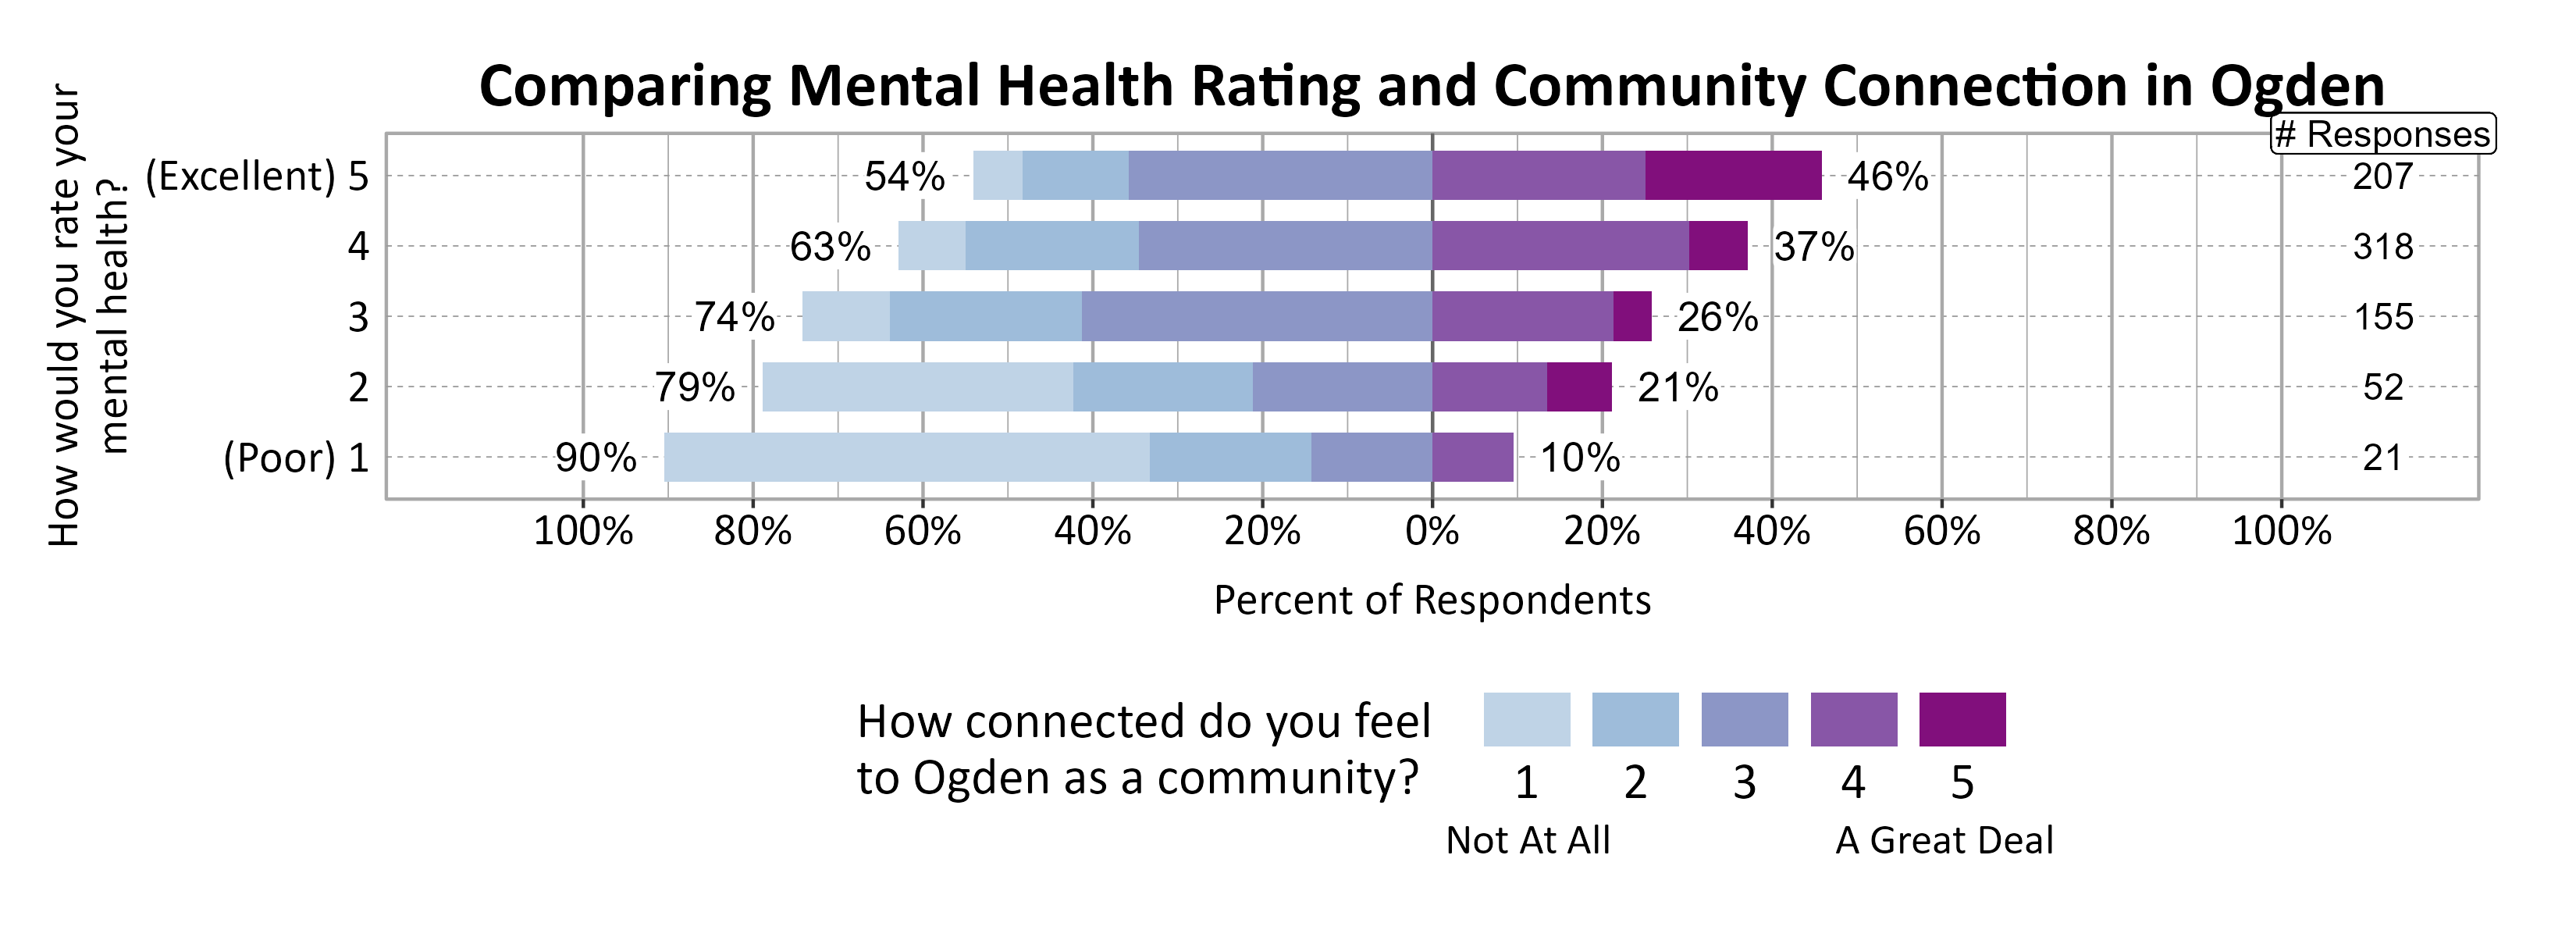
A positive relationship was found between individuals’ community connection and overall personal wellbeing as well as mental health.
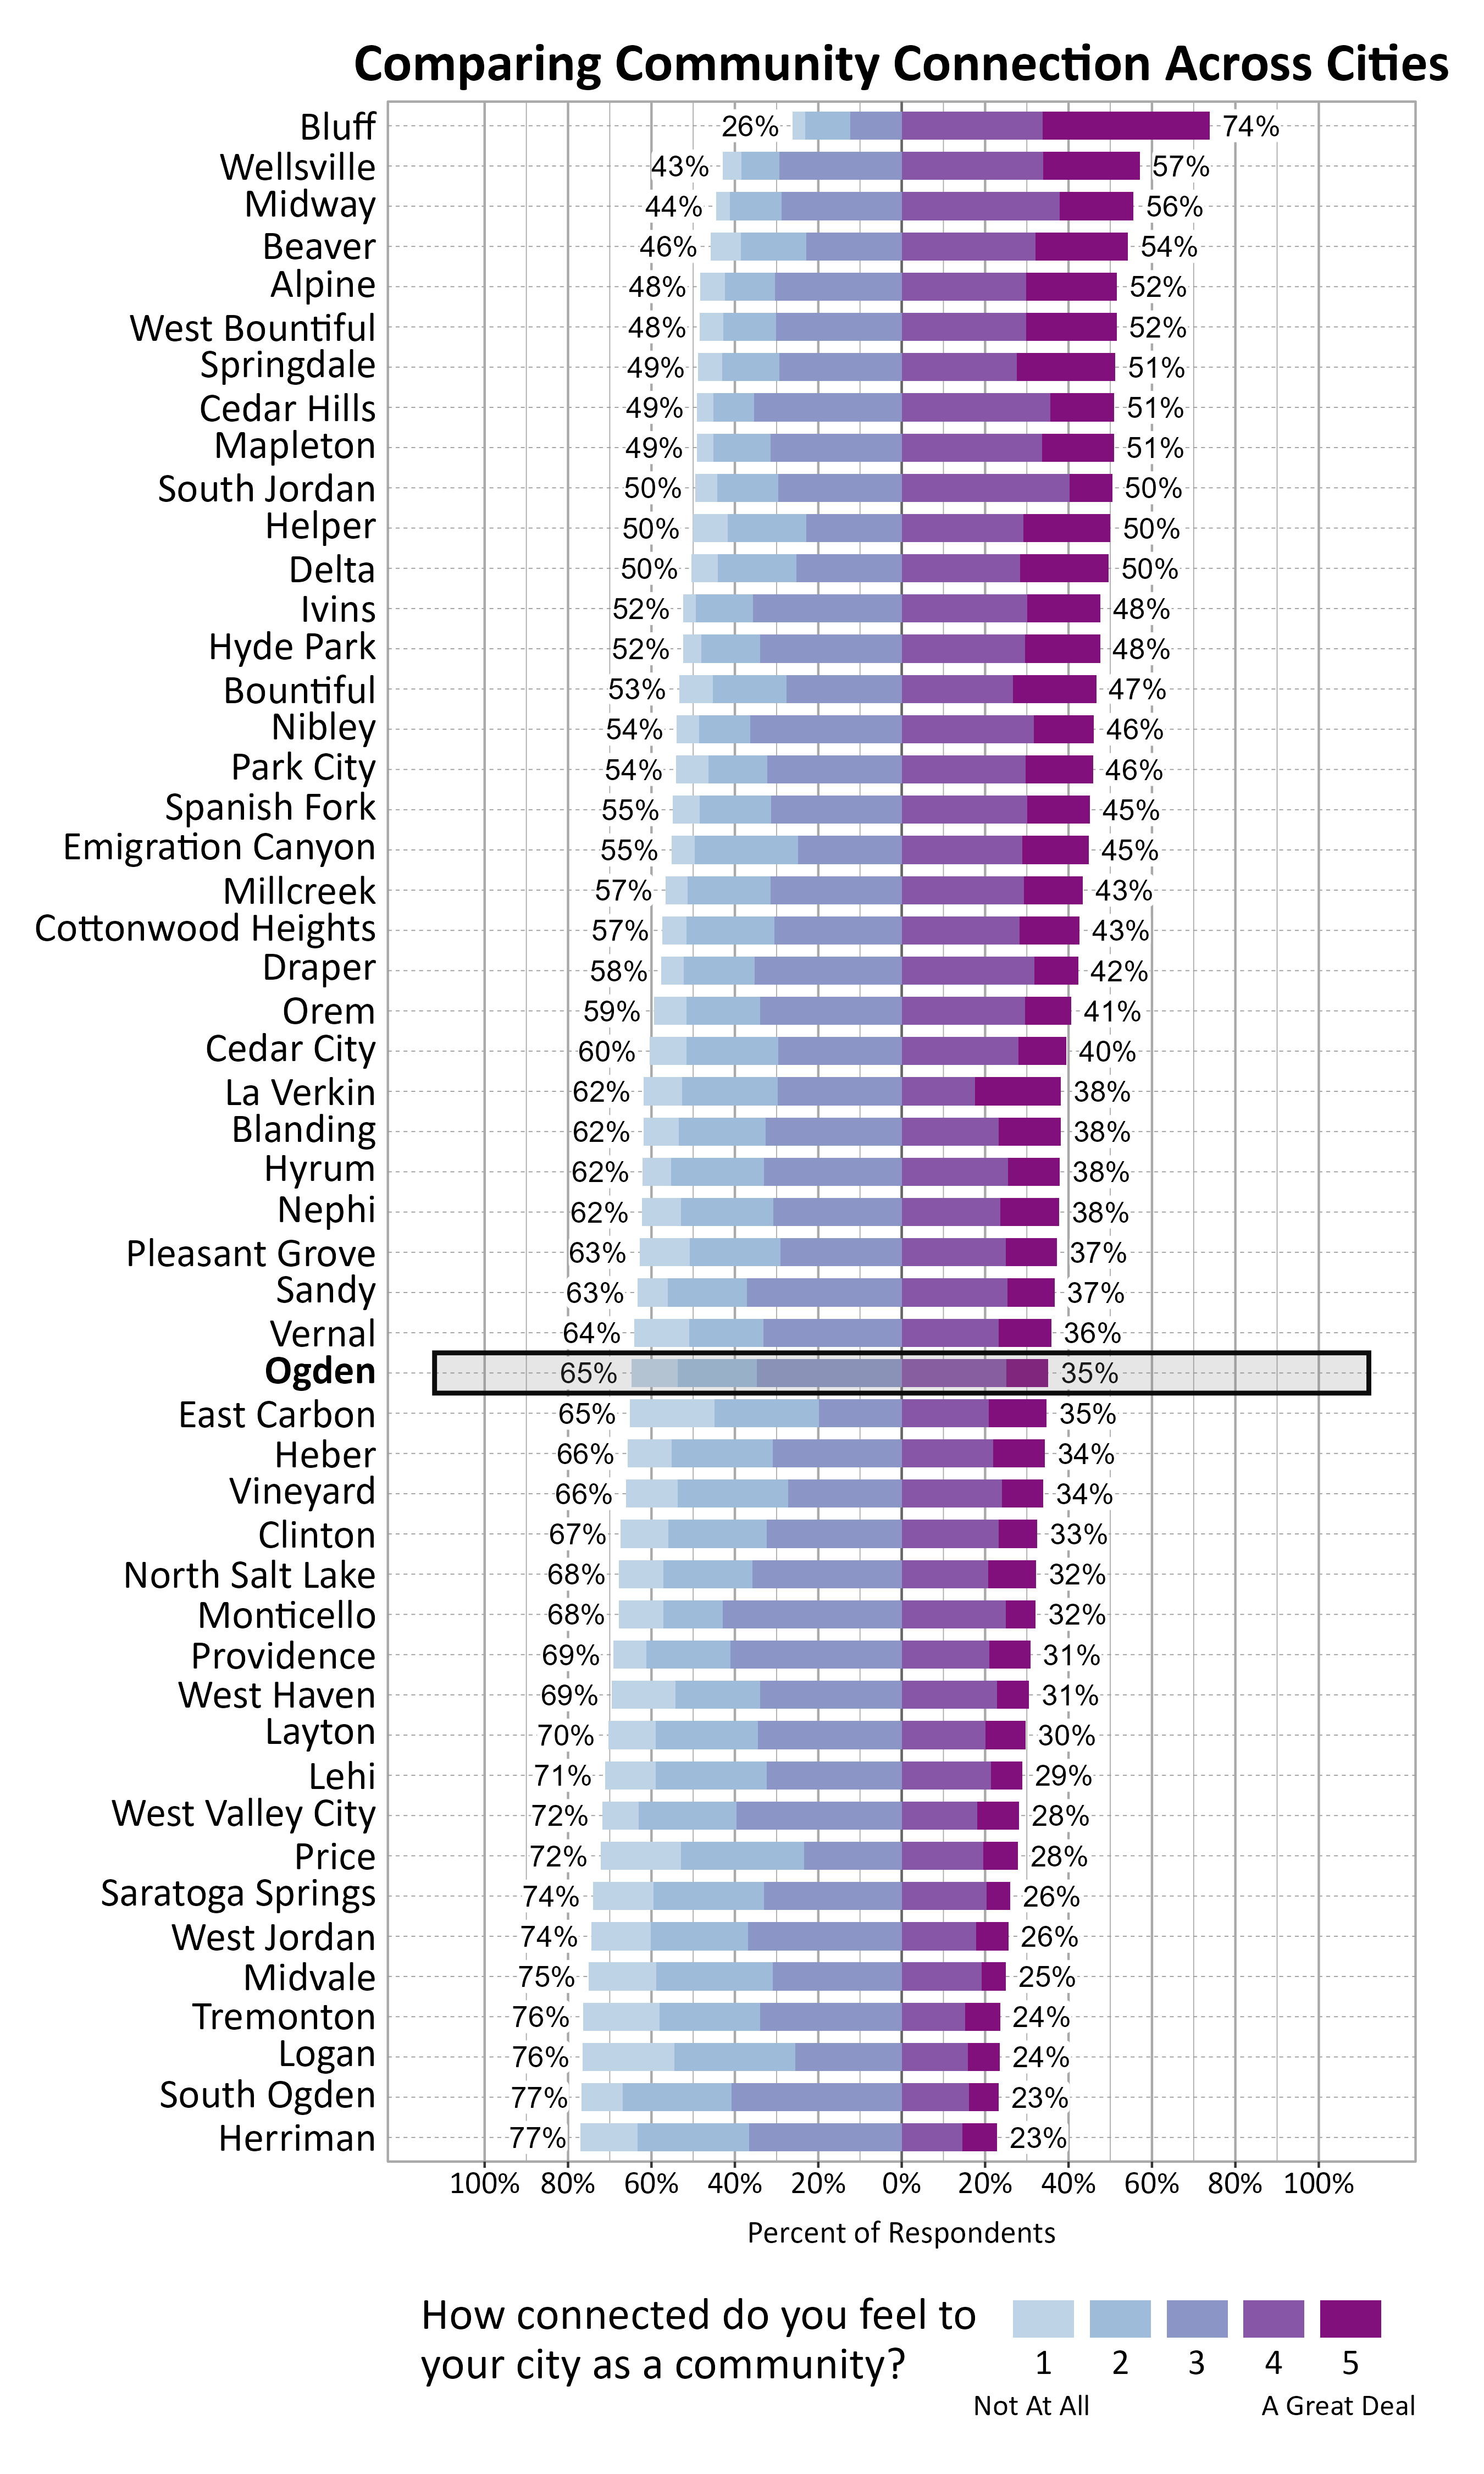
The graph below shows how Wellbeing Project cities and towns compare on feelings of community connection based on the percentage of respondents who answered 4 or a 5 on a 5-point scale from “not at all” to “a great deal” connected to their city or town. Ogden ranked 32 out of the 51 cities that participated.
Participation in Recreation and Nature-Related Activities
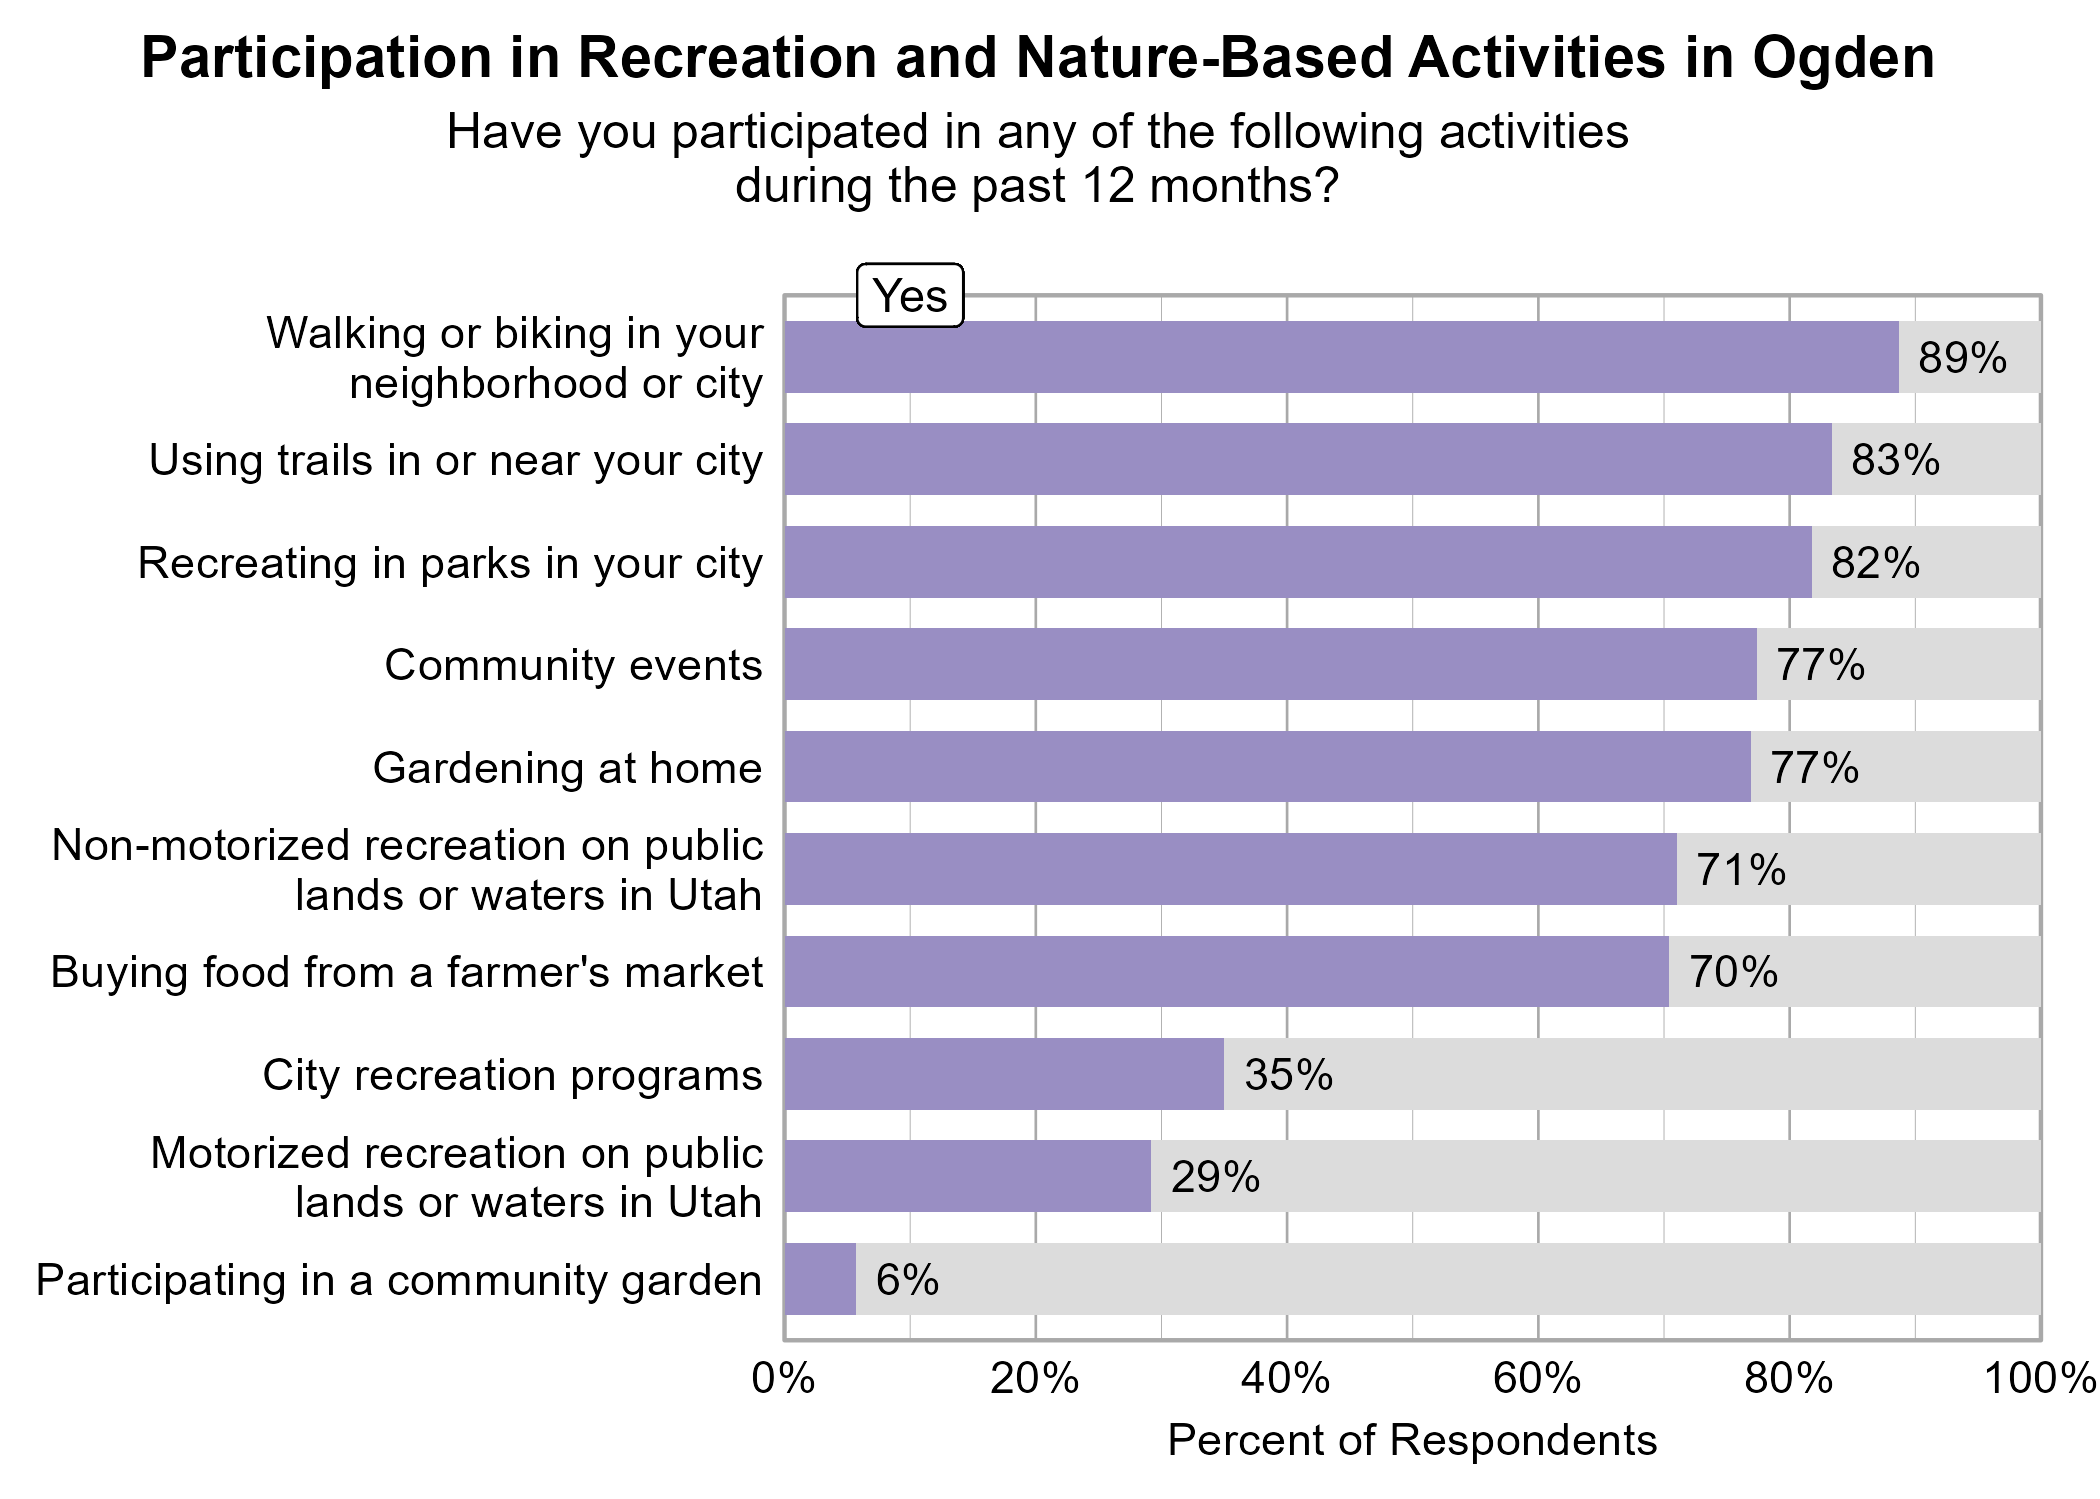
Respondents were asked to indicate whether or not they participated in various activities in the last 12 months. The most popular activities were walking or biking in your neighborhood or city (89%), using trails in or near your city (83%), and recreating in parks in your city (82%).
All of the recreation activities above, except for participating in a community garden, motorized recreation on public lands or waters in Utah, and participating in city recreation programs were significantly related to higher ratings of personal wellbeing.
Buying food from a farmer’s market, participating in city recreation programs, participating in community events, recreating in parks in your city, and walking or biking in your neighborhood or city were significantly related to higher ratings of community wellbeing.
All of the recreation activities above, except for participating in a community garden and motorized and non-motorized recreation on public lands or waters in Utah were significantly related to higher ratings of community connection.
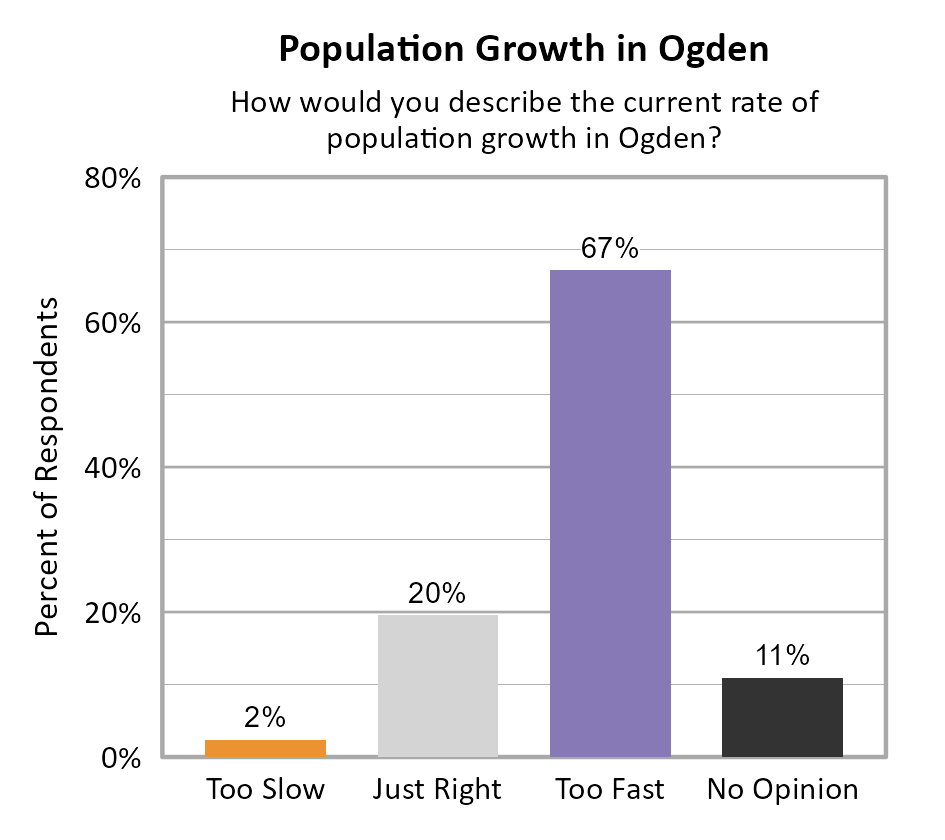
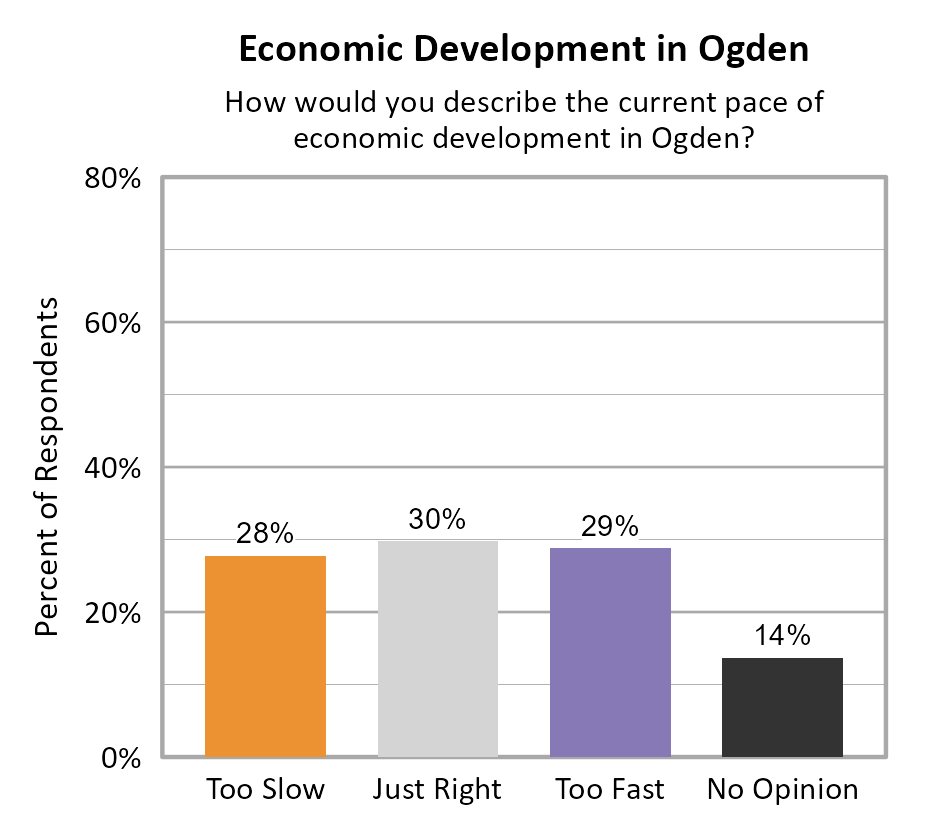
Perspectives on Population Growth and Economic Development
The majority of respondents in Ogden indicated that they felt the population growth was too fast (67%). For the pace of economic development, respondents were split between opinions that it was just right (30%), too fast (29%), and too slow (28%).
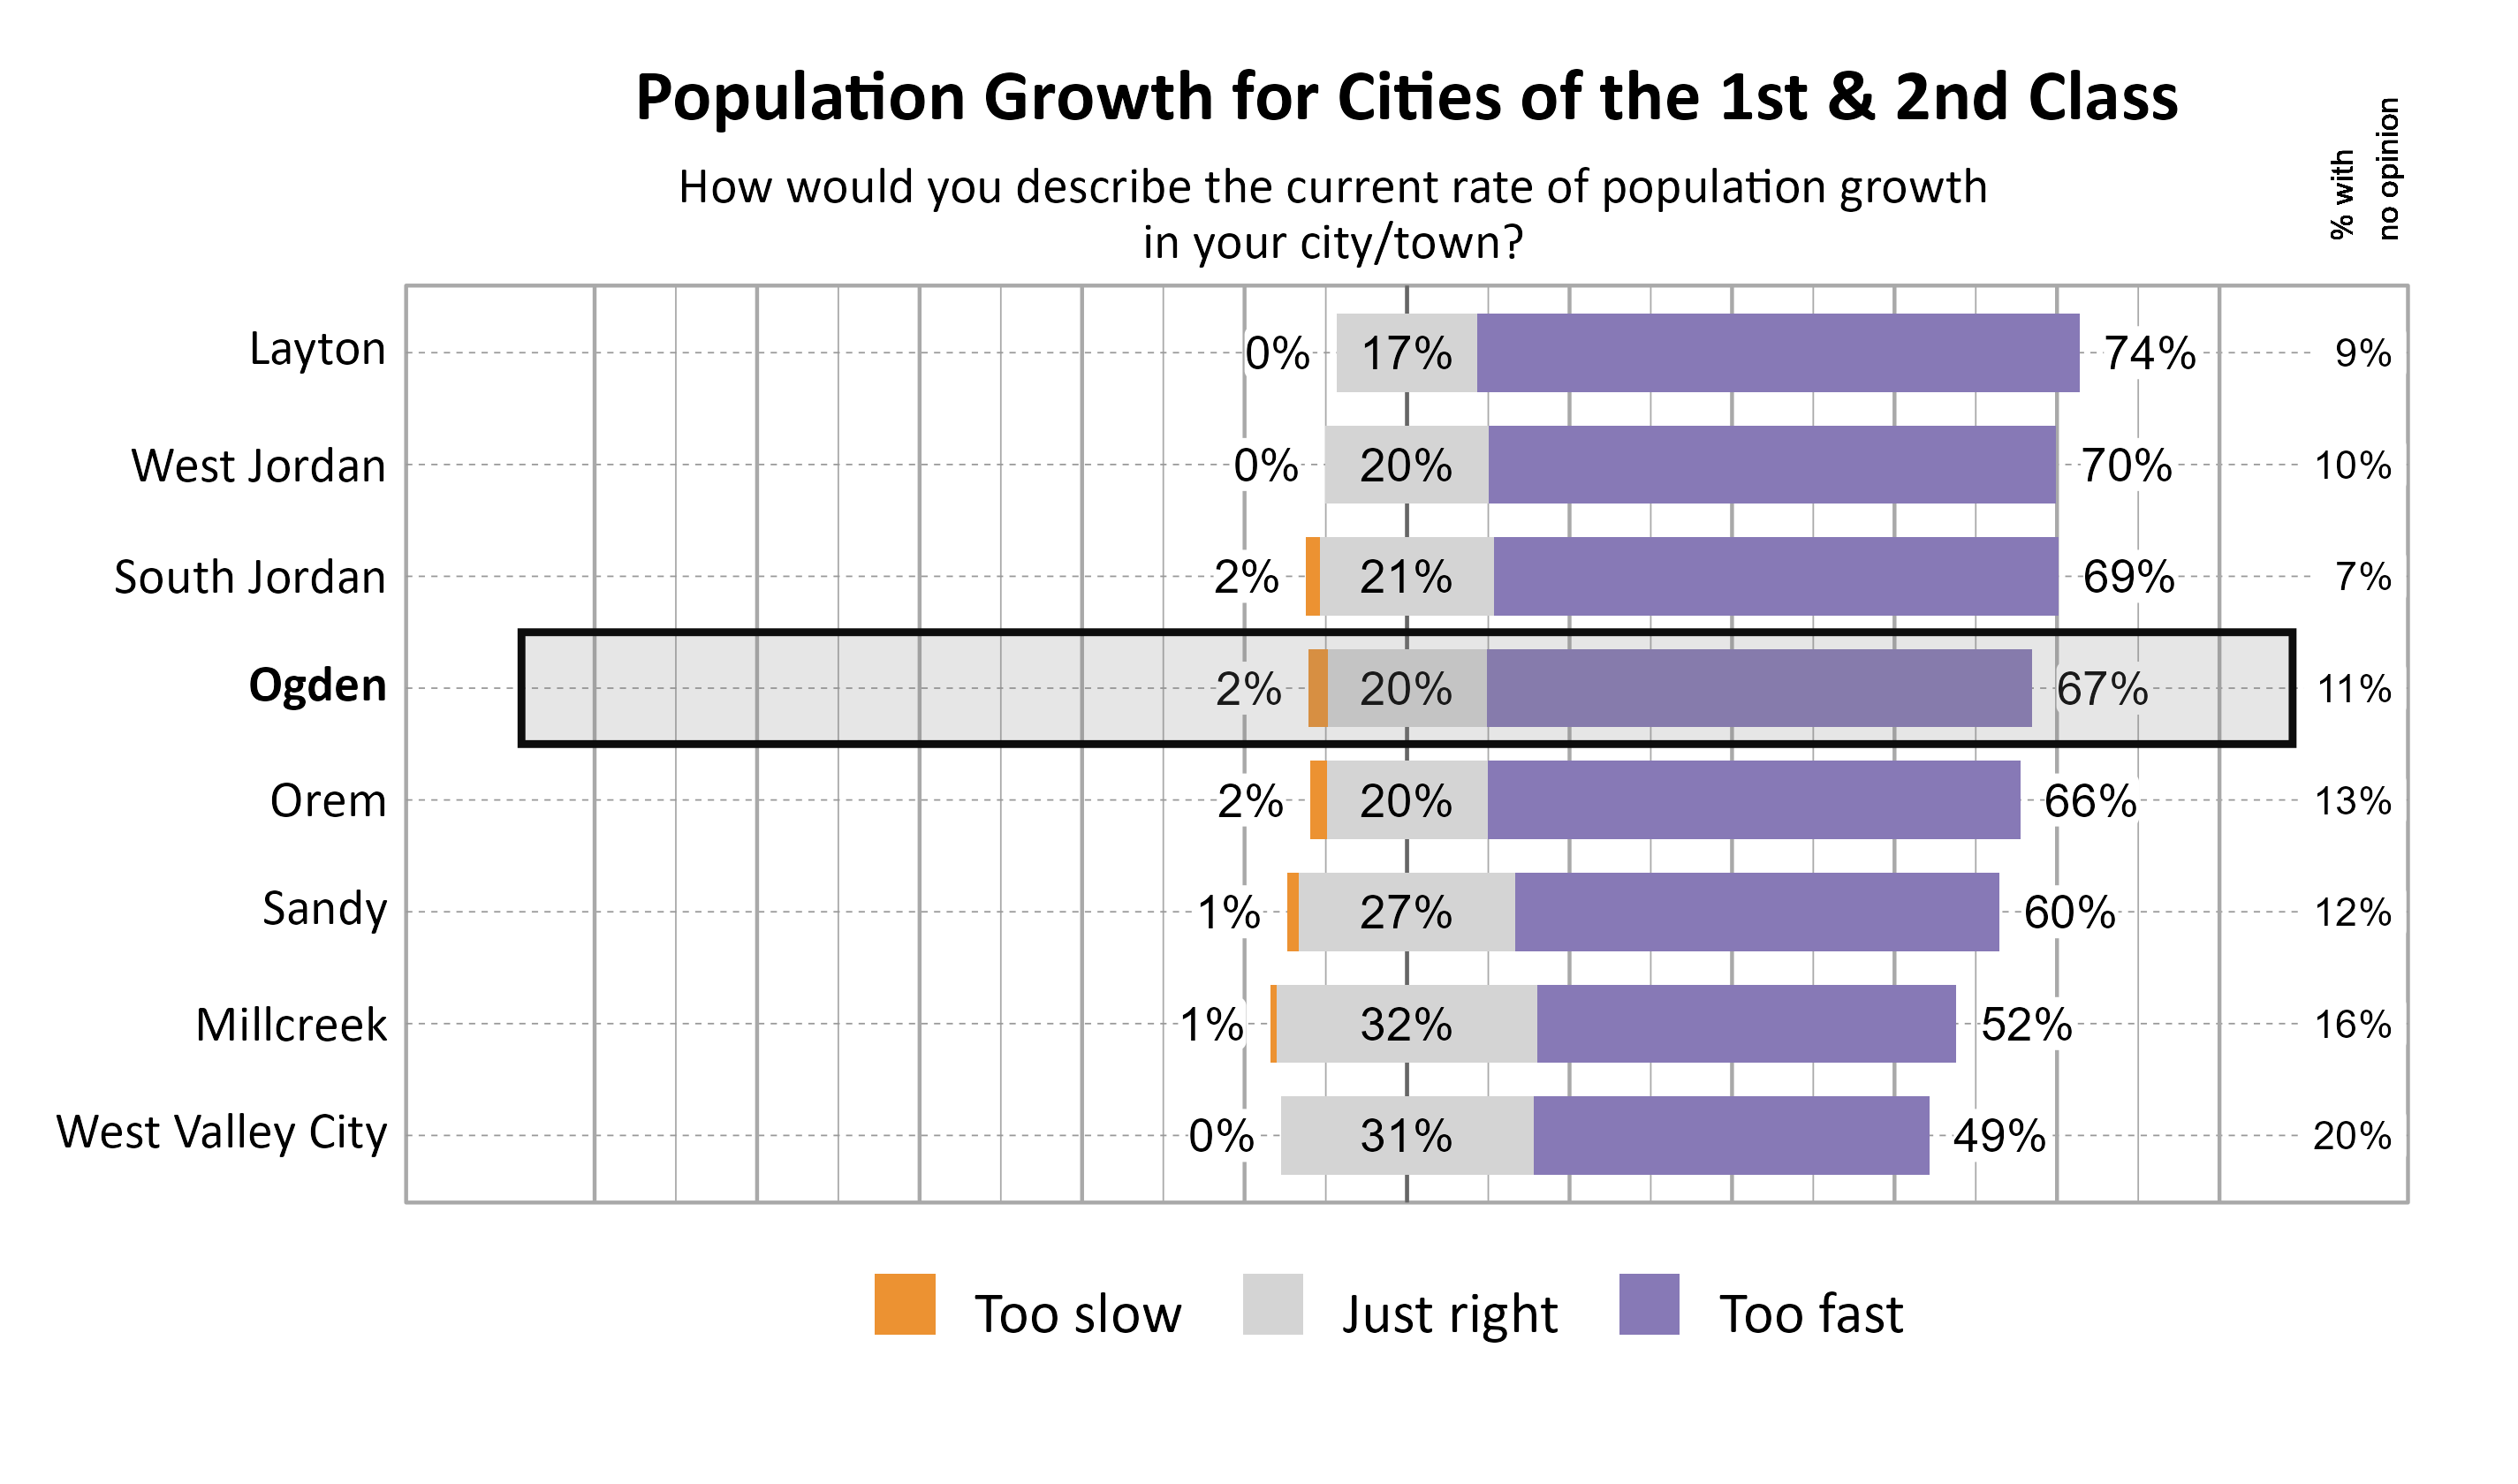
The graphs below show perceptions of population growth and economic development for Ogden compared to other participating cities and towns in the Cities of the 1st & 2nd Class cluster.
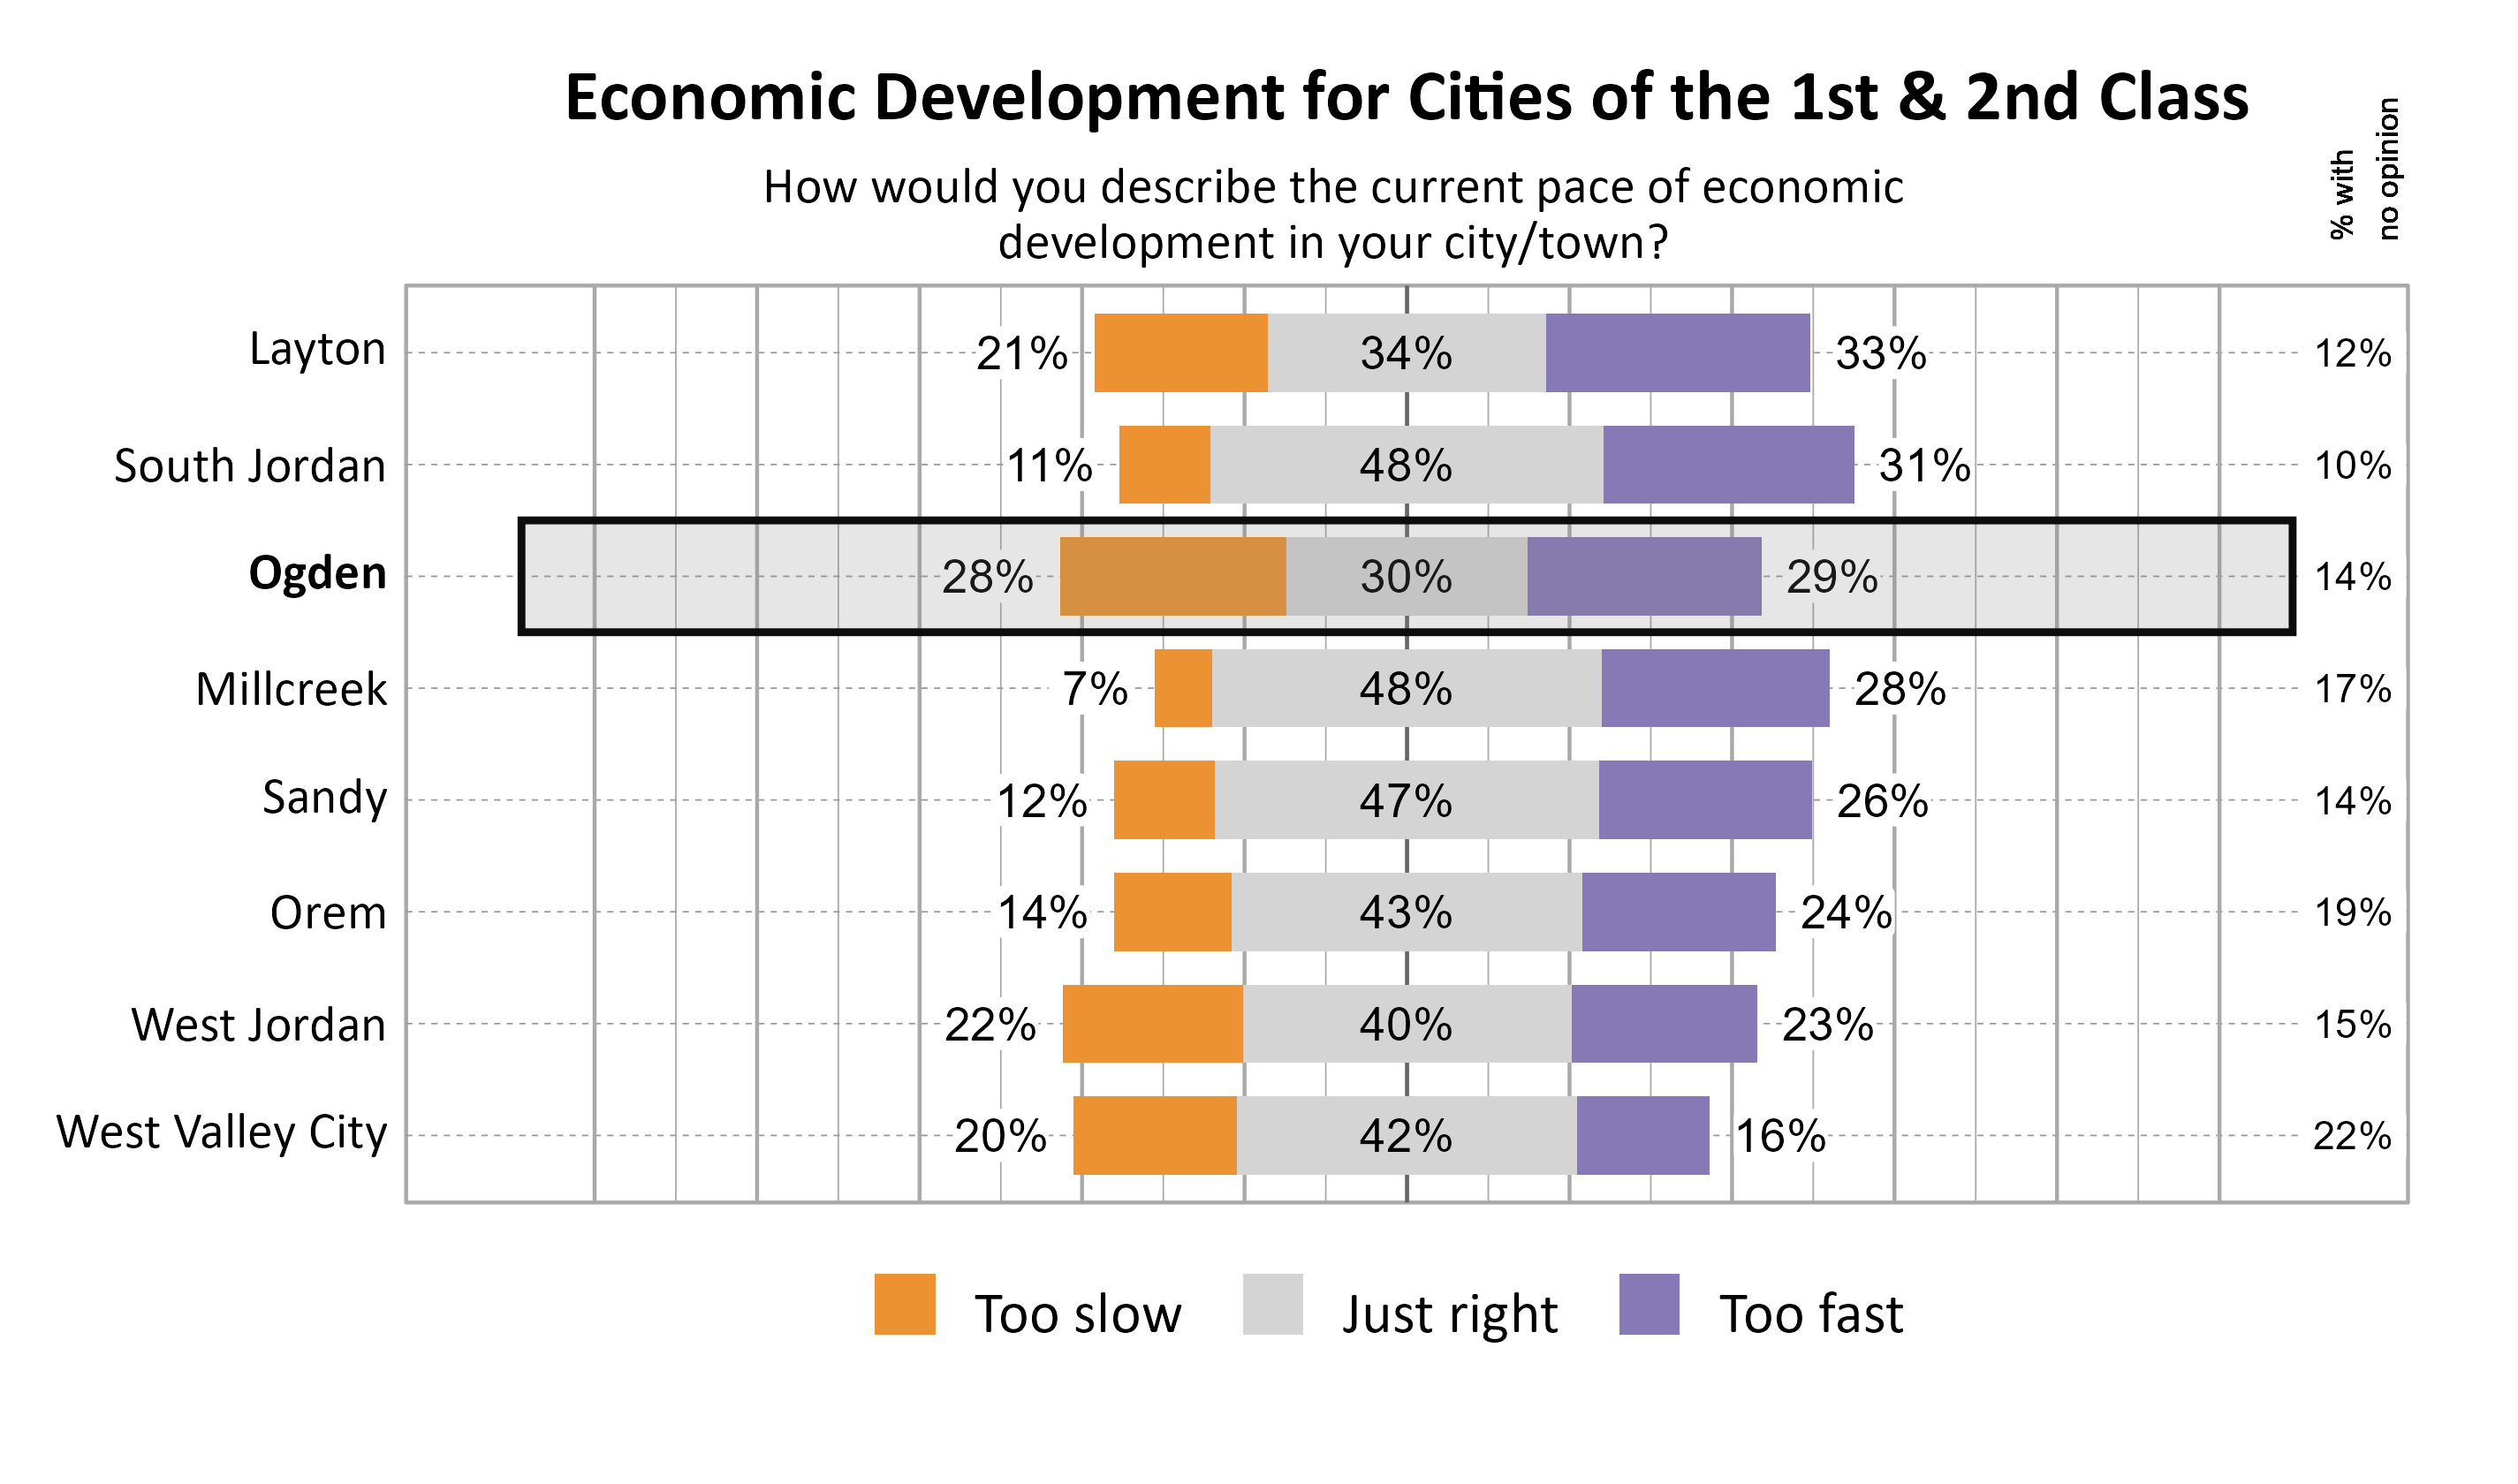
The graph below illustrates how many respondents perceived the pace of economic development as too slow, just right, too fast, or had no opinion, with additional breakdowns for the number of respondents who provided comments.
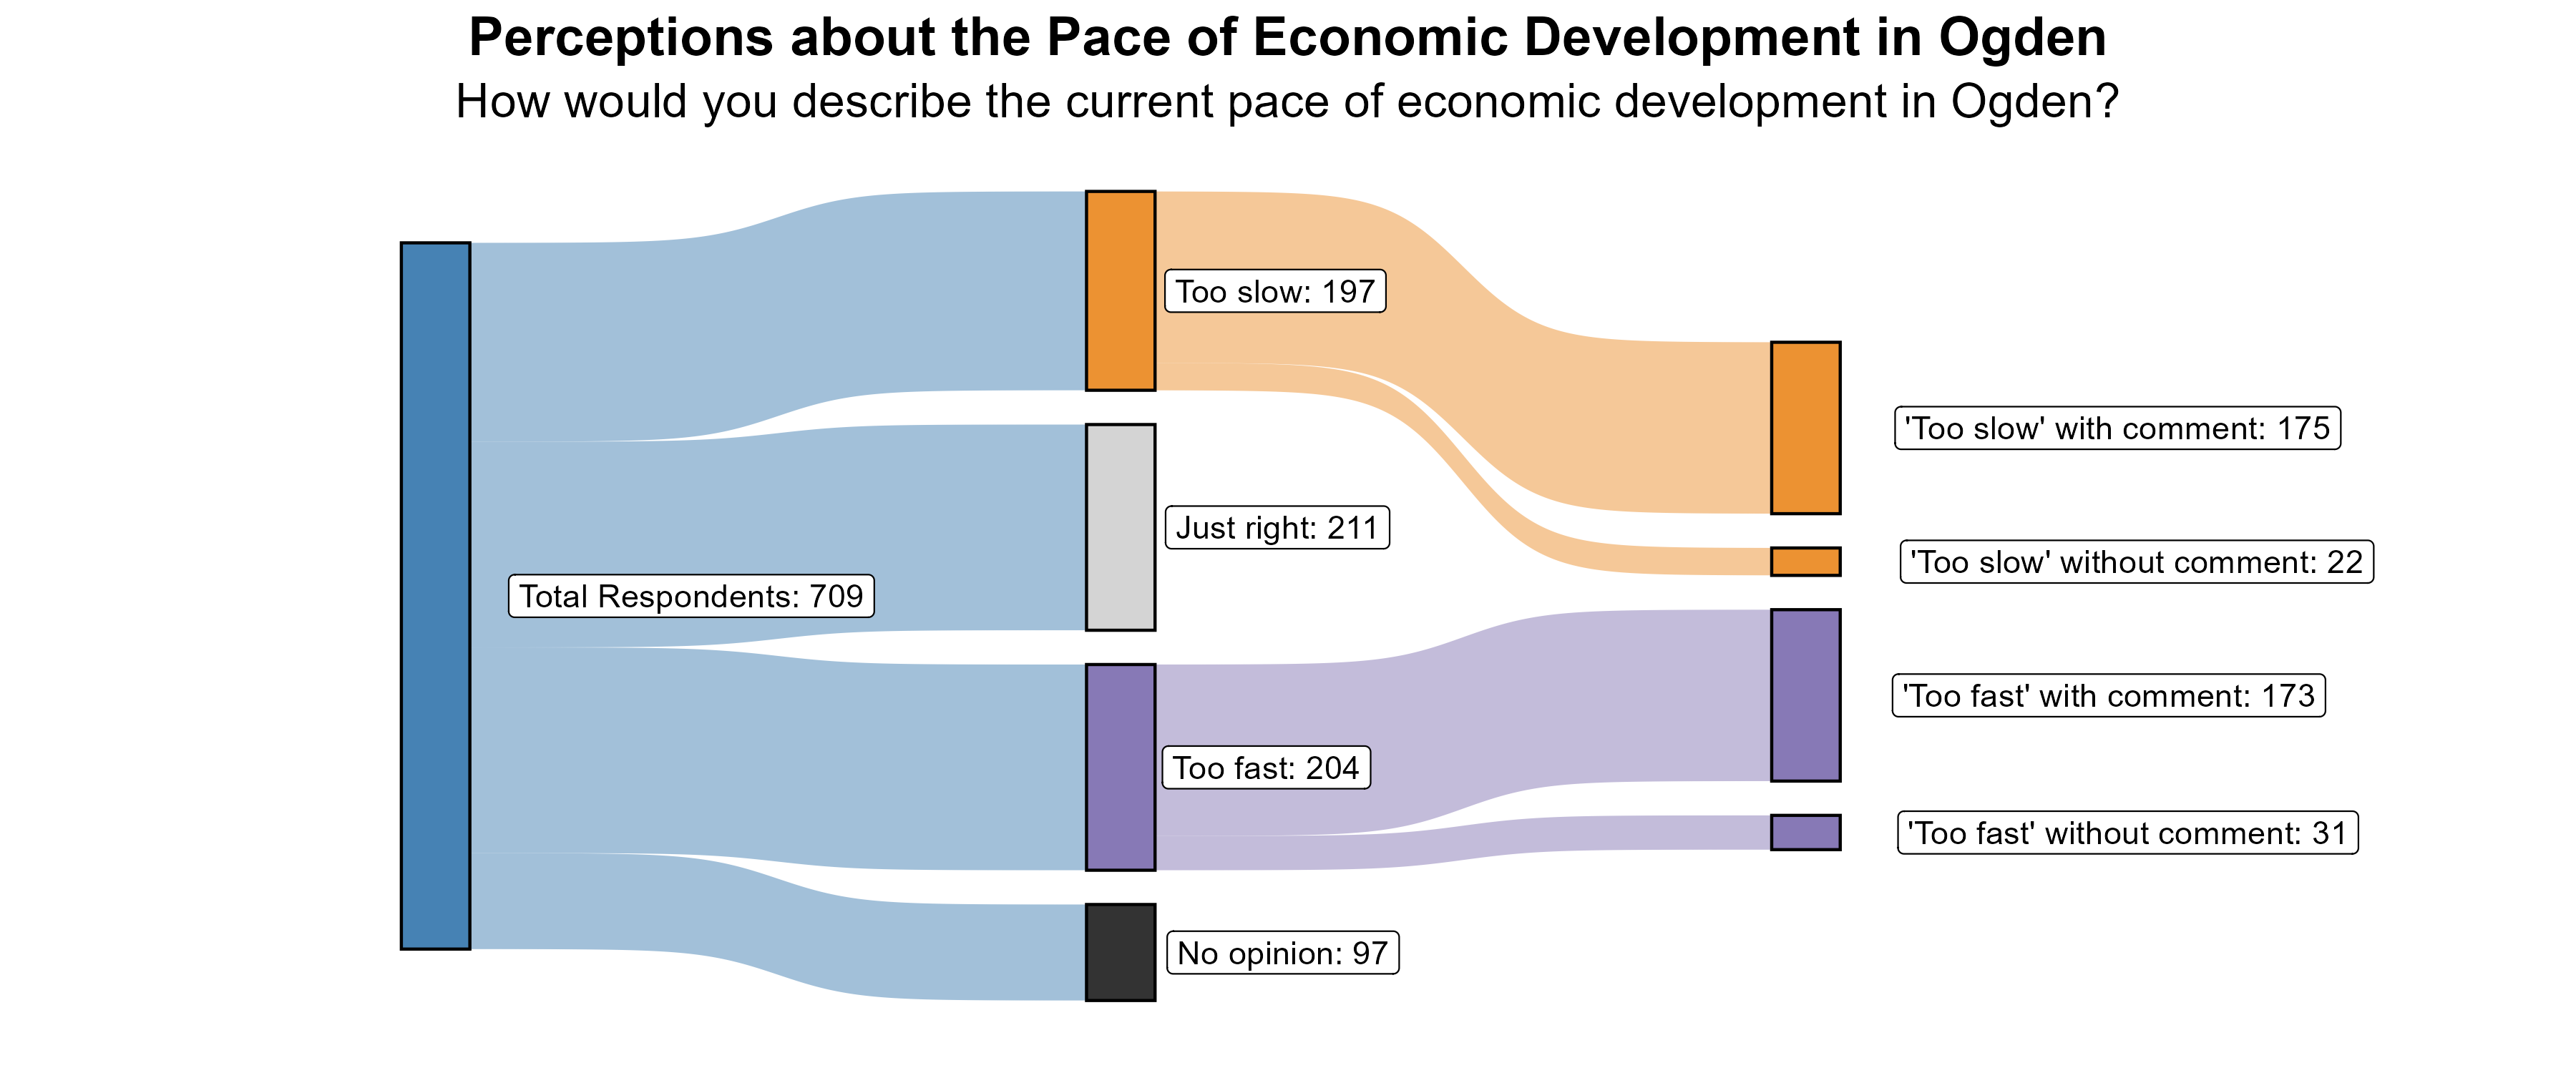
The 28% of respondents who rated the pace of economic growth as “too slow” were further asked what aspects of the local economy they would like to see more of in Ogden. Many indicated they would like to see more retail options, both in terms of big box stores and local businesses, as well as restaurants and entertainment. Many would like to see empty lots and businesses revitalized and cleaned up. Better paying jobs and more employment opportunities were also common topics among respondents.
Additionally, the 29% of respondents who rated the pace of economic growth as “too fast” were further asked what aspects of the local economy they feel are growing too quickly in Ogden. The most common topic by far was that of housing and the opinion that apartments and high-density housing are going up too fast. Many respondents indicated they felt residents have been forgotten as the city pursues other ideals. This main topic relates to other areas of concern such as crowding and traffic, infrastructure issues, and worry about overconsumption of resources. Respondents also frequently mentioned they feel there is a lack of proper planning for the future. Others mentioned the problem of affordability and rising cost of living.
Transportation in Ogden
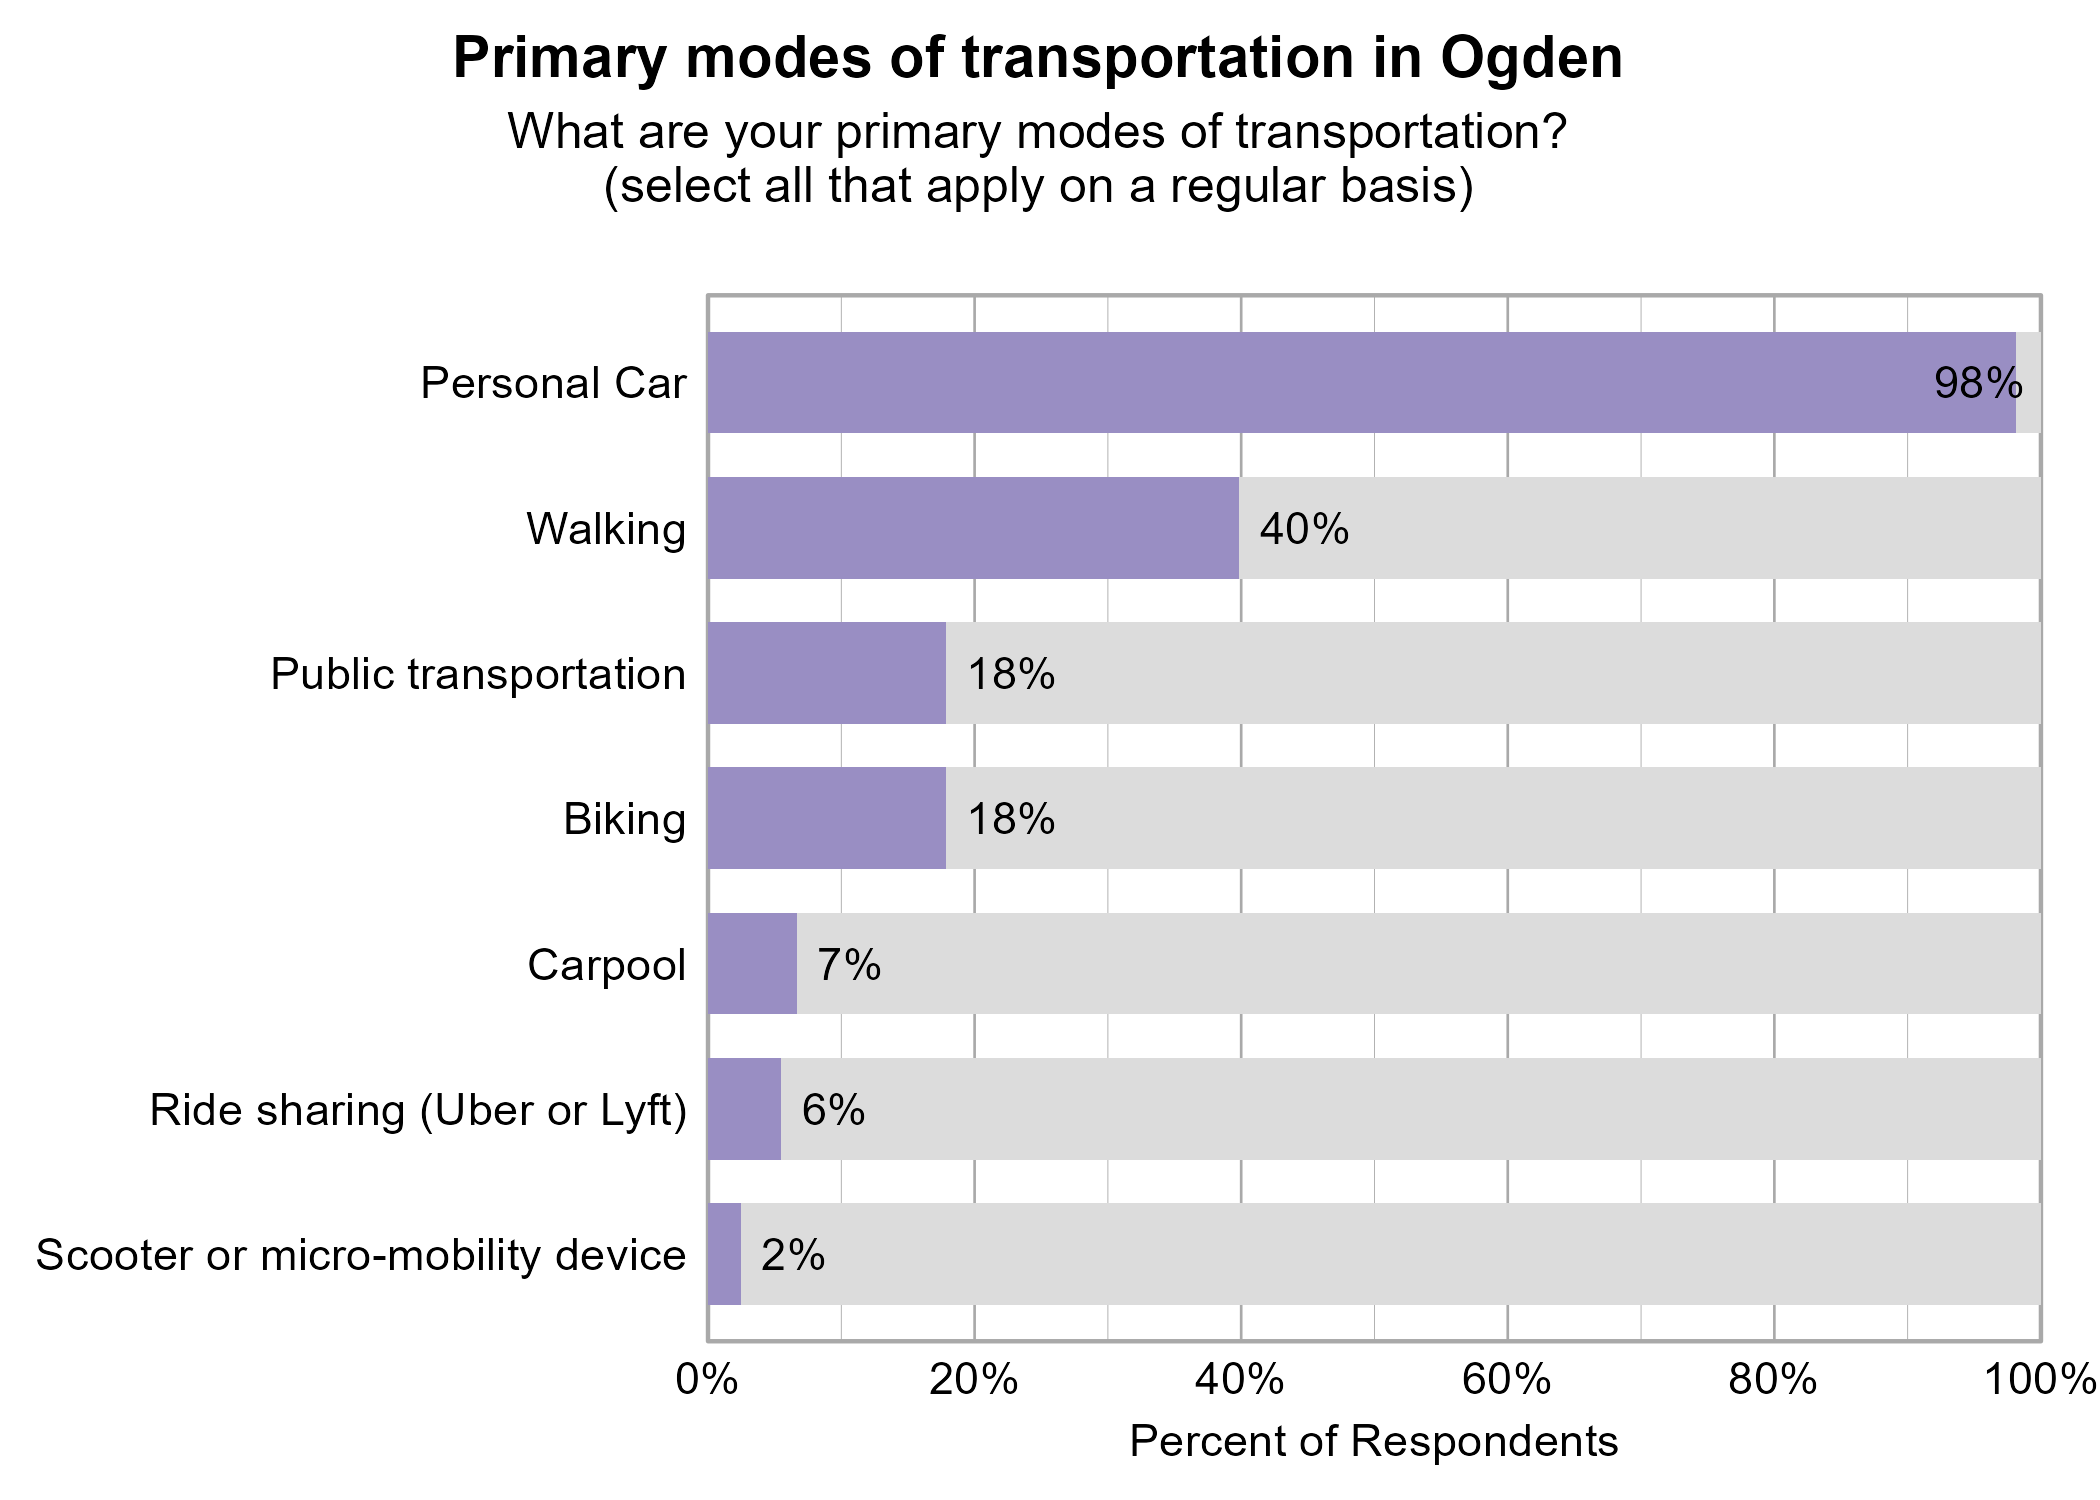
Respondents were asked to indicate all of their primary modes of transportation on a regular basis in Ogden. The most popular modes of transportation were personal car (98%) and walking (40%).
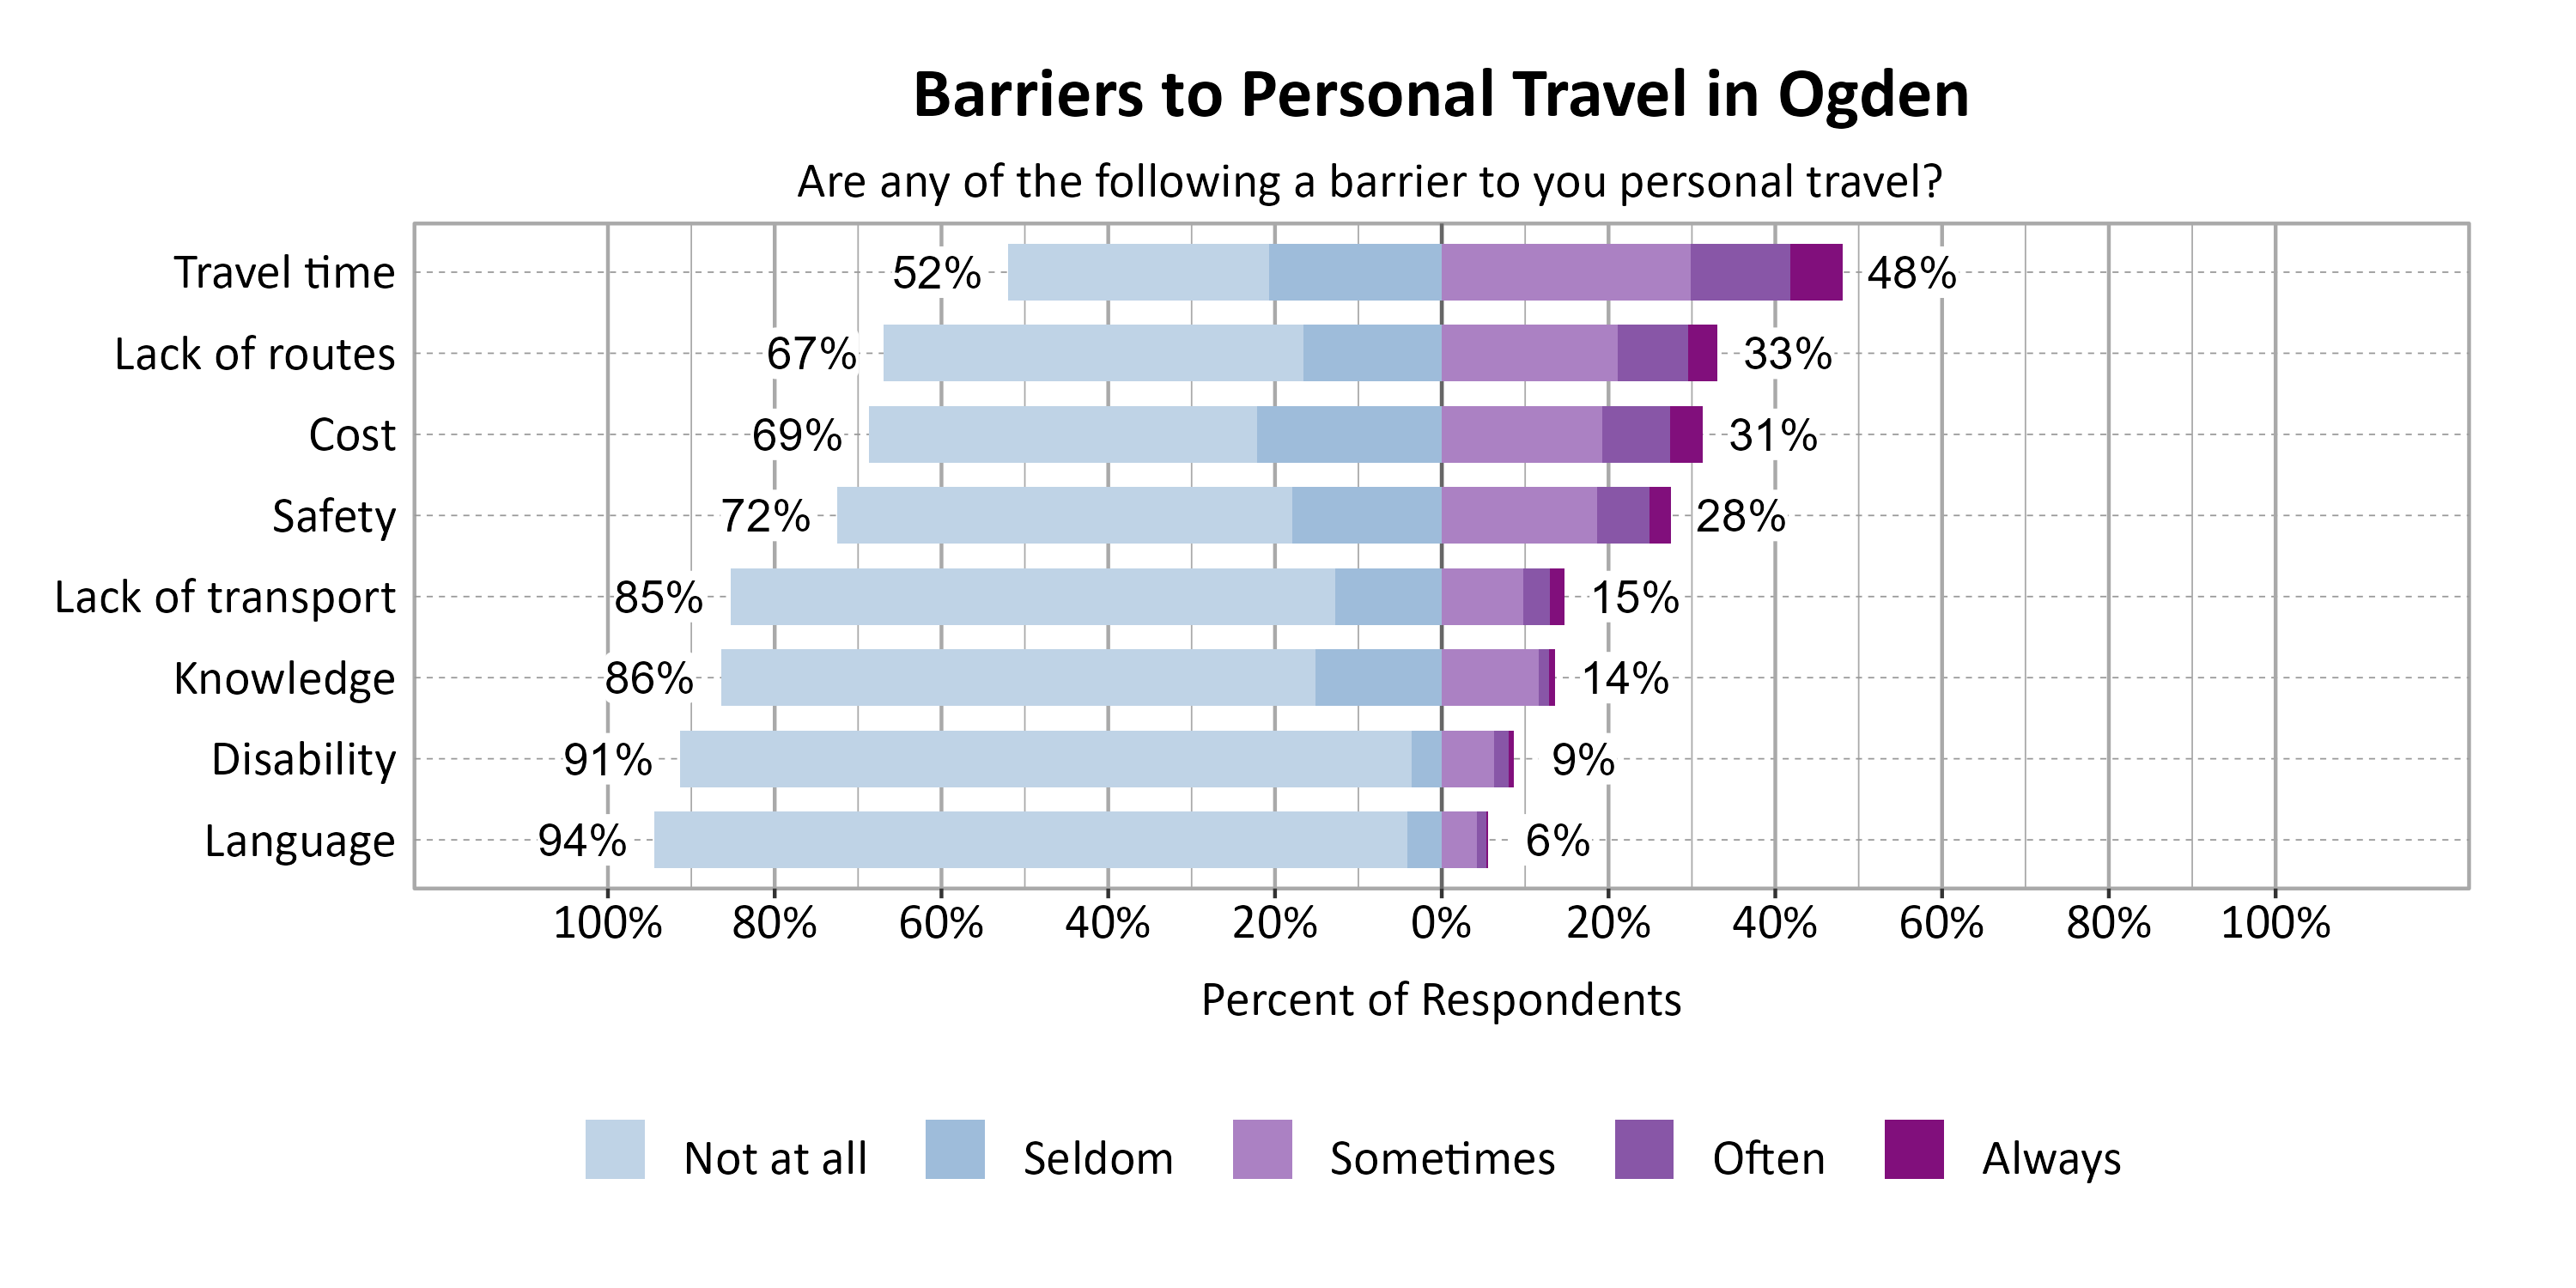
Respondents were asked to indicate the most common barriers to transportation in Ogden. The most problematic barriers were Travel time (48%) and Lack of routes (33%), followed closely by Cost (31%) and Safety (28%).
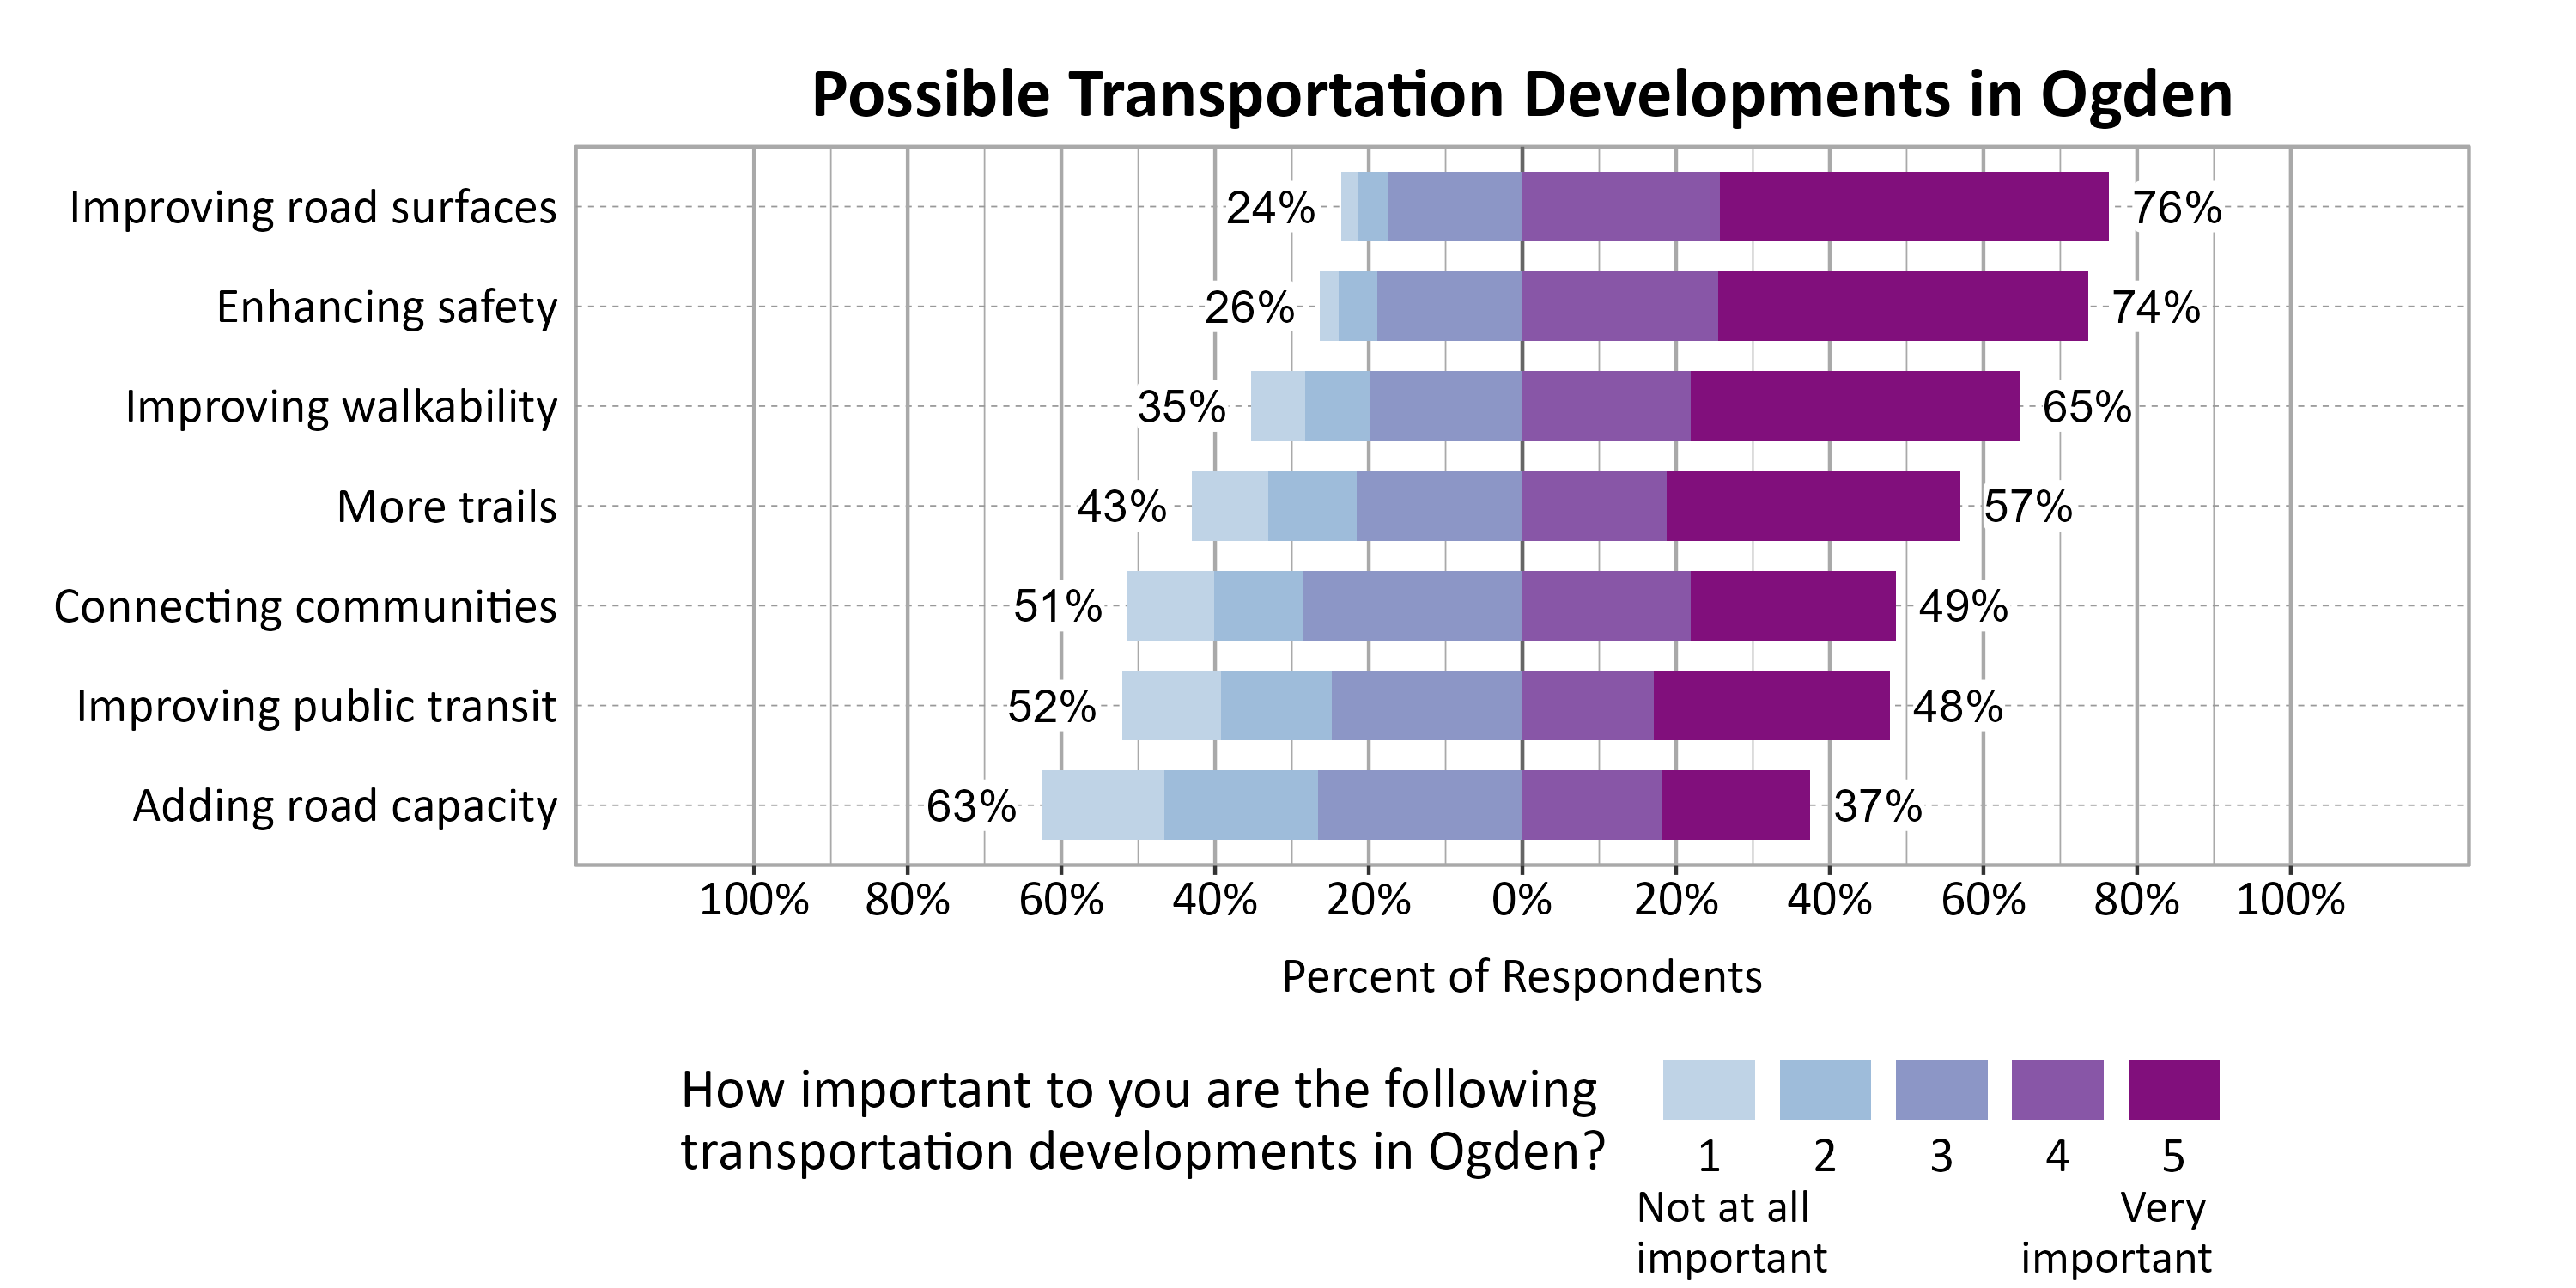
Respondents were asked to indicate the importance of a set of possible transportation developments in Ogden. The most important development to respondents were Improving road surfaces (76%), Enhancing safety (74%), and Improving walkability (65%).
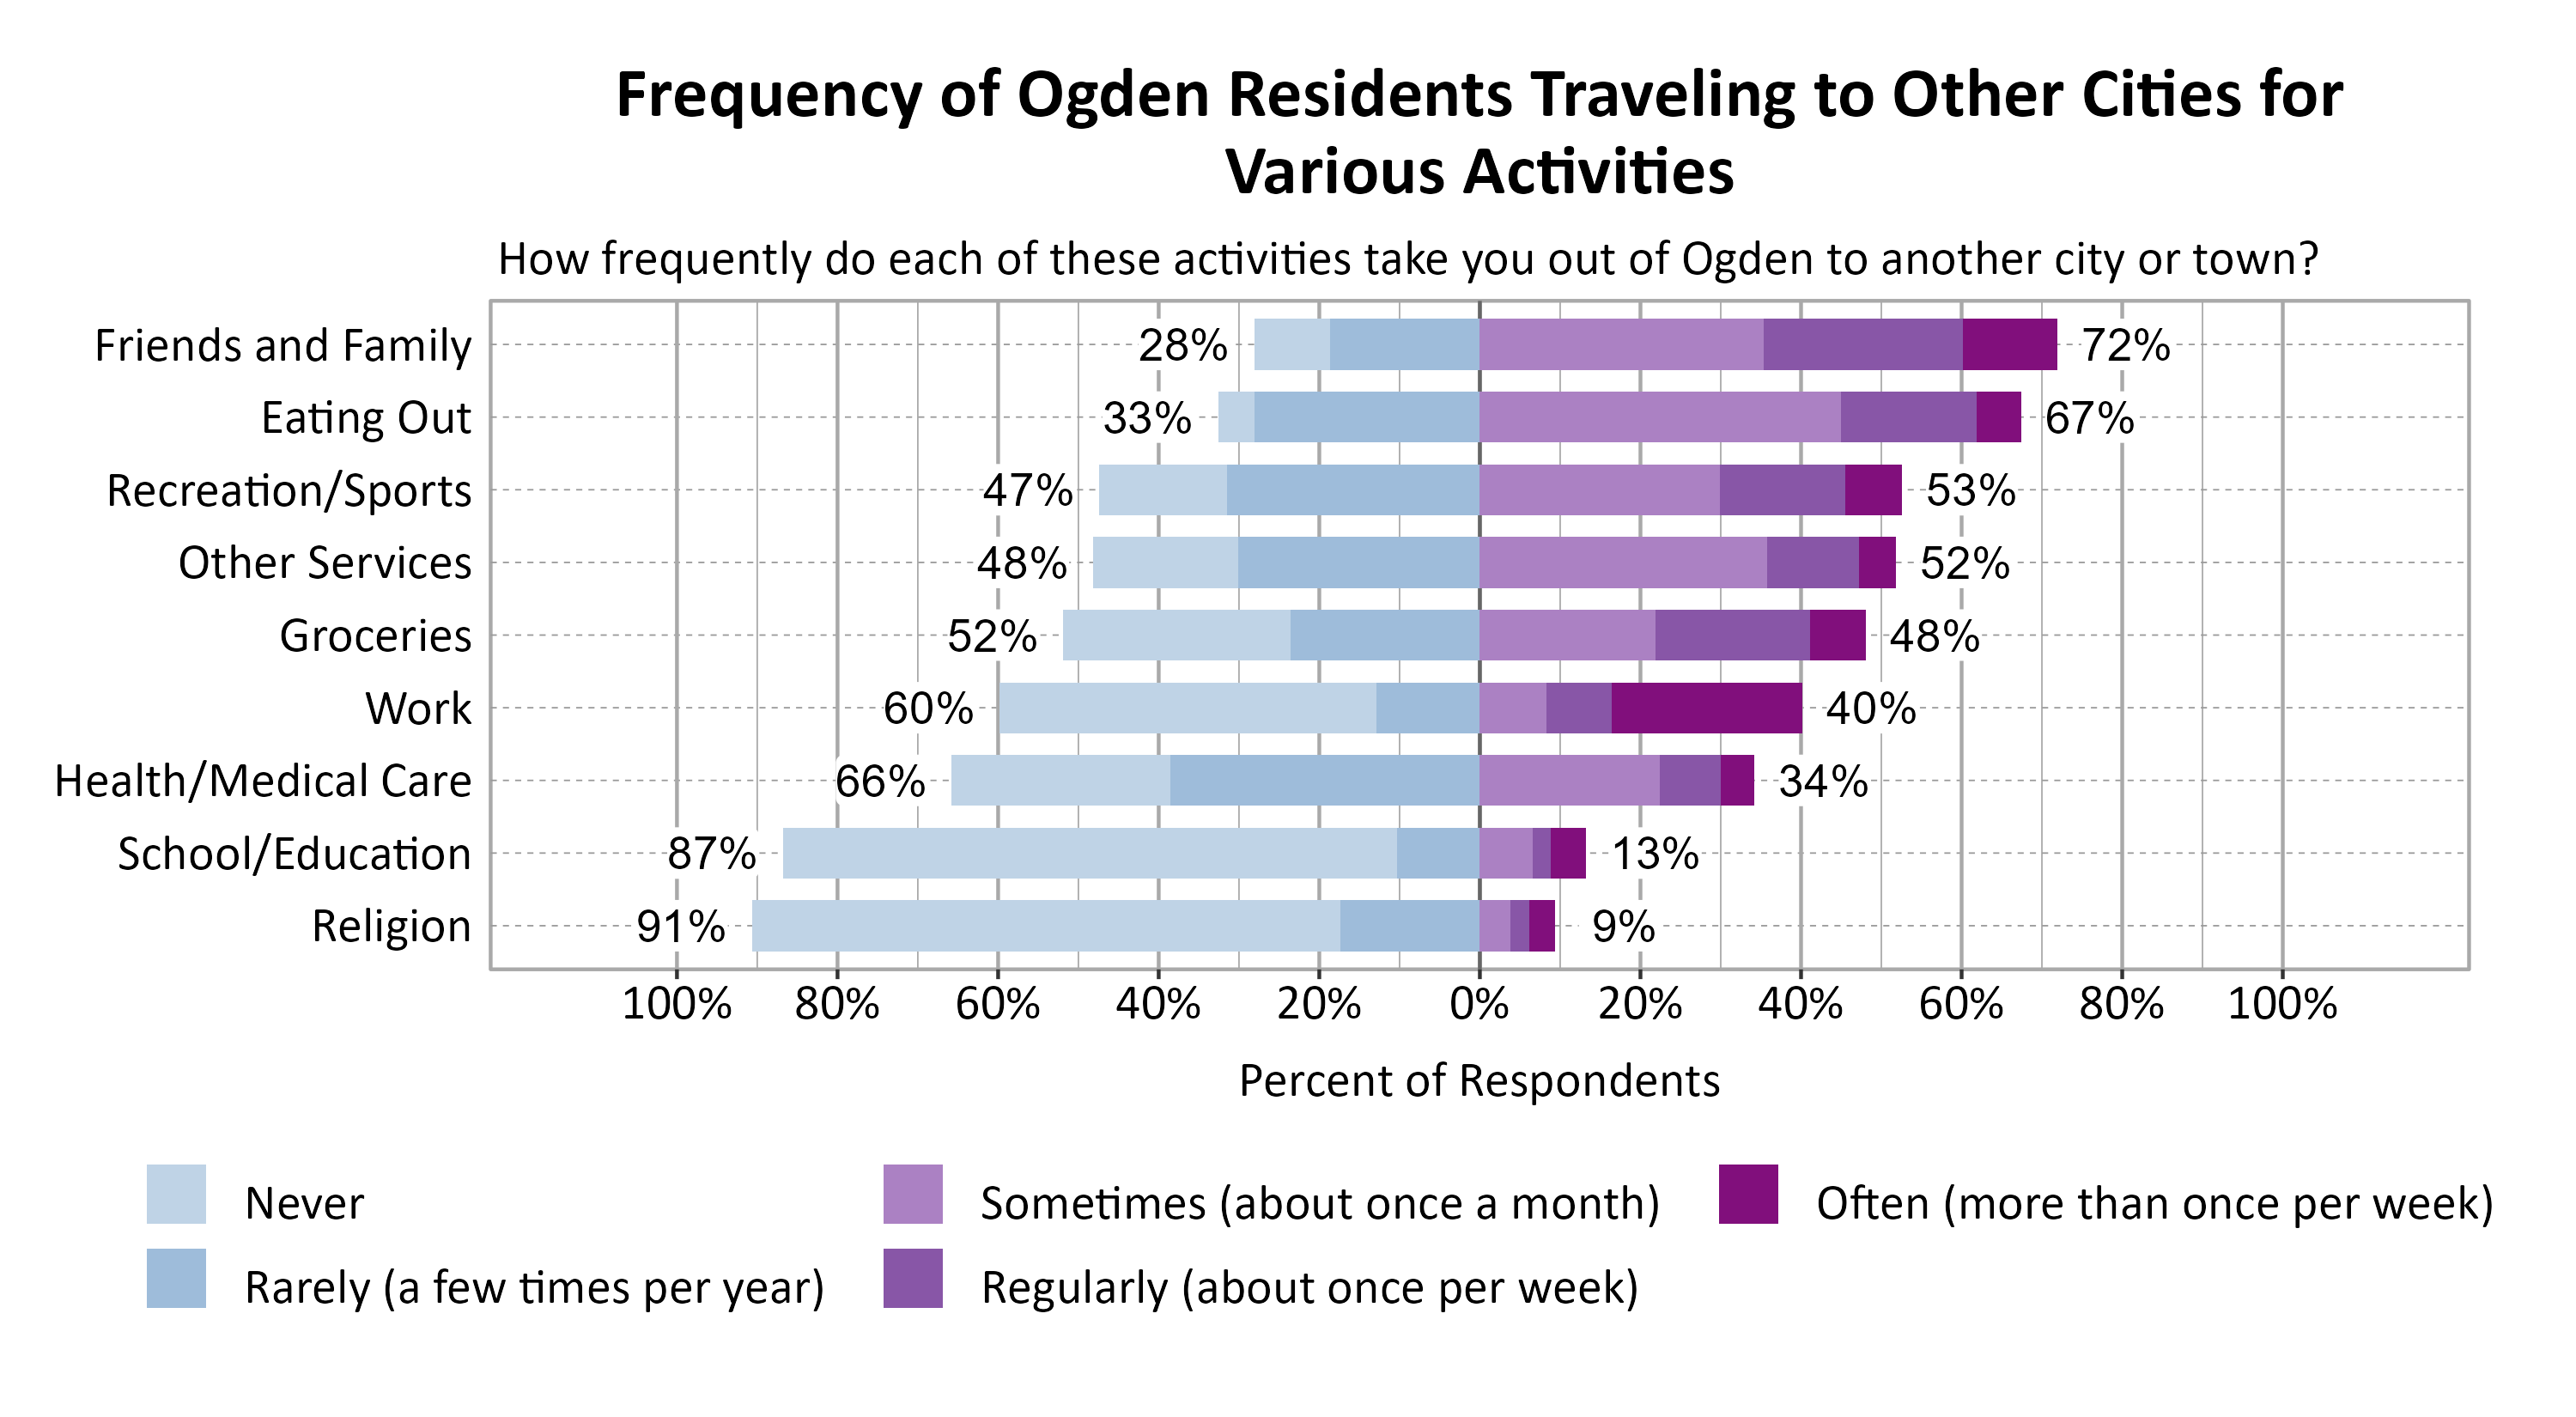
Respondents were asked to indicate how frequently various activities take them out of Ogden to another city or town. The most commonly indicated reasons for traveling to another city or town at least sometimes or once a month were Friends and Family (72%), Eating Out (67%), Recreation/Sports (53%), and Other Services (52%).
Concerns in Ogden
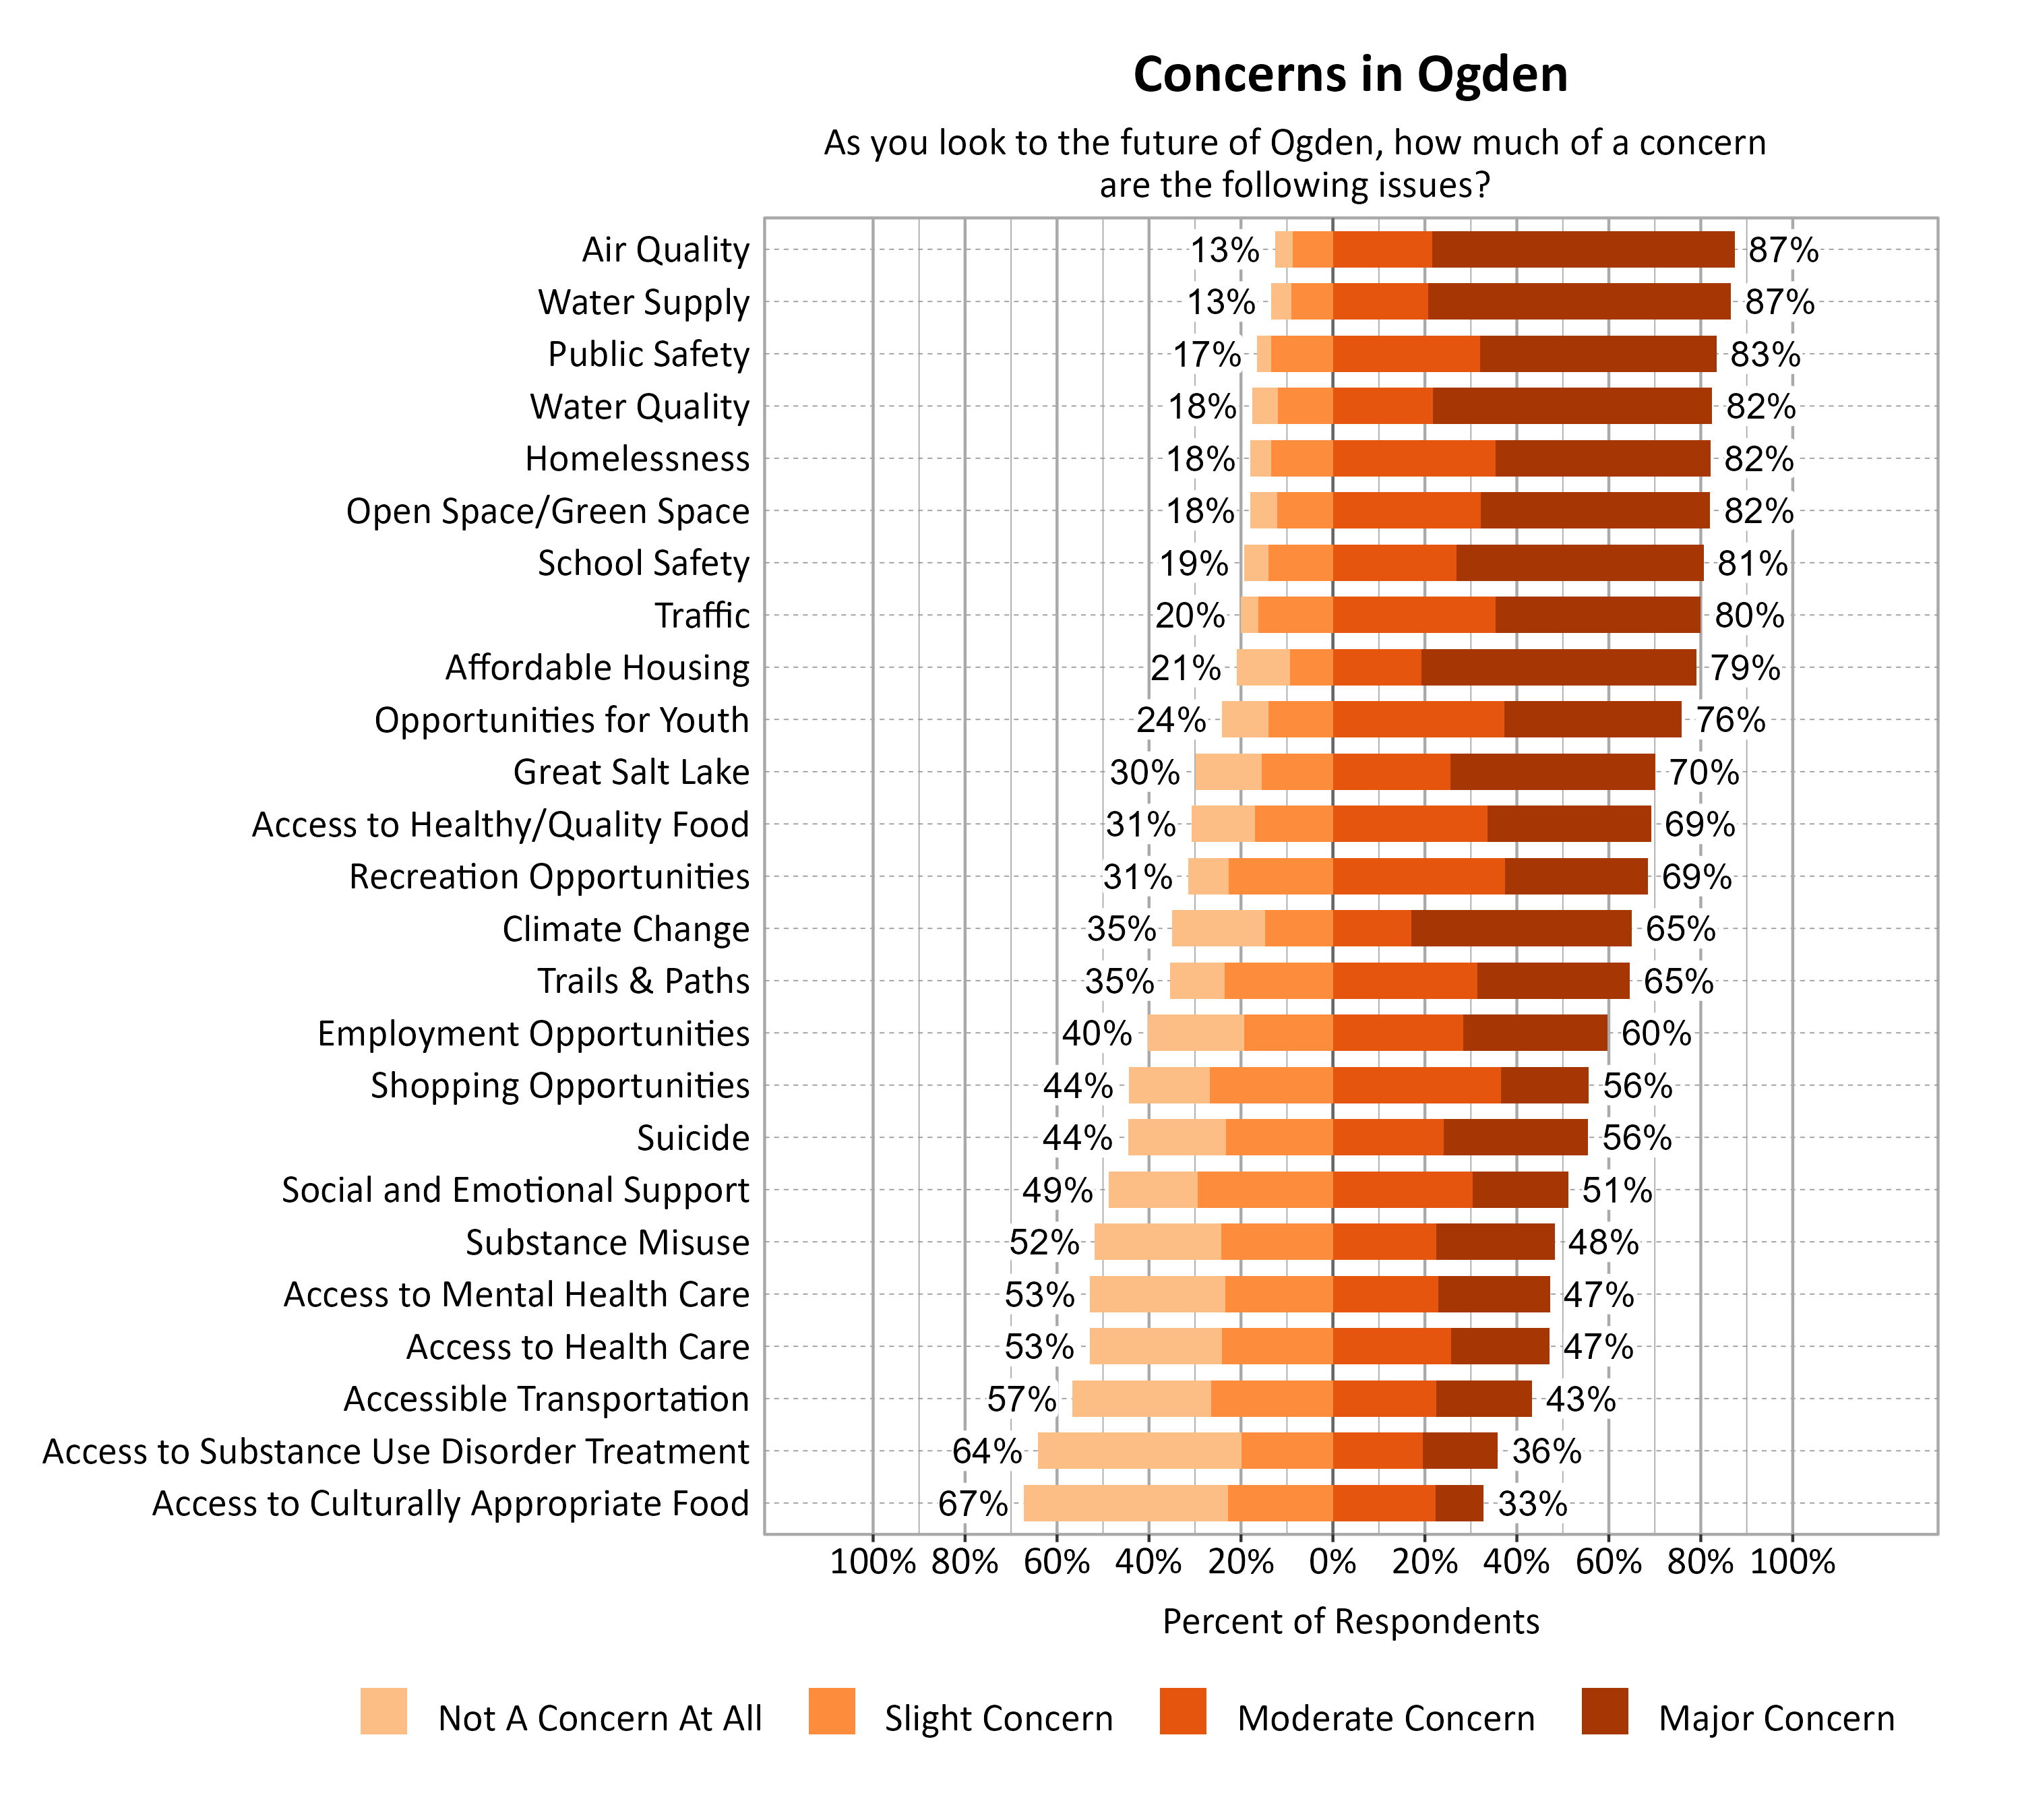
Survey respondents indicated the degree to which a number of possible local issues were a concern as they look to the future of Ogden. Air Quality (87%), Water Supply (87%), Public Safety (83%), Water Quality (82%), Homelessness (82%), and Open Space/Green Space (82%) were the top concerns.
Additional Questions for Ogden
Community Events In Ogden
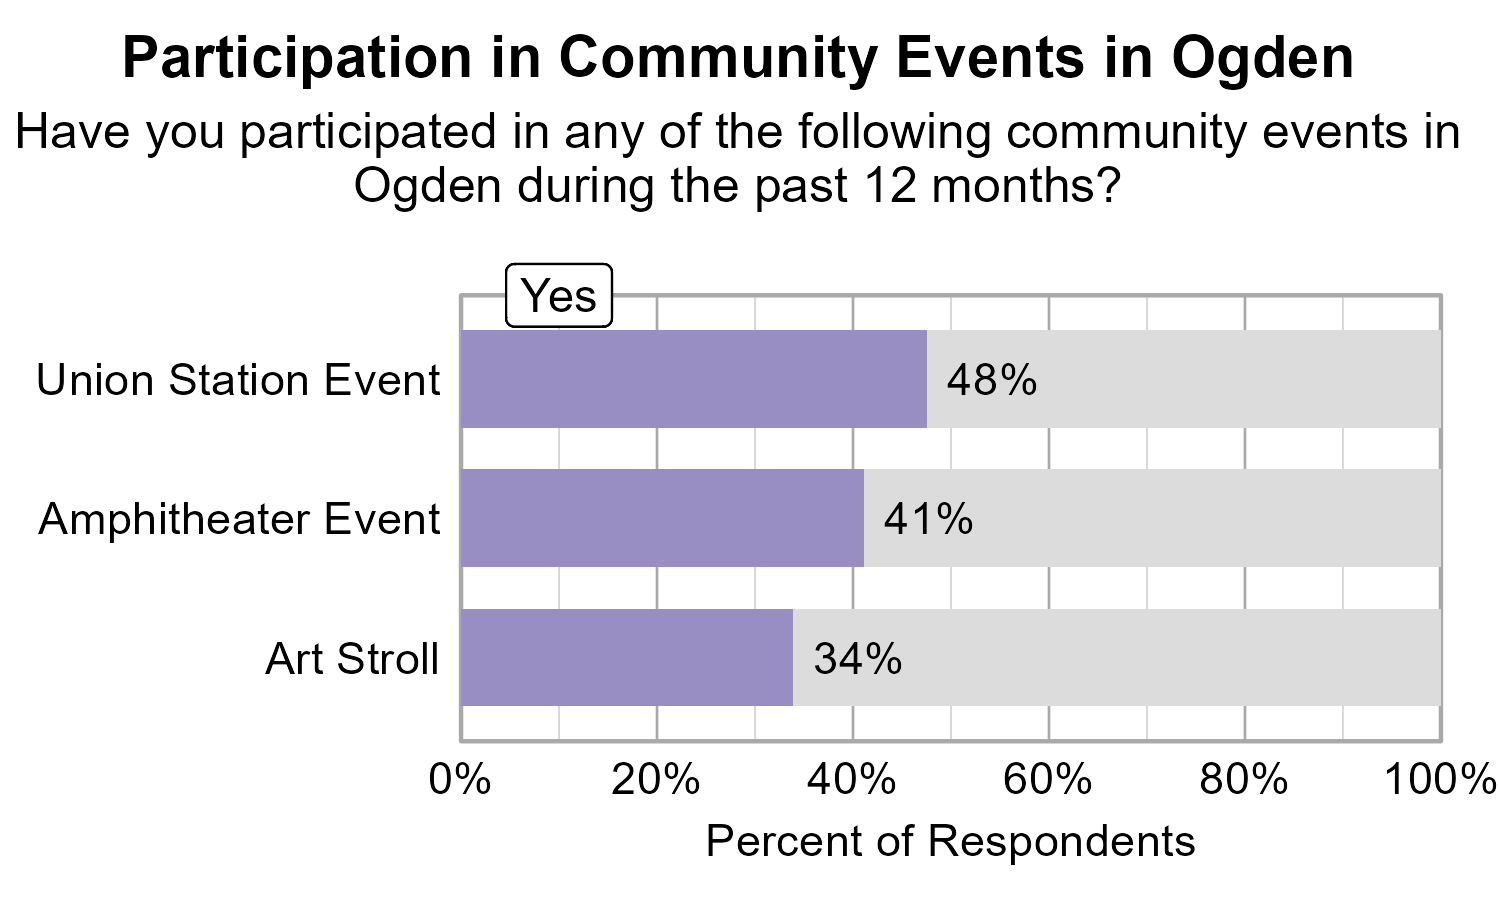
Respondents were asked to indicate whether or not they participated in various community events in the last 12 months. Nearly half (48%) of respondents indicated they have participated in a Union Station Event, 41% of respondents indicated they have participated in an Amphitheater Event, and 34% of respondents indicated they have participated in an Art Stroll.
Open Comments
All open comments collected in the survey were shared with city leaders. General observations and themes are shared here.
What Respondents Value Most in Ogden
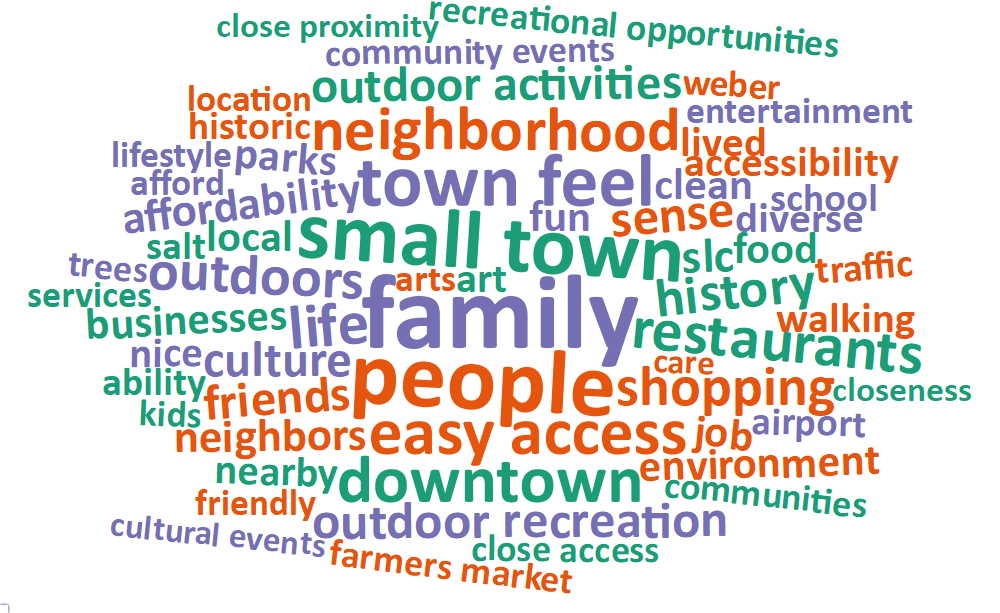
Survey respondents were asked to comment on what they value most about Ogden. The most common words and phrases from all city comments are included in the word cloud below. It is possible that negative or unrelated words may appear since these words have been taken out of context, and they may not indicate the respondent’s intended meaning. The most common response was valuing the people, culture, and diversity of Ogden, with a close second set valuing recreation, especially access to trails. Many respondents also mentioned valuing the nature and beauty of Ogden, and the balance between small town and city, the history of Ogden, and the general vibe or character of Ogden.
Local Environmental Quality in Ogden
The 57% of respondents who rated the Local Environmental Quality domain as 1, 2, or 3 (Poor, Fair, or Moderate) were further asked if there are specific aspects of local environmental quality that they feel are problematic. Comments often indicated inversions and air quality as a main concern in the area. Respondents relate this to car exhaust and a dog food plant that makes the air smell bad. Comments surrounding management of air quality seem unhopeful as residents feel this is an issue for state leaders. Trash was mentioned as a concern related to sidewalks and streets, residents who don’t keep their yards clean, homeless people, and people leaving drug remnants in parks. Water quality and access was another concern as respondents mentioned that Ogden doesn’t have the infrastructure or capacity for the amount of development happening. Crowding on roads and lack of safe travel for walking/biking was another dominant concern. Other less common themes included a lack of green space, noise from cars and Hill Air Force Base, the Great Salt Lake drying up, and homelessness.
Improving Wellbeing in Ogden
Survey respondents were asked if there is anything that could be done to improve wellbeing in Ogden. The most dominant theme, by far, was transportation, including improving traffic, public access, preserving free parking (usually specifically downtown/25th street), and improving roads (but doing so in a way that didn’t create too much construction at the same time). Another key theme was growth and development, primarily asking for growth to slow or stop and to stop building apartments. Similarly, many respondents discussed housing, especially affordable housing. Another theme was environmental issues, such as sound pollution, upkeep of personal property, and water use (specifically secondary water use). Quite a few respondents brought up concerns about homelessness, concerns about government (city code enforcement, traffic enforcement, growth and development choices), or concerns about the economy (cost of living, affordability).
Additional Comments
Respondents were also asked if they had any additional comments on wellbeing in Ogden. Many comments concerned government, more specifically rising property taxes, the need for enforcement of city ordinances, and complaints about corruption. Many comments also concerned transportation, asking for better public transportation, road maintenance, and complaints about traffic or parking. Many comments concerned growth and development, usually a desire to slow down or for better management. Several comments were about quality of life and how much they enjoy living in Ogden.