Orem Wellbeing Survey Findings 2024

By Dr. Courtney Flint and Team


utah wellbeing survey logo

Contact Information

Summary

Orem is one of 51 cities participating in the Utah Wellbeing Survey Project in 2024. This project is designed to assess the wellbeing and local perspectives of city residents and to provide information to city leaders to inform general planning processes. Additional analysis is underway and this report may be updated over time.

We are grateful to all those who took the survey and to our city partners who helped to make this possible. We are grateful to a number of entities for funding: the Utah League of Cities and Towns, USU Extension, USU’s Institute for Land Water and Air, the Wasatch Front Regional Council, Utah Department of Transportation, the Utah Agricultural Experiment Station, and the cities of Alpine, Cedar Hills, Draper, Millcreek, Nephi, North Salt Lake, Ogden, Orem, Pleasant Grove, Providence, Springdale, Tremonton, West Bountiful, and West Valley City.

This report describes findings from the 2024 Orem survey and comparative information with other project cities. In February and March 2024, Orem City advertised the survey for residents through social media and newsletters. All city residents age 18+ were encouraged to take the online Qualtrics survey.

How many people responded?

  • 1361 viable surveys were recorded in this 2024 survey effort.
  • The adult population of Orem was estimated at 70,703, based on the American Community Survey by the U.S. Census. The 1361 survey responses in 2024 represent 1.9% of the adult population and have a conservative margin of error of 2.63%.

Survey Respondent Characteristics

Resident Statistics
Full Time Residents of Orem 98.4%
Part Time Residents of Orem 1.6%
Length of Residency — Range 0.5-75 years
Length of Residency — Average 24.3 years
Length of Residency — Median 23 years
Length of Residency 5 Years or less 16.8%
ZIP Code Percent
84057 37.2%
84058 27.8%
84059 2.9%
84097 32.1%
Other 0.1%
City Area Percent
Neighborhood 1 15.7%
Neighborhood 2 9.9%
Neighborhood 3 13.0%
Neighborhood 4 9.6%
Neighborhood 5 16.9%
Neighborhood 6 13.2%
Neighborhood 7 5.2%
Neighborhood 8 7.5%
Neighborhood 9 9.1%

A Map of Orem City Areas

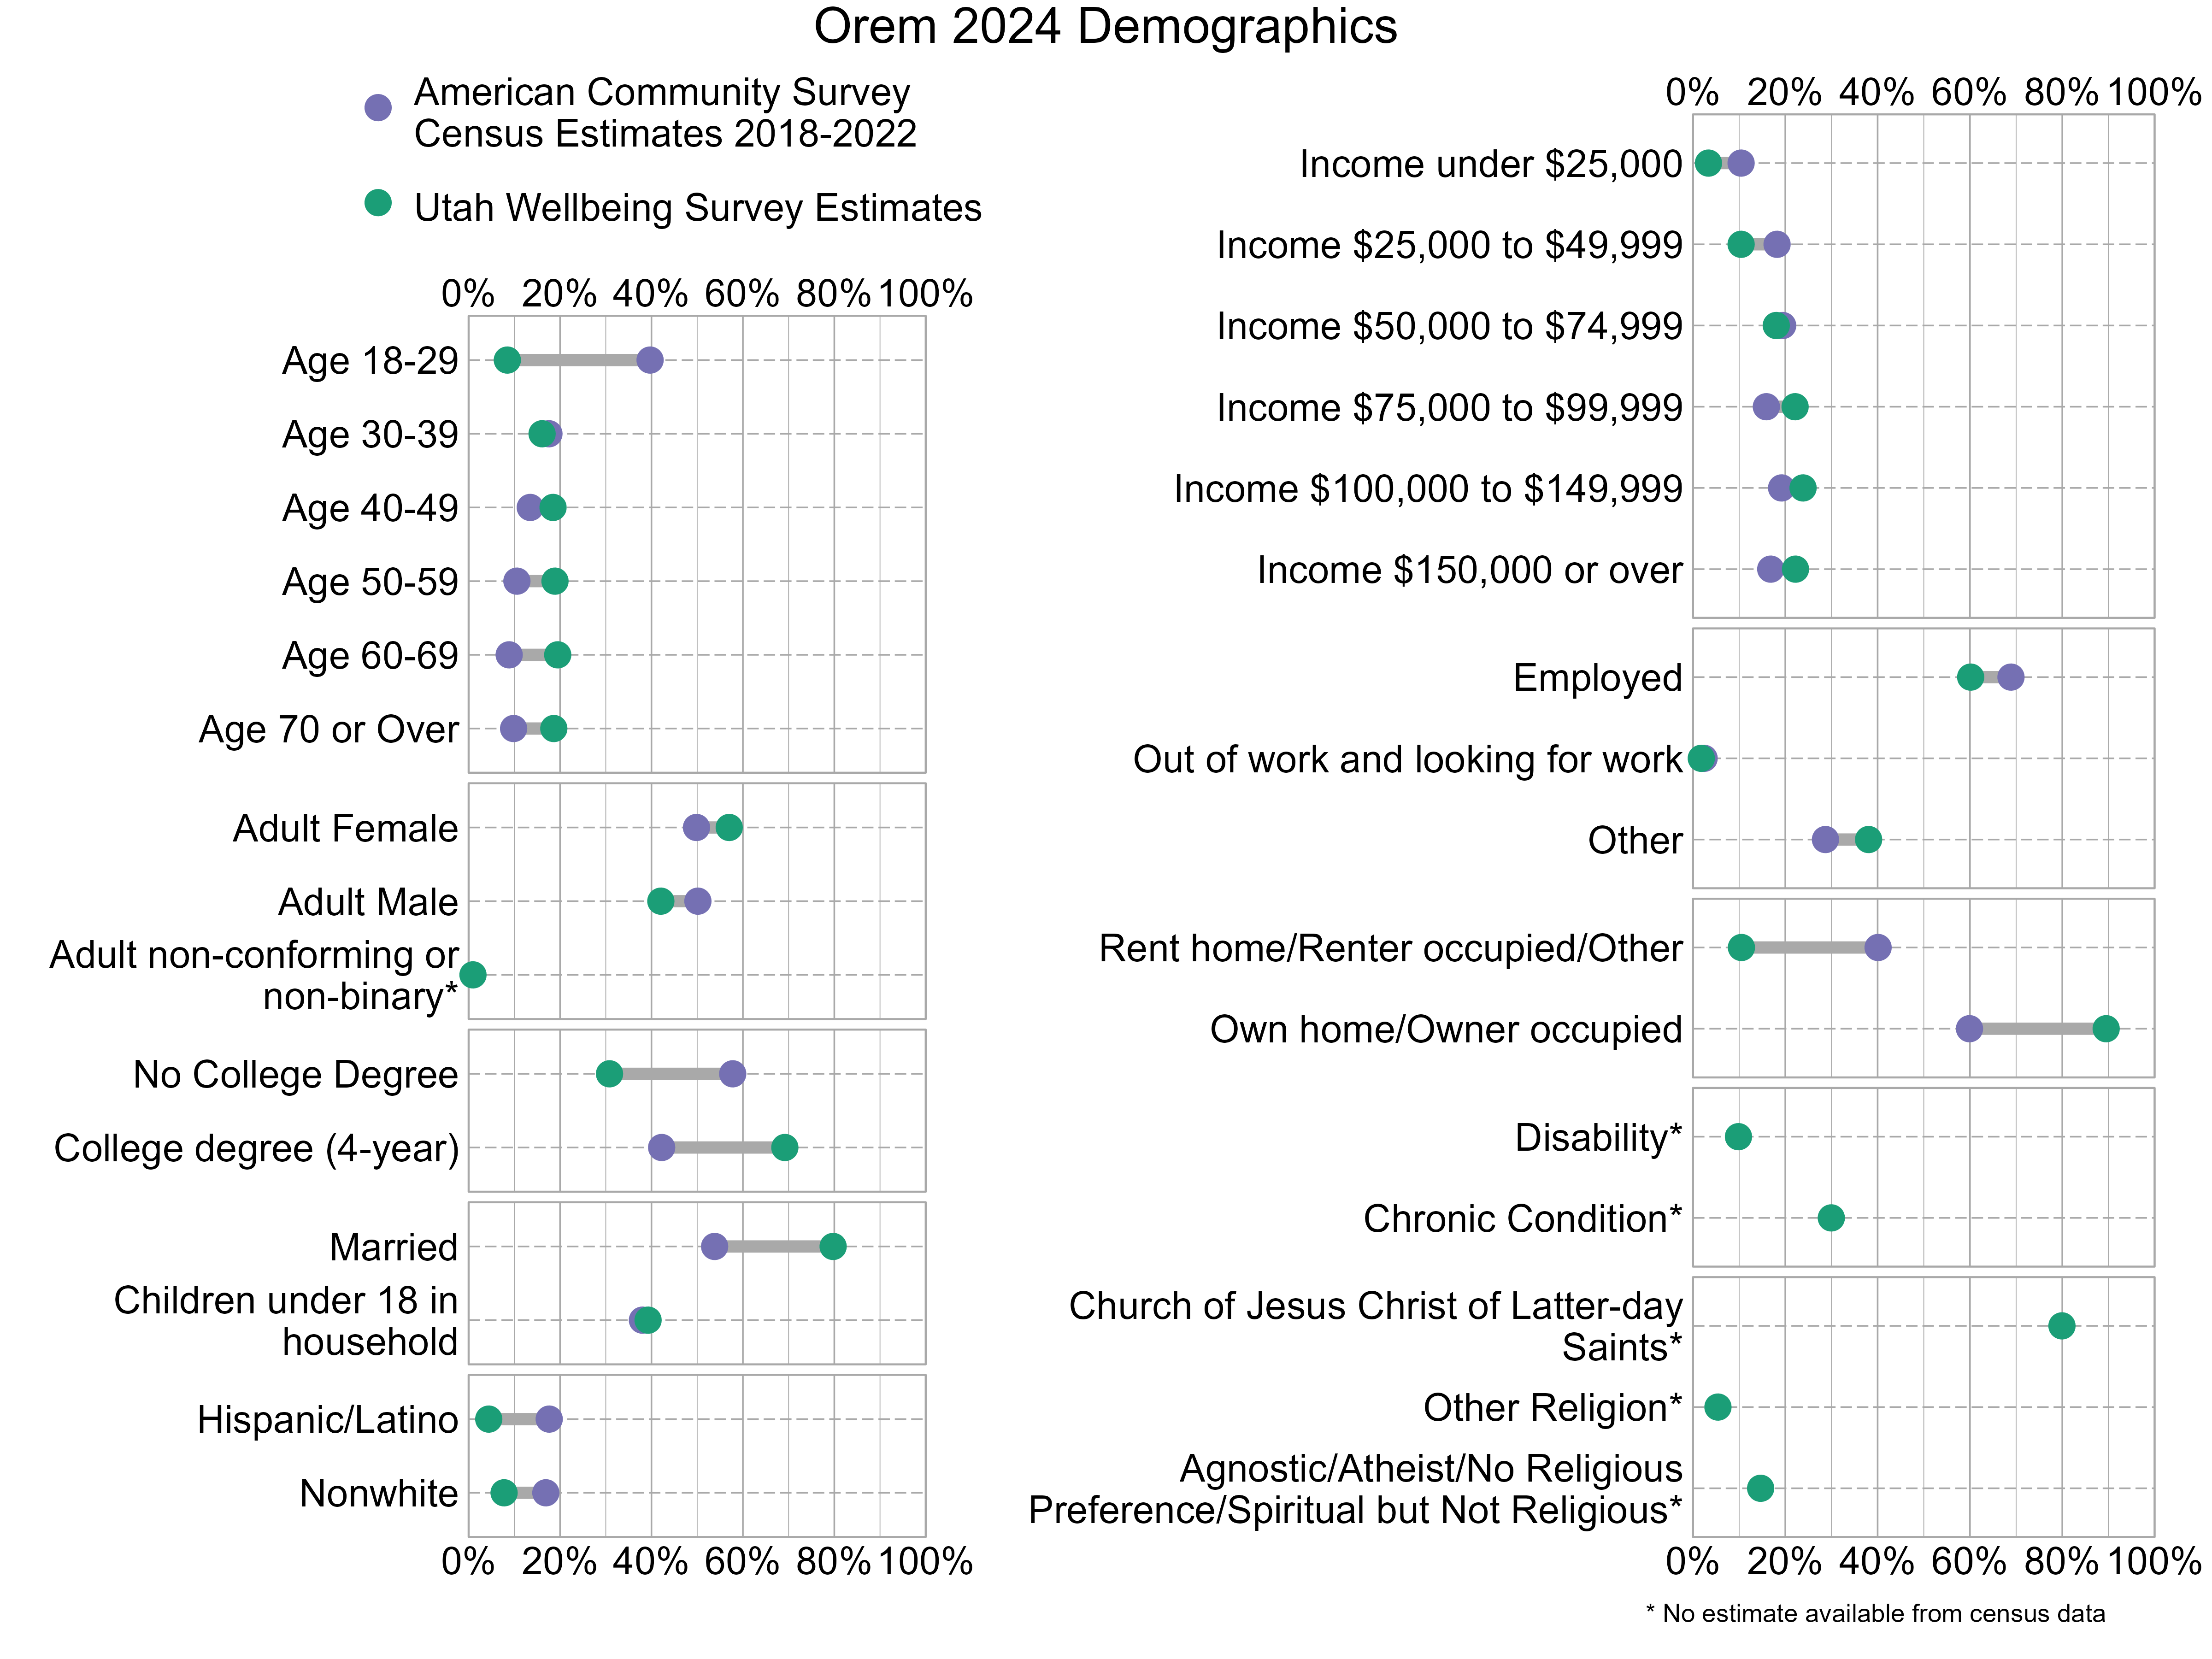
Demographic characteristics of the survey respondents were compared below with U.S. Census information from the 2018-2022 American Community Survey. In the graph below, gray bars indicate differences between the American Community Survey estimates and the Utah Wellbeing Project surveys. The wider the gray bars, the larger the differences. Also note that estimates for religious affiliation, adult non-conforming or non-binary gender, disability, and chronic conditions are unavailable from the census data. There can also be a variable margin of error in the American Community Survey estimates, and caution should be used when comparing estimates. Not all respondents provided demographic information. As the graph shows, 2024 survey respondents were not fully representative of Orem. People who have at least a 4-year college degree, are married, and own their homes were overrepresented while those who are age 18-29, do not have a college degree, and are renters were underrepresented.

Dot Plot. Title: Orem 2024 Demographics. Data — Age 18-29: American Community Survey Estimate: 40%, Utah Wellbeing Survey Estimate: 8%; Age 30-39: American Community Survey Estimate: 18%, Utah Wellbeing Survey Estimate: 16%; Age 40-49: American Community Survey Estimate: 13%, Utah Wellbeing Survey Estimate: 18%; Age 50-59: American Community Survey Estimate: 11%, Utah Wellbeing Survey Estimate: 19%; Age 60-69: American Community Survey Estimate: 9%, Utah Wellbeing Survey Estimate: 19%; Age 70 or Over: American Community Survey Estimate: 10%, Utah Wellbeing Survey Estimate: 19%; Income under $25,000: American Community Survey Estimate: 10%, Utah Wellbeing Survey Estimate: 3%; Income $25,000 to $49,999: American Community Survey Estimate: 18%, Utah Wellbeing Survey Estimate: 10%; Income $50,000 to $74,999: American Community Survey Estimate: 19%, Utah Wellbeing Survey Estimate: 18%; Income $75,000 to $99,999: American Community Survey Estimate: 16%, Utah Wellbeing Survey Estimate: 22%; Income $100,000 to $149,999: American Community Survey Estimate: 19%, Utah Wellbeing Survey Estimate: 24%; Income $150,000 or over: American Community Survey Estimate: 17%, Utah Wellbeing Survey Estimate: 22%; Adult Female: American Community Survey Estimate: 50%, Utah Wellbeing Survey Estimate: 57%; Adult Male: American Community Survey Estimate: 50%, Utah Wellbeing Survey Estimate: 42%; Adult non-conforming or non-binary*: American Community Survey Estimate: NA%, Utah Wellbeing Survey Estimate: 1%; Employed: American Community Survey Estimate: 69%, Utah Wellbeing Survey Estimate: 60%; Out of work and looking for work: American Community Survey Estimate: 2%, Utah Wellbeing Survey Estimate: 2%; Other: American Community Survey Estimate: 29%, Utah Wellbeing Survey Estimate: 38%; No College Degree: American Community Survey Estimate: 58%, Utah Wellbeing Survey Estimate: 31%; College degree (4-year): American Community Survey Estimate: 42%, Utah Wellbeing Survey Estimate: 69%; Rent home/Renter occupied/Other: American Community Survey Estimate: 40%, Utah Wellbeing Survey Estimate: 10%; Own home/Owner occupied: American Community Survey Estimate: 60%, Utah Wellbeing Survey Estimate: 90%; Married: American Community Survey Estimate: 54%, Utah Wellbeing Survey Estimate: 80%; Children under 18 in household: American Community Survey Estimate: 38%, Utah Wellbeing Survey Estimate: 39%; Disability*: American Community Survey Estimate: NA%, Utah Wellbeing Survey Estimate: 10%; Chronic Condition*: American Community Survey Estimate: NA%, Utah Wellbeing Survey Estimate: 30%; Hispanic/Latino: American Community Survey Estimate: 18%, Utah Wellbeing Survey Estimate: 4%; Nonwhite: American Community Survey Estimate: 17%, Utah Wellbeing Survey Estimate: 8%; Church of Jesus Christ of Latter-day Saints*: American Community Survey Estimate: NA%, Utah Wellbeing Survey Estimate: 80%; Other Religion*: American Community Survey Estimate: NA%, Utah Wellbeing Survey Estimate: 5%; Agnostic/Atheist/No Religious Preference/Spiritual but Not Religious*: American Community Survey Estimate: NA%, Utah Wellbeing Survey Estimate: 15%

Overall Personal Wellbeing and Overall Wellbeing in Orem

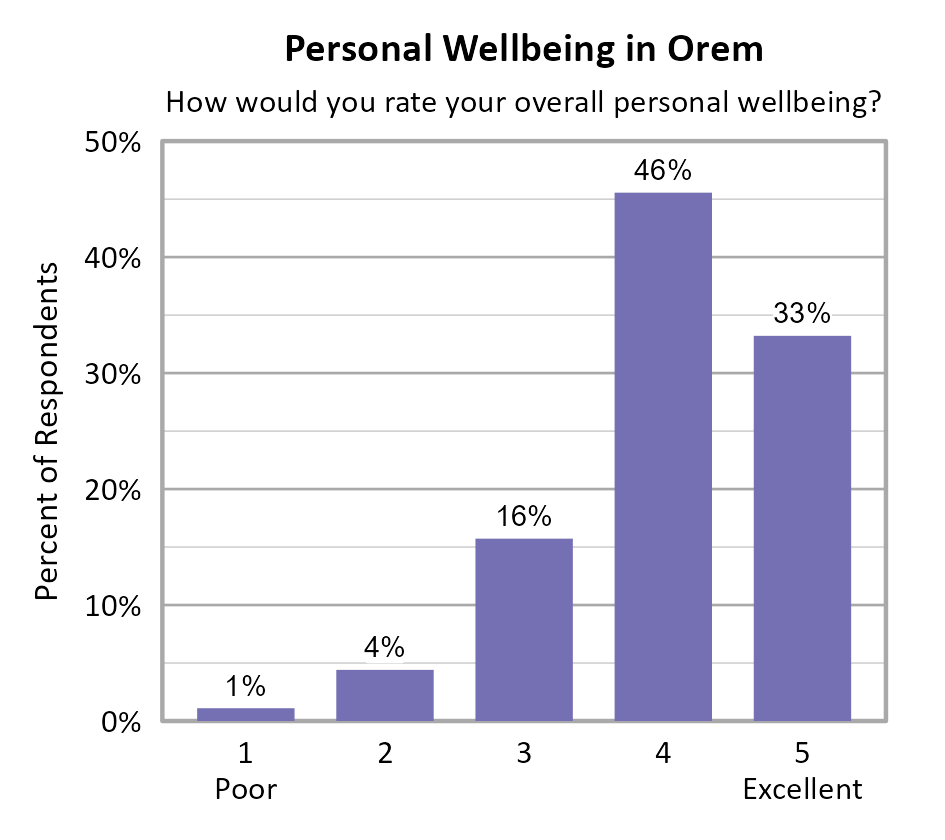
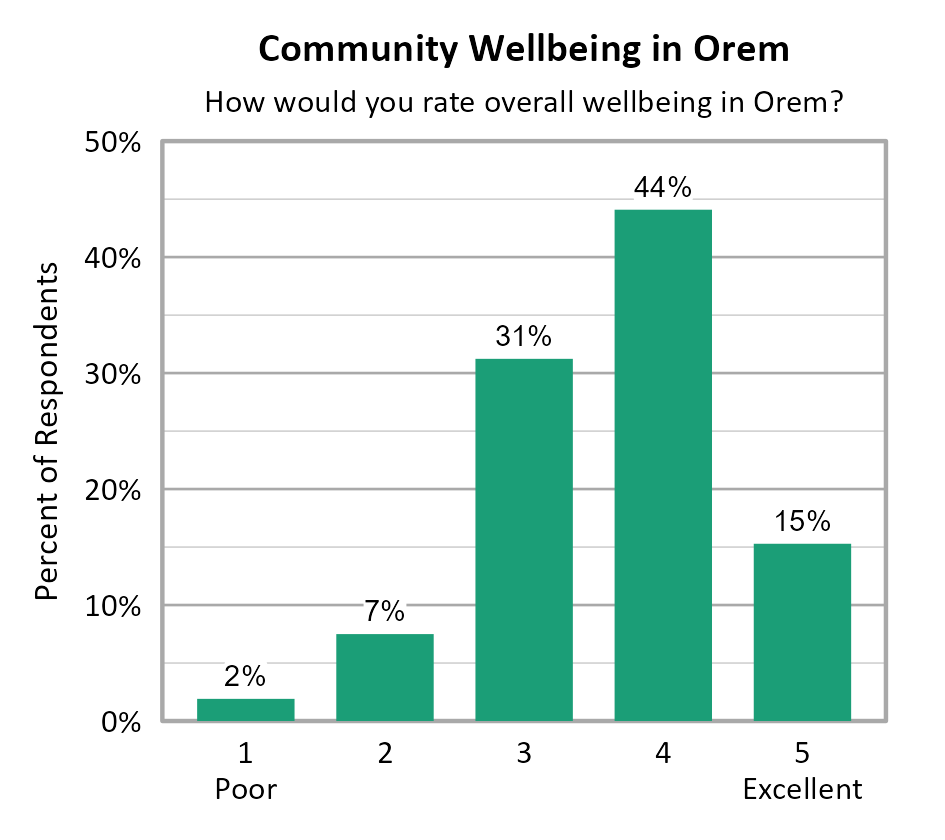
Survey participants were asked about their overall personal wellbeing and overall community wellbeing in Orem. These wellbeing indicators were both measured on a 5-point scale from poor (1) to excellent (5). The average personal wellbeing score in Orem was 4.05 with 79% of respondents indicating their wellbeing at a 4 or 5 on the 5-point scale. The average score for community wellbeing in Orem was 3.63 with 59% of respondents indicating community wellbeing at a 4 or 5 on the 5-point scale. While each of the 9 city neighborhoods (see map at top of webpage) had different personal wellbeing scores, only neighborhood 3 (Northridge, Heatheridge, and Windsor) was found to be statistically higher than neighborhood 2 (Orem North and Sharon Park). No differences were found among the 9 neighborhoods for community wellbeing scores.

Bar Chart. Title: Personal Wellbeing in Orem. Subtitle: How would you rate your overall personal wellbeing? Data — 1 Poor: 1% of respondents; 2: 4% of respondents; 3: 16% of respondents; 4: 46% of respondents; 5 Excellent: 33% of respondents

Bar Chart. Title: Community Wellbeing in Orem. Subtitle: How would you rate overall wellbeing in Orem? Data — 1 Poor: 2% of respondents; 2: 7% of respondents; 3: 31% of respondents; 4: 44% of respondents; 5 Excellent: 15% of respondents

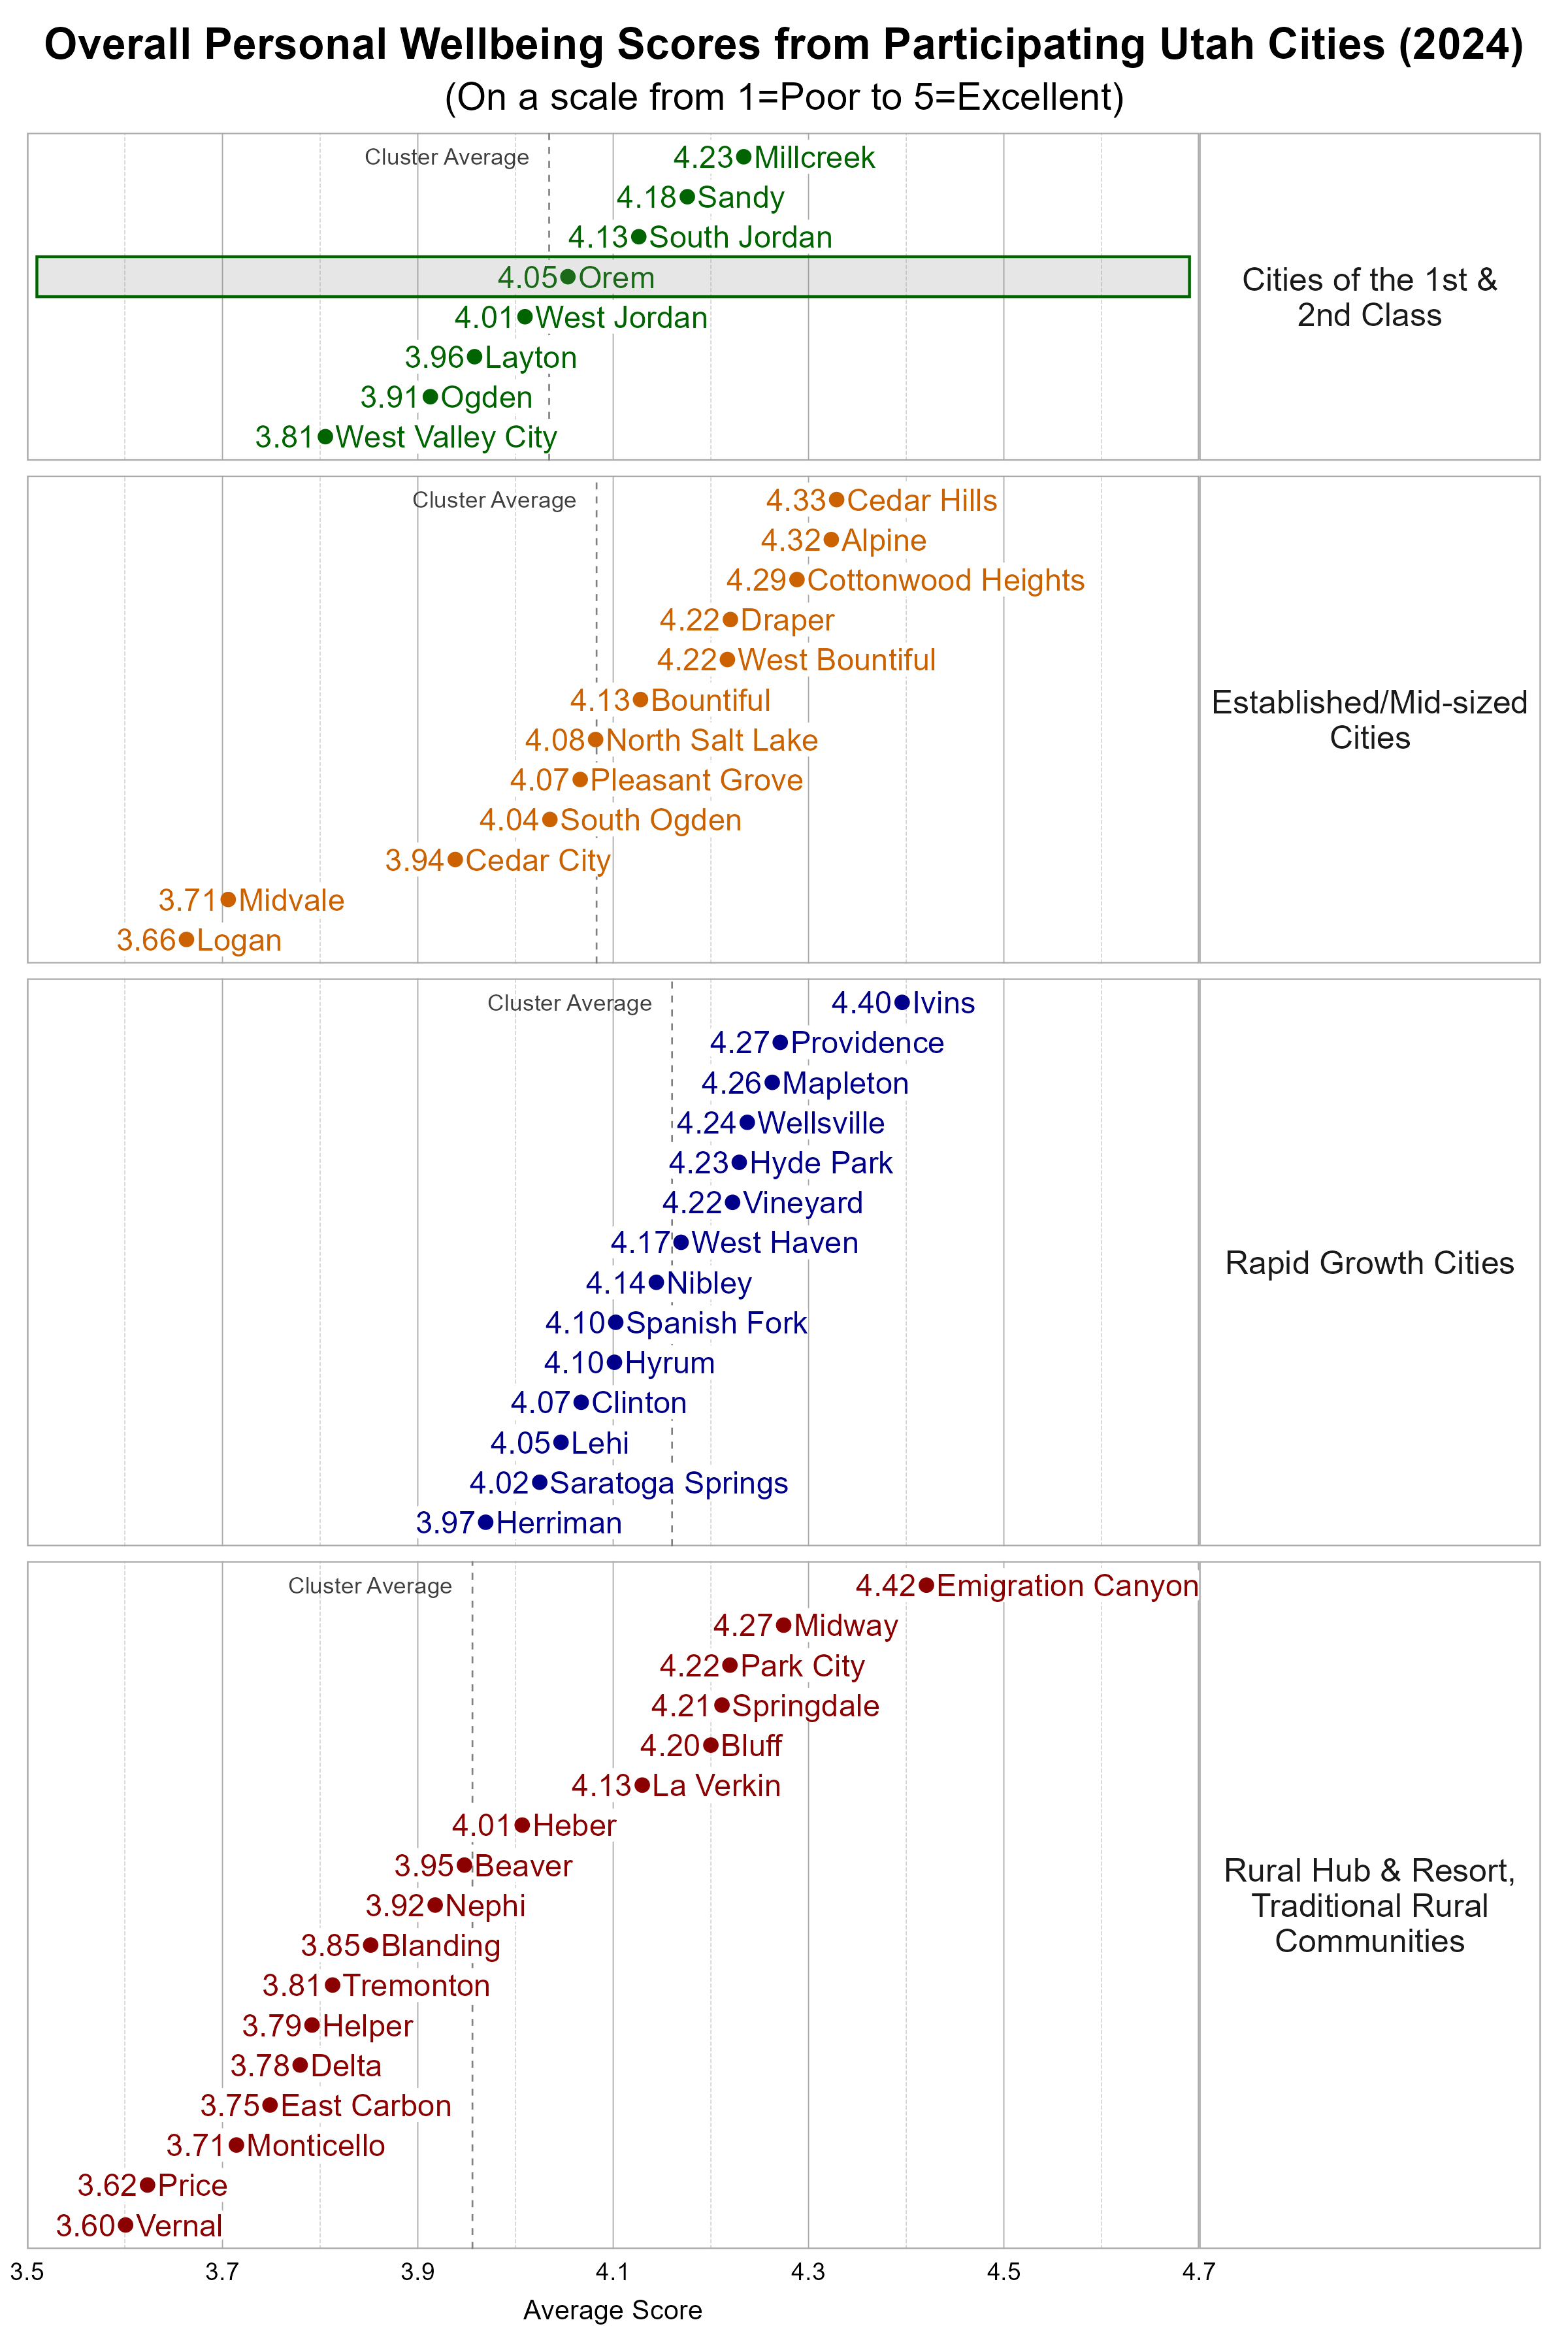
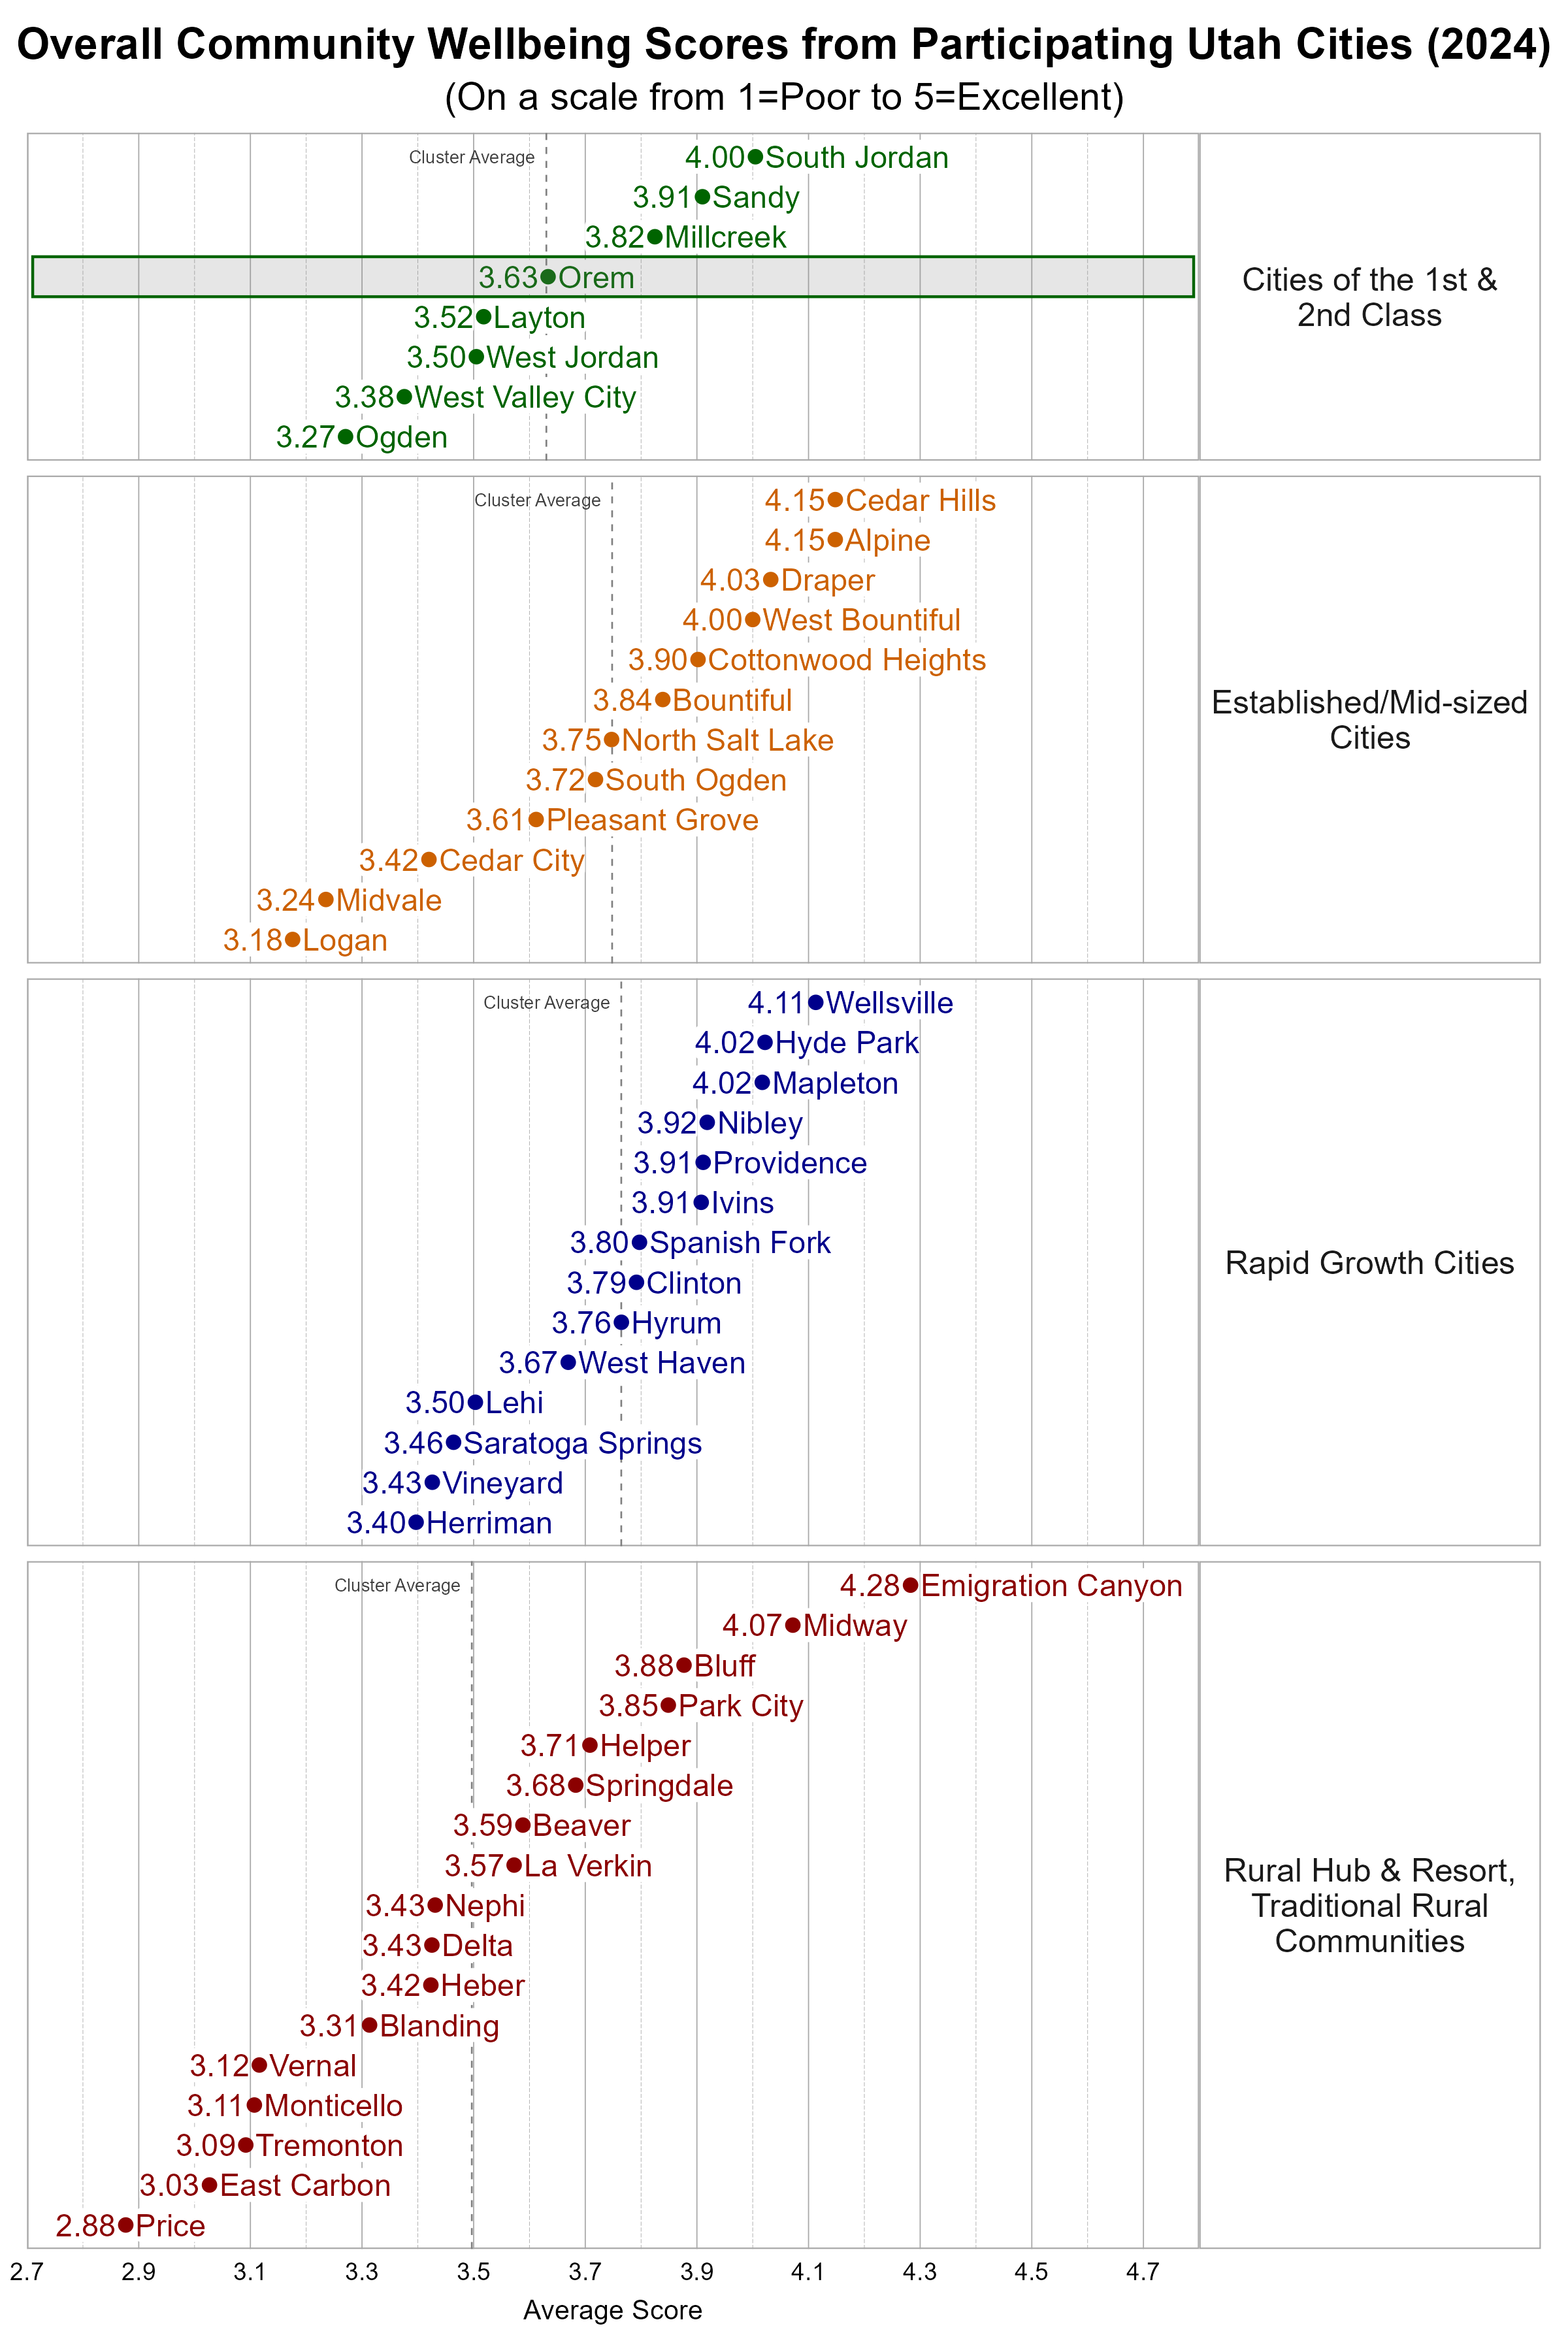
Comparing Wellbeing Across Utah Cities

The Utah League of Cities and Towns clusters cities and towns into five different categories based on size and growth rates. We utilize these clusters in our analysis. Orem is classified as a City of the 1st and 2nd Class. Some cities may fit within more than one cluster.

Within the more Urban city cluster, Orem was close to the average overall personal wellbeing score and close to the average overall community wellbeing score.

Dot Plot. Title: Overall Personal Wellbeing Scores from Participating Utah Cities (2024). Subtitle: (On a scale from 1=Poor to 5=Excellent). Data — Group: Cities of the 1st & 2nd Class — West Valley City Average Score 3.81; Ogden Average Score 3.91; Layton Average Score 3.96; West Jordan Average Score 4.01; Orem Average Score 4.05; South Jordan Average Score 4.13; Sandy Average Score 4.18; Millcreek Average Score 4.23; Group: Established/Mid-sized Cities — Logan Average Score 3.66; Midvale Average Score 3.71; Cedar City Average Score 3.94; South Ogden Average Score 4.04; Pleasant Grove Average Score 4.07; North Salt Lake Average Score 4.08; Bountiful Average Score 4.13; Draper Average Score 4.22; West Bountiful Average Score 4.22; Cottonwood Heights Average Score 4.29; Alpine Average Score 4.32; Cedar Hills Average Score 4.33; Group: Rapid Growth Cities — Herriman Average Score 3.97; Saratoga Springs Average Score 4.02; Lehi Average Score 4.05; Clinton Average Score 4.07; Hyrum Average Score 4.10; Spanish Fork Average Score 4.10; Nibley Average Score 4.14; West Haven Average Score 4.17; Vineyard Average Score 4.22; Hyde Park Average Score 4.23; Wellsville Average Score 4.24; Mapleton Average Score 4.26; Providence Average Score 4.27; Ivins Average Score 4.40; Group: Rural Hub & Resort, Traditional Rural Communities — Vernal Average Score 3.60; Price Average Score 3.62; Monticello Average Score 3.71; East Carbon Average Score 3.75; Delta Average Score 3.78; Helper Average Score 3.79; Tremonton Average Score 3.81; Blanding Average Score 3.85; Nephi Average Score 3.92; Beaver Average Score 3.95; Heber Average Score 4.01; La Verkin Average Score 4.13; Bluff Average Score 4.20; Springdale Average Score 4.21; Park City Average Score 4.22; Midway Average Score 4.27; Emigration Canyon Average Score 4.42

Dot Plot. Title: Overall Community Wellbeing Scores from Participating Utah Cities (2024). Subtitle: (On a scale from 1=Poor to 5=Excellent). Data — Group: Cities of the 1st & 2nd Class — Ogden Average Score 3.27; West Valley City Average Score 3.38; West Jordan Average Score 3.50; Layton Average Score 3.52; Orem Average Score 3.63; Millcreek Average Score 3.82; Sandy Average Score 3.91; South Jordan Average Score 4.00; Group: Established/Mid-sized Cities — Logan Average Score 3.18; Midvale Average Score 3.24; Cedar City Average Score 3.42; Pleasant Grove Average Score 3.61; South Ogden Average Score 3.72; North Salt Lake Average Score 3.75; Bountiful Average Score 3.84; Cottonwood Heights Average Score 3.90; West Bountiful Average Score 4.00; Draper Average Score 4.03; Alpine Average Score 4.15; Cedar Hills Average Score 4.15; Group: Rapid Growth Cities — Herriman Average Score 3.40; Vineyard Average Score 3.43; Saratoga Springs Average Score 3.46; Lehi Average Score 3.50; West Haven Average Score 3.67; Hyrum Average Score 3.76; Clinton Average Score 3.79; Spanish Fork Average Score 3.80; Ivins Average Score 3.91; Providence Average Score 3.91; Nibley Average Score 3.92; Hyde Park Average Score 4.02; Mapleton Average Score 4.02; Wellsville Average Score 4.11; Group: Rural Hub & Resort, Traditional Rural Communities — Price Average Score 2.88; East Carbon Average Score 3.03; Tremonton Average Score 3.09; Monticello Average Score 3.11; Vernal Average Score 3.12; Blanding Average Score 3.31; Heber Average Score 3.42; Delta Average Score 3.43; Nephi Average Score 3.43; La Verkin Average Score 3.57; Beaver Average Score 3.59; Springdale Average Score 3.68; Helper Average Score 3.71; Park City Average Score 3.85; Bluff Average Score 3.88; Midway Average Score 4.07; Emigration Canyon Average Score 4.28

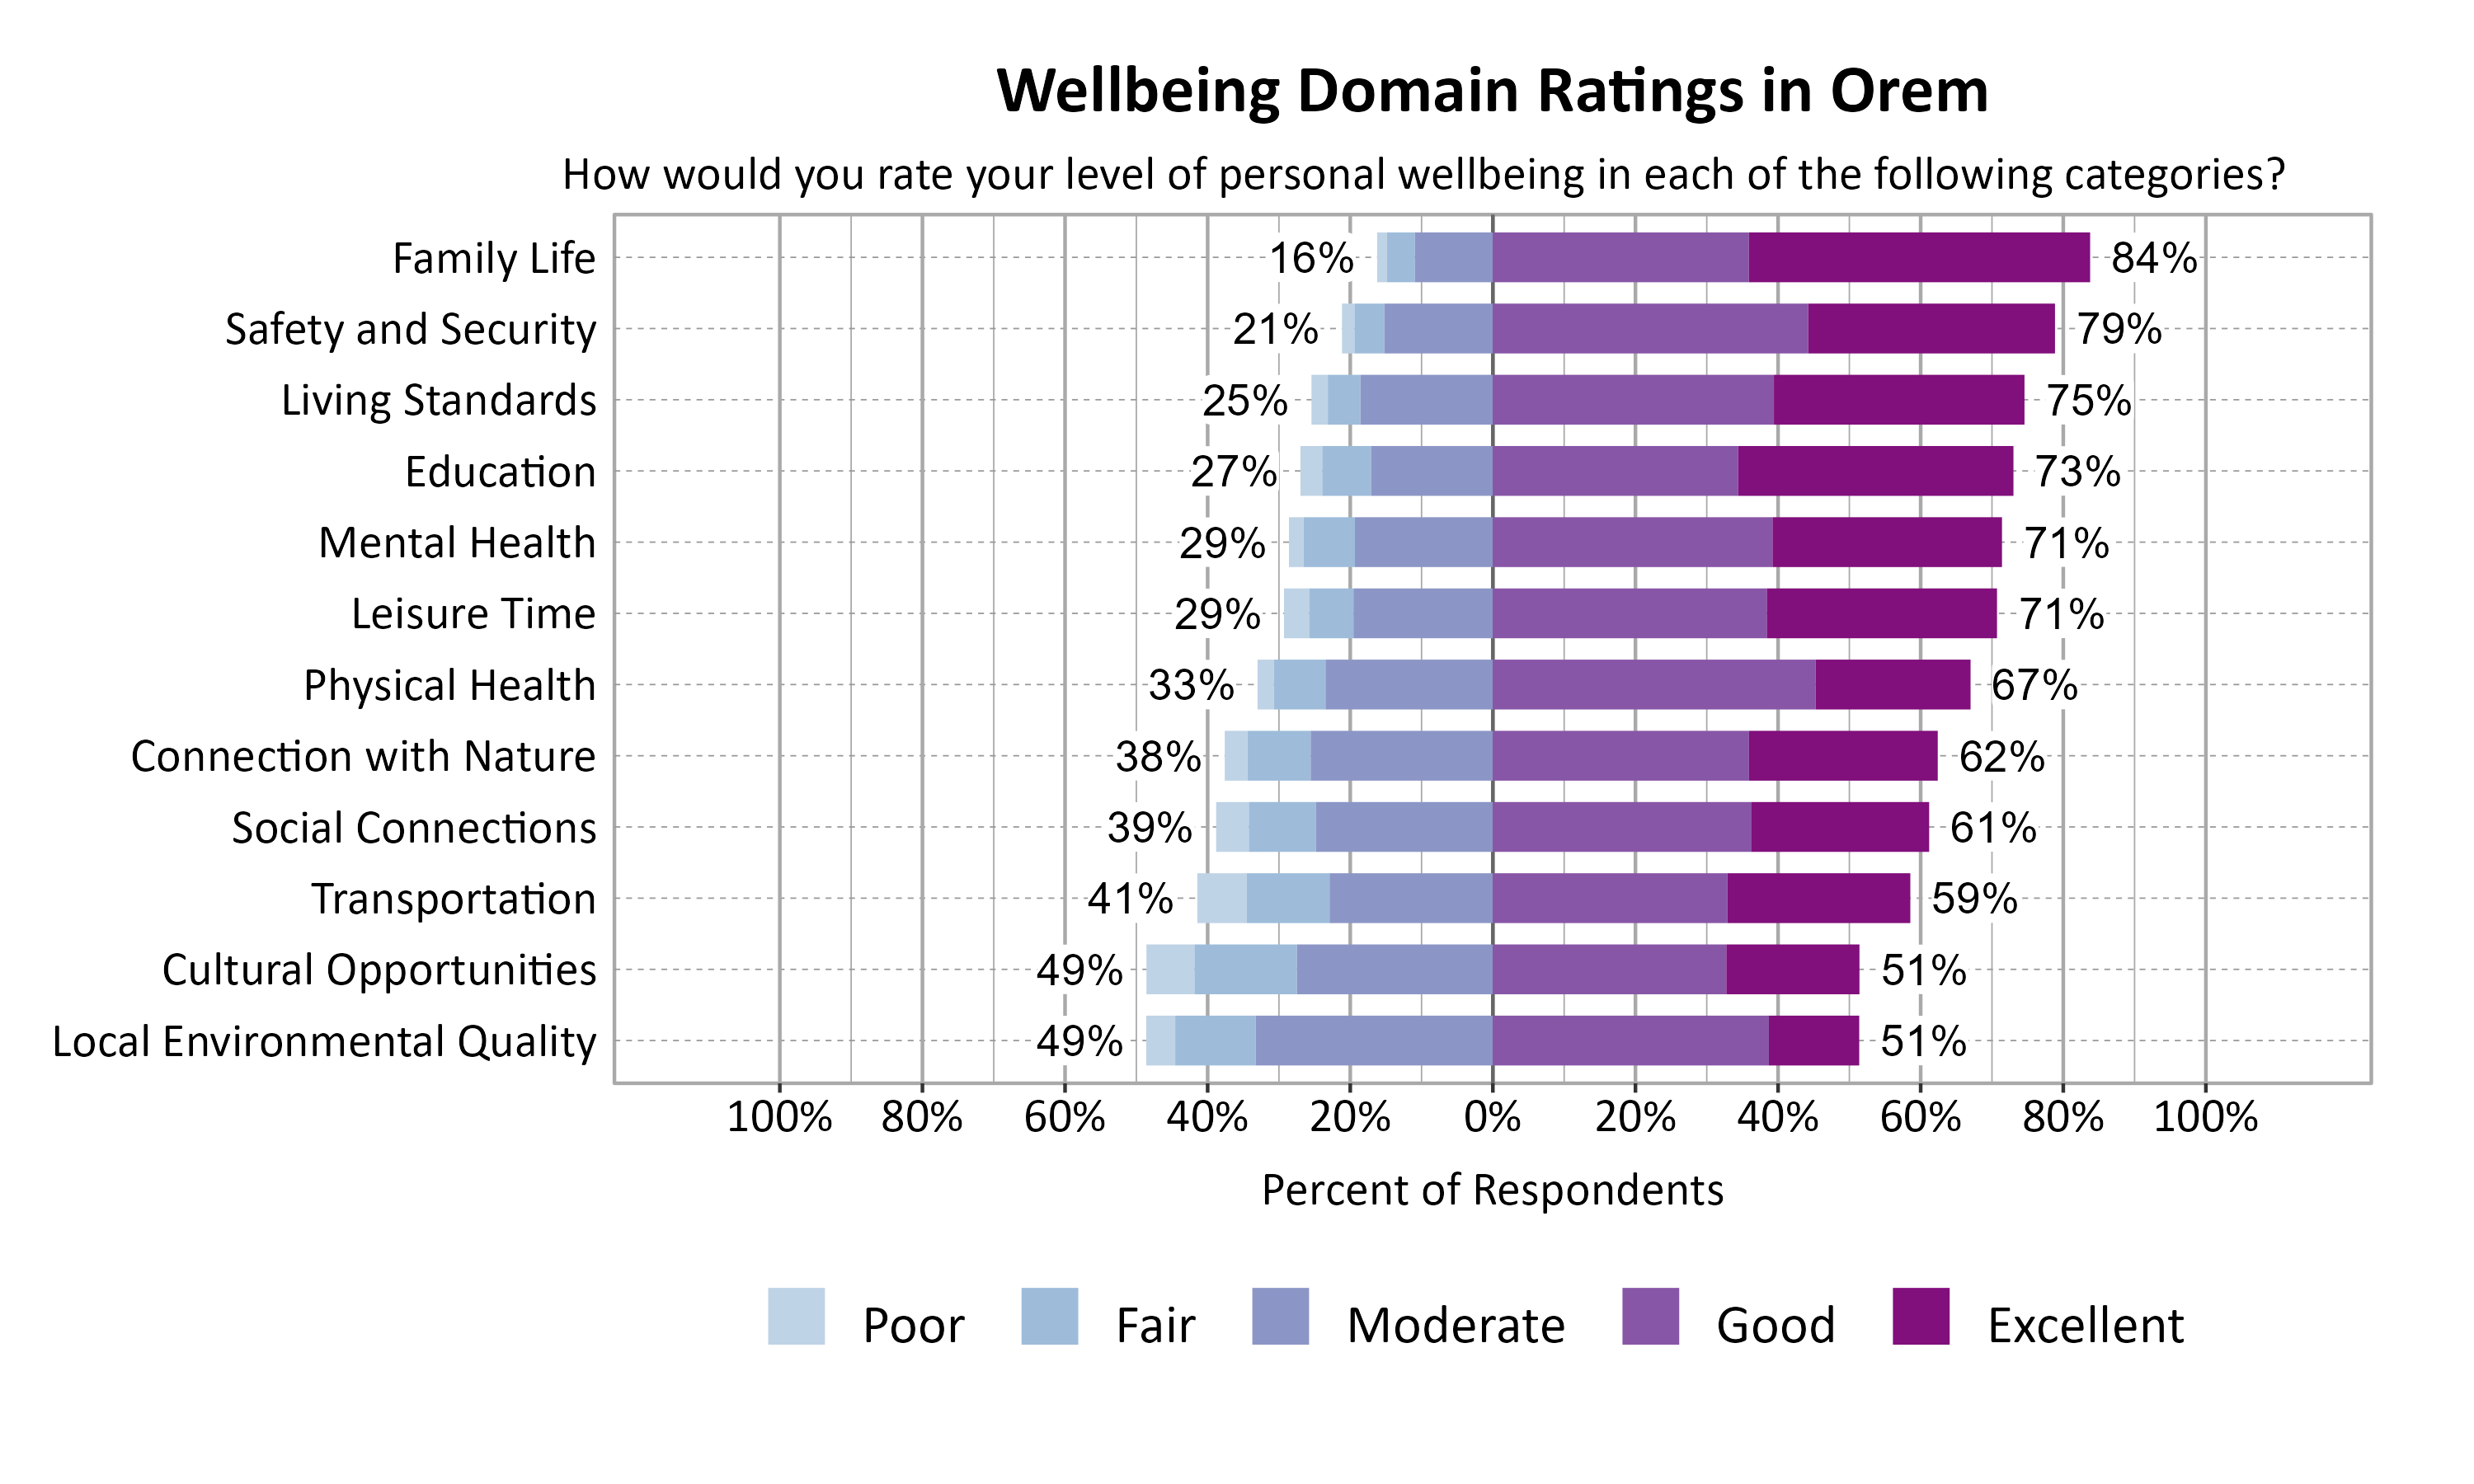
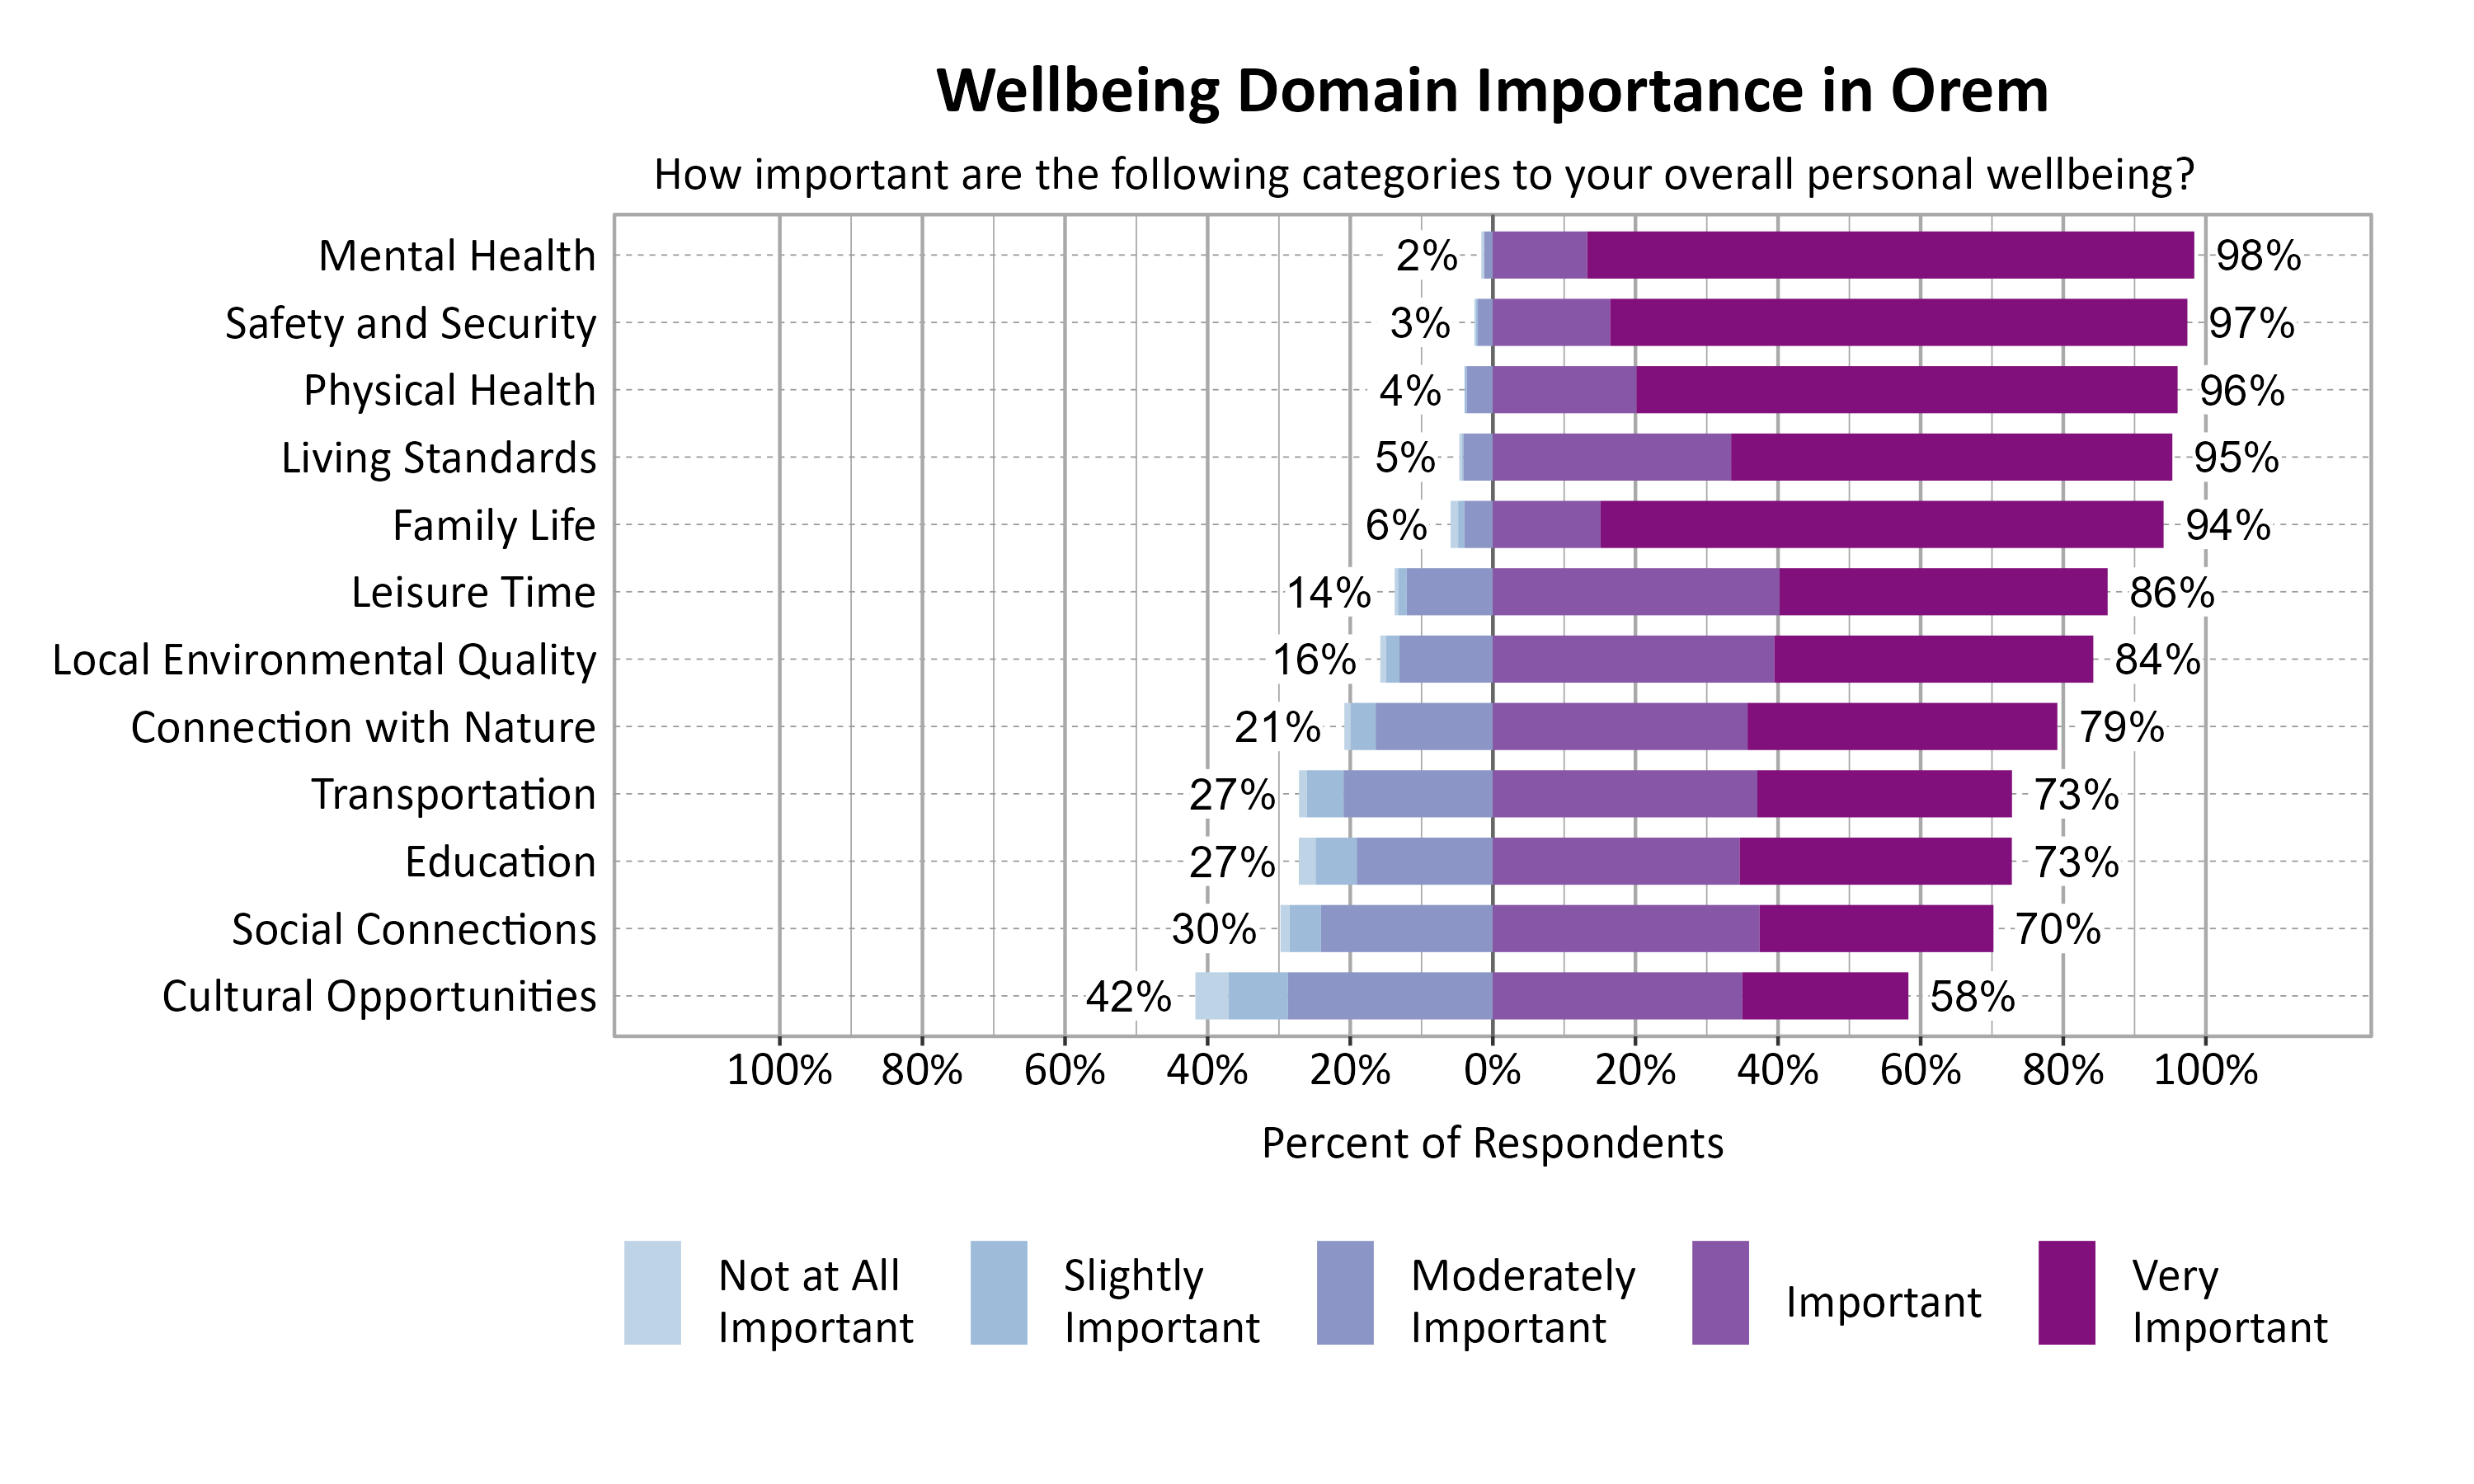
Wellbeing Domains in Orem

According to national and international entities that track wellbeing, there are a number of common dimensions or domains of wellbeing. Survey respondents rated twelve domains on a 5-point scale from poor to excellent. They were also asked to indicate the importance of each domain to their overall personal wellbeing on a 5-point scale from not at all important to very important. The highest rated wellbeing domains for respondents in Orem were Family Life (84%), Safety and Security (79%), and Living Standards (75%). The most important wellbeing domains were Mental Health (98%), Safety and Security (97%), Physical Health (96%), and Living Standards (95%).

Likert Graph. Title: Wellbeing Domain Ratings in Orem. Subtitle: How would you rate your level of personal wellbeing in each of the following categories? Data — Category: Family Life - 16% of respondents rated as poor, fair, or moderate while  84% rated as good or excellent; Category: Safety and Security - 21% of respondents rated as poor, fair, or moderate while  79% rated as good or excellent; Category: Living Standards - 25% of respondents rated as poor, fair, or moderate while  75% rated as good or excellent; Category: Education - 27% of respondents rated as poor, fair, or moderate while  73% rated as good or excellent; Category: Leisure Time - 29% of respondents rated as poor, fair, or moderate while  71% rated as good or excellent; Category: Mental Health - 29% of respondents rated as poor, fair, or moderate while  71% rated as good or excellent; Category: Physical Health - 33% of respondents rated as poor, fair, or moderate while  67% rated as good or excellent; Category: Connection with Nature - 38% of respondents rated as poor, fair, or moderate while  62% rated as good or excellent; Category: Social Connections - 39% of respondents rated as poor, fair, or moderate while  61% rated as good or excellent; Category: Transportation - 41% of respondents rated as poor, fair, or moderate while  59% rated as good or excellent; Category: Cultural Opportunities - 49% of respondents rated as poor, fair, or moderate while  51% rated as good or excellent; Category: Local Environmental Quality - 49% of respondents rated as poor, fair, or moderate while  51% rated as good or excellent Likert Graph. Title: Wellbeing Domain Importance in Orem. Subtitle: How important are the following categories to your overall personal wellbeing? Data — Category: Mental Health - 2% of respondents rated as not at all important, slightly important, or moderately important while 98% rated as important or very important; Category: Safety and Security - 3% of respondents rated as not at all important, slightly important, or moderately important while 97% rated as important or very important; Category: Physical Health - 4% of respondents rated as not at all important, slightly important, or moderately important while 96% rated as important or very important; Category: Living Standards - 5% of respondents rated as not at all important, slightly important, or moderately important while 95% rated as important or very important; Category: Family Life - 6% of respondents rated as not at all important, slightly important, or moderately important while 94% rated as important or very important; Category: Leisure Time -14% of respondents rated as not at all important, slightly important, or moderately important while 86% rated as important or very important; Category: Local Environmental Quality -16% of respondents rated as not at all important, slightly important, or moderately important while 84% rated as important or very important; Category: Connection with Nature -21% of respondents rated as not at all important, slightly important, or moderately important while 79% rated as important or very important; Category: Education -27% of respondents rated as not at all important, slightly important, or moderately important while 73% rated as important or very important; Category: Transportation -27% of respondents rated as not at all important, slightly important, or moderately important while 73% rated as important or very important; Category: Social Connections -30% of respondents rated as not at all important, slightly important, or moderately important while 70% rated as important or very important; Category: Cultural Opportunities -42% of respondents rated as not at all important, slightly important, or moderately important while 58% rated as important or very important

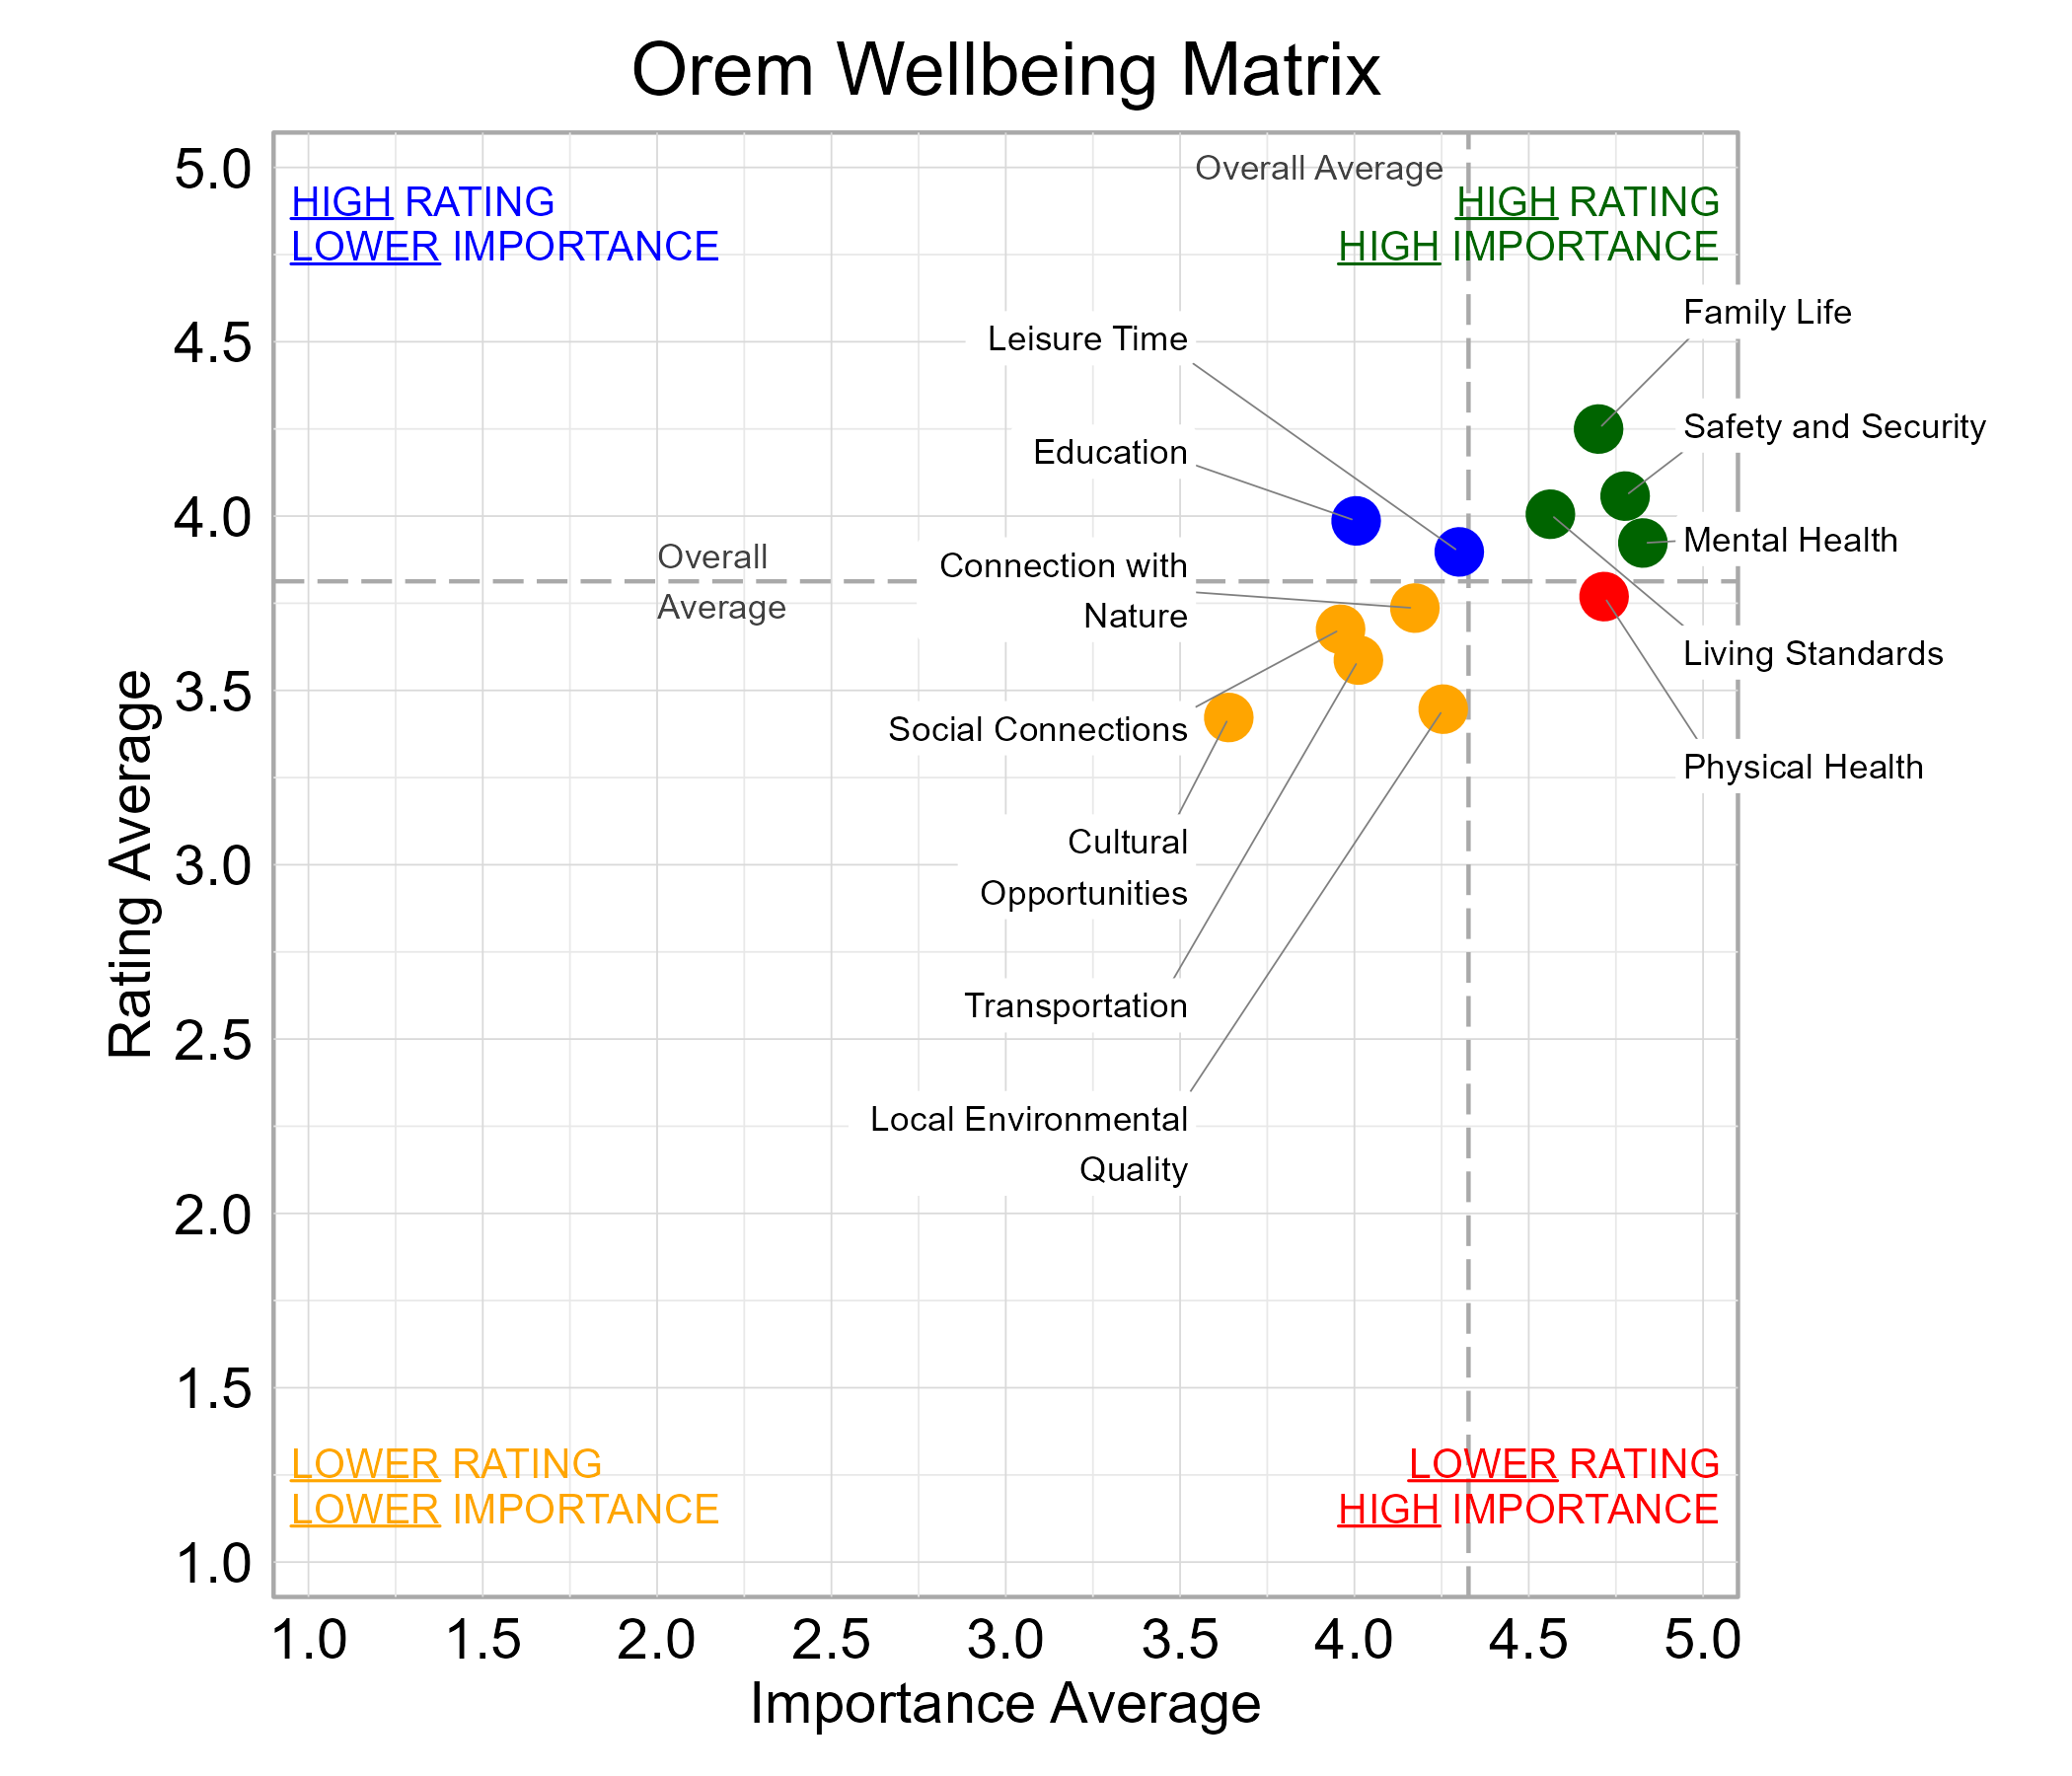
Wellbeing Matrix for Orem

The graph below illustrates the relationship between the average rating and the average importance of wellbeing domains for survey respondents from Orem. Family Life, Living Standards, Mental Health, and Safety and Security were highly important and rated above average among the domains. Physical Health fell in the “red zone” of higher importance and lower ratings.

Scatterplot. Title: Orem Wellbeing Matrix. Subtitle: Domains are classified into four quadrants depending on their average rating and average importance as compared to the average of all the average domain ratings and the average domain importance ratings. Data — High rating, high importance (green quadrant) domains include: Family Life, Living Standards, Mental Health, and Safety and Security; High rating, lower importance (blue quadrant) domains include: Education  and  Leisure Time; Lower rating, lower importance (yellow quadrant) domains include: Connection with Nature, Cultural Opportunities, Local Environmental Quality, Social Connections, and Transportation; Lower rating, high importance (red quadrant) domains include: Physical Health

Community Connection in Orem

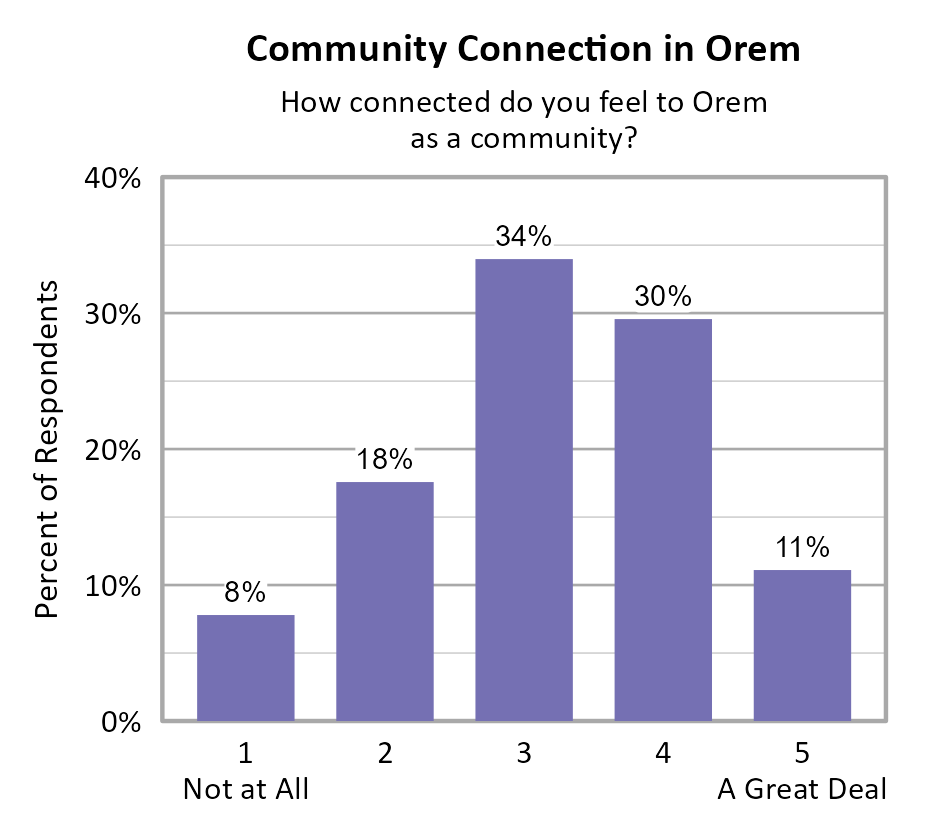
Survey participants were asked about how connected they feel to Orem on a 5-point scale from not at all (1) to a great deal (5), and the average score of all respondents was 3.19. Neighborhood 1 (Canyon View, Orchard, and Cascade) had statistically higher community connection scores than neighborhoods 2 (Orem North, Sharon Park), 4 (Aspen and Timpview), and 5 (Geneva Heights, Suncrest, and Orem Park).

Bar Chart. Title: Community Connection in Orem. Subtitle: How connected do you feel to Orem as a community? Data — 1 Not at All: 8% of respondents; 2: 18% of respondents; 3: 34% of respondents; 4: 30% of respondents; 5 A Great Deal: 11% of respondents

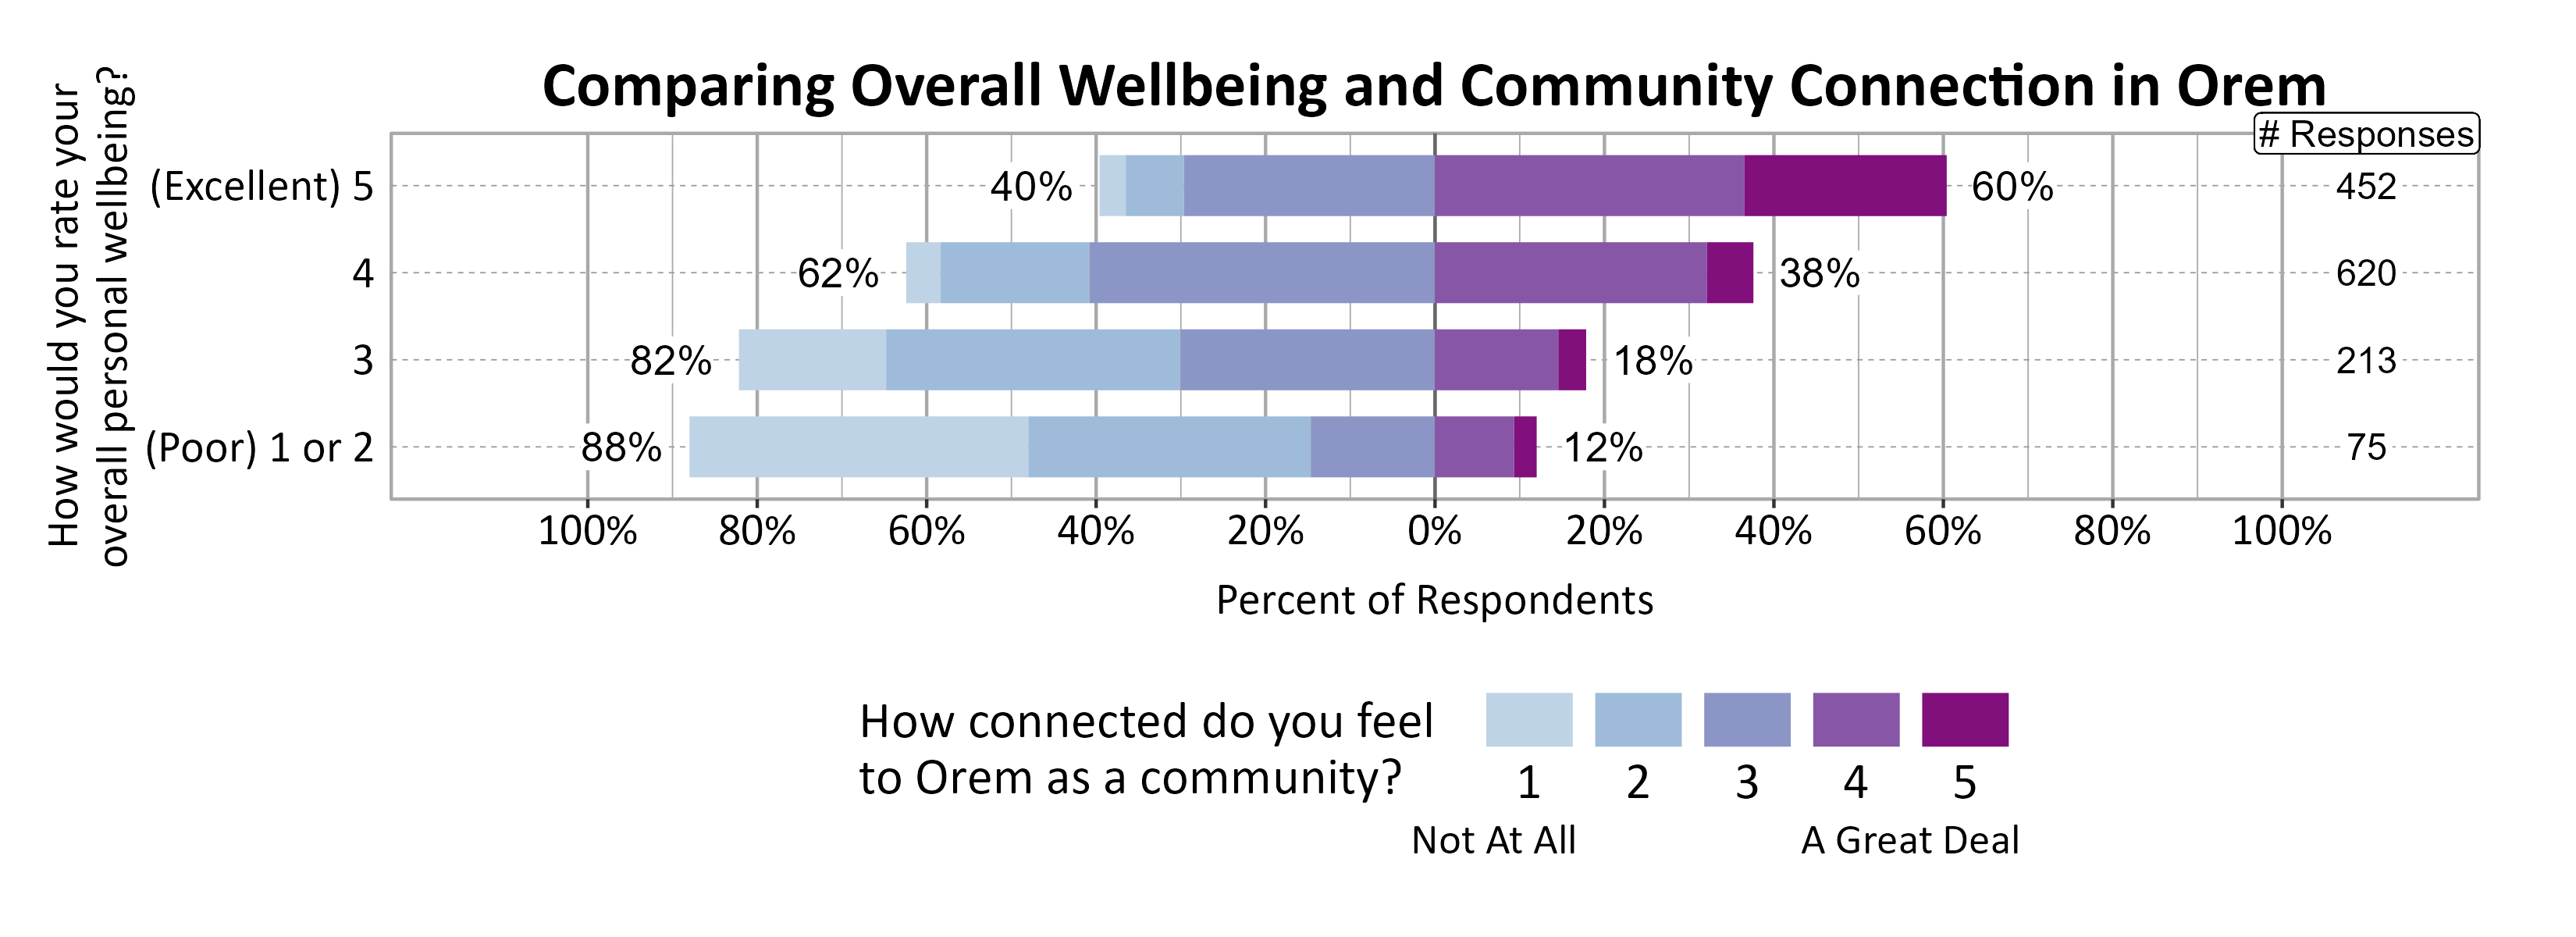
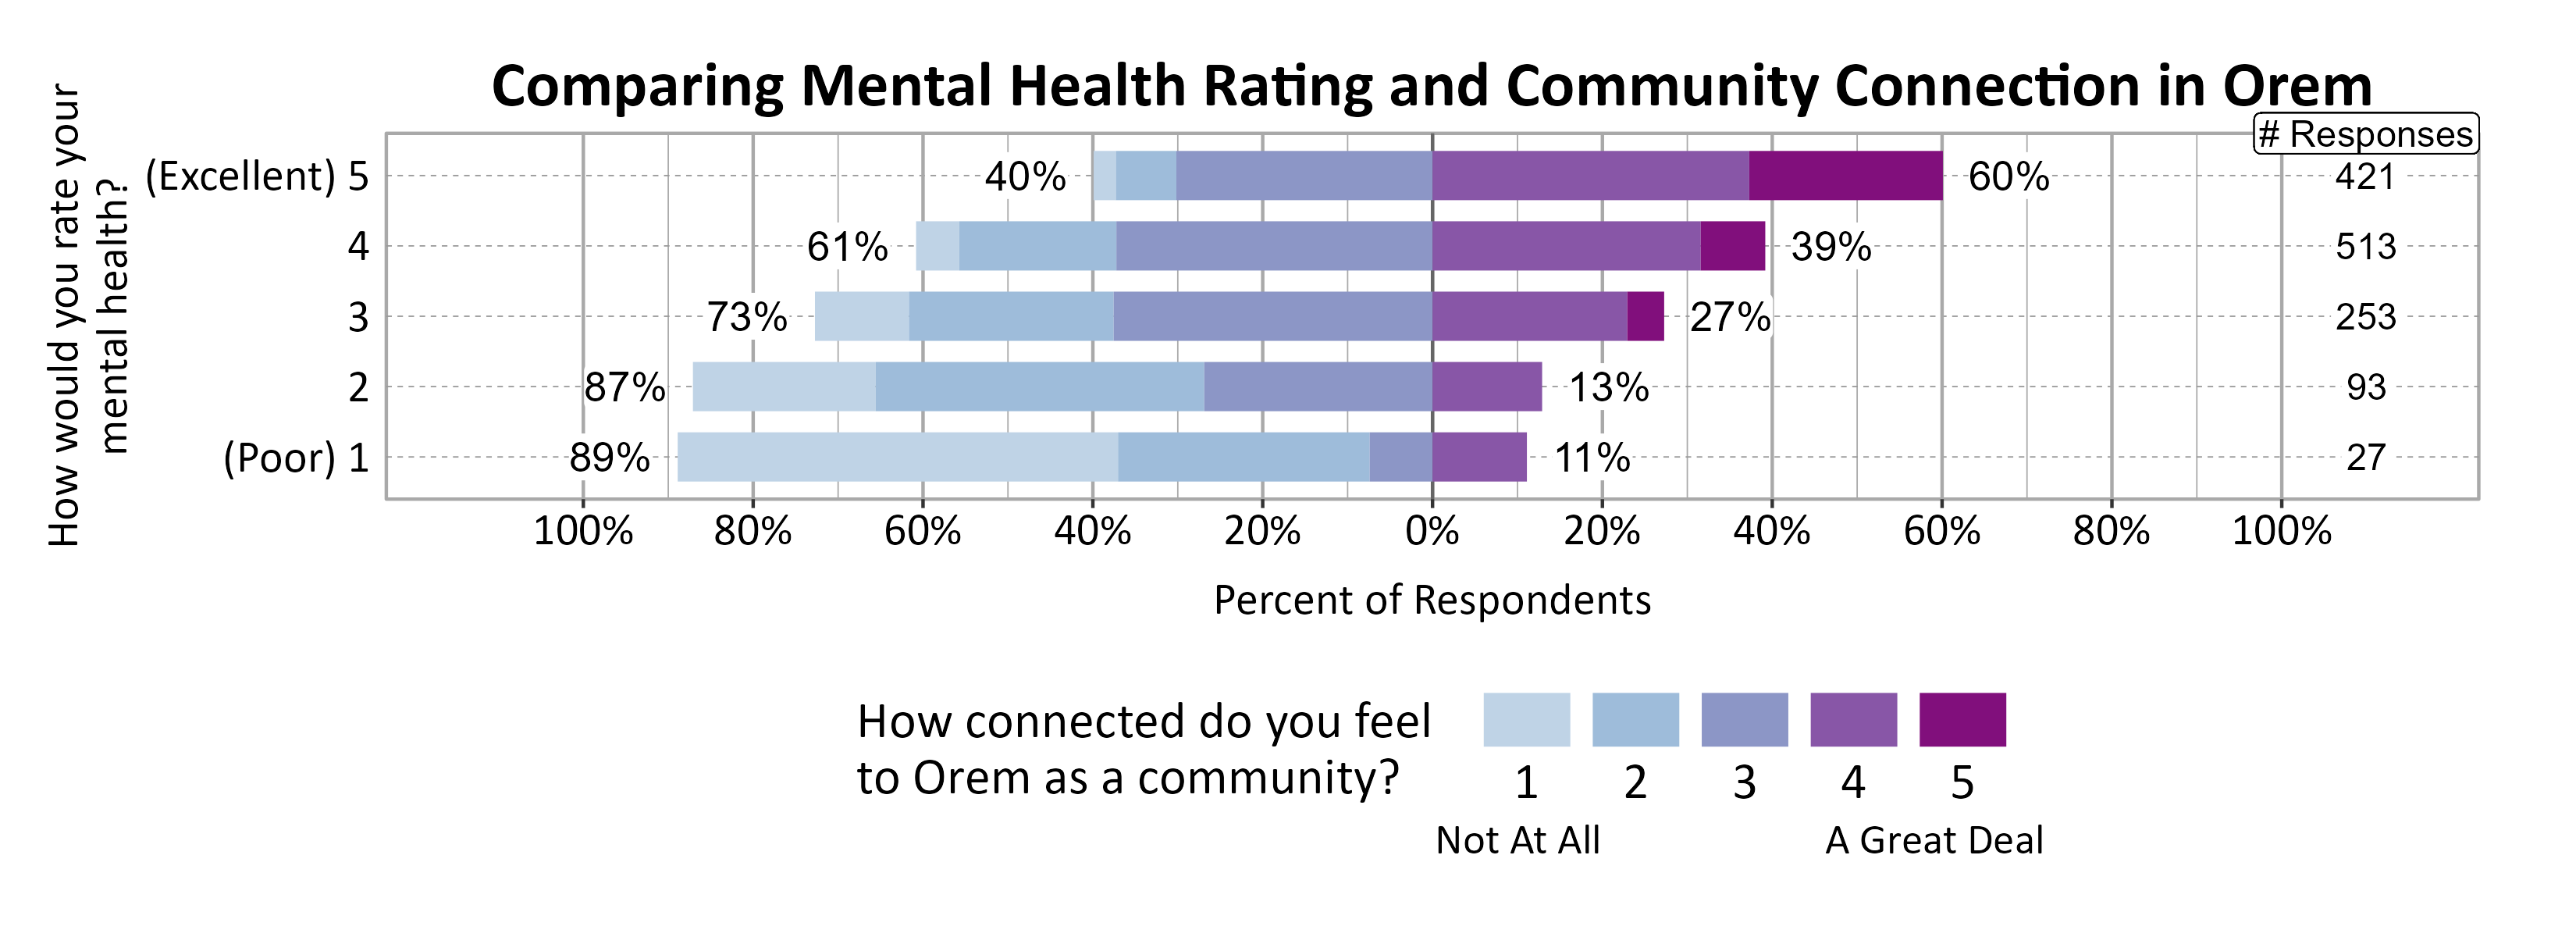
A positive relationship was found between individuals’ community connection and overall personal wellbeing as well as mental health.

Likert Graph. Title: Comparing Overall Wellbeing and Community Connection in Orem. Data — Of the 75 respondents that rate their overall personal wellbeing as a (Poor) 1 or 2, 88% indicate a community connection score of 1, 2, or 3 while 12% indicate a community connection score of 4 or 5; Of the 213 respondents that rate their overall personal wellbeing as a 3, 82% indicate a community connection score of 1, 2, or 3 while 18% indicate a community connection score of 4 or 5; Of the 620 respondents that rate their overall personal wellbeing as a 4, 62% indicate a community connection score of 1, 2, or 3 while 38% indicate a community connection score of 4 or 5; Of the 452 respondents that rate their overall personal wellbeing as a (Excellent) 5, 40% indicate a community connection score of 1, 2, or 3 while 60% indicate a community connection score of 4 or 5

Likert Graph. Title: Comparing Mental Health Rating and Community Connection in Orem. Data — Of the 27 respondents that rate their mental health rating as a (Poor) 1, 89% indicate a community connection score of 1, 2, or 3 while 11% indicate a community connection score of 4 or 5; Of the 93 respondents that rate their mental health rating as a 2, 87% indicate a community connection score of 1, 2, or 3 while 13% indicate a community connection score of 4 or 5; Of the 253 respondents that rate their mental health rating as a 3, 73% indicate a community connection score of 1, 2, or 3 while 27% indicate a community connection score of 4 or 5; Of the 513 respondents that rate their mental health rating as a 4, 61% indicate a community connection score of 1, 2, or 3 while 39% indicate a community connection score of 4 or 5; Of the 421 respondents that rate their mental health rating as a (Excellent) 5, 40% indicate a community connection score of 1, 2, or 3 while 60% indicate a community connection score of 4 or 5

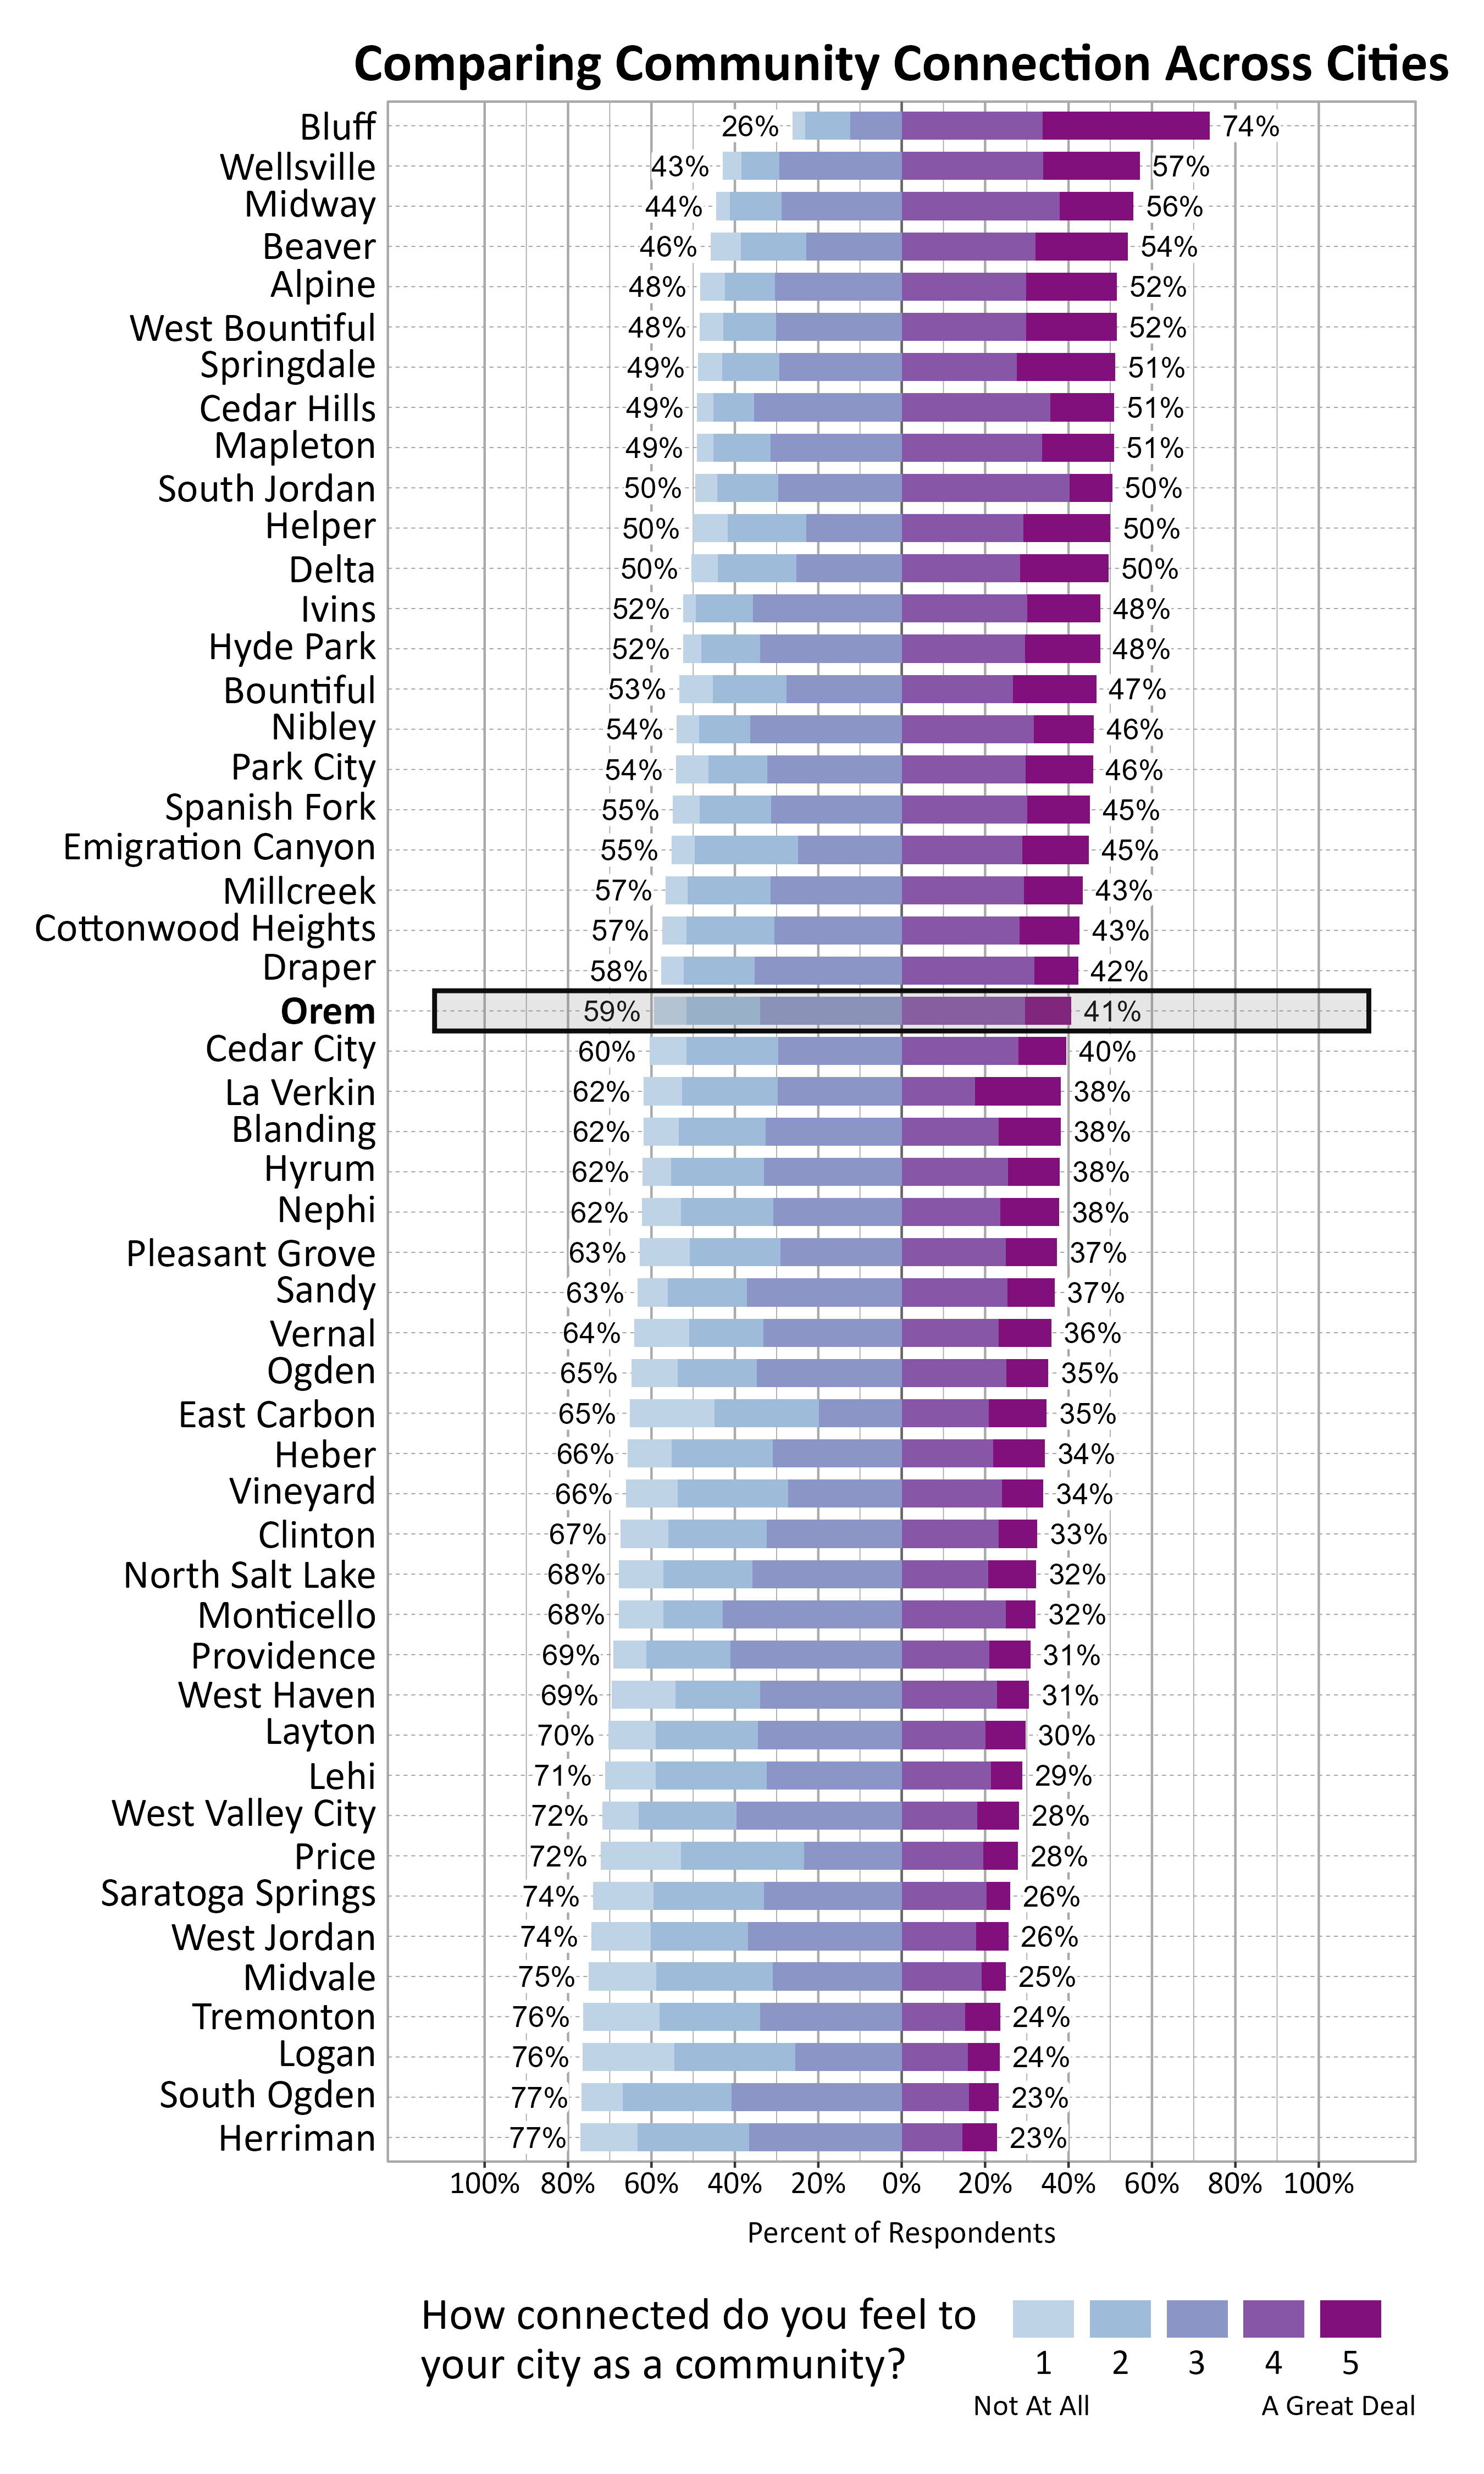
The graph below shows how Wellbeing Project cities and towns compare on feelings of community connection based on the percentage of respondents who answered 4 or a 5 on a 5-point scale from “not at all” to “a great deal” connected to their city or town. Orem ranked 23 out of the 51 cities that participated.

Likert Graph. Title: Comparing Community Connection Across Cities. Subtitle: How connected do you feel to your city as a community? 1 being not at all and 5 being a great deal. Data — City: Bluff 26% of respondents indicated a community connection score of 1, 2, or 3 while 74% of respondents indicated a community connection score of 4 or 5; City: Wellsville 43% of respondents indicated a community connection score of 1, 2, or 3 while 57% of respondents indicated a community connection score of 4 or 5; City: Midway 44% of respondents indicated a community connection score of 1, 2, or 3 while 56% of respondents indicated a community connection score of 4 or 5; City: Beaver 46% of respondents indicated a community connection score of 1, 2, or 3 while 54% of respondents indicated a community connection score of 4 or 5; City: Alpine 48% of respondents indicated a community connection score of 1, 2, or 3 while 52% of respondents indicated a community connection score of 4 or 5; City: West Bountiful 48% of respondents indicated a community connection score of 1, 2, or 3 while 52% of respondents indicated a community connection score of 4 or 5; City: Springdale 49% of respondents indicated a community connection score of 1, 2, or 3 while 51% of respondents indicated a community connection score of 4 or 5; City: Cedar Hills 49% of respondents indicated a community connection score of 1, 2, or 3 while 51% of respondents indicated a community connection score of 4 or 5; City: Mapleton 49% of respondents indicated a community connection score of 1, 2, or 3 while 51% of respondents indicated a community connection score of 4 or 5; City: South Jordan 50% of respondents indicated a community connection score of 1, 2, or 3 while 50% of respondents indicated a community connection score of 4 or 5; City: Helper 50% of respondents indicated a community connection score of 1, 2, or 3 while 50% of respondents indicated a community connection score of 4 or 5; City: Delta 50% of respondents indicated a community connection score of 1, 2, or 3 while 50% of respondents indicated a community connection score of 4 or 5; City: Ivins 52% of respondents indicated a community connection score of 1, 2, or 3 while 48% of respondents indicated a community connection score of 4 or 5; City: Hyde Park 52% of respondents indicated a community connection score of 1, 2, or 3 while 48% of respondents indicated a community connection score of 4 or 5; City: Bountiful 53% of respondents indicated a community connection score of 1, 2, or 3 while 47% of respondents indicated a community connection score of 4 or 5; City: Nibley 54% of respondents indicated a community connection score of 1, 2, or 3 while 46% of respondents indicated a community connection score of 4 or 5; City: Park City 54% of respondents indicated a community connection score of 1, 2, or 3 while 46% of respondents indicated a community connection score of 4 or 5; City: Spanish Fork 55% of respondents indicated a community connection score of 1, 2, or 3 while 45% of respondents indicated a community connection score of 4 or 5; City: Emigration Canyon 55% of respondents indicated a community connection score of 1, 2, or 3 while 45% of respondents indicated a community connection score of 4 or 5; City: Millcreek 57% of respondents indicated a community connection score of 1, 2, or 3 while 43% of respondents indicated a community connection score of 4 or 5; City: Cottonwood Heights 57% of respondents indicated a community connection score of 1, 2, or 3 while 43% of respondents indicated a community connection score of 4 or 5; City: Draper 58% of respondents indicated a community connection score of 1, 2, or 3 while 42% of respondents indicated a community connection score of 4 or 5; City: Orem 59% of respondents indicated a community connection score of 1, 2, or 3 while 41% of respondents indicated a community connection score of 4 or 5; City: Cedar City 60% of respondents indicated a community connection score of 1, 2, or 3 while 40% of respondents indicated a community connection score of 4 or 5; City: La Verkin 62% of respondents indicated a community connection score of 1, 2, or 3 while 38% of respondents indicated a community connection score of 4 or 5; City: Blanding 62% of respondents indicated a community connection score of 1, 2, or 3 while 38% of respondents indicated a community connection score of 4 or 5; City: Hyrum 62% of respondents indicated a community connection score of 1, 2, or 3 while 38% of respondents indicated a community connection score of 4 or 5; City: Nephi 62% of respondents indicated a community connection score of 1, 2, or 3 while 38% of respondents indicated a community connection score of 4 or 5; City: Pleasant Grove 63% of respondents indicated a community connection score of 1, 2, or 3 while 37% of respondents indicated a community connection score of 4 or 5; City: Sandy 63% of respondents indicated a community connection score of 1, 2, or 3 while 37% of respondents indicated a community connection score of 4 or 5; City: Vernal 64% of respondents indicated a community connection score of 1, 2, or 3 while 36% of respondents indicated a community connection score of 4 or 5; City: Ogden 65% of respondents indicated a community connection score of 1, 2, or 3 while 35% of respondents indicated a community connection score of 4 or 5; City: East Carbon 65% of respondents indicated a community connection score of 1, 2, or 3 while 35% of respondents indicated a community connection score of 4 or 5; City: Heber 66% of respondents indicated a community connection score of 1, 2, or 3 while 34% of respondents indicated a community connection score of 4 or 5; City: Vineyard 66% of respondents indicated a community connection score of 1, 2, or 3 while 34% of respondents indicated a community connection score of 4 or 5; City: Clinton 67% of respondents indicated a community connection score of 1, 2, or 3 while 33% of respondents indicated a community connection score of 4 or 5; City: North Salt Lake 68% of respondents indicated a community connection score of 1, 2, or 3 while 32% of respondents indicated a community connection score of 4 or 5; City: Monticello 68% of respondents indicated a community connection score of 1, 2, or 3 while 32% of respondents indicated a community connection score of 4 or 5; City: Providence 69% of respondents indicated a community connection score of 1, 2, or 3 while 31% of respondents indicated a community connection score of 4 or 5; City: West Haven 69% of respondents indicated a community connection score of 1, 2, or 3 while 31% of respondents indicated a community connection score of 4 or 5; City: Layton 70% of respondents indicated a community connection score of 1, 2, or 3 while 30% of respondents indicated a community connection score of 4 or 5; City: Lehi 71% of respondents indicated a community connection score of 1, 2, or 3 while 29% of respondents indicated a community connection score of 4 or 5; City: West Valley City 72% of respondents indicated a community connection score of 1, 2, or 3 while 28% of respondents indicated a community connection score of 4 or 5; City: Price 72% of respondents indicated a community connection score of 1, 2, or 3 while 28% of respondents indicated a community connection score of 4 or 5; City: Saratoga Springs 74% of respondents indicated a community connection score of 1, 2, or 3 while 26% of respondents indicated a community connection score of 4 or 5; City: West Jordan 74% of respondents indicated a community connection score of 1, 2, or 3 while 26% of respondents indicated a community connection score of 4 or 5; City: Midvale 75% of respondents indicated a community connection score of 1, 2, or 3 while 25% of respondents indicated a community connection score of 4 or 5; City: Tremonton 76% of respondents indicated a community connection score of 1, 2, or 3 while 24% of respondents indicated a community connection score of 4 or 5; City: Logan 76% of respondents indicated a community connection score of 1, 2, or 3 while 24% of respondents indicated a community connection score of 4 or 5; City: South Ogden 77% of respondents indicated a community connection score of 1, 2, or 3 while 23% of respondents indicated a community connection score of 4 or 5; City: Herriman 77% of respondents indicated a community connection score of 1, 2, or 3 while 23% of respondents indicated a community connection score of 4 or 5

Participation in Recreation and Nature-Related Activities

Respondents were asked to indicate whether or not they participated in various activities in the last 12 months. The most popular activities were walking or biking in your neighborhood or city (93%), recreating in parks in your city (85%), gardening at home (78%), and community events (76%).

Bar Graph. Title: Participation in Recreation and Nature-Based Activities in Orem. Subtitle: Have you participated in any of the following activities during the past 12 months? Data — 93% of respondents indicated yes to Walking or biking in your neighborhood or city; 85% of respondents indicated yes to Recreating in parks in your city; 78% of respondents indicated yes to Gardening at home; 76% of respondents indicated yes to Community events; 73% of respondents indicated yes to Using trails in or near your city; 63% of respondents indicated yes to Non-motorized recreation on public lands or waters in Utah; 55% of respondents indicated yes to Buying food from a farmer's market; 47% of respondents indicated yes to City recreation programs; 29% of respondents indicated yes to Motorized recreation on public lands or waters in Utah; 2% of respondents indicated yes to Participating in a community garden

All of the recreation activities above, except for buying food from a farmer's market and participating in a community garden, were significantly related to higher ratings of personal wellbeing.

None of the recreation activities above were significantly related to higher ratings of community wellbeing.

Participating in city recreation programs, participating in community events, gardening at home, motorized recreation on public lands or waters in Utah, and recreating in parks in your city were significantly related to higher ratings of community connection.

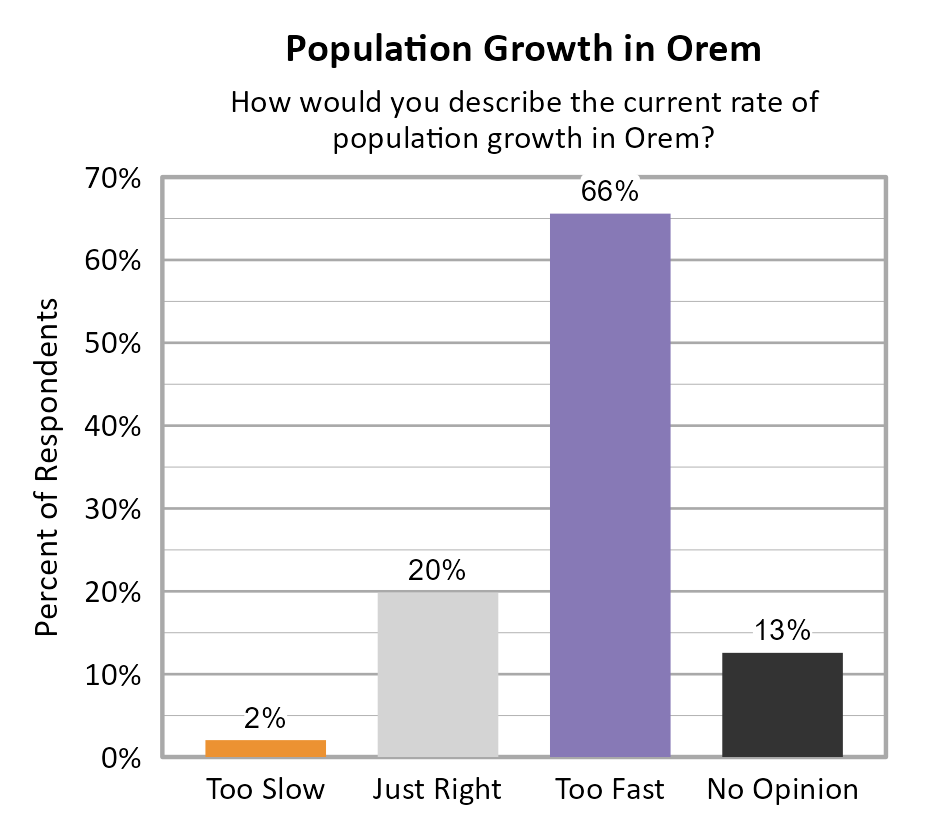
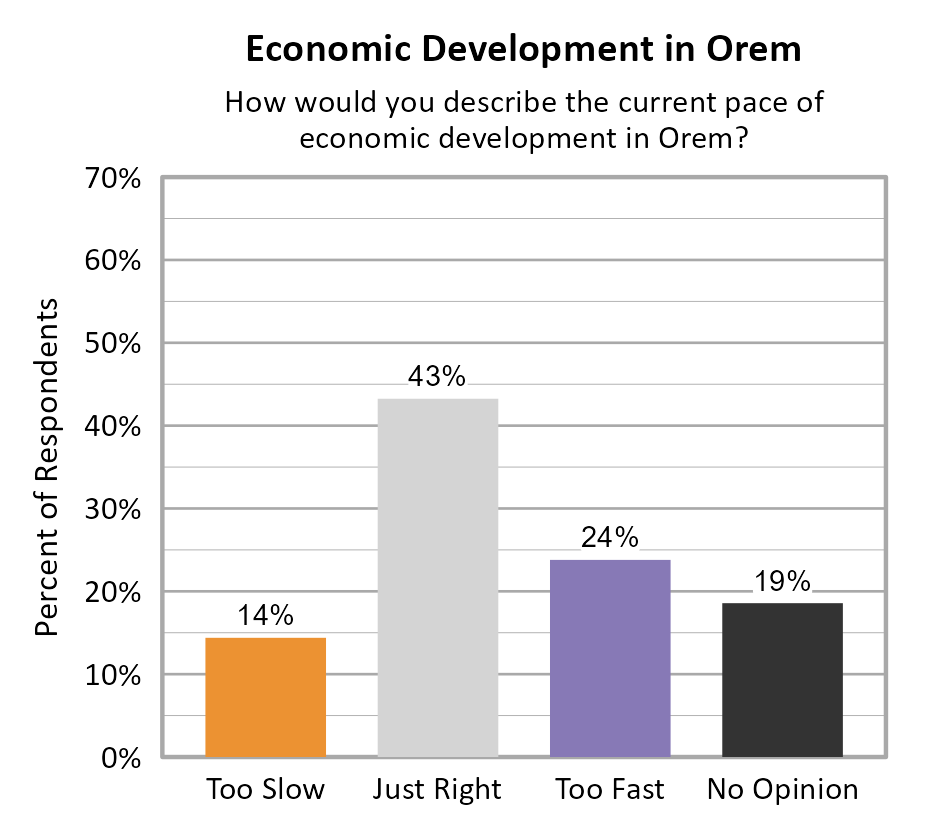
Perspectives on Population Growth and Economic Development

The majority of respondents in Orem indicated that they felt the population growth was too fast (66%). For the pace of economic development, the largest proportion of respondents indicated that it was just right (43%).

Bar Chart. Title: Population Growth in Orem. Subtitle: How would you describe the current rate of population growth in Orem? Data — Too Slow: 2% of respondents; Just Right: 20% of respondents; Too Fast: 66% of respondents; No Opinion: 13% of respondents

Bar Chart. Title: Economic Development in Orem. Subtitle: How would you describe the current pace of economic development in Orem? Data — Too Slow: 14% of respondents; Just Right: 43% of respondents; Too Fast: 24% of respondents; No Opinion: 19% of respondents

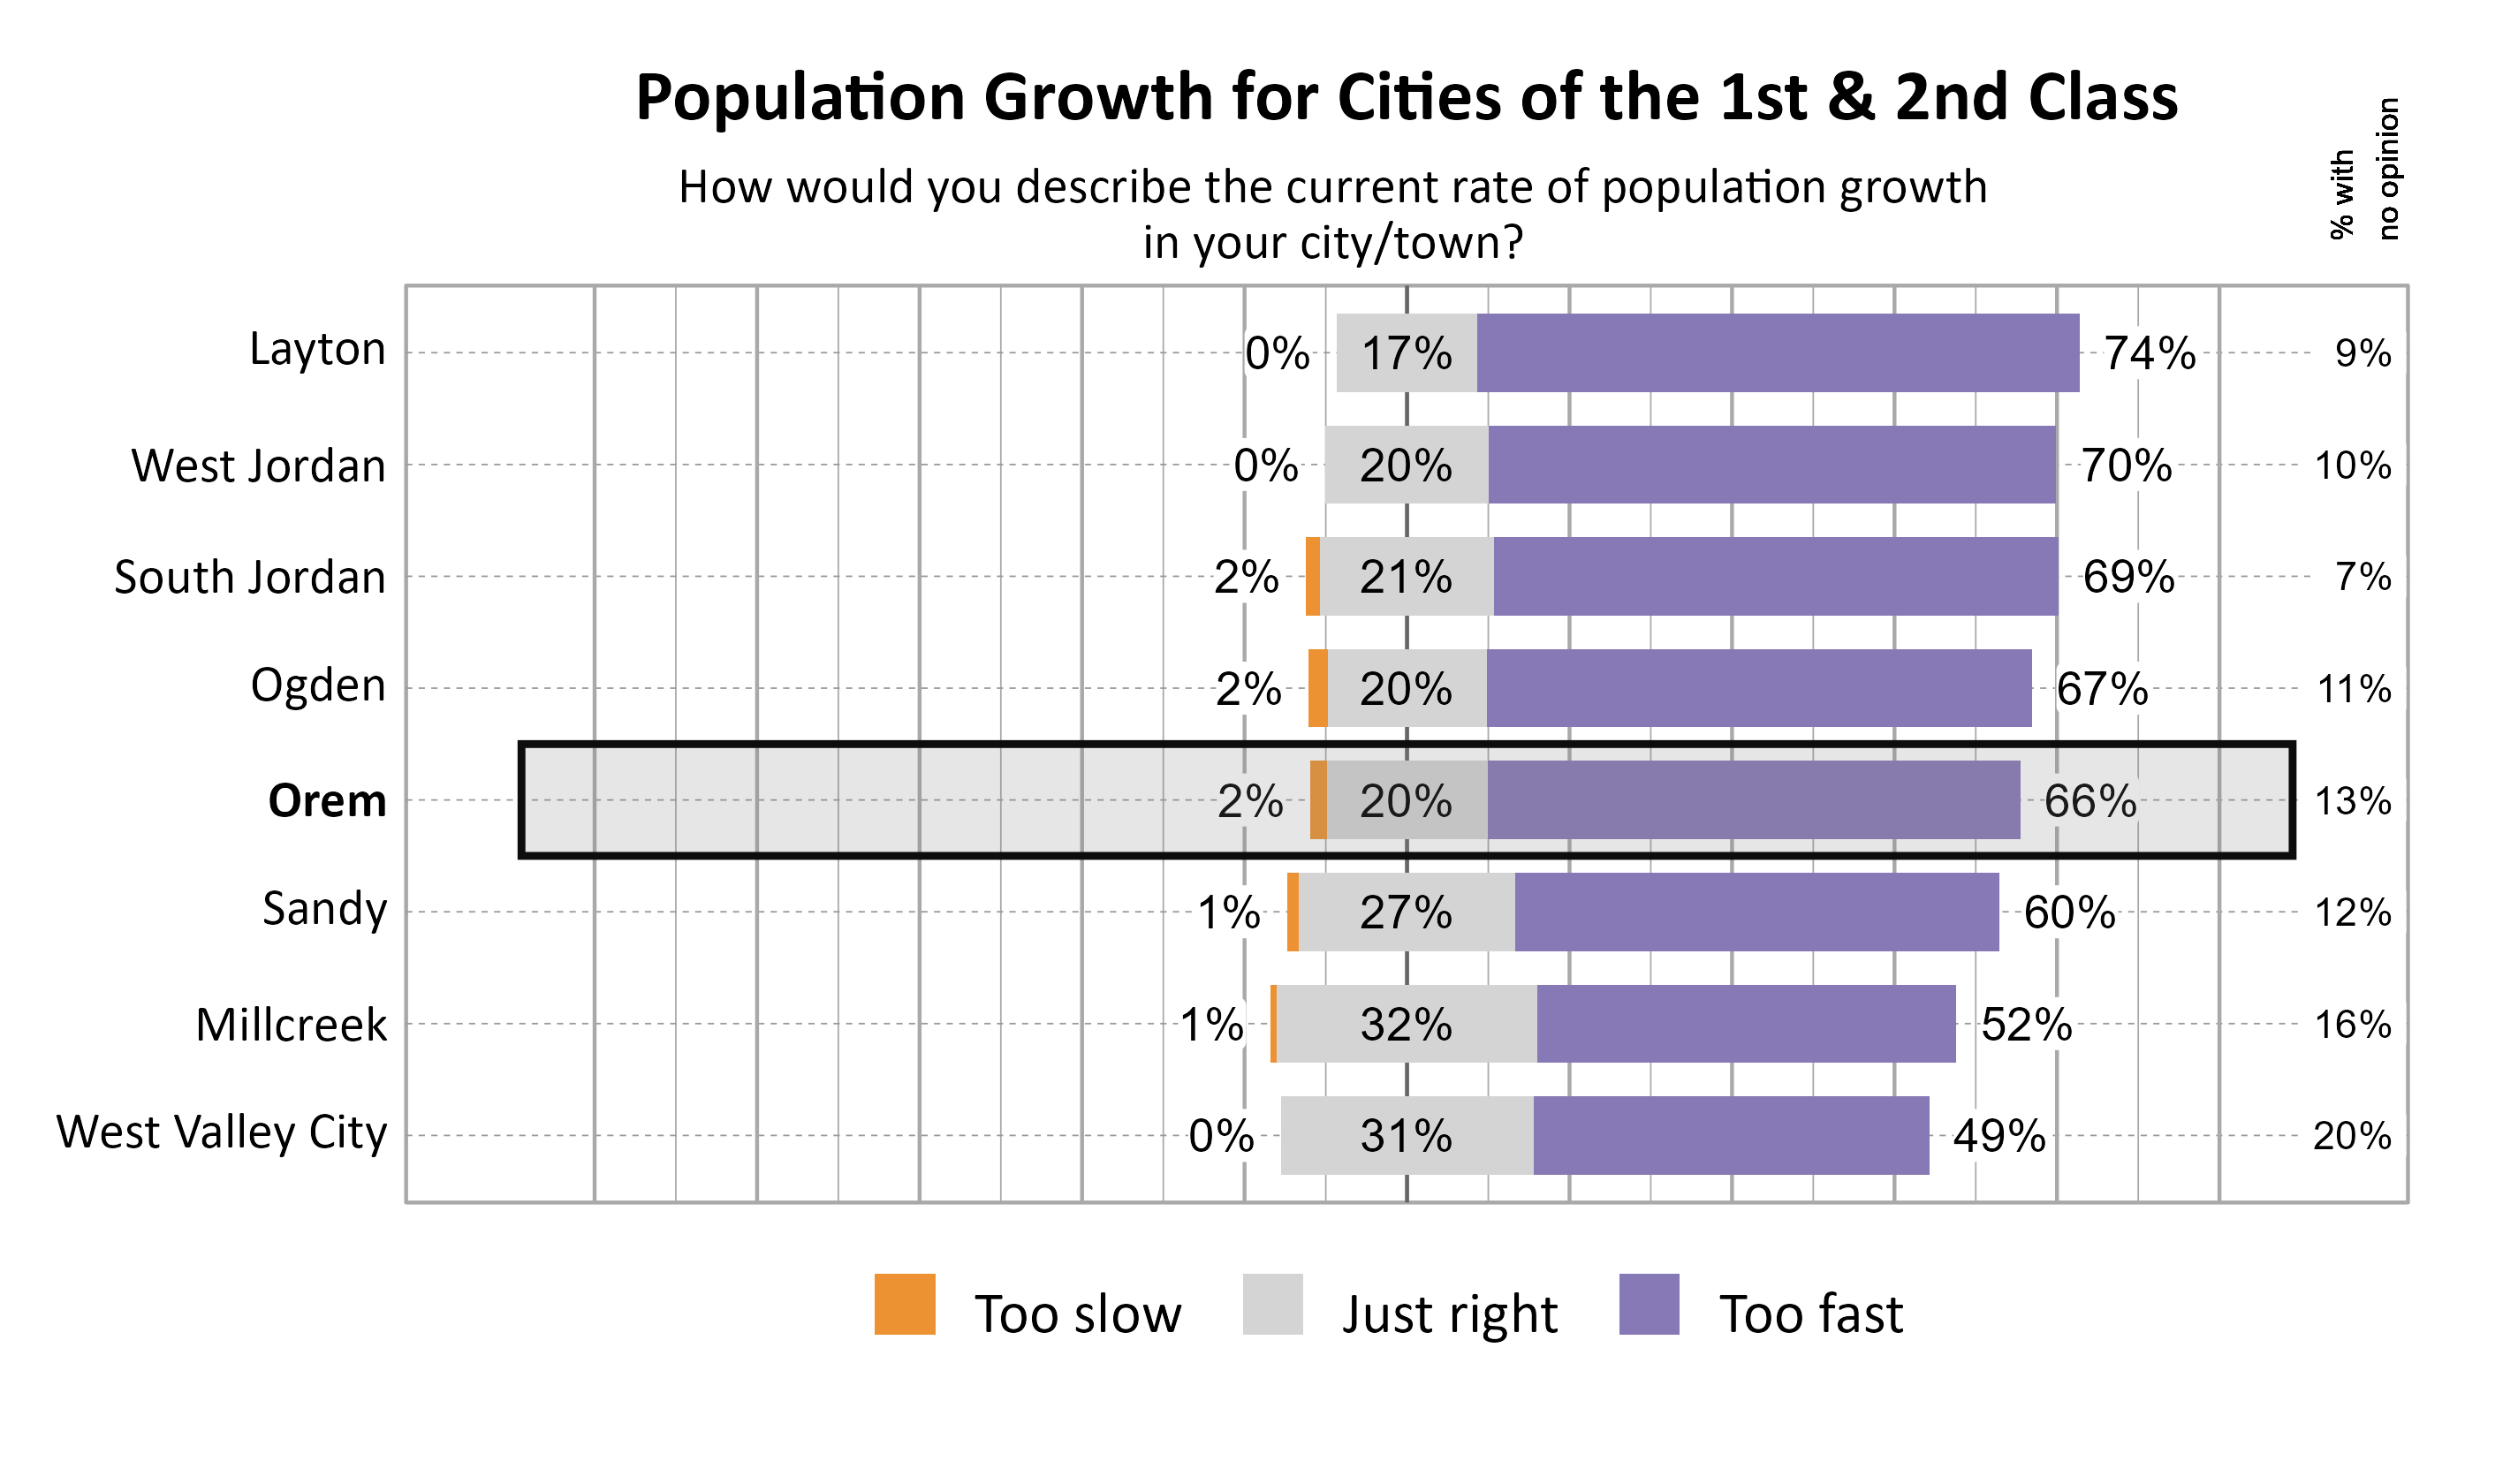
The graphs below show perceptions of population growth and economic development for Orem compared to other participating cities and towns in the Cities of the 1st & 2nd Class cluster.

Likert Graph. Title: Population Growth for Cities of the 1st & 2nd Class. Subtitle: How would you describe the current rate of population growth in your city/town? Data — City: Layton 0% of respondents indicated that it was too slow, 17% indicated that it was just right, 74% indicated that it was too fast, and  9% had no opinion; City: West Jordan 0% of respondents indicated that it was too slow, 20% indicated that it was just right, 70% indicated that it was too fast, and 10% had no opinion; City: South Jordan 2% of respondents indicated that it was too slow, 21% indicated that it was just right, 69% indicated that it was too fast, and  7% had no opinion; City: Ogden 2% of respondents indicated that it was too slow, 20% indicated that it was just right, 67% indicated that it was too fast, and 11% had no opinion; City: Orem 2% of respondents indicated that it was too slow, 20% indicated that it was just right, 66% indicated that it was too fast, and 13% had no opinion; City: Sandy 1% of respondents indicated that it was too slow, 27% indicated that it was just right, 60% indicated that it was too fast, and 12% had no opinion; City: Millcreek 1% of respondents indicated that it was too slow, 32% indicated that it was just right, 52% indicated that it was too fast, and 16% had no opinion; City: West Valley City 0% of respondents indicated that it was too slow, 31% indicated that it was just right, 49% indicated that it was too fast, and 20% had no opinion

Likert Graph. Title: Economic Development for Cities of the 1st & 2nd Class. Subtitle: How would you describe the current pace of economic development in your city/town? Data — City: Layton 21% of respondents indicated that it was too slow, 34% indicated that it was just right, 33% indicated that it was too fast, and 12% had no opinion; City: South Jordan 11% of respondents indicated that it was too slow, 48% indicated that it was just right, 31% indicated that it was too fast, and 10% had no opinion; City: Ogden 28% of respondents indicated that it was too slow, 30% indicated that it was just right, 29% indicated that it was too fast, and 14% had no opinion; City: Millcreek  7% of respondents indicated that it was too slow, 48% indicated that it was just right, 28% indicated that it was too fast, and 17% had no opinion; City: Sandy 12% of respondents indicated that it was too slow, 47% indicated that it was just right, 26% indicated that it was too fast, and 14% had no opinion; City: Orem 14% of respondents indicated that it was too slow, 43% indicated that it was just right, 24% indicated that it was too fast, and 19% had no opinion; City: West Jordan 22% of respondents indicated that it was too slow, 40% indicated that it was just right, 23% indicated that it was too fast, and 15% had no opinion; City: West Valley City 20% of respondents indicated that it was too slow, 42% indicated that it was just right, 16% indicated that it was too fast, and 22% had no opinion

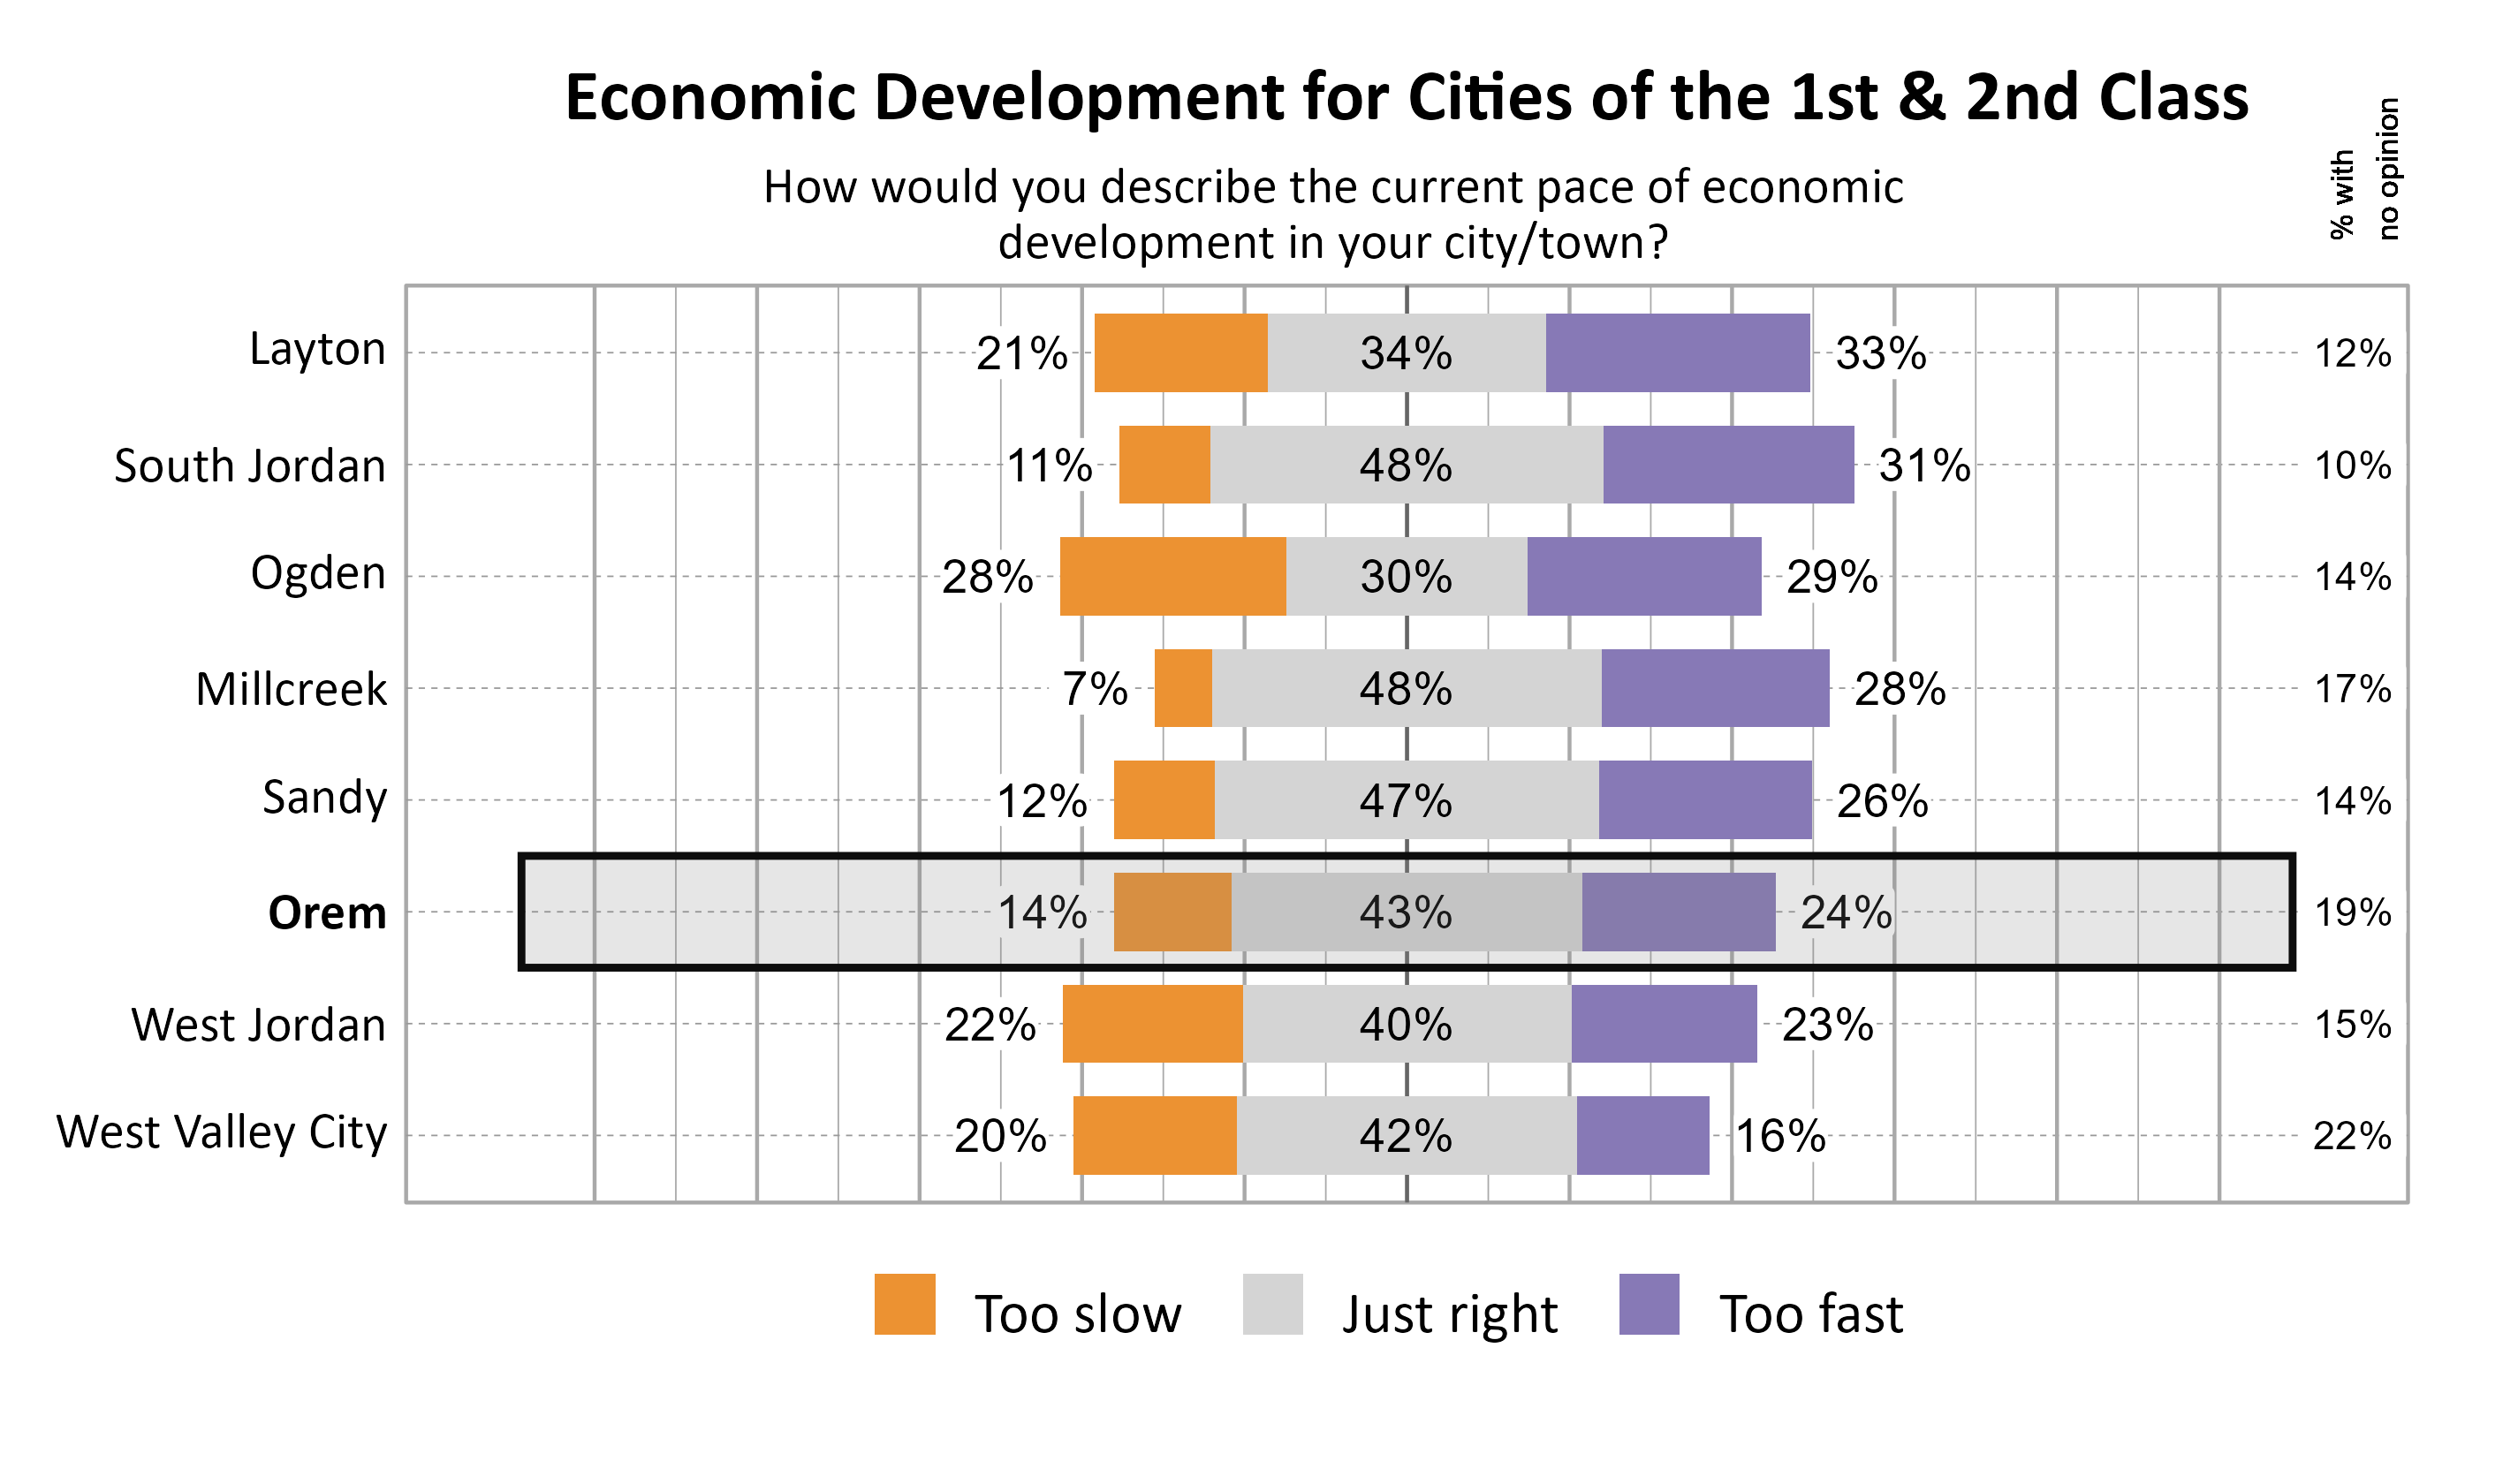
The graph below illustrates how many respondents perceived the pace of economic development as too slow, just right, too fast, or had no opinion, with additional breakdowns for the number of respondents who provided comments.

Sankey Graph. Title: Perceptions about the Pace of Economic Development in Orem. Subtitle: How would you describe the current pace of economic development in Orem? (In Number of Respondents). Data — Total Respondents: 1244; No opinion: 231; Too fast: 296; Just right: 538; Too slow: 179; 'Too fast' without comment: 49; 'Too fast' with comment: 247; 'Too slow' without comment: 26; 'Too slow' with comment: 153

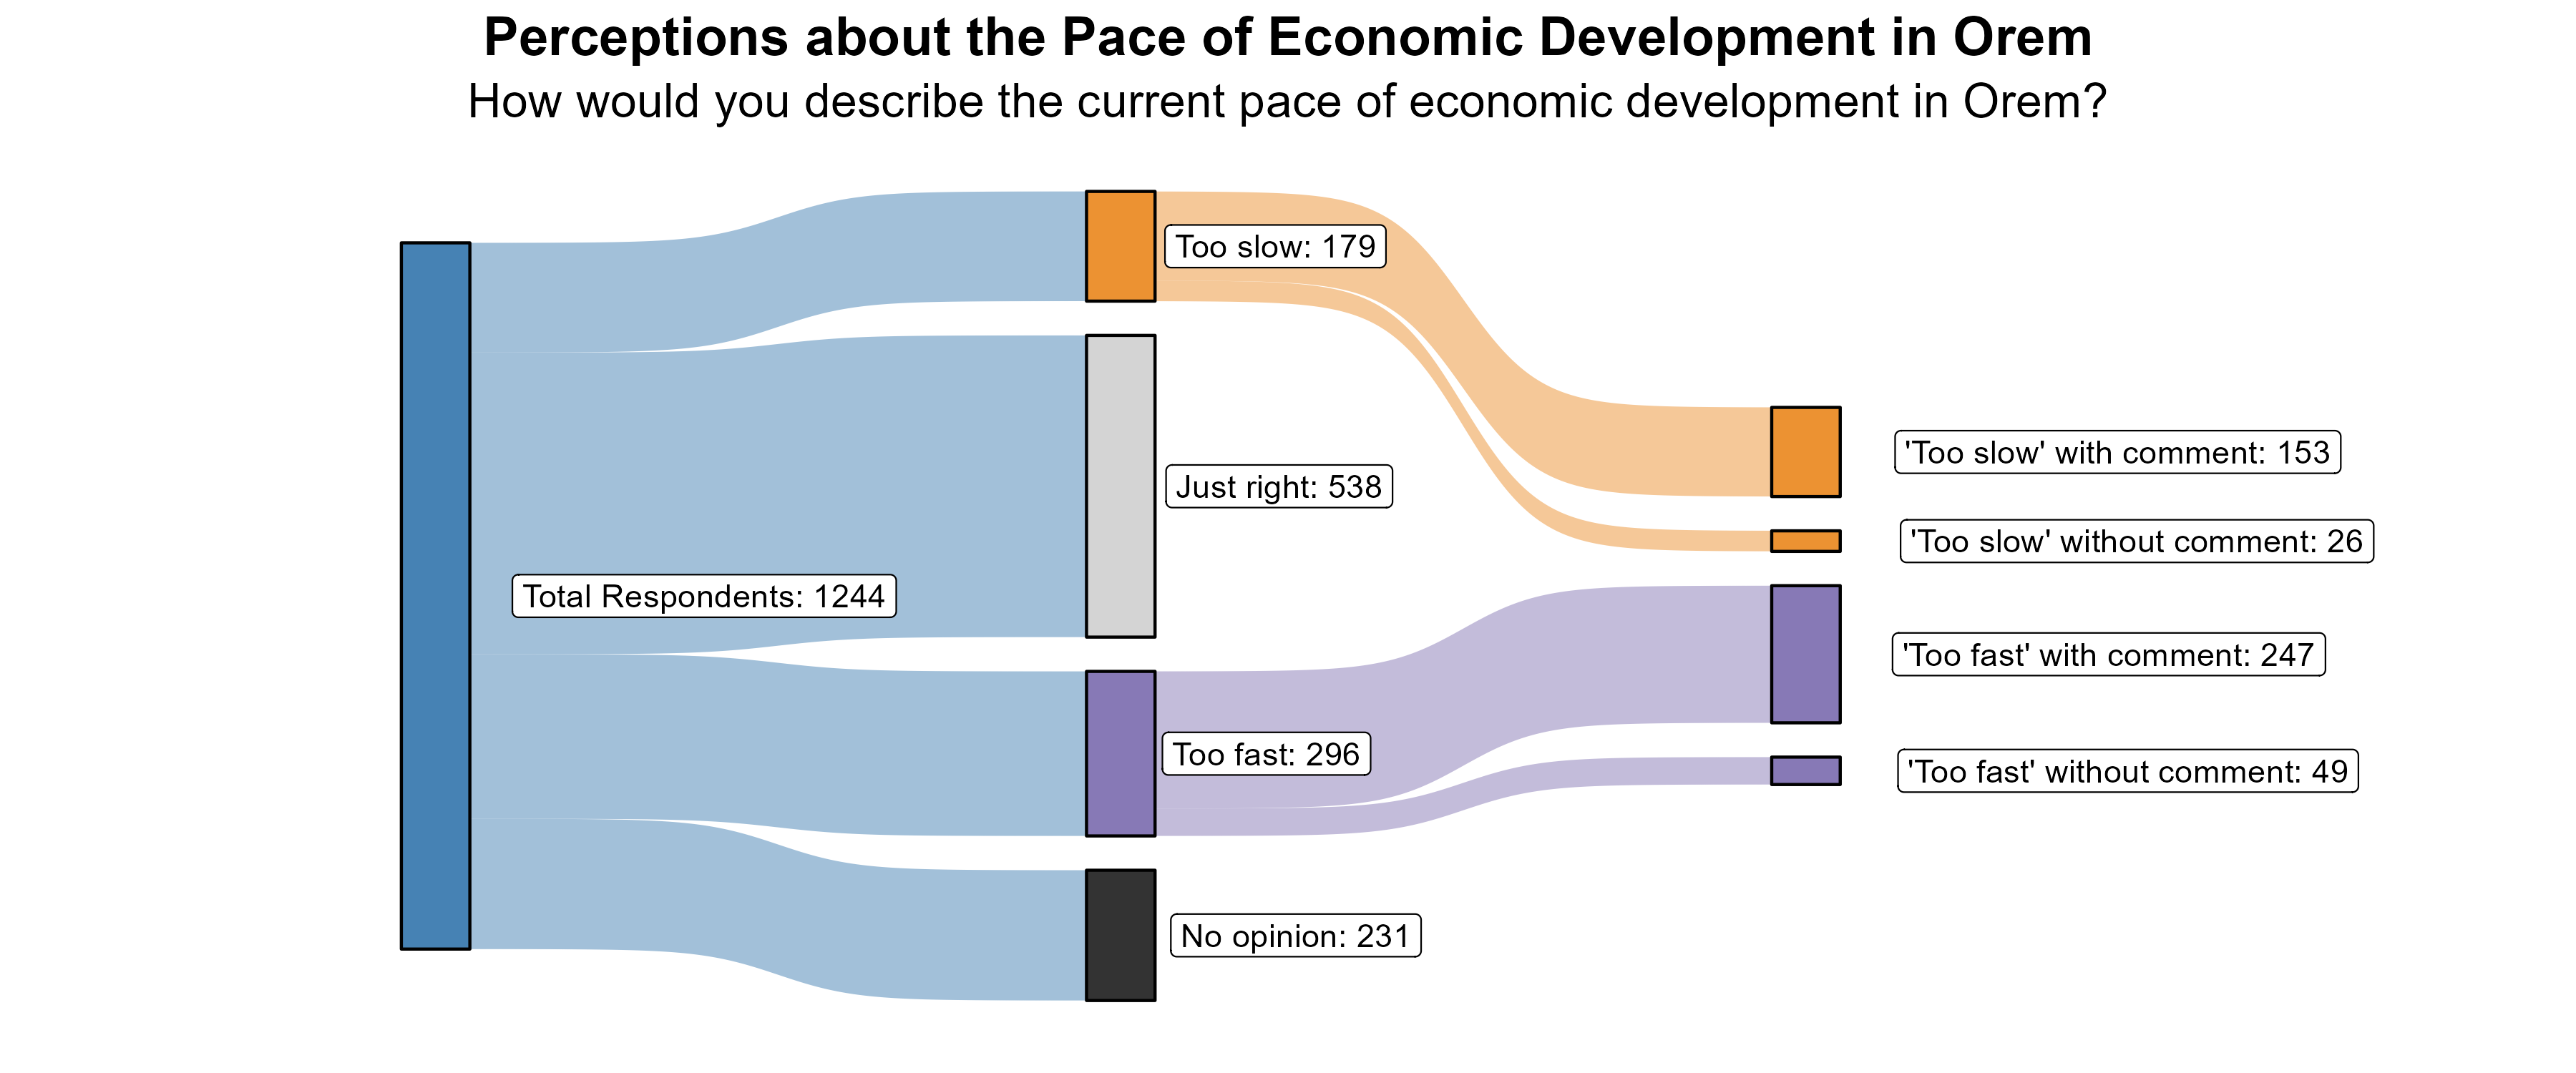
The 14% of respondents who rated the pace of economic growth as “too slow” were further asked what aspects of the local economy they would like to see more of in Orem. Comments focused on the need for more retail and business opportunities, particularly regarding support of local businesses and development and revitalization of State Street. There were quite a few comments indicating a need for better employment opportunities in Orem as well as affordable housing. Some expressed frustration with local government leaders regarding growth. There were comments about the need for infrastructure, particularly related to transportation.

Additionally, the 24% of respondents who rated the pace of economic growth as “too fast” were further asked what aspects of the local economy they feel are growing too quickly in Orem. The majority of comments focused on overdevelopment of housing and the resulting traffic and congestion that results from the influx of people coming to Orem. There were also many comments about retail and business and the turnover in businesses. There were concerns about having the infrastructure and resources to support development. Planning and governance were also concerns and there was an emphasis on the need to focus on families. There were a number of comments about the influx of students.

Transportation in Orem

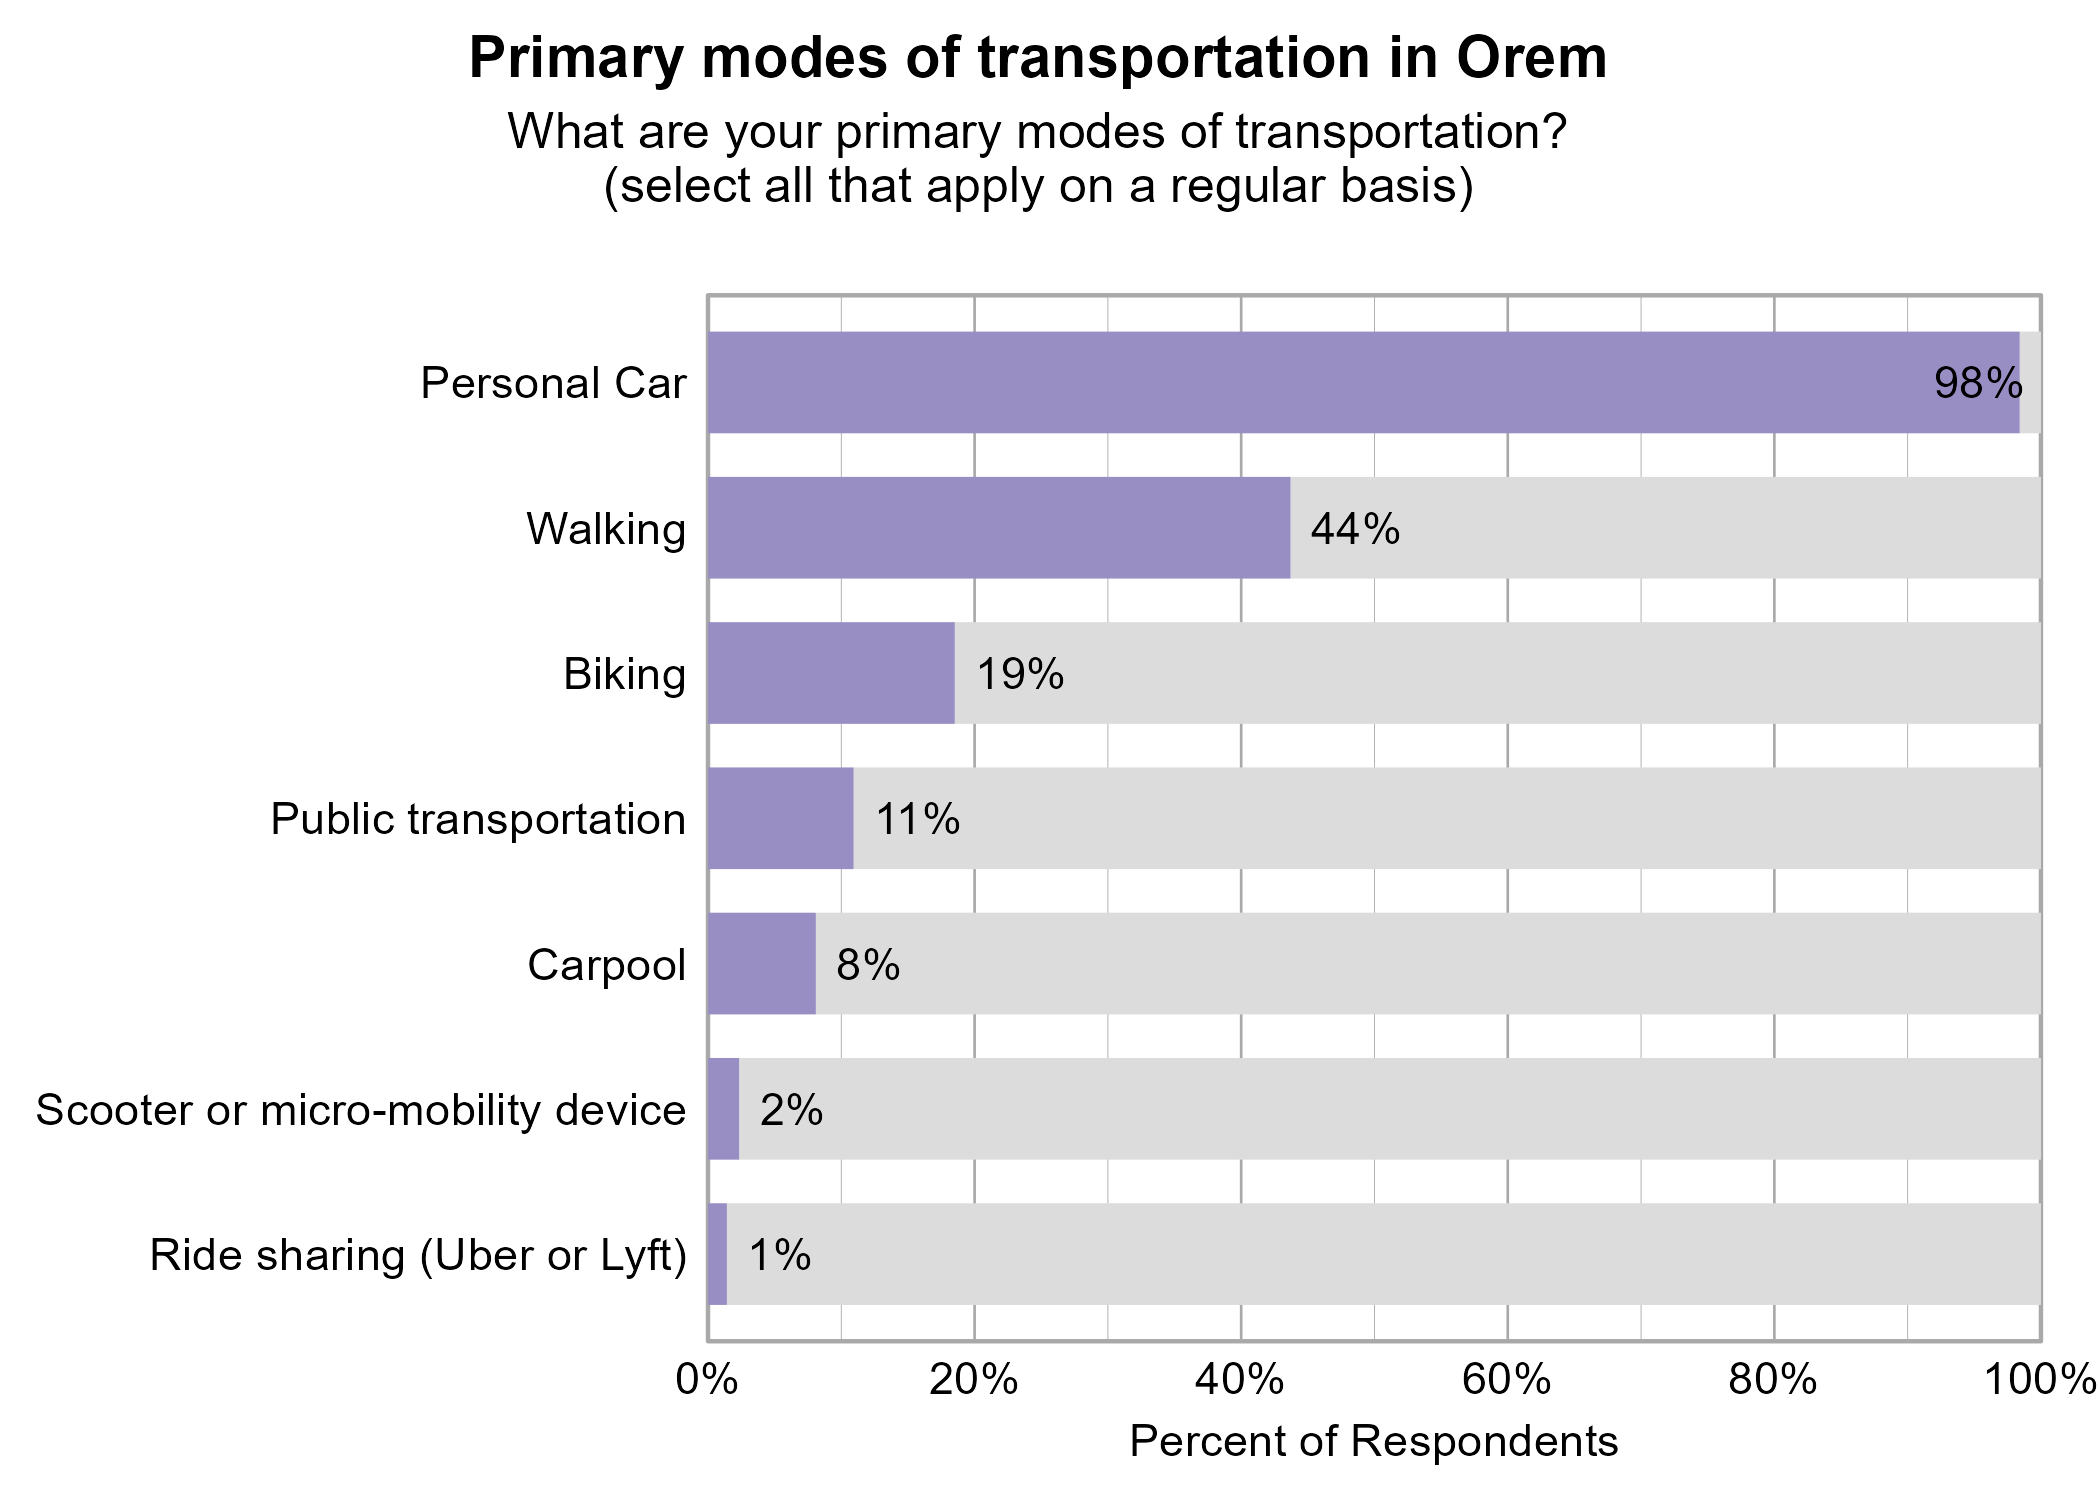
Respondents were asked to indicate all of their primary modes of transportation on a regular basis in Orem. The most popular modes of transportation were personal car (98%) and walking (44%).

Bar Graph. Title: Primary modes of transportation in Orem. Subtitle: What are your primary modes of transportation? (select all that apply on a regular basis) Data — 98% of respondents indicated yes to Personal Car; 44% of respondents indicated yes to Walking; 19% of respondents indicated yes to Biking; 11% of respondents indicated yes to Public transportation; 8% of respondents indicated yes to Carpool; 2% of respondents indicated yes to Scooter or micro-mobility device; 1% of respondents indicated yes to Ride sharing (Uber or Lyft)

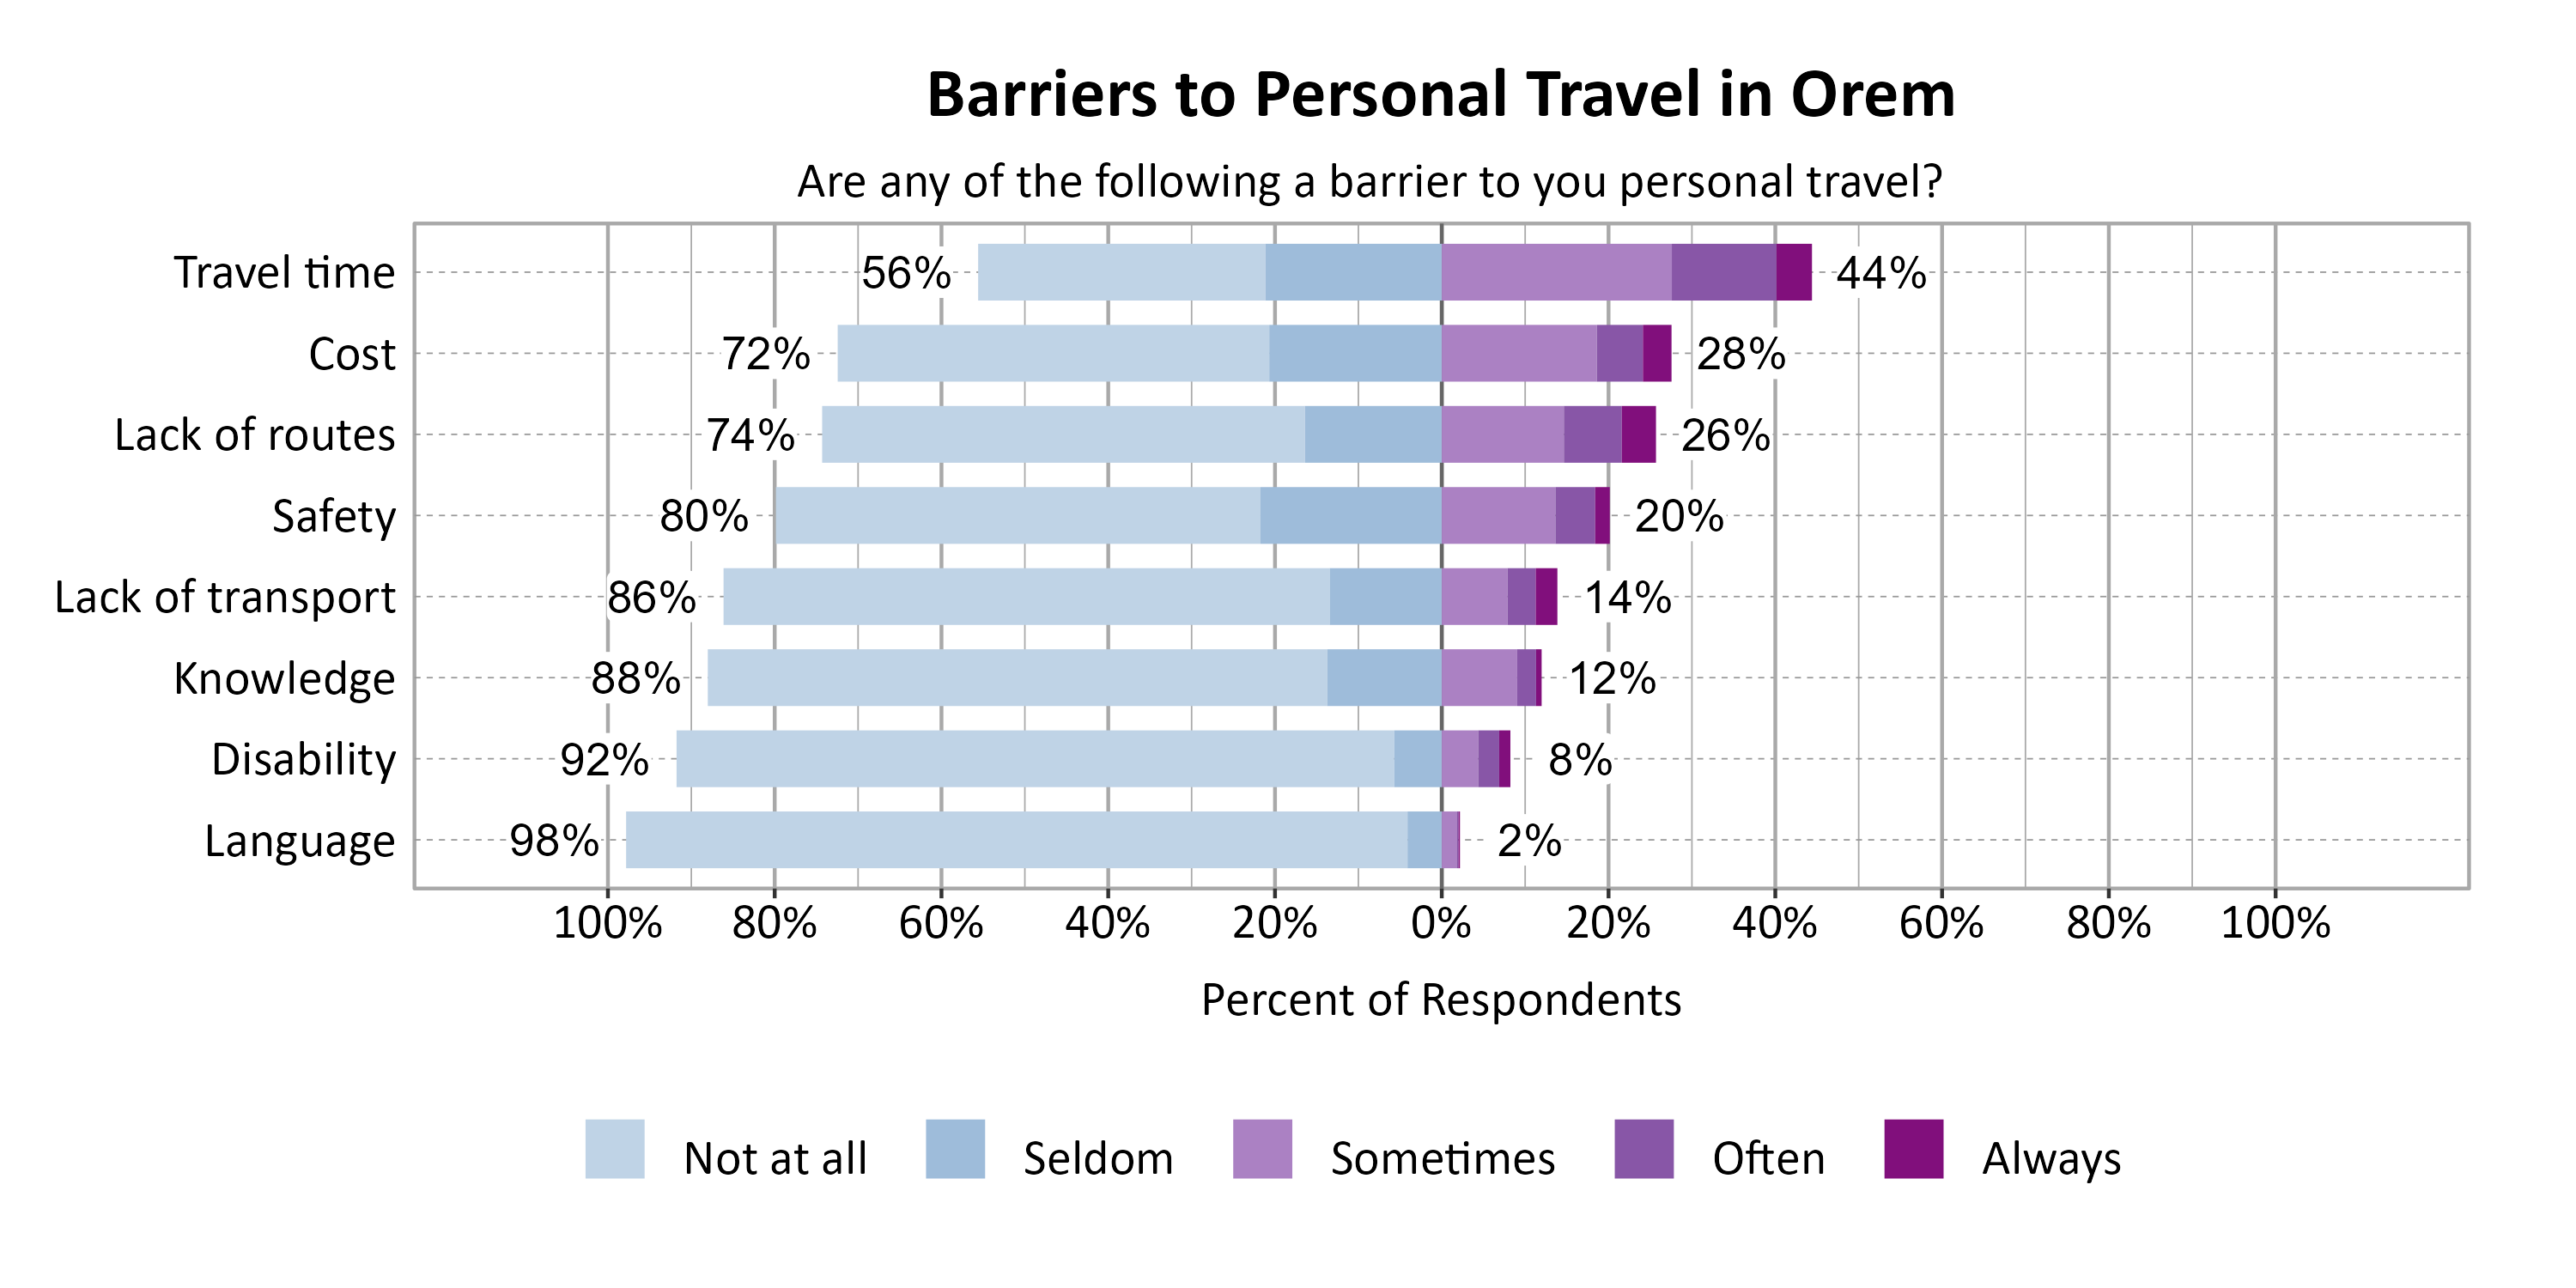
Respondents were asked to indicate the most common barriers to transportation in Orem. The most problematic barriers were Travel time (44%) and Cost (28%).

Likert Graph. Title: Barriers to Personal Travel in Orem. Subtitle: Are any of the following a barrier to you personal travel? Data — Category: Travel time - 56% of respondents indicated it was not a barrier or seldom a barrier, while 44% of respondents indicated it was sometimes, often, or always a barrier; Category: Cost - 72% of respondents indicated it was not a barrier or seldom a barrier, while 28% of respondents indicated it was sometimes, often, or always a barrier; Category: Lack of routes - 74% of respondents indicated it was not a barrier or seldom a barrier, while 26% of respondents indicated it was sometimes, often, or always a barrier; Category: Safety - 80% of respondents indicated it was not a barrier or seldom a barrier, while 20% of respondents indicated it was sometimes, often, or always a barrier; Category: Lack of transport - 86% of respondents indicated it was not a barrier or seldom a barrier, while 14% of respondents indicated it was sometimes, often, or always a barrier; Category: Knowledge - 88% of respondents indicated it was not a barrier or seldom a barrier, while 12% of respondents indicated it was sometimes, often, or always a barrier; Category: Disability - 92% of respondents indicated it was not a barrier or seldom a barrier, while  8% of respondents indicated it was sometimes, often, or always a barrier; Category: Language - 98% of respondents indicated it was not a barrier or seldom a barrier, while  2% of respondents indicated it was sometimes, often, or always a barrier

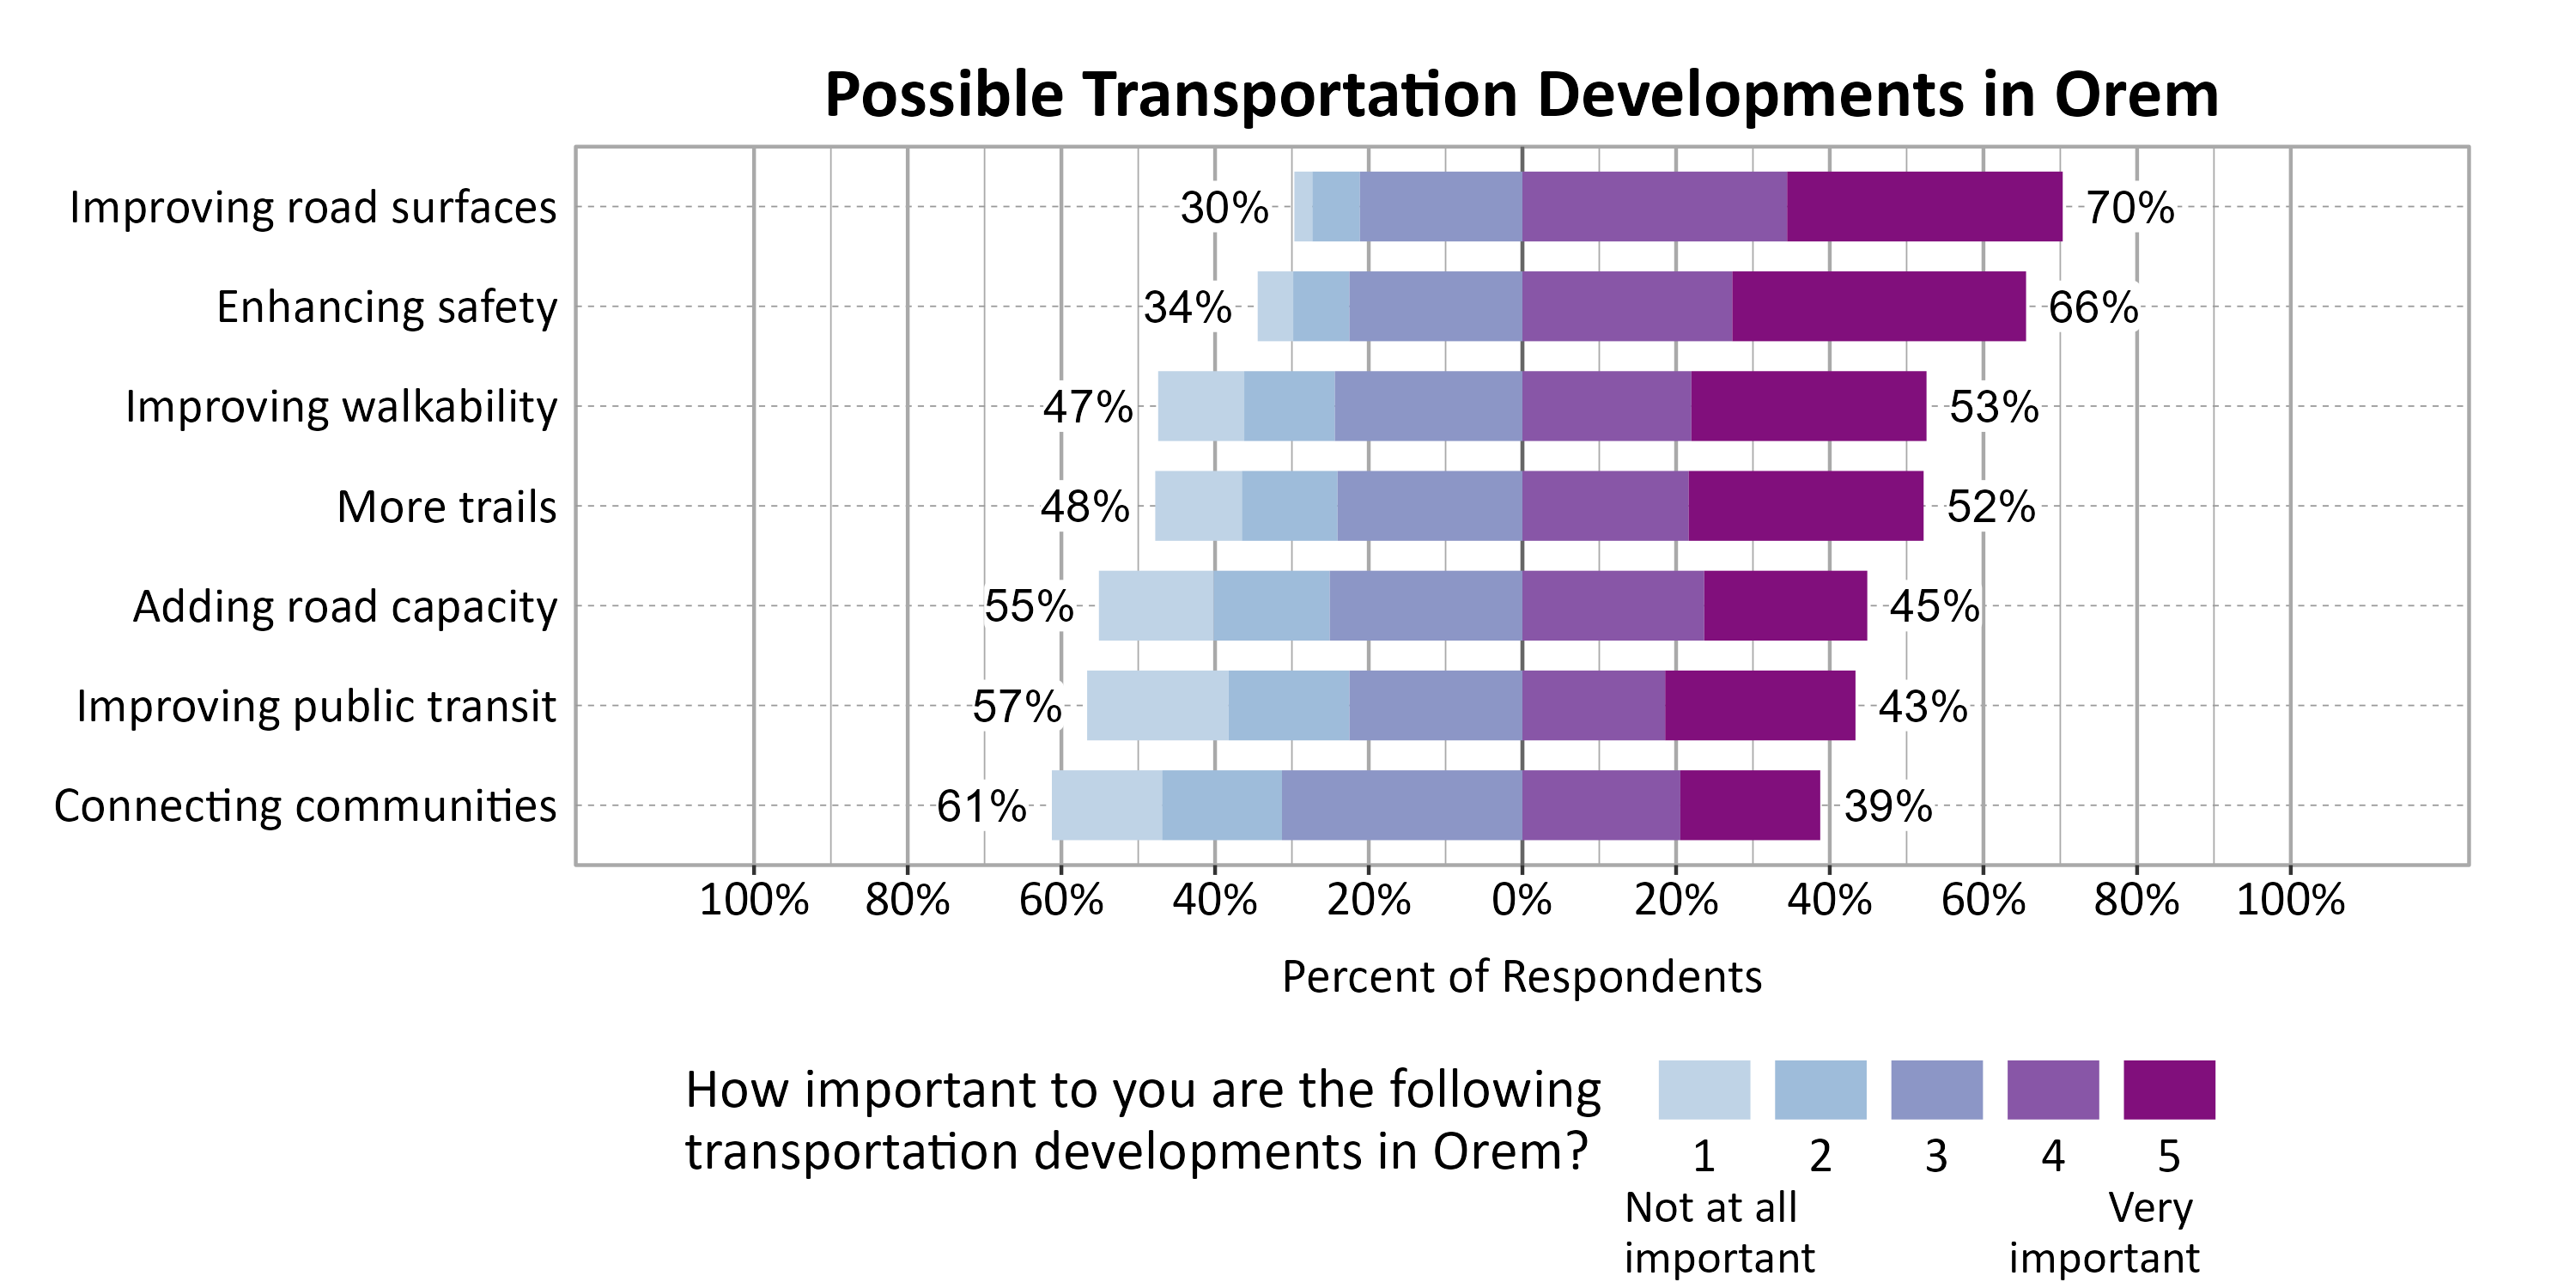
Respondents were asked to indicate the importance of a set of possible transportation developments in Orem. The most important development to respondents were Improving road surfaces (70%), Enhancing safety (66%), Improving walkability (53%), and More trails (52%).

Likert Graph. Title: Possible Transportation Developments in Orem. Subtitle: On a scale of 1 - Not at all important to 5 - Very important, please rate the importance of the following developments to you. Data — Category: Improving road surfaces - 30% of respondents indicated it 1, 2, or 3, while 70% of respondents rated it a 4 or 5.; Category: Enhancing safety - 34% of respondents indicated it 1, 2, or 3, while 66% of respondents rated it a 4 or 5.; Category: Improving walkability - 47% of respondents indicated it 1, 2, or 3, while 53% of respondents rated it a 4 or 5.; Category: More trails - 48% of respondents indicated it 1, 2, or 3, while 52% of respondents rated it a 4 or 5.; Category: Adding road capacity - 55% of respondents indicated it 1, 2, or 3, while 45% of respondents rated it a 4 or 5.; Category: Improving public transit - 57% of respondents indicated it 1, 2, or 3, while 43% of respondents rated it a 4 or 5.; Category: Connecting communities - 61% of respondents indicated it 1, 2, or 3, while 39% of respondents rated it a 4 or 5.

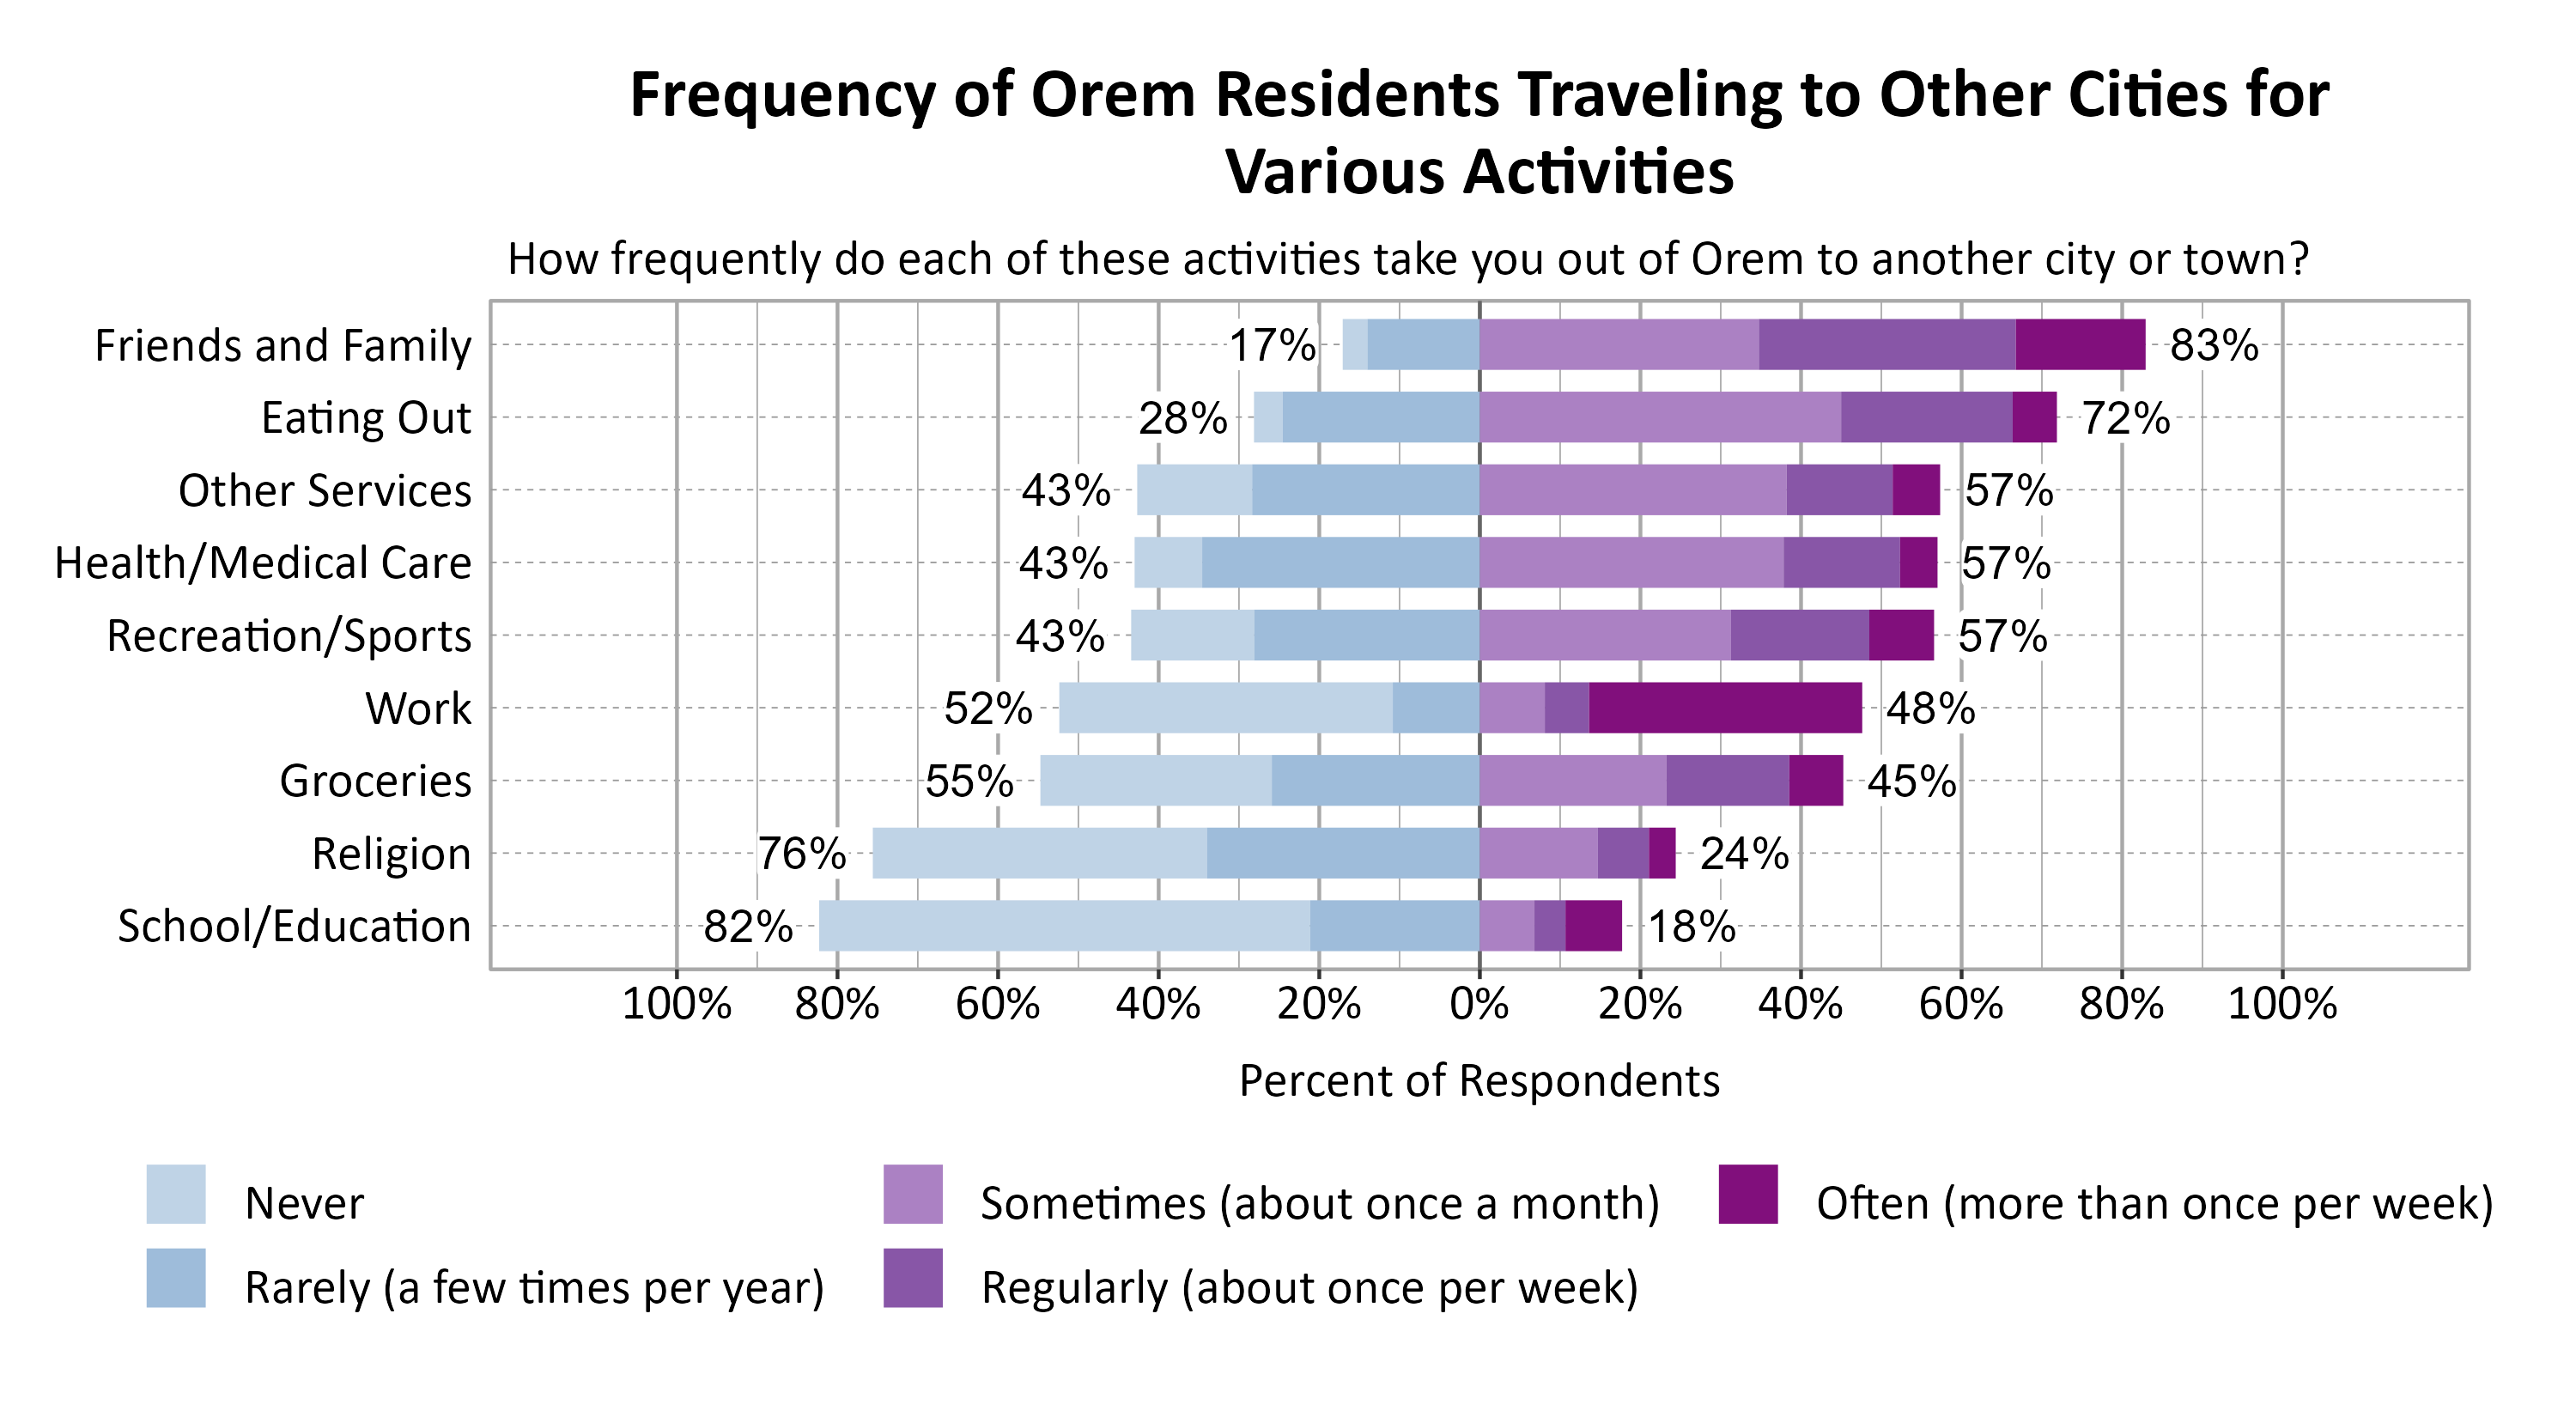
Respondents were asked to indicate how frequently various activities take them out of Orem to another city or town. The most commonly indicated reasons for traveling to another city or town at least sometimes or once a month were Friends and Family (83%), Eating Out (72%), Other Services (57%), Health/Medical Care (57%), and Recreation/Sports (57%).

Likert Graph. Title: Frequency of Orem Residents Traveling to Other Cities for Various Activities. Subtitle: How frequently do each of these activities take you out of Orem to another city or town? Data — Category: Friends and Family - 17% of respondents indicated it was never or rarely and 83% of respondents indicated it was sometimes, regularly, often; Category: Eating Out - 28% of respondents indicated it was never or rarely and 72% of respondents indicated it was sometimes, regularly, often; Category: Health/Medical Care - 43% of respondents indicated it was never or rarely and 57% of respondents indicated it was sometimes, regularly, often; Category: Other Services - 43% of respondents indicated it was never or rarely and 57% of respondents indicated it was sometimes, regularly, often; Category: Recreation/Sports - 43% of respondents indicated it was never or rarely and 57% of respondents indicated it was sometimes, regularly, often; Category: Work - 52% of respondents indicated it was never or rarely and 48% of respondents indicated it was sometimes, regularly, often; Category: Groceries - 55% of respondents indicated it was never or rarely and 45% of respondents indicated it was sometimes, regularly, often; Category: Religion - 76% of respondents indicated it was never or rarely and 24% of respondents indicated it was sometimes, regularly, often; Category: School/Education - 82% of respondents indicated it was never or rarely and 18% of respondents indicated it was sometimes, regularly, often

Concerns in Orem

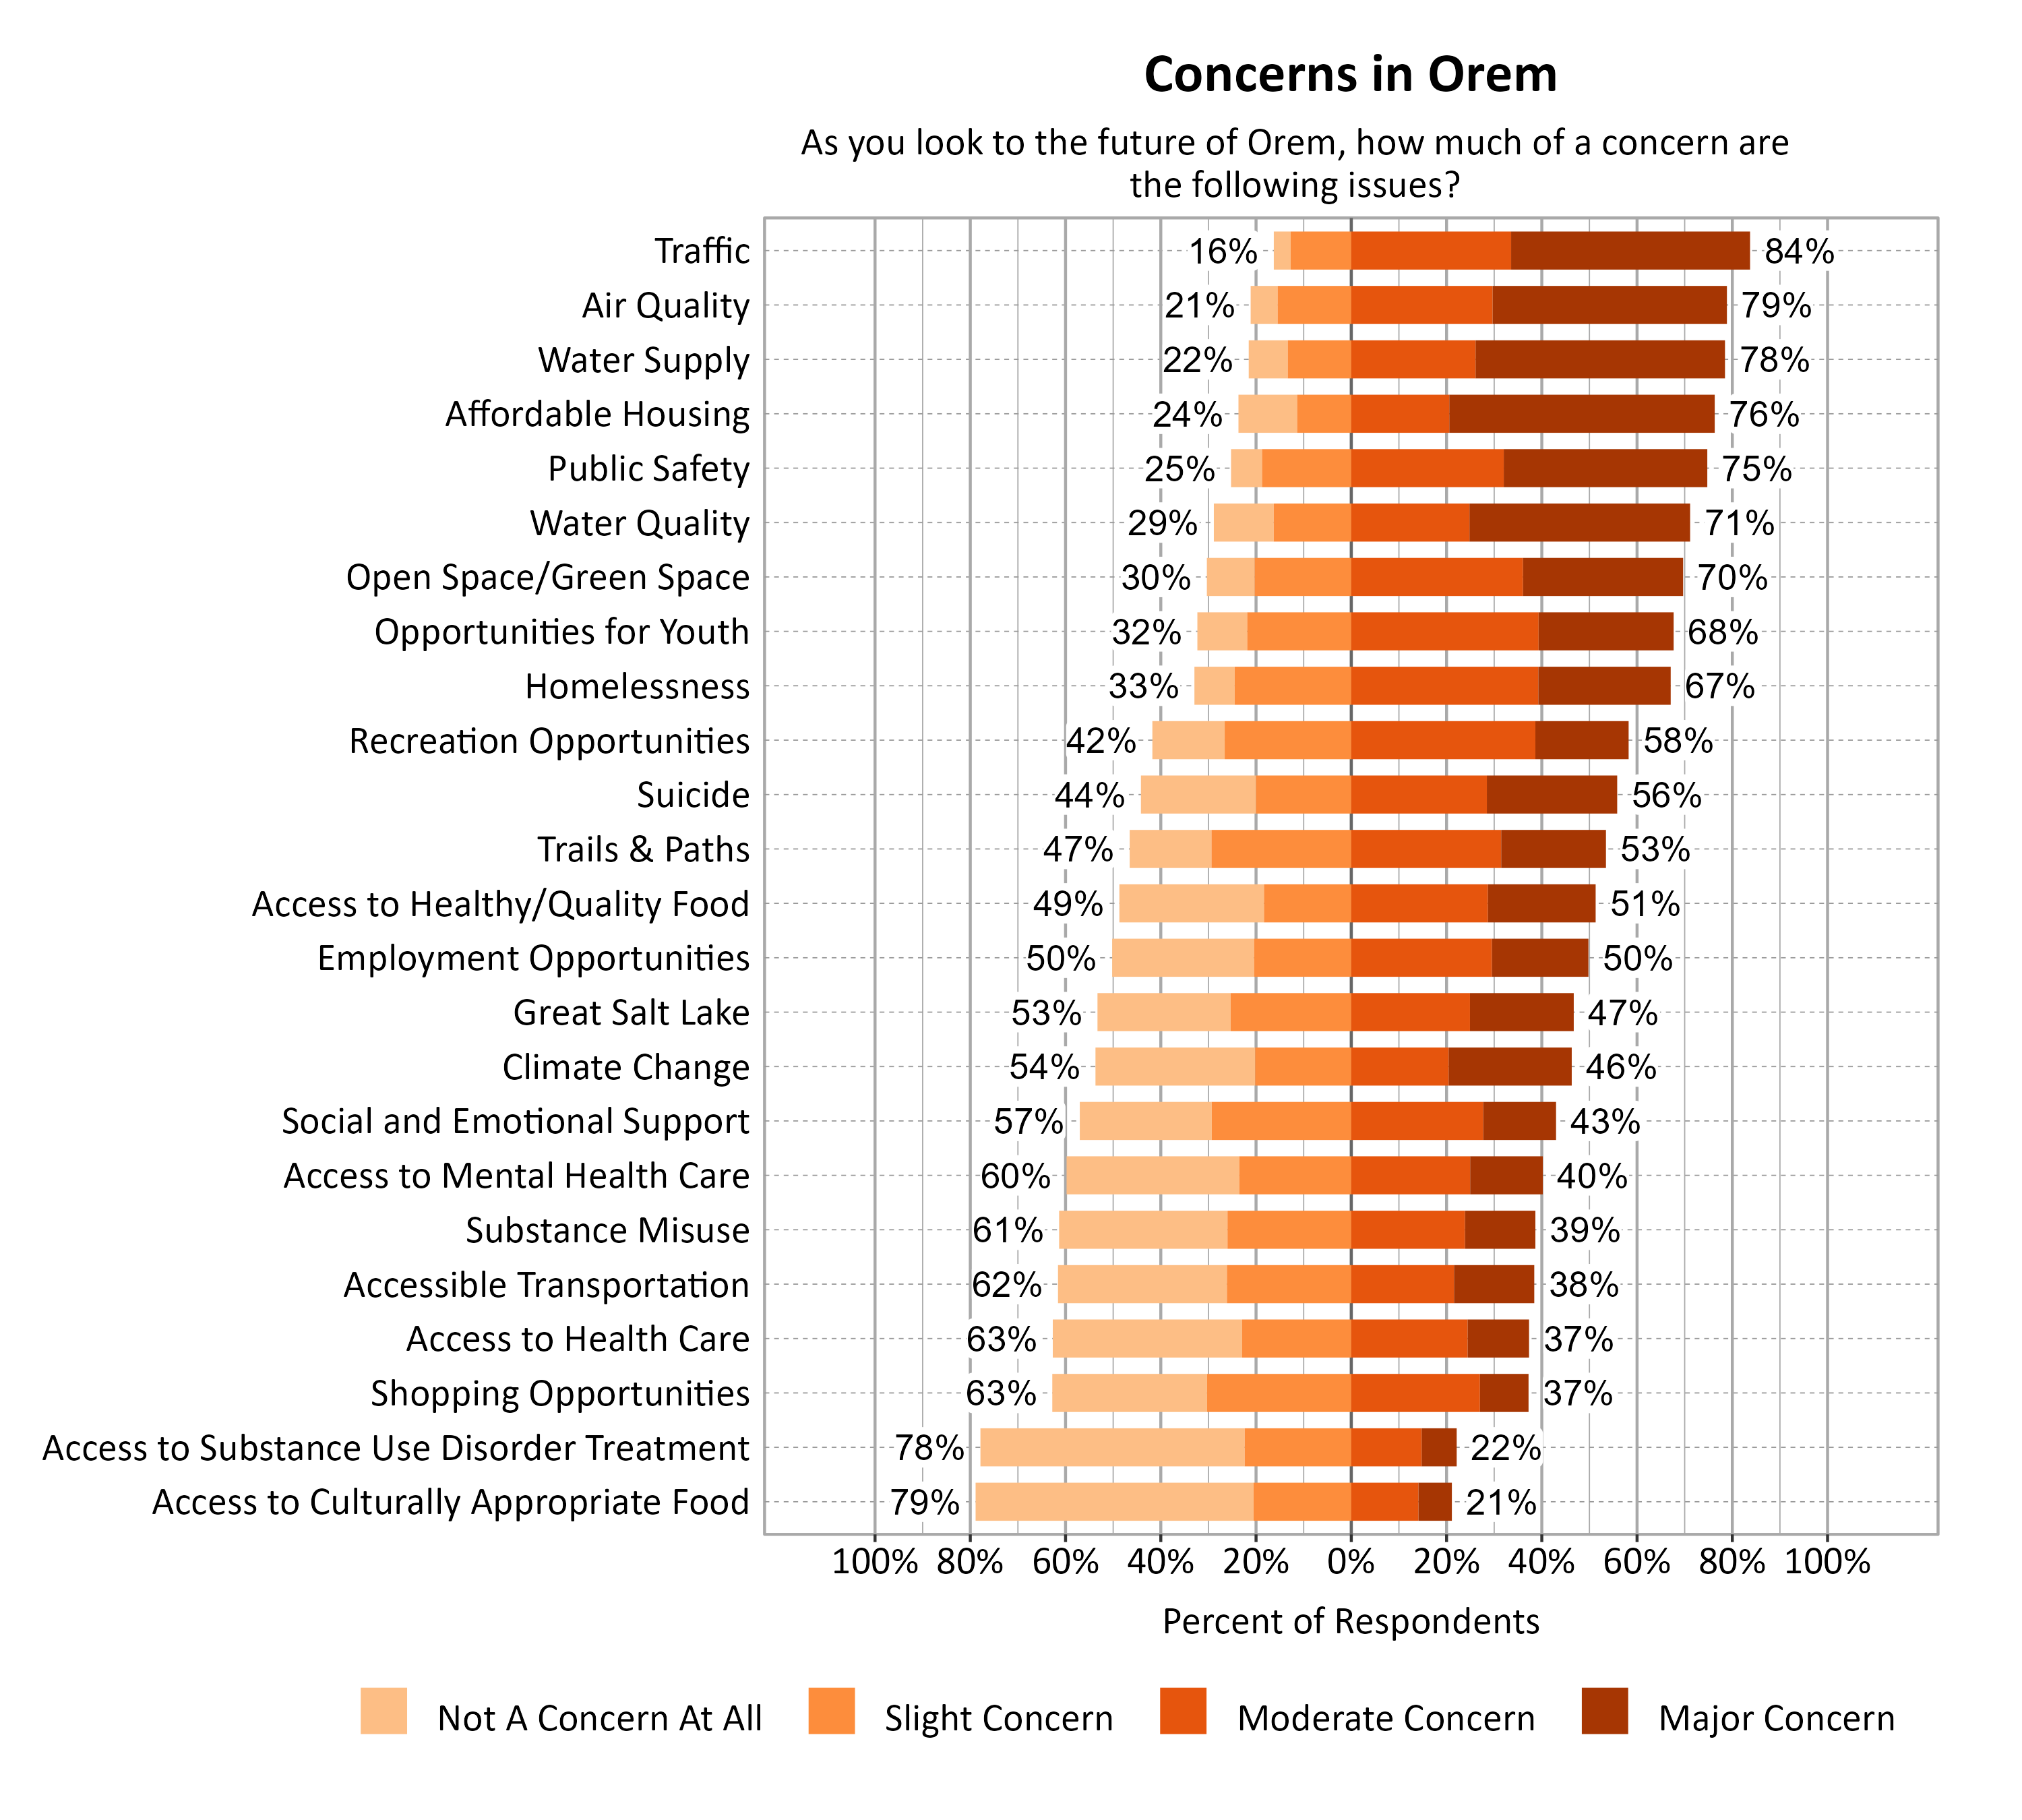
Survey respondents indicated the degree to which a number of possible local issues were a concern as they look to the future of Orem. Traffic (84%), Air Quality (79%), and Water Supply (78%) were the top concerns.

Likert Graph. Title: Concerns in Orem. Subtitle: As you look to the future of Orem, how much of a concern are the following issues? Data — Category: Traffic - 16% of respondents indicated not a concern at all or slight concern while 84% of respondents indicated a moderate or major concern; Category: Air Quality - 21% of respondents indicated not a concern at all or slight concern while 79% of respondents indicated a moderate or major concern; Category: Water Supply - 22% of respondents indicated not a concern at all or slight concern while 78% of respondents indicated a moderate or major concern; Category: Affordable Housing - 24% of respondents indicated not a concern at all or slight concern while 76% of respondents indicated a moderate or major concern; Category: Public Safety - 25% of respondents indicated not a concern at all or slight concern while 75% of respondents indicated a moderate or major concern; Category: Water Quality - 29% of respondents indicated not a concern at all or slight concern while 71% of respondents indicated a moderate or major concern; Category: Open Space/Green Space - 30% of respondents indicated not a concern at all or slight concern while 70% of respondents indicated a moderate or major concern; Category: Opportunities for Youth - 32% of respondents indicated not a concern at all or slight concern while 68% of respondents indicated a moderate or major concern; Category: Homelessness - 33% of respondents indicated not a concern at all or slight concern while 67% of respondents indicated a moderate or major concern; Category: Recreation Opportunities - 42% of respondents indicated not a concern at all or slight concern while 58% of respondents indicated a moderate or major concern; Category: Suicide - 44% of respondents indicated not a concern at all or slight concern while 56% of respondents indicated a moderate or major concern; Category: Trails & Paths - 47% of respondents indicated not a concern at all or slight concern while 53% of respondents indicated a moderate or major concern; Category: Access to Healthy/Quality Food - 49% of respondents indicated not a concern at all or slight concern while 51% of respondents indicated a moderate or major concern; Category: Employment Opportunities - 50% of respondents indicated not a concern at all or slight concern while 50% of respondents indicated a moderate or major concern; Category: Great Salt Lake - 53% of respondents indicated not a concern at all or slight concern while 47% of respondents indicated a moderate or major concern; Category: Climate Change - 54% of respondents indicated not a concern at all or slight concern while 46% of respondents indicated a moderate or major concern; Category: Social and Emotional Support - 57% of respondents indicated not a concern at all or slight concern while 43% of respondents indicated a moderate or major concern; Category: Access to Mental Health Care - 60% of respondents indicated not a concern at all or slight concern while 40% of respondents indicated a moderate or major concern; Category: Substance Misuse - 61% of respondents indicated not a concern at all or slight concern while 39% of respondents indicated a moderate or major concern; Category: Accessible Transportation - 62% of respondents indicated not a concern at all or slight concern while 38% of respondents indicated a moderate or major concern; Category: Access to Health Care - 63% of respondents indicated not a concern at all or slight concern while 37% of respondents indicated a moderate or major concern; Category: Shopping Opportunities - 63% of respondents indicated not a concern at all or slight concern while 37% of respondents indicated a moderate or major concern; Category: Access to Substance Use Disorder Treatment - 78% of respondents indicated not a concern at all or slight concern while 22% of respondents indicated a moderate or major concern; Category: Access to Culturally Appropriate Food - 79% of respondents indicated not a concern at all or slight concern while 21% of respondents indicated a moderate or major concern

Open Comments

All open comments collected in the survey were shared with city leaders. General observations and themes are shared here.

What Respondents Value Most in Orem

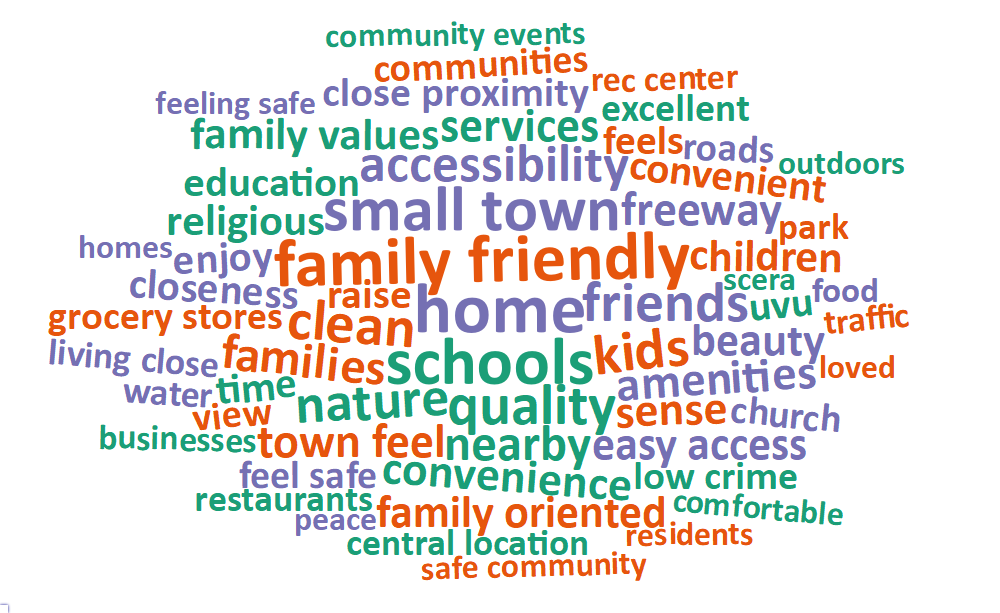
Survey respondents were asked to comment on what they value most about Orem. The most common words and phrases from all city comments are included in the word cloud below. It is possible that negative or unrelated words may appear since these words have been taken out of context, and they may not indicate the respondent’s intended meaning. Respondents from Orem indicated that they highly value the location of the city, citing closeness to nature and outdoor recreation as well as closeness to other places in the valley. Social climate, specifically community and good neighbors, along with feelings of safety in Orem were also mentioned. 

A word cloud of most common words about what respondents value most in their city

Local Environmental Quality in Orem

The 49% of respondents who rated the Local Environmental Quality domain as 1, 2, or 3 (Poor, Fair, or Moderate) were further asked if there are specific aspects of local environmental quality that they feel are problematic. Many concerns focused on air quality and traffic. Comments on air quality discussed pollution, inversions, and overall air quality in Utah. Alternate transportation comments often mentioned congestion, traffic, and how other forms of transportation are not an option often times. There were some comments about a need for green space and for a cleaner community.

Improving Wellbeing in Orem

Survey respondents were asked if there is anything that could be done to improve wellbeing in Orem. Many comments mentioned that improved traffic conditions would contribute to wellbeing. Increased access public transportation was also mentioned as needed to improve wellbeing. Improved city image was also mentioned, citing that they wished things like State Street would be visually improved.

Additional Comments

Respondents were also asked if they had any additional comments on wellbeing in Orem. This question resulted in a variety of themes. One theme that arose is that of local government as some comments critiqued the direction of Orem’s leadership and also desire for more communication from city leadership. Many cited concerns about the current level of growth in the city. Social climate also arose with people saying they want Orem to remain “Family City USA” and they don’t want that theme to be meaningless.