Park City Area Wellbeing Survey Findings 2024
By Dr. Courtney Flint and Team
![]()
Contact Information
Dr. Courtney Flint
courtney.flint@usu.edu
435-797-8635
Summary
Park City is one of 51 cities participating in the Utah Wellbeing Survey Project in 2024. This project is designed to assess the wellbeing and local perspectives of city residents and to provide information to city leaders to inform general planning processes. Additional analysis is underway and this report may be updated over time.
We are grateful to all those who took the survey and to our city partners who helped to make this possible. We are grateful to a number of entities for funding: the Utah League of Cities and Towns, USU Extension, USU’s Institute for Land Water and Air, the Wasatch Front Regional Council, Utah Department of Transportation, the Utah Agricultural Experiment Station, and the cities of Alpine, Cedar Hills, Draper, Millcreek, Nephi, North Salt Lake, Ogden, Orem, Pleasant Grove, Providence, Springdale, Tremonton, West Bountiful, and West Valley City.
This report describes findings from the 2024 Park City survey and comparative information with other project cities. In April and May 2024, Park City government advertised the survey for residents through social media, newsletters, and the Park Record. All city residents age 18+ were encouraged to take the online Qualtrics survey. While not strictly in the city of Park City, many respondents indicated they were from the surrounding area in ZIP Code 84098, and their responses have been included in this report. Notable differences between the responses for the city of Park City (only ZIP Code 84060 responses) and the greater area (all responses) are highlighted throughout the report.
How many people responded?
- 205 viable surveys were recorded in this 2024 survey effort. 108 viable surveys were recorded for Park City.
- The Park City Area 2022 survey had 390 responses.
- The adult population of Park City was estimated at 6,945, based on the American Community Survey by the U.S. Census. The 108 Park City survey responses in 2024 represent 1.6% of the adult population and have a conservative margin of error of 9.36%.
Survey Respondent Characteristics
| Resident Statistics | |
|---|---|
| Full Time Residents of the Park City Area | 87.8% |
| Part Time Residents of the Park City Area | 12.2% |
| Length of Residency — Range | 1-49 years |
| Length of Residency — Average | 15.1 years |
| Length of Residency — Median | 12 years |
| Length of Residency 5 Years or less | 32.2% |
| ZIP Code | Percent |
|---|---|
| 84060 (Park City) | 52.7% |
| 84098 | 39.0% |
| Other | 8.3% |
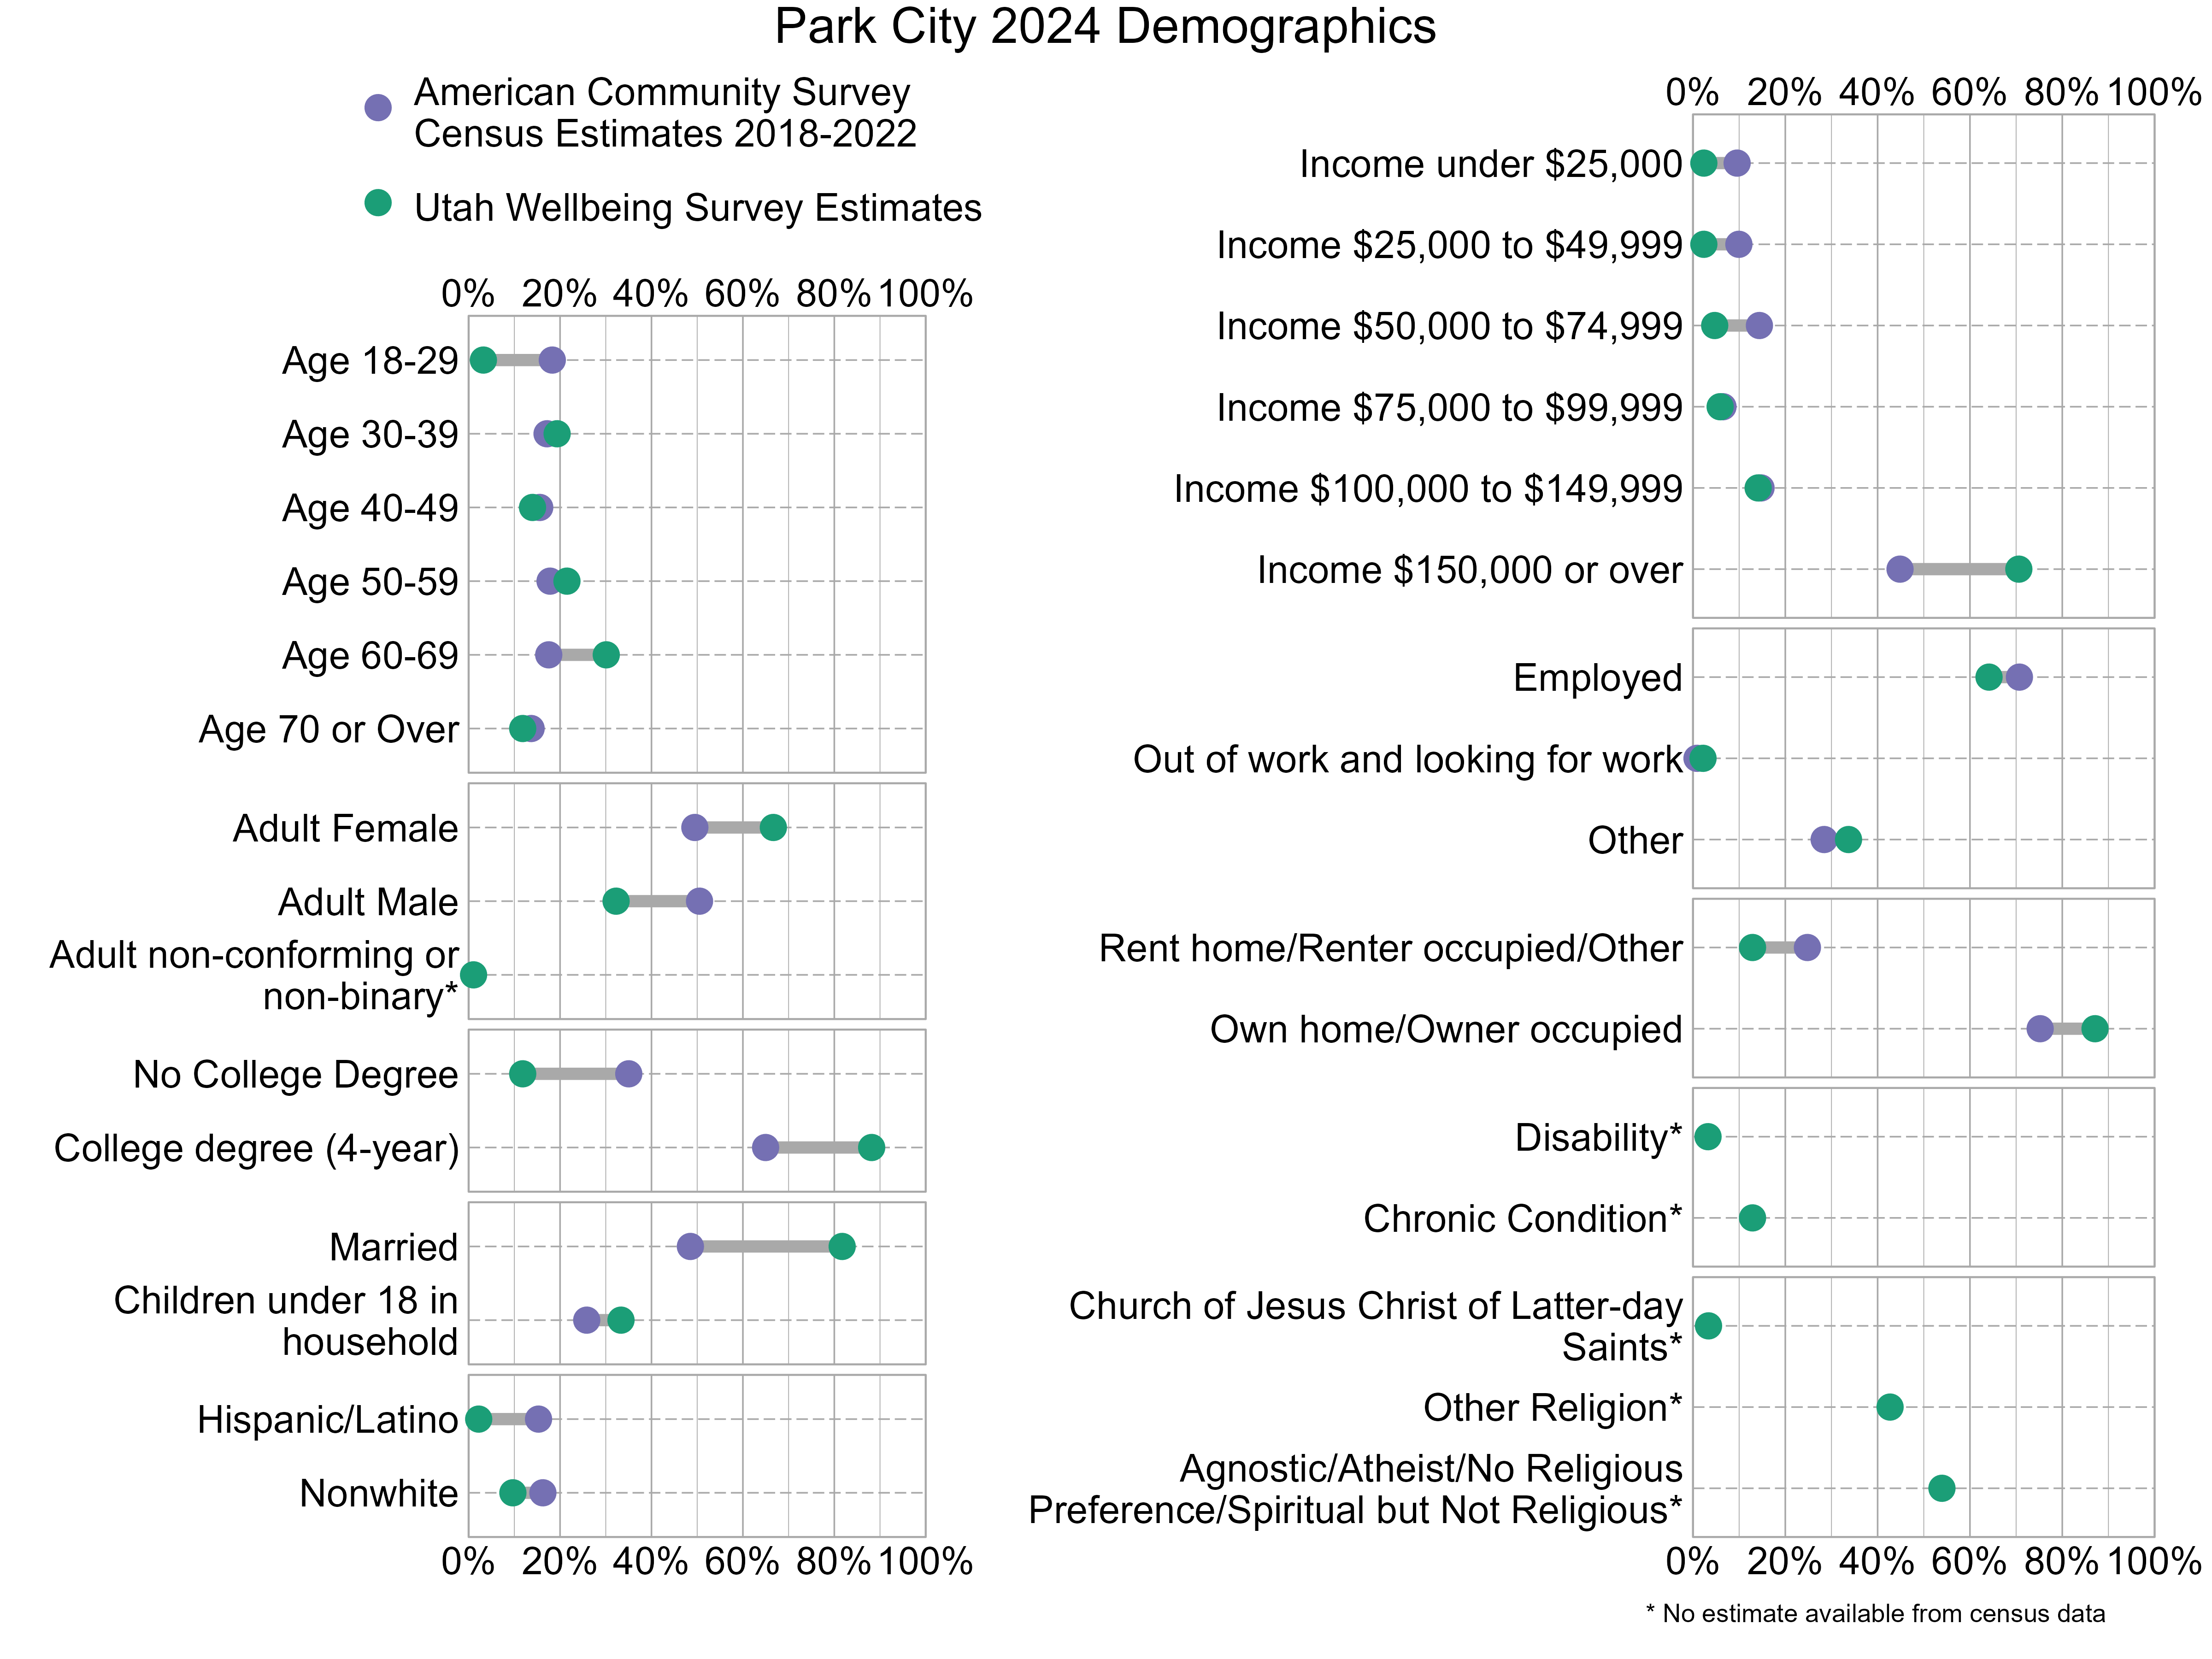
Demographic characteristics of the Park City (ZIP Code 84060) survey respondents were compared below with U.S. Census information from the 2018-2022 American Community Survey. In the graph below, gray bars indicate differences between the American Community Survey estimates and the Utah Wellbeing Project surveys. The wider the gray bars, the larger the differences. Also note that estimates for religious affiliation, adult non-conforming or non-binary gender, disability, and chronic conditions are unavailable from the census data. There can also be a variable margin of error in the American Community Survey estimates, and caution should be used when comparing estimates. Not all respondents provided demographic information. As the graph shows, the 108 Park City 2024 survey respondents were not fully representative of Park City. People who are adult females, have at least a 4-year college degree, have an income $150,000 or over, and are married were overrepresented while those who are adult males and do not have a college degree were underrepresented.
Overall Personal Wellbeing and Overall Wellbeing in the Park City Area
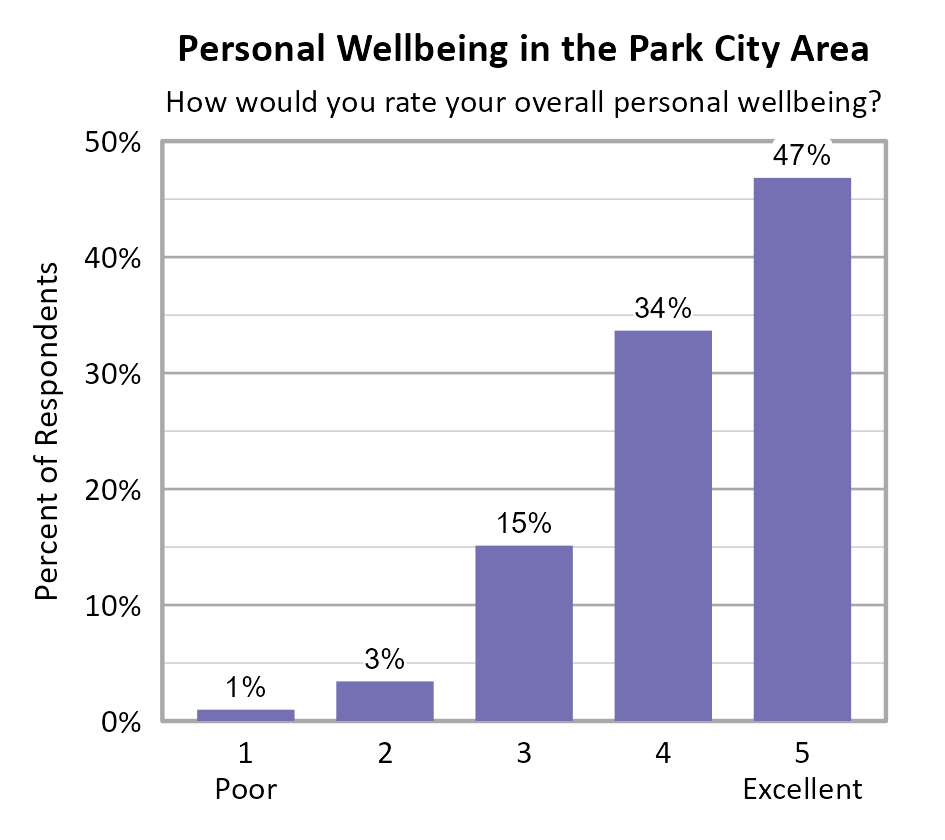
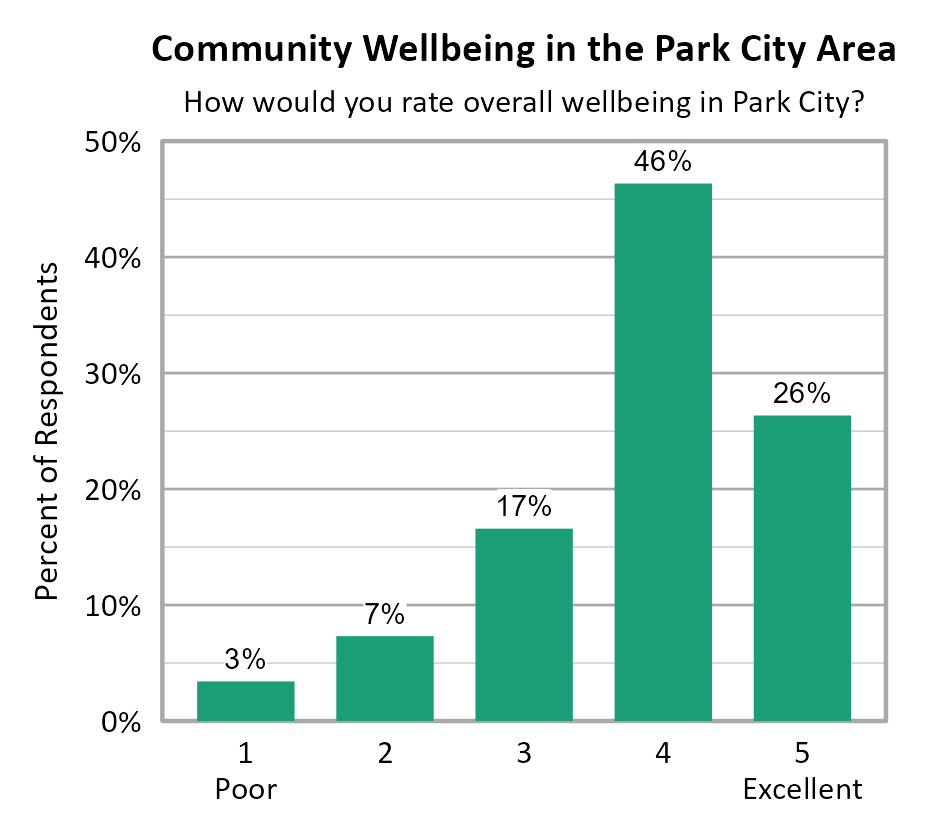
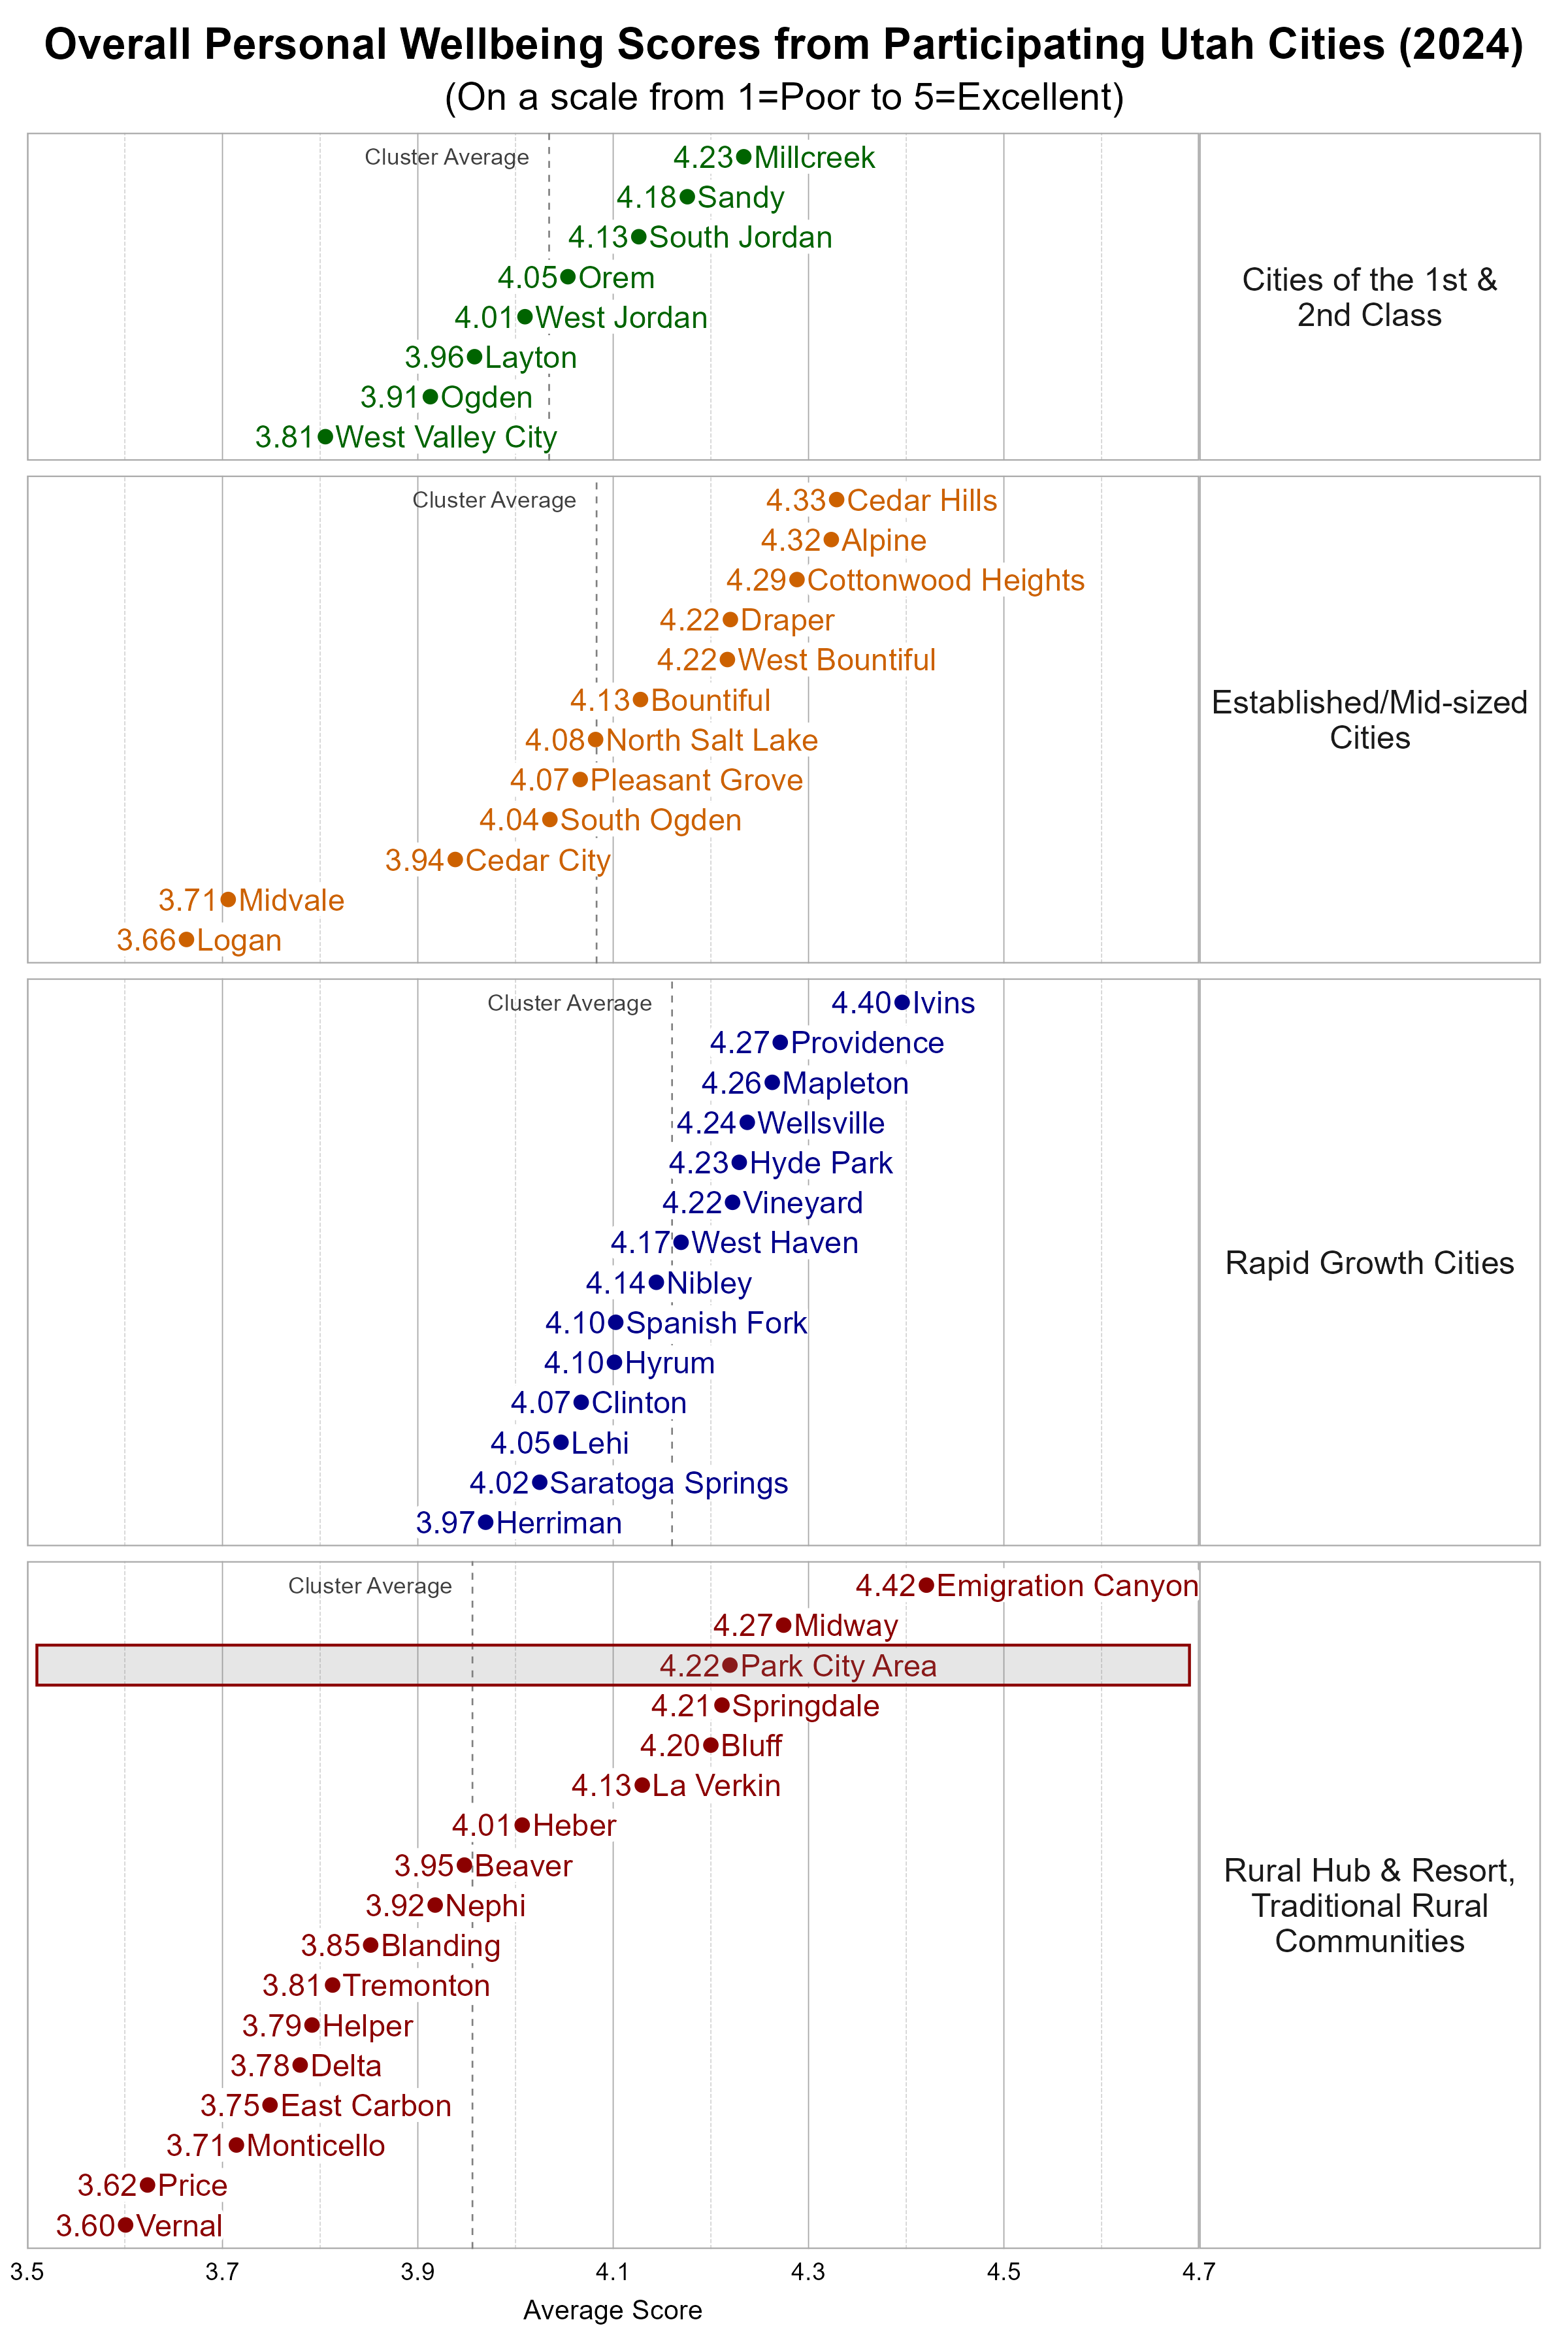
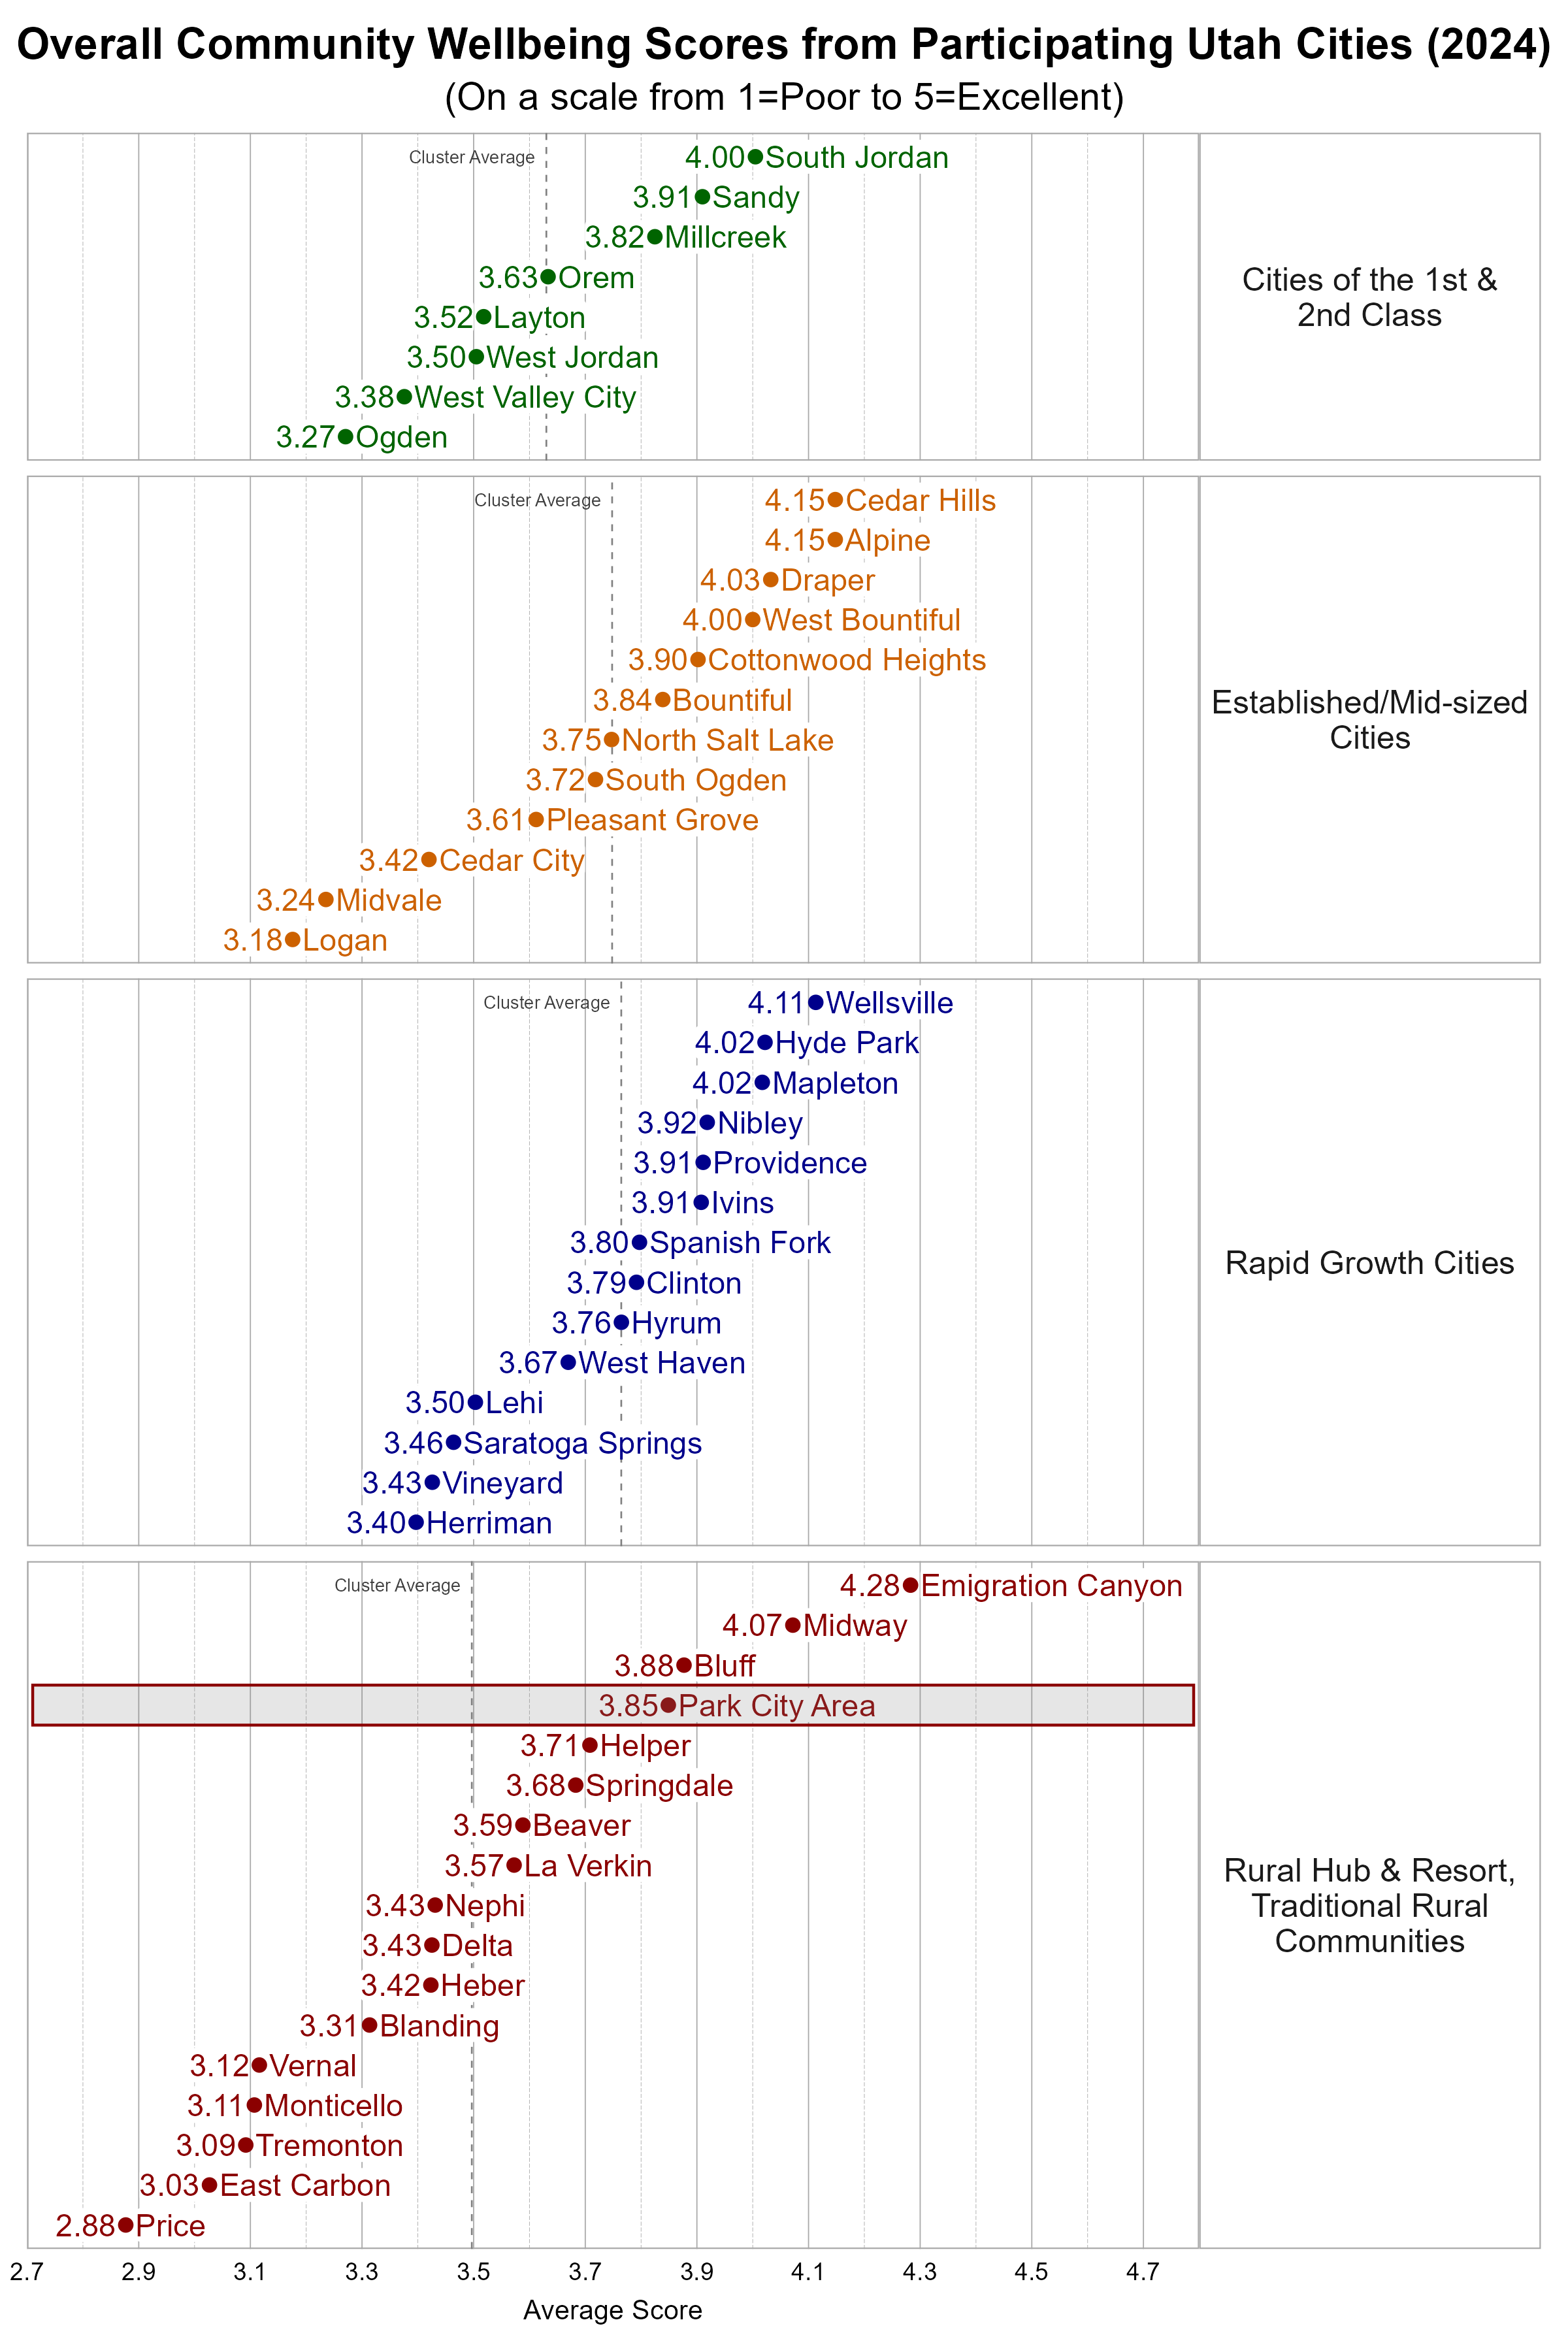
Survey participants were asked about their overall personal wellbeing and overall community wellbeing in Park City. These wellbeing indicators were both measured on a 5-point scale from poor (1) to excellent (5). The average personal wellbeing score in the Park City Area was 4.22 with 80% of respondents indicating their wellbeing at a 4 or 5 on the 5-point scale. The average score for community wellbeing in the Park City Area was 3.85 with 73% of respondents indicating community wellbeing at a 4 or 5 on the 5-point scale.
Looking at respondents from just Park City (ZIP Code 84060), the average personal wellbeing score was similar at 4.23, with 82% of respondents indicating their wellbeing at a 4 or 5 on the 5-point scale. The average score for community wellbeing in just Park City was slightly higher at 3.94, with 77% of respondents indicating community wellbeing at a 4 or 5 on the 5-point scale.
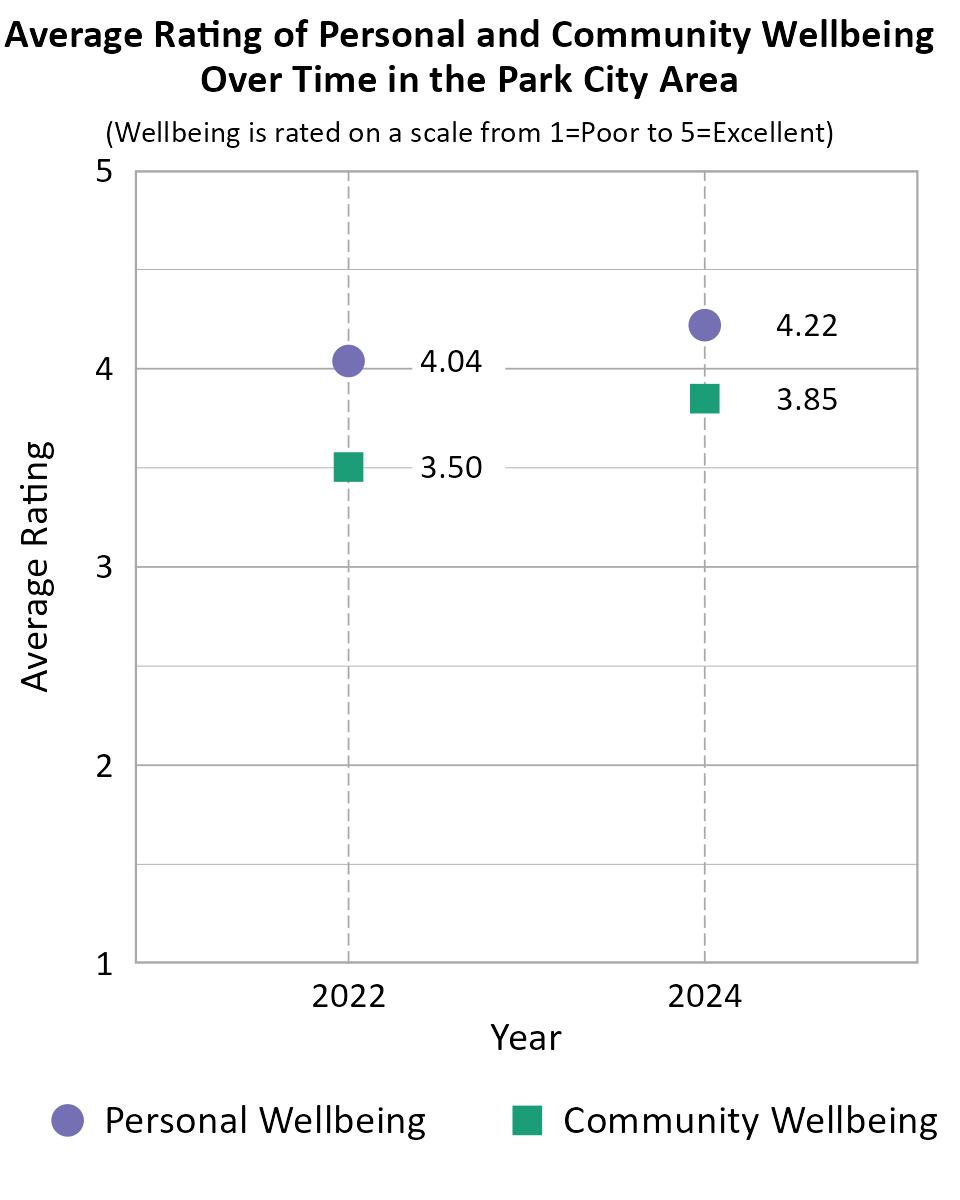
When comparing survey data from the Park City Area over the years as shown in the information below, we can see that the average personal wellbeing score and the average community wellbeing score improved between 2022 and 2024. Note that the number of respondents differed between years, there is no tracking of individuals from one year to the next, and the low end of the scale was "Poor" in 2024 but "Very Poor" in prior years which may account for differences in scores over time.
Comparing Wellbeing Across Utah Cities
The Utah League of Cities and Towns clusters cities and towns into five different categories based on size and growth rates. We utilize these clusters in our analysis. Park City is classified as a Rural Hub/Resort Community (and we have combined these with the Traditional Rural Communities). Some cities may fit within more than one cluster.
Within the Rural city cluster, the Park City Area was above the average overall personal wellbeing score and above the average overall community wellbeing score.
Wellbeing Domains in the Park City Area
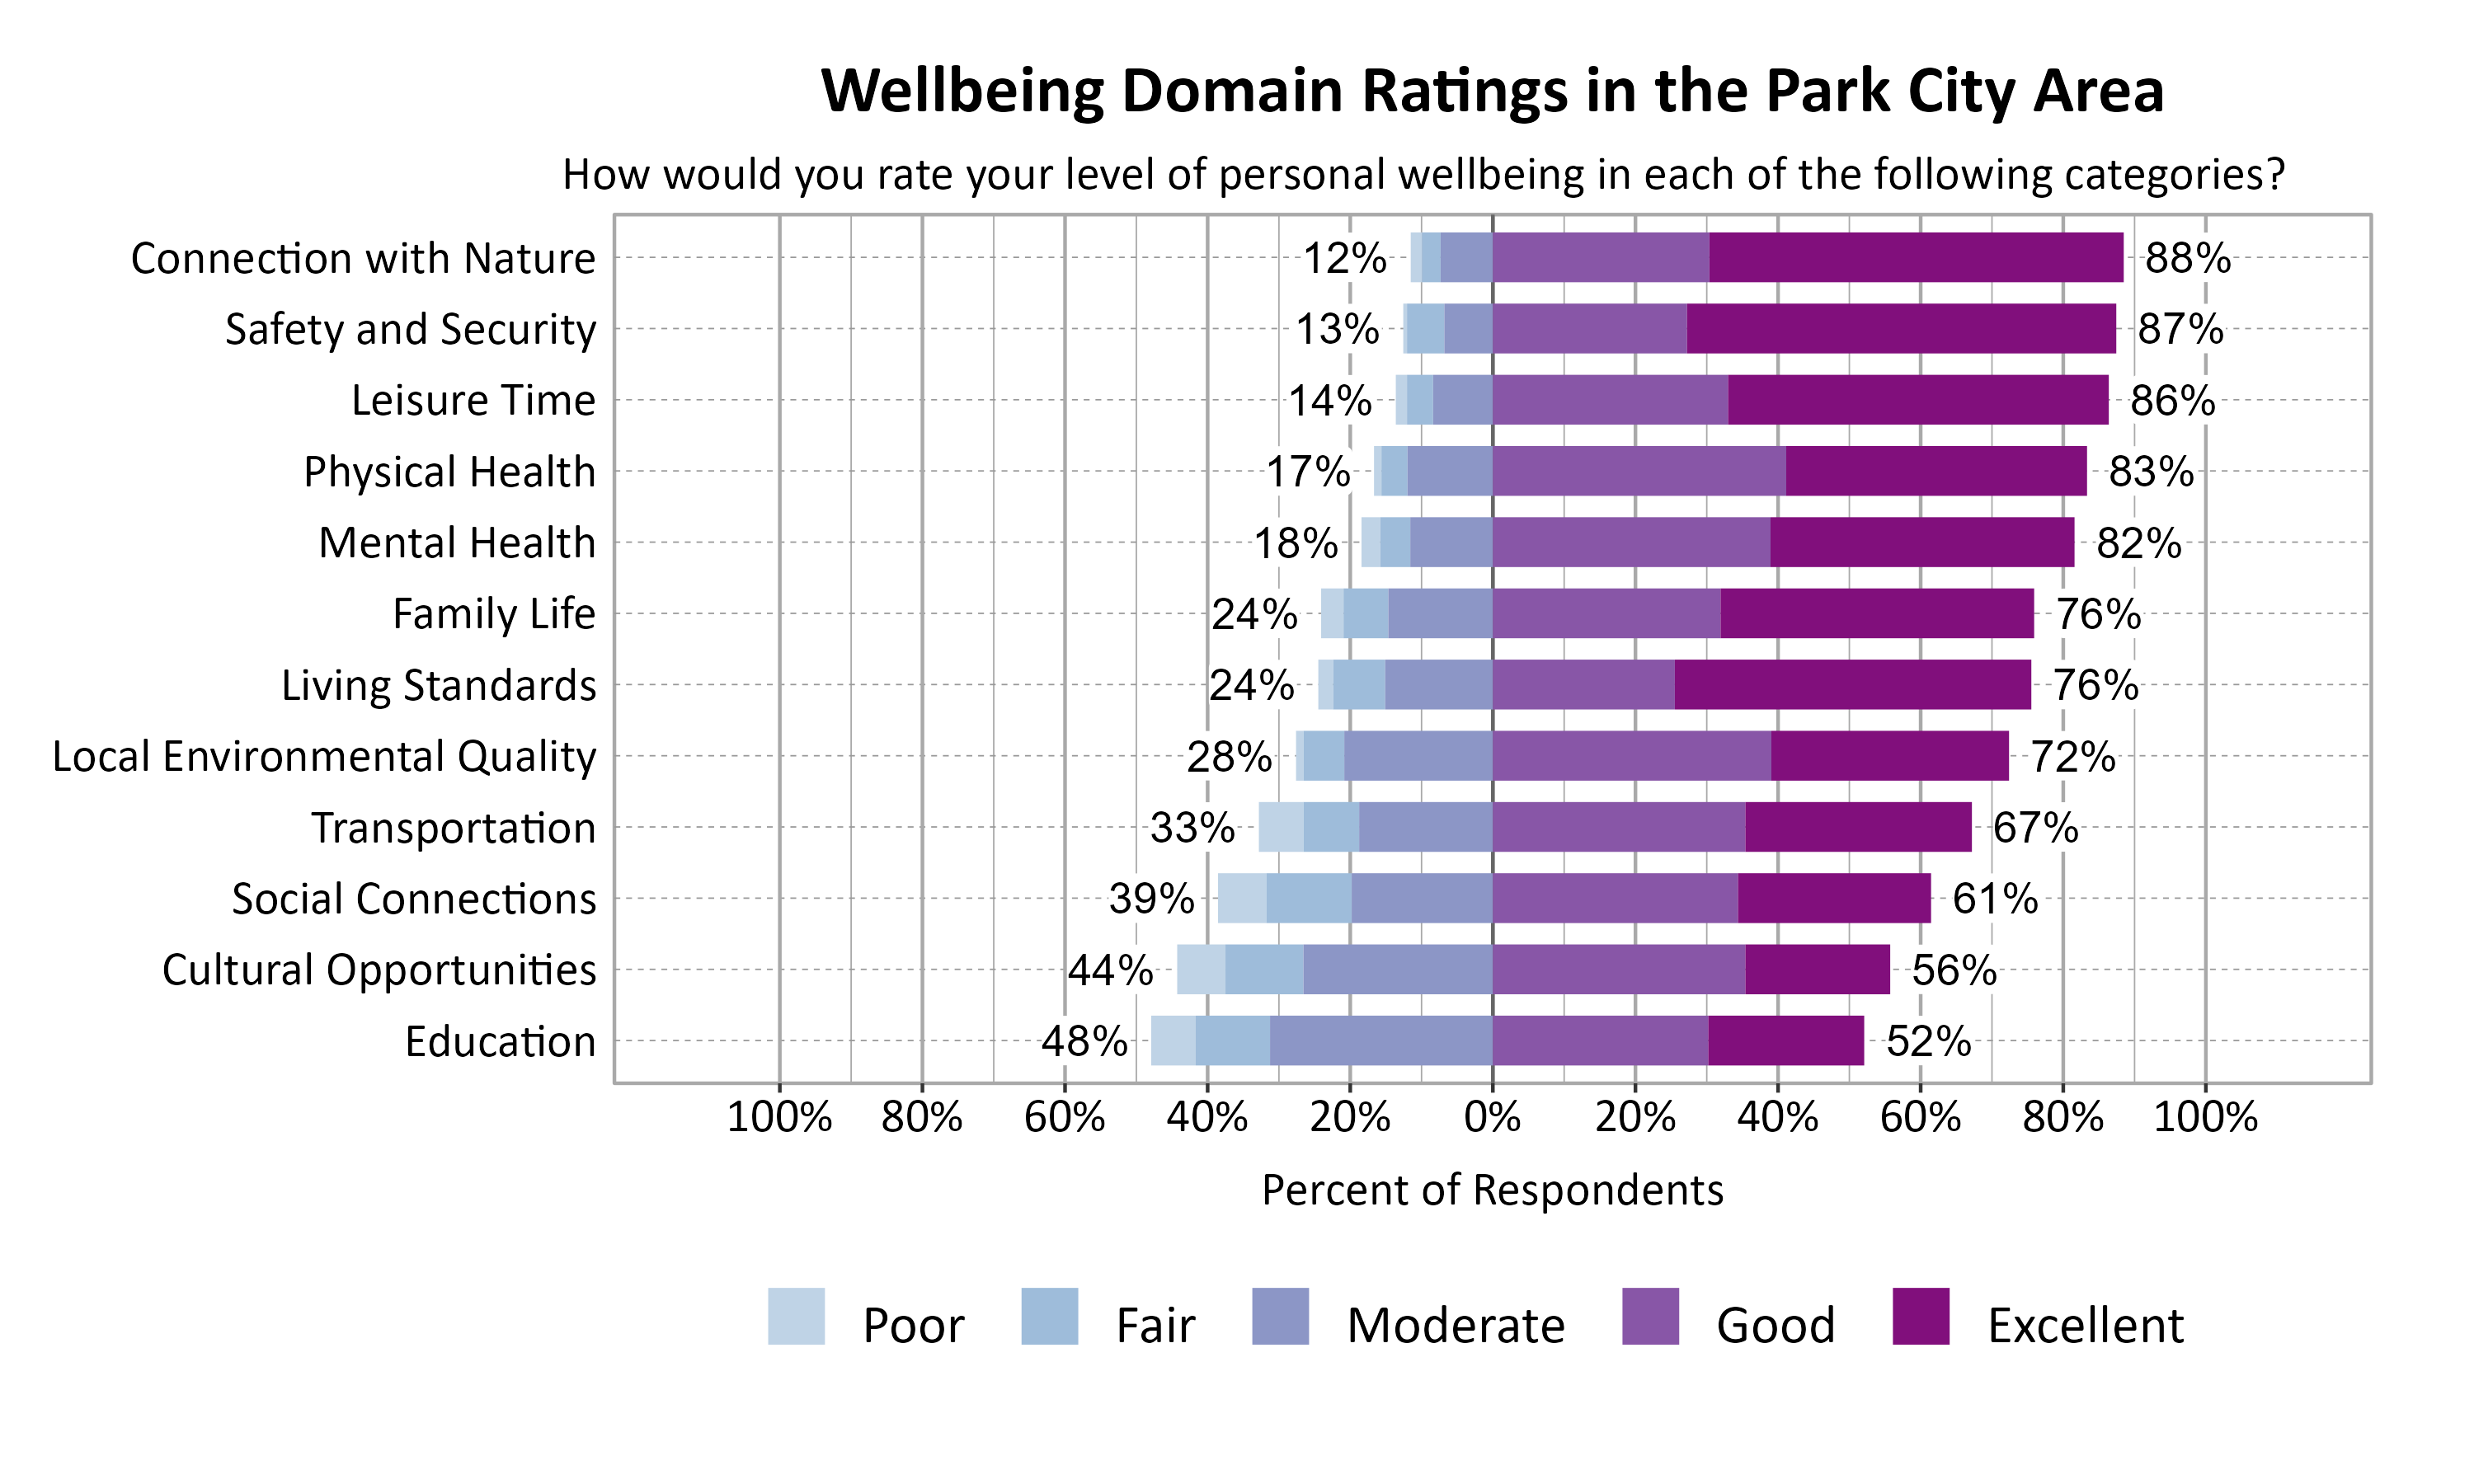
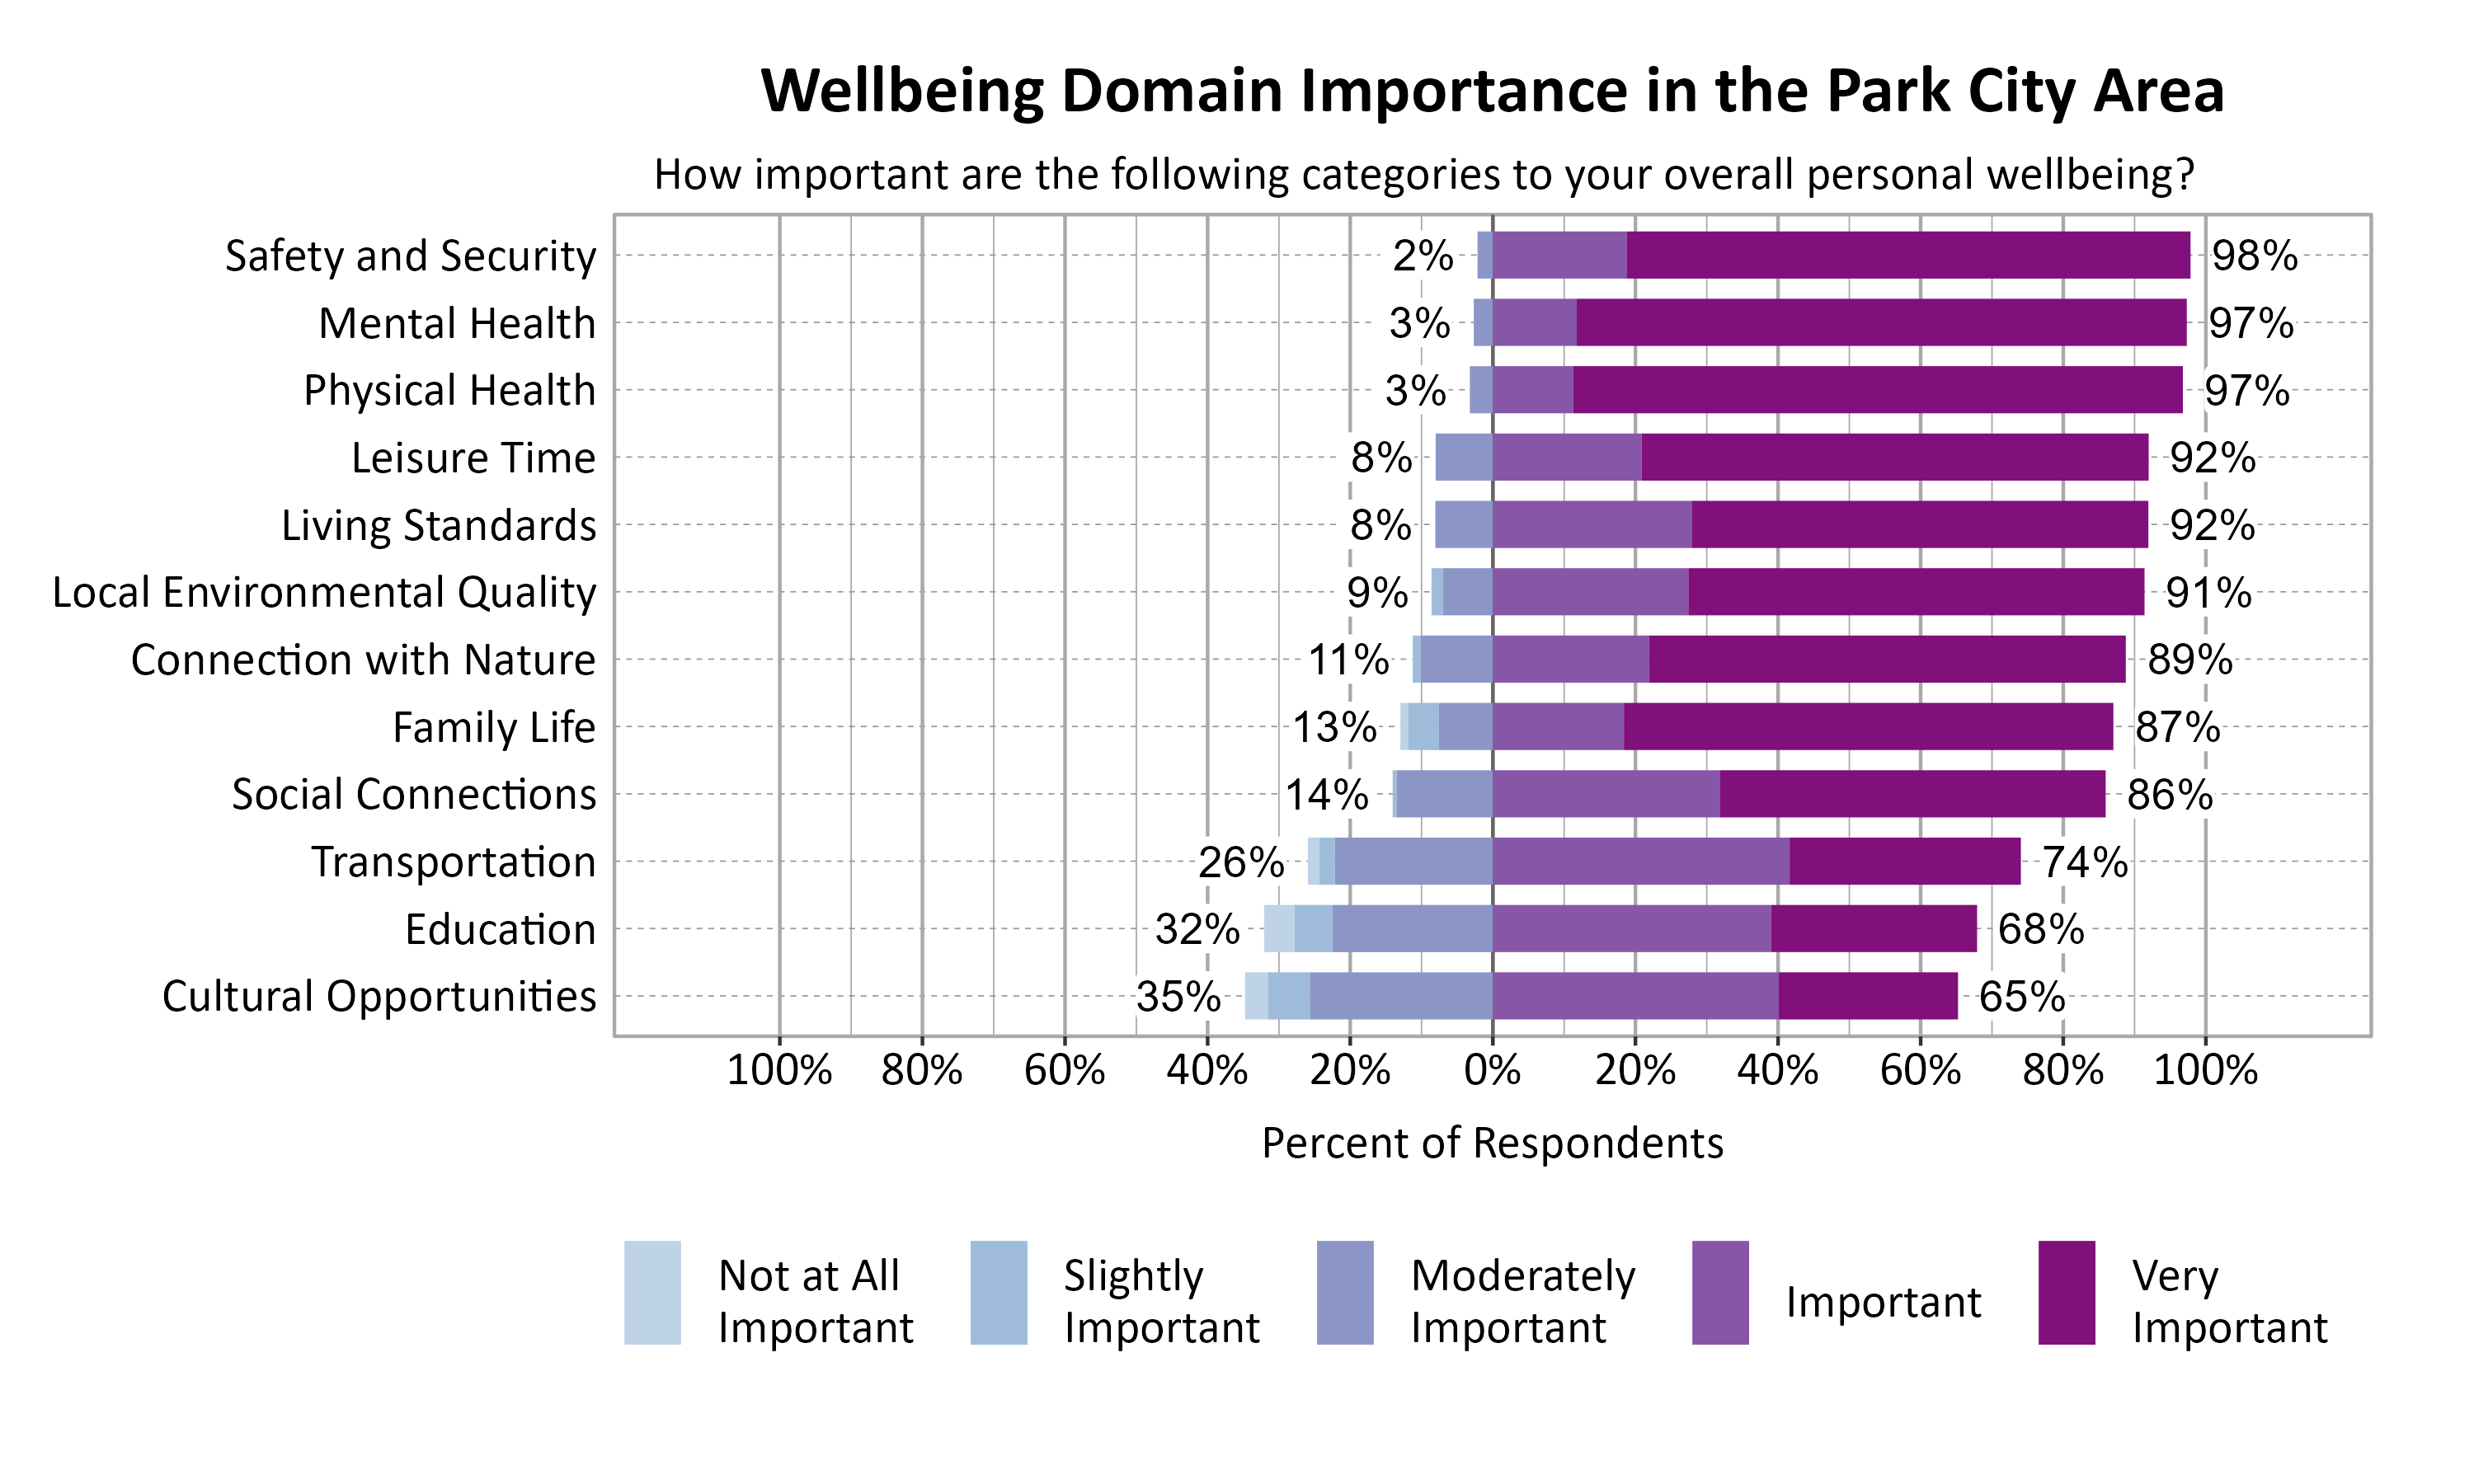
According to national and international entities that track wellbeing, there are a number of common dimensions or domains of wellbeing. Survey respondents rated twelve domains on a 5-point scale from poor to excellent. They were also asked to indicate the importance of each domain to their overall personal wellbeing on a 5-point scale from not at all important to very important. The highest rated wellbeing domains for respondents in the Park City Area were Connection with Nature (88%), Safety and Security (87%), and Leisure Time (86%). The most important wellbeing domains were Safety and Security (98%), Mental Health (97%), and Physical Health (97%).
Looking at respondents from just Park City (ZIP Code 84060), the highest rated wellbeing domains for respondents were Leisure Time (89%), Connection with Nature (88%), Safety and Security (84%), and Mental Health (84%). Cultural Opportunities also saw a 6% increase in respondents indicating a 4 or 5 on the 5-point scale. The most important wellbeing domains were very similar.
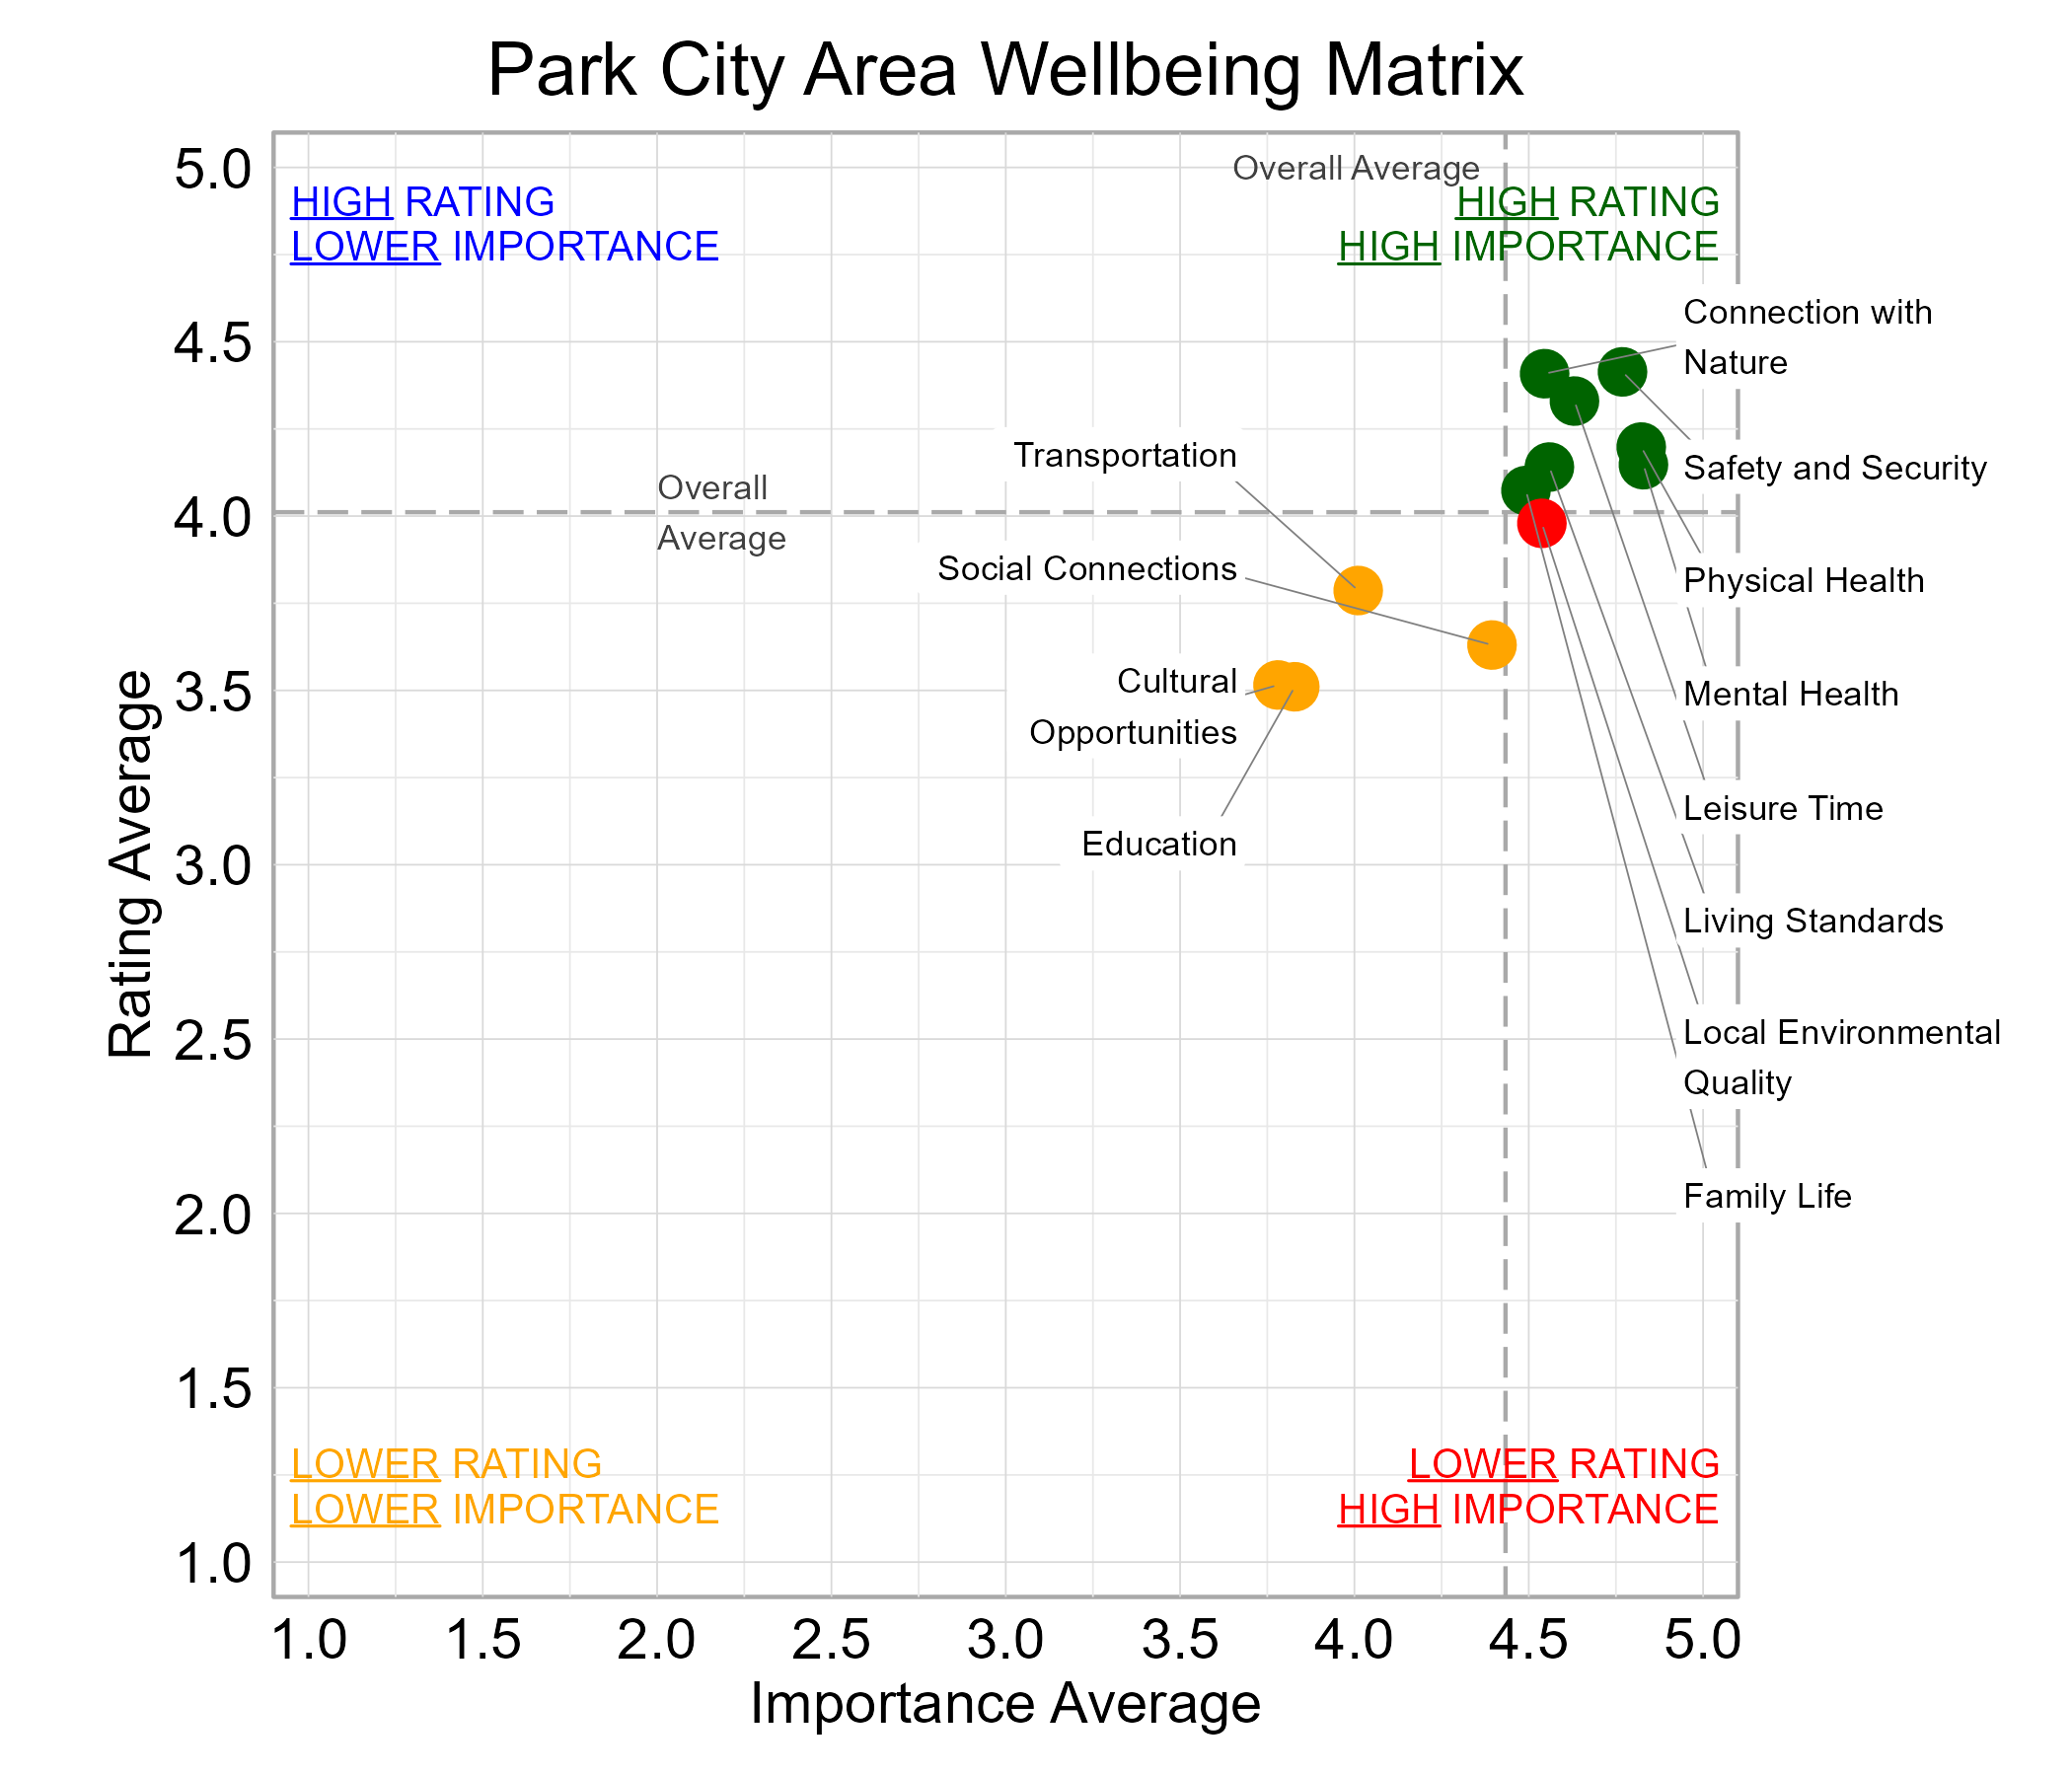
Wellbeing Matrix for the Park City Area
The graph below illustrates the relationship between the average rating and the average importance of wellbeing domains for survey respondents from the Park City Area. Connection with Nature, Family Life, Leisure Time, Living Standards, Mental Health, Physical Health, and Safety and Security were highly important and rated above average among the domains. Local Environmental Quality fell in the “red zone” of higher importance and lower ratings. No domains changed quadrants when looking at responses from just Park City (ZIP Code 84060).
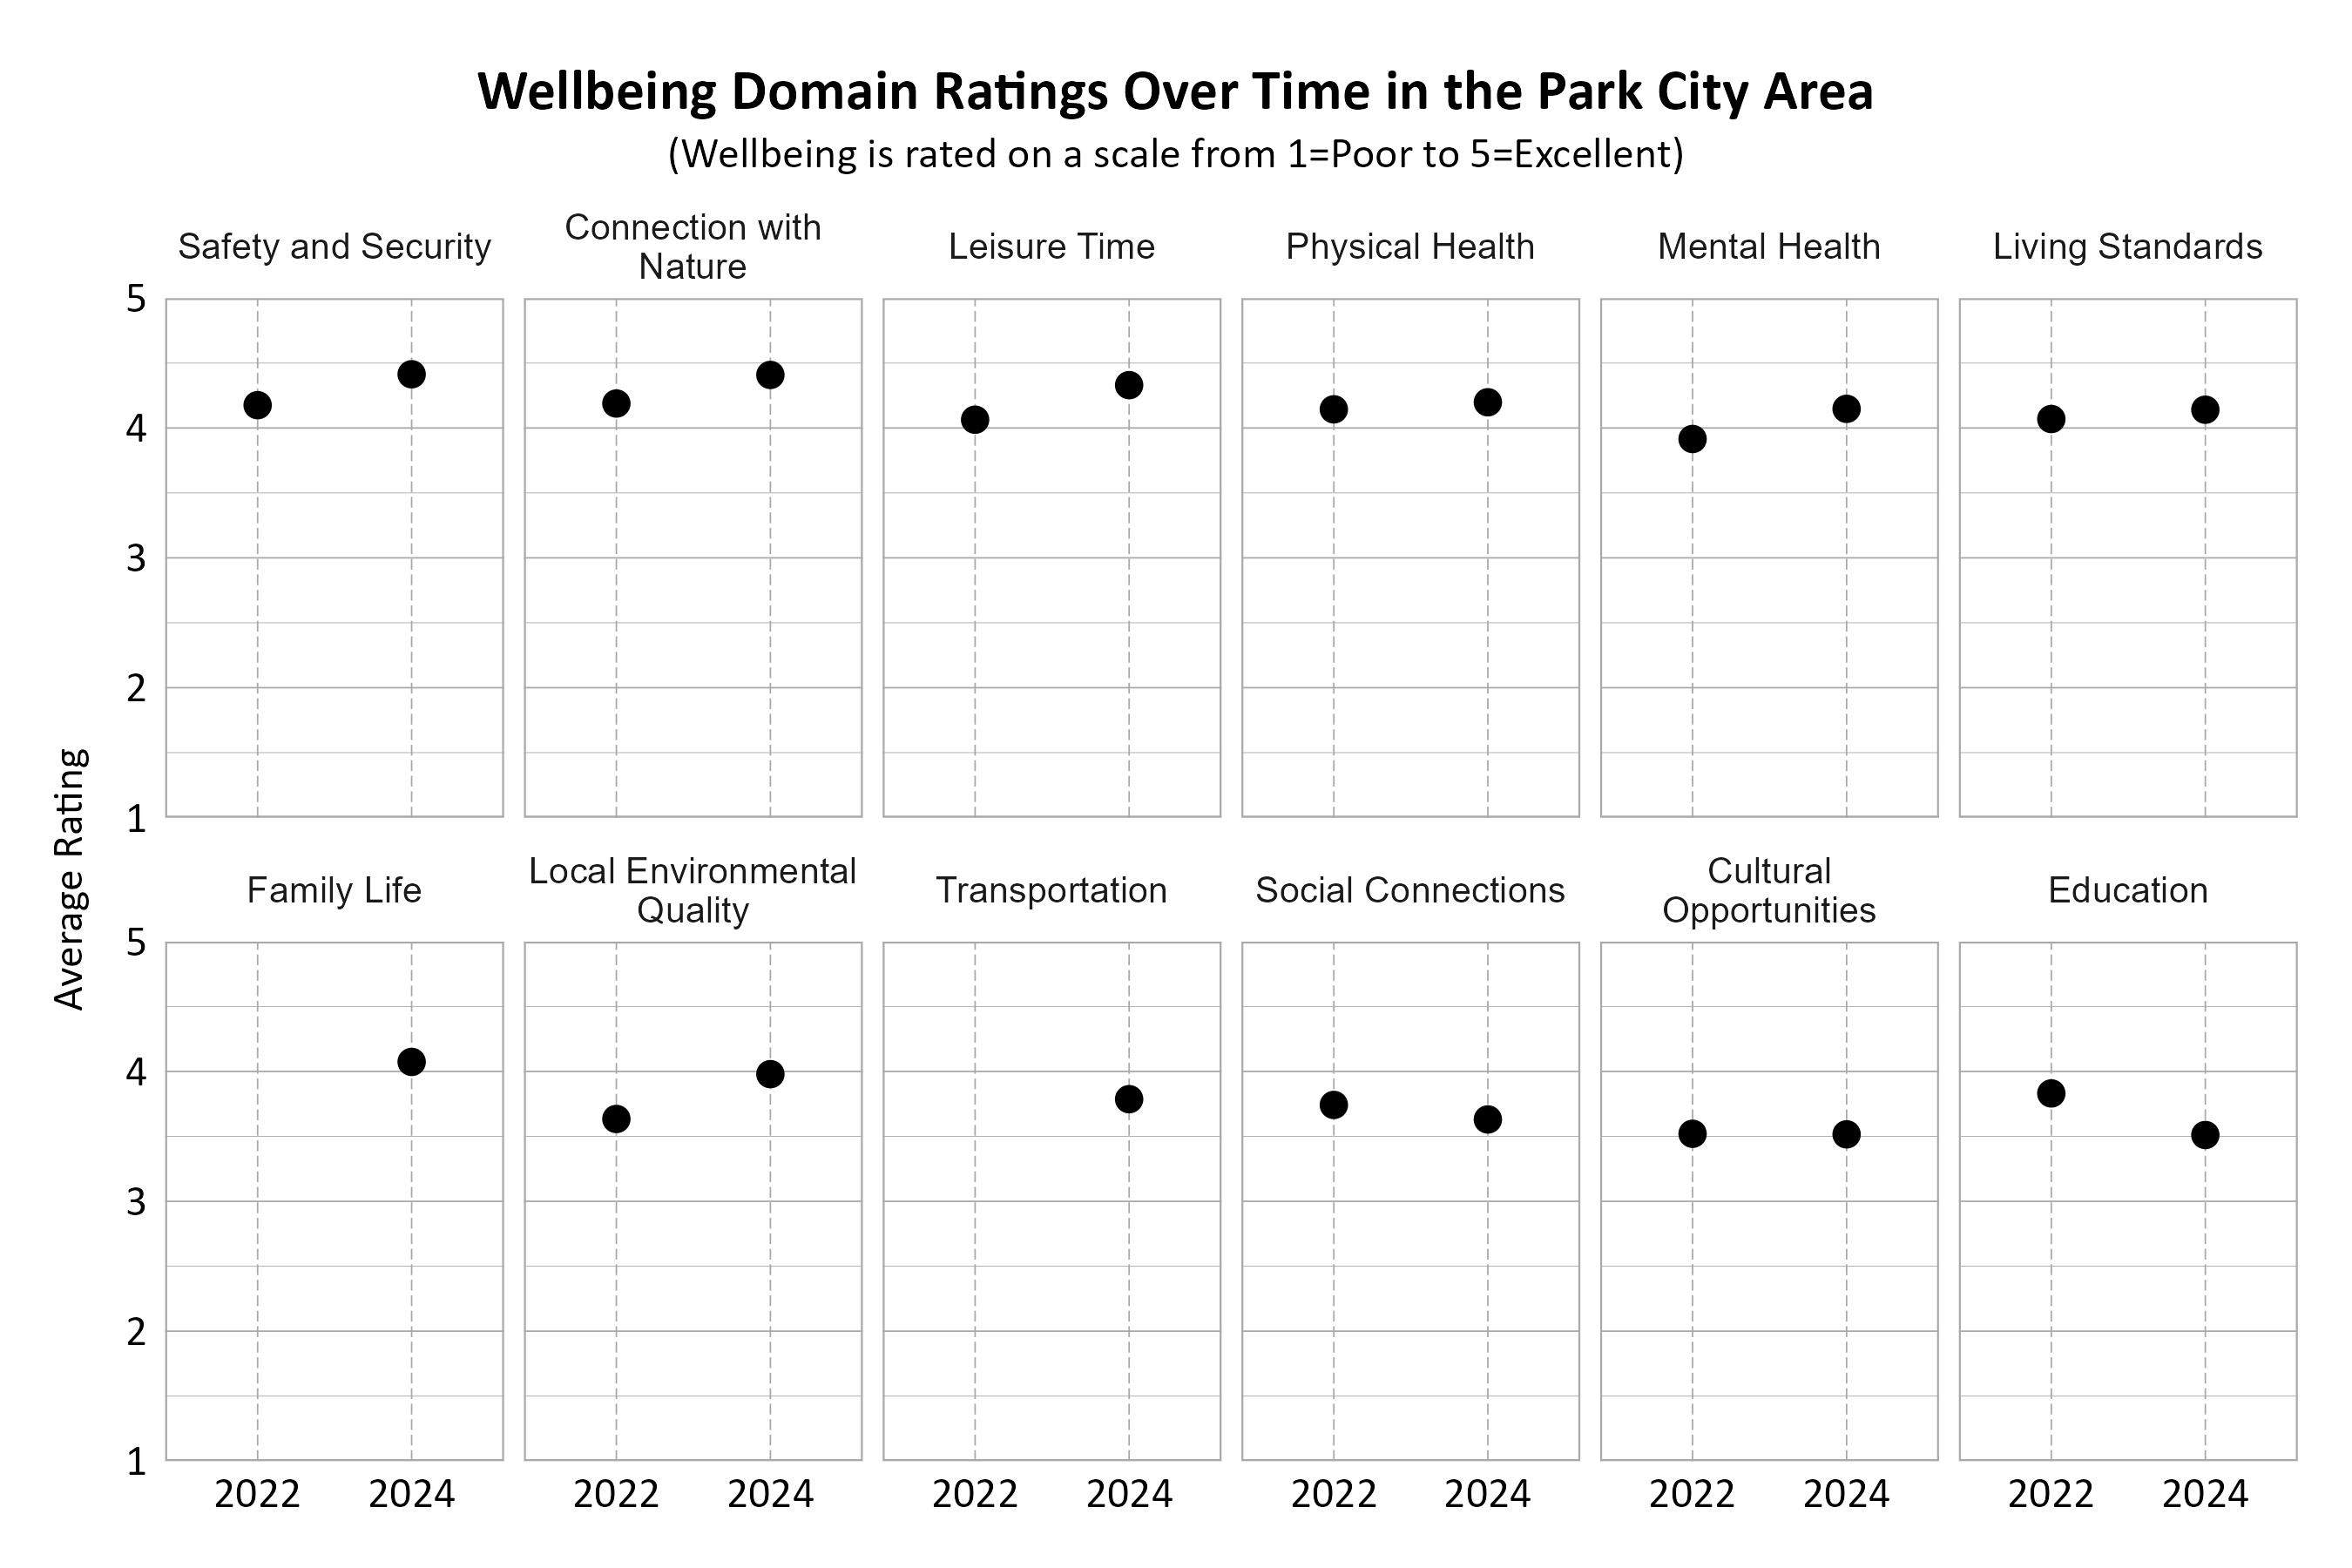
Wellbeing Domains Over Time in the Park City Area
The graphs below show how the domains were rated over the years by the Park City Area residents. The number of respondents changed over time. Note that the two domains Family Life and Transportation were new categories in the 2024 survey and were not measured in previous years. Almost all of the domains increased in their overall ratings, except for Social Connections and Education which decreased. Safety and Security and Connection with Nature were consistently among the top rated domains in both survey years.
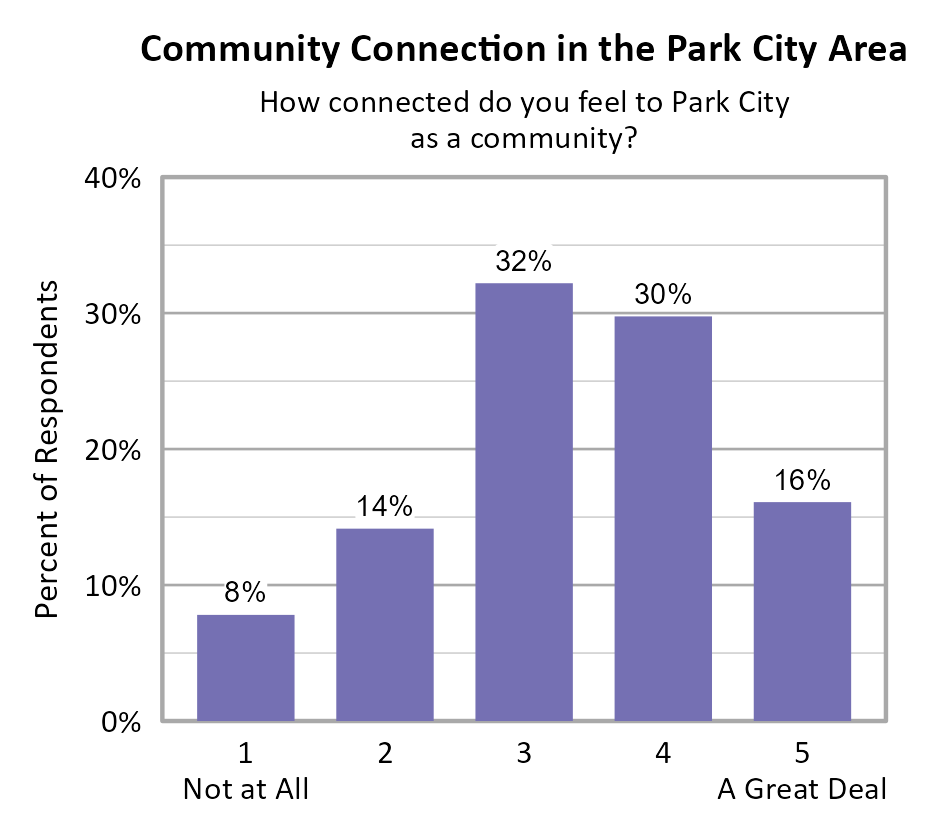
Community Connection in the Park City Area
Survey participants were asked about how connected they feel to Park City on a 5-point scale from not at all (1) to a great deal (5), and the average score of all respondents was 3.32.
Looking at respondents from just Park City (ZIP Code 84060), the average community connection score was higher at 3.41.
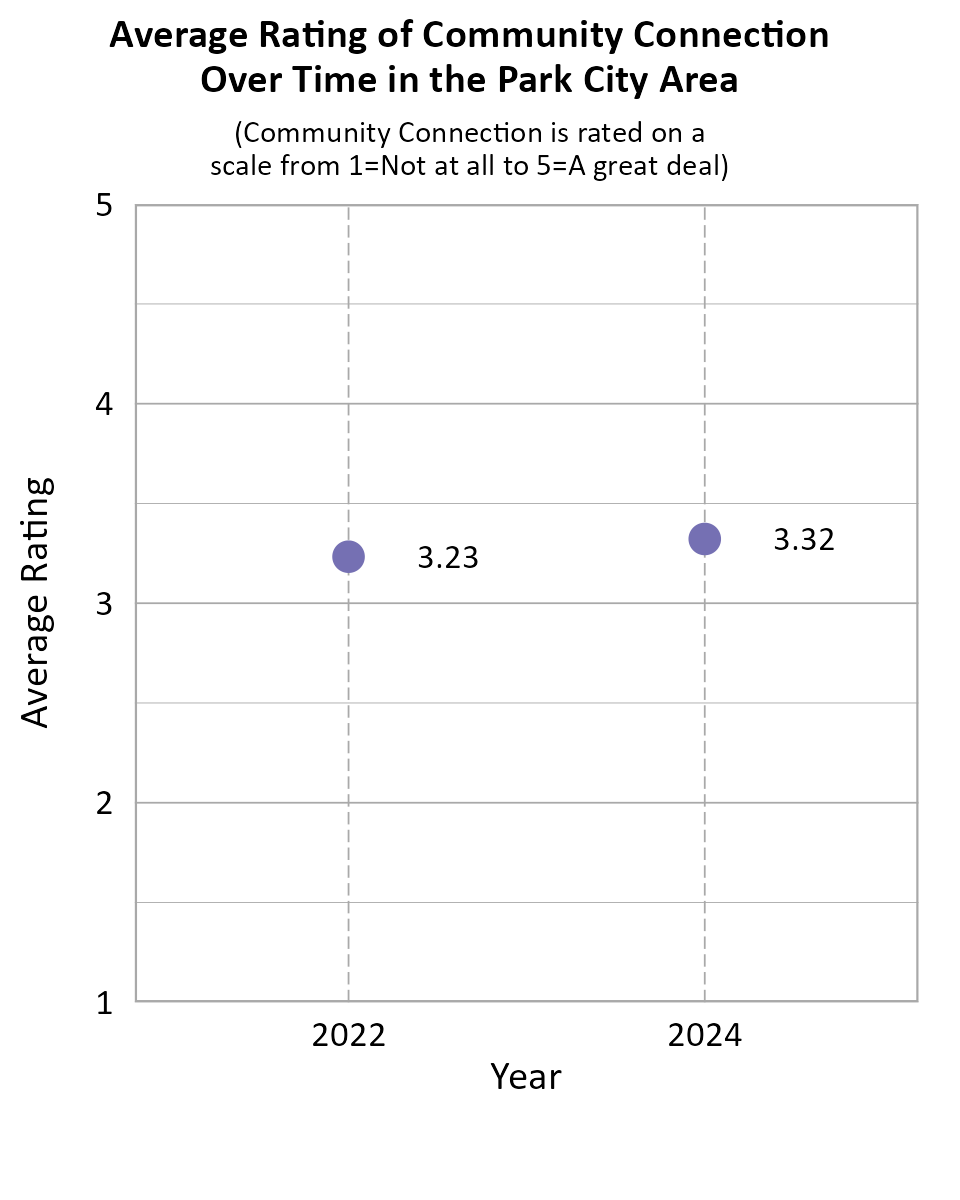
When comparing survey data from the Park City Area over the years as shown in the information below, we can see that the average community connection score improved between 2022 and 2024.
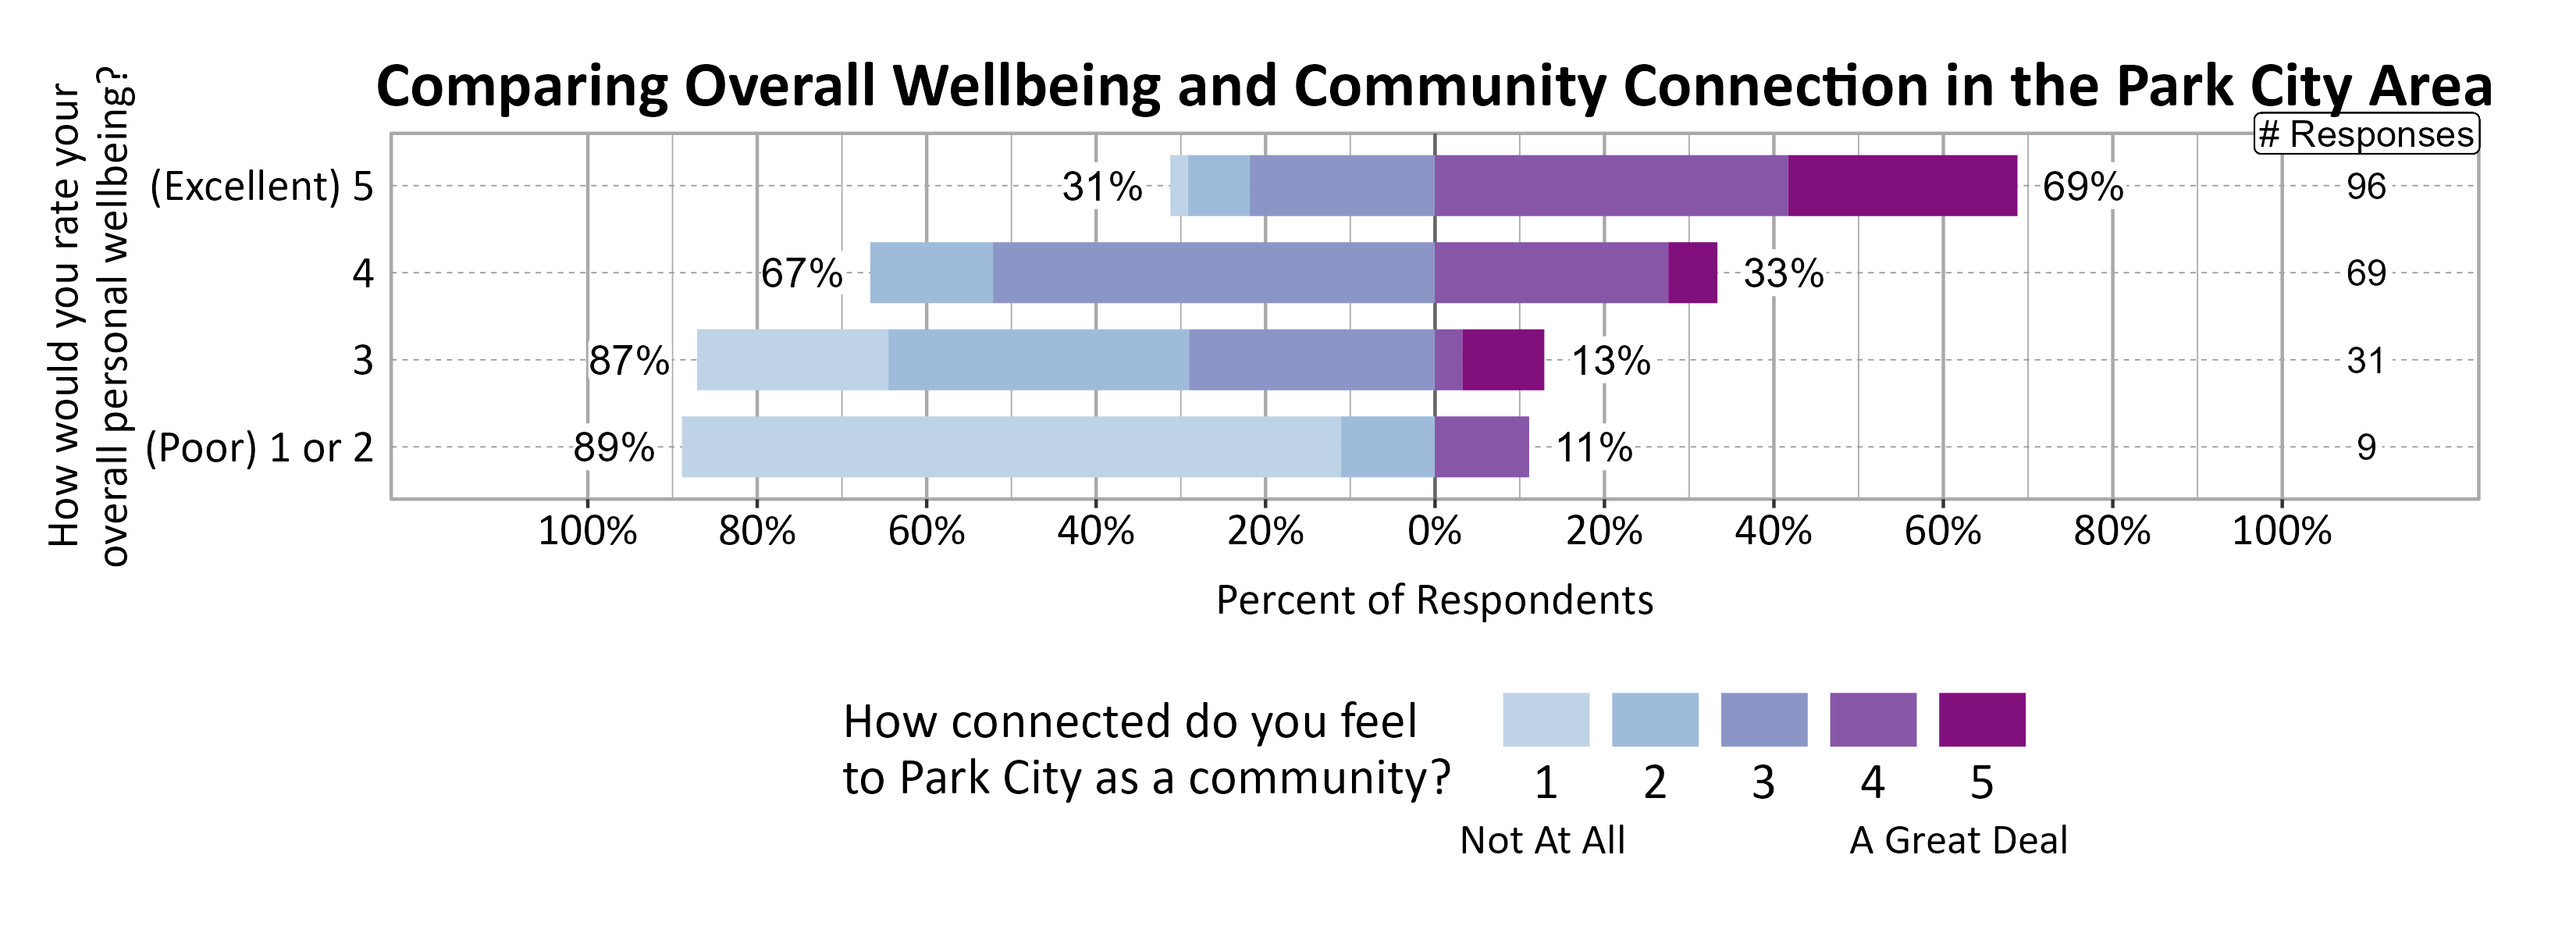
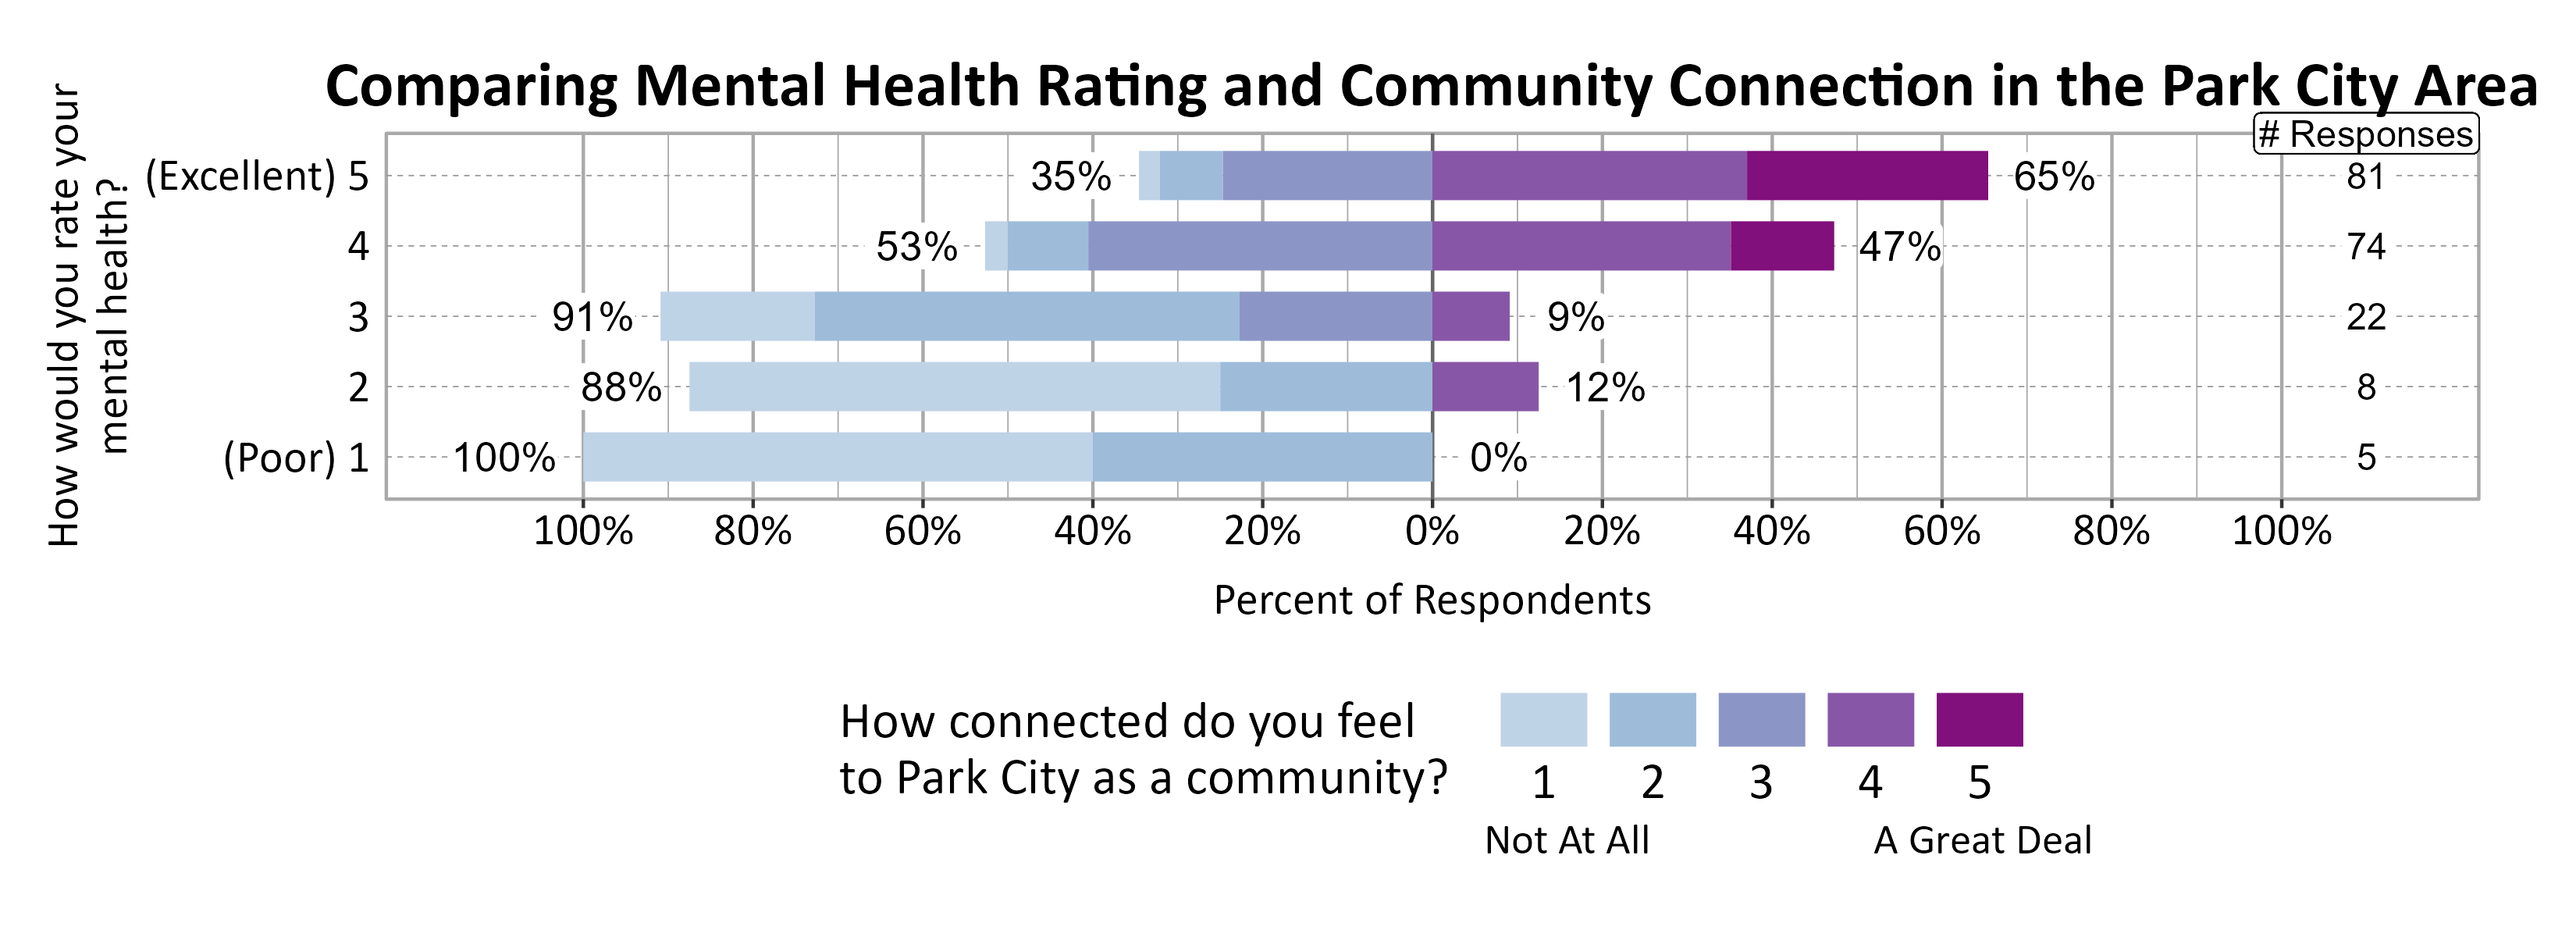
A positive relationship was found between individuals’ community connection and overall personal wellbeing, and to some extent between community connection and mental health.
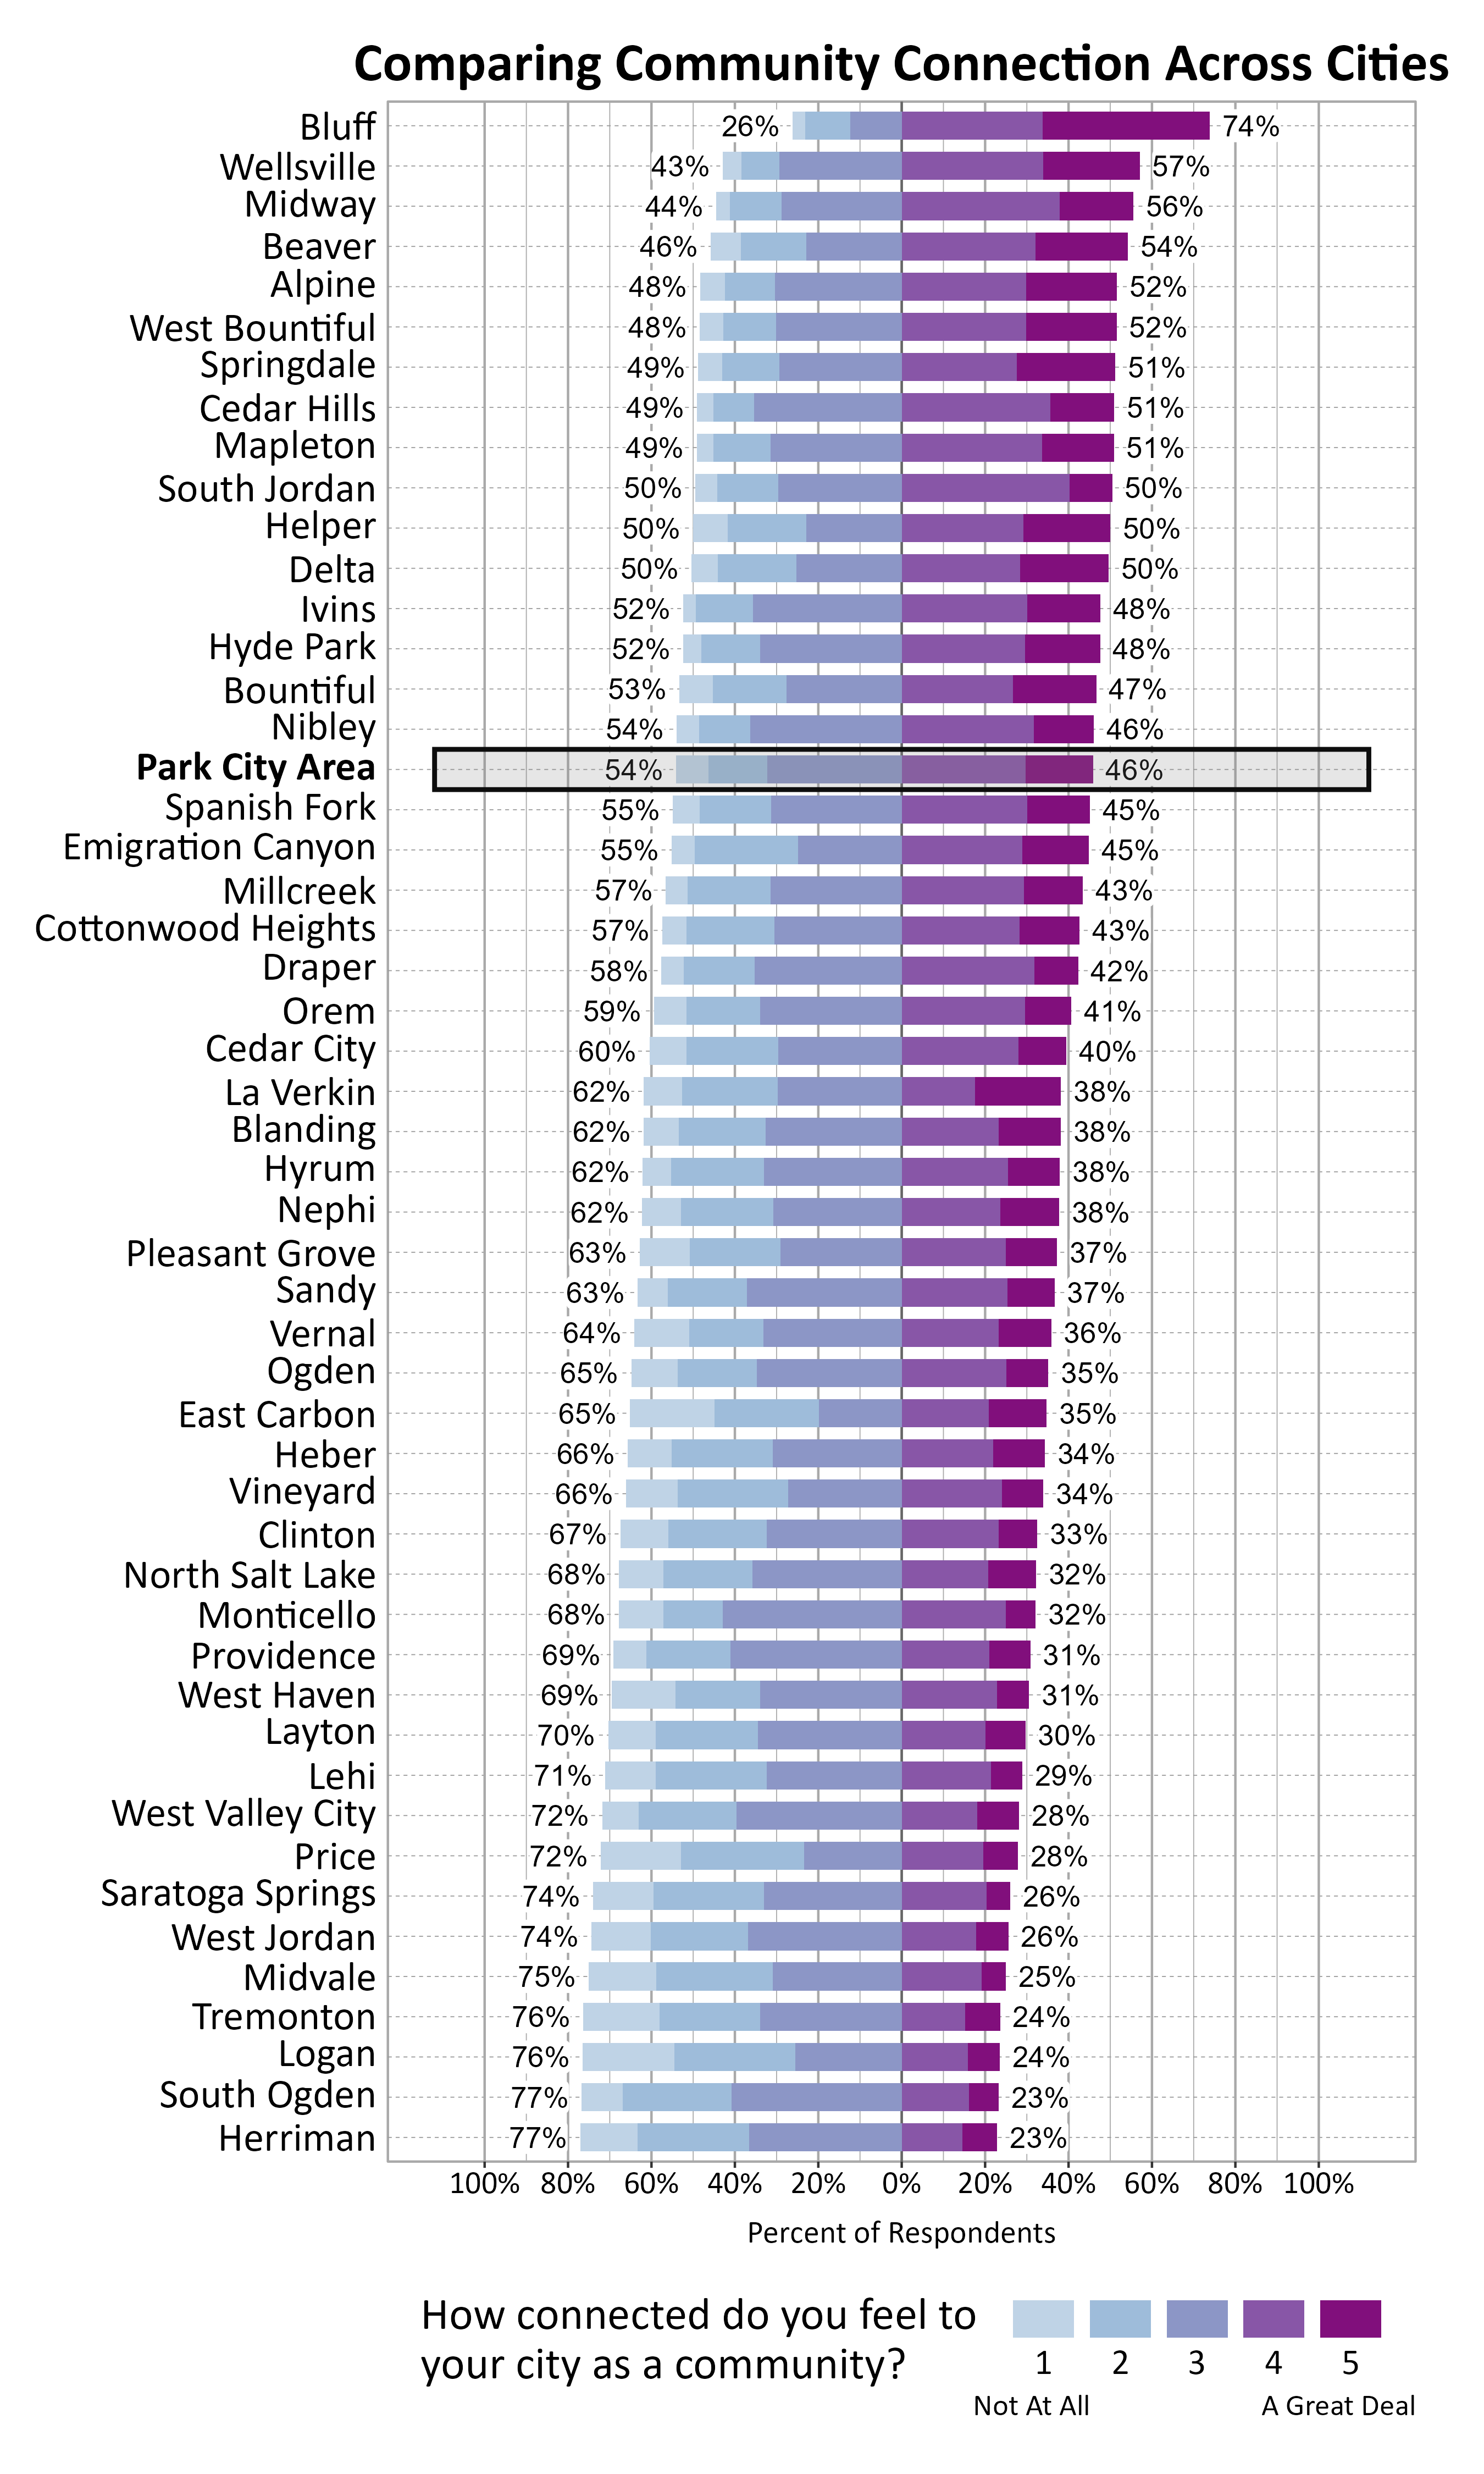
The graph below shows how Wellbeing Project cities and towns compare on feelings of community connection based on the percentage of respondents who answered 4 or a 5 on a 5-point scale from “not at all” to “a great deal” connected to their city or town. The Park City Area ranked 17 out of the 51 cities that participated.
Looking at responses from just Park City (ZIP Code 84060), the ranking improves to 10th, with 50% of respondents indicating a 4 or 5 on the 5-point scale.
Participation in Recreation and Nature-Related Activities
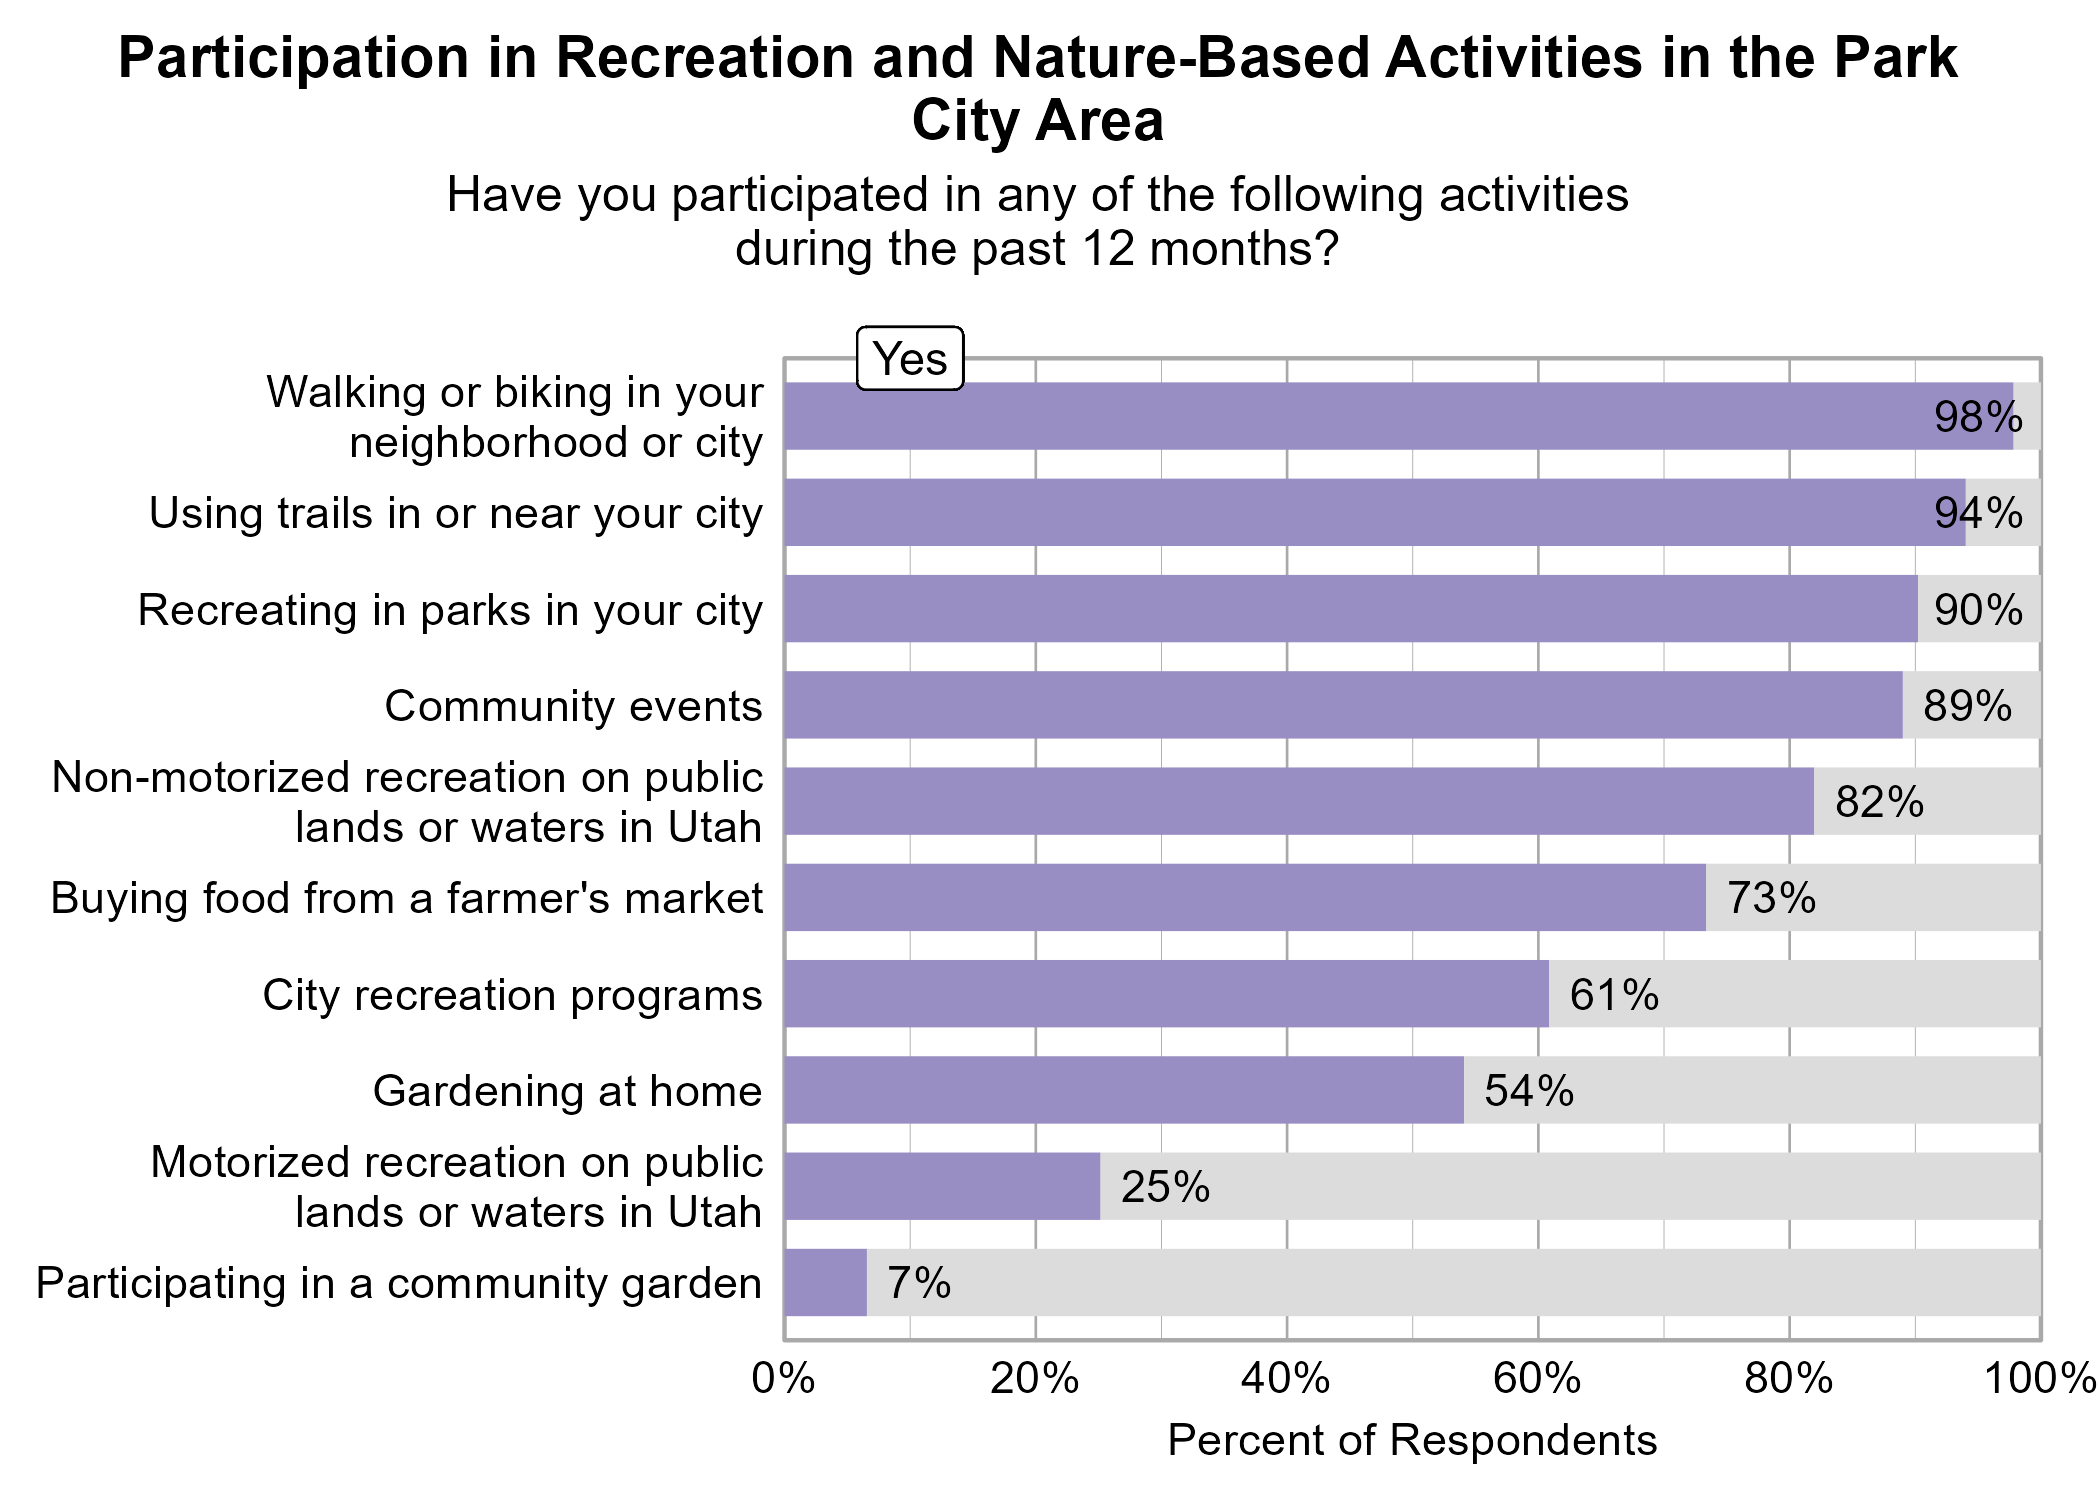
Respondents were asked to indicate whether or not they participated in various activities in the last 12 months. The most popular activities were walking or biking in your neighborhood or city (98%), using trails in or near your city (94%), recreating in parks in your city (90%), and community events (89%). Results were similar when looking at responses from just Park City (ZIP Code 84060).
Buying food from a farmer's market, gardening at home, and non-motorized recreation on public lands or waters in Utah were significantly related to higher ratings of personal wellbeing and community wellbeing.
Buying food from a farmer's market, participating in city recreation programs, and gardening at home were significantly related to higher ratings of community connection.
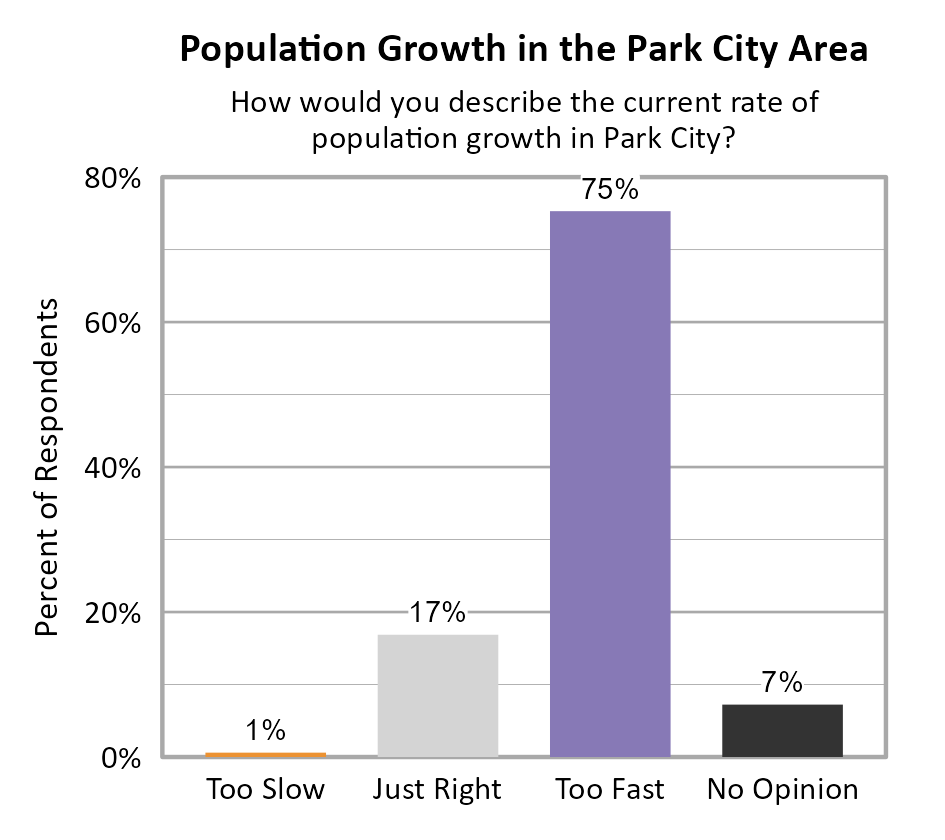
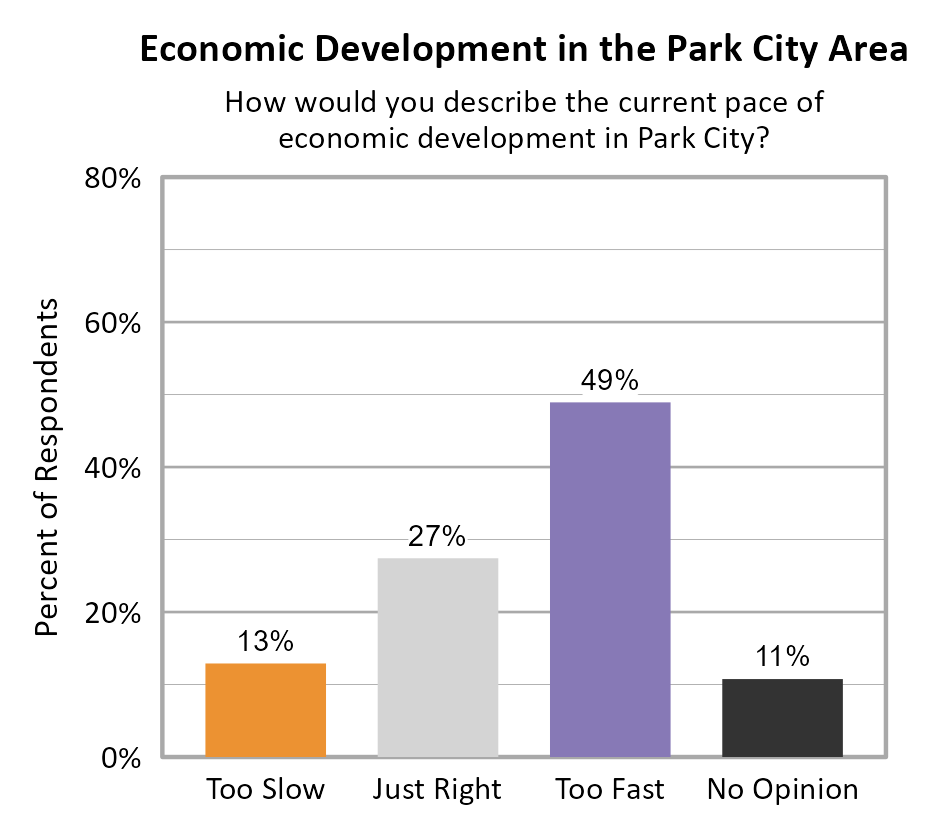
Perspectives on Population Growth and Economic Development
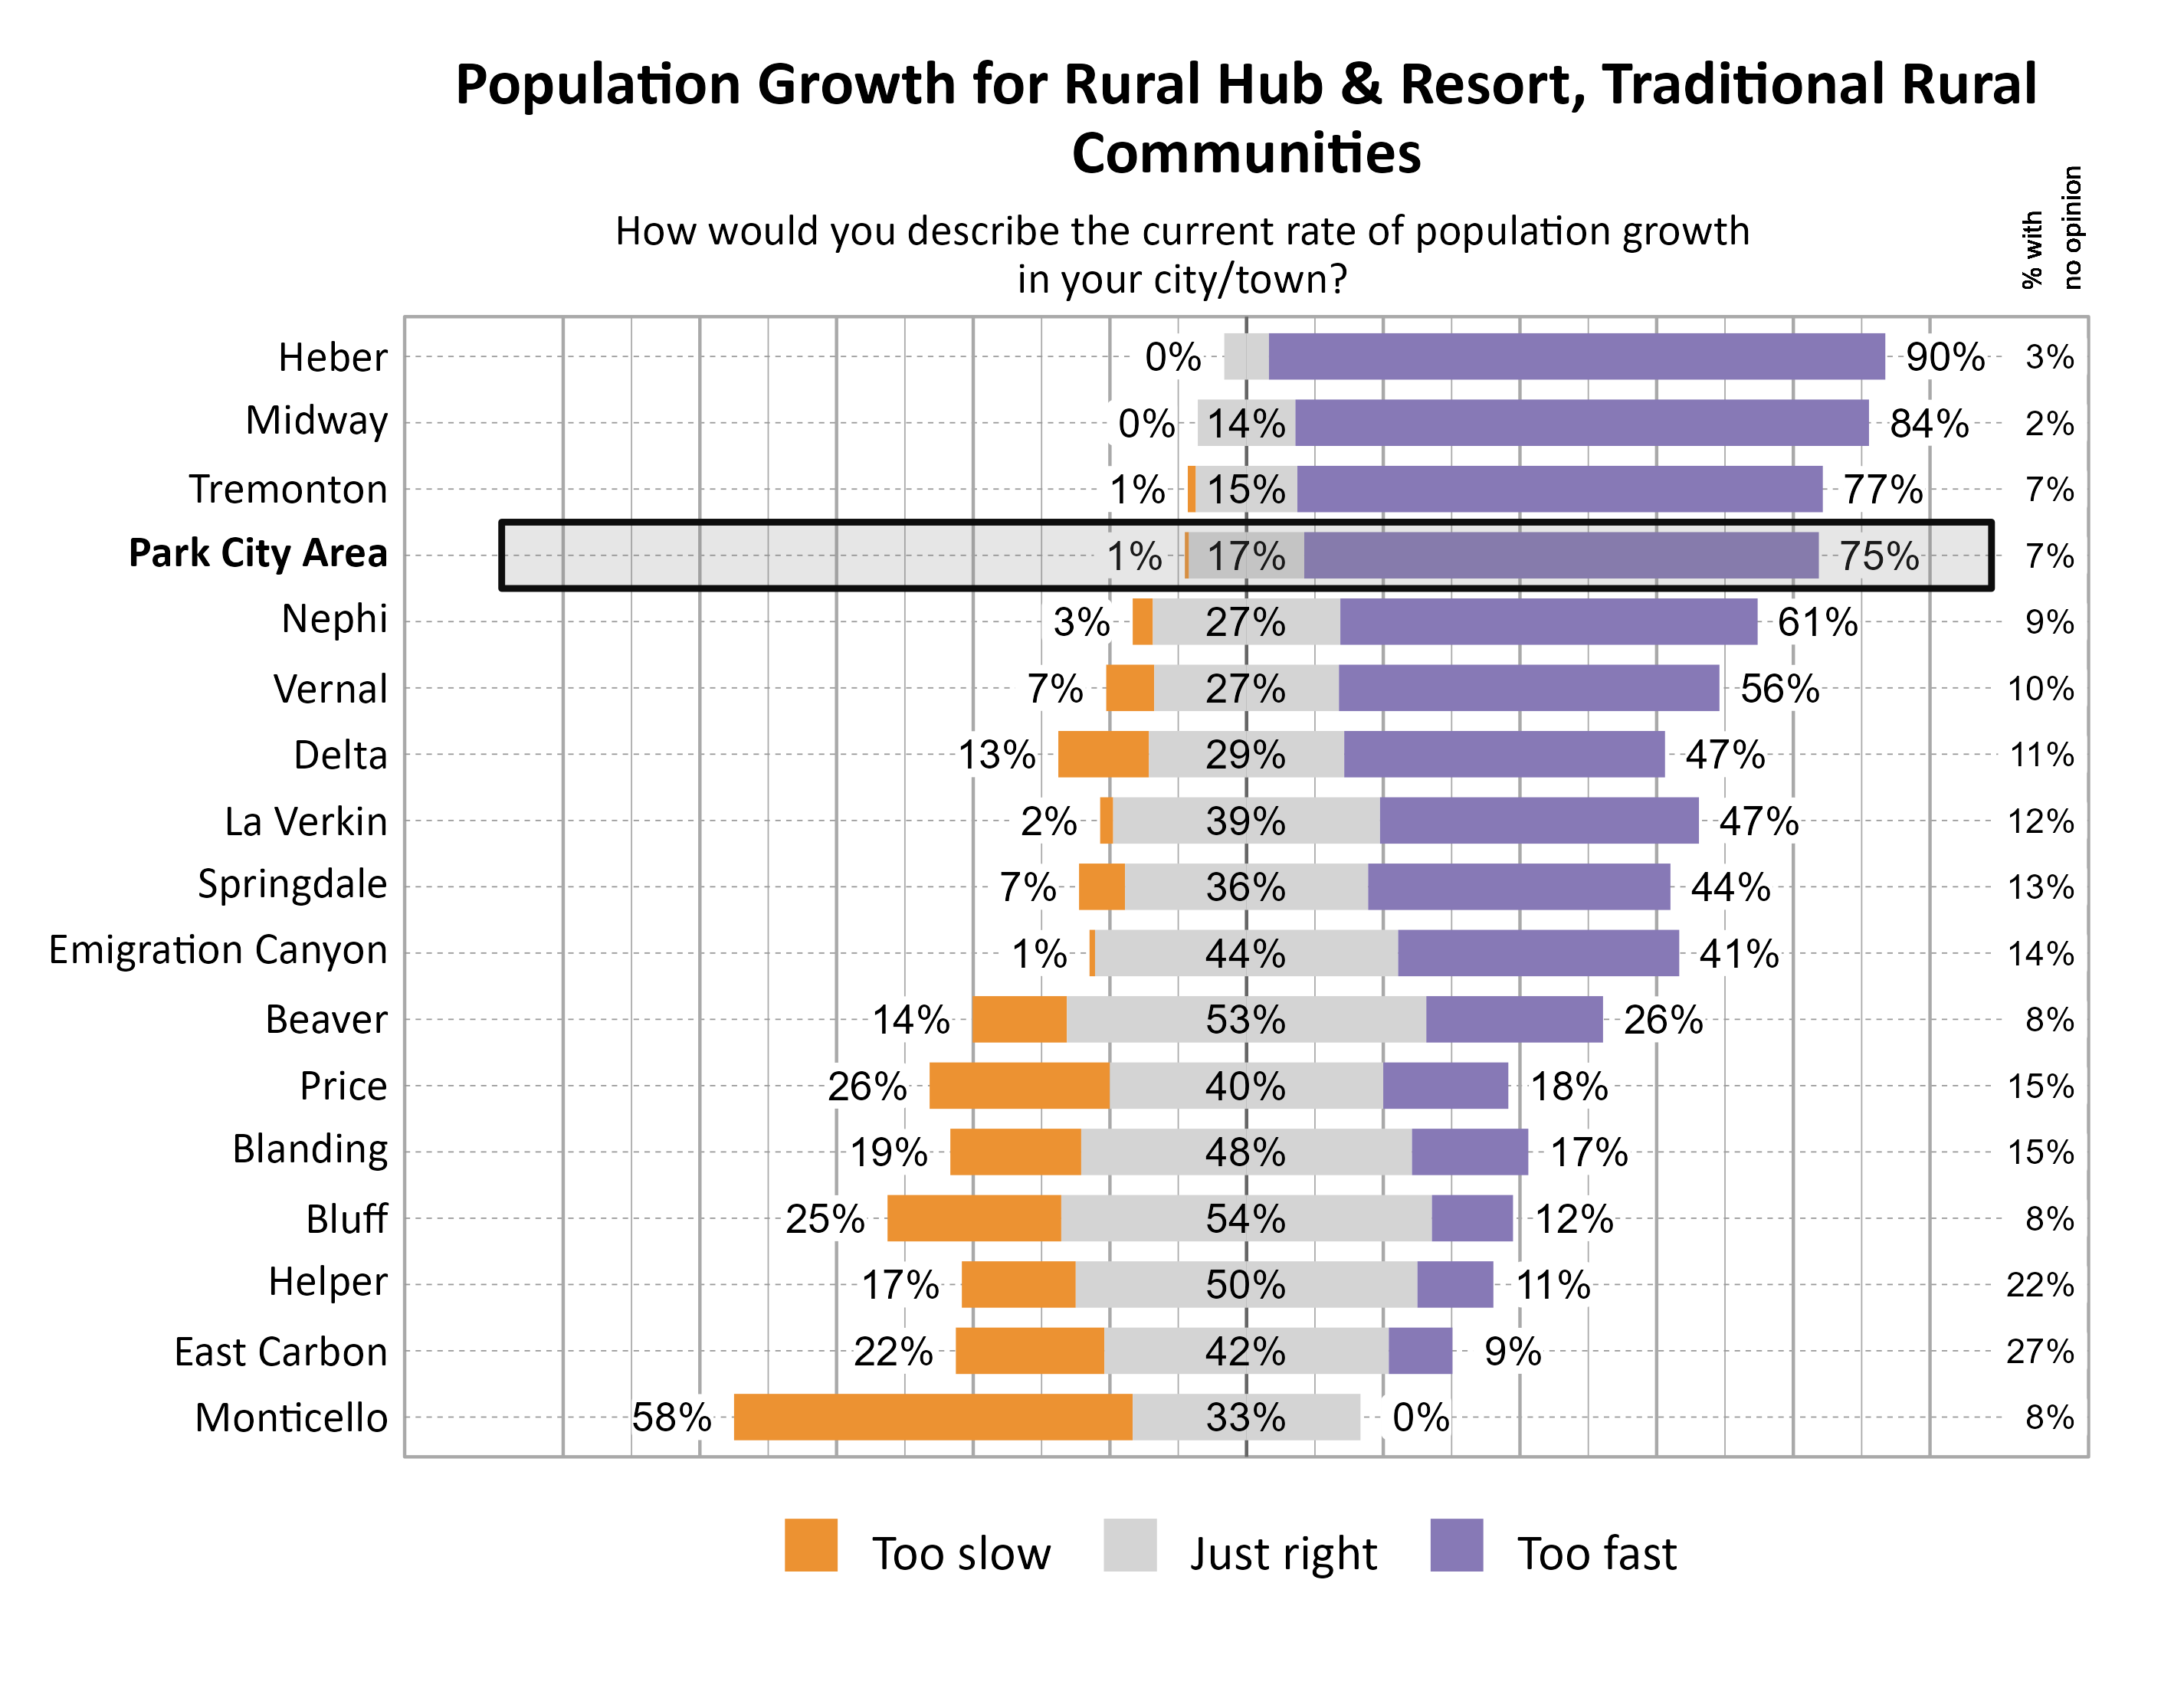
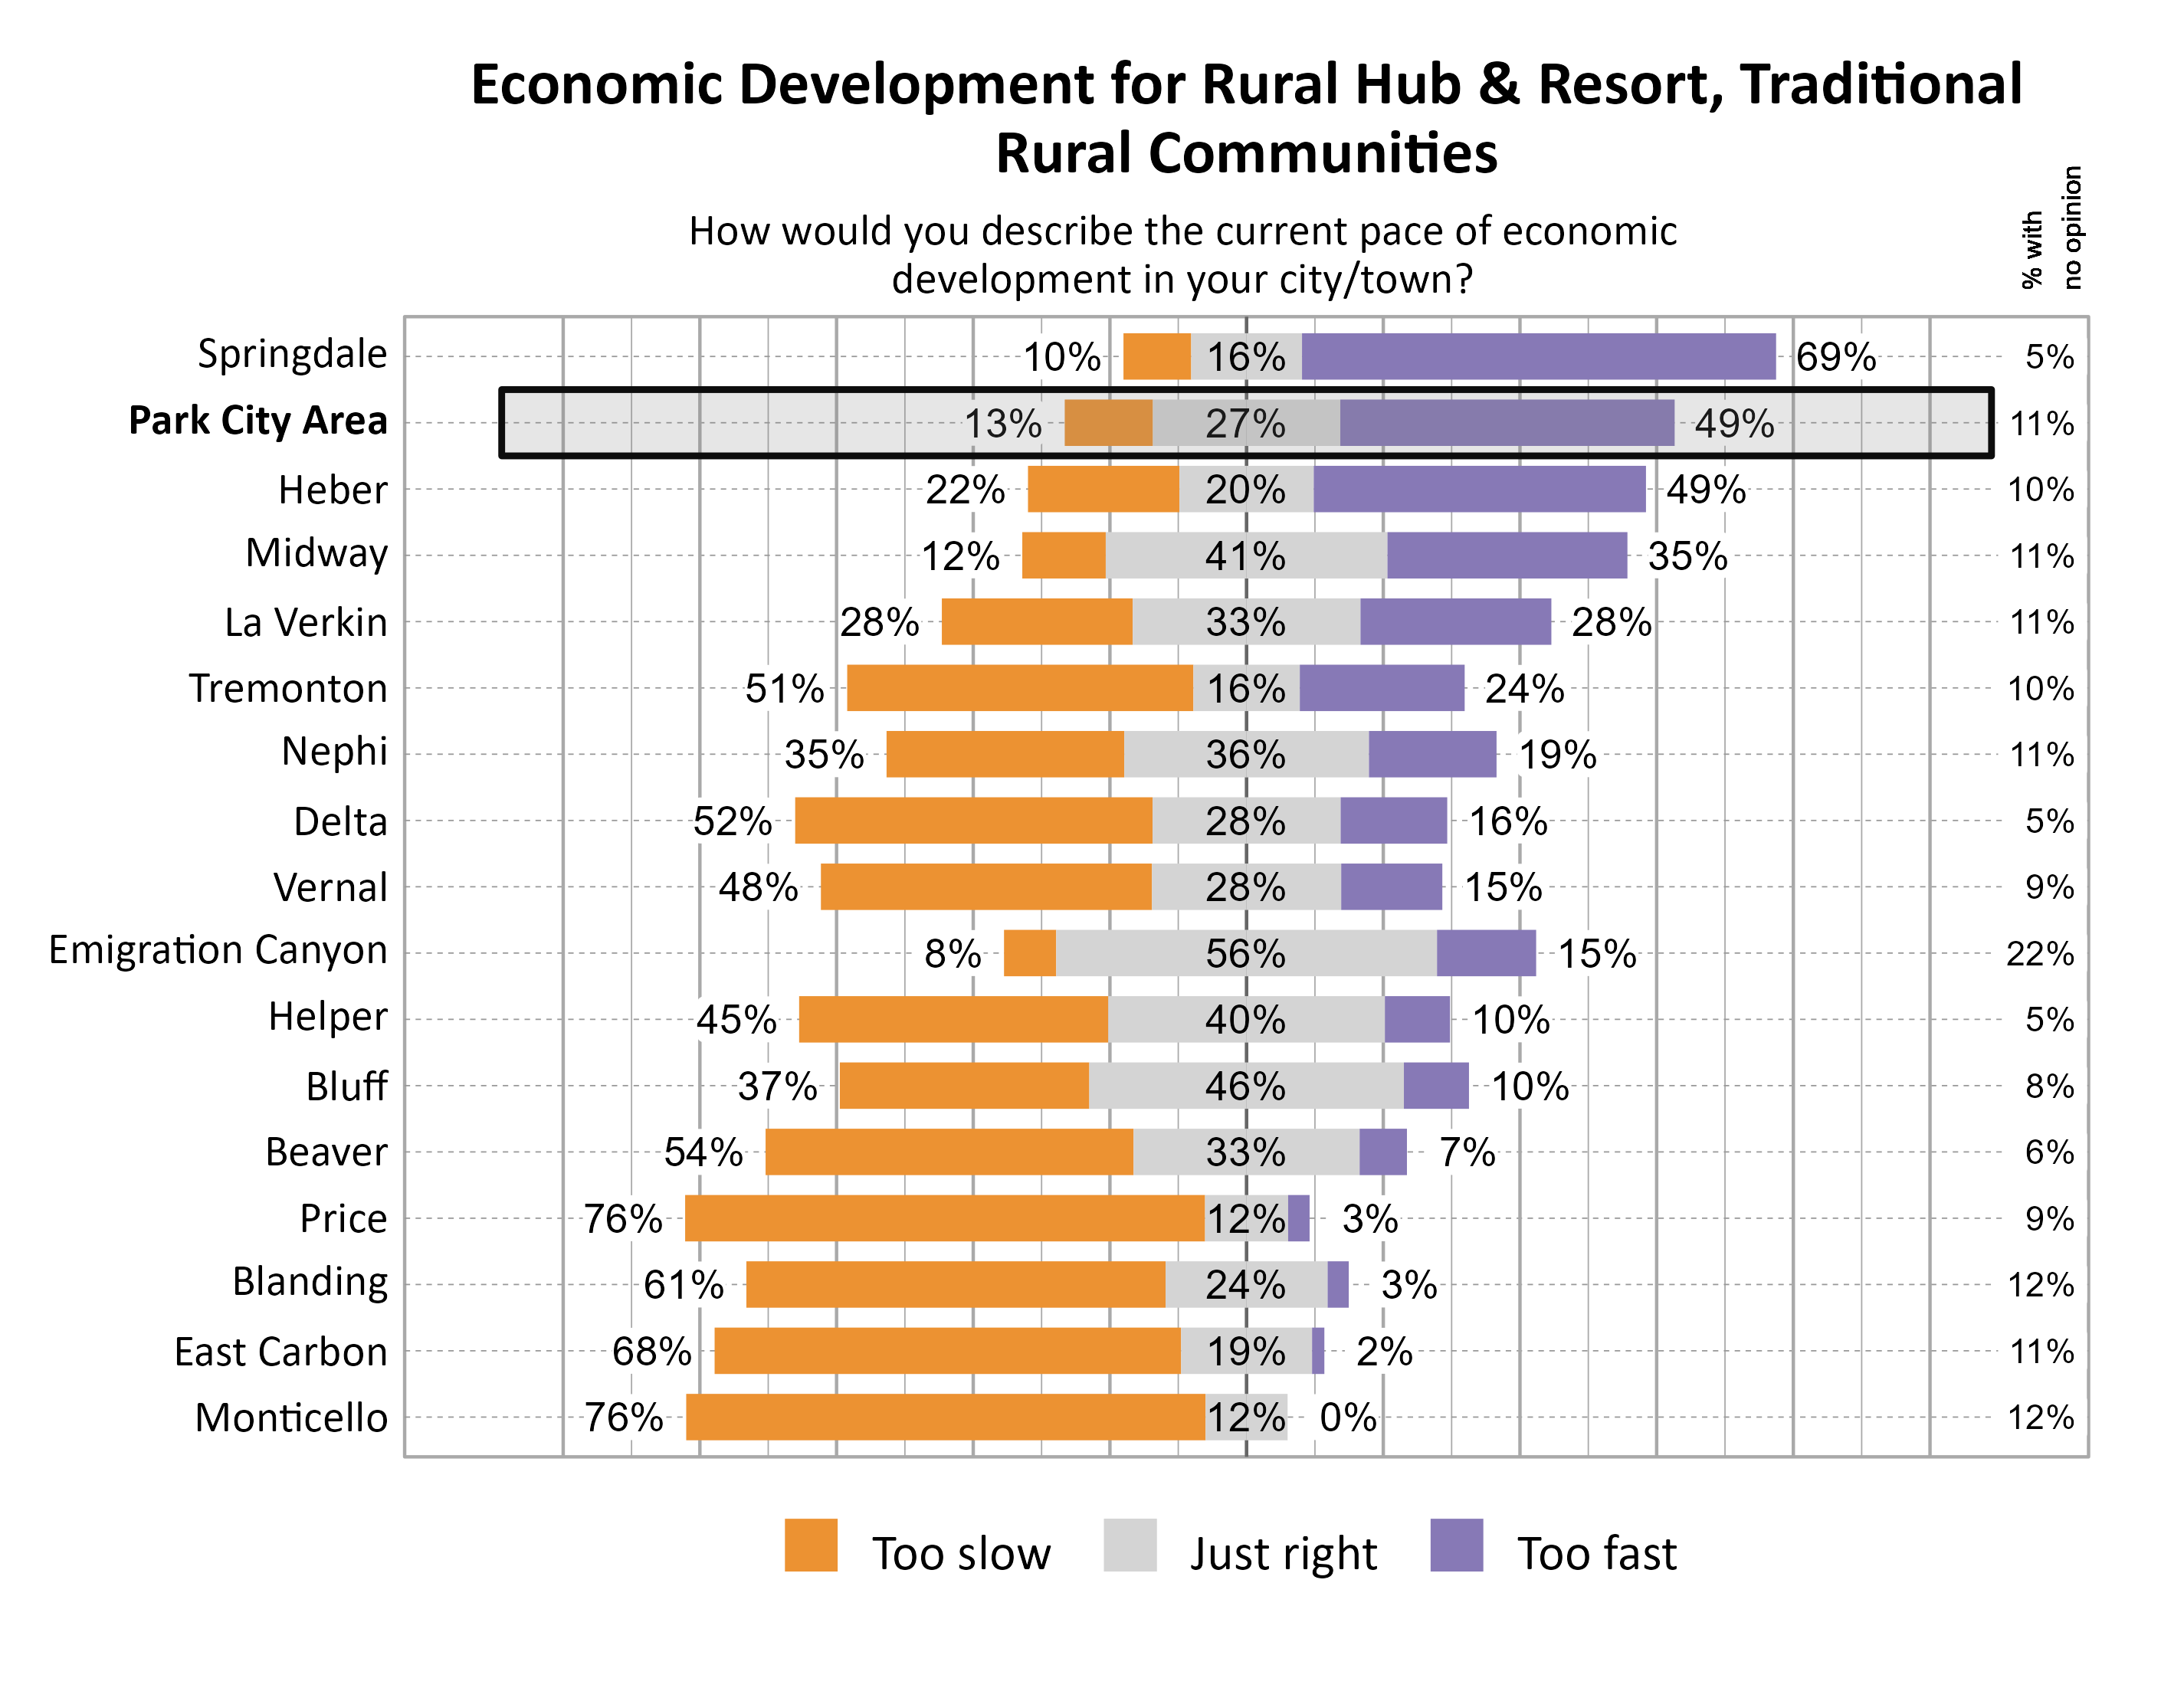
The majority of respondents in the Park City Area indicated that they felt the population growth was too fast (75%). For the pace of economic development, the largest proportion of respondents indicated that it was too fast (49%). Results were similar when looking at responses from just Park City (ZIP Code 84060).
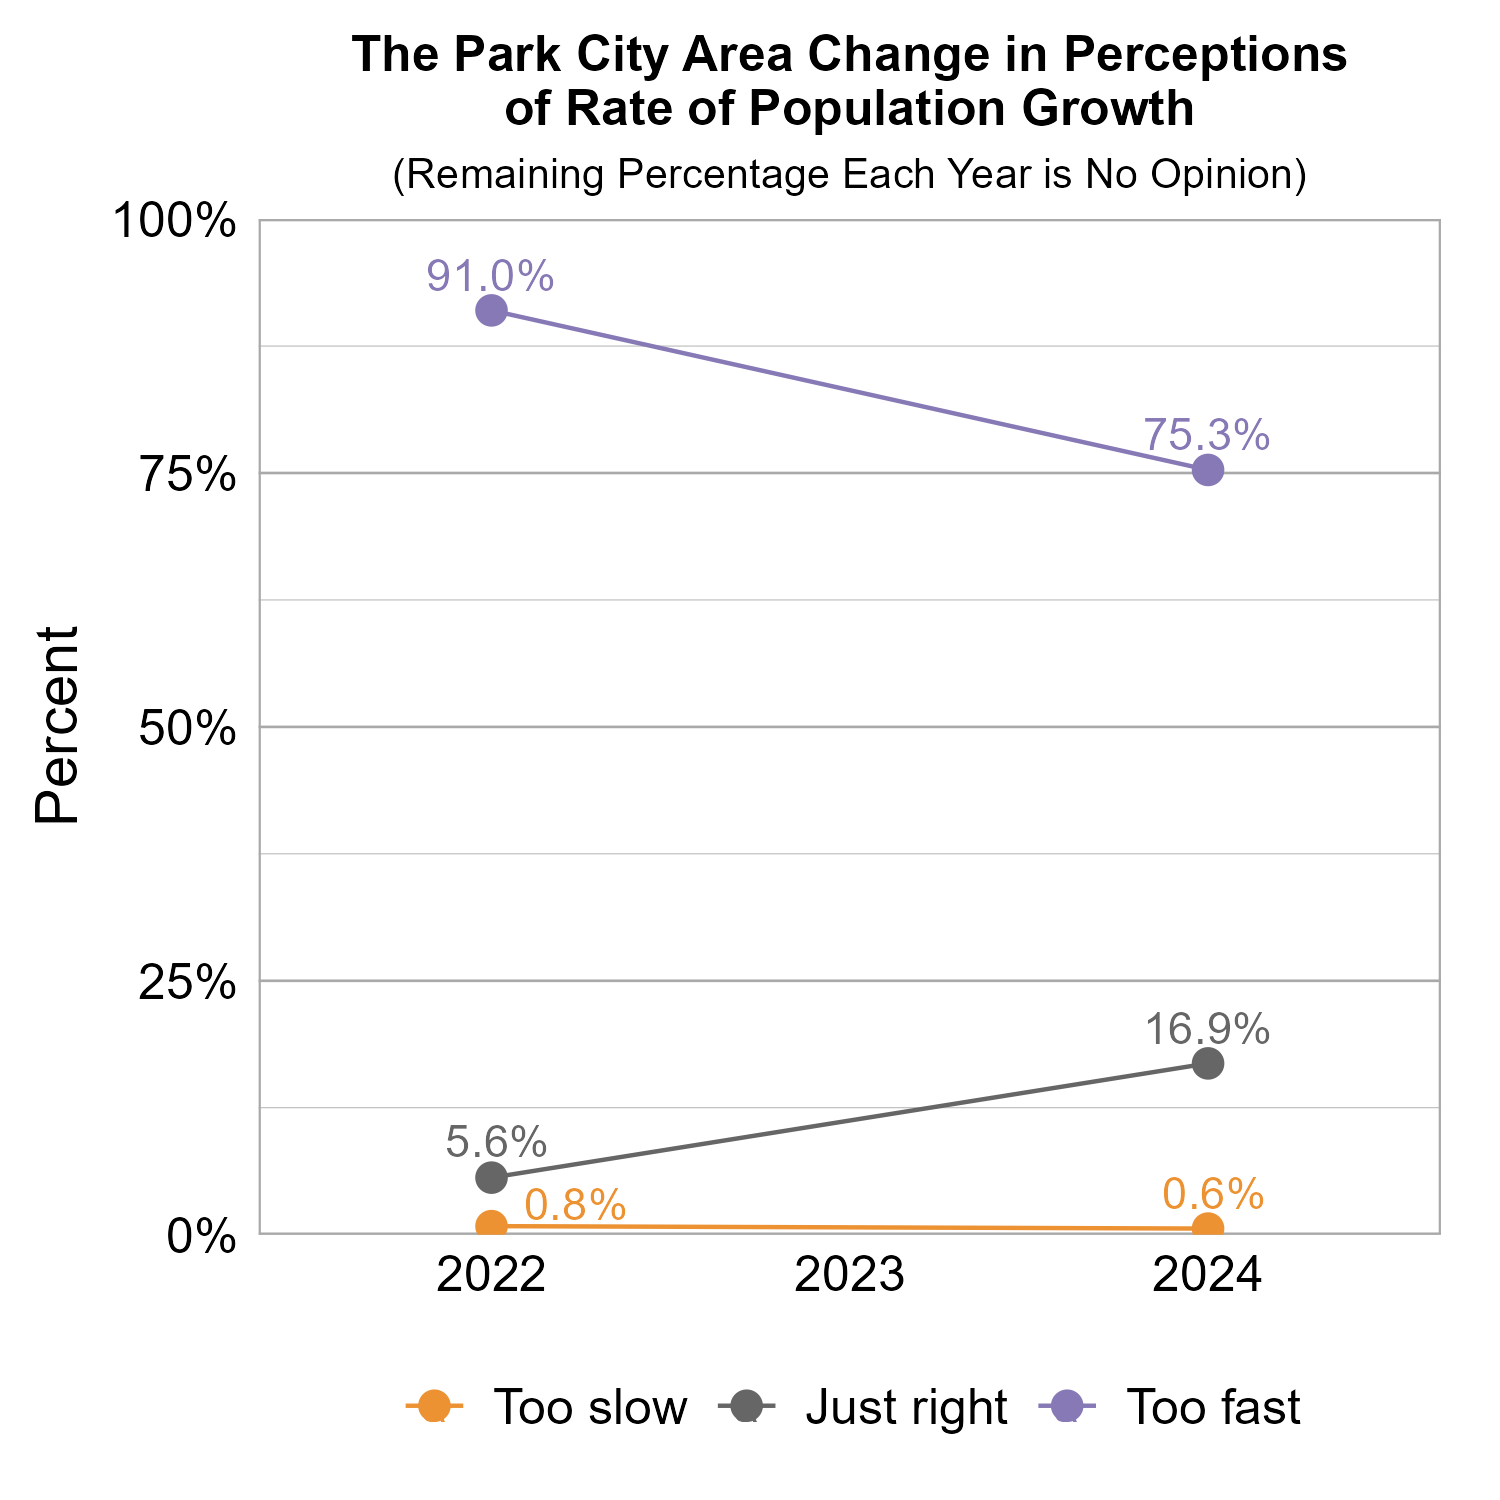
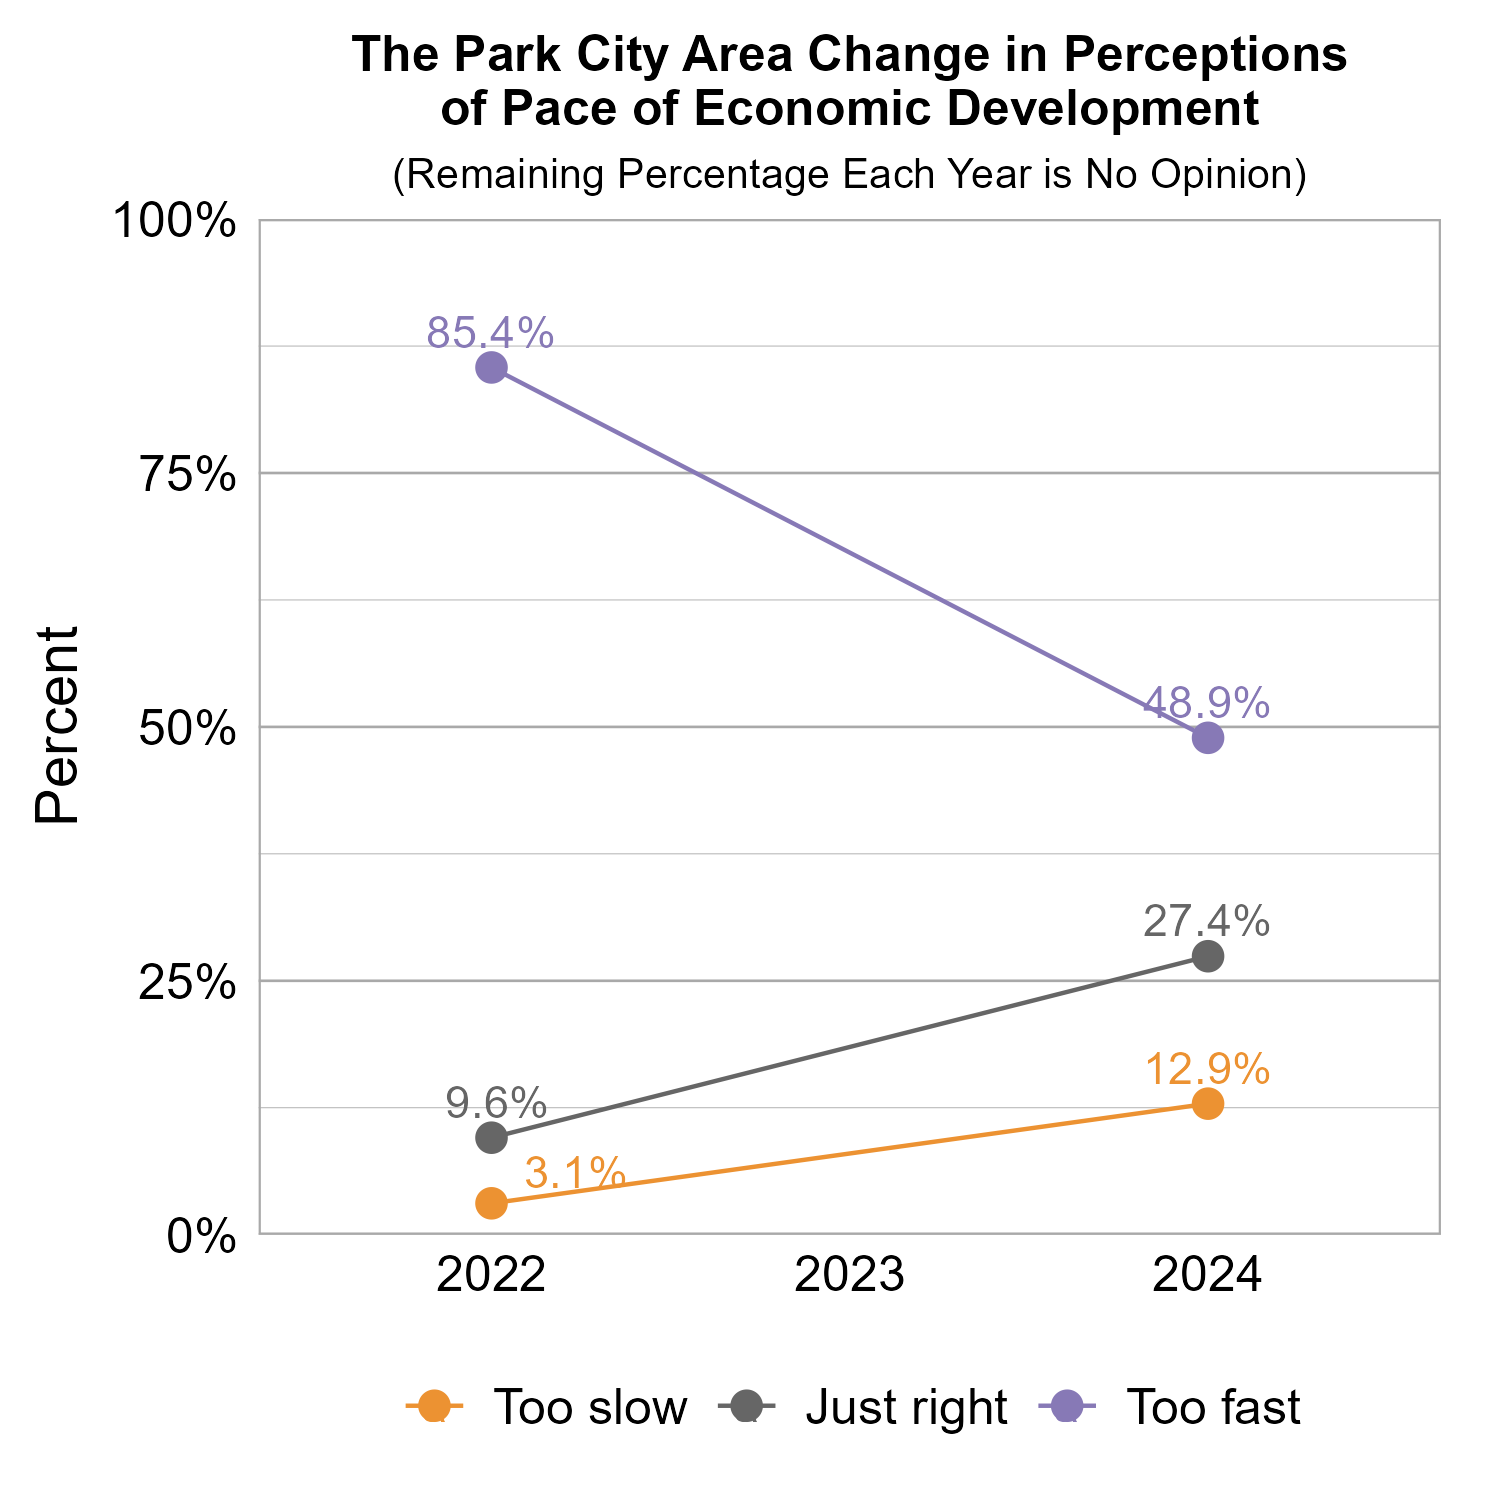
The graphs below show how perceptions of population growth and economic development in the Park City Area have varied across recent years of Wellbeing Surveys. While the largest proportion of respondents indicated that the rate of population growth and the pace of economic development was too fast, both saw large decreases from 2022 to 2024.
The graphs below show perceptions of population growth and economic development for the Park City Area compared to other participating cities and towns in the Rural cluster.
The graph below illustrates how many respondents perceived the pace of economic development as too slow, just right, too fast, or had no opinion, with additional breakdowns for the number of respondents who provided comments.
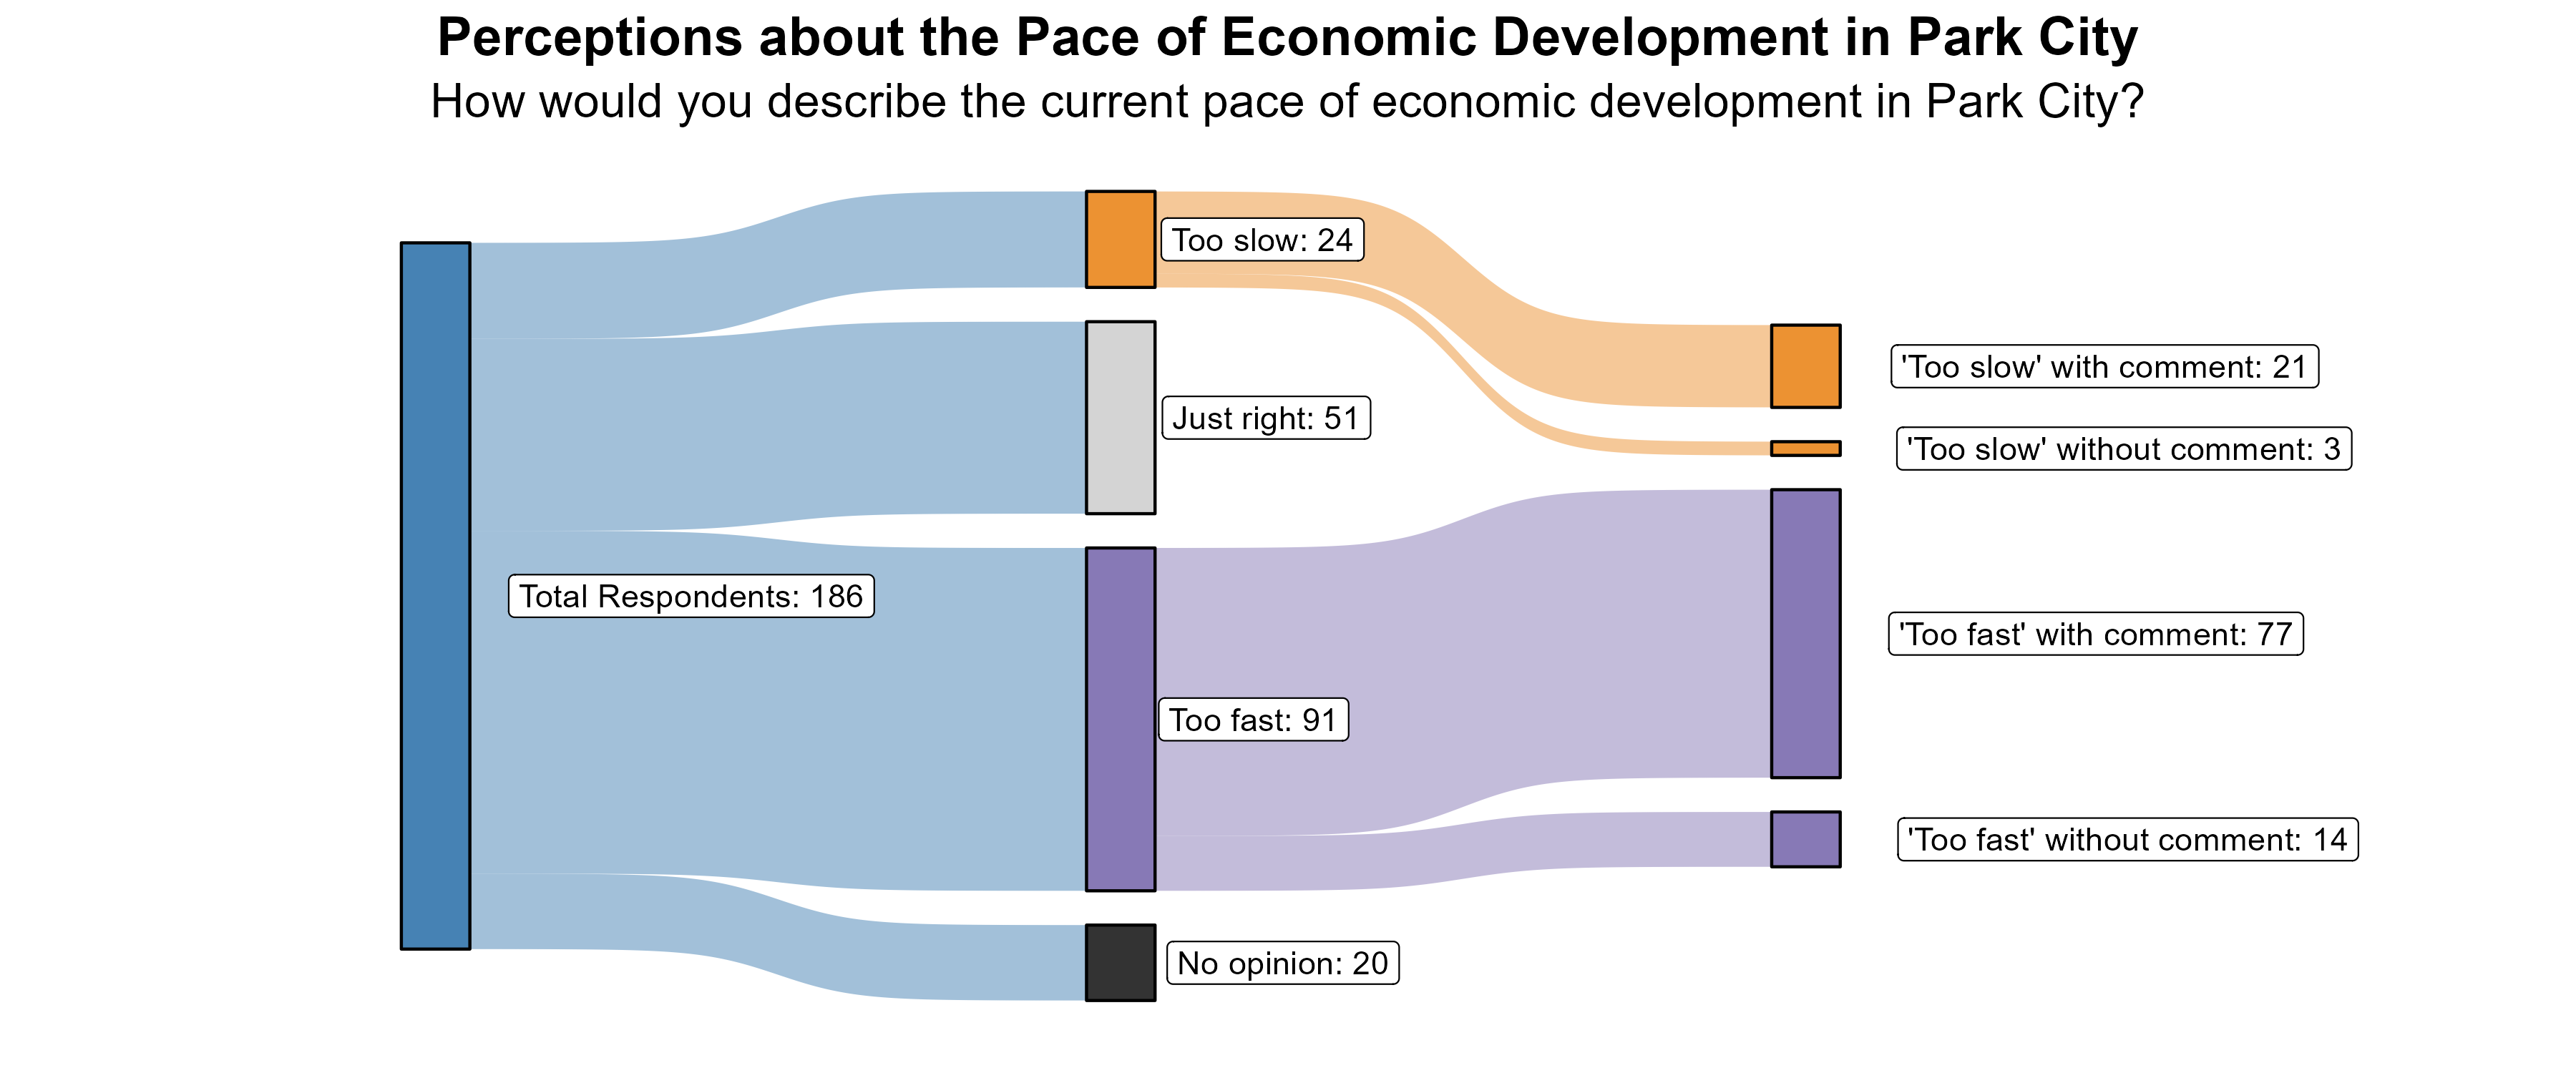
The 13% of respondents who rated the pace of economic growth as “too slow” were further asked what aspects of the local economy they would like to see more of in Park City. Many commented on the need for more housing options for locals and for service employees, especially more affordable housing. Others also asked for increased wages and more local services like childcare and cheaper restaurants. Comments from zipcode 84060 were generally similar.
Additionally, the 49% of respondents who rated the pace of economic growth as “too fast” were further asked what aspects of the local economy they feel are growing too quickly in Park City. Housing was often mentioned, with many opinions about there being too much or too little, about it being too expensive or too cheap, and comments about the supply not matching the workforce, being catered to tourists, or being bought up by millionaires as their second or third home. People also brought up development quite often, saying that there is too much building going on and that it’s creating crowding and traffic problems and that the infrastructure is not keeping up. There were also quite a few comments about the growth being for noncitizens and locals not feeling like it is serving them or in their interest. Increased cost of living was brought up often. Comments from zipcode 84060 were generally similar.
Transportation in the Park City Area
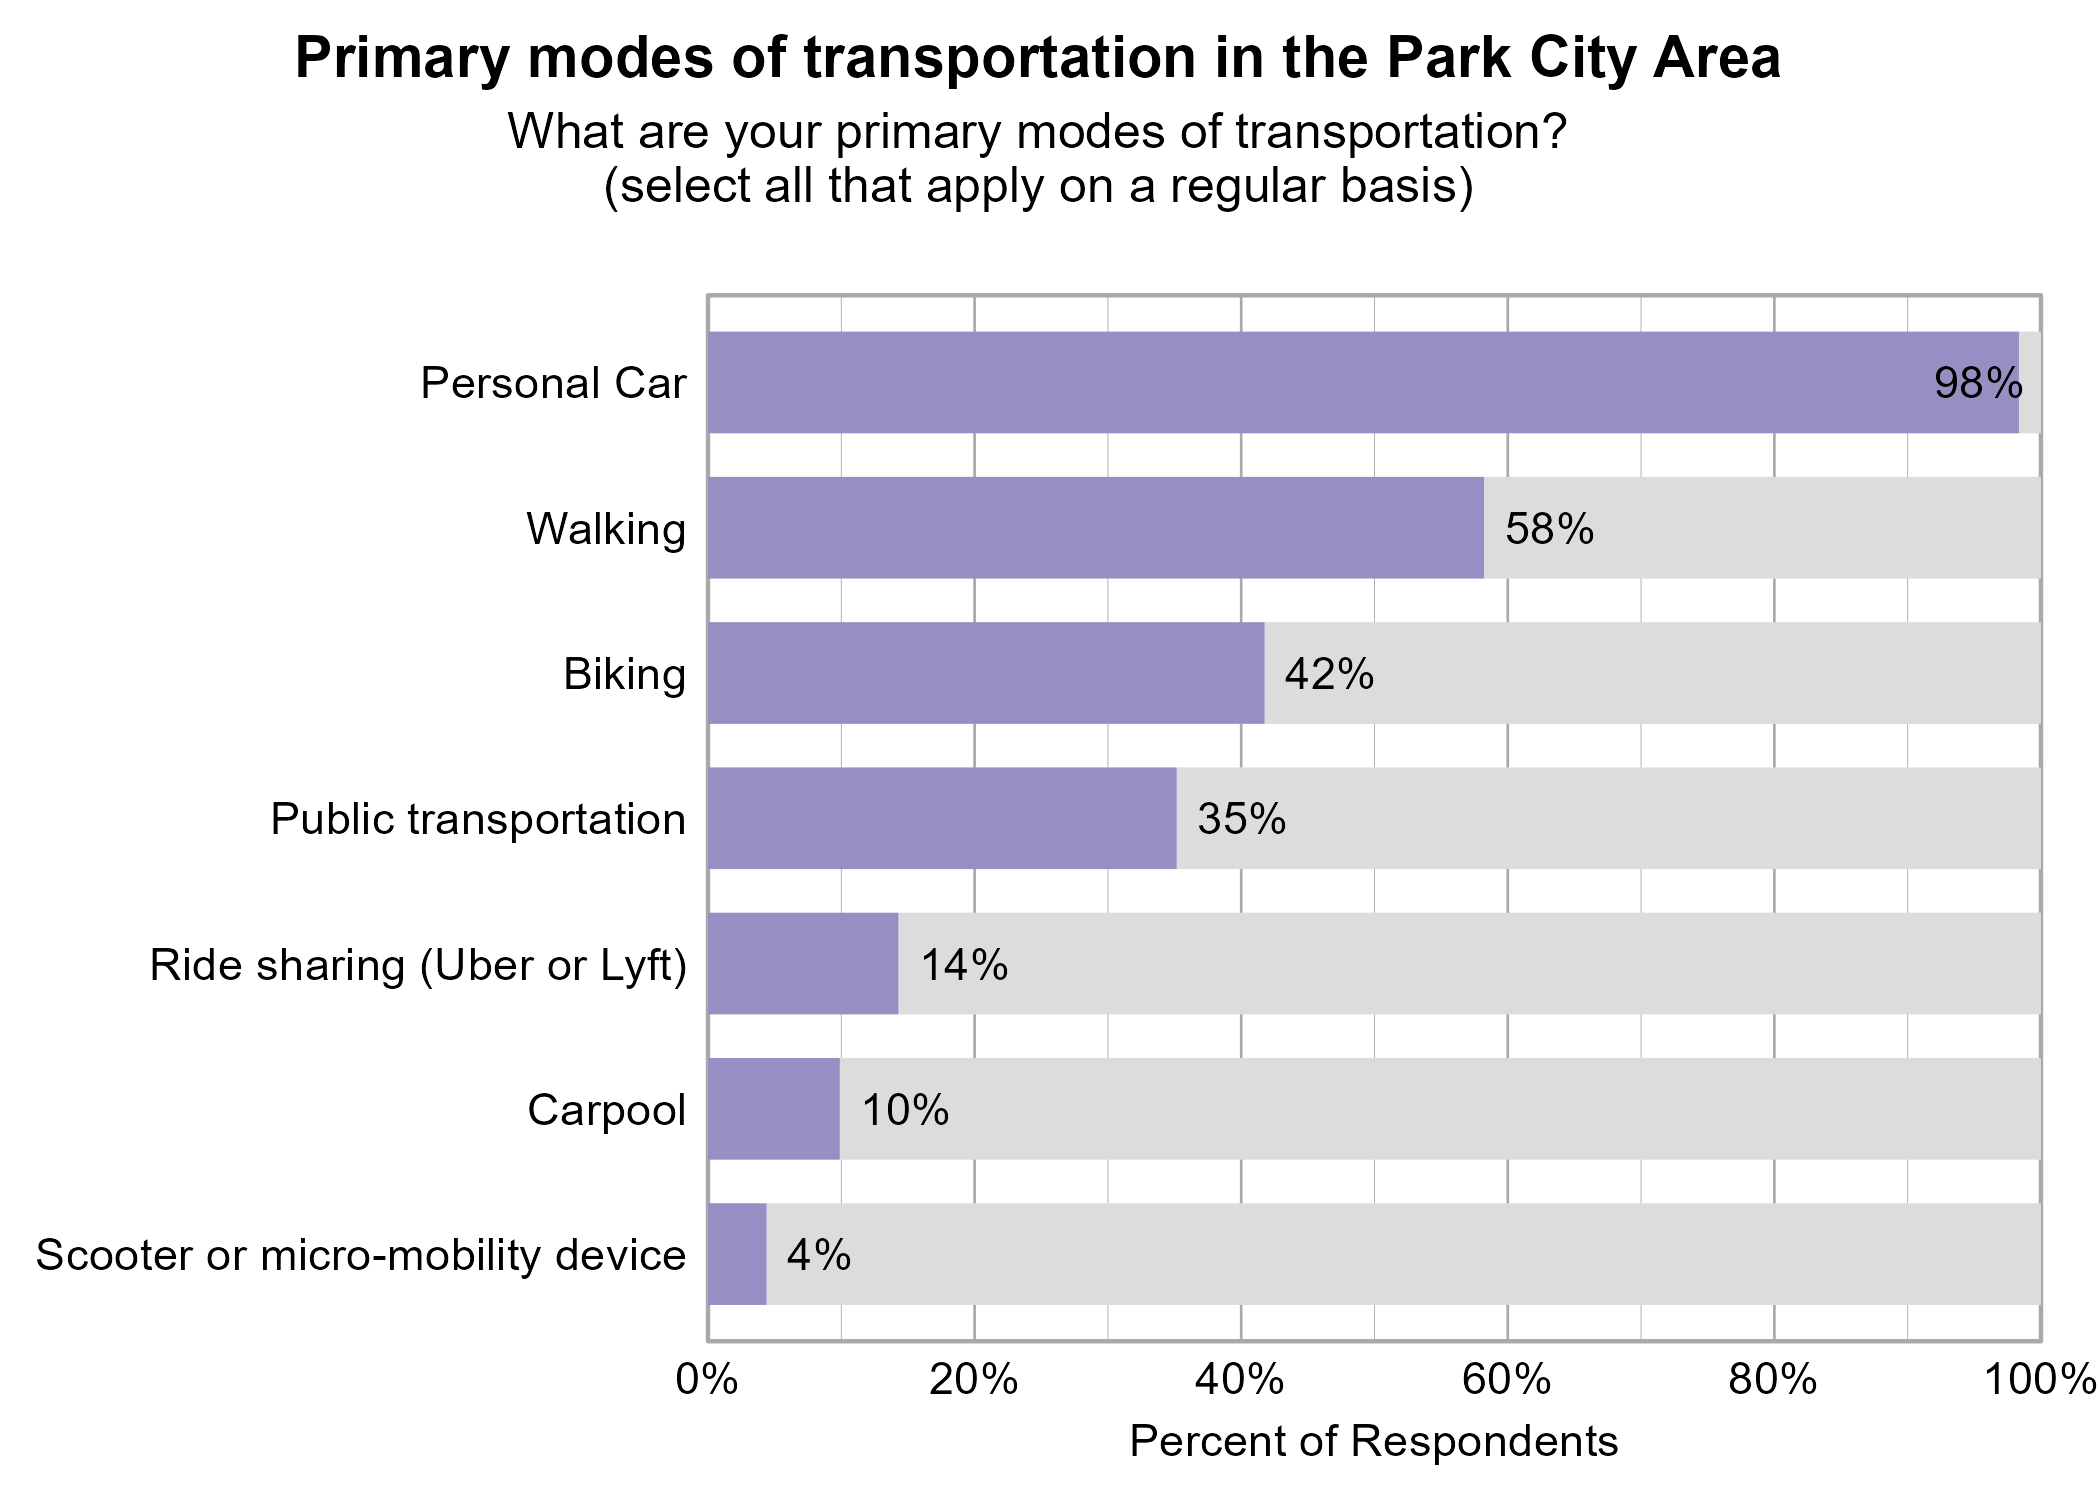
Respondents were asked to indicate all of their primary modes of transportation on a regular basis in Park City. The most popular modes of transportation were personal car (98%) and walking (58%).
Looking at responses from just Park City (ZIP Code 84060), the proportion of respondents walking (69%), biking (47%), and using public transportation (42%) were all higher.
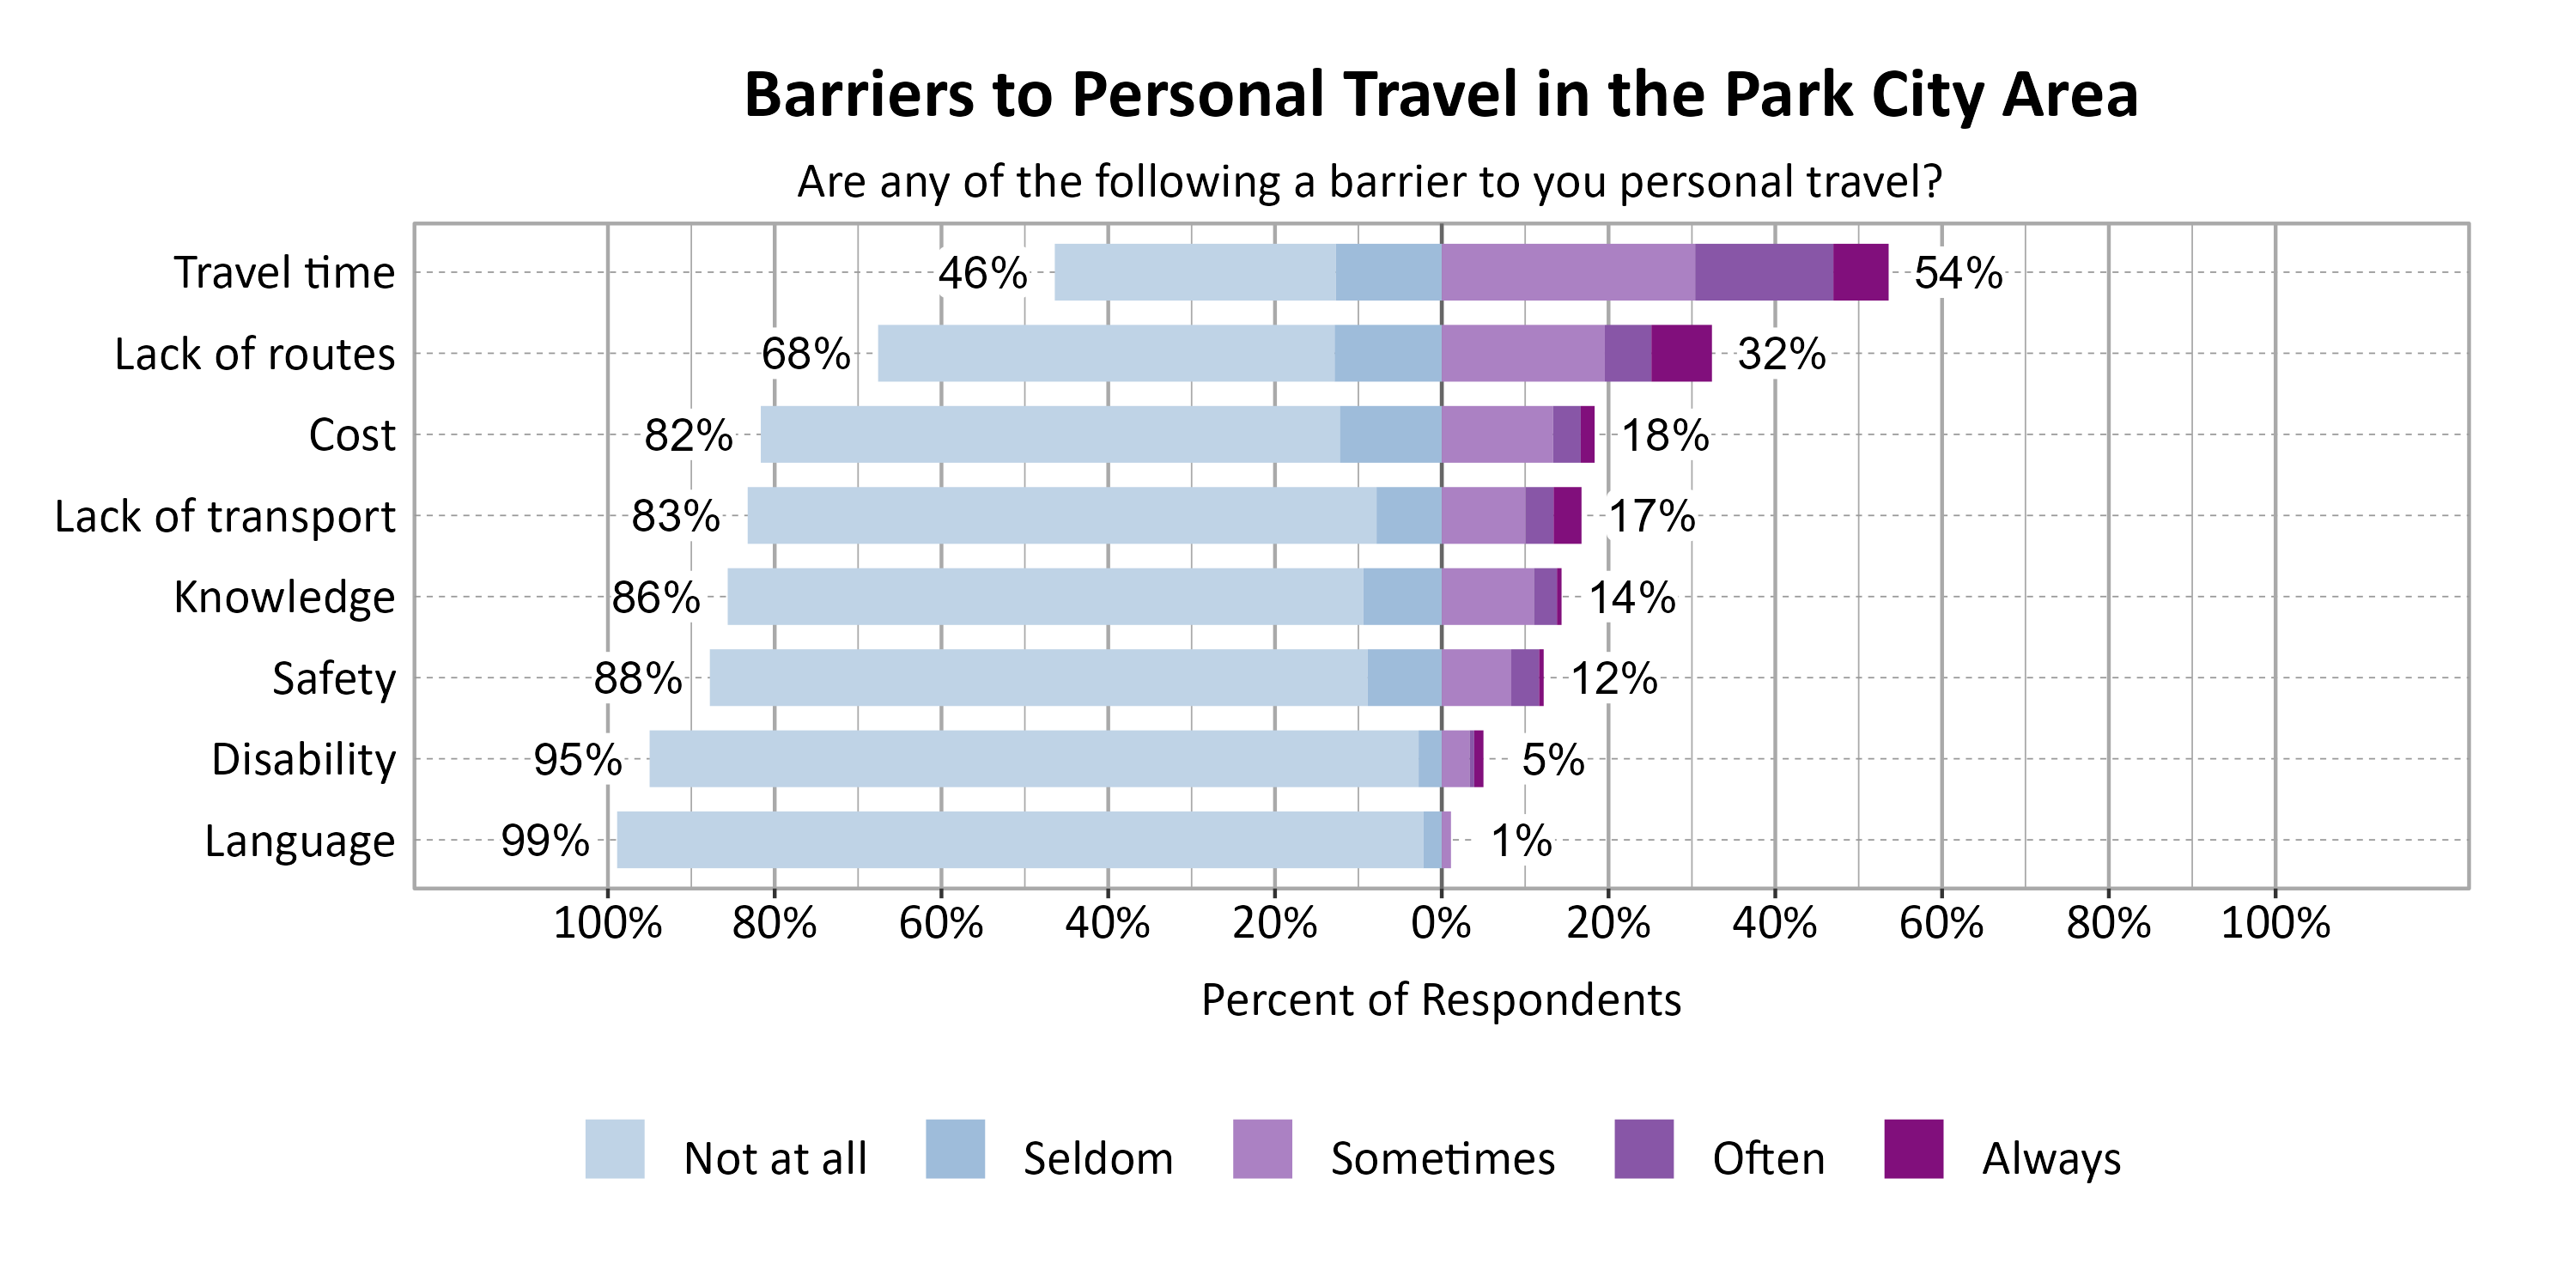
Respondents were asked to indicate the most common barriers to transportation in Park City. The most problematic barriers were Travel time (54%) and Lack of routes (32%).
Looking at responses from just Park City (ZIP Code 84060), the percentage of respondents who indicated sometimes, often, or always decreased for Travel Time by 8%.
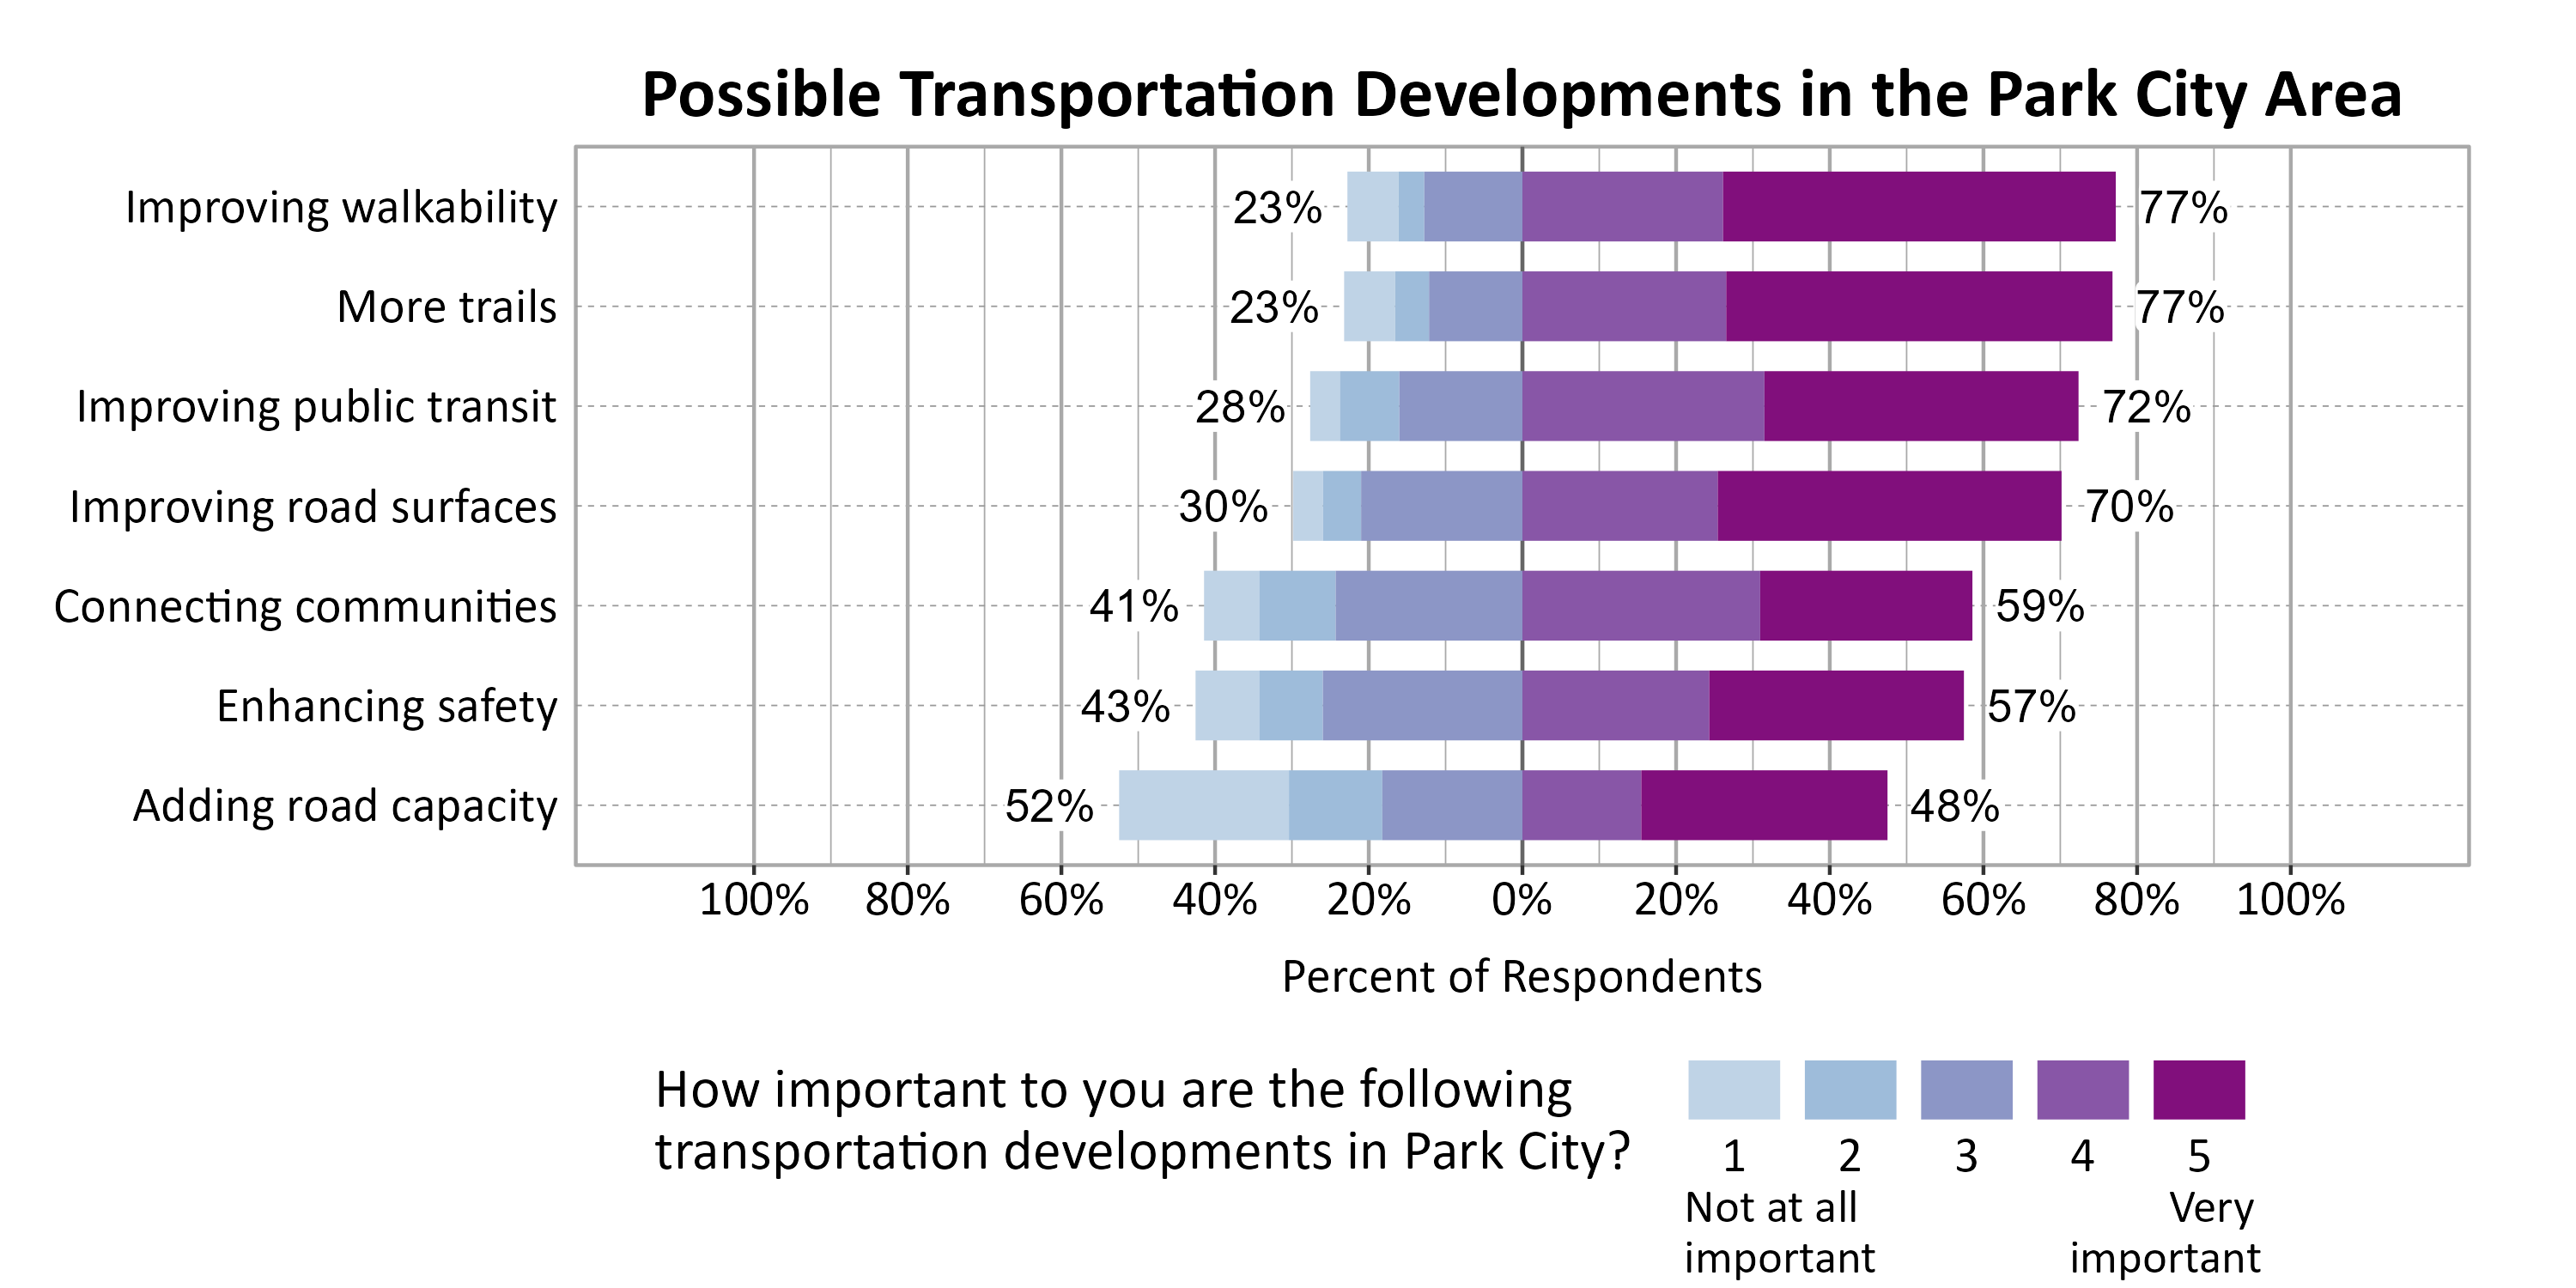
Respondents were asked to indicate the importance of a set of possible transportation developments in Park City. The most important development to respondents were Improving walkability (77%), More trails (77%), and Improving public transit (72%).
Looking at responses from just Park City (ZIP Code 84060), the proportion of respondents who indicated a 3, 4, or 5 for Improving walkability and More trails each increased by 5%.
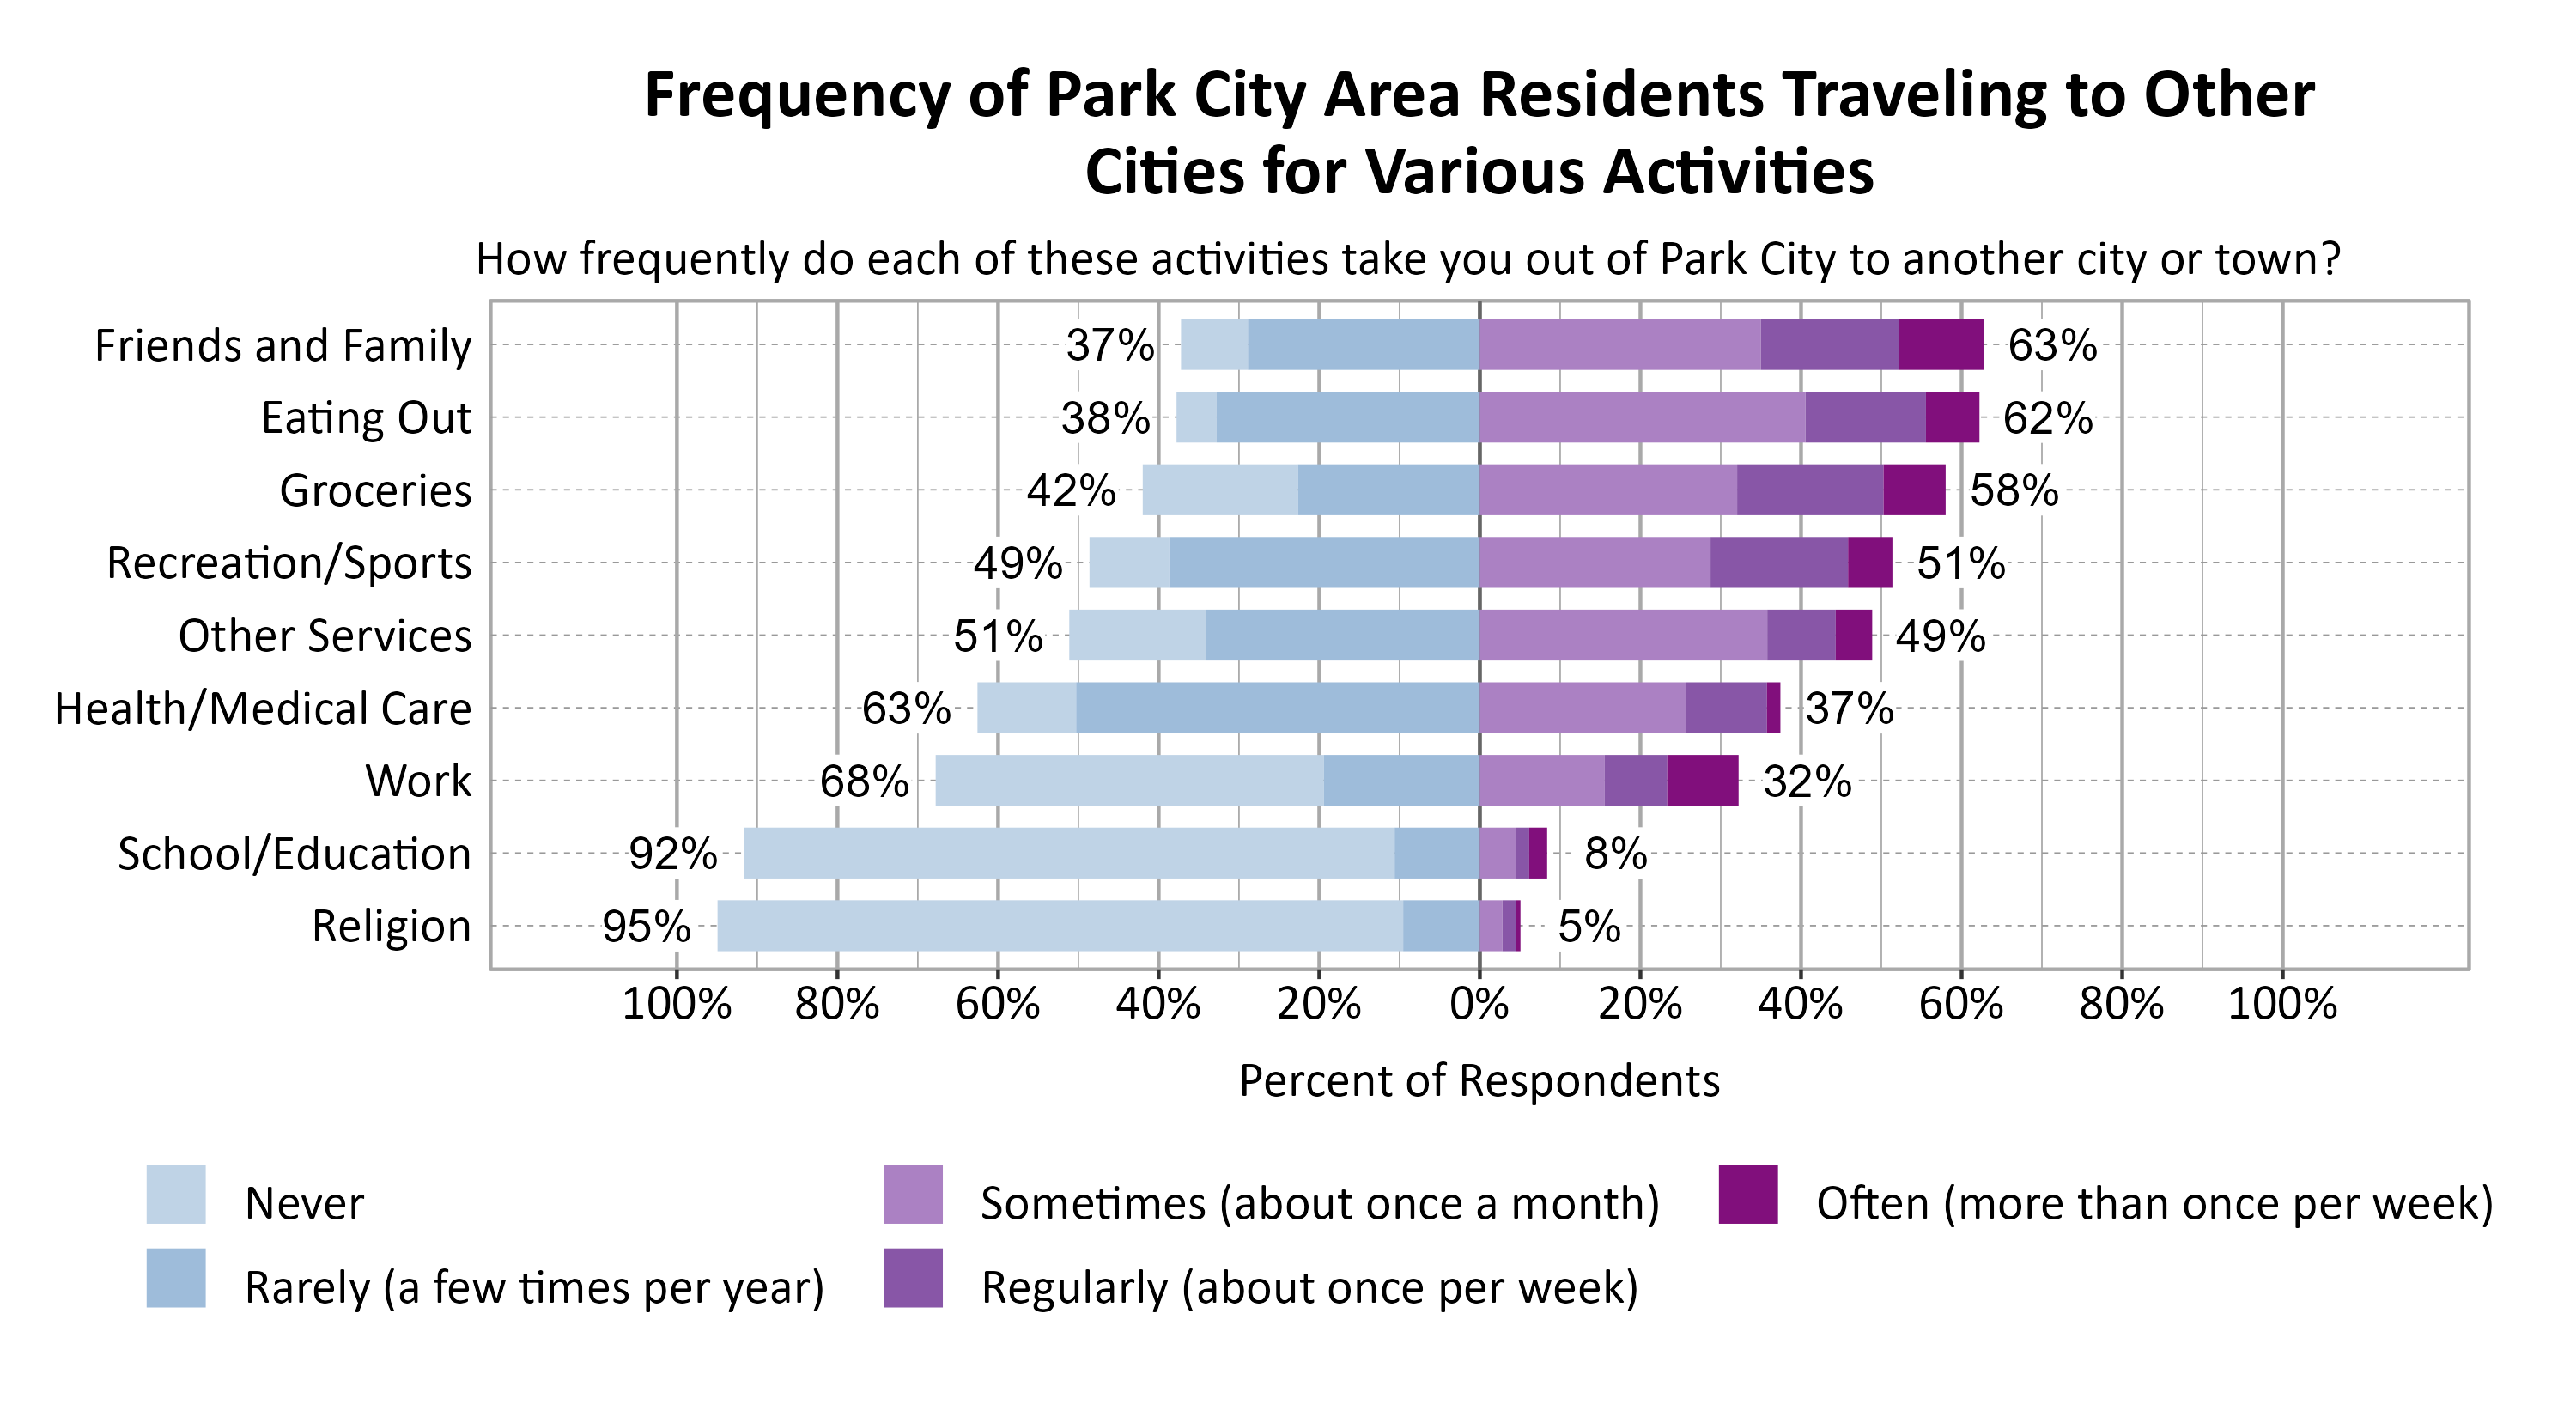
Respondents were asked to indicate how frequently various activities take them out of Park City to another city or town. The most commonly indicated reasons for traveling to another city or town at least sometimes or once a month were Friends and Family (63%), Eating Out (62%), and Groceries (58%).
Results were similar when looking at responses from just Park City (ZIP Code 84060).
Concerns in the Park City Area
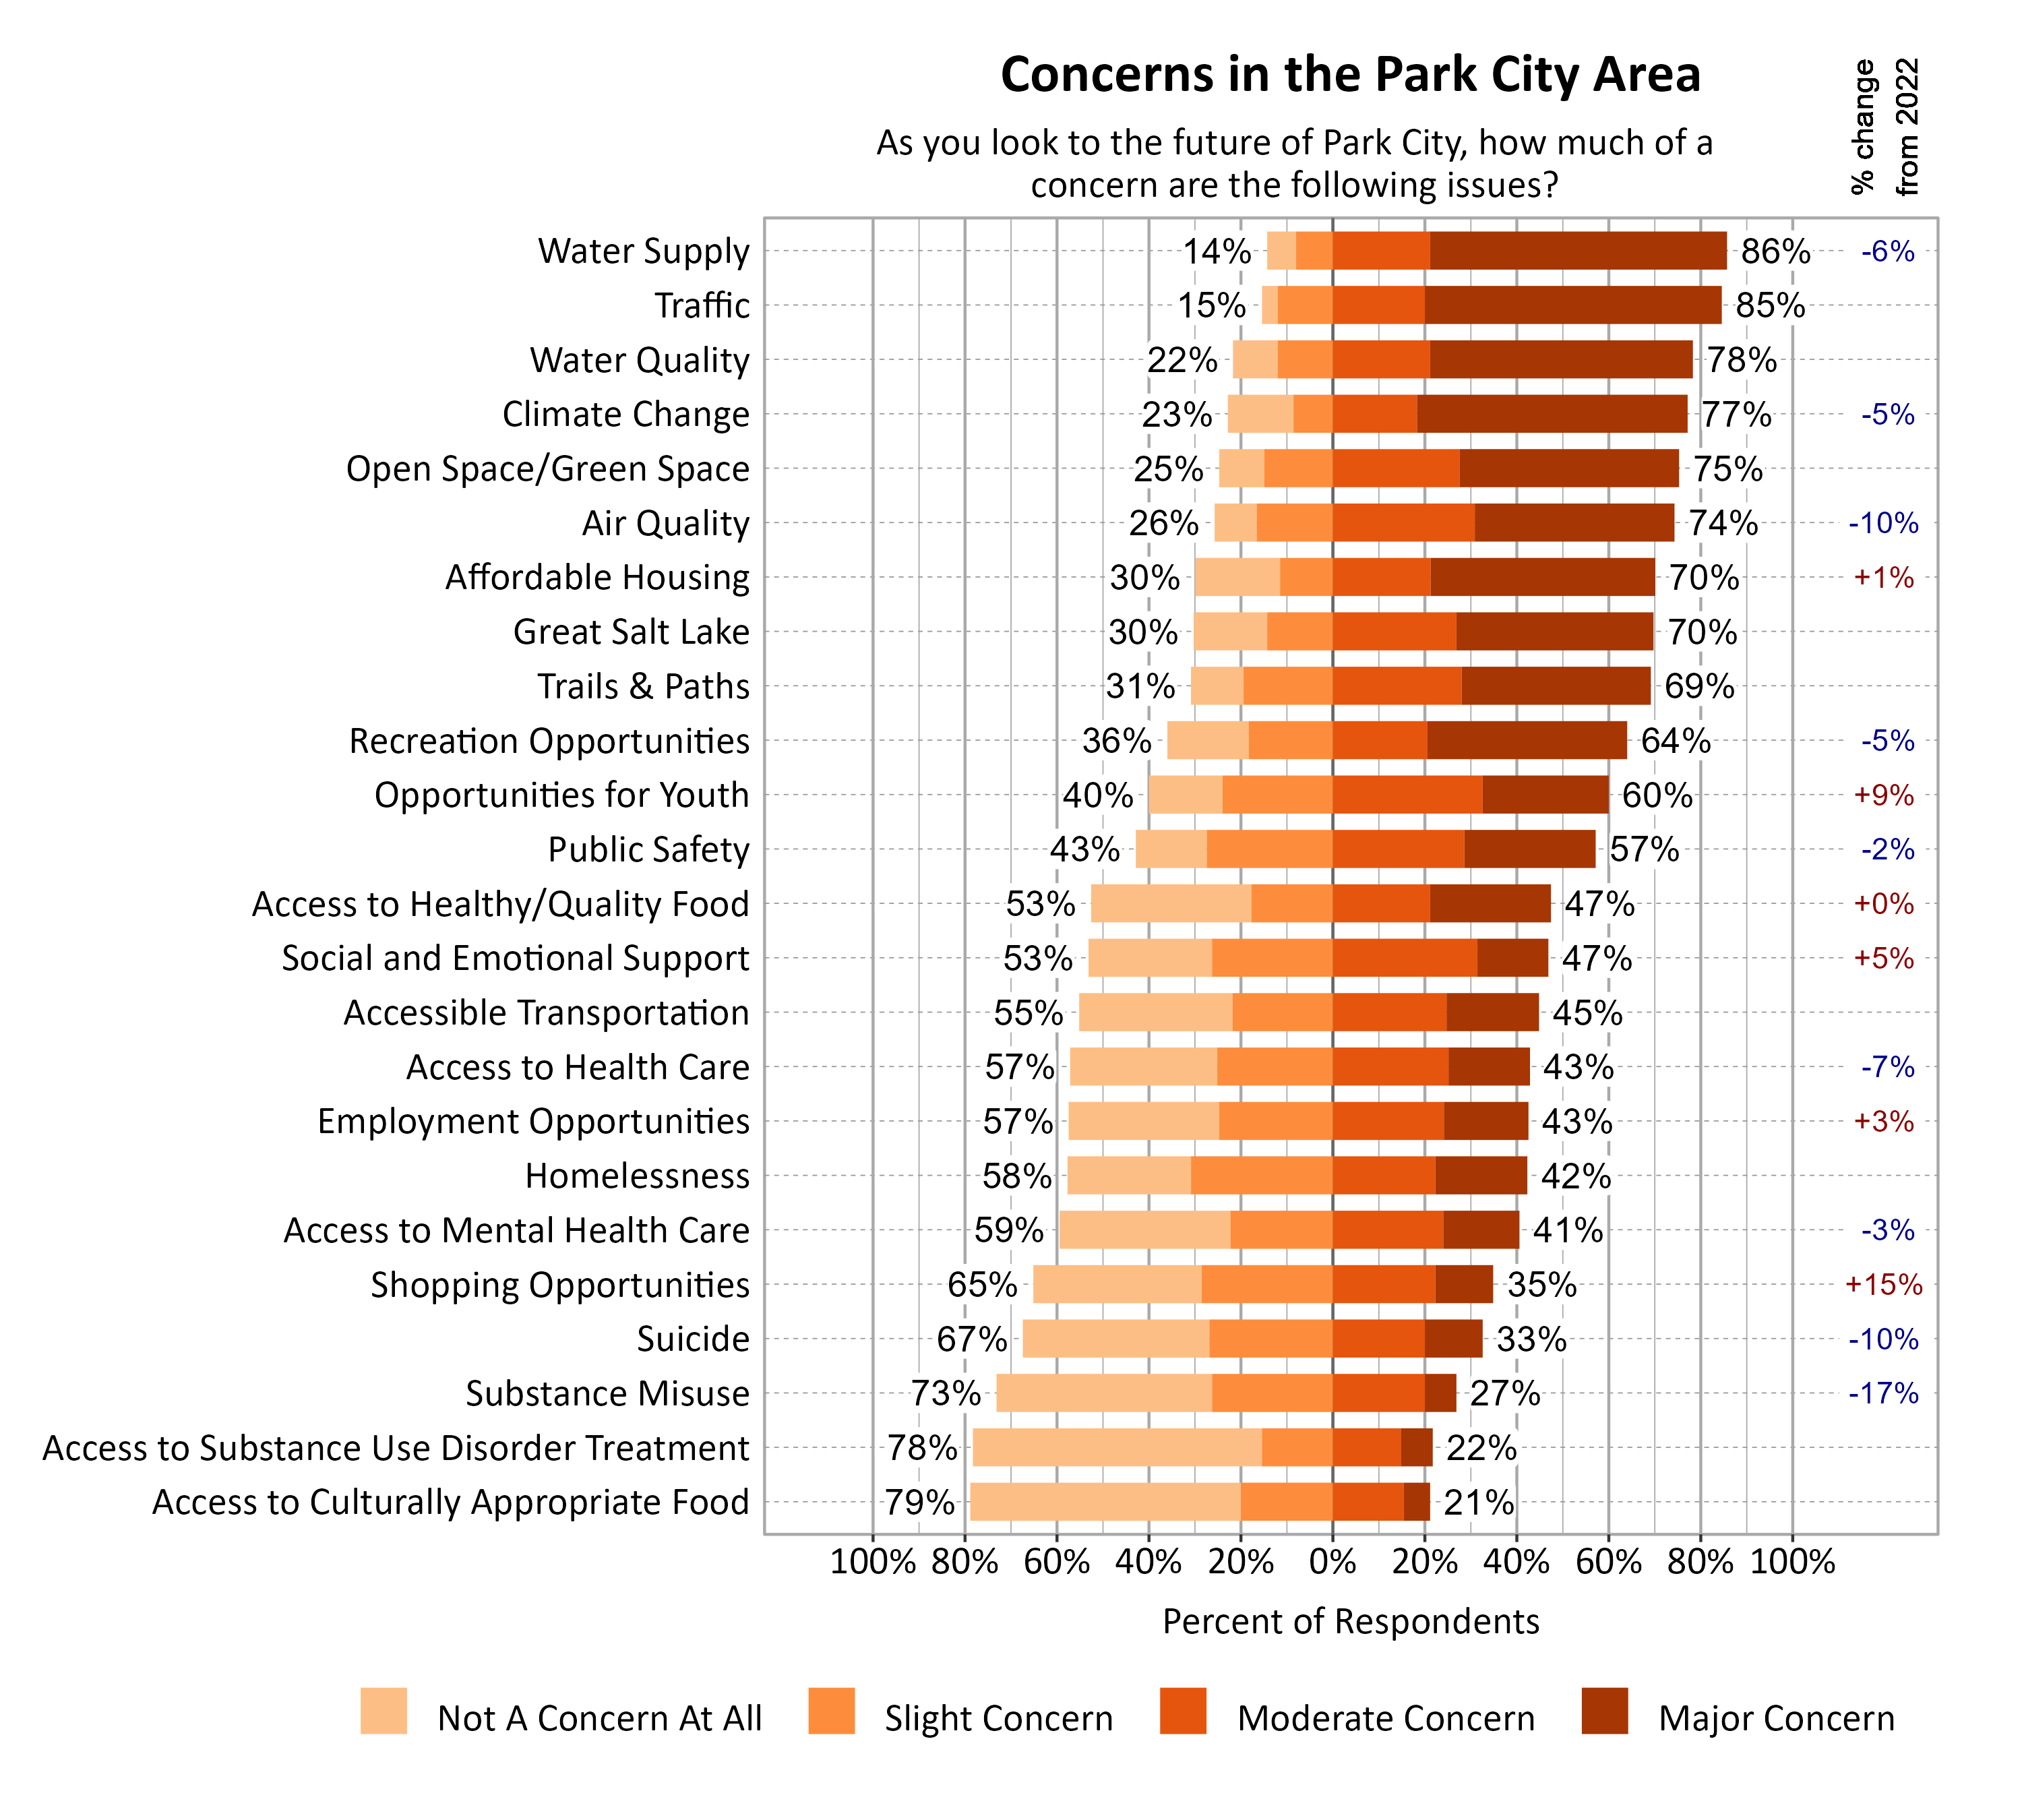
Survey respondents indicated the degree to which a number of possible local issues were a concern as they look to the future of Park City. Water Supply (86%), Traffic (85%), Water Quality (78%), and Climate Change (77%) were the top concerns. Since 2022, moderate or major concern about shopping opportunities (+15%) notably increased, while concern about substance misuse (-17%), suicide (-10%), and air quality (-10%) notably decreased.
Looking at responses from just Park City (ZIP Code 84060), concerns about Affordable Housing (65%), Social and Emotional Support (39%), Employment Opportunities (38%), Homelessness (36%), Mental Health Care (34%), Suicide (27%) were lower, while concerns about Trails & Paths (77%), Access to Health Care (49%) were higher.
Additional Questions for the Park City Area
Communication Methods in the Park City Area
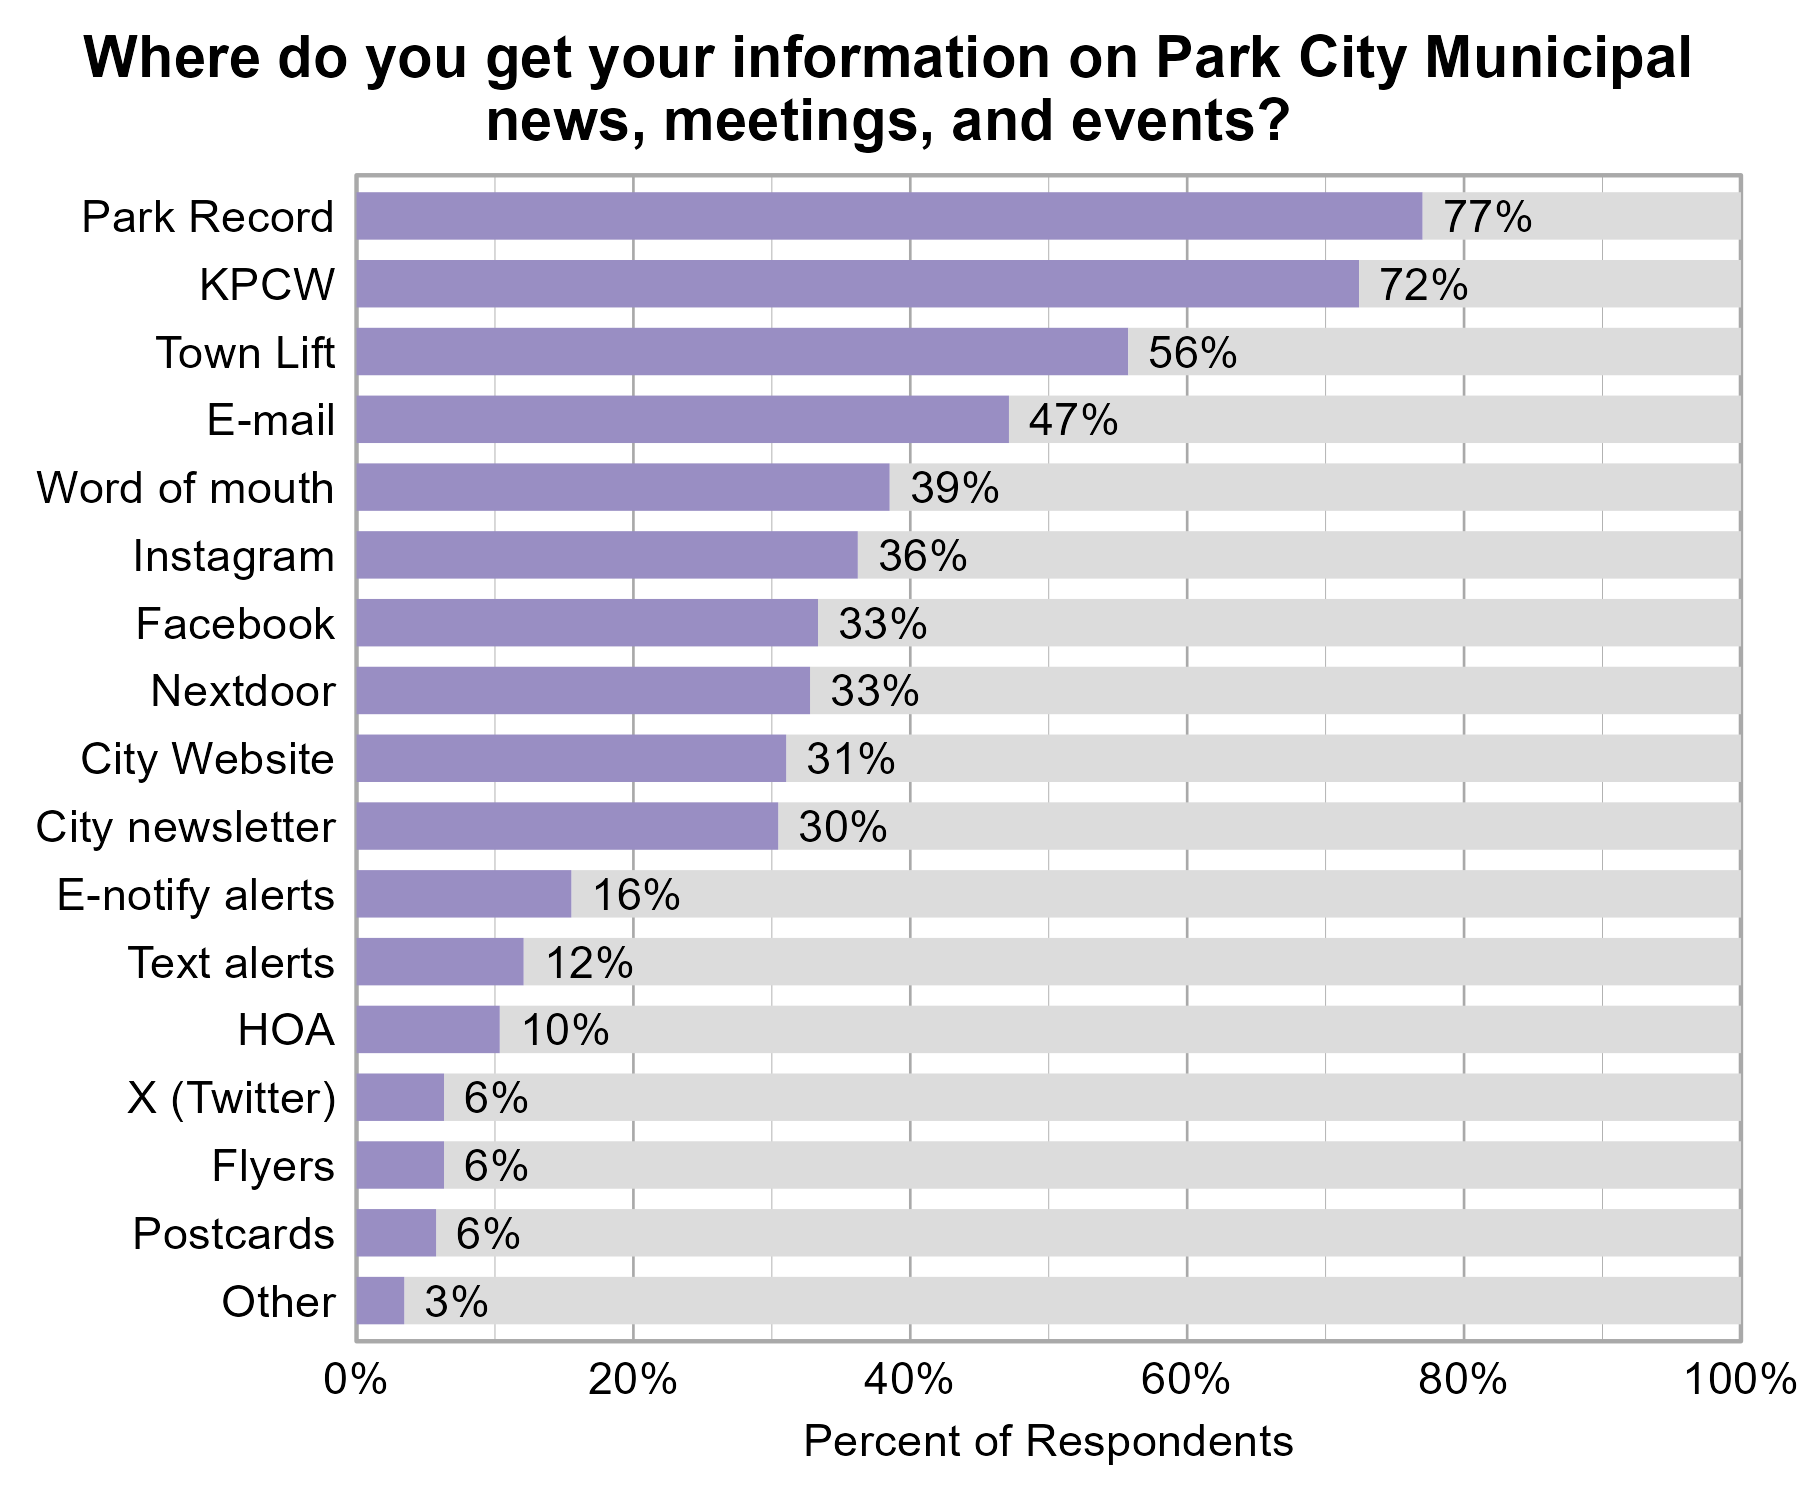
Survey respondents in the Park City area were asked to select all the sources where they received information on Park City Municipal news, meetings, and events. The most popular ways were Park Record (77%), KPCW (72%), and Town Lift (56%). The Park City Area 2022 survey also indicates similar results. Other sources of obtaining information generally included work and city council/planning meetings.
Looking at responses from just Park City (ZIP Code 84060), the percentage of respondents who indicated Nextdoor (20%) was lower, while those who indicated City Website (39%), and the Newsletter (37%) was higher.
Survey respondents were also asked about ways to improve getting information out. There were a variety of comments about information delivery. They generally suggest that a multifaceted approach to communication across delivery outlets is important as people have different preferences. Respondents indicated that getting information out in a timely manner and prior to events would be appreciated.
Open Comments
All open comments collected in the survey were shared with city leaders. General observations and themes are shared here. Comments from Park City alone (zip code 84060) did not differ greatly from the wider area beyond Park City.
What Respondents Value Most in the Park City Area
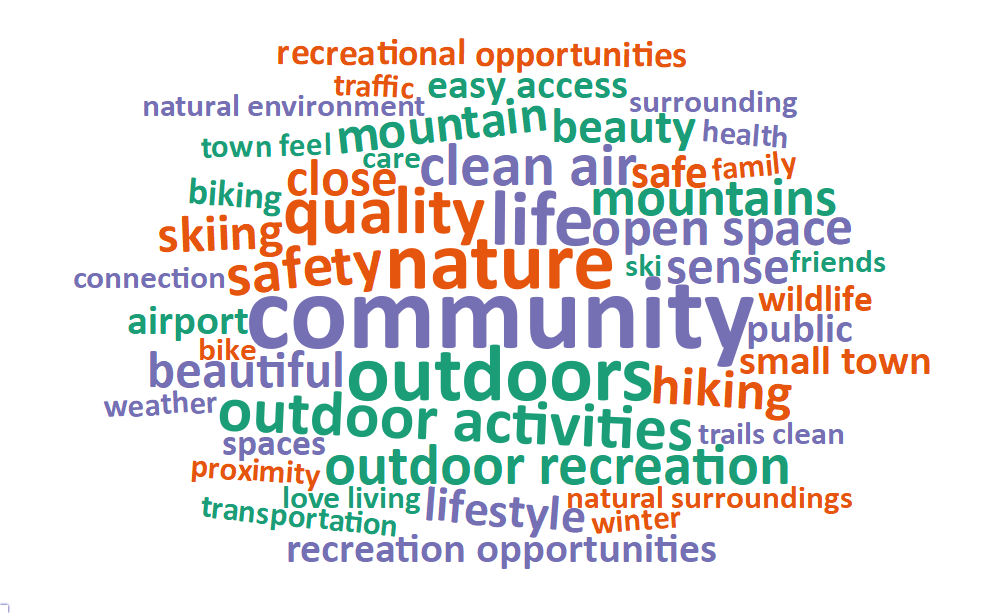
Survey respondents were asked to comment on what they value most about Park City. The most common words and phrases from all city comments are included in the word cloud below. It is possible that negative or unrelated words may appear since these words have been taken out of context, and they may not indicate the respondent’s intended meaning. Respondents valued recreation very highly and made many comments about enjoying their access to the outdoors and to activities such as hiking, biking, and skiing. Many people also commented on their connection to nature.
Local Environmental Quality in the Park City Area
The 28% of respondents who rated the Local Environmental Quality domain as 1, 2, or 3 (Poor, Fair, or Moderate) were further asked if there are specific aspects of local environmental quality that they feel are problematic. Air quality was the most common concern regarding local environmental quality. Water quality was also a concern, particularly regarding contamination from previous mining developments and ski wax. Traffic and having a more walkable city were also prevalent concerns in Park City.
Improving Wellbeing in the Park City Area
Survey respondents were asked if there is anything that could be done to improve wellbeing in Park City. A majority of the comments on how wellbeing could be improved centered around transportation and the desire for better public transportation especially in the winter when there are more tourists. Many people also asked for enhanced walkability and bike-ability in the town. Traffic was a frequent comment as well.
Additional Comments
Respondents were also asked if they had any additional comments on wellbeing in Park City. Lack of affordable housing and affordable shopping was mentioned several times. Respondents also focused on the idea of neglect from the city in terms of services and opportunities and felt that the tourists are the focus of Park City in many regards.