Providence Wellbeing Survey Findings 2024
By Dr. Courtney Flint and Team
![]()
Contact Information
Dr. Courtney Flint
courtney.flint@usu.edu
435-797-8635
Summary
Providence is one of 51 cities participating in the Utah Wellbeing Survey Project in 2024. This project is designed to assess the wellbeing and local perspectives of city residents and to provide information to city leaders to inform general planning processes. Additional analysis is underway and this report may be updated over time.
We are grateful to all those who took the survey and to our city partners who helped to make this possible. We are grateful to a number of entities for funding: the Utah League of Cities and Towns, USU Extension, USU’s Institute for Land Water and Air, the Wasatch Front Regional Council, Utah Department of Transportation, the Utah Agricultural Experiment Station, and the cities of Alpine, Cedar Hills, Draper, Millcreek, Nephi, North Salt Lake, Ogden, Orem, Pleasant Grove, Providence, Springdale, Tremonton, West Bountiful, and West Valley City.
This report describes findings from the 2024 Providence survey and comparative information with other project cities. From February to May 2024, Providence City advertised the survey for residents through email, social media, flyers, and newsletters. All city residents age 18+ were encouraged to take the online Qualtrics survey.
How many people responded?
- 214 viable surveys were recorded in this 2024 survey effort.
- The adult population of Providence was estimated at 5,518, based on the American Community Survey by the U.S. Census. The 214 survey responses in 2024 represent 3.9% of the adult population and have a conservative margin of error of 6.57%.
Survey Respondent Characteristics
| Resident Statistics | |
|---|---|
| Full Time Residents of Providence | 98.6% |
| Part Time Residents of Providence | 1.4% |
| Length of Residency — Range | 0.5-54 years |
| Length of Residency — Average | 12.4 years |
| Length of Residency — Median | 8 years |
| Length of Residency 5 Years or less | 40.2% |
| ZIP Code | Percent |
|---|---|
| 84332 | 99.5% |
| Other | 0.5% |
Demographic characteristics of the survey respondents were compared below with U.S. Census information from the 2018-2022 American Community Survey. In the graph below, gray bars indicate differences between the American Community Survey estimates and the Utah Wellbeing Project surveys. The wider the gray bars, the larger the differences. Also note that estimates for religious affiliation, adult non-conforming or non-binary gender, disability, and chronic conditions are unavailable from the census data. There can also be a variable margin of error in the American Community Survey estimates, and caution should be used when comparing estimates. Not all respondents provided demographic information. As the graph shows, 2024 survey respondents were not fully representative of Providence. People who have at least a 4-year college degree, have an income $100,000 to $149,999, are married, and have children under 18 in their household were overrepresented while those who are age 18-29 and do not have a college degree were underrepresented.

Overall Personal Wellbeing and Overall Wellbeing in Providence
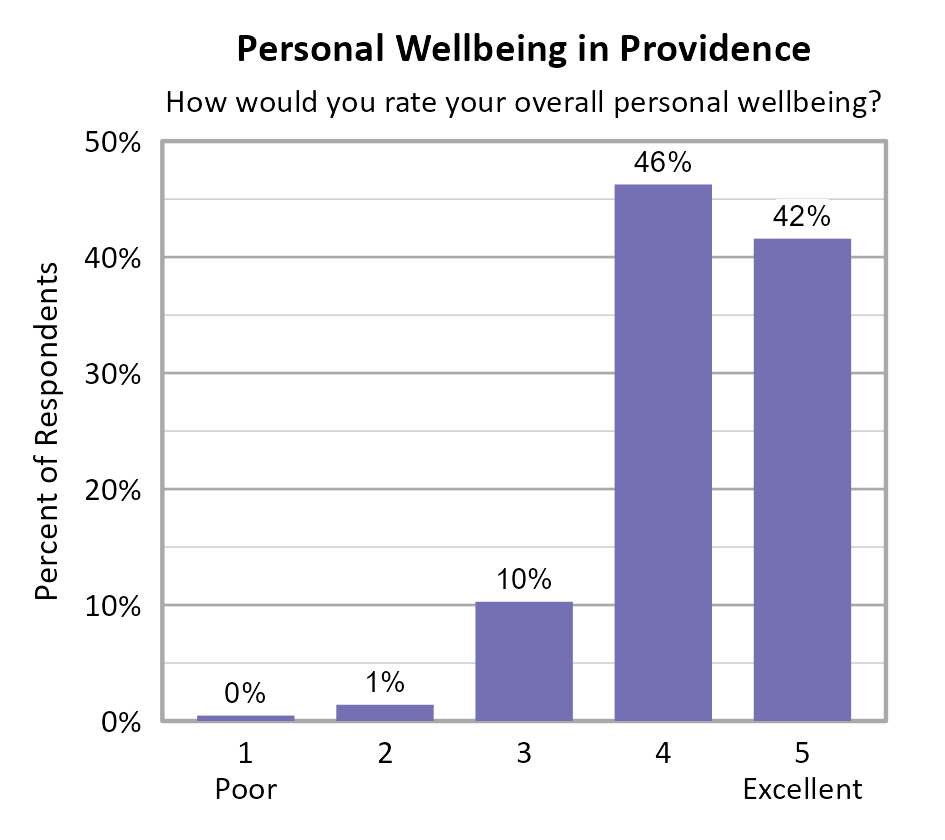
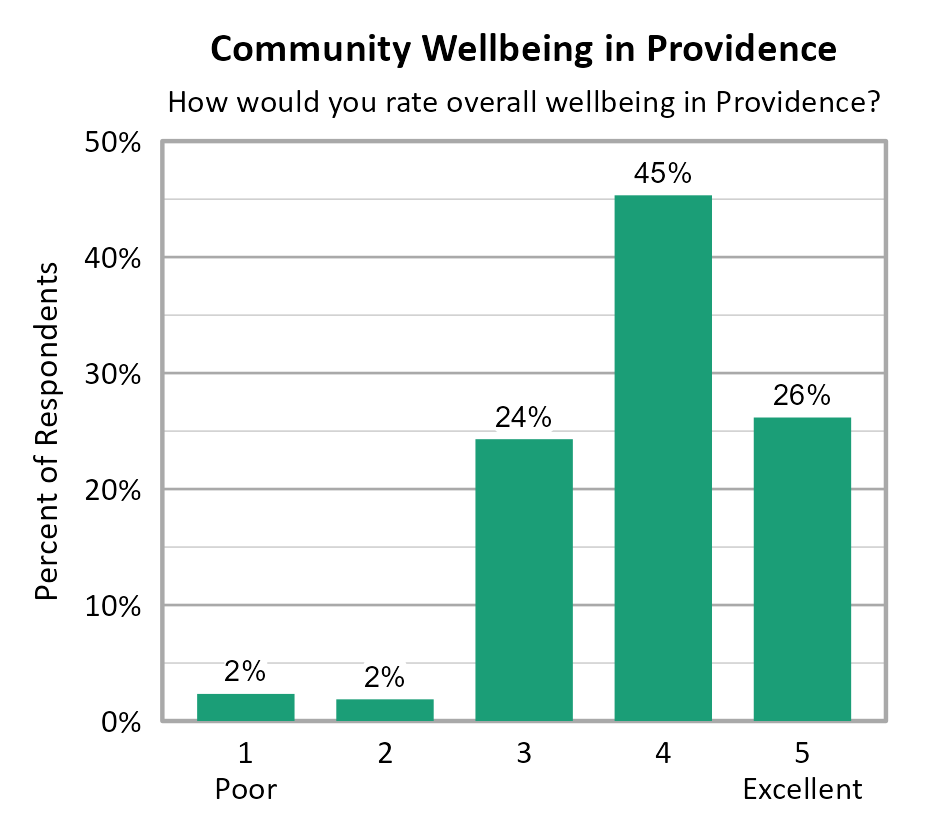
Survey participants were asked about their overall personal wellbeing and overall community wellbeing in Providence. These wellbeing indicators were both measured on a 5-point scale from poor (1) to excellent (5). The average personal wellbeing score in Providence was 4.27 with 88% of respondents indicating their wellbeing at a 4 or 5 on the 5-point scale. The average score for community wellbeing in Providence was 3.91 with 71% of respondents indicating community wellbeing at a 4 or 5 on the 5-point scale.
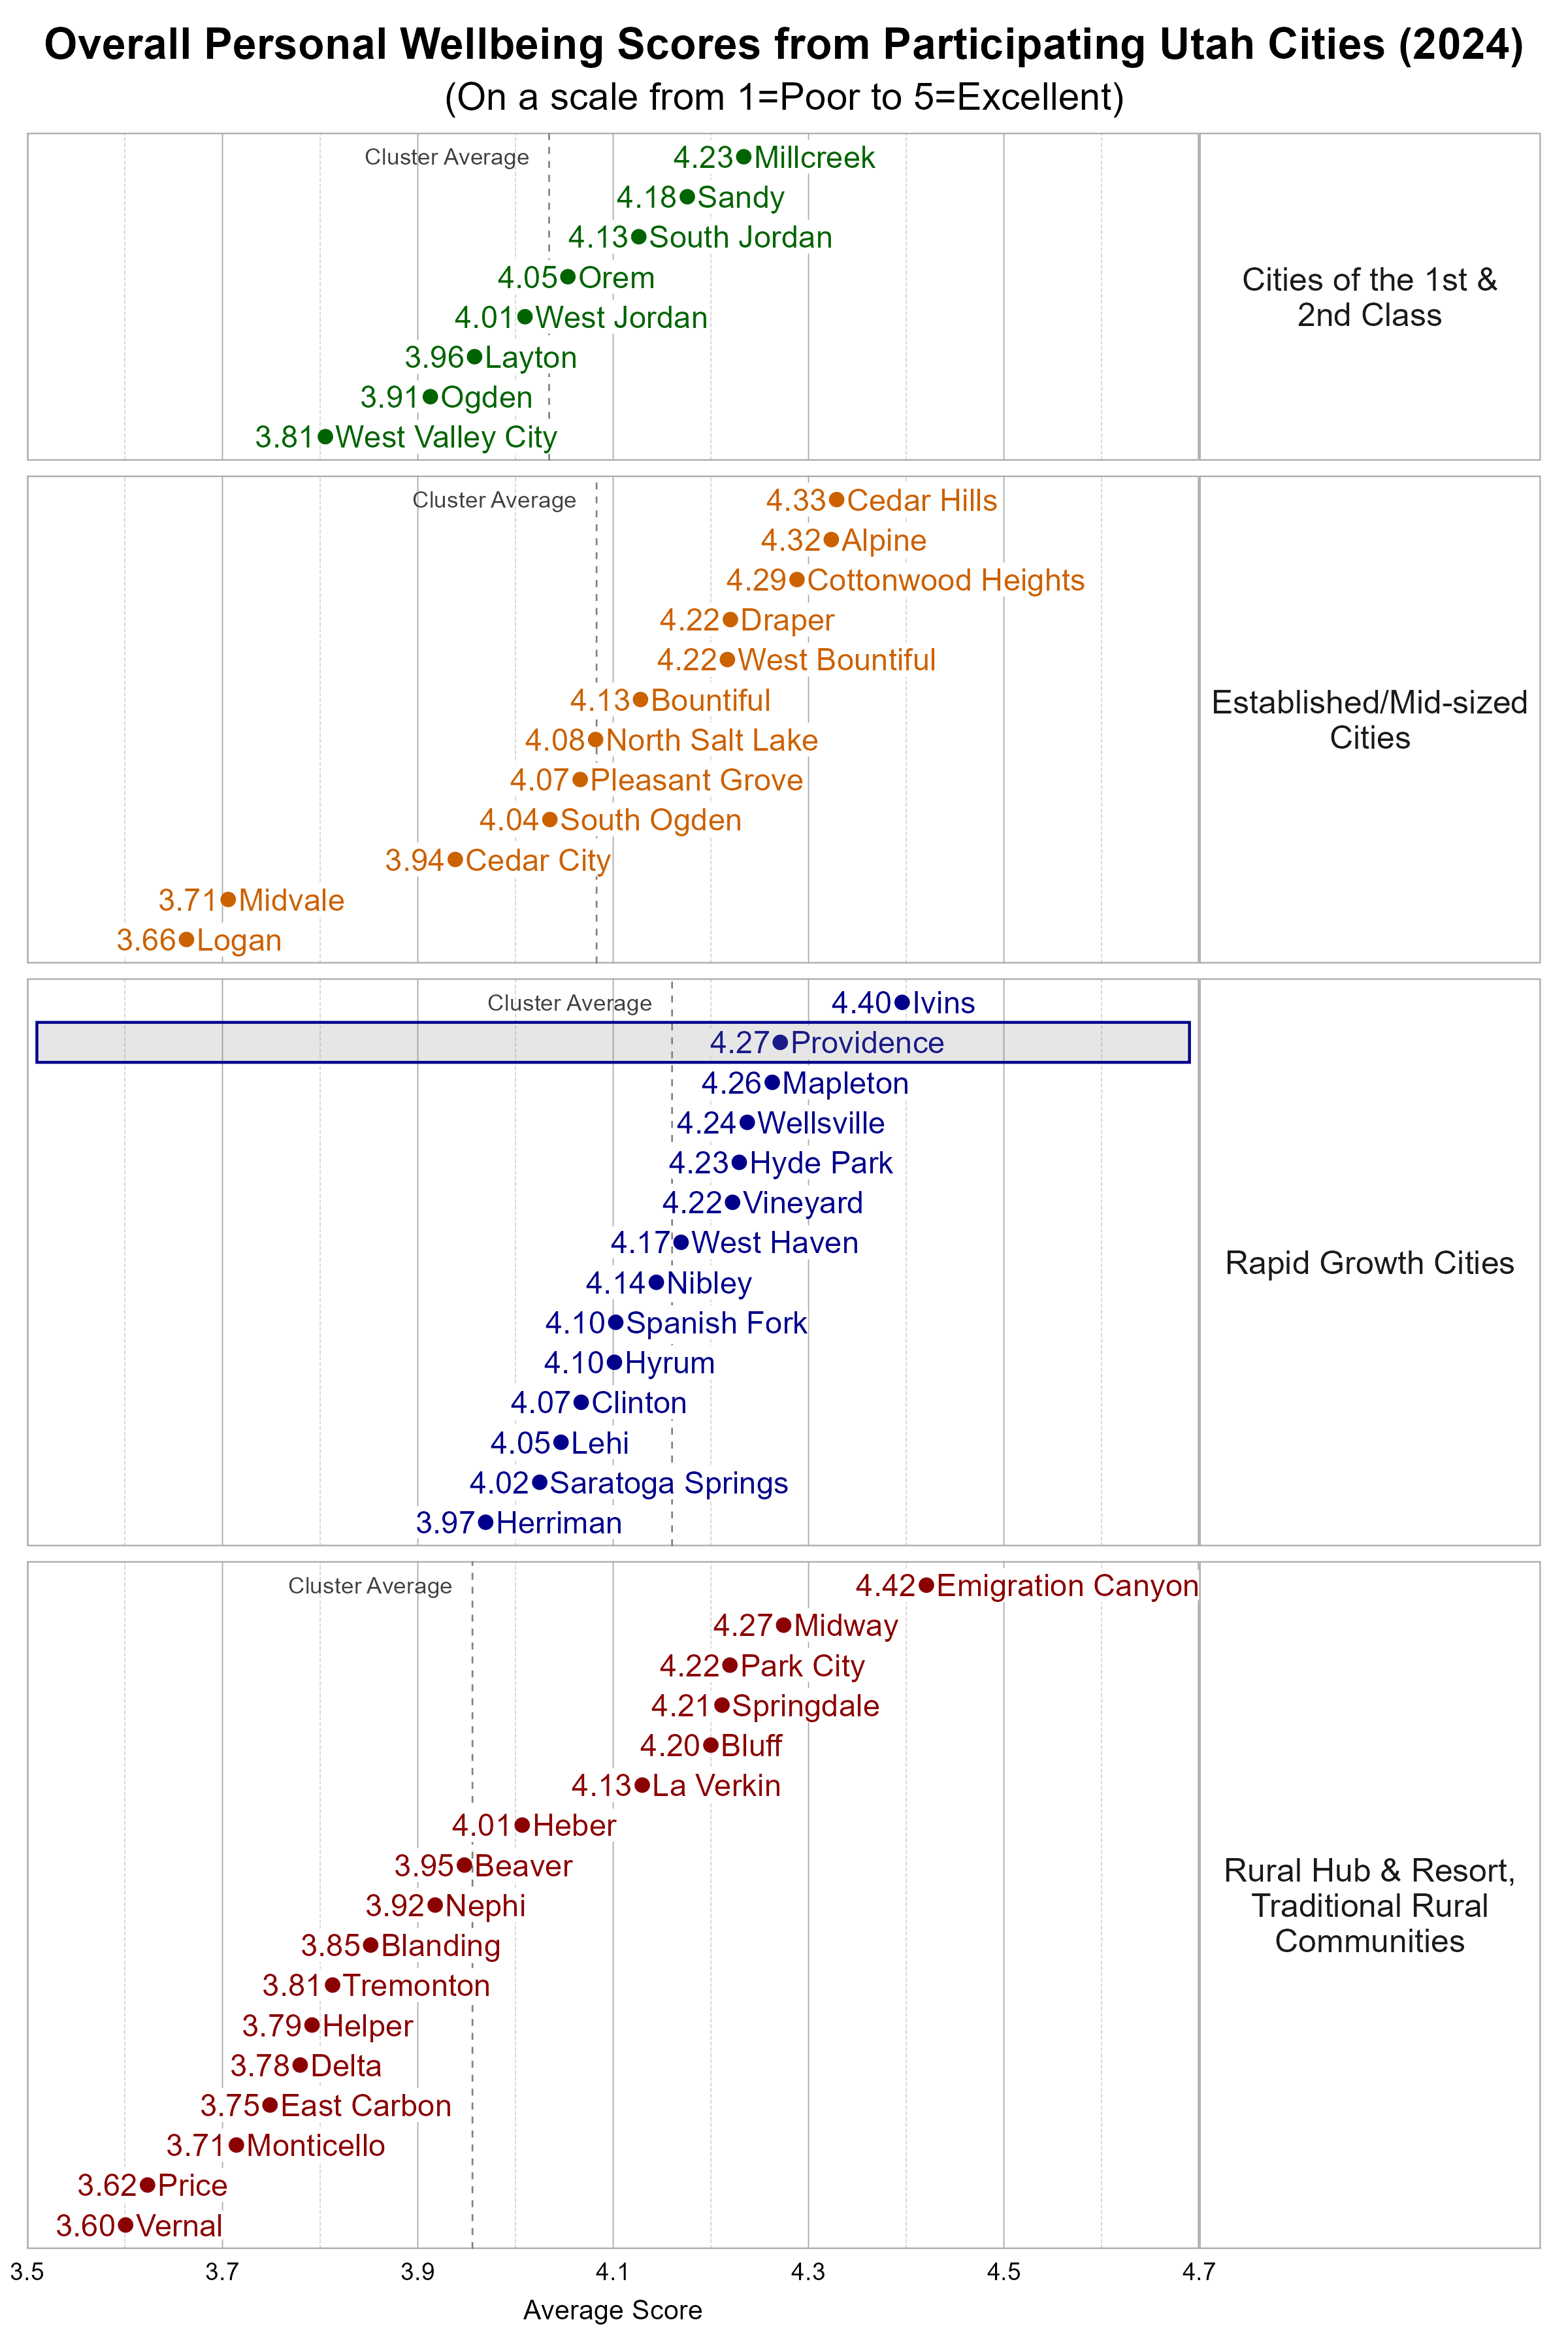
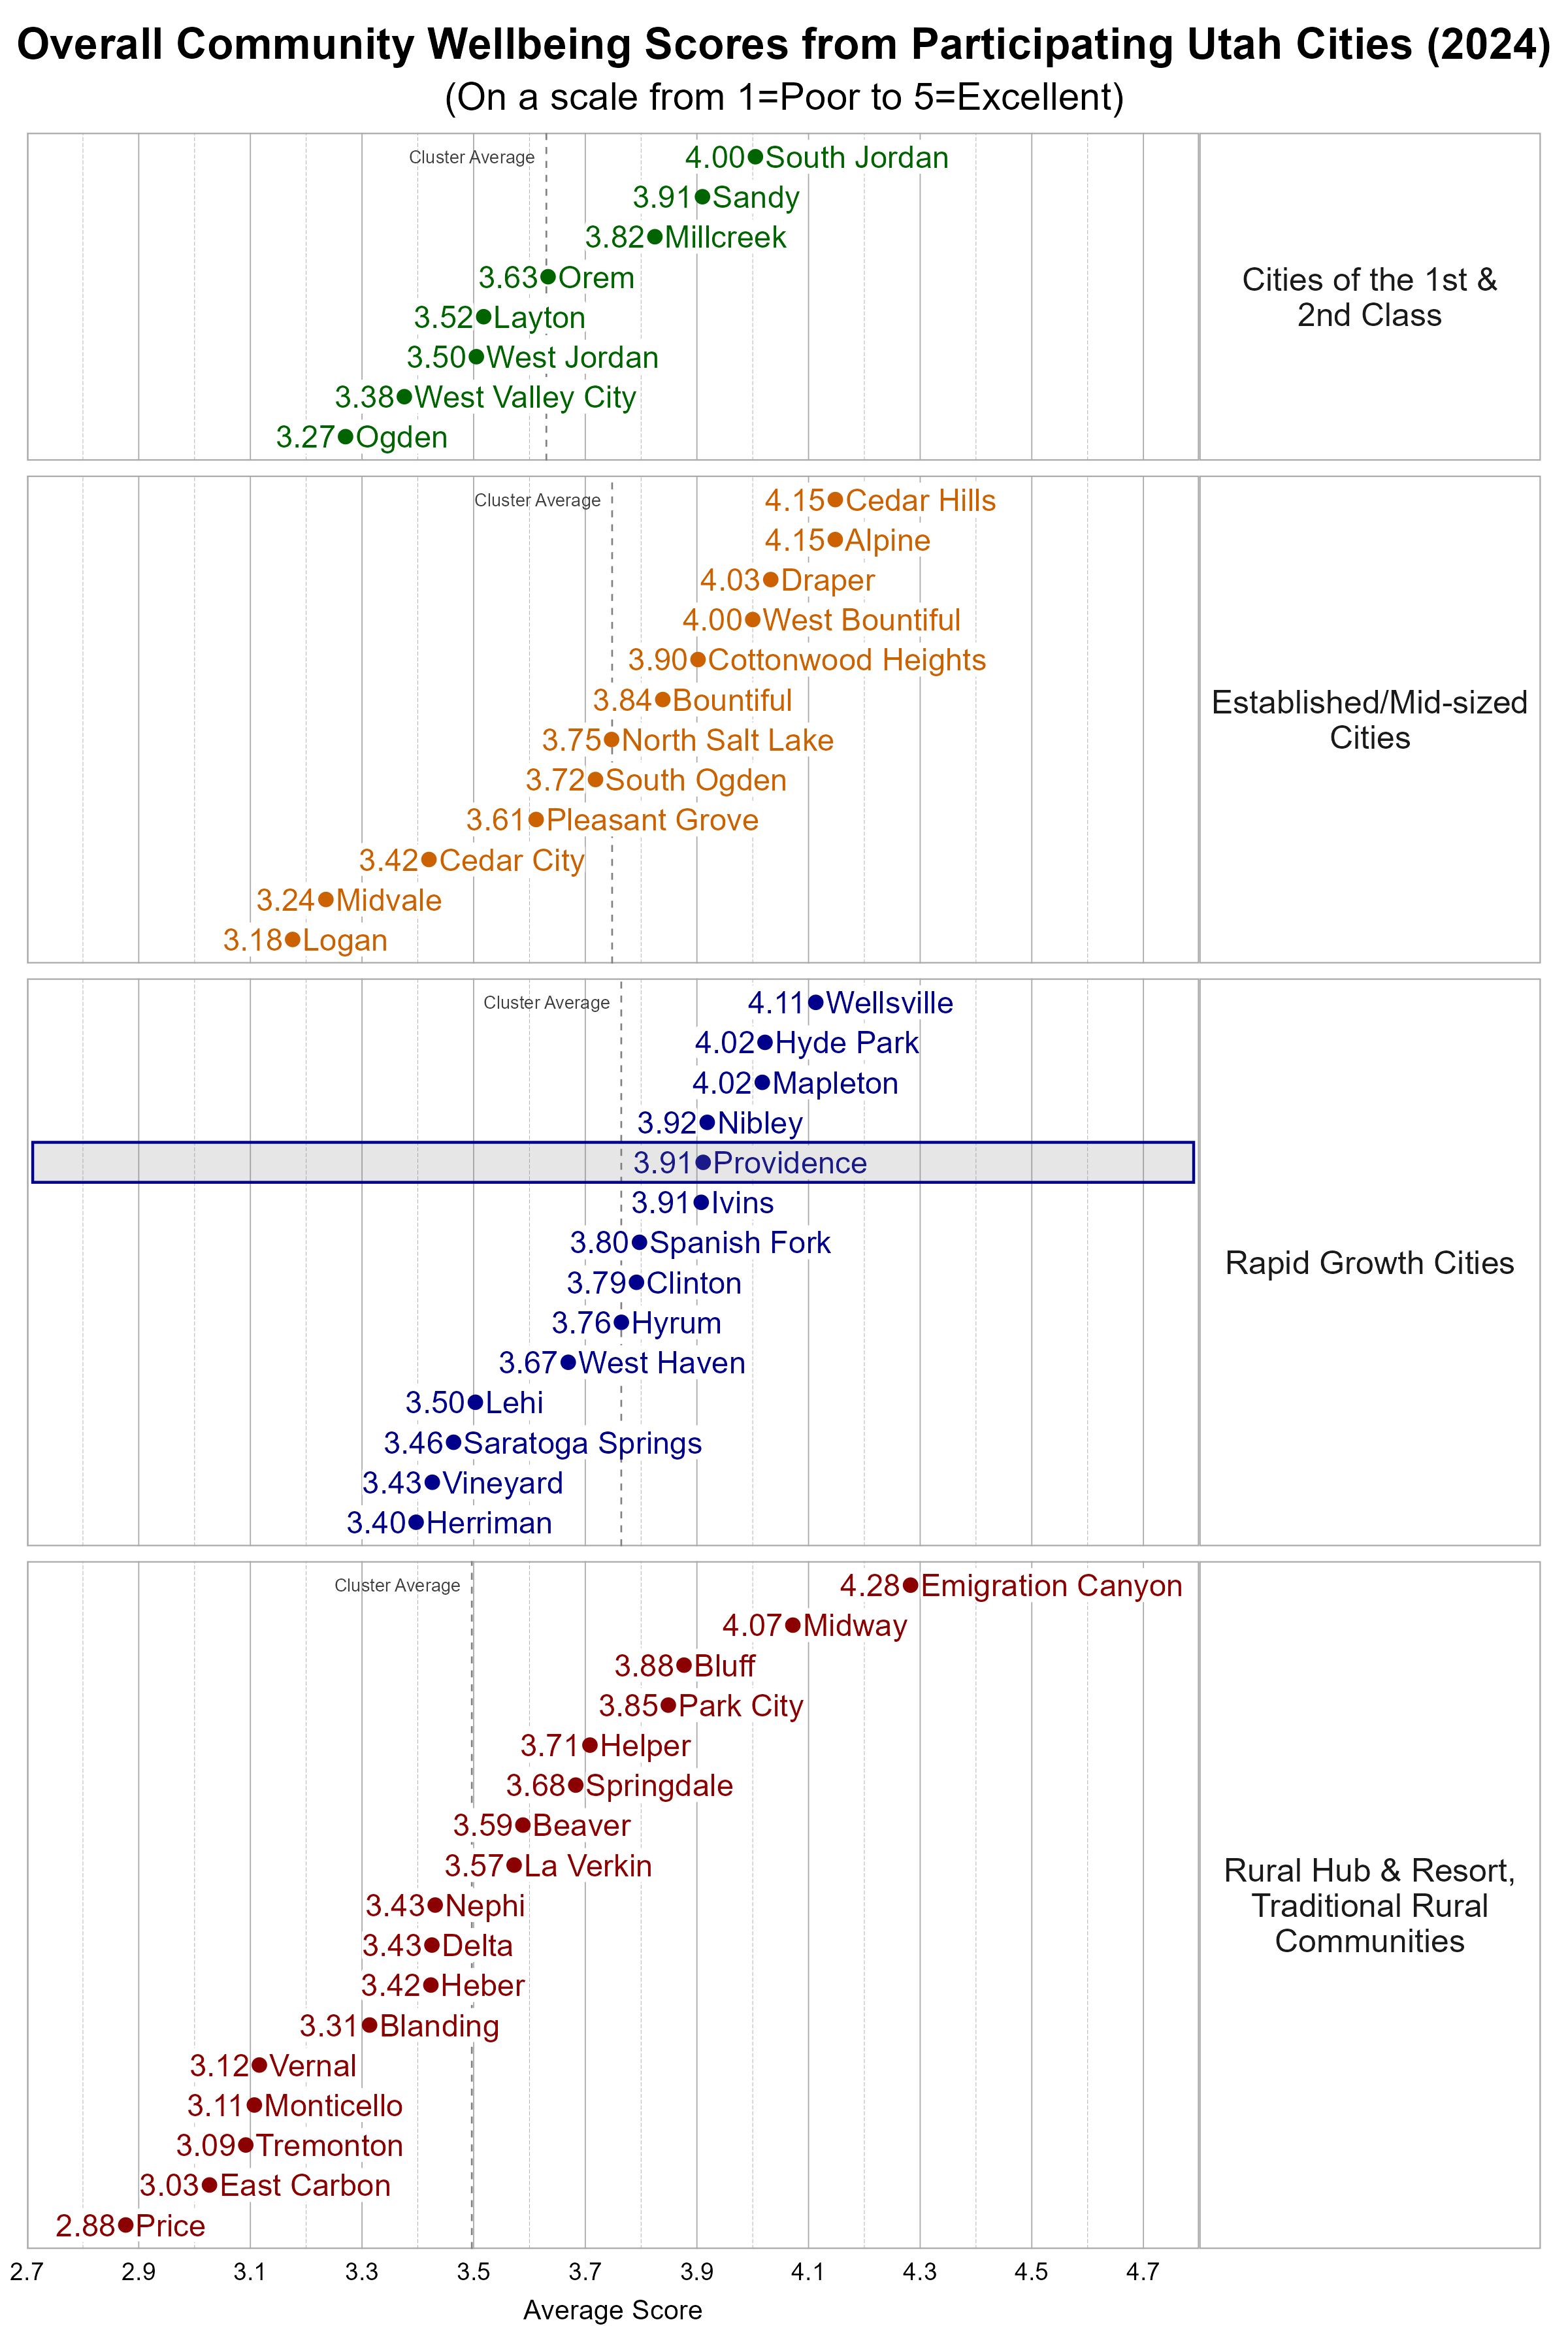
Comparing Wellbeing Across Utah Cities
The Utah League of Cities and Towns clusters cities and towns into five different categories based on size and growth rates. We utilize these clusters in our analysis. Providence is classified as a Rapid Growth City. Some cities may fit within more than one cluster.
Within the Rapid Growth city cluster, Providence was well above the average overall personal wellbeing score and slightly above the average overall community wellbeing score.
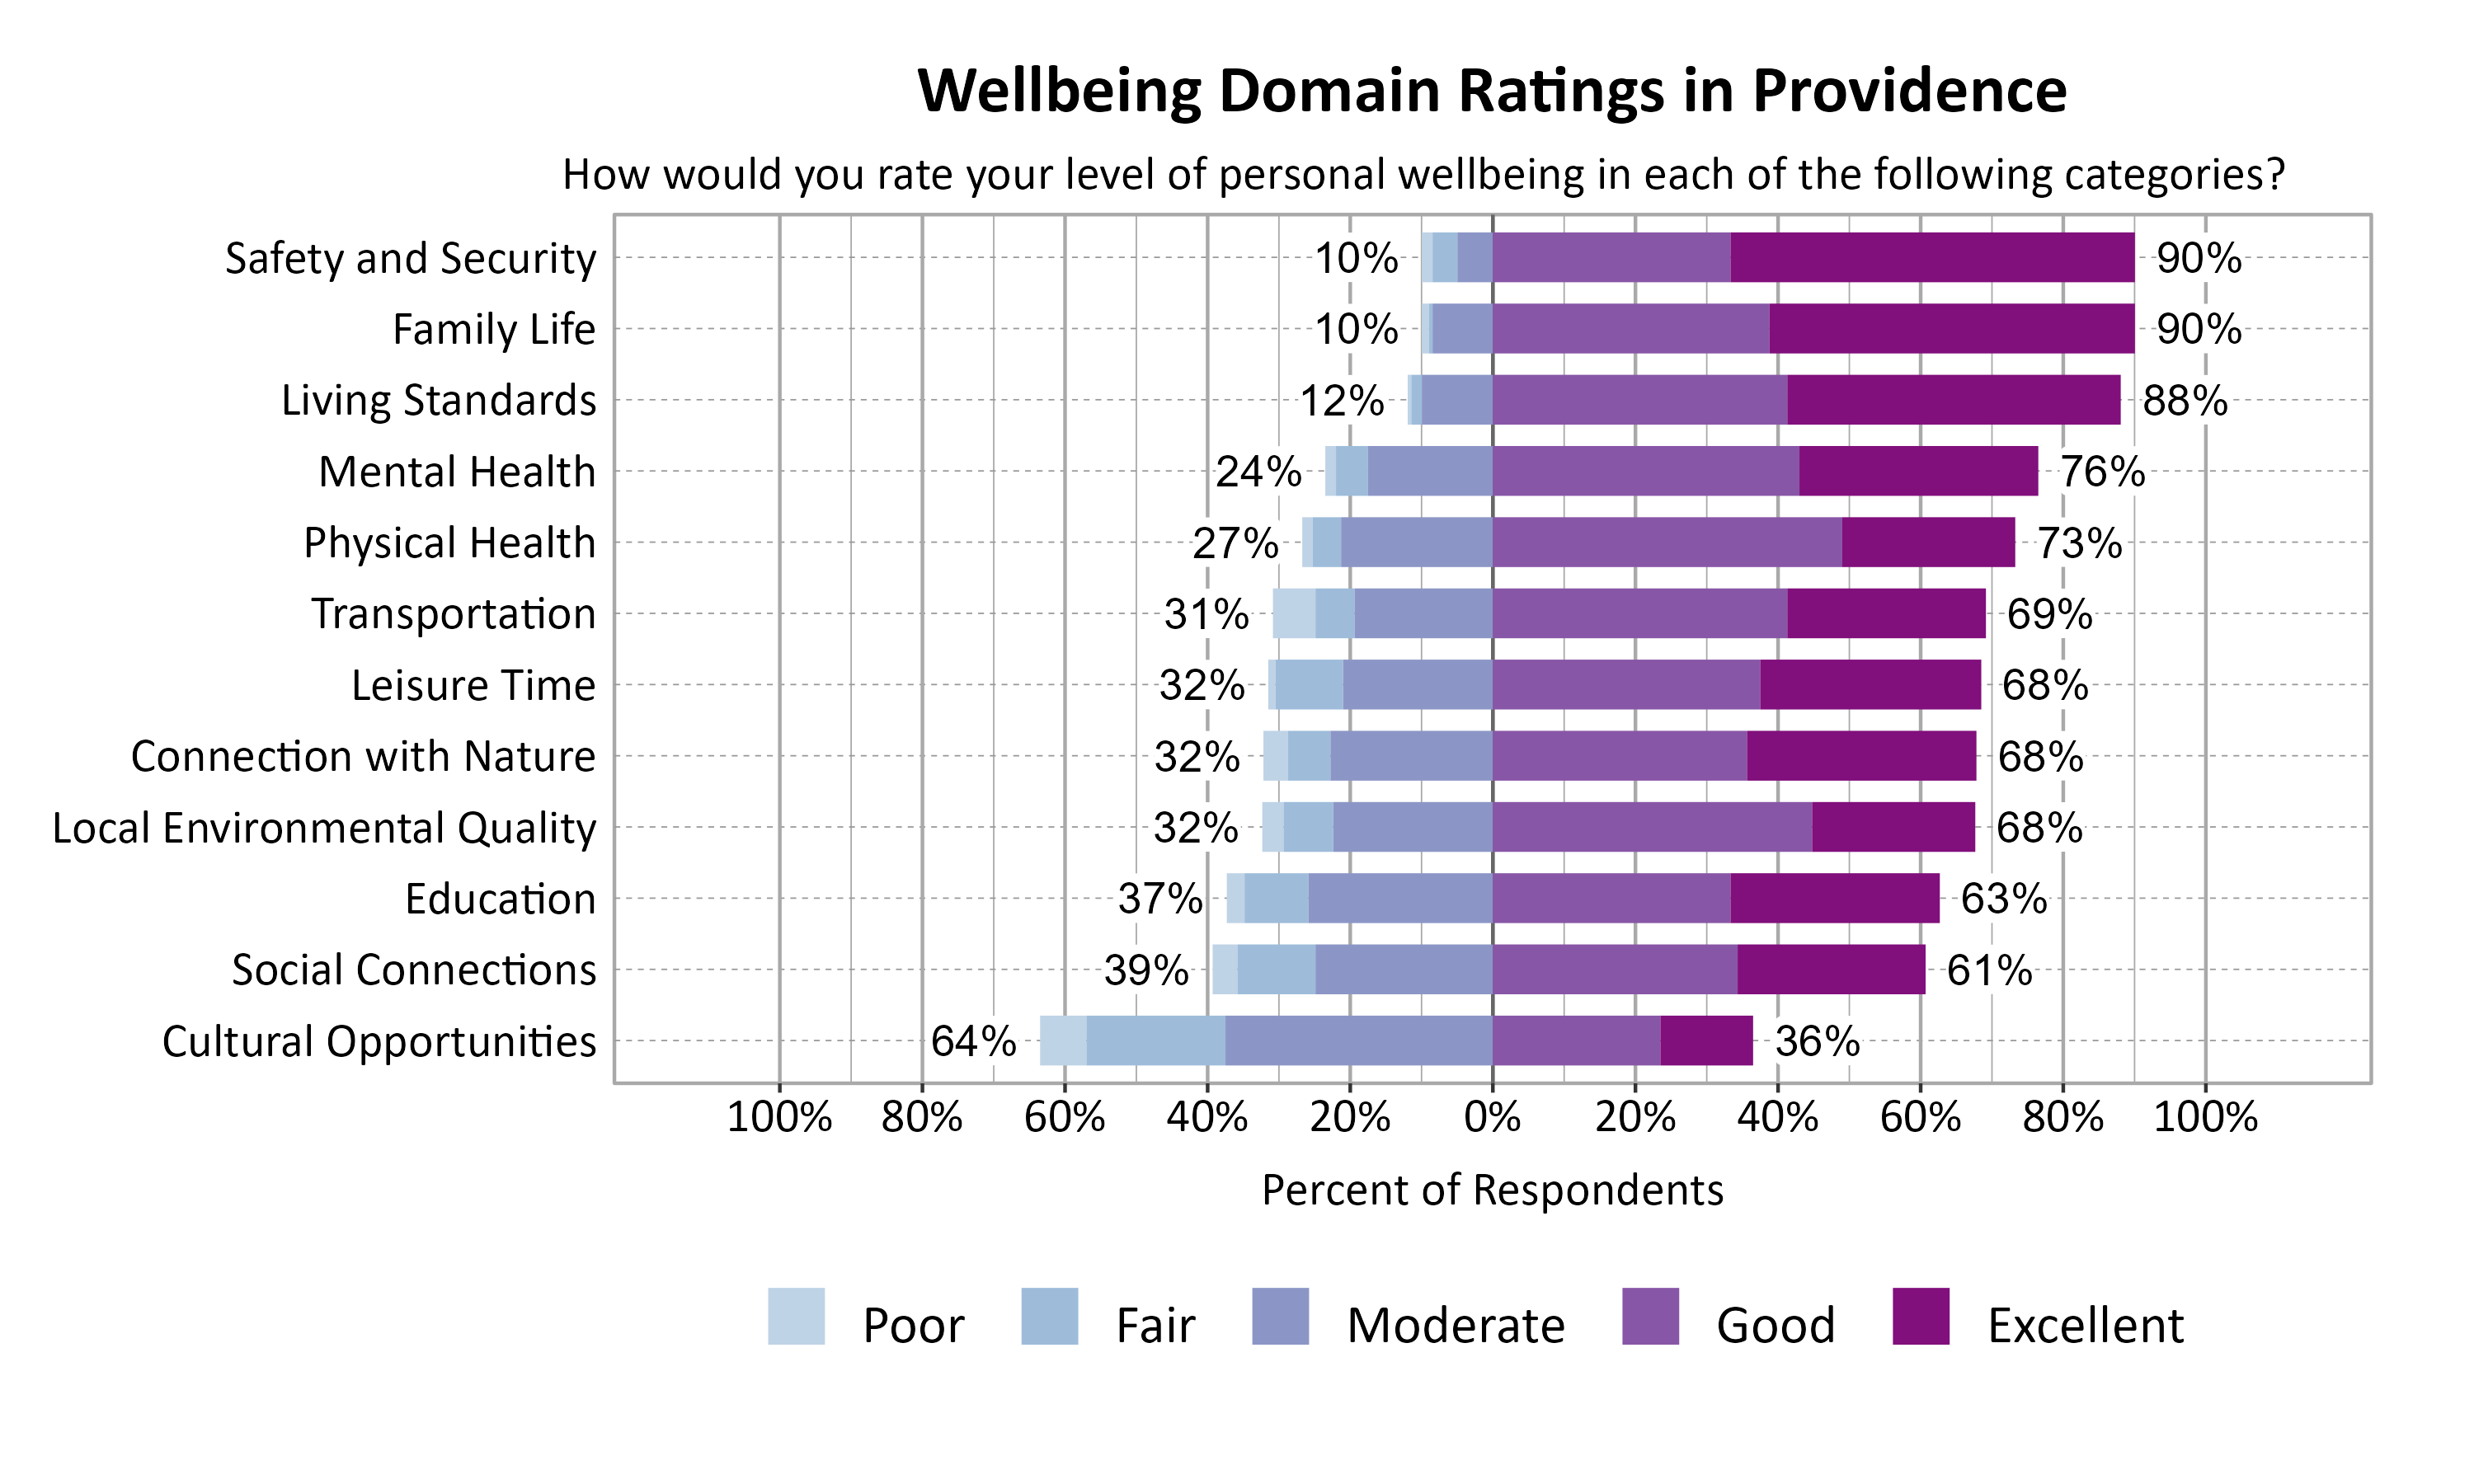
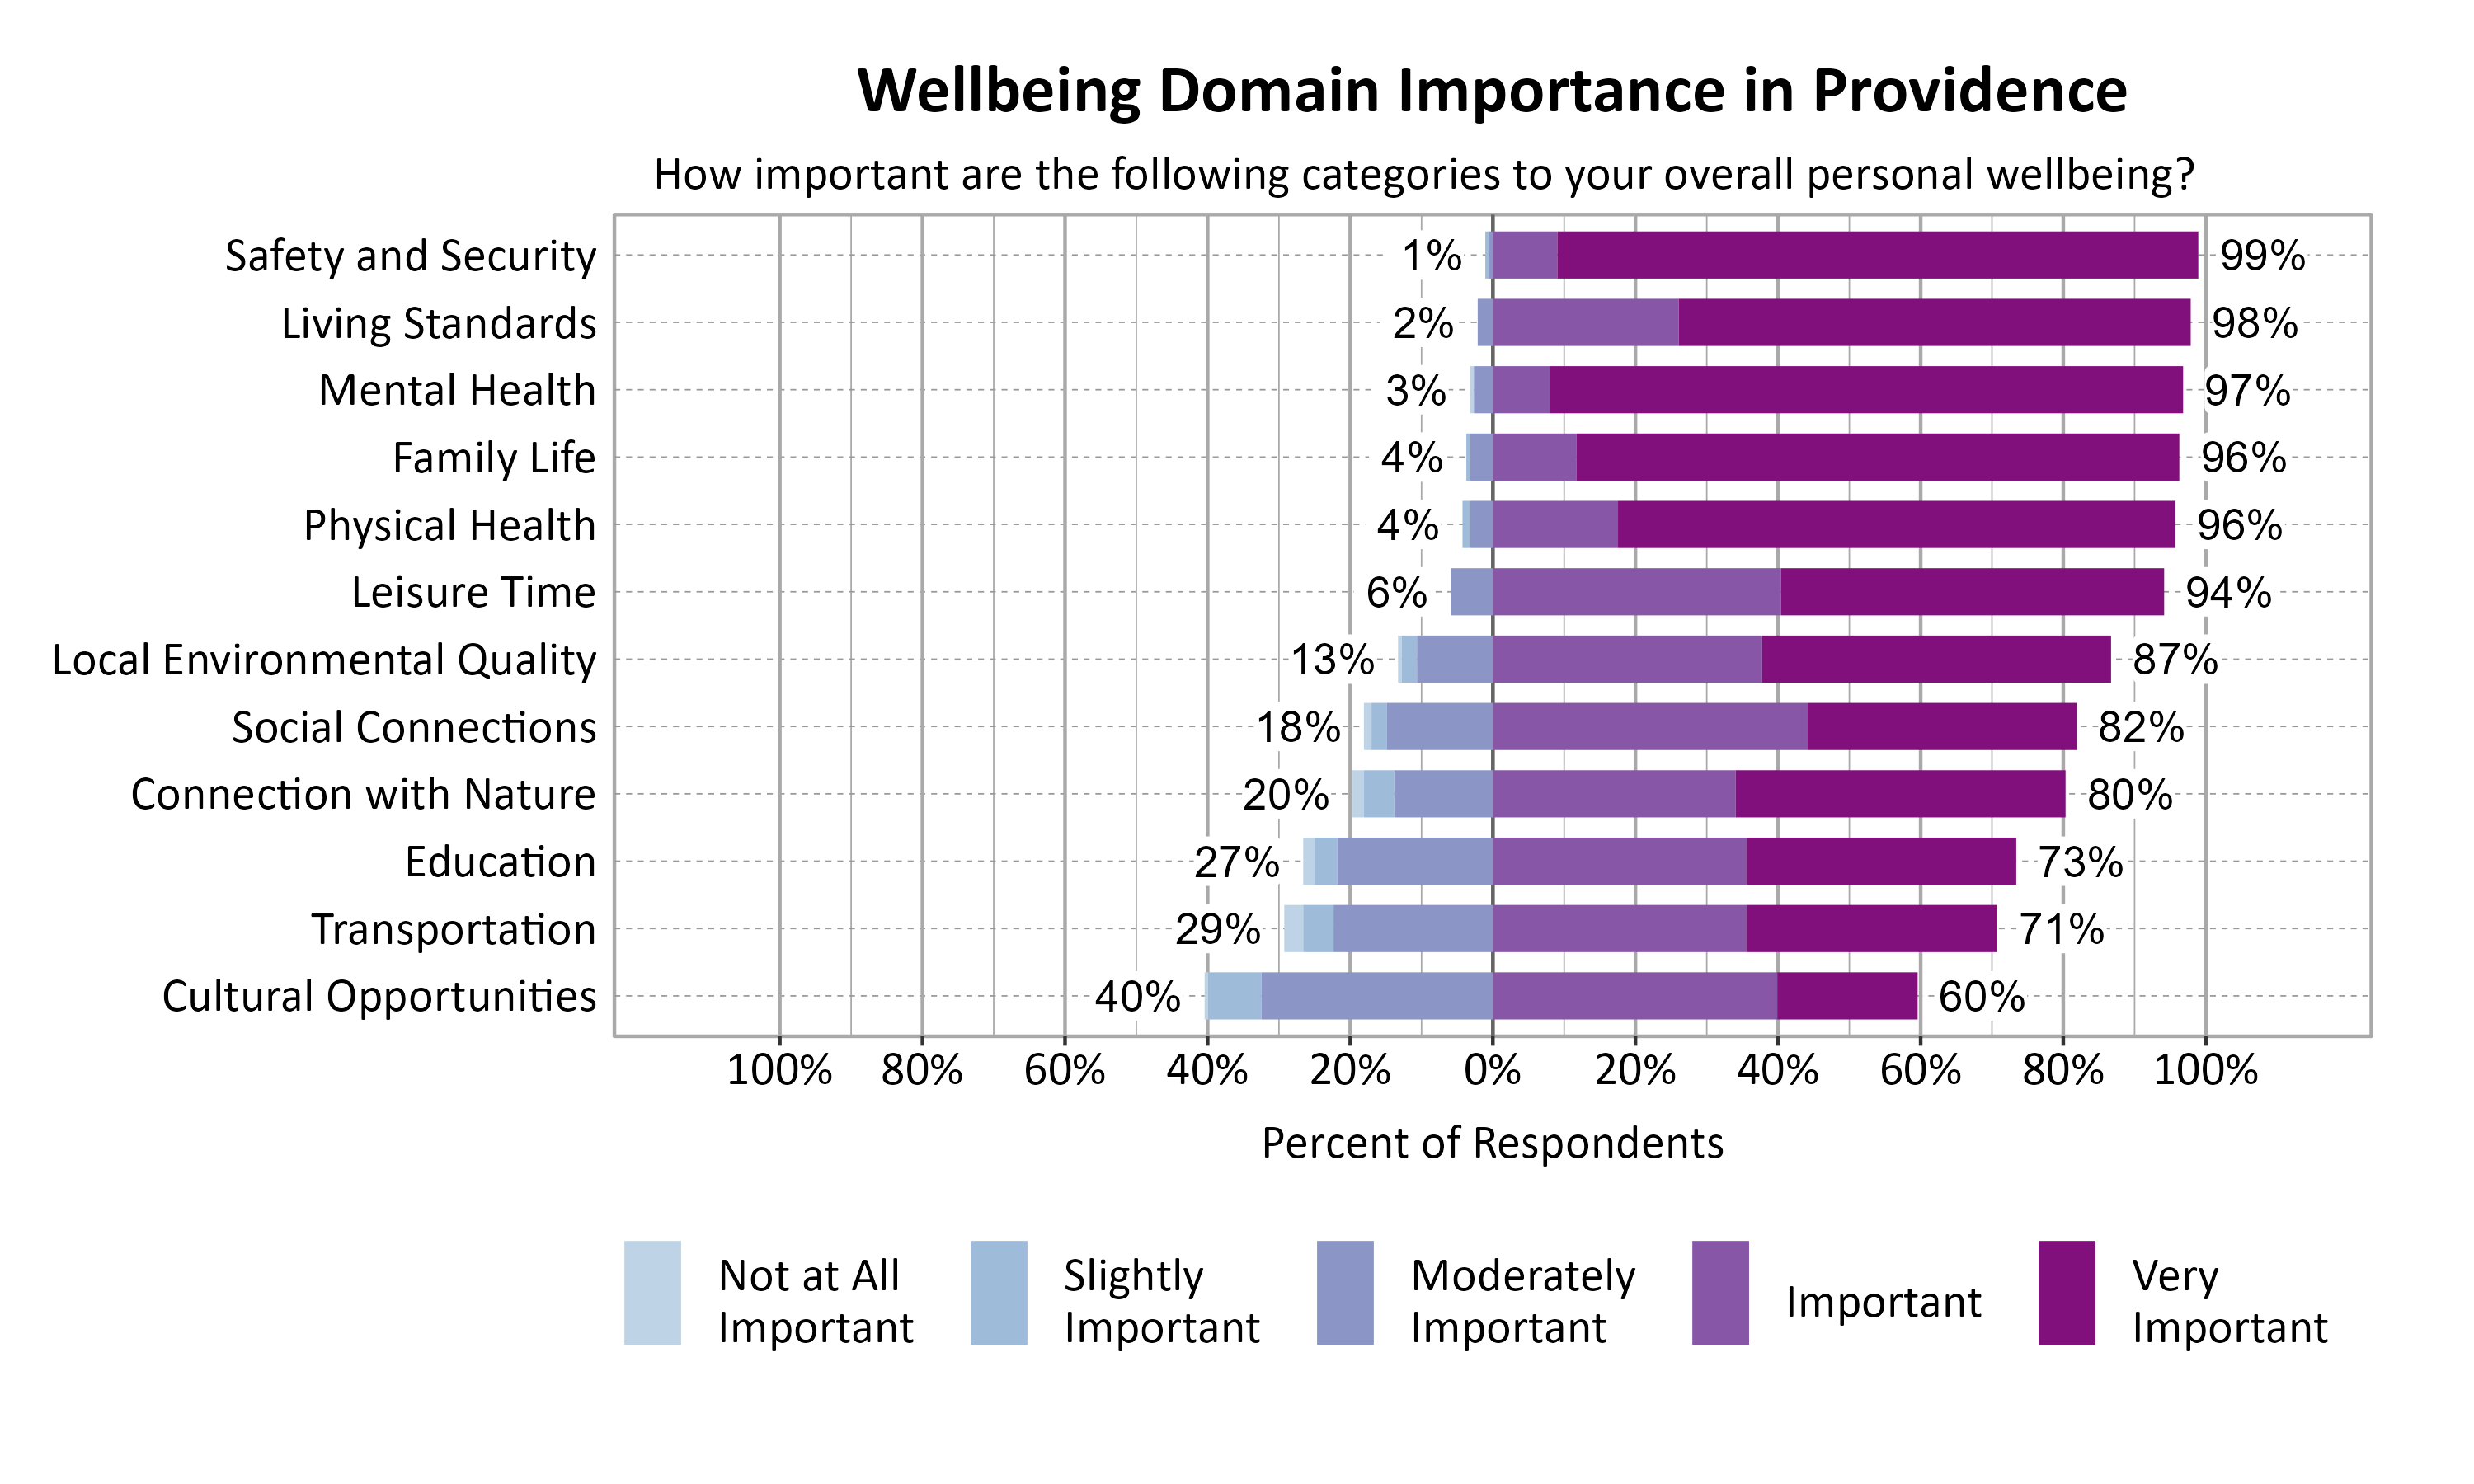
Wellbeing Domains in Providence
According to national and international entities that track wellbeing, there are a number of common dimensions or domains of wellbeing. Survey respondents rated twelve domains on a 5-point scale from poor to excellent. They were also asked to indicate the importance of each domain to their overall personal wellbeing on a 5-point scale from not at all important to very important. The highest rated wellbeing domains for respondents in Providence were Family Life (90%), Safety and Security (90%), and Living Standards (88%). The most important wellbeing domains were Safety and Security (99%), Living Standards (98%), Mental Health (97%), Family Life (96%), and Physical Health (96%).
Wellbeing Matrix for Providence
The graph below illustrates the relationship between the average rating and the average importance of wellbeing domains for survey respondents from Providence. Family Life, Living Standards, Mental Health, and Safety and Security were highly important and rated above average among the domains. Leisure Time and Physical Health fell in the “red zone” of higher importance and lower ratings.

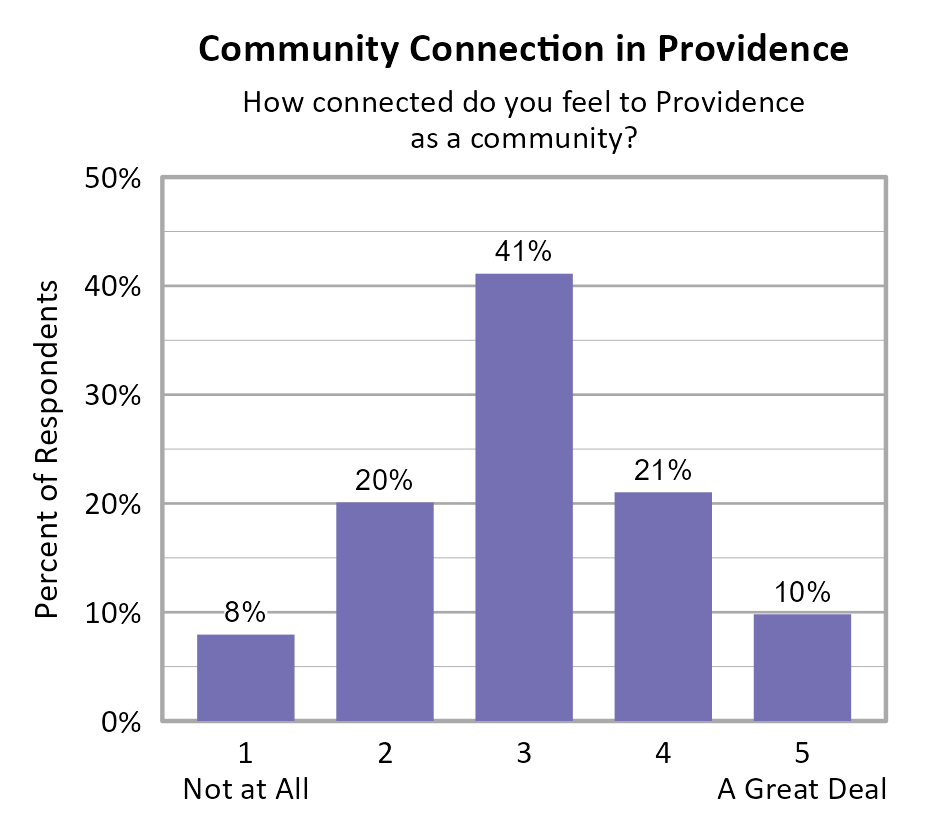
Community Connection in Providence
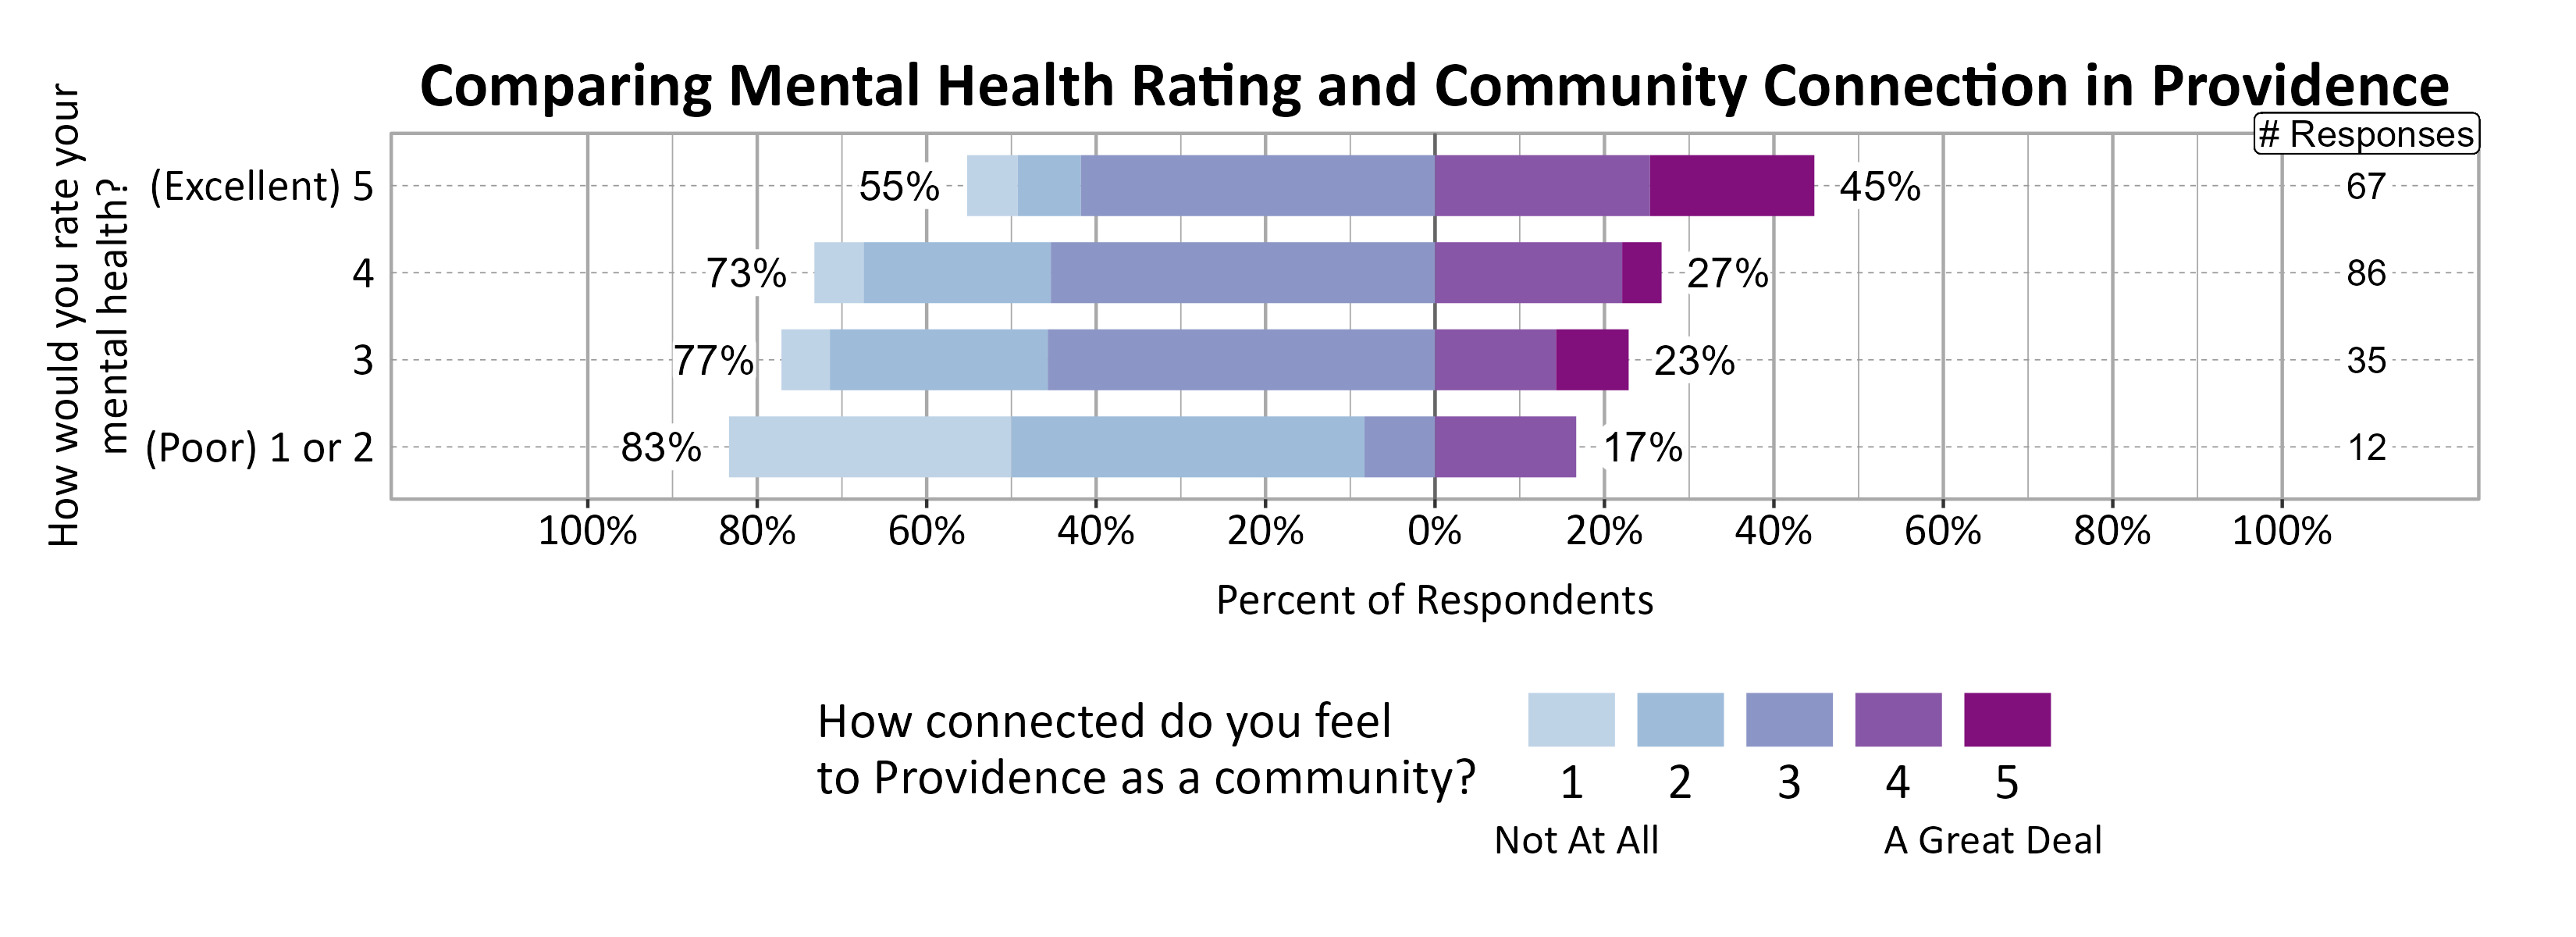
Survey participants were asked about how connected they feel to Providence on a 5-point scale from not at all (1) to a great deal (5), and the average score of all respondents was 3.05.
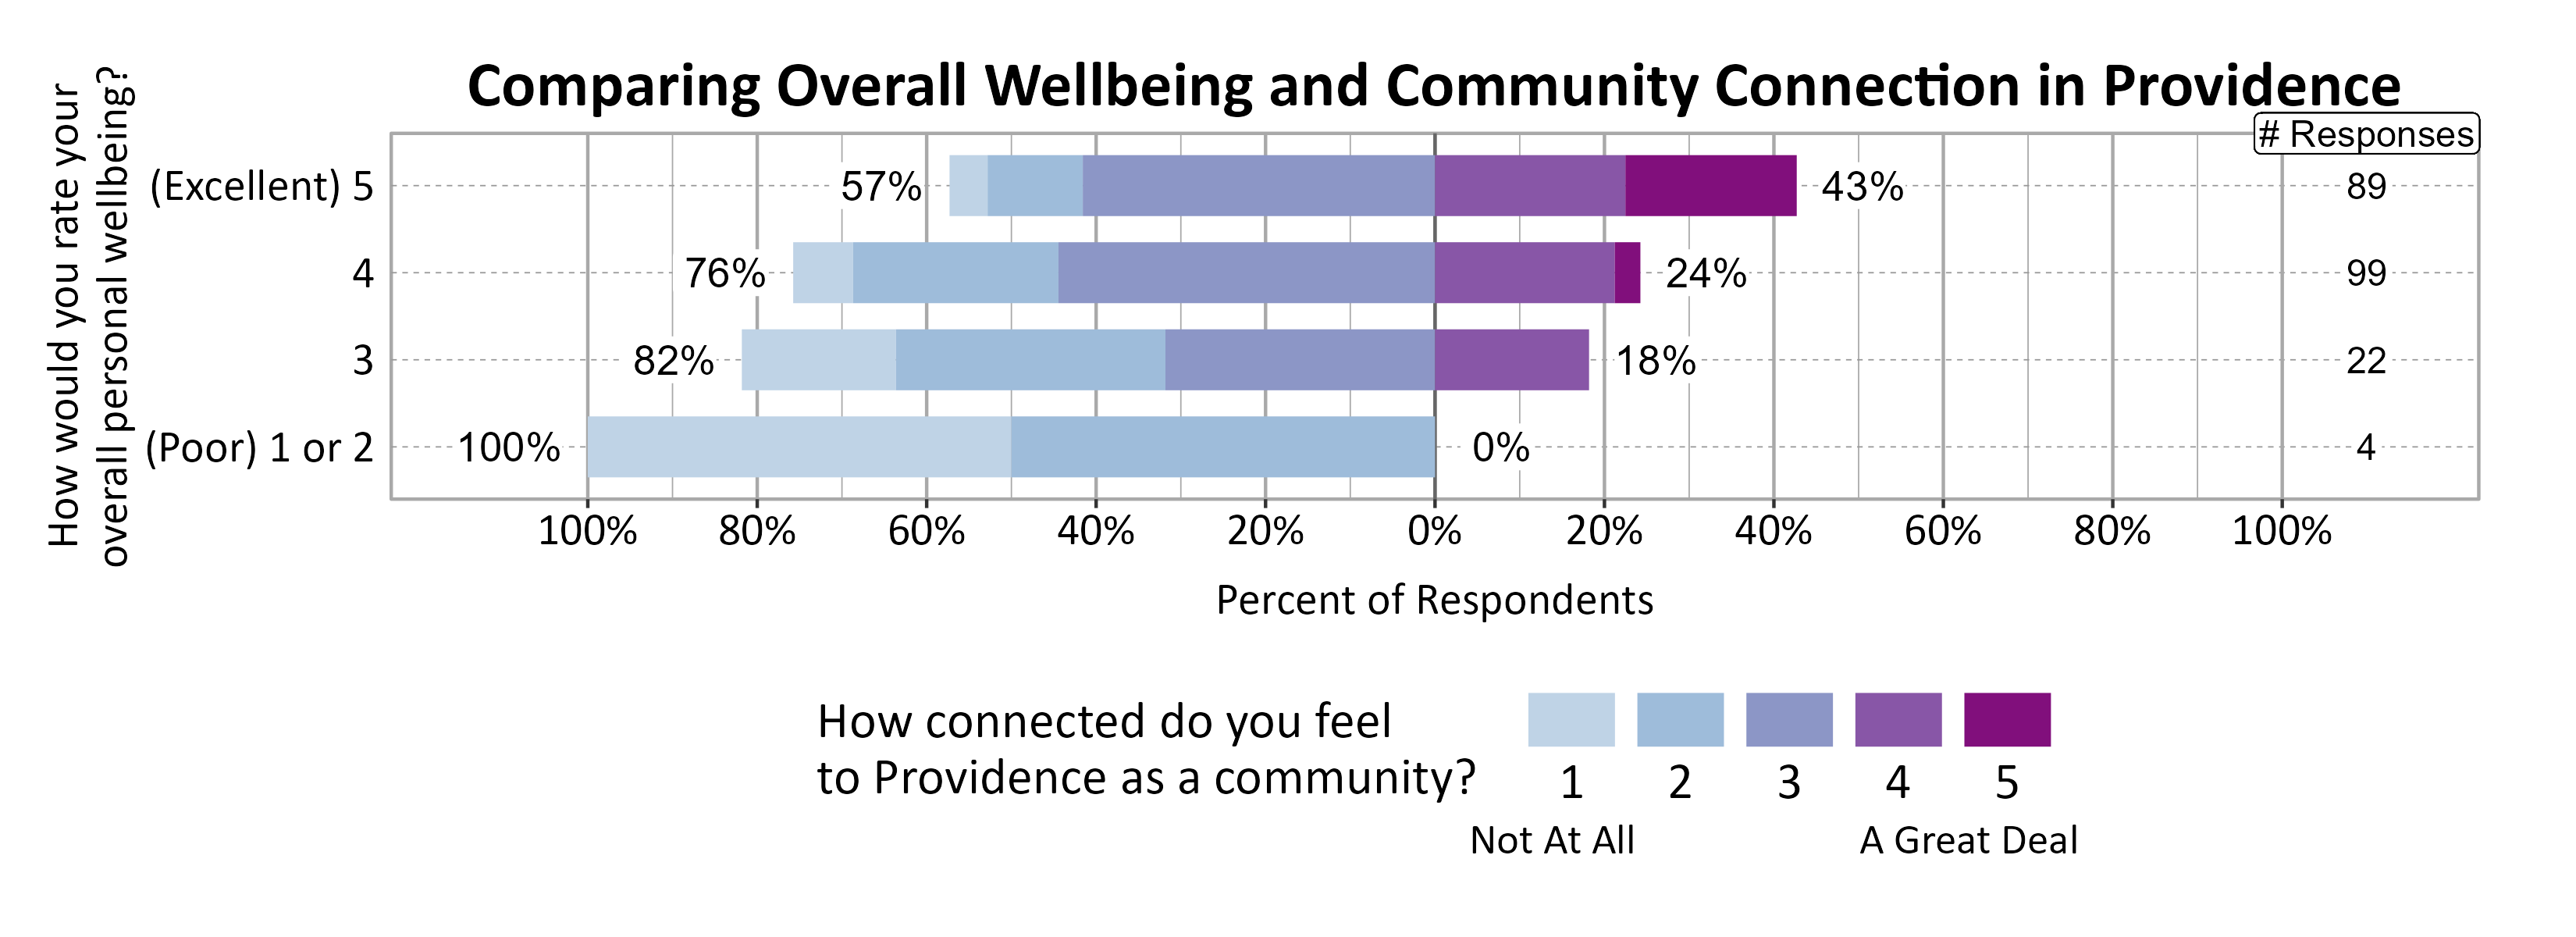
A positive relationship was found between individuals’ community connection and overall personal wellbeing as well as mental health.
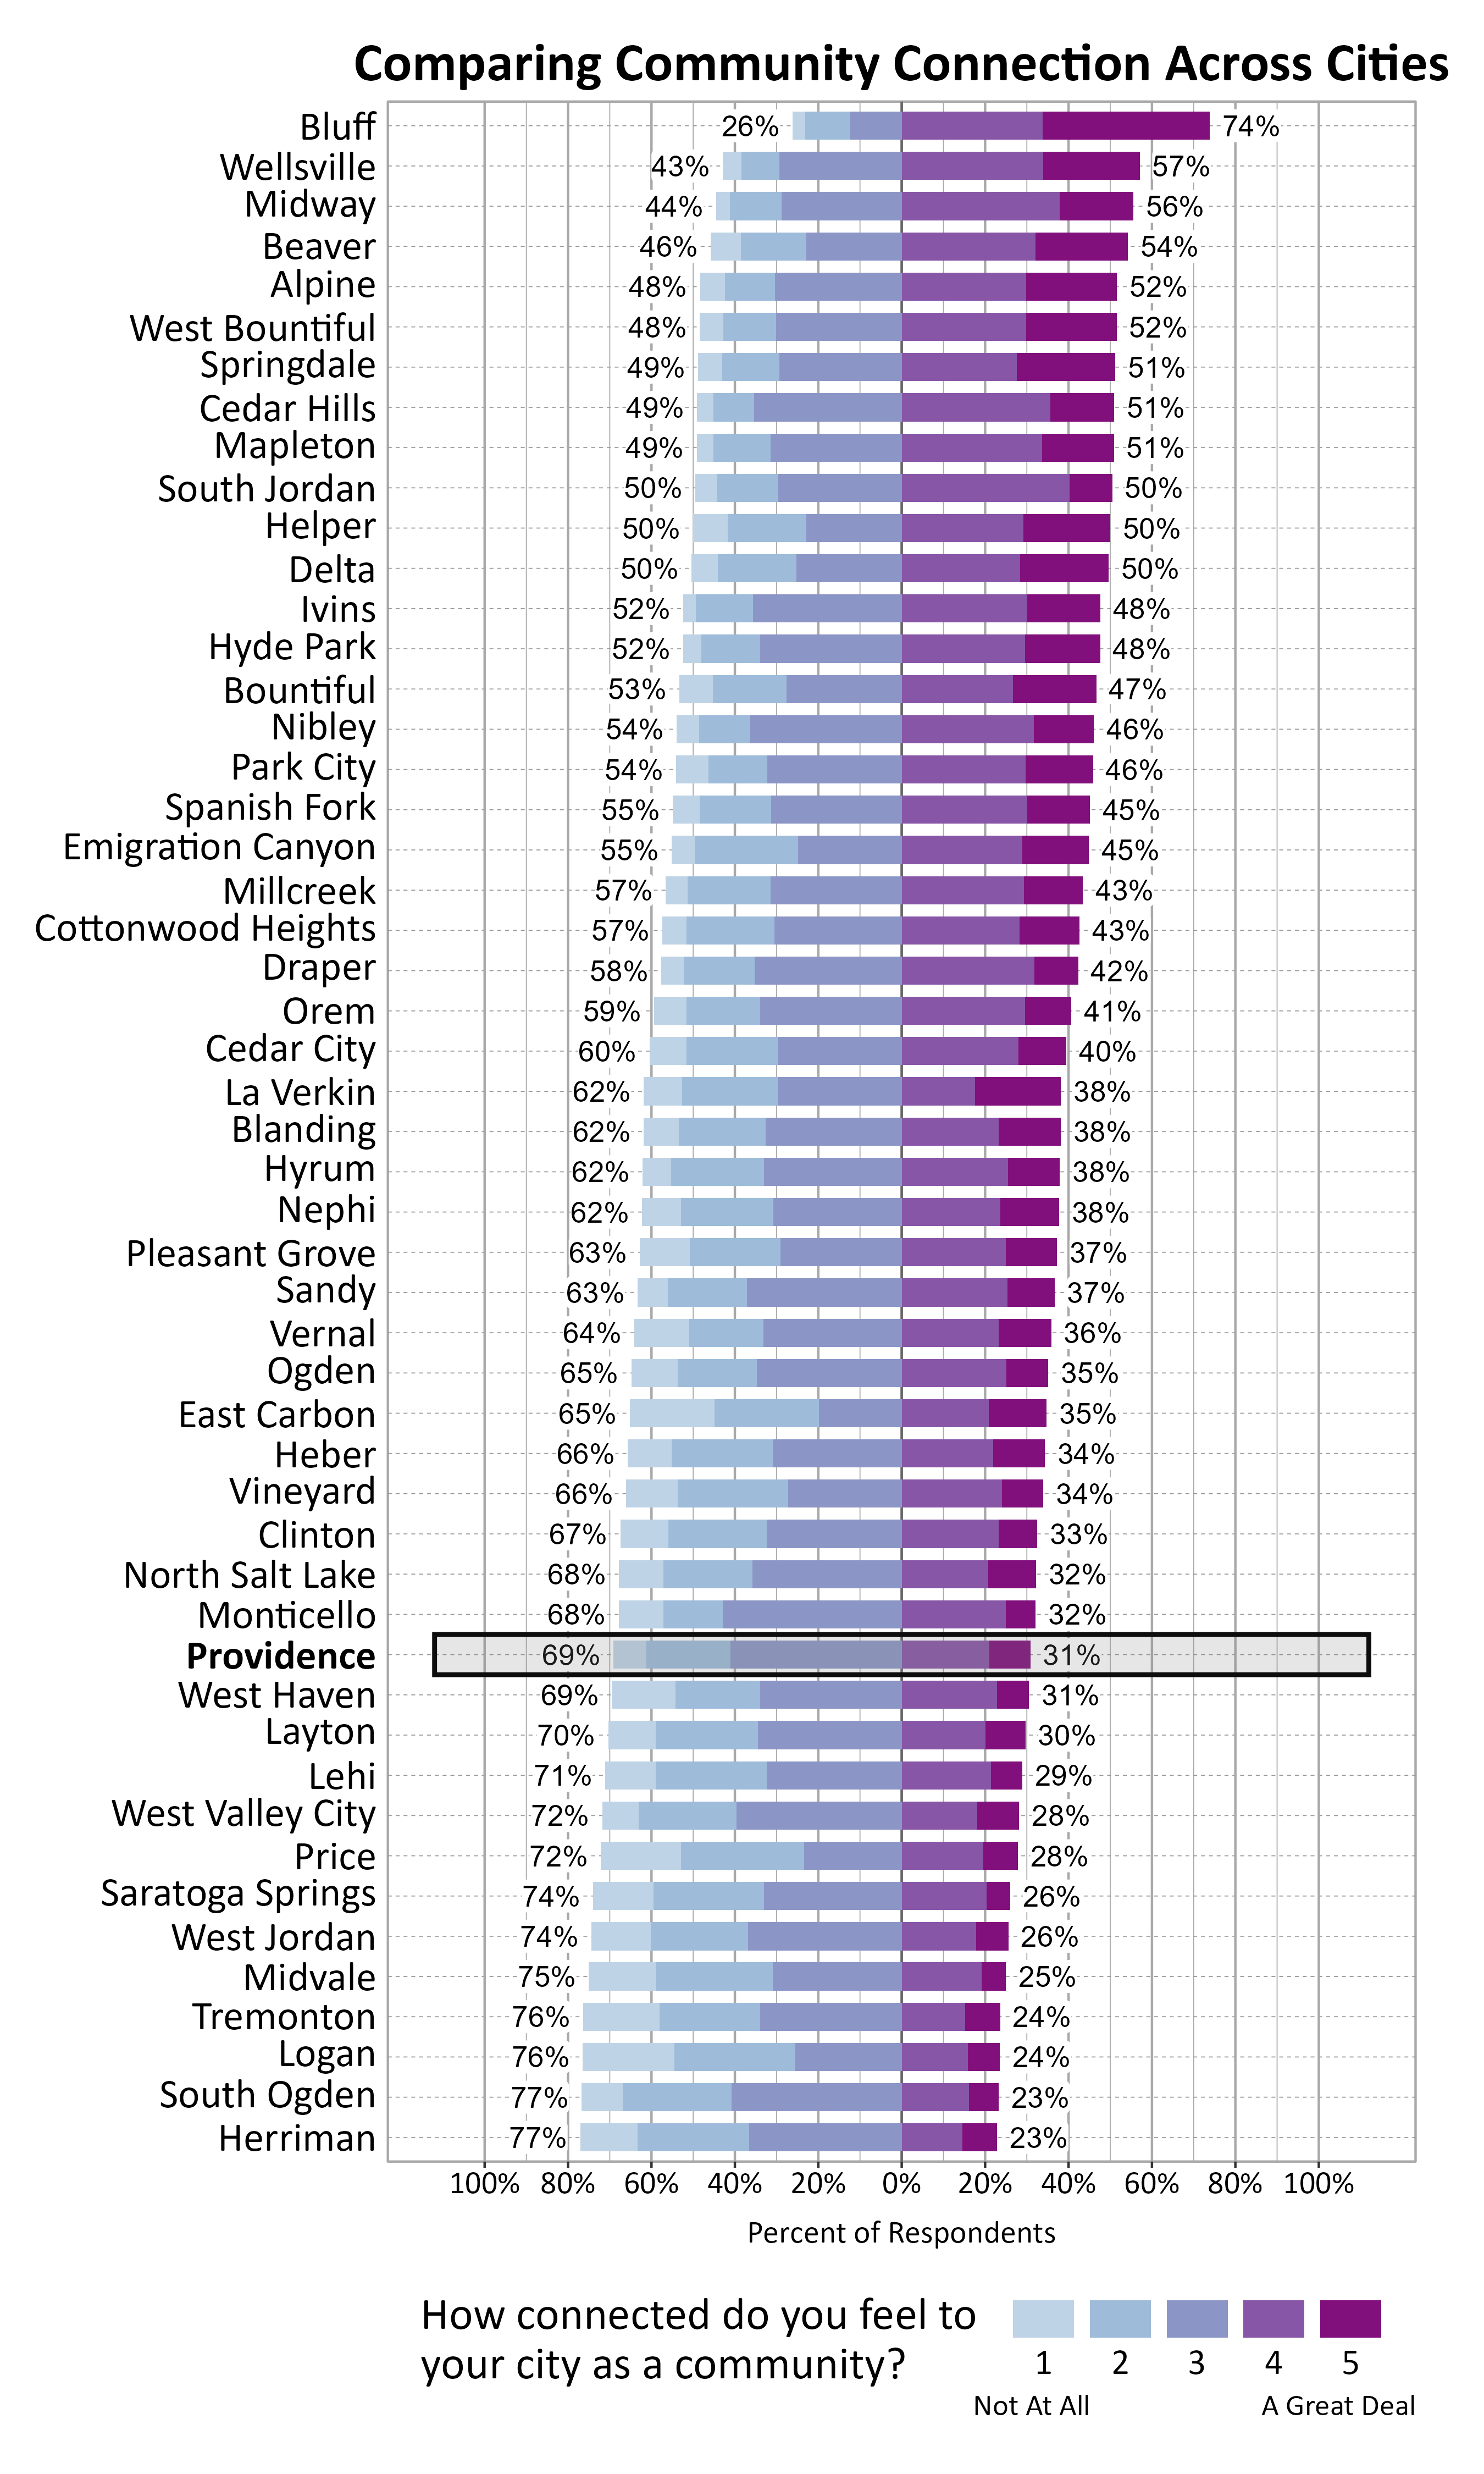
The graph below shows how Wellbeing Project cities and towns compare on feelings of community connection based on the percentage of respondents who answered 4 or a 5 on a 5-point scale from “not at all” to “a great deal” connected to their city or town. Providence ranked 39 out of the 51 cities that participated.
Participation in Recreation and Nature-Related Activities
Respondents were asked to indicate whether or not they participated in various activities in the last 12 months. The most popular activities were walking or biking in your neighborhood or city (94%), gardening at home (80%), recreating in parks in your city (77%), and community events (77%).
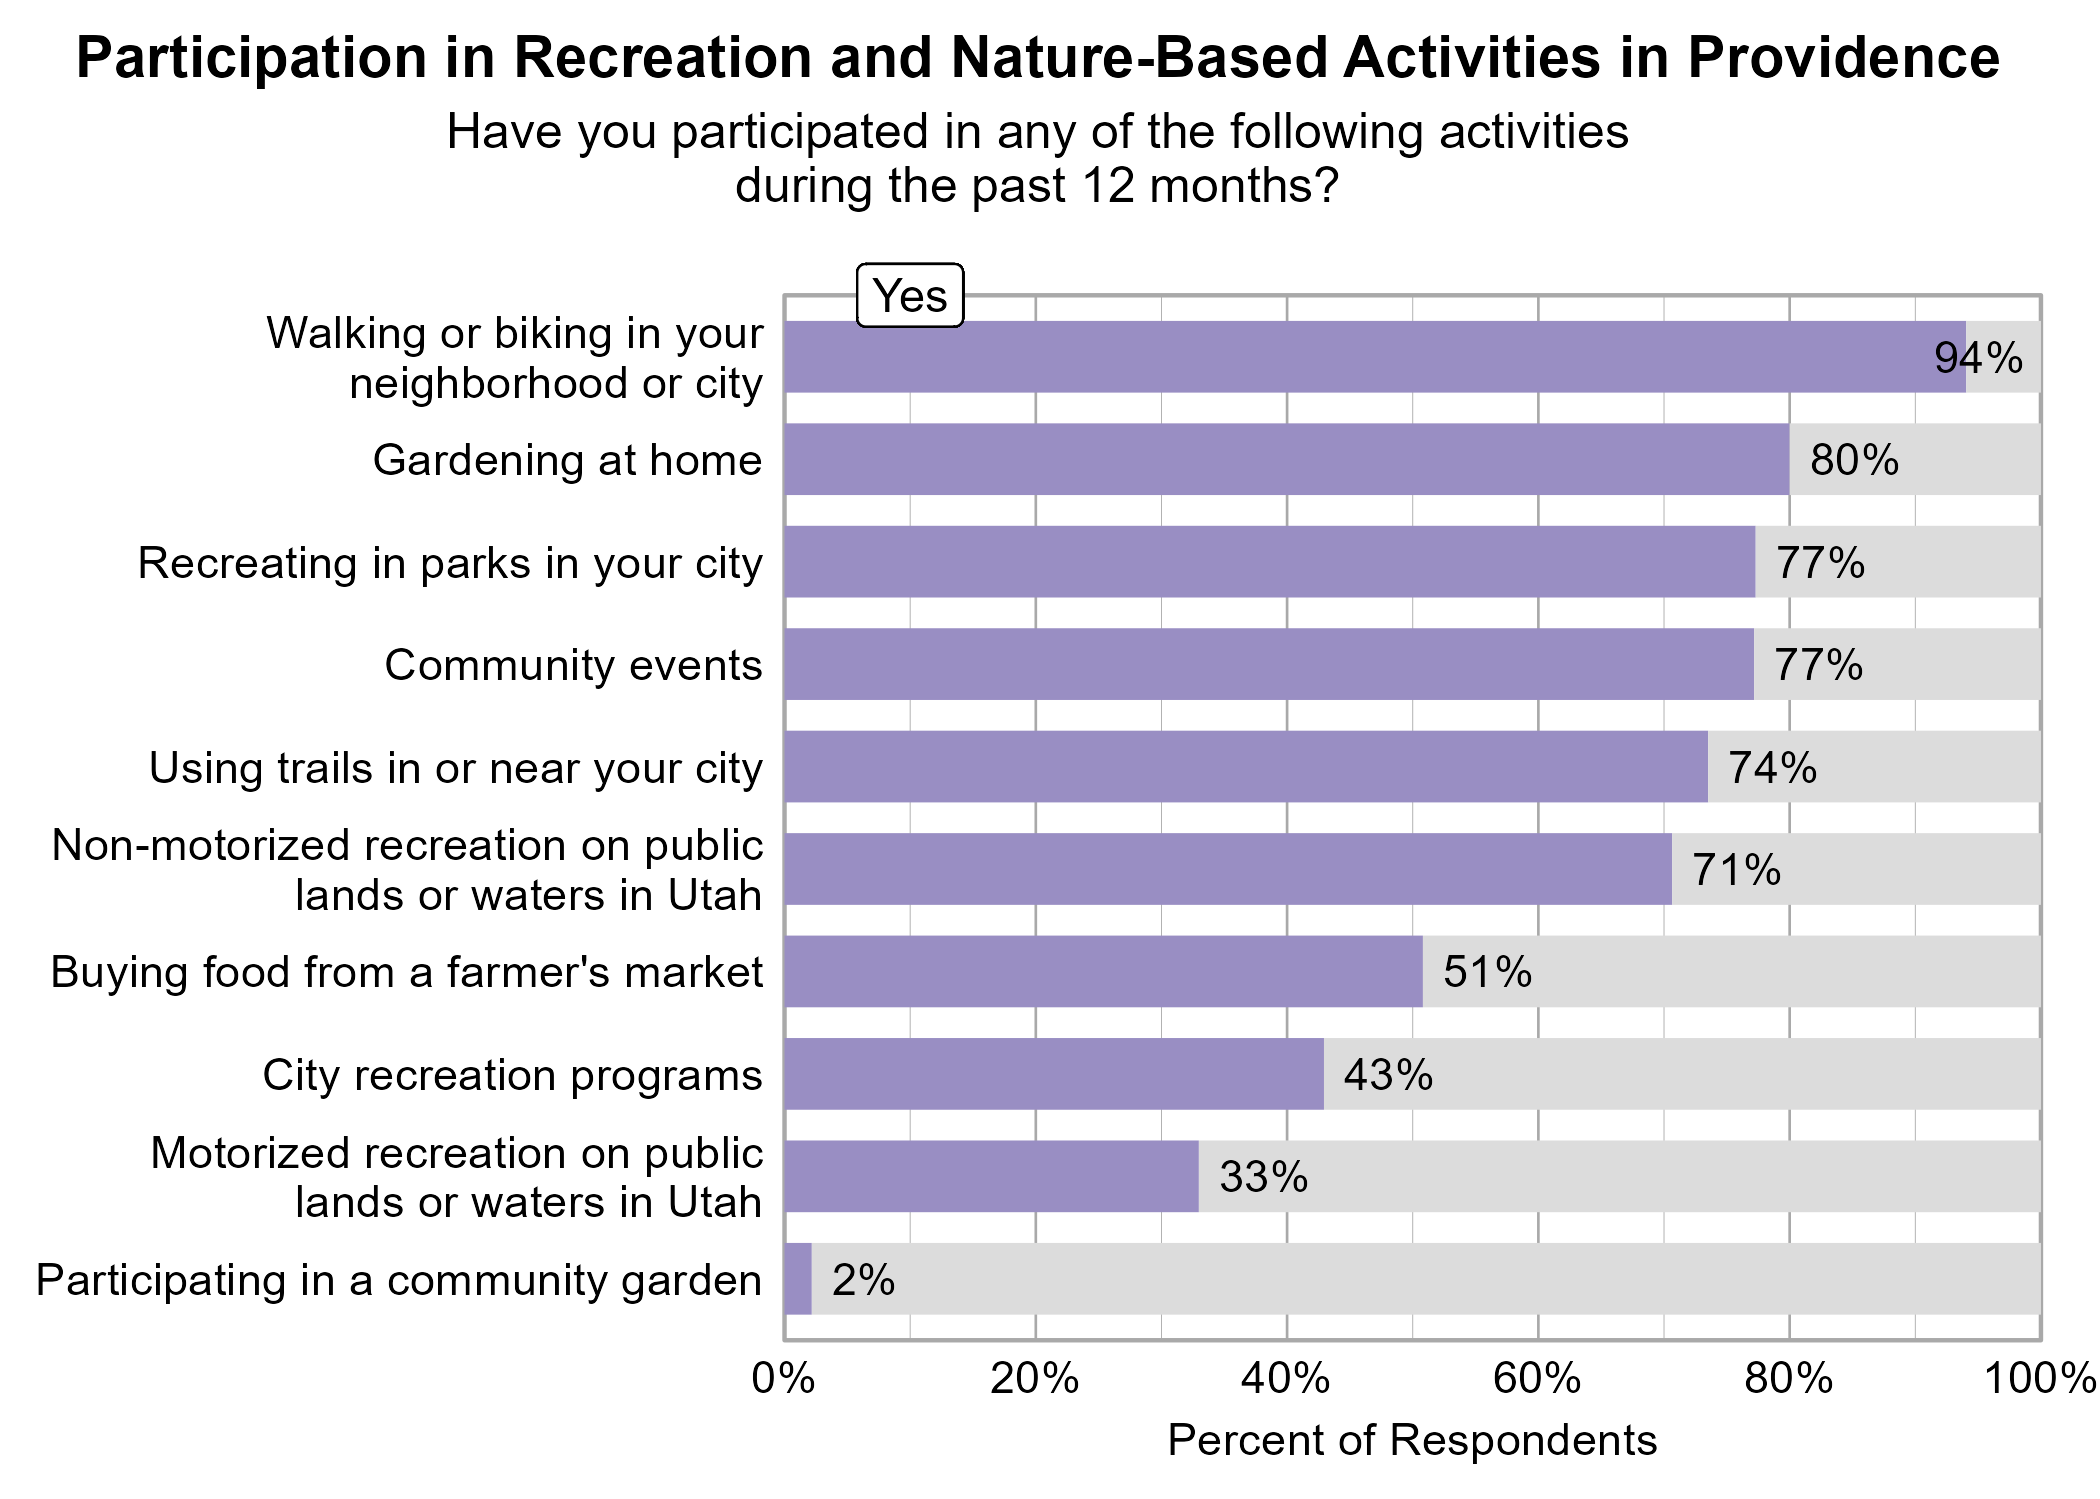
None of the recreation activities above were significantly related to higher ratings of personal wellbeing or community wellbeing.
Participating in community events was significantly related to higher ratings of community connection.
Perspectives on Population Growth and Economic Development
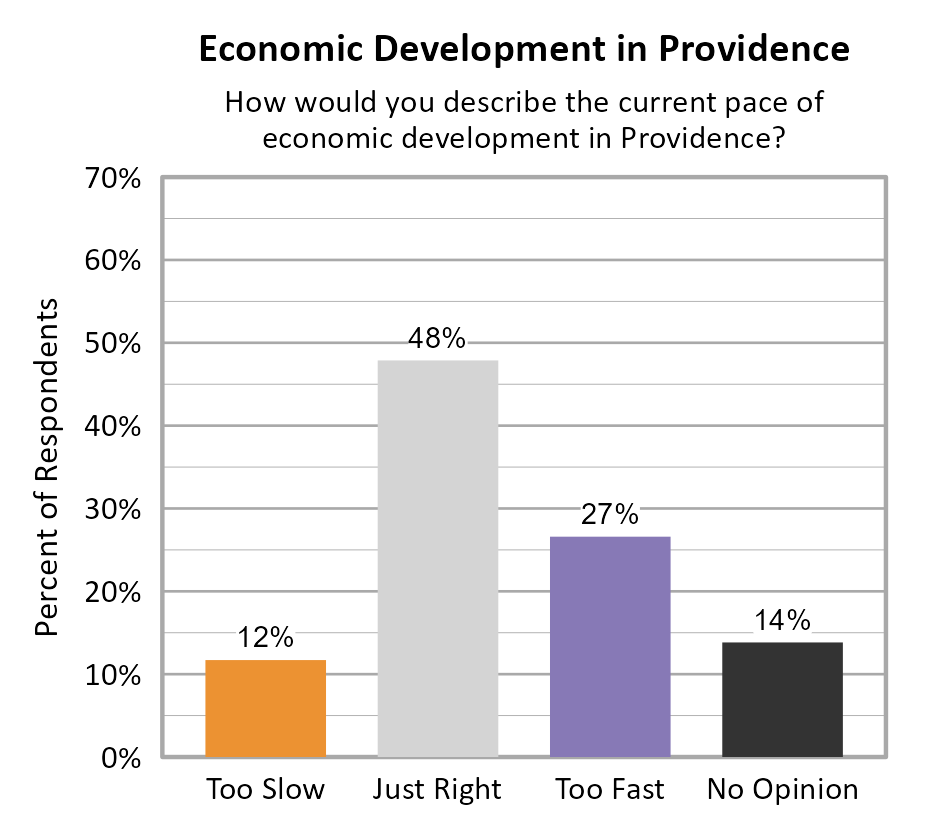
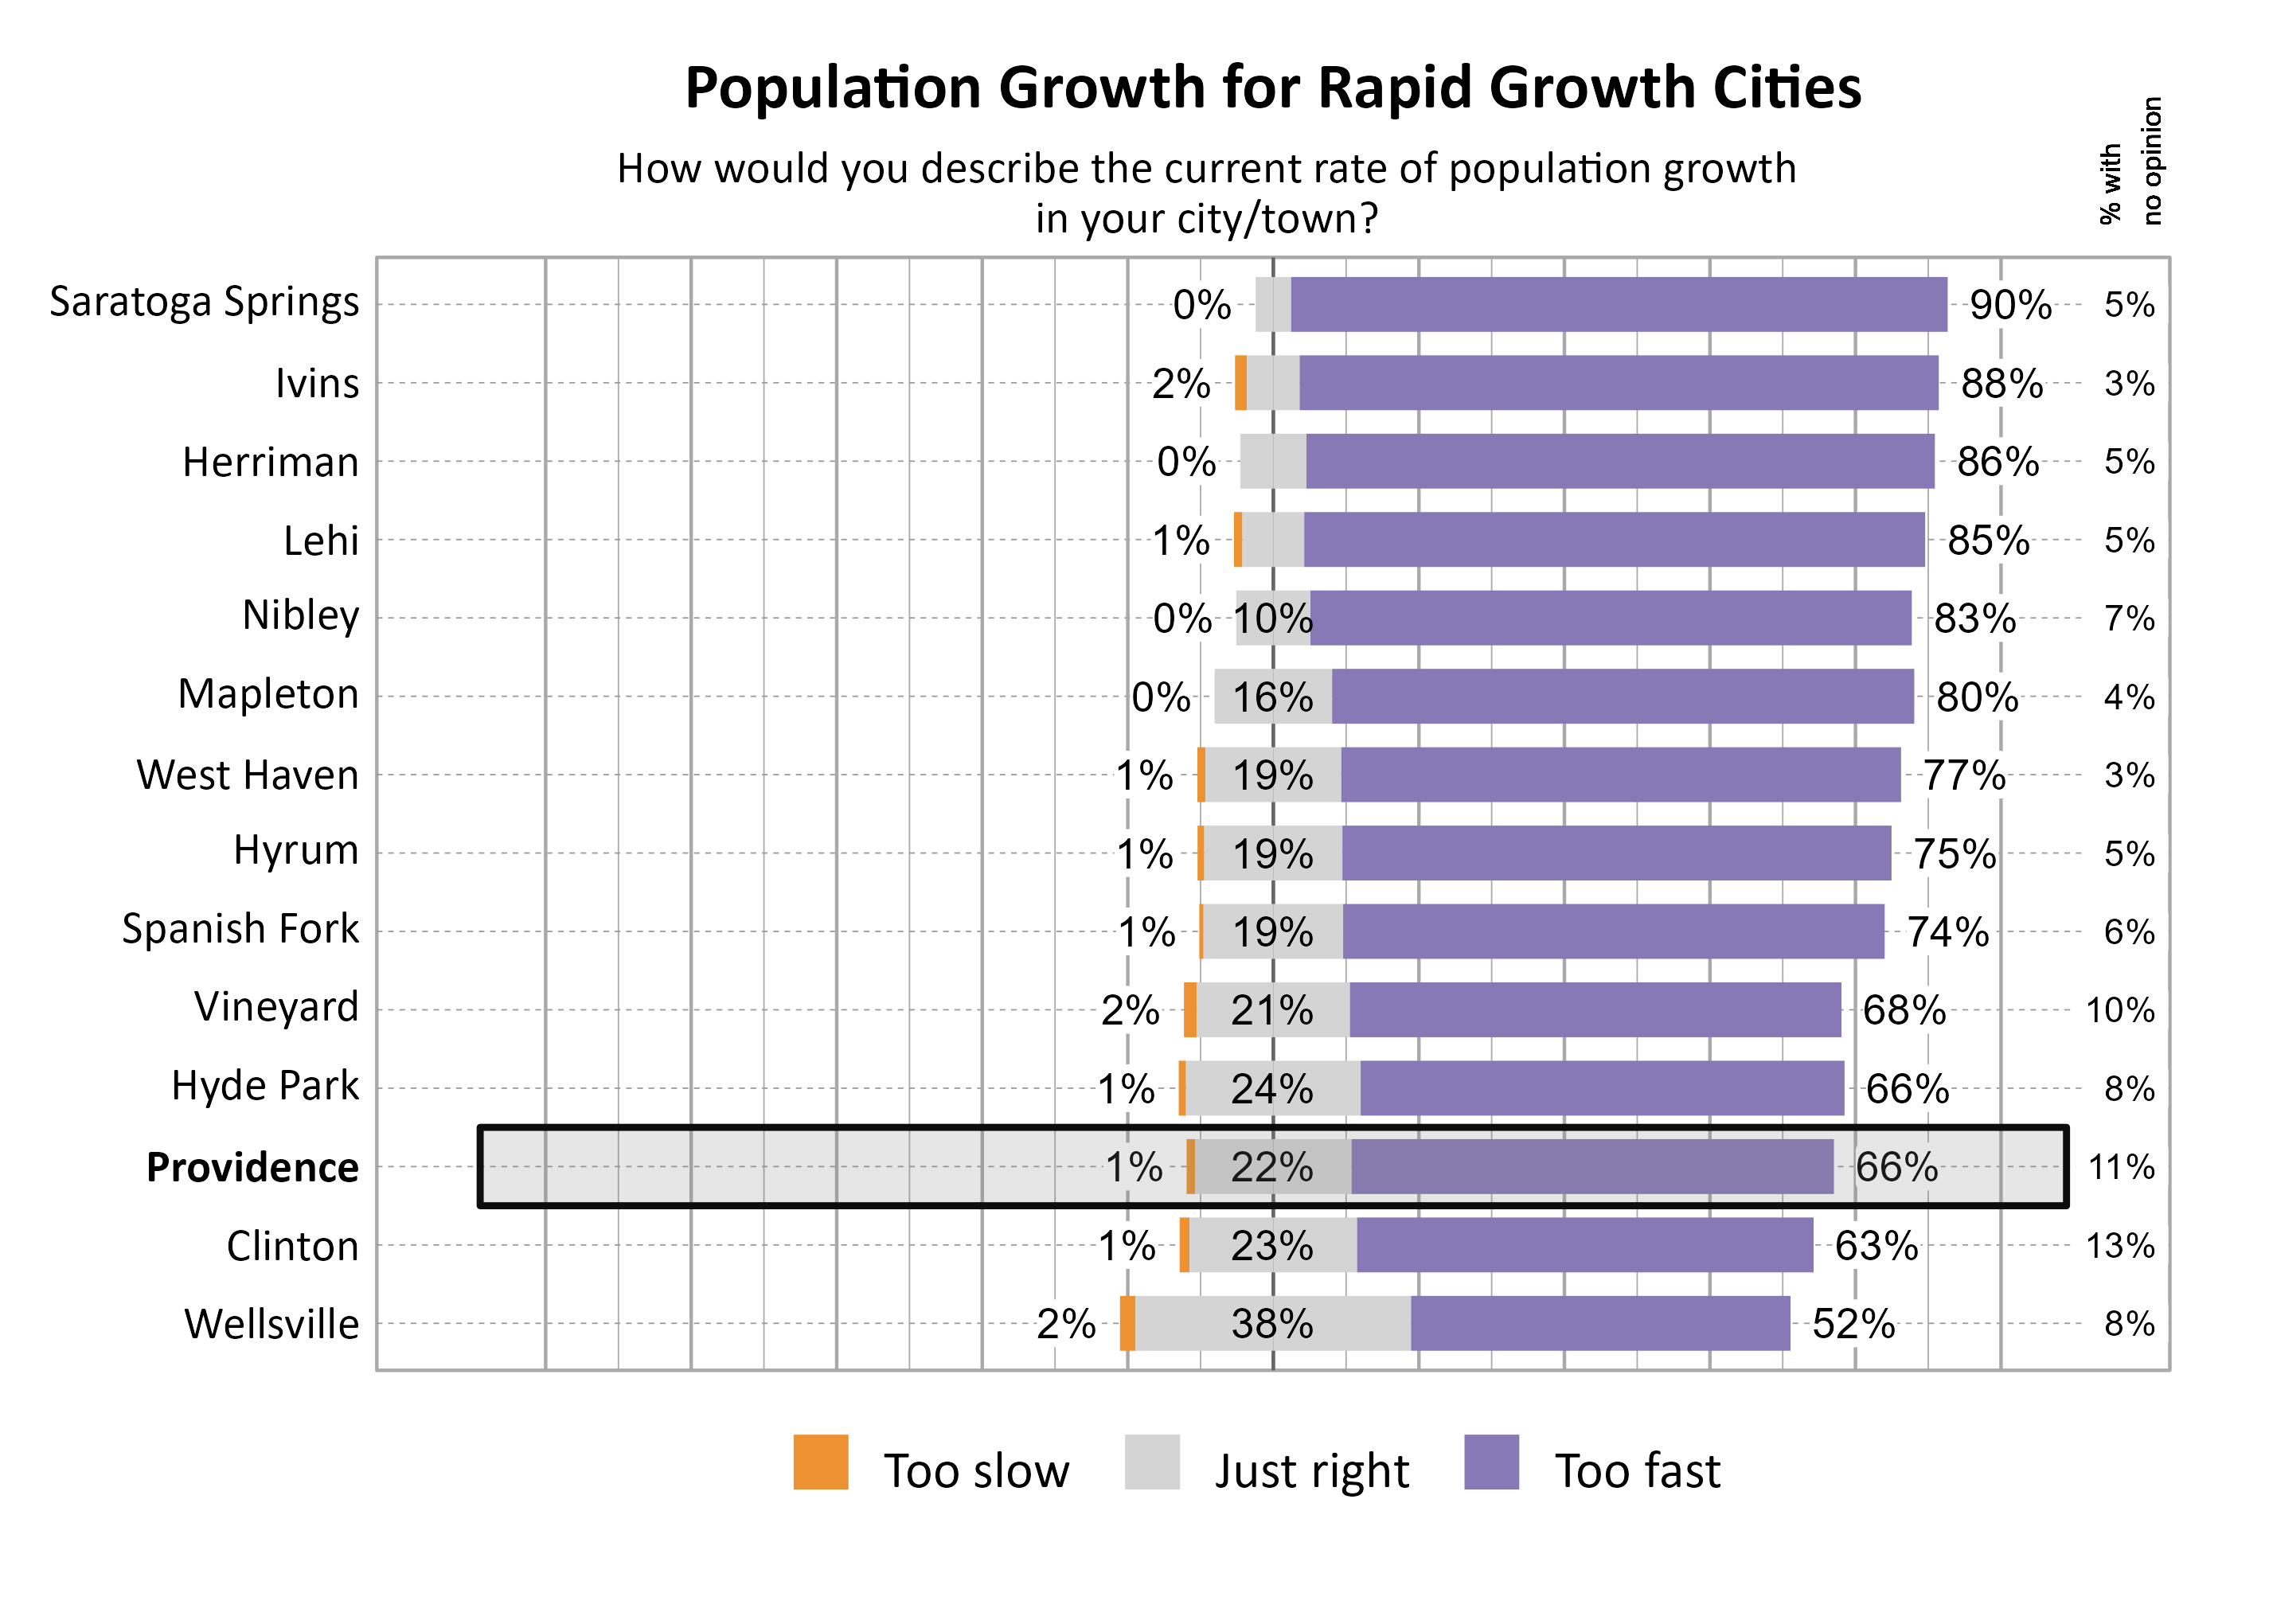
The majority of respondents in Providence indicated that they felt the population growth was too fast (66%). For the pace of economic development, the largest proportion of respondents indicated that it was just right (48%).
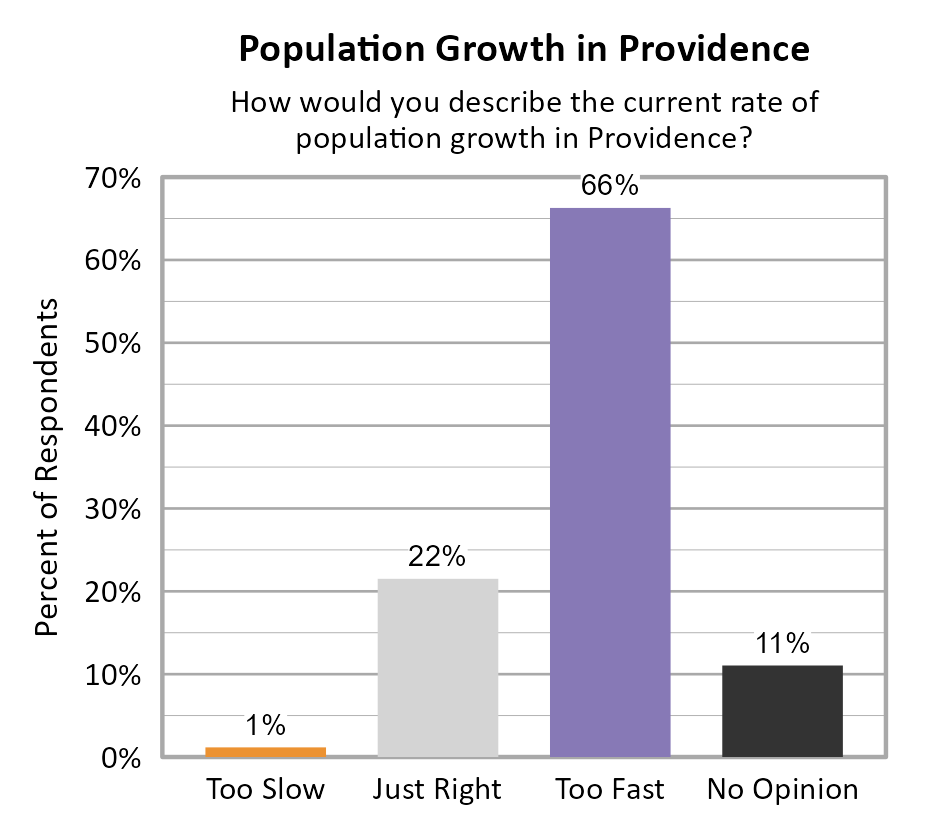
The graphs below show perceptions of population growth and economic development for Providence compared to other participating cities and towns in the Rapid Growth Cities cluster.
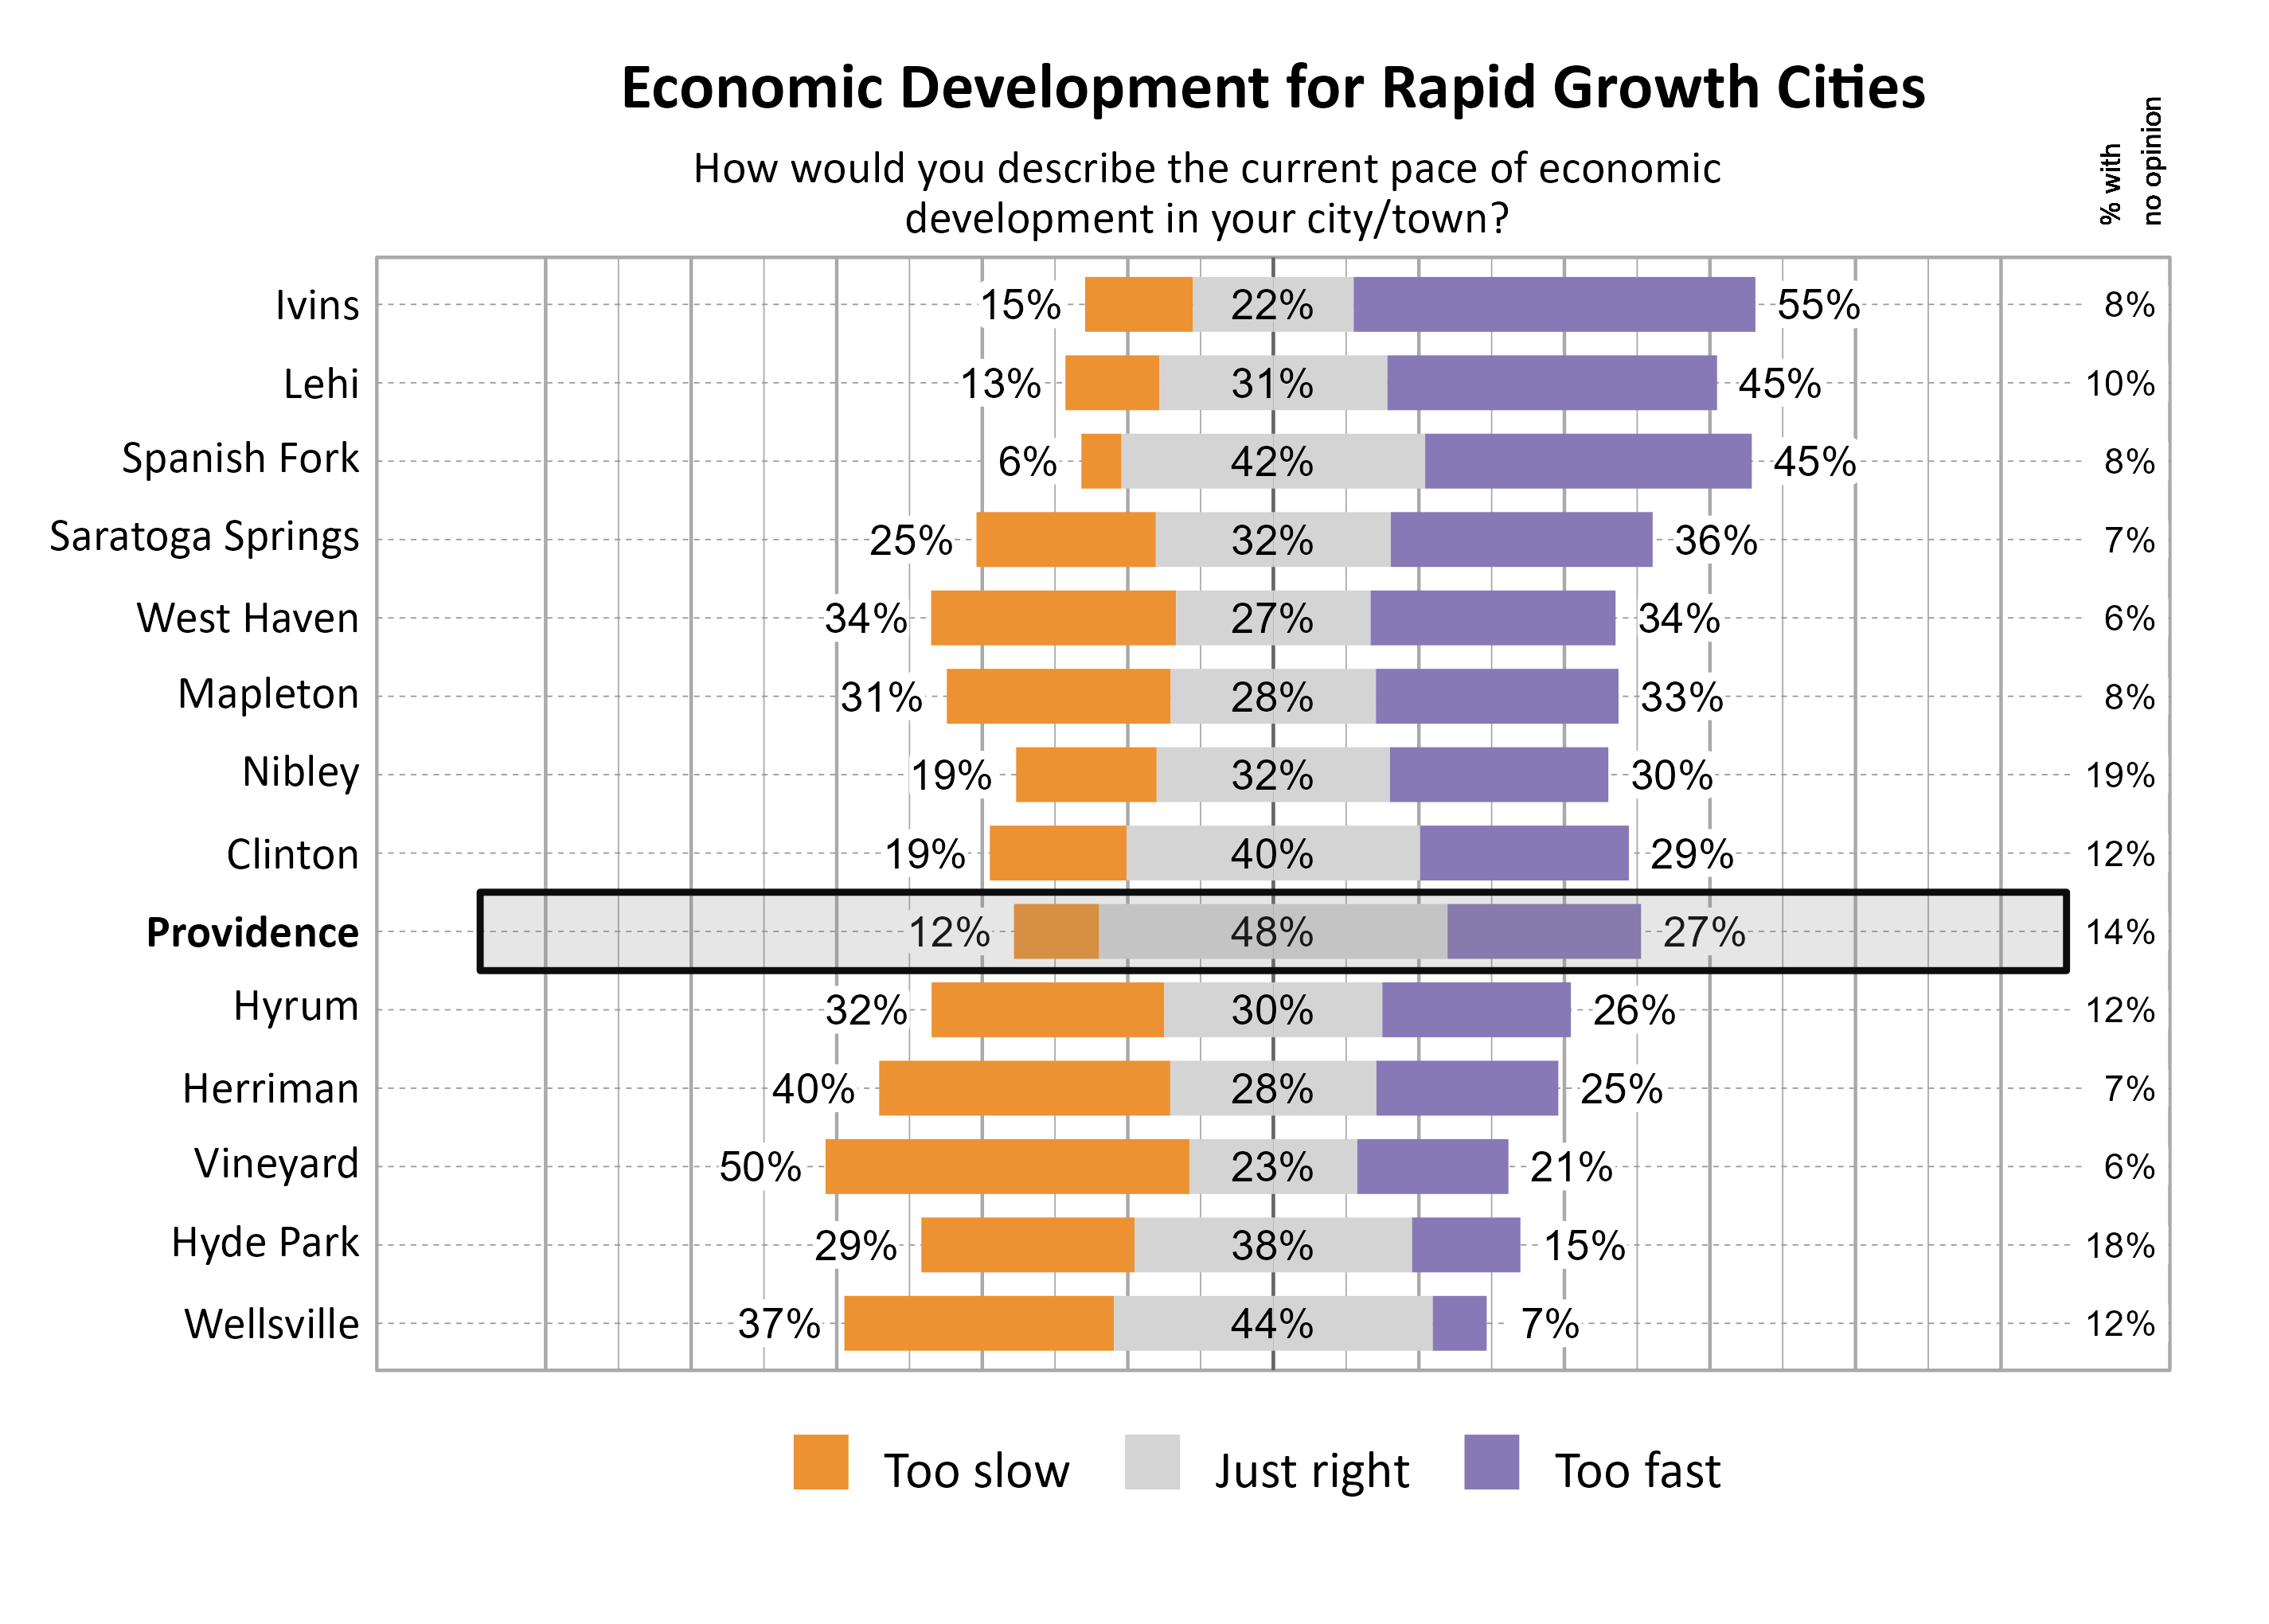
The graph below illustrates how many respondents perceived the pace of economic development as too slow, just right, too fast, or had no opinion, with additional breakdowns for the number of respondents who provided comments.

The 12% of respondents who rated the pace of economic growth as “too slow” were further asked what aspects of the local economy they would like to see more of in Providence. The primary focus was on the need for retail development, with an emphasis on local businesses.
Additionally, the 27% of respondents who rated the pace of economic growth as “too fast” were further asked what aspects of the local economy they feel are growing too quickly in Providence. Dominant themes related to housing, particularly high-density housing, and retail development. The car washes (too many) were mentioned numerous times. There were quite a few concerns expressed about the loss of green space and open space as well as traffic.
Transportation in Providence
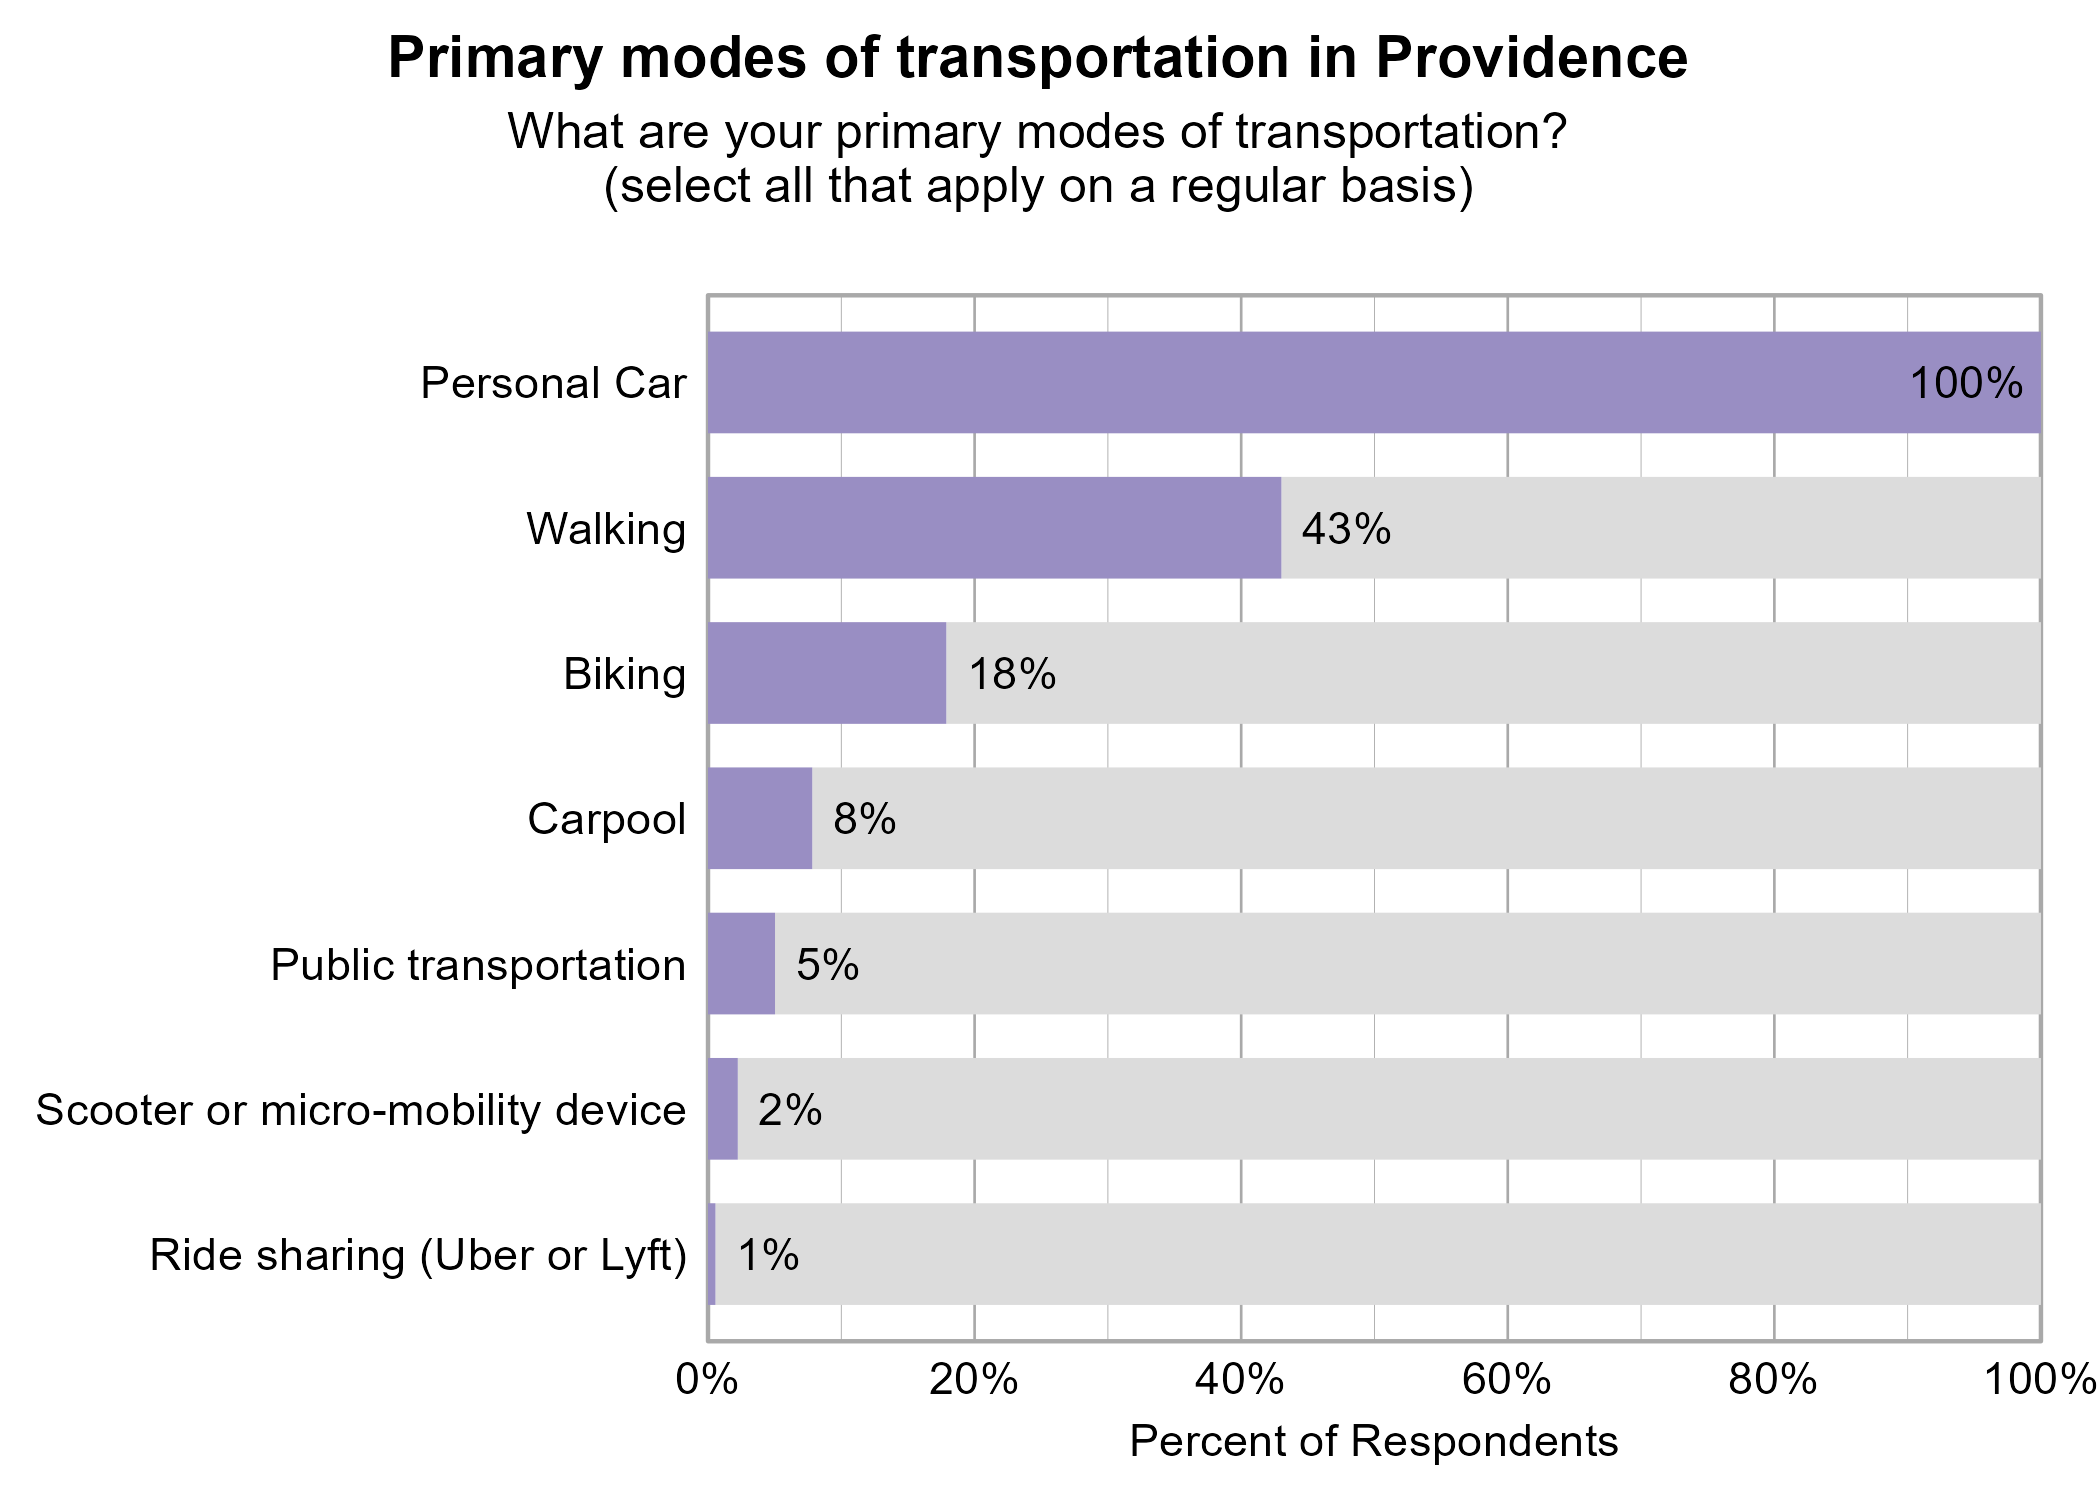
Respondents were asked to indicate all of their primary modes of transportation on a regular basis in Providence. The most popular modes of transportation were personal car (100%) and walking (43%).
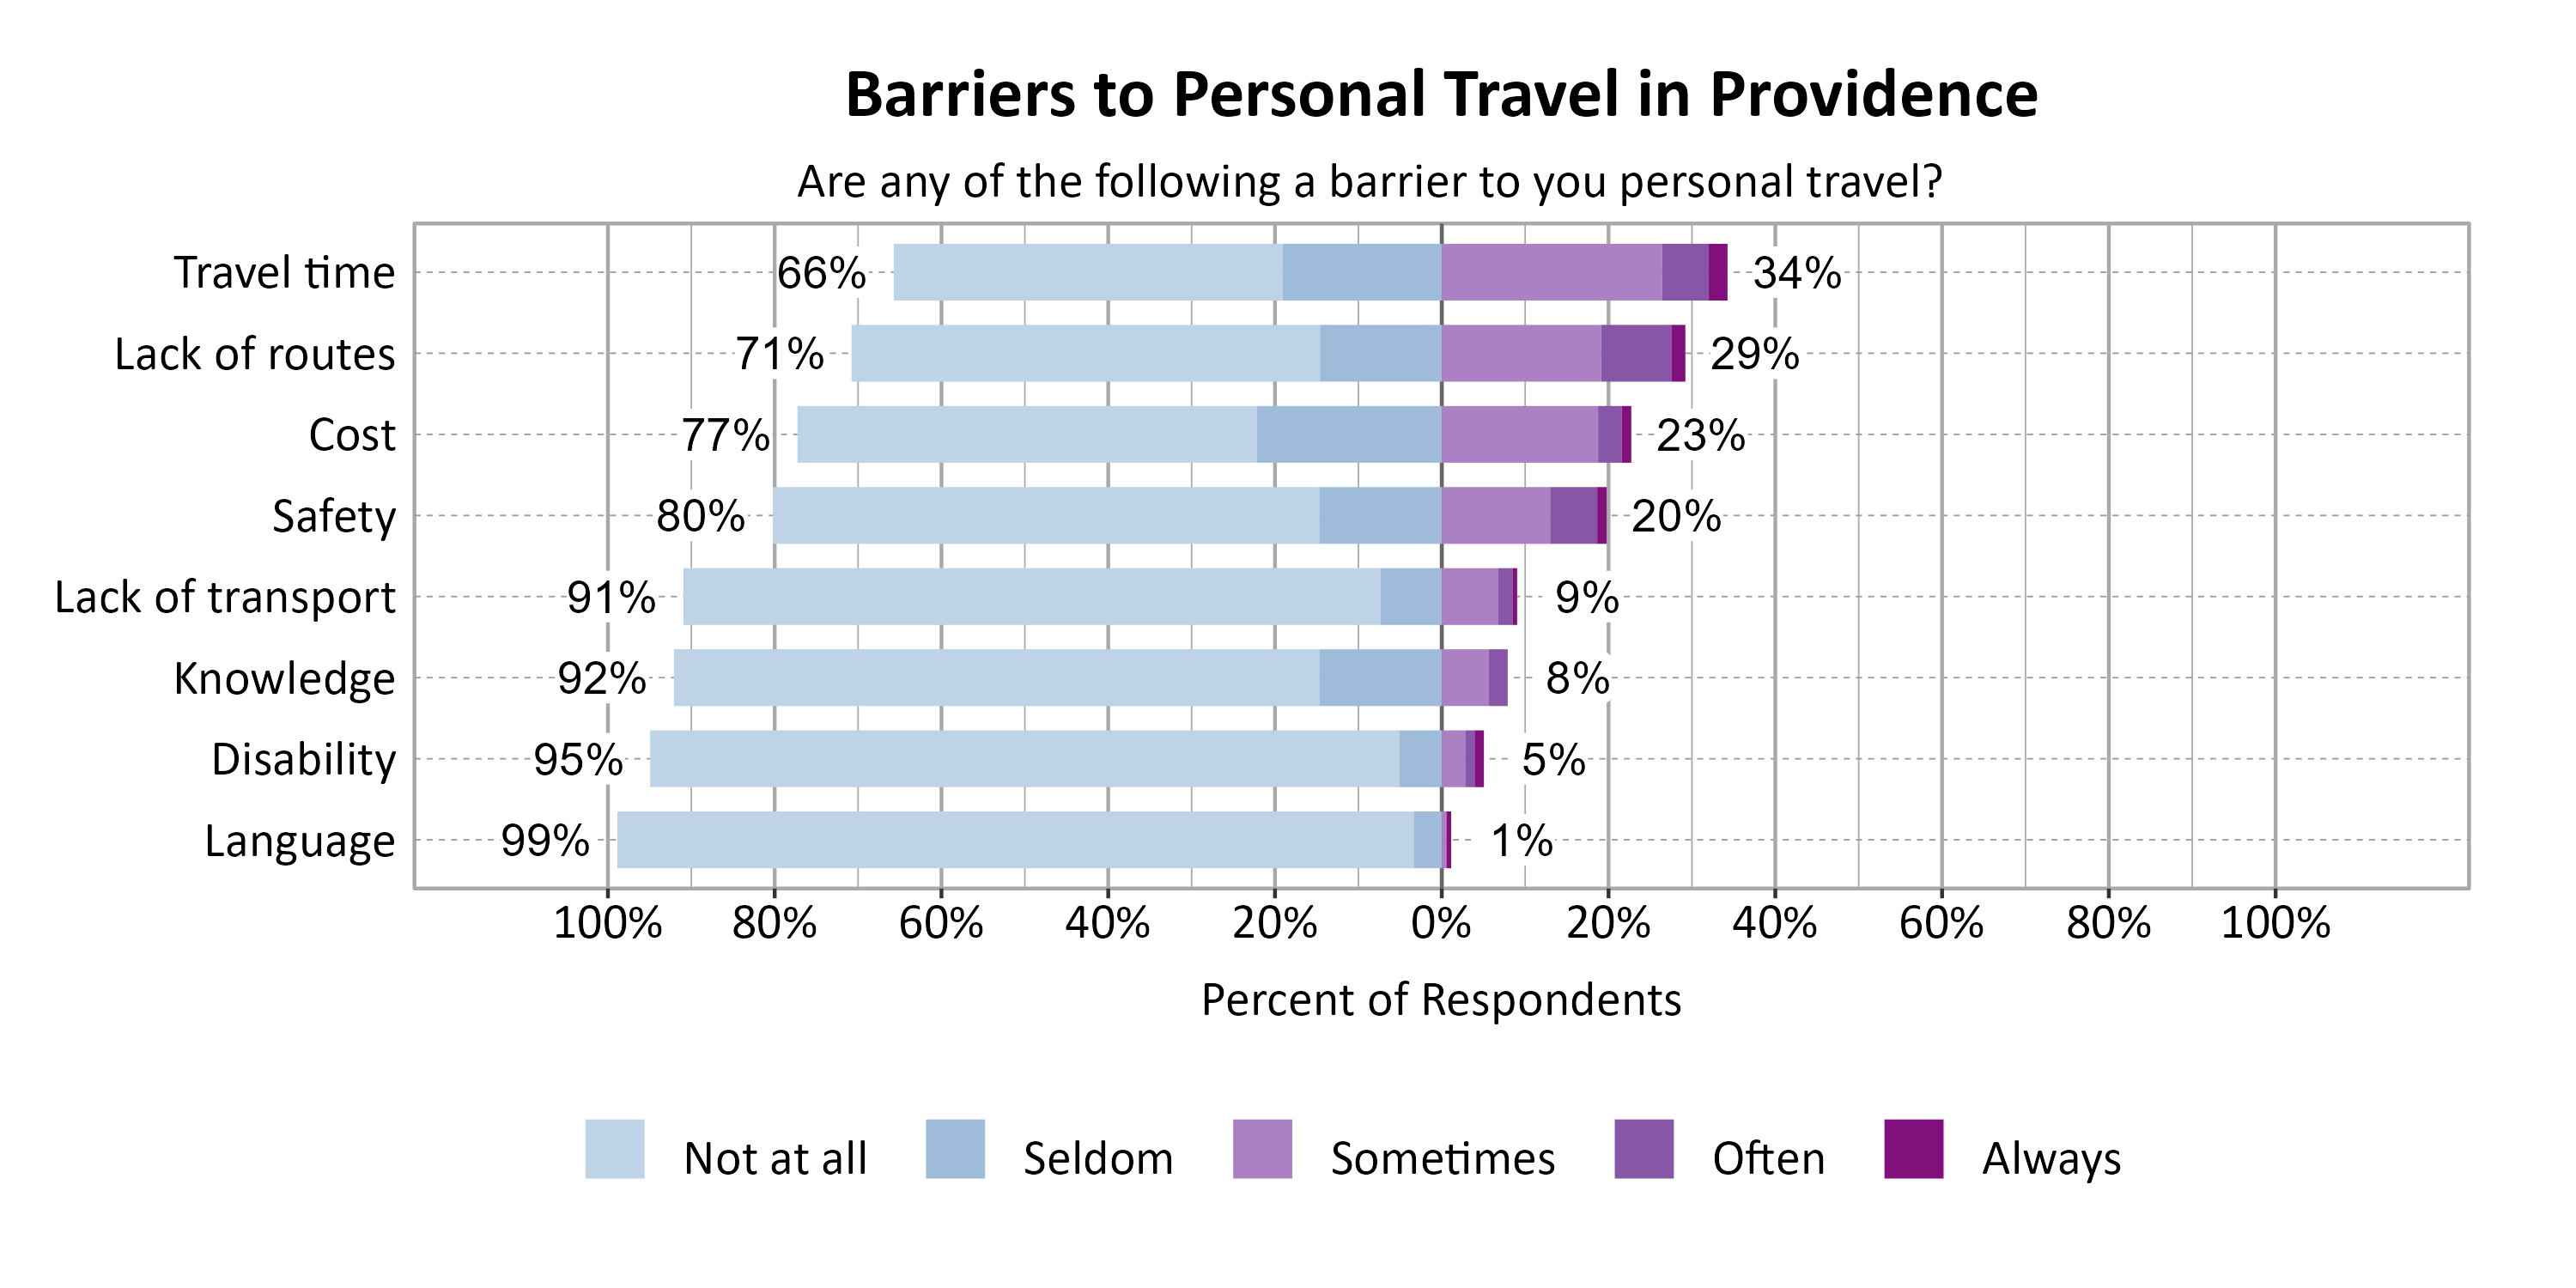
Respondents were asked to indicate the most common barriers to transportation in Providence. The most problematic barriers were Travel time (34%) and Lack of routes (29%).
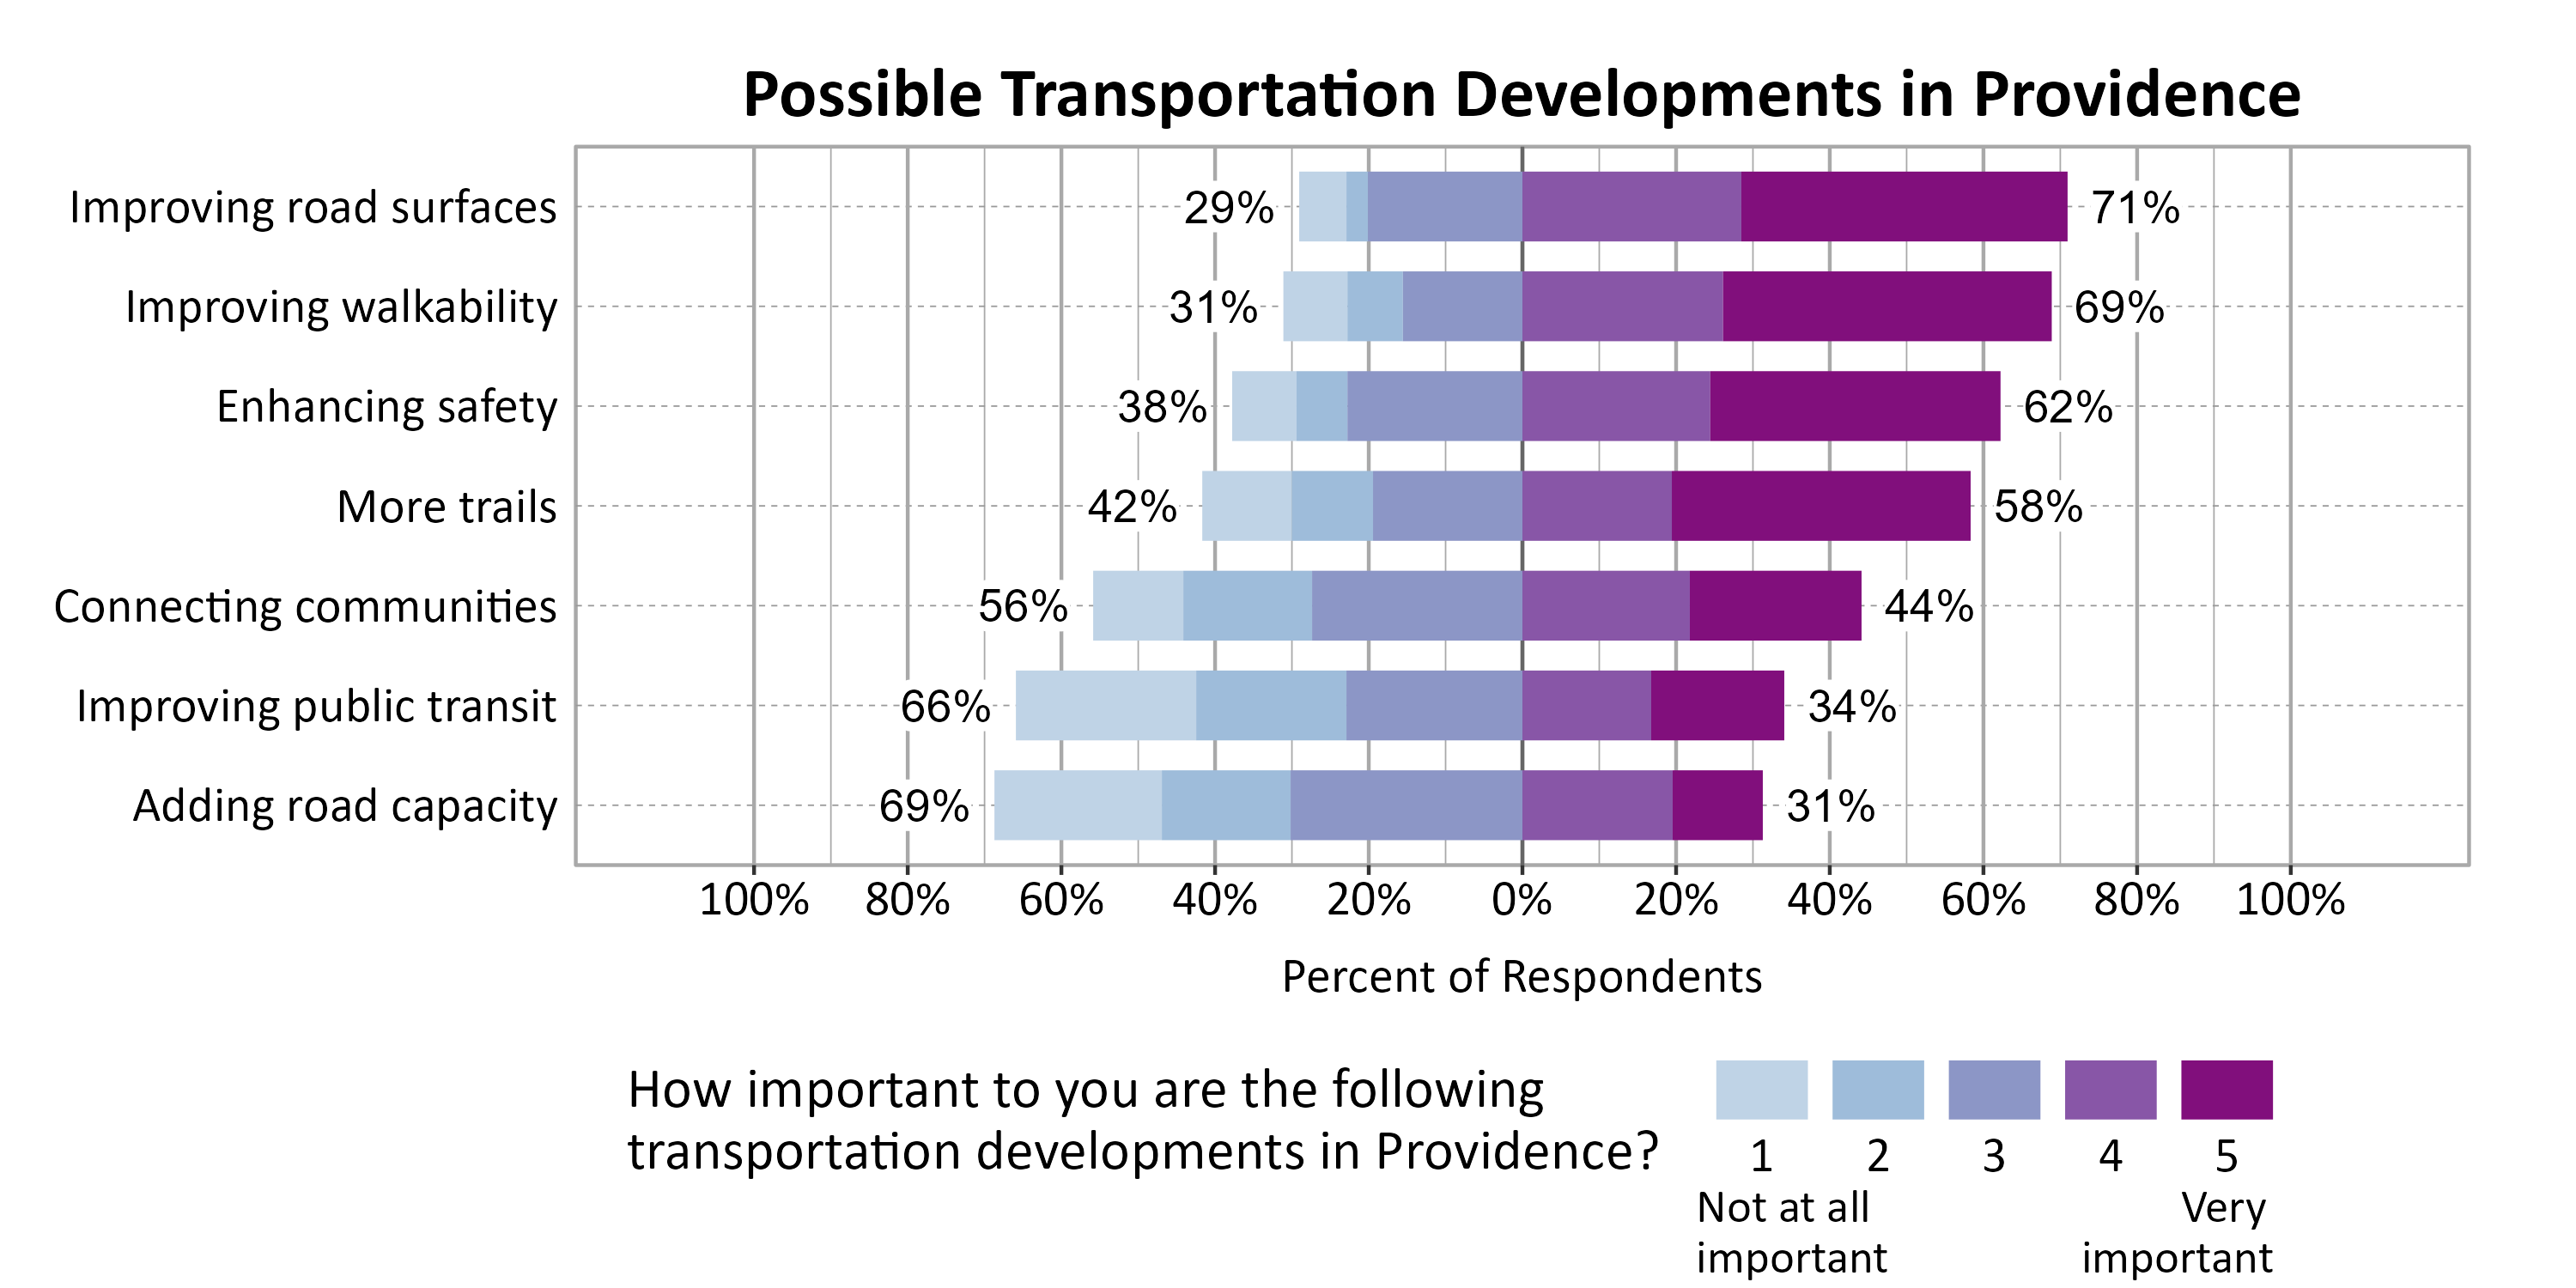
Respondents were asked to indicate the importance of a set of possible transportation developments in Providence. The most important development to respondents were Improving road surfaces (71%), Improving walkability (69%), and Enhancing safety (62%).
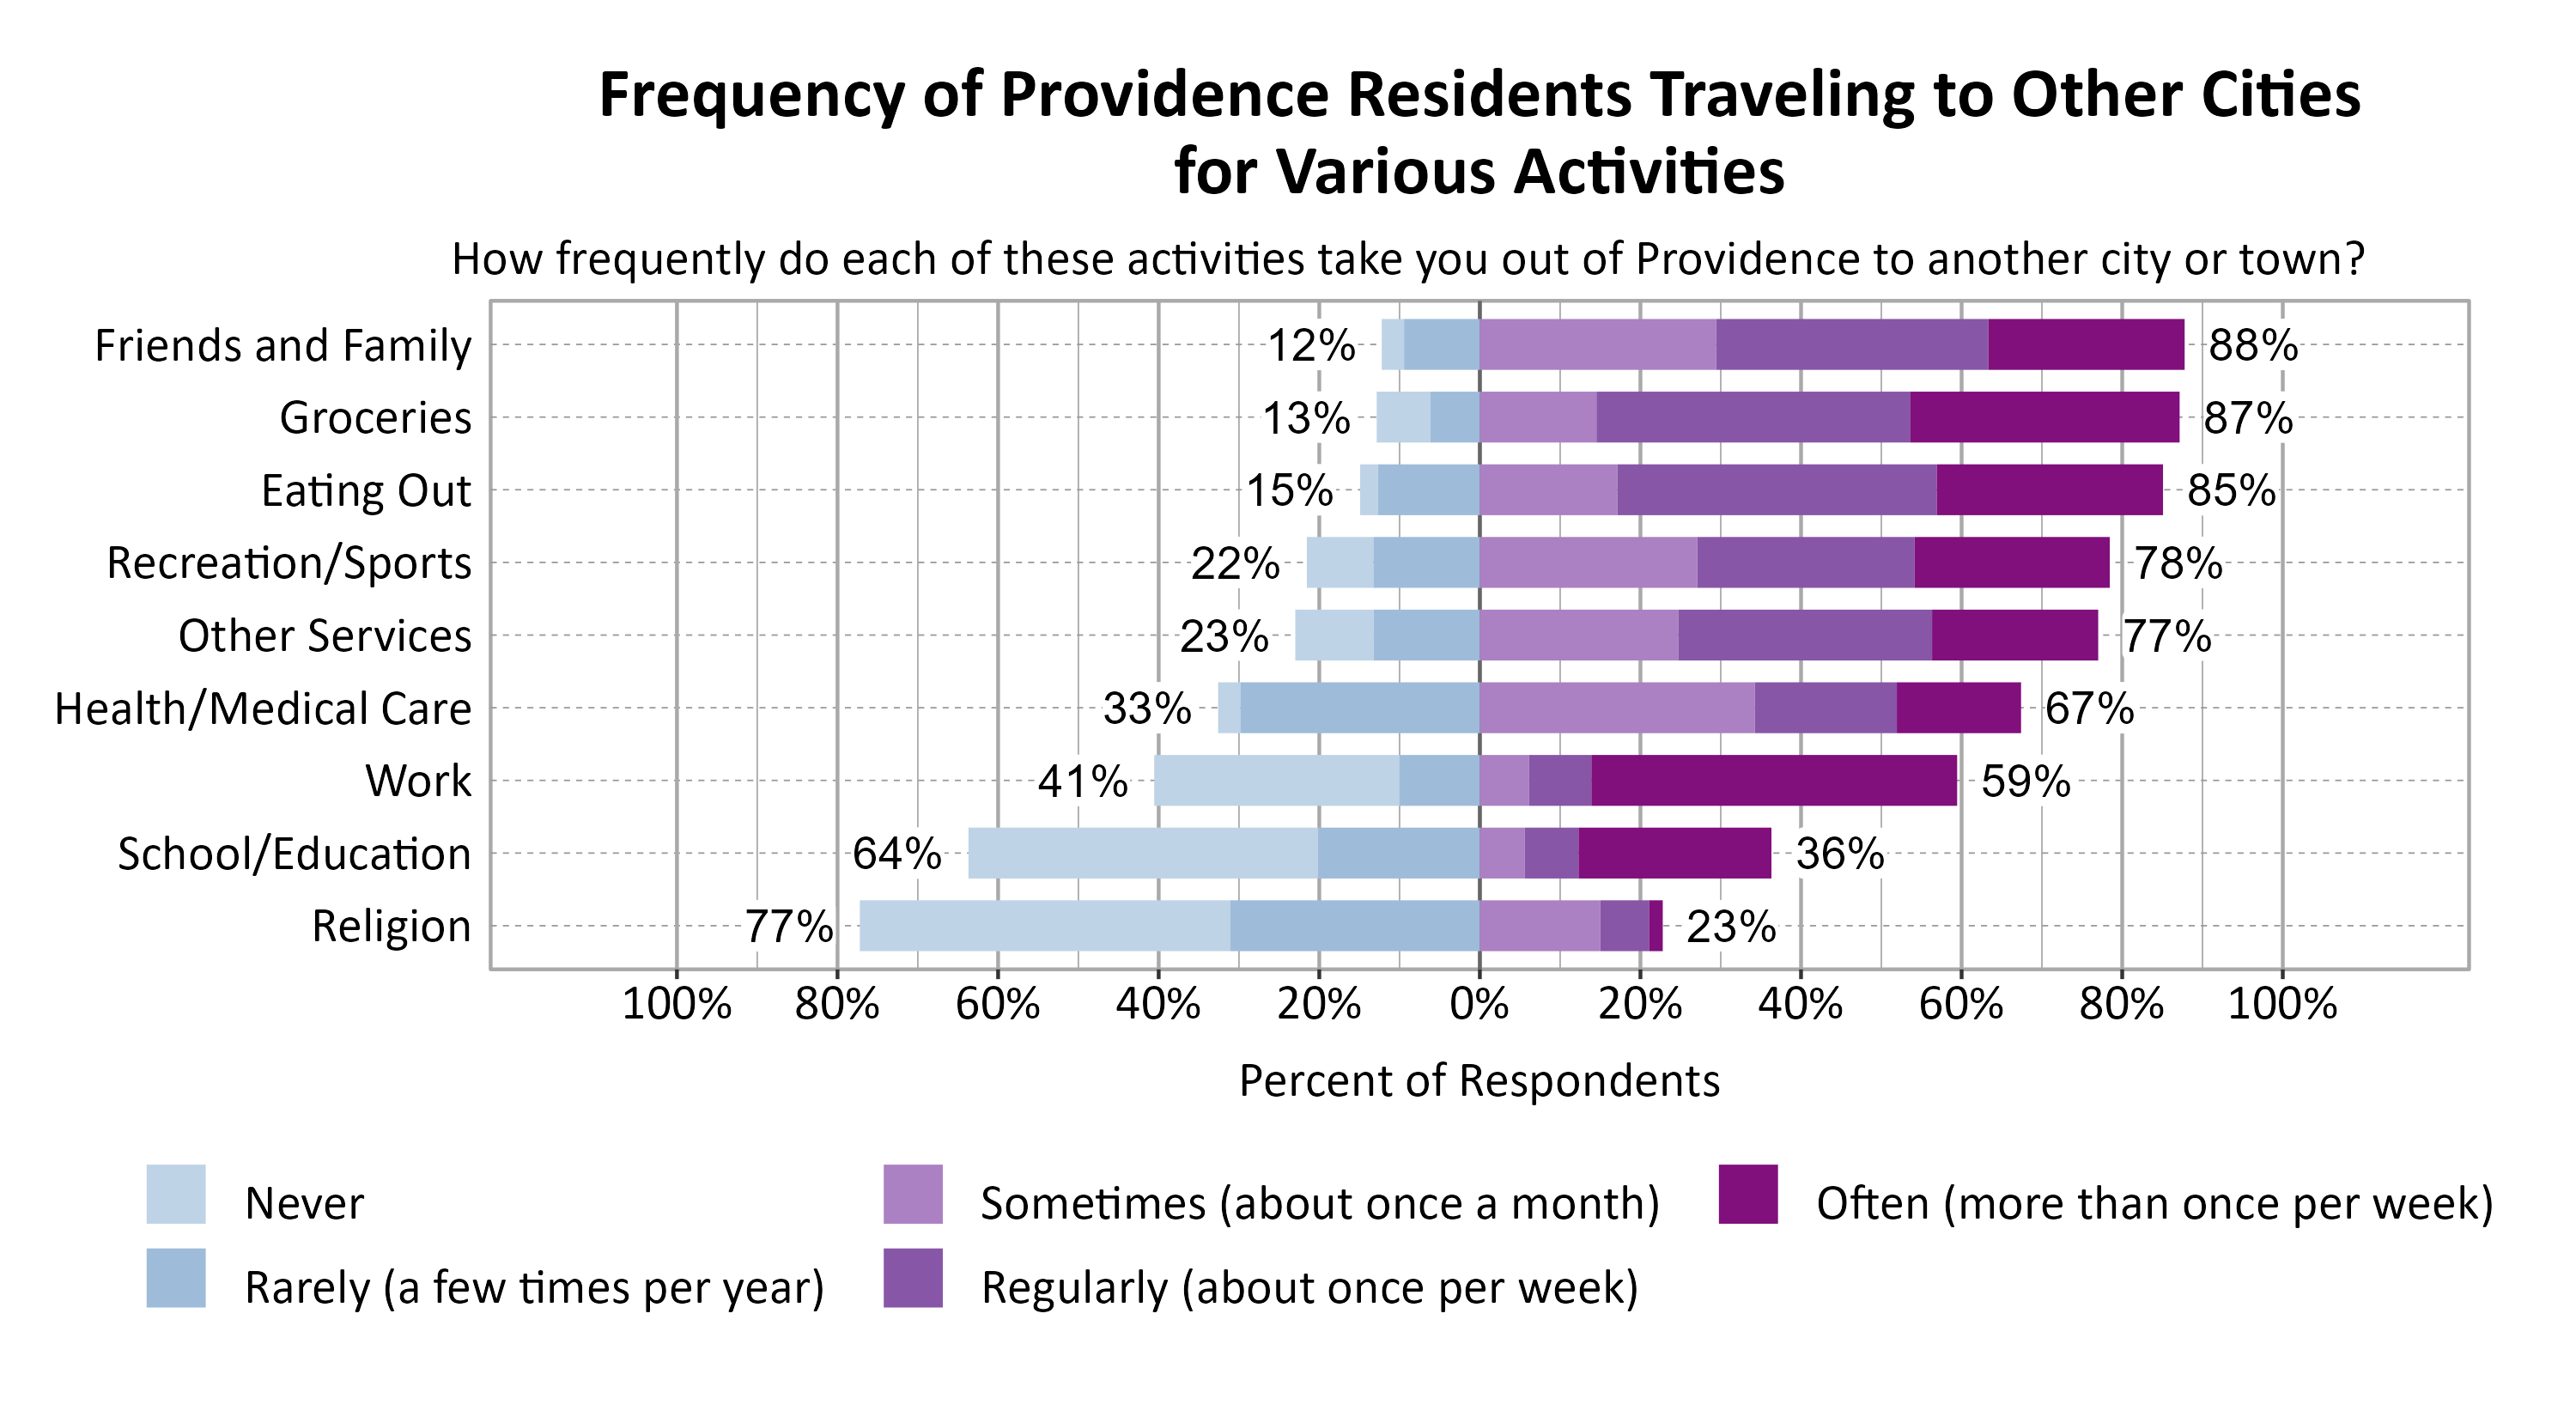
Respondents were asked to indicate how frequently various activities take them out of Providence to another city or town. The most commonly indicated reasons for traveling to another city or town at least sometimes or once a month were Friends and Family (88%), Groceries (87%), and Eating Out (85%).
Concerns in Providence
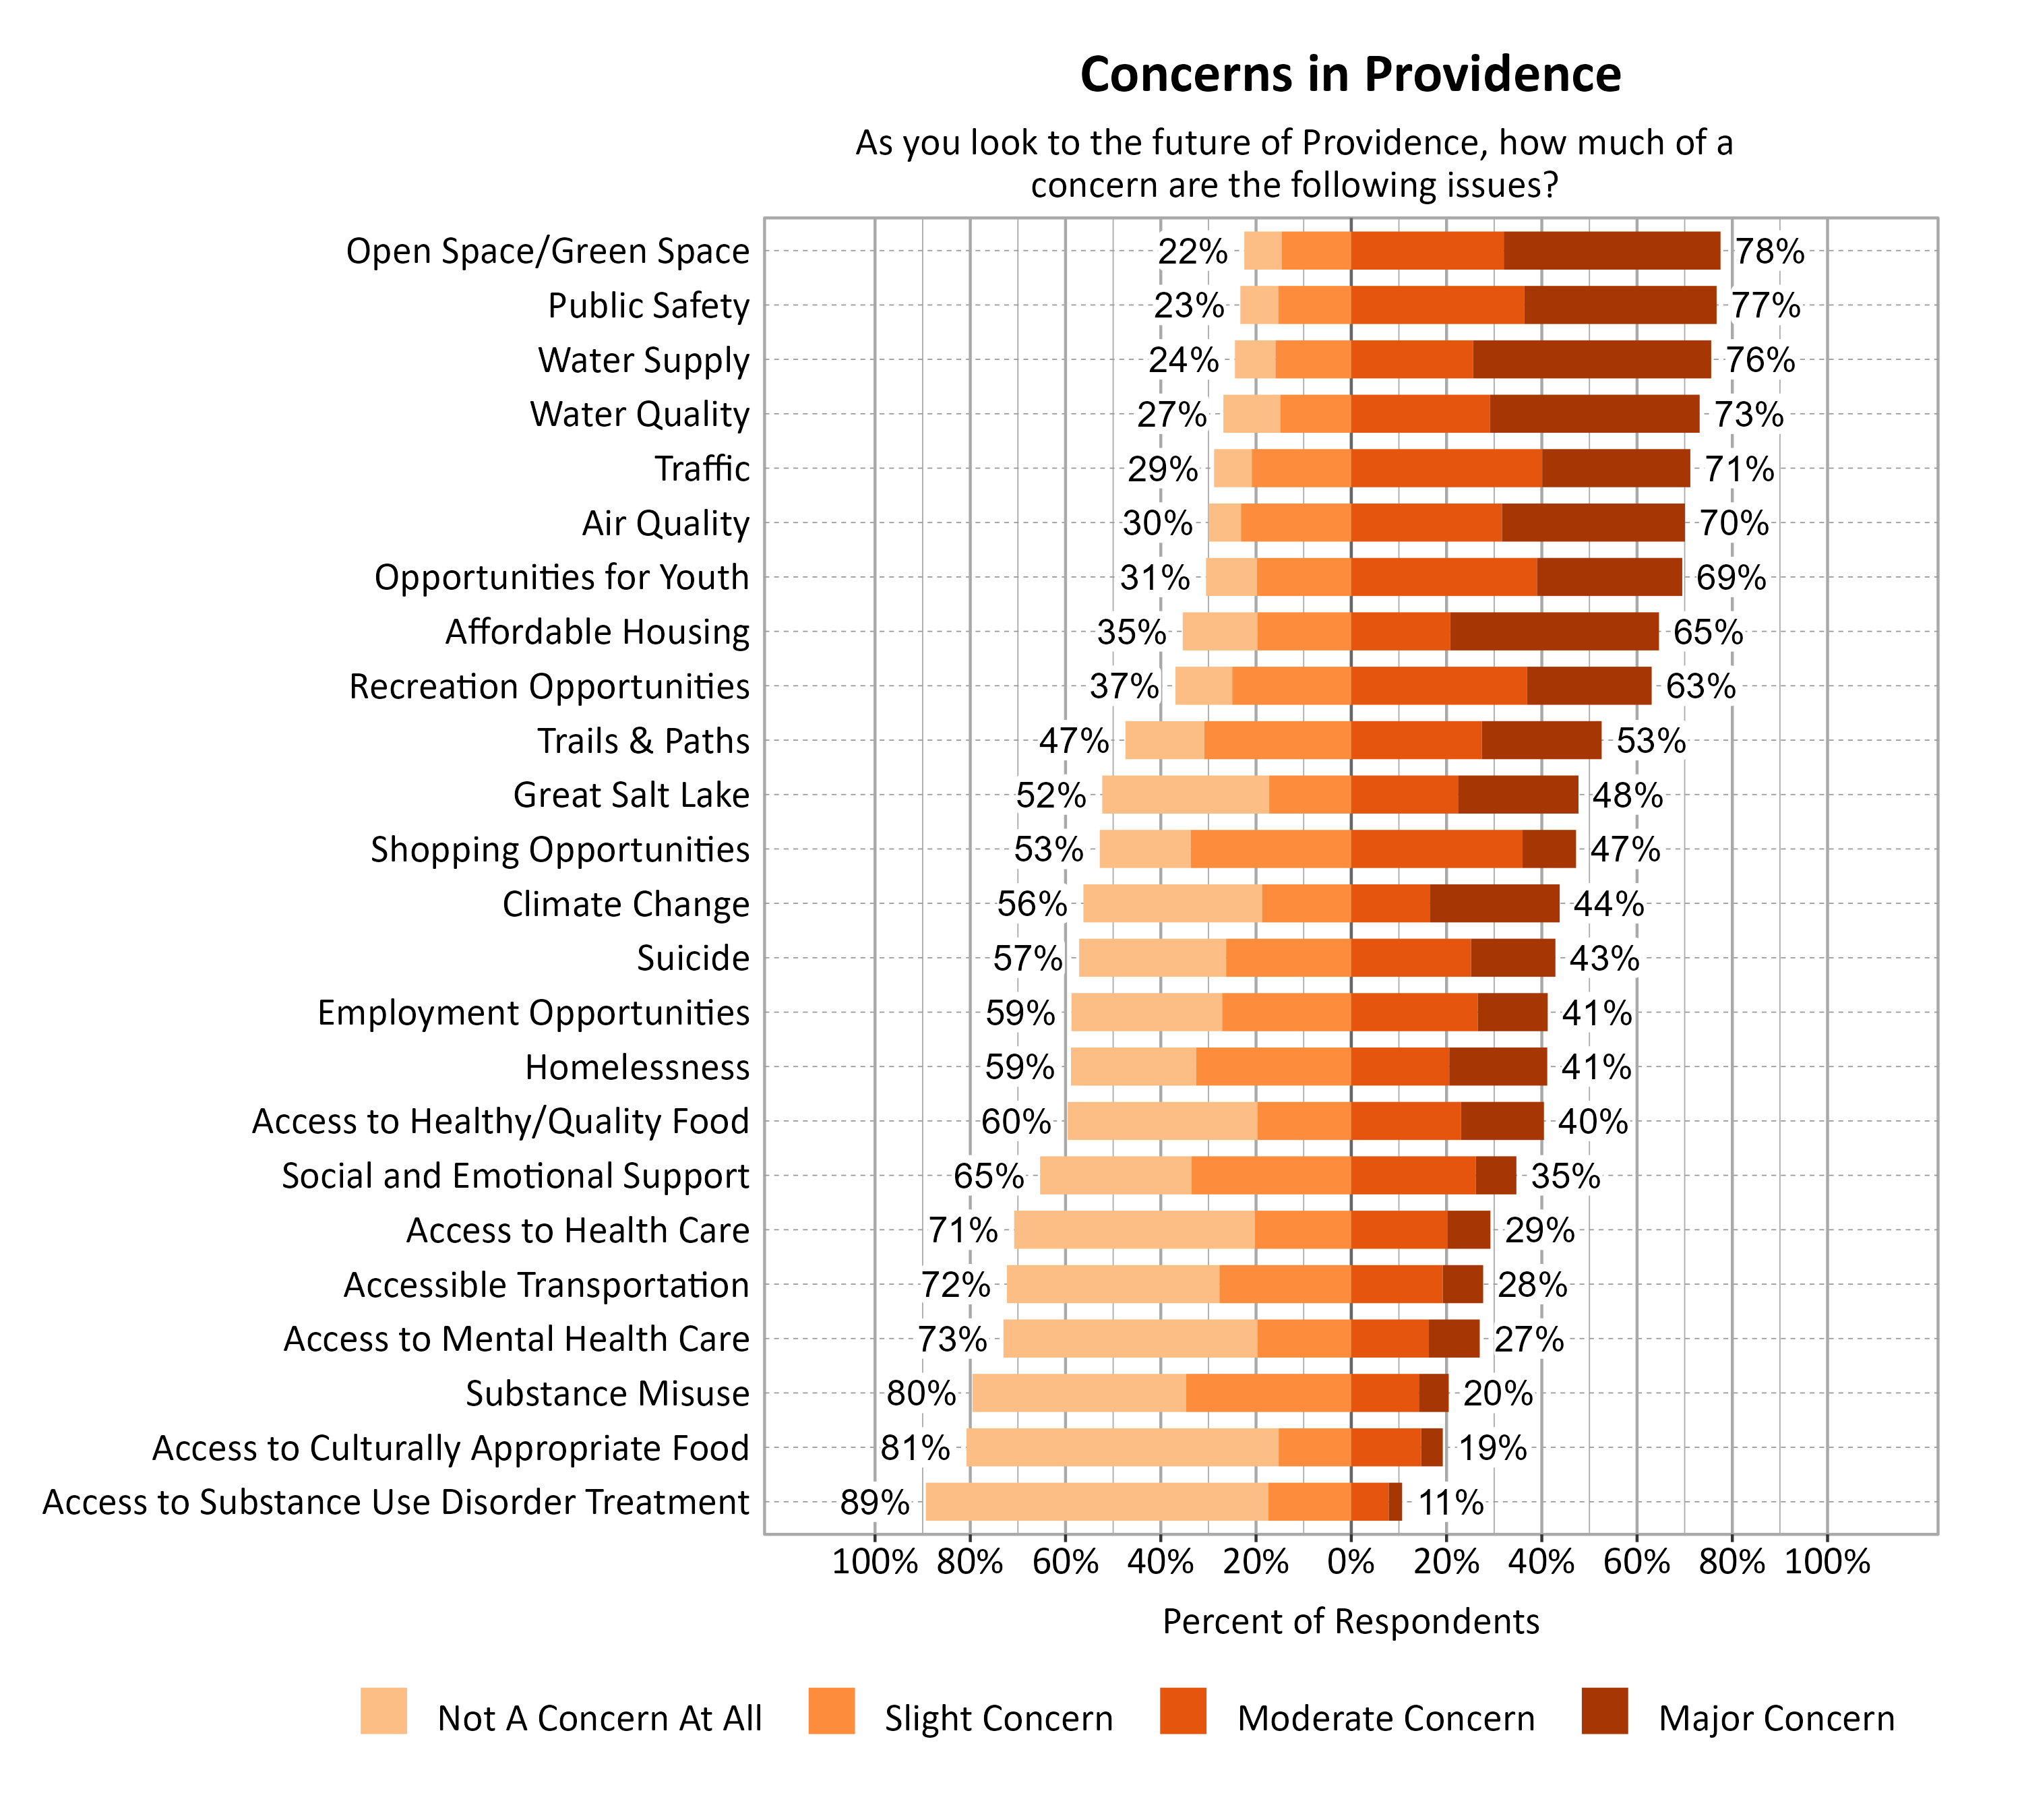
Survey respondents indicated the degree to which a number of possible local issues were a concern as they look to the future of Providence. Open Space/Green Space (78%), Public Safety (77%), and Water Supply (76%) were the top concerns.
Additional Questions for Providence
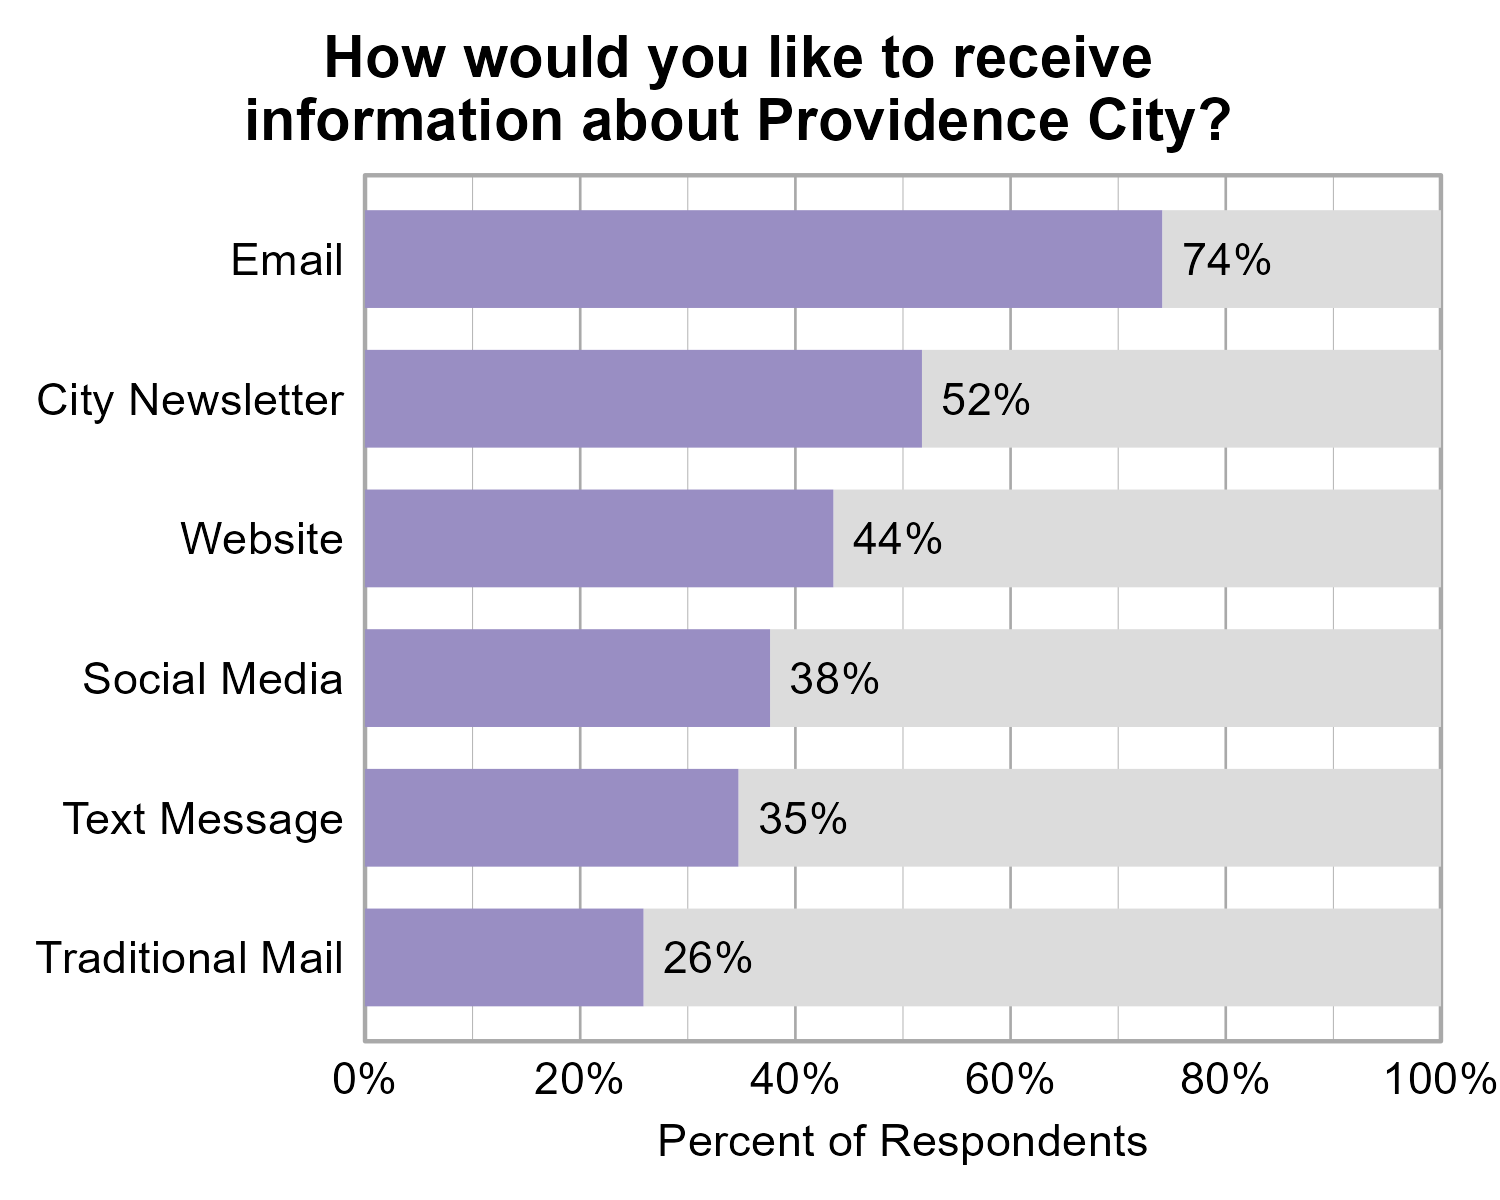
Communication Methods in Providence
Respondents were asked to indicate any/all methods of communication they like to receive information about Providence City. The most popular answers were through Email (74%) and the City Newsletter (52%).
Providence Fiber Internet
Respondents were also asked to indicate their satisfaction with the new city-wide fiber network system. Responses varied considerably.
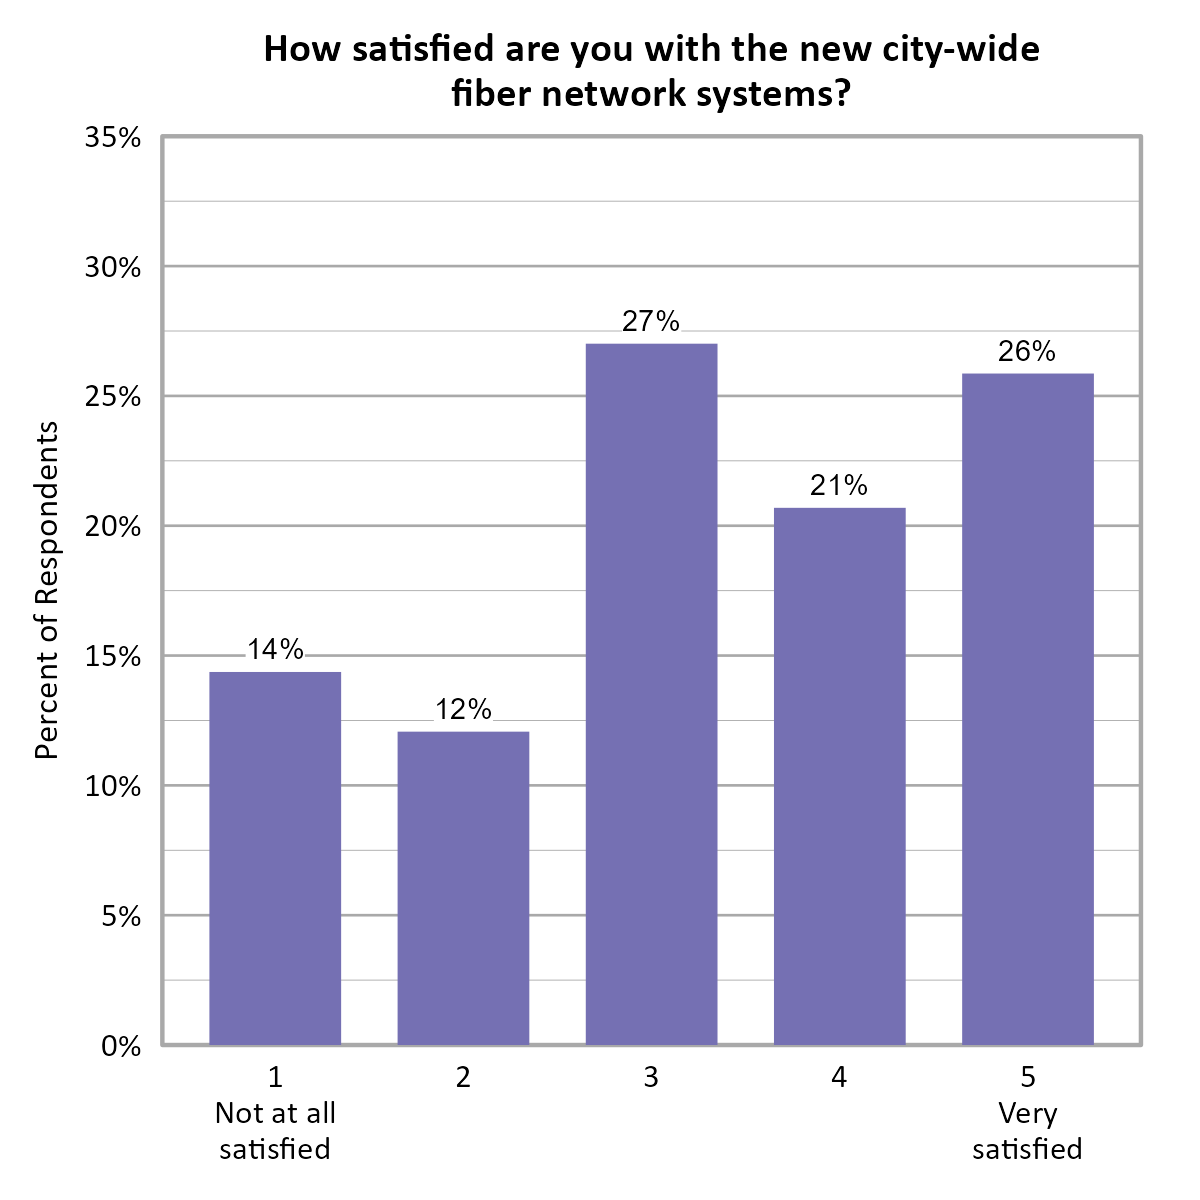
Respondents were also asked, “Do you have any comments on how the city fiber network system could be improved?” A number of respondent comments were positive about the fiber Internet. Some had not yet been able to get hooked up to the system. Additional comments emphasized problems with affordability and speed of the new system. Some mentioned problems with installation and concerns about the city’s involvement with the system change.
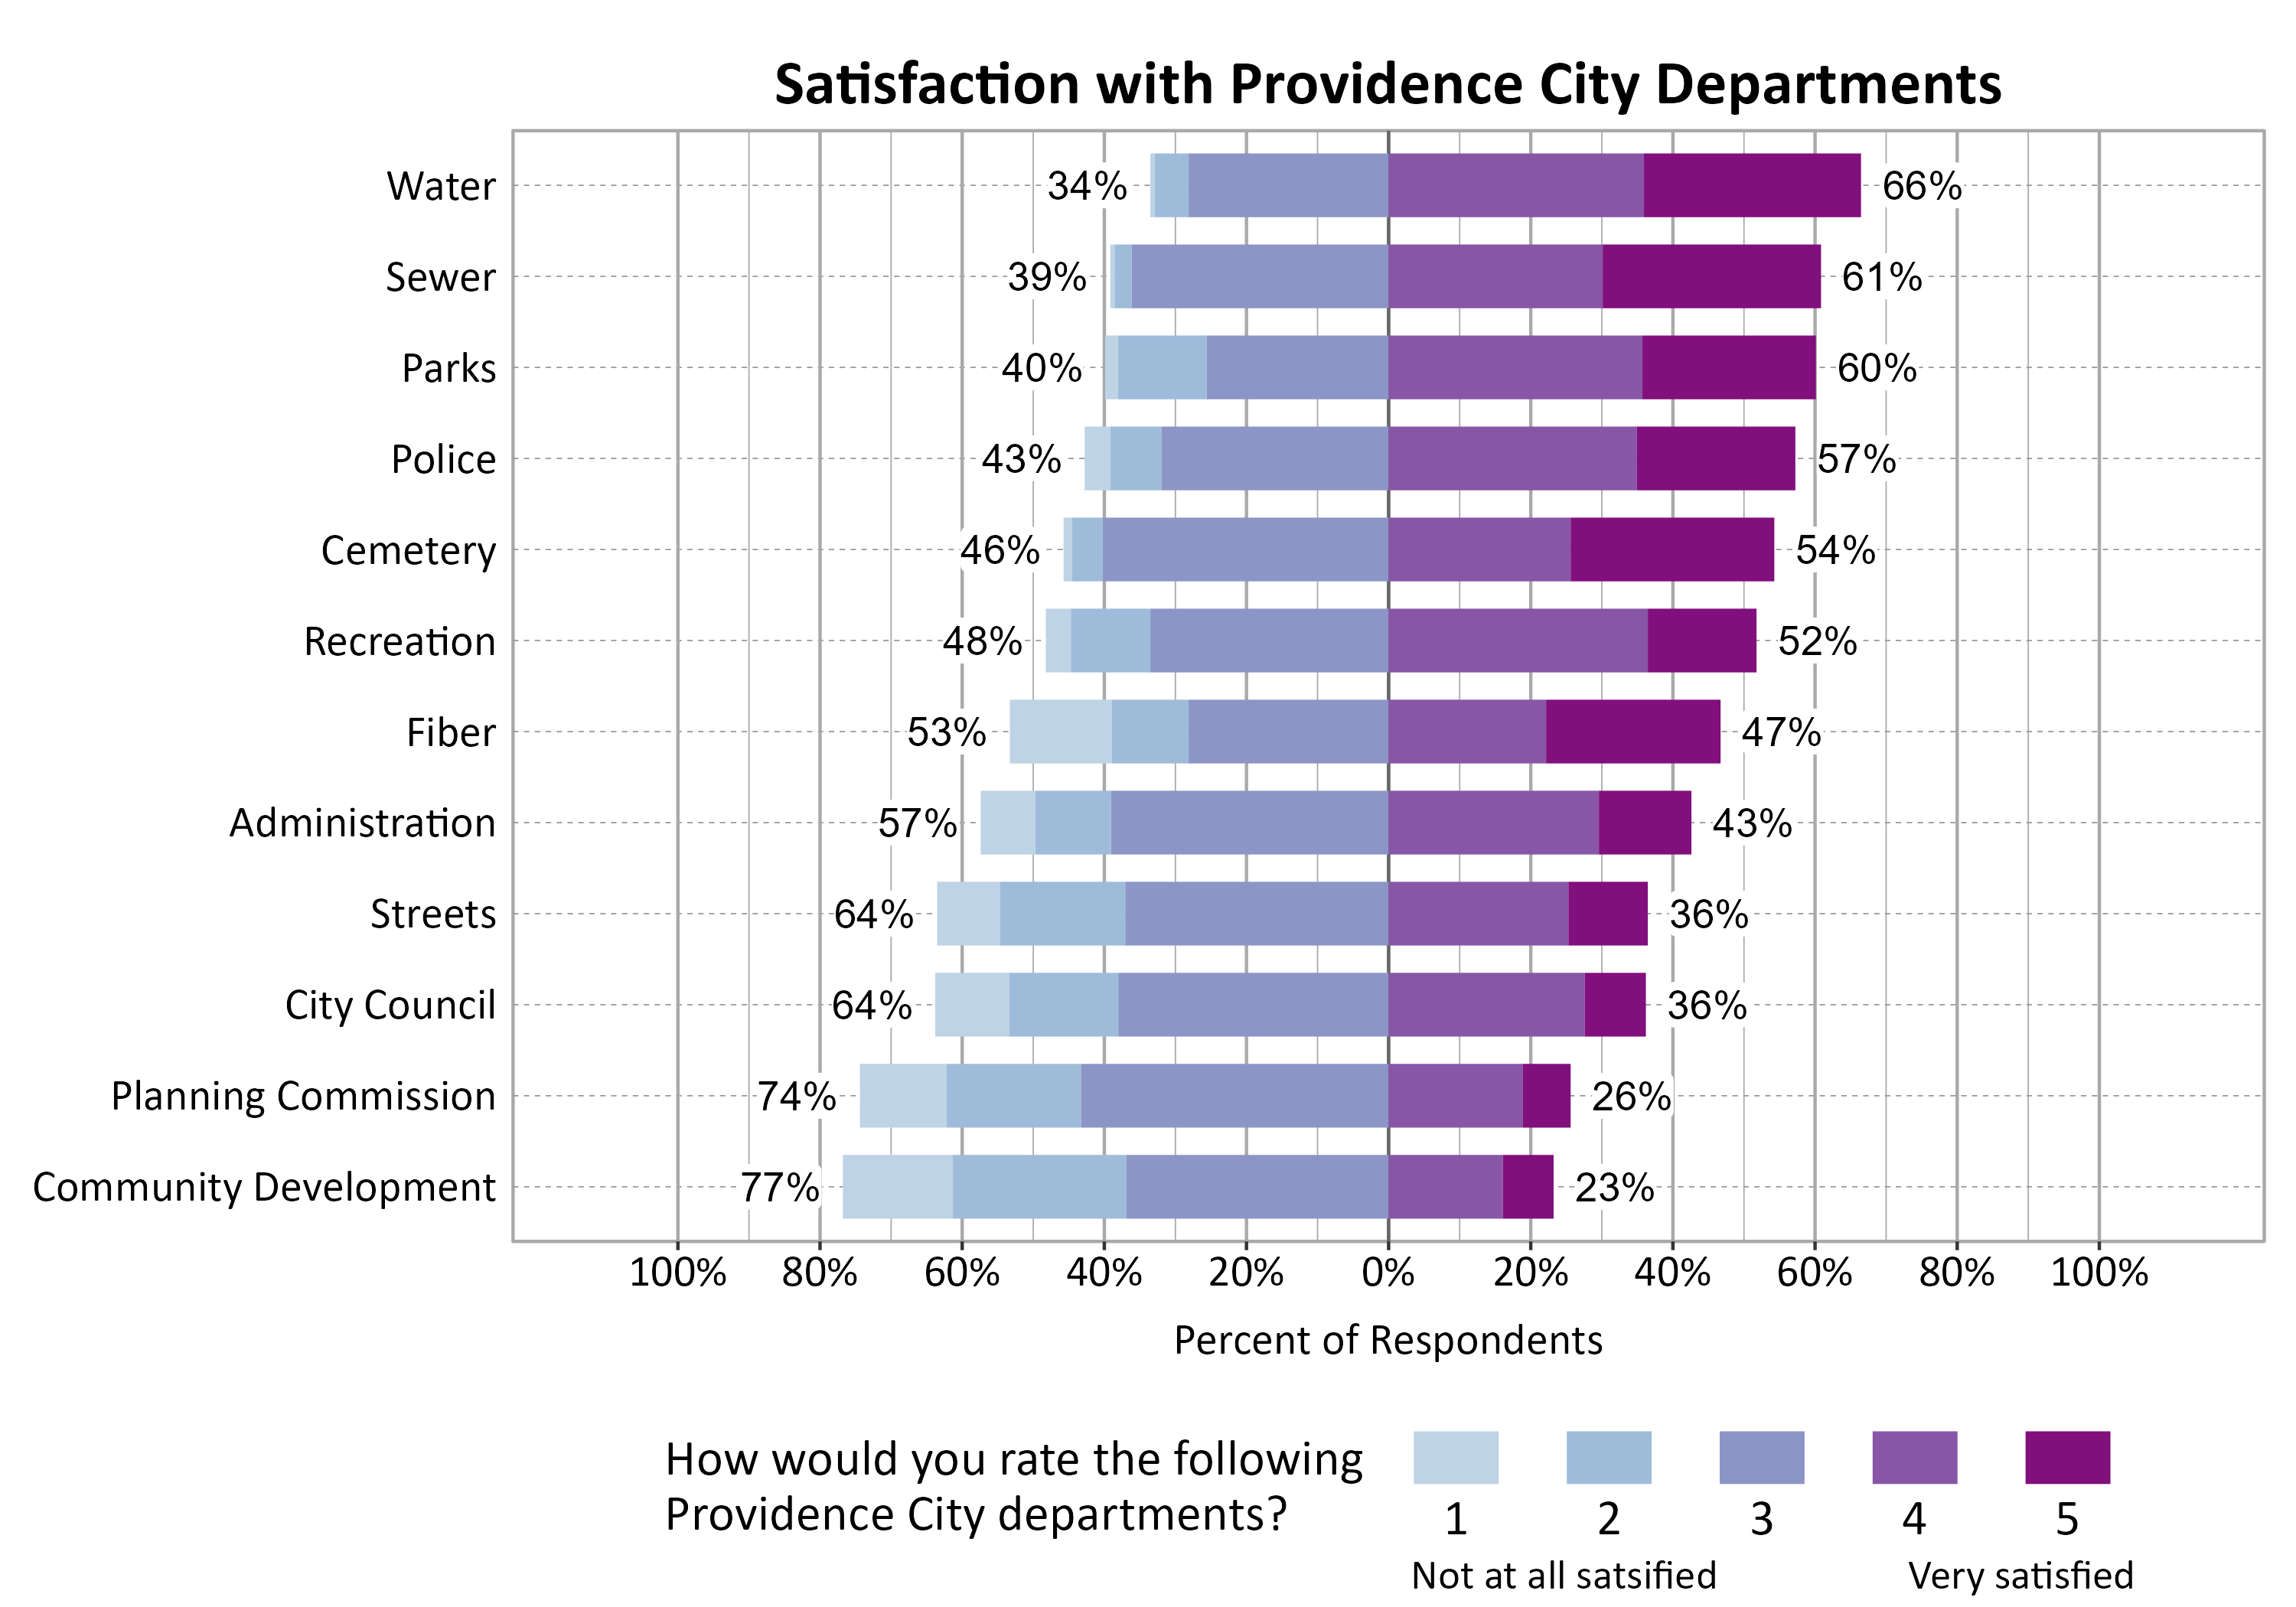
Satisfaction with Providence City Departments
When asked to rate a series of Providence City Departments, the highest rated departments were Water (66%), Sewer (61%), and Parks (60%).
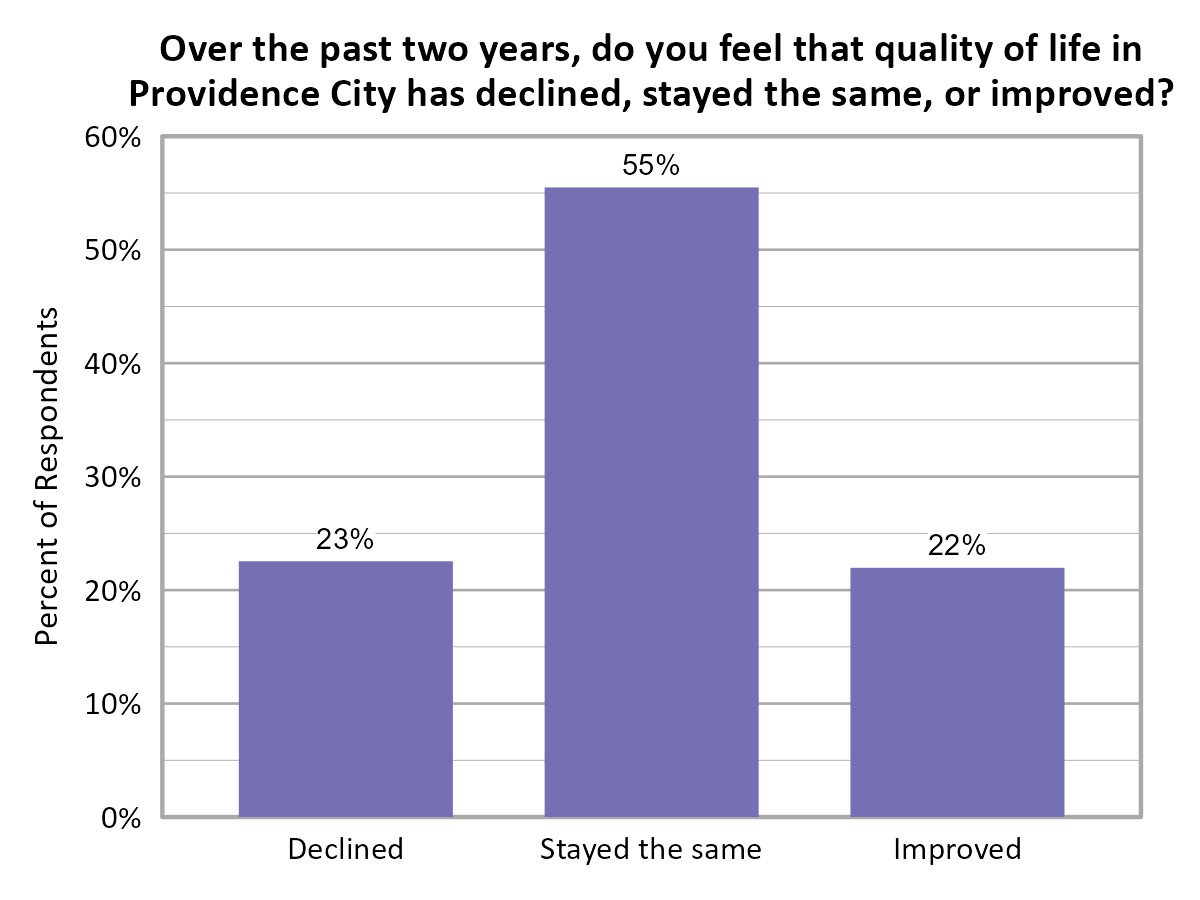
Quality of Life in Providence
When asked if respondents though that the quality of life in Providence City has declined, stayed the same, or improved over the past two years, the majority of respondents indicated that it has stayed the same (55%).
Open Comments
All open comments collected in the survey were shared with city leaders. General observations and themes are shared here.
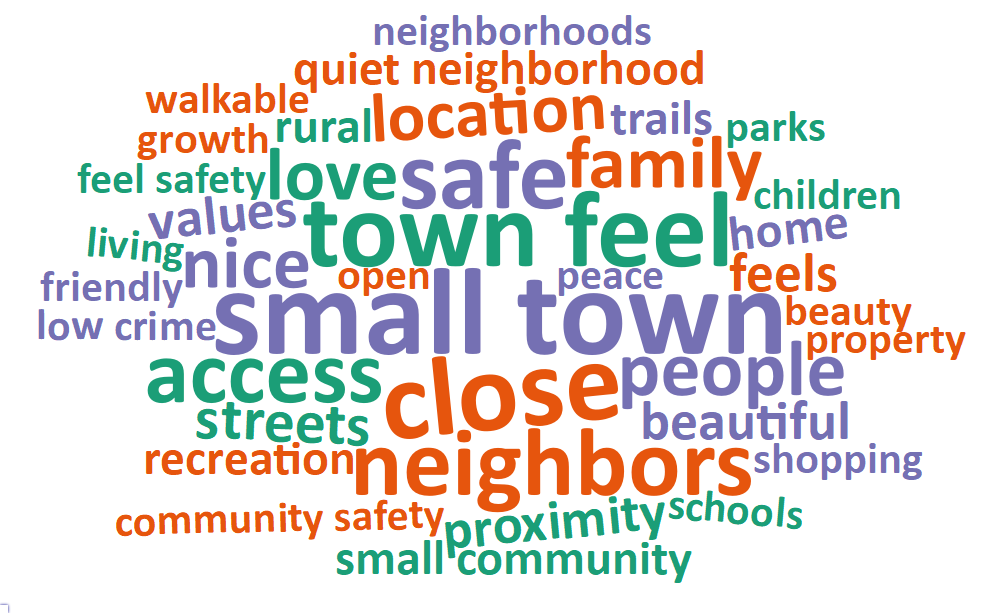
What Respondents Value Most in Providence
Survey respondents were asked to comment on what they value most about Providence. The most common words and phrases from all city comments are included in the word cloud below. It is possible that negative or unrelated words may appear since these words have been taken out of context, and they may not indicate the respondent’s intended meaning. Many comments expressed positive attitudes towards the ‘small-town’ feel of Providence. The social and community aspects of the town were also highly valued in addition to its location near other larger towns and cities.
Local Environmental Quality in Providence
The 32% of respondents who rated the Local Environmental Quality domain as 1, 2, or 3 (Poor, Fair, or Moderate) were further asked if there are specific aspects of local environmental quality that they feel are problematic. There was a common concern and desire for green spaces and open spaces to be maintained and available. Many mentioned that existing areas are run down and have trash problems. Air quality was a major concern, with inversions and wildfires mentioned most often.
Improving Wellbeing in Providence
Survey respondents were asked if there is anything that could be done to improve wellbeing in Providence. Comments suggested a need for improvements in various parks and trails throughout the area. In addition, the need for better roadways was a significant concern. The rapid construction of housing was also noted as a negative aspect of the area.
Additional Comments
Respondents were also asked if they had any additional comments on wellbeing in Providence. Although some comments noted appreciation toward Providence, other comments mentioned concerns the government leaders in the area do not reflect their political beliefs. Comments also mentioned the need for improved roadways.