Sandy Wellbeing Survey Findings 2024
By Dr. Courtney Flint and Team
![]()
Contact Information
Dr. Courtney Flint
courtney.flint@usu.edu
435-797-8635
Summary
Sandy is one of 51 cities participating in the Utah Wellbeing Survey Project in 2024. This project is designed to assess the wellbeing and local perspectives of city residents and to provide information to city leaders to inform general planning processes. Additional analysis is underway and this report may be updated over time.
We are grateful to all those who took the survey and to our city partners who helped to make this possible. We are grateful to a number of entities for funding: the Utah League of Cities and Towns, USU Extension, USU’s Institute for Land Water and Air, the Wasatch Front Regional Council, Utah Department of Transportation, the Utah Agricultural Experiment Station, and the cities of Alpine, Cedar Hills, Draper, Millcreek, Nephi, North Salt Lake, Ogden, Orem, Pleasant Grove, Providence, Springdale, Tremonton, West Bountiful, and West Valley City.
This report describes findings from the 2024 Sandy survey and comparative information with other project cities. In April and May 2024, Sandy City advertised the survey through social media, Nextdoor, and a newsletter. All city residents age 18+ were encouraged to take the online Qualtrics survey.
How many people responded?
- 955 viable surveys were recorded in this 2024 survey effort.
- The Sandy 2022 survey had 809 responses and the Sandy 2021 survey had 1159 responses.
- The adult population of Sandy was estimated at 70,993, based on the American Community Survey by the U.S. Census. The 955 survey responses in 2024 represent 1.3% of the adult population and have a conservative margin of error of 3.15%.
Survey Respondent Characteristics
| Resident Statistics | |
|---|---|
| Full Time Residents of Sandy | 98.8% |
| Part Time Residents of Sandy | 1.2% |
| Length of Residency — Range | 0.5-76 years |
| Length of Residency — Average | 24.0 years |
| Length of Residency — Median | 23 years |
| Length of Residency 5 Years or less | 12.1% |
| ZIP Code | Percent |
|---|---|
| 84047 | 0.2% |
| 84070 | 21.0% |
| 84092 | 34.5% |
| 84093 | 21.9% |
| 84094 | 22.3% |
| Other | 0.1% |
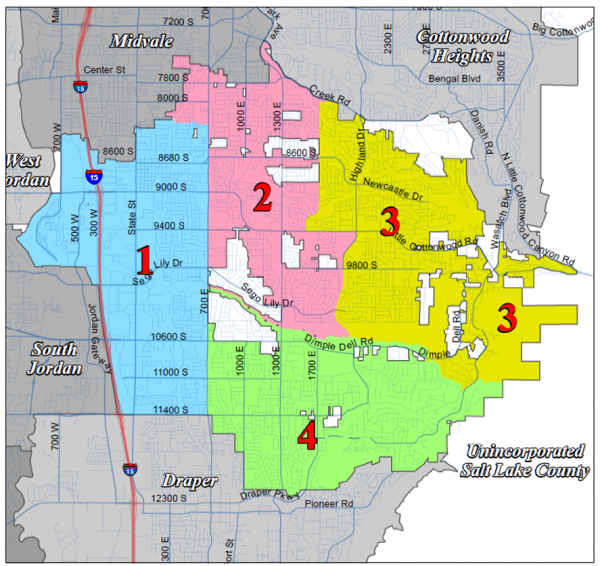
| City Area | Percent |
|---|---|
| Council District 1 | 19.7% |
| Council District 2 | 24.9% |
| Council District 3 | 31.7% |
| Council District 4 | 23.7% |
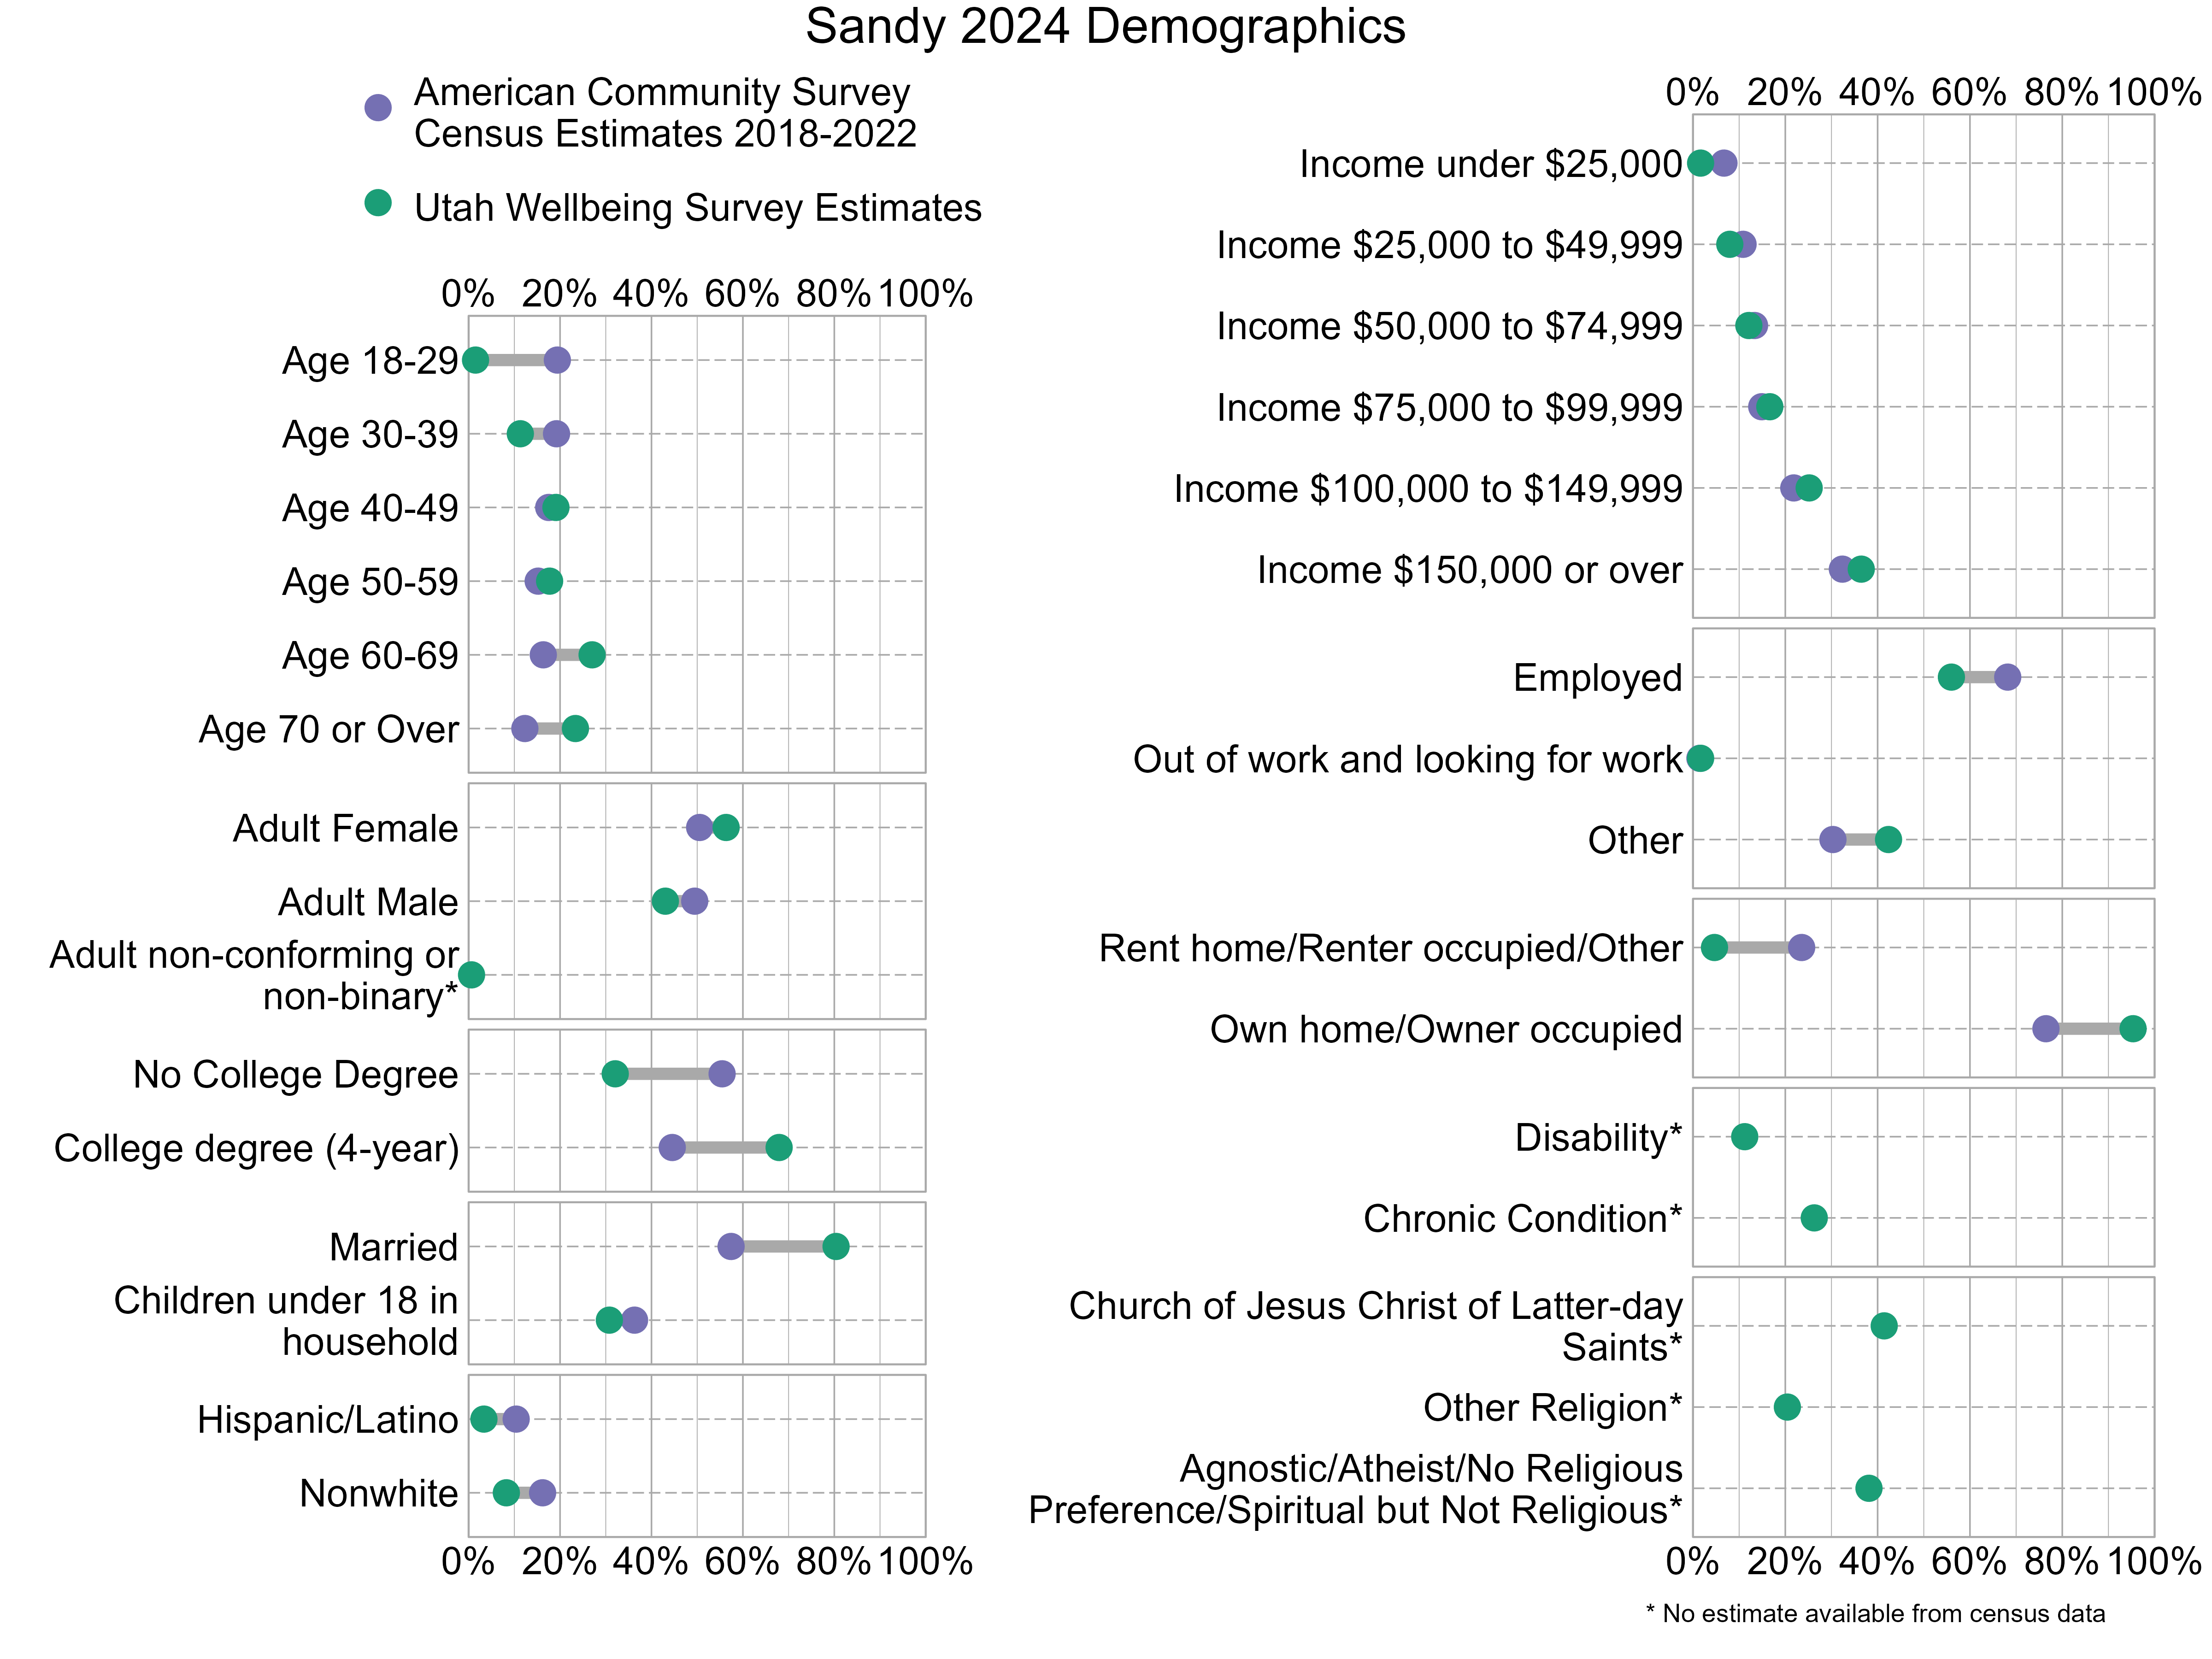
Demographic characteristics of the survey respondents were compared below with U.S. Census information from the 2018-2022 American Community Survey. In the graph below, gray bars indicate differences between the American Community Survey estimates and the Utah Wellbeing Project surveys. The wider the gray bars, the larger the differences. Also note that estimates for religious affiliation, adult non-conforming or non-binary gender, disability, and chronic conditions are unavailable from the census data. There can also be a variable margin of error in the American Community Survey estimates, and caution should be used when comparing estimates. Not all respondents provided demographic information. As the graph shows, 2024 survey respondents were not fully representative of Sandy. People who have at least a 4-year college degree, are married, and own their homes were overrepresented while those who are age 18-29, do not have a college degree, and are renters were underrepresented.
Overall Personal Wellbeing and Overall Wellbeing in Sandy
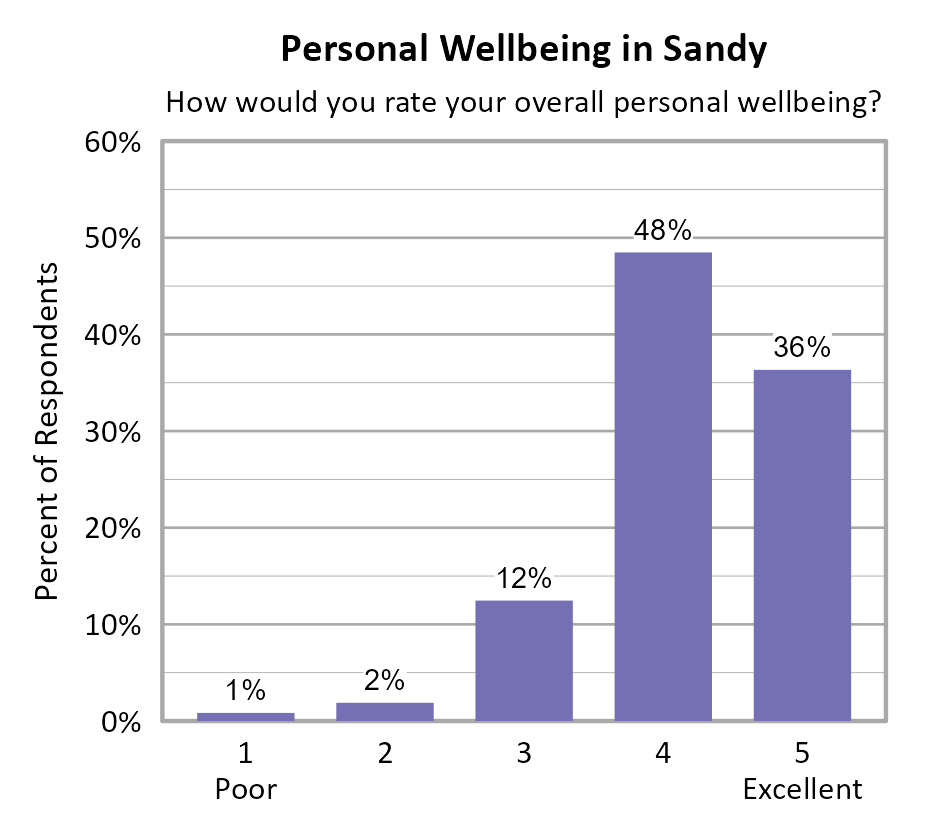
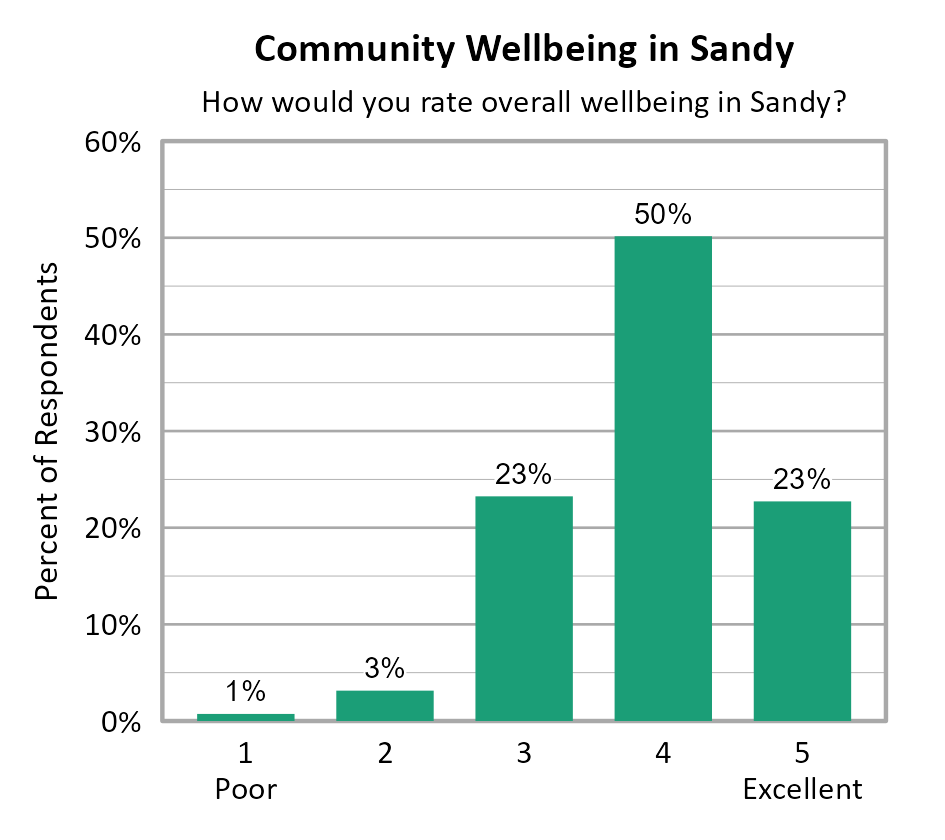
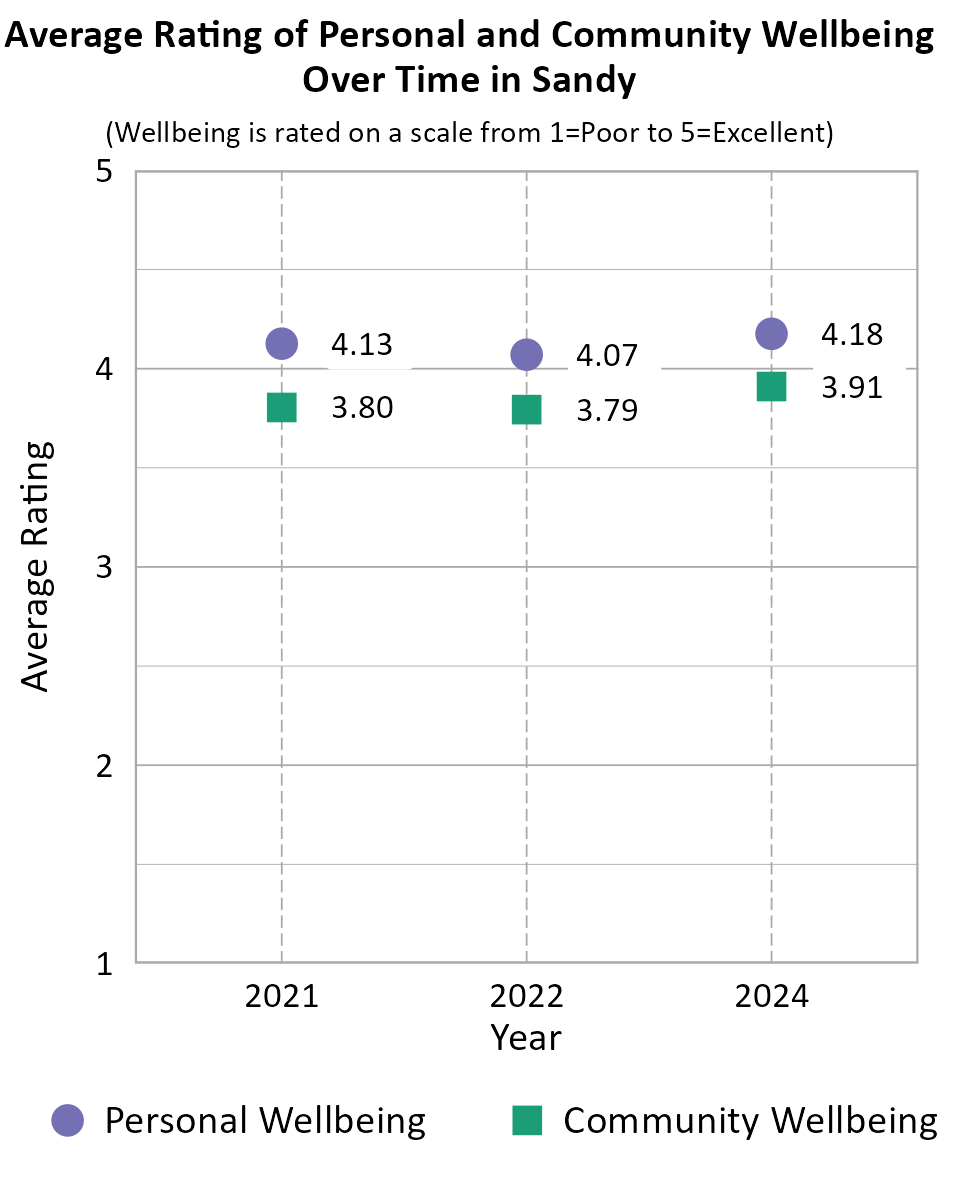
Survey participants were asked about their overall personal wellbeing and overall community wellbeing in Sandy. These wellbeing indicators were both measured on a 5-point scale from poor (1) to excellent (5). The average personal wellbeing score in Sandy was 4.18 with 85% of respondents indicating their wellbeing at a 4 or 5 on the 5-point scale. The average score for community wellbeing in Sandy was 3.91 with 73% of respondents indicating community wellbeing at a 4 or 5 on the 5-point scale. In Sandy, Council District 3 had statistically higher personal wellbeing scores than Council Districts 1 and 2, and Council District 4 was also statistically higher than Council District 1. For community wellbeing scores, Council Districts 3 and 4 were both statistically higher than Council District 1.
When comparing survey data from Sandy over the years as shown in the information below, we can see that both the average personal wellbeing score and the average community wellbeing score remained nearly the same between 2021 and 2022, and improved between 2022 and 2024. Note that the number of respondents differed between years, there is no tracking of individuals from one year to the next, and the low end of the scale was "Poor" in 2024 but "Very Poor" in prior years which may account for differences in scores over time.
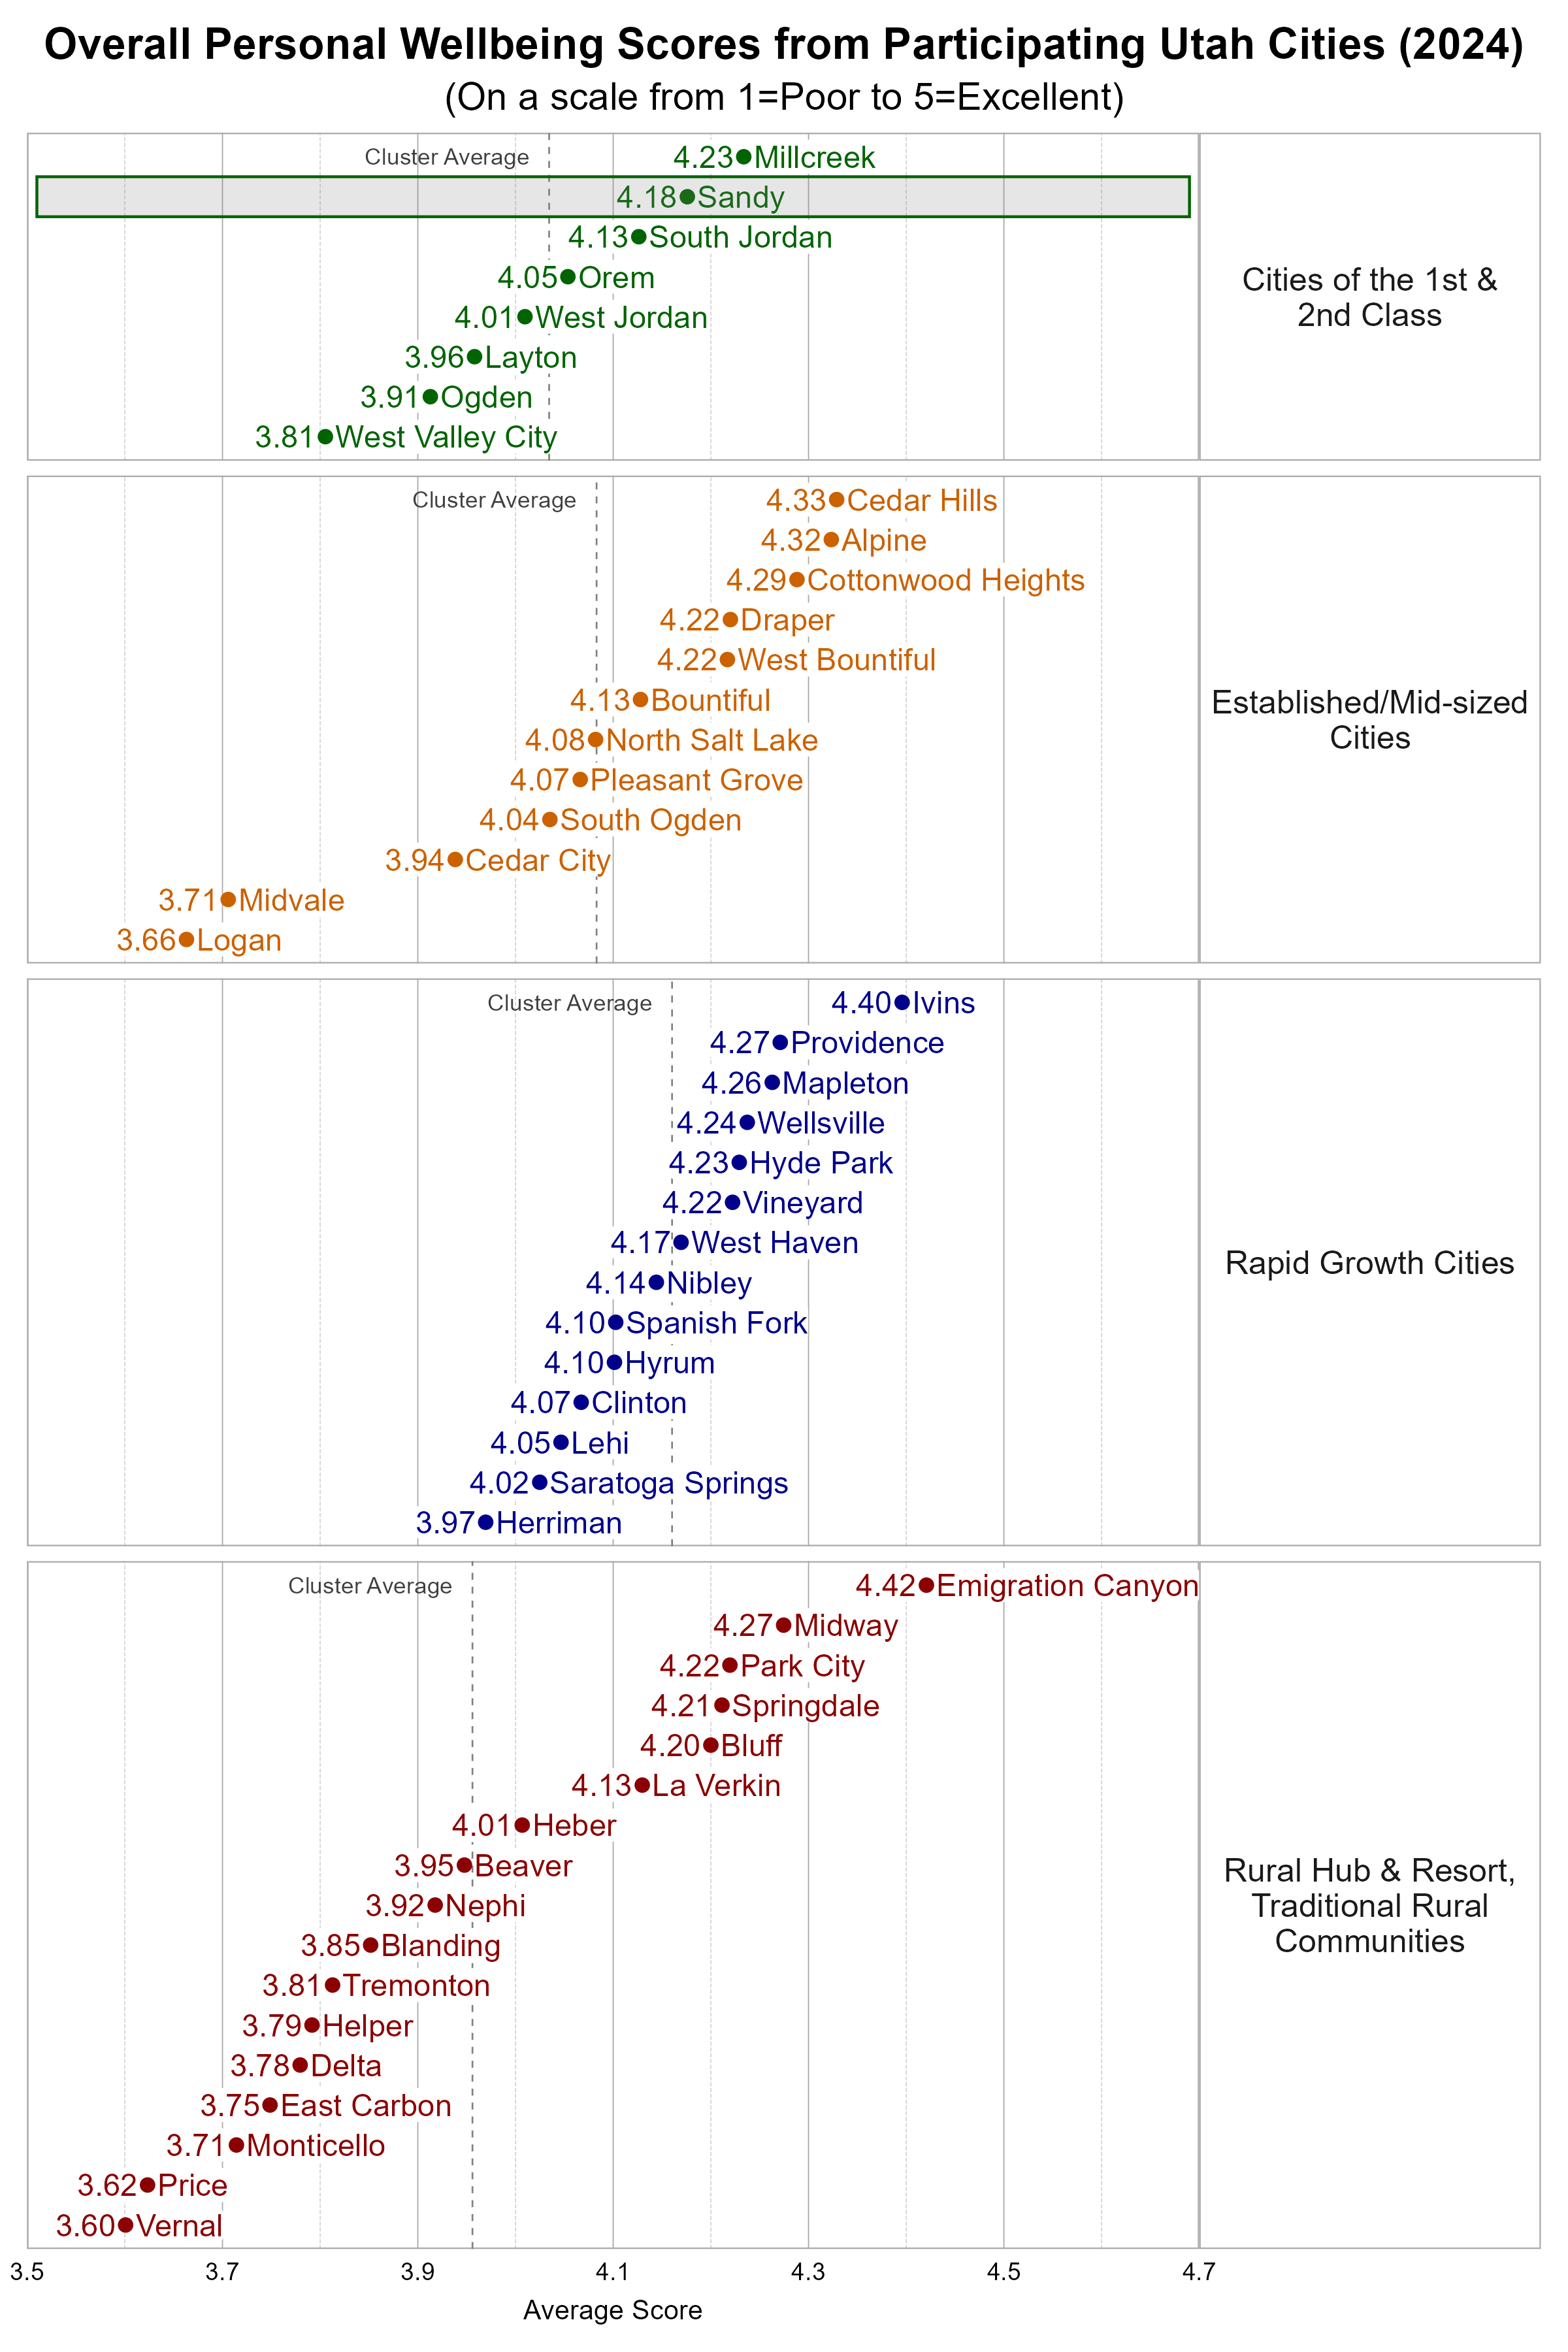
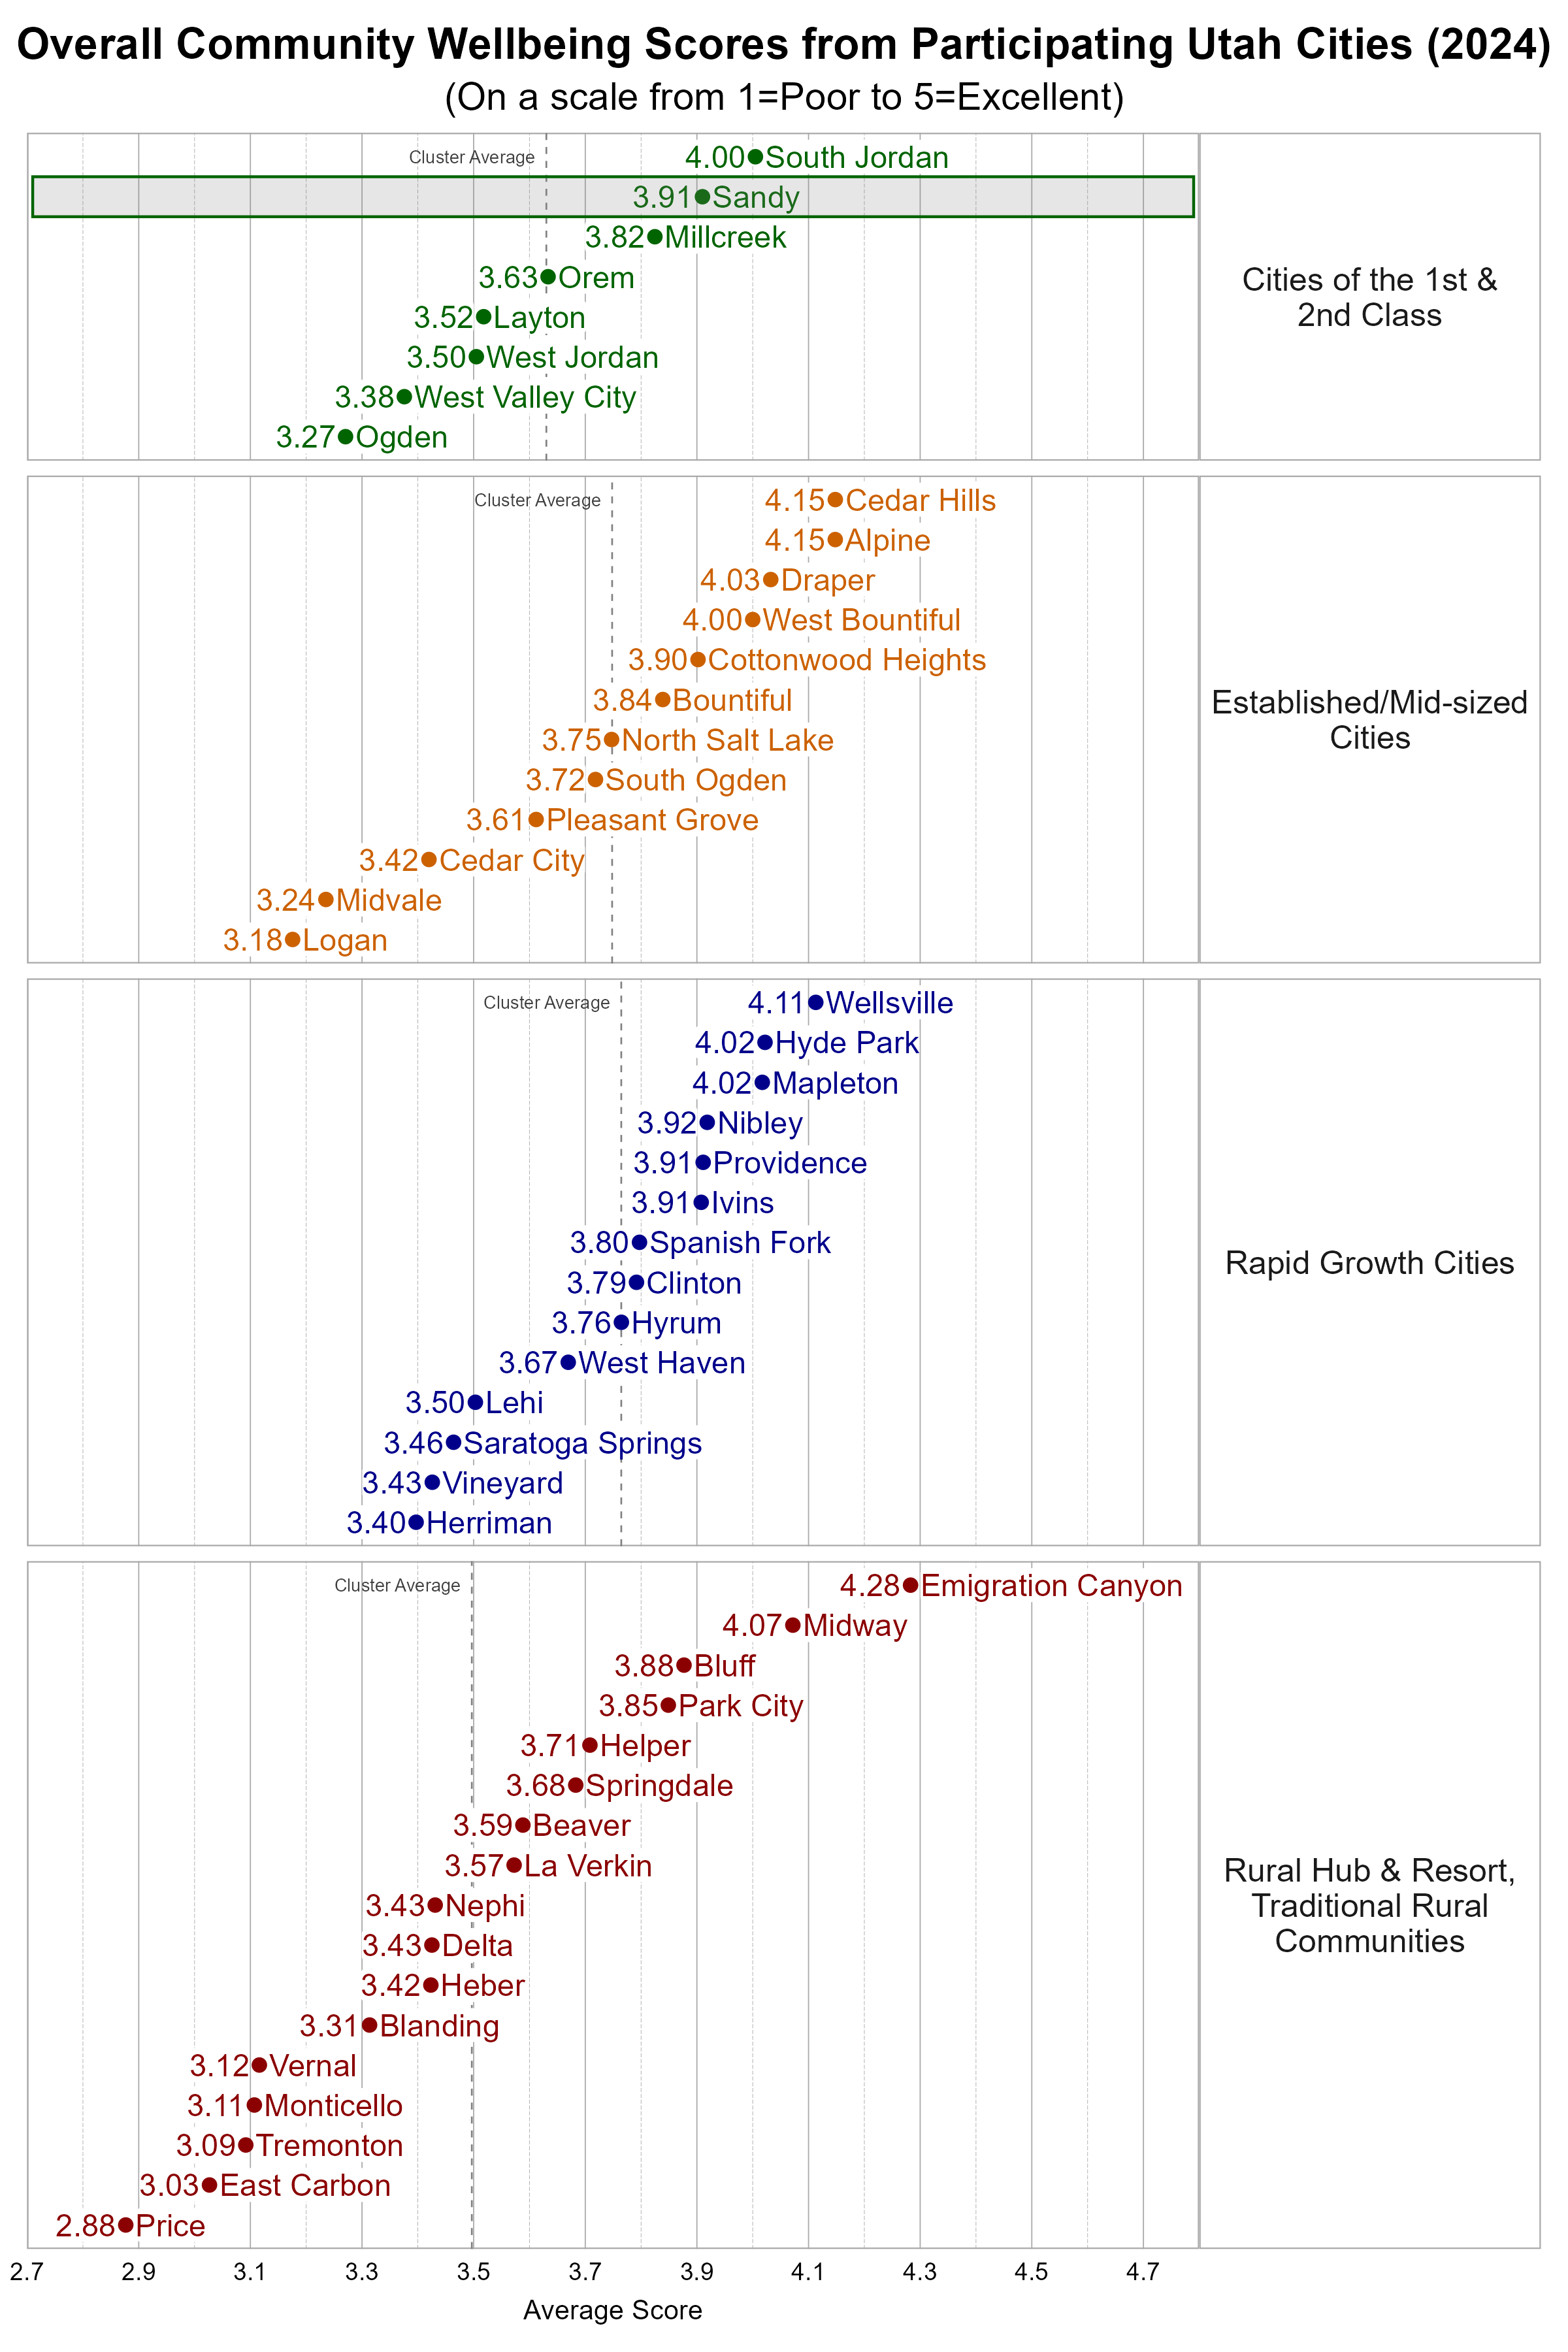
Comparing Wellbeing Across Utah Cities
The Utah League of Cities and Towns clusters cities and towns into five different categories based on size and growth rates. We utilize these clusters in our analysis. Sandy is classified as a City of the 1st and 2nd Class. Some cities may fit within more than one cluster.
Within the more Urban city cluster, Sandy was above the average overall personal wellbeing score and above the average overall community wellbeing score.
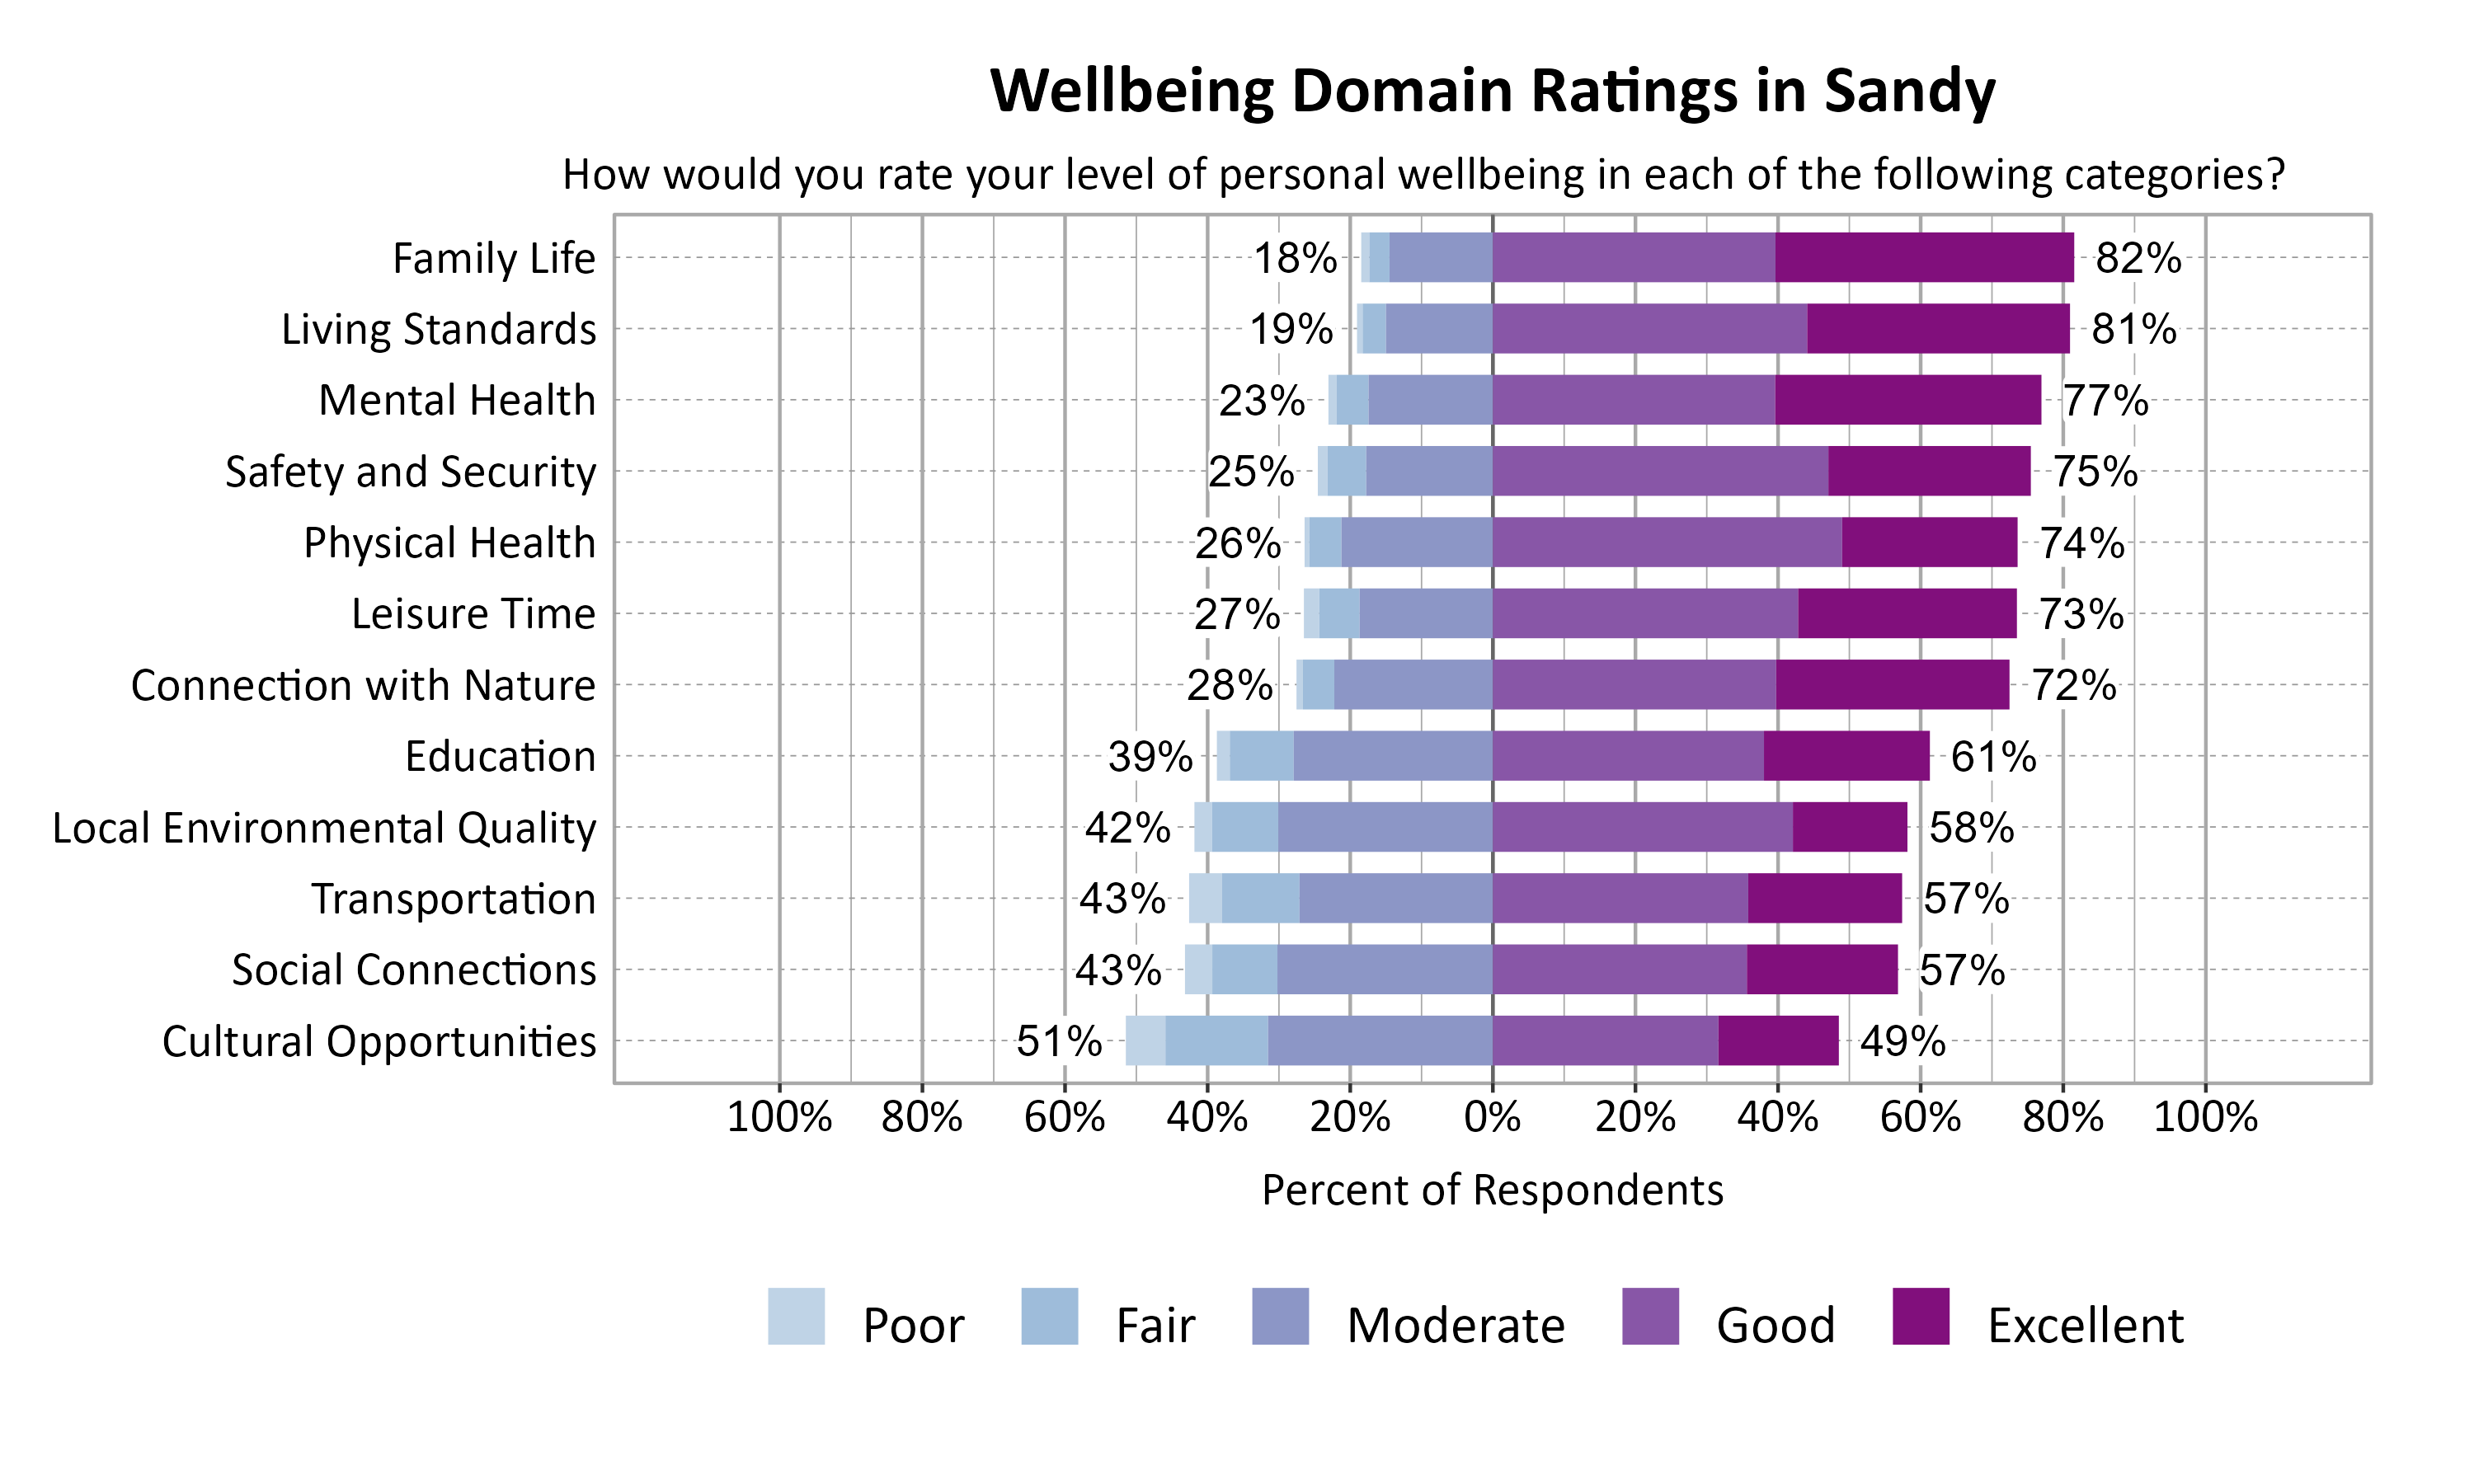
Wellbeing Domains in Sandy
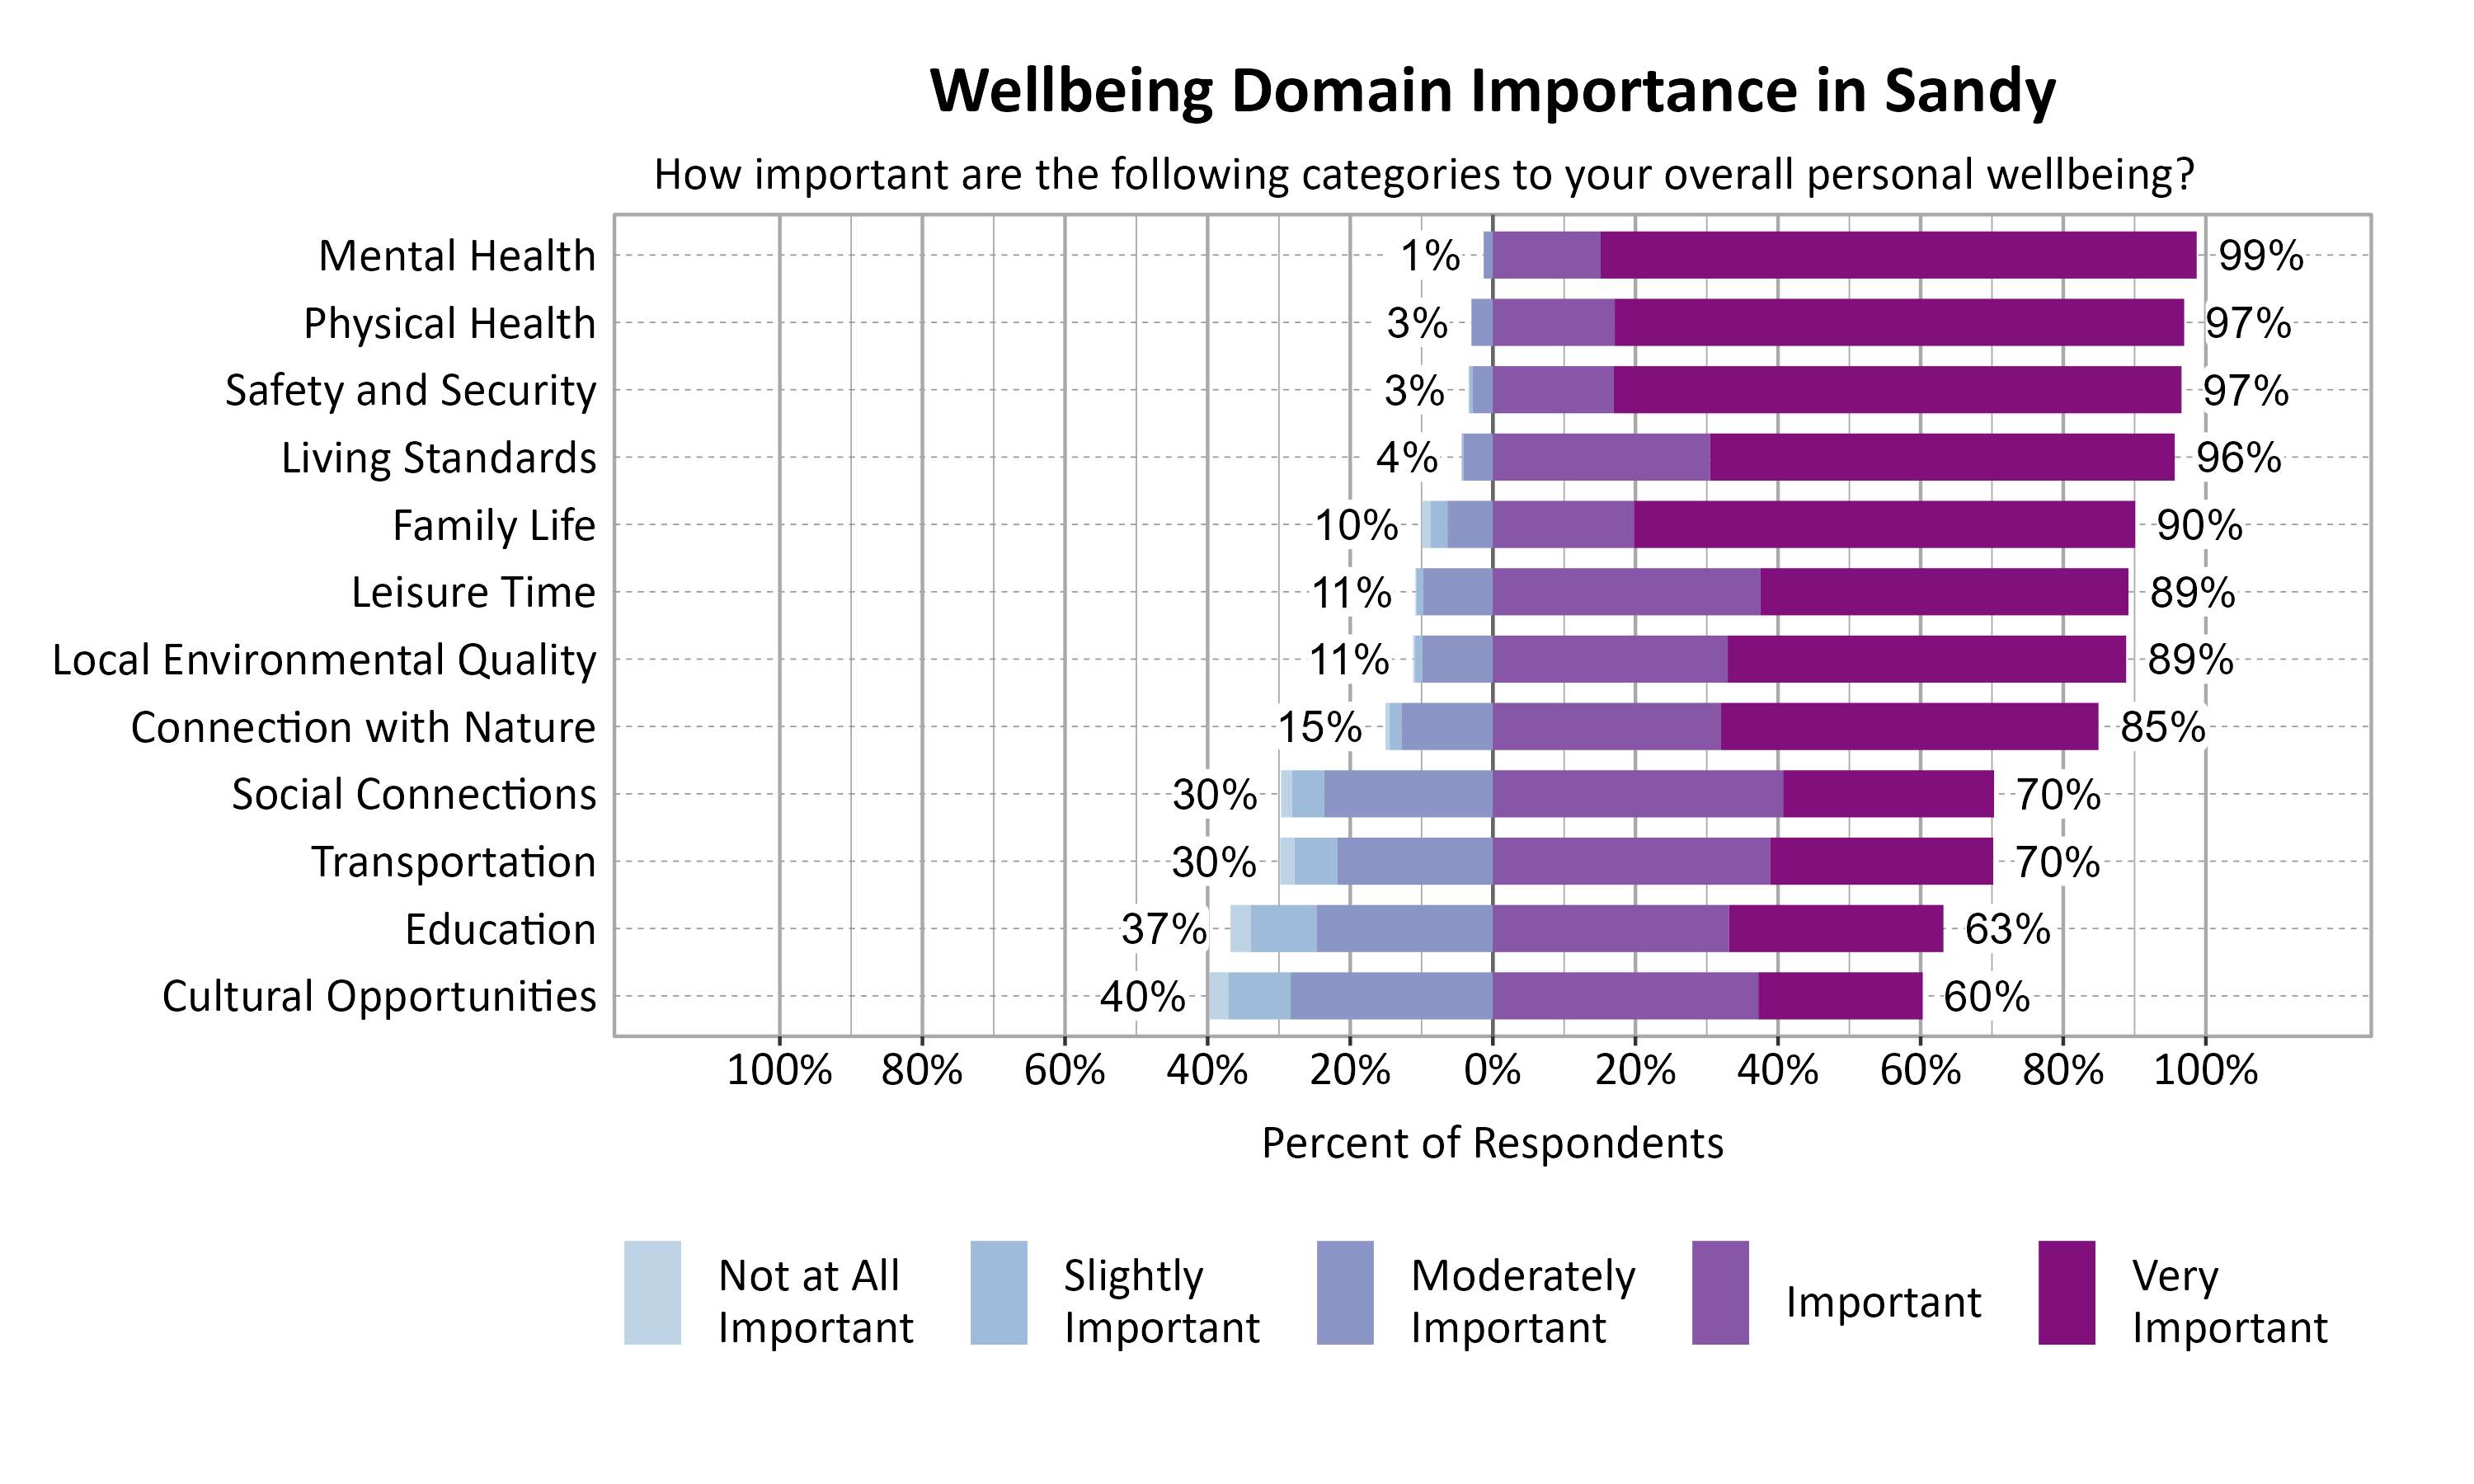
According to national and international entities that track wellbeing, there are a number of common dimensions or domains of wellbeing. Survey respondents rated twelve domains on a 5-point scale from poor to excellent. They were also asked to indicate the importance of each domain to their overall personal wellbeing on a 5-point scale from not at all important to very important. The highest rated wellbeing domains for respondents in Sandy were Family Life (82%), Living Standards (81%), and Mental Health (77%). The most important wellbeing domains were Mental Health (99%), Physical Health (97%), Safety and Security (97%), and Living Standards (96%).
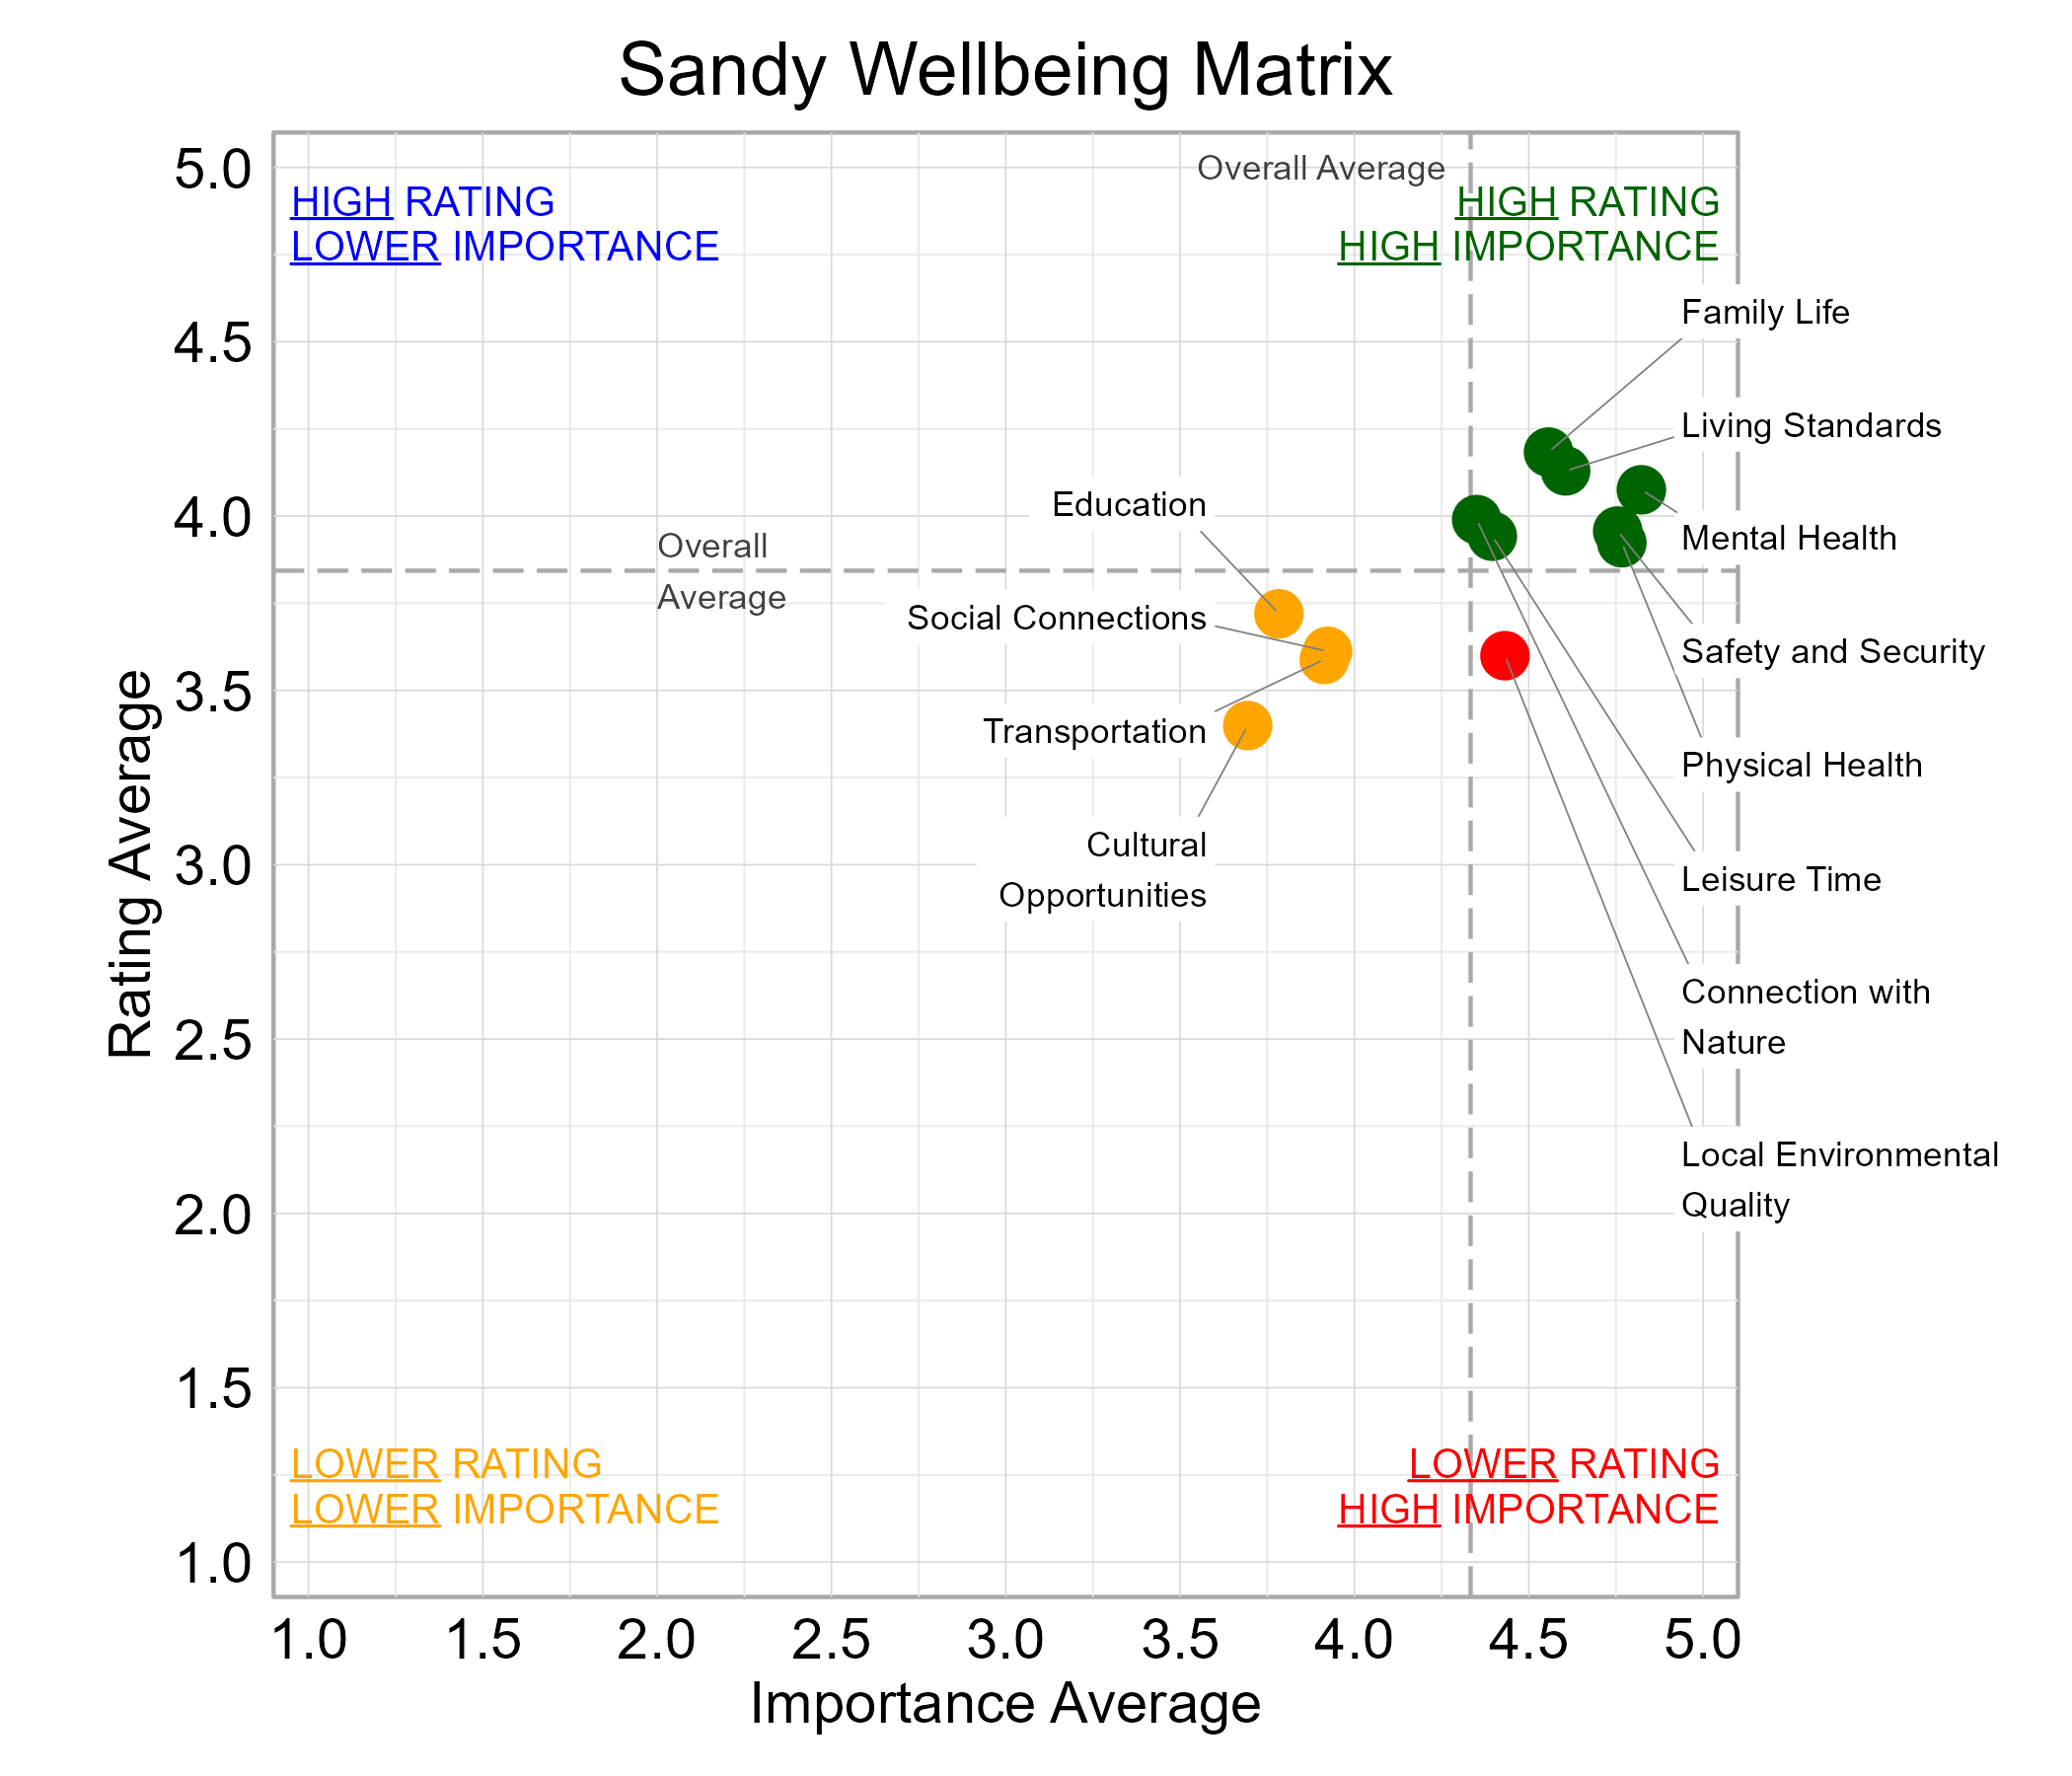
Wellbeing Matrix for Sandy
The graph below illustrates the relationship between the average rating and the average importance of wellbeing domains for survey respondents from Sandy. Connection with Nature, Family Life, Leisure Time, Living Standards, Mental Health, Physical Health, and Safety and Security were highly important and rated above average among the domains. Local Environmental Quality fell in the “red zone” of higher importance and lower ratings.
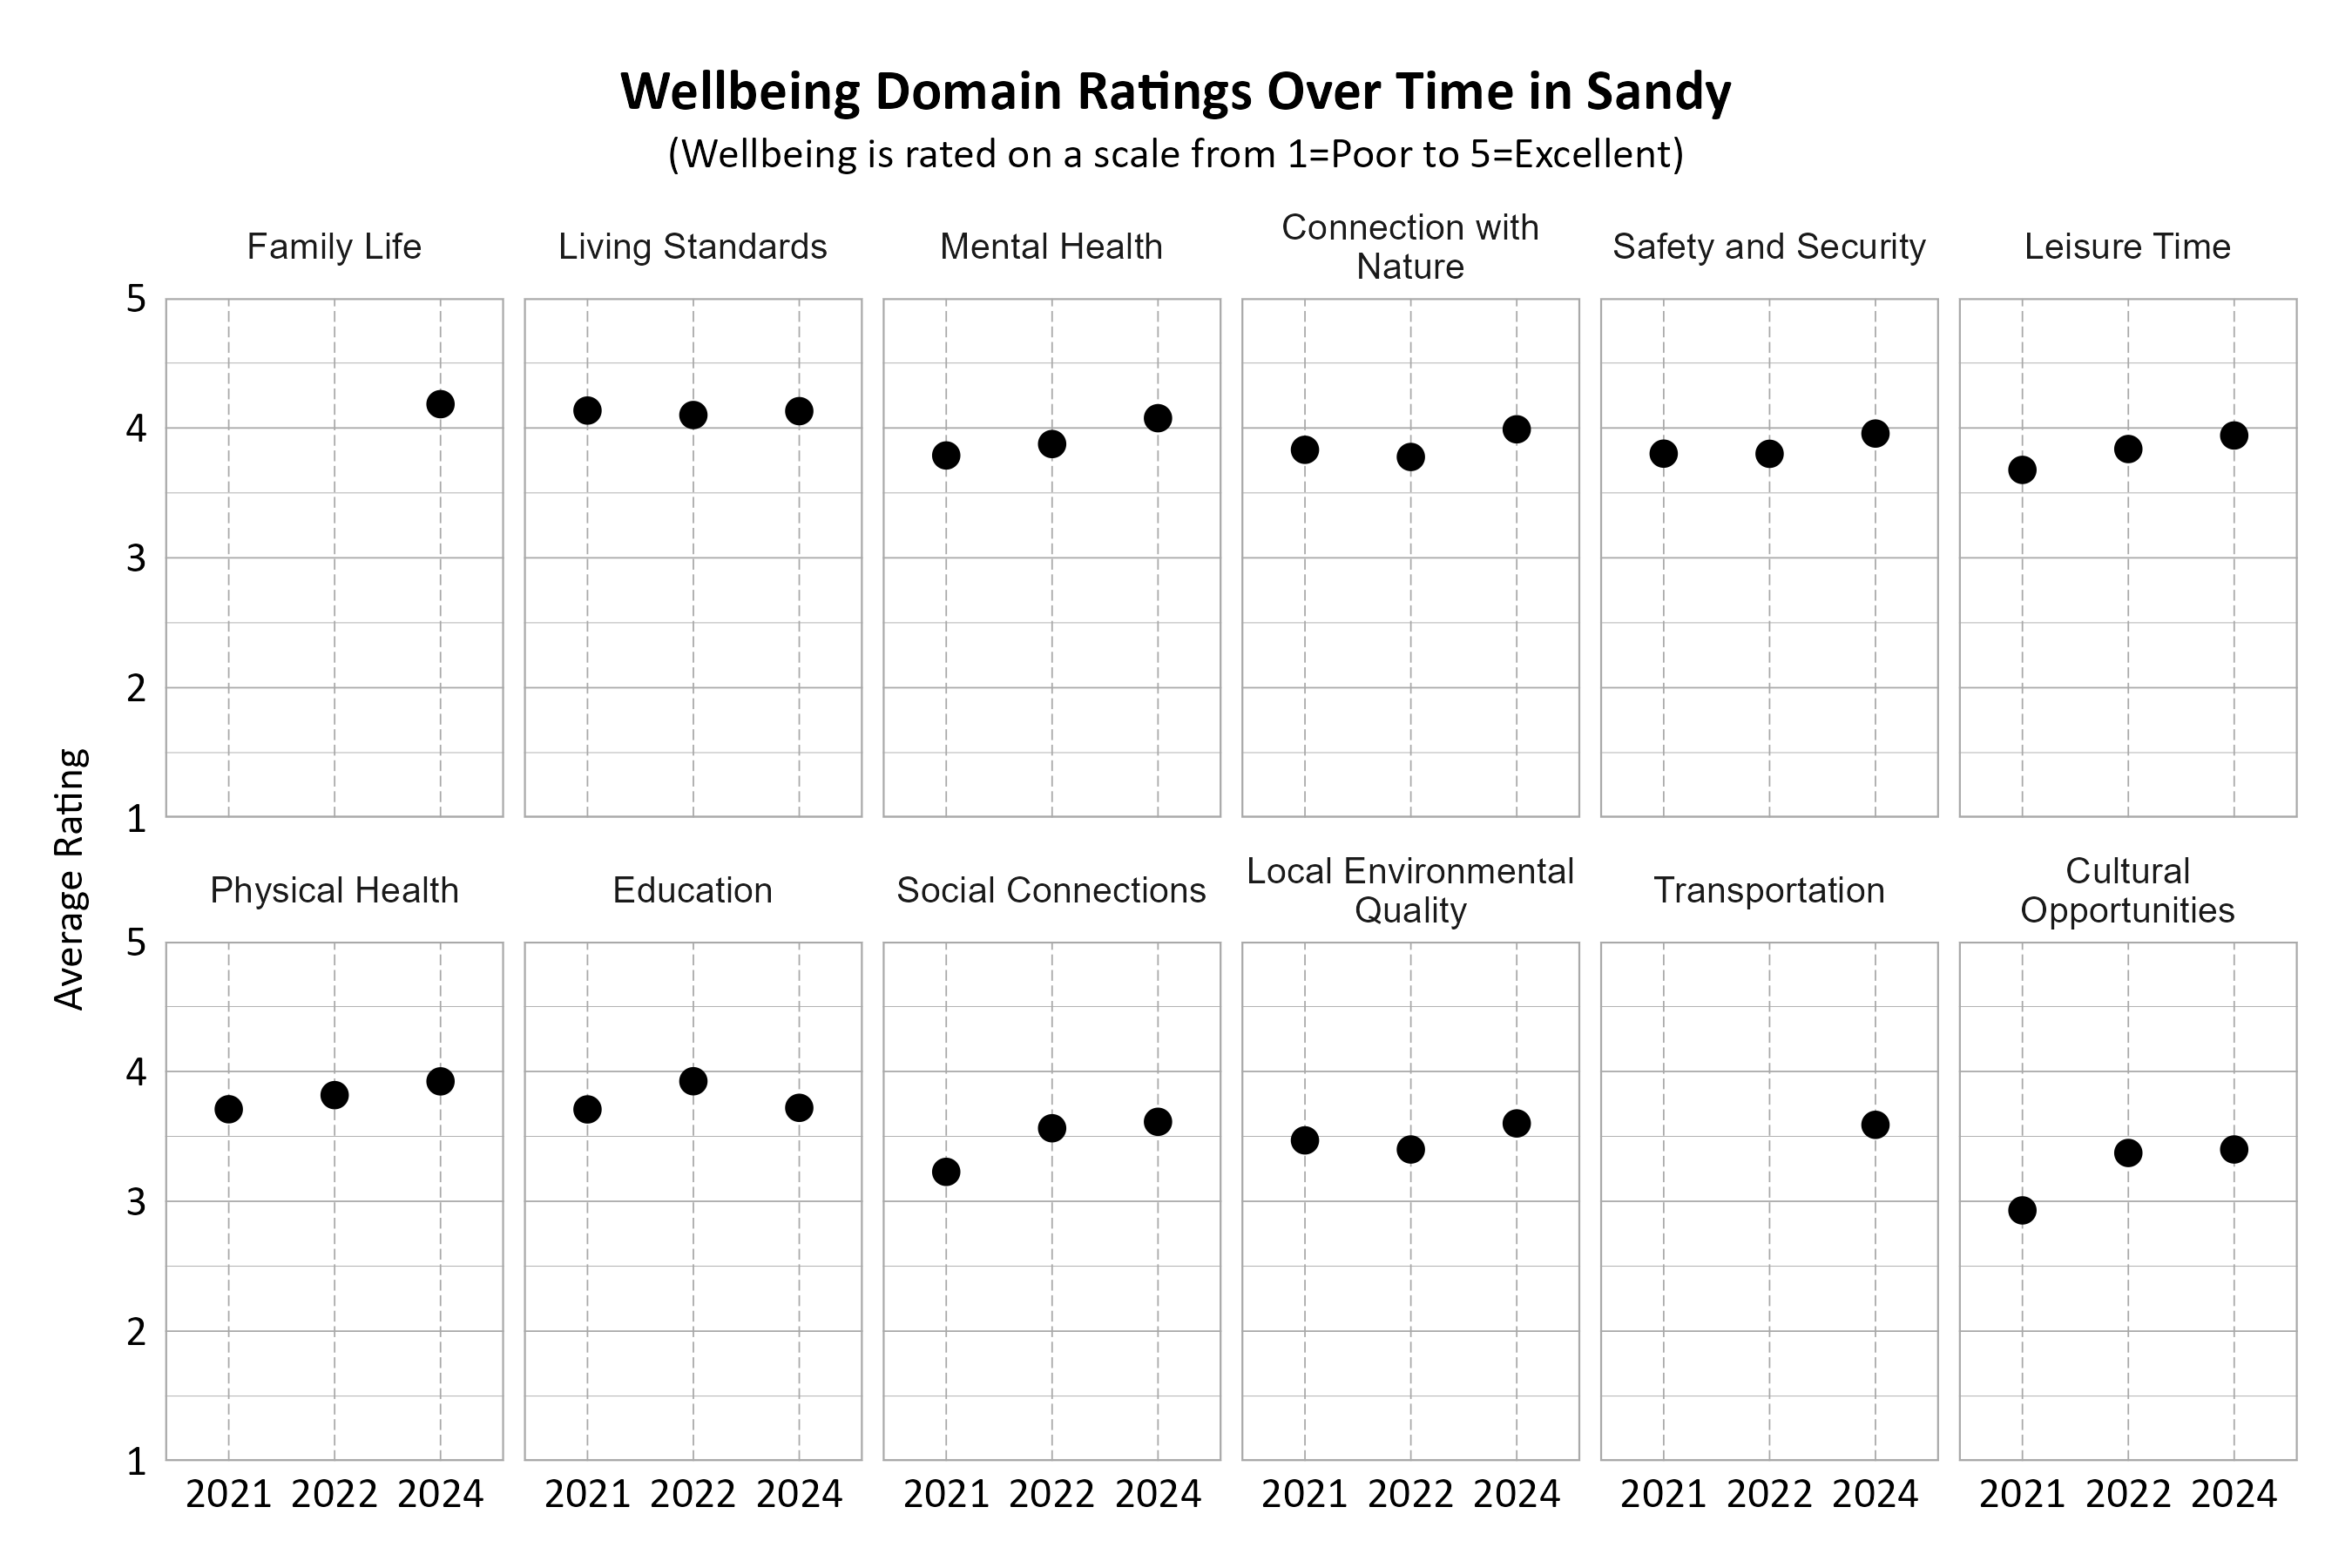
Wellbeing Domains Over Time in Sandy
The graphs below show how the domains were rated over the years by Sandy residents. The number of respondents changed over time. Note that the two domains Family Life and Transportation were new categories in the 2024 survey and were not measured in previous years. Most domains either stayed the same from 2022 to 2024 or increased in overall ratings, except for Education which decreased. Living Standards was consistently highly rated in each survey year.
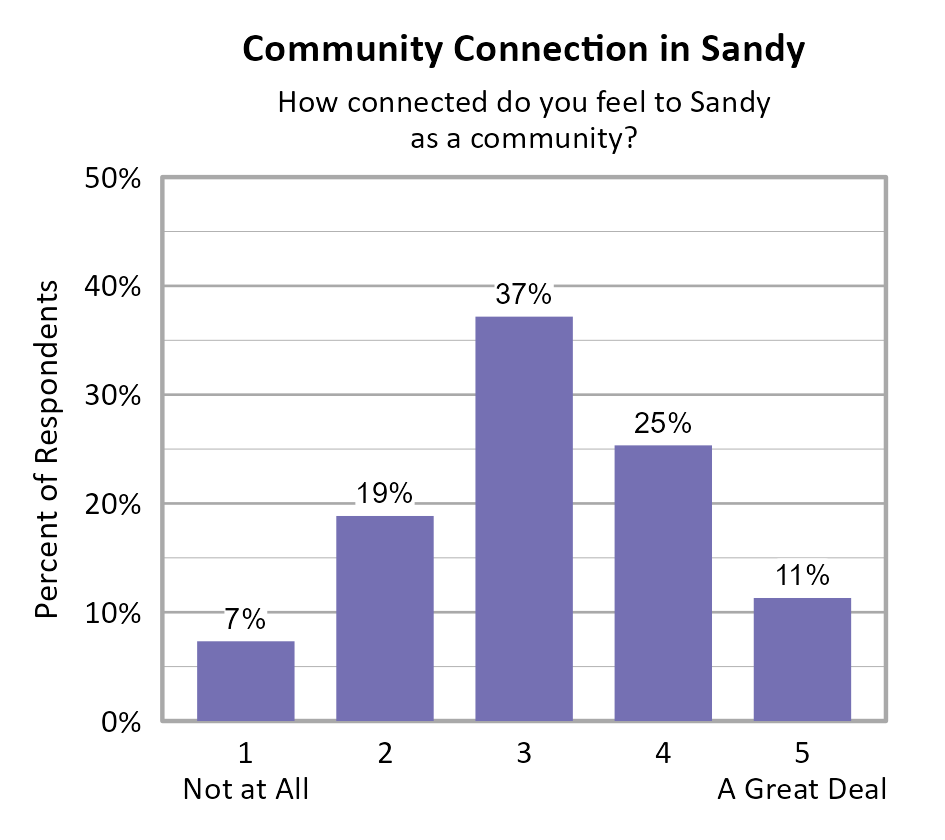
Community Connection in Sandy
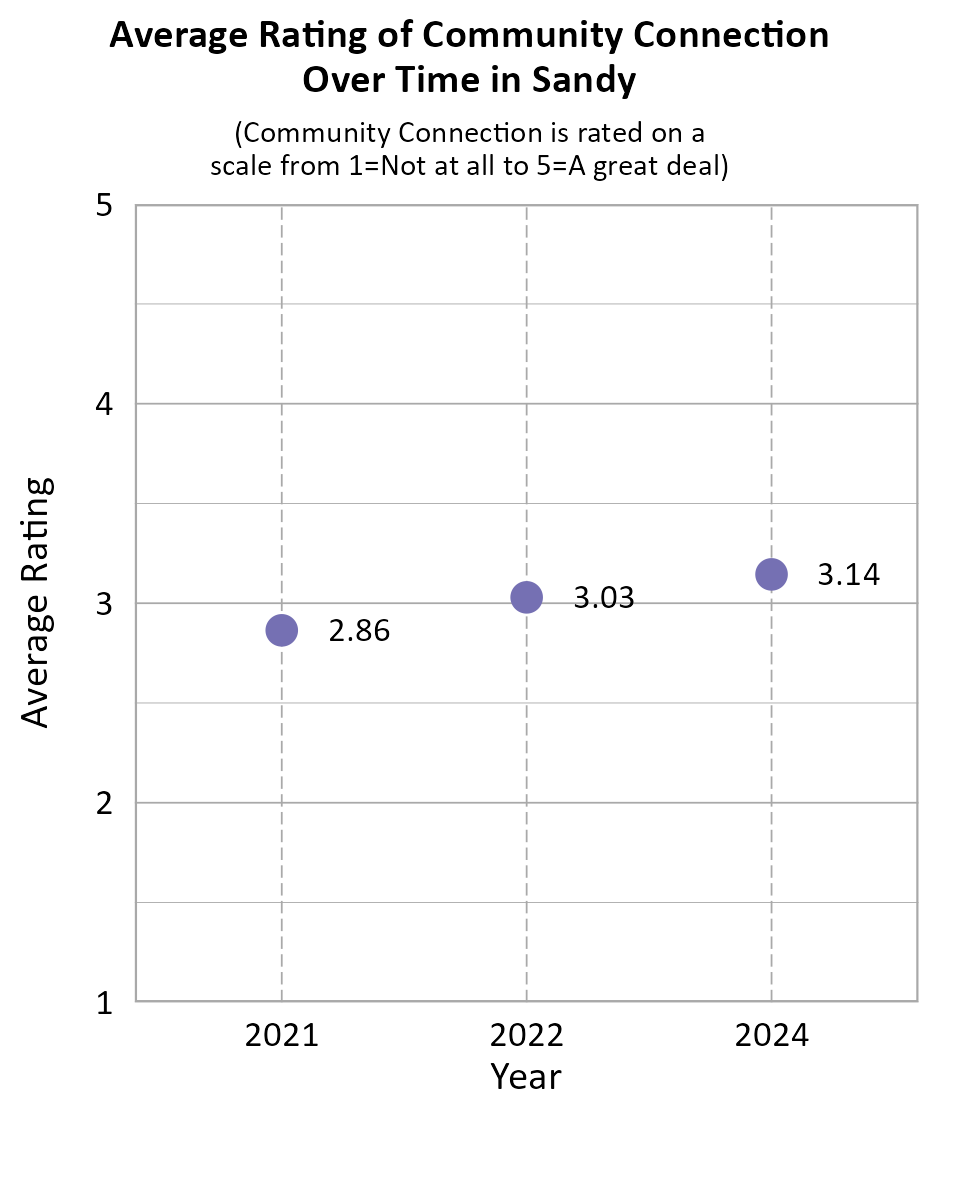
Survey participants were asked about how connected they feel to Sandy on a 5-point scale from not at all (1) to a great deal (5), and the average score of all respondents was 3.14. No statistically significant differences were found for community connection scores among the 4 council districts in Sandy.
When comparing survey data from Sandy over the years as shown in the information below, we can see that the average community connection score has increased in each survey year.
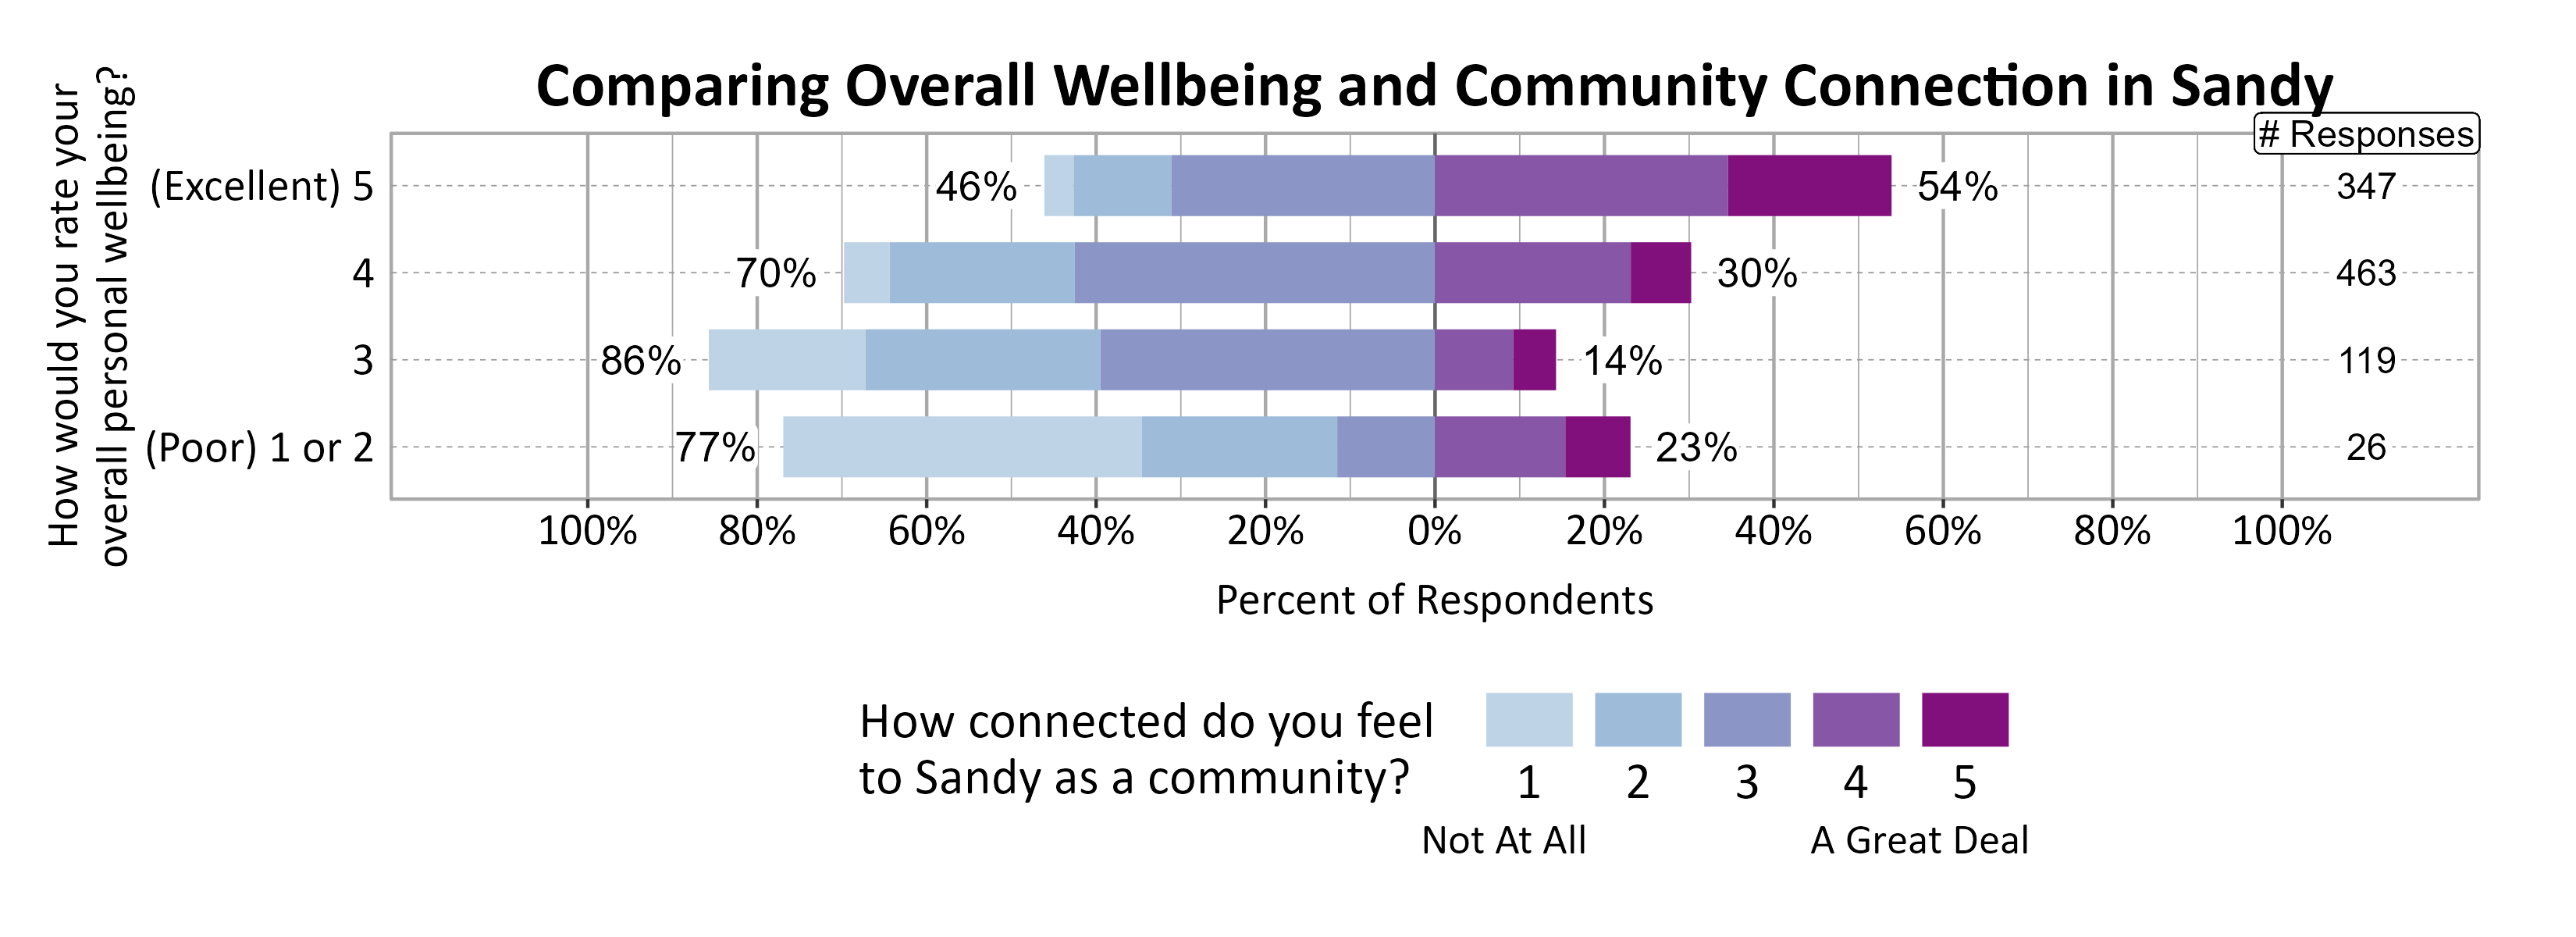
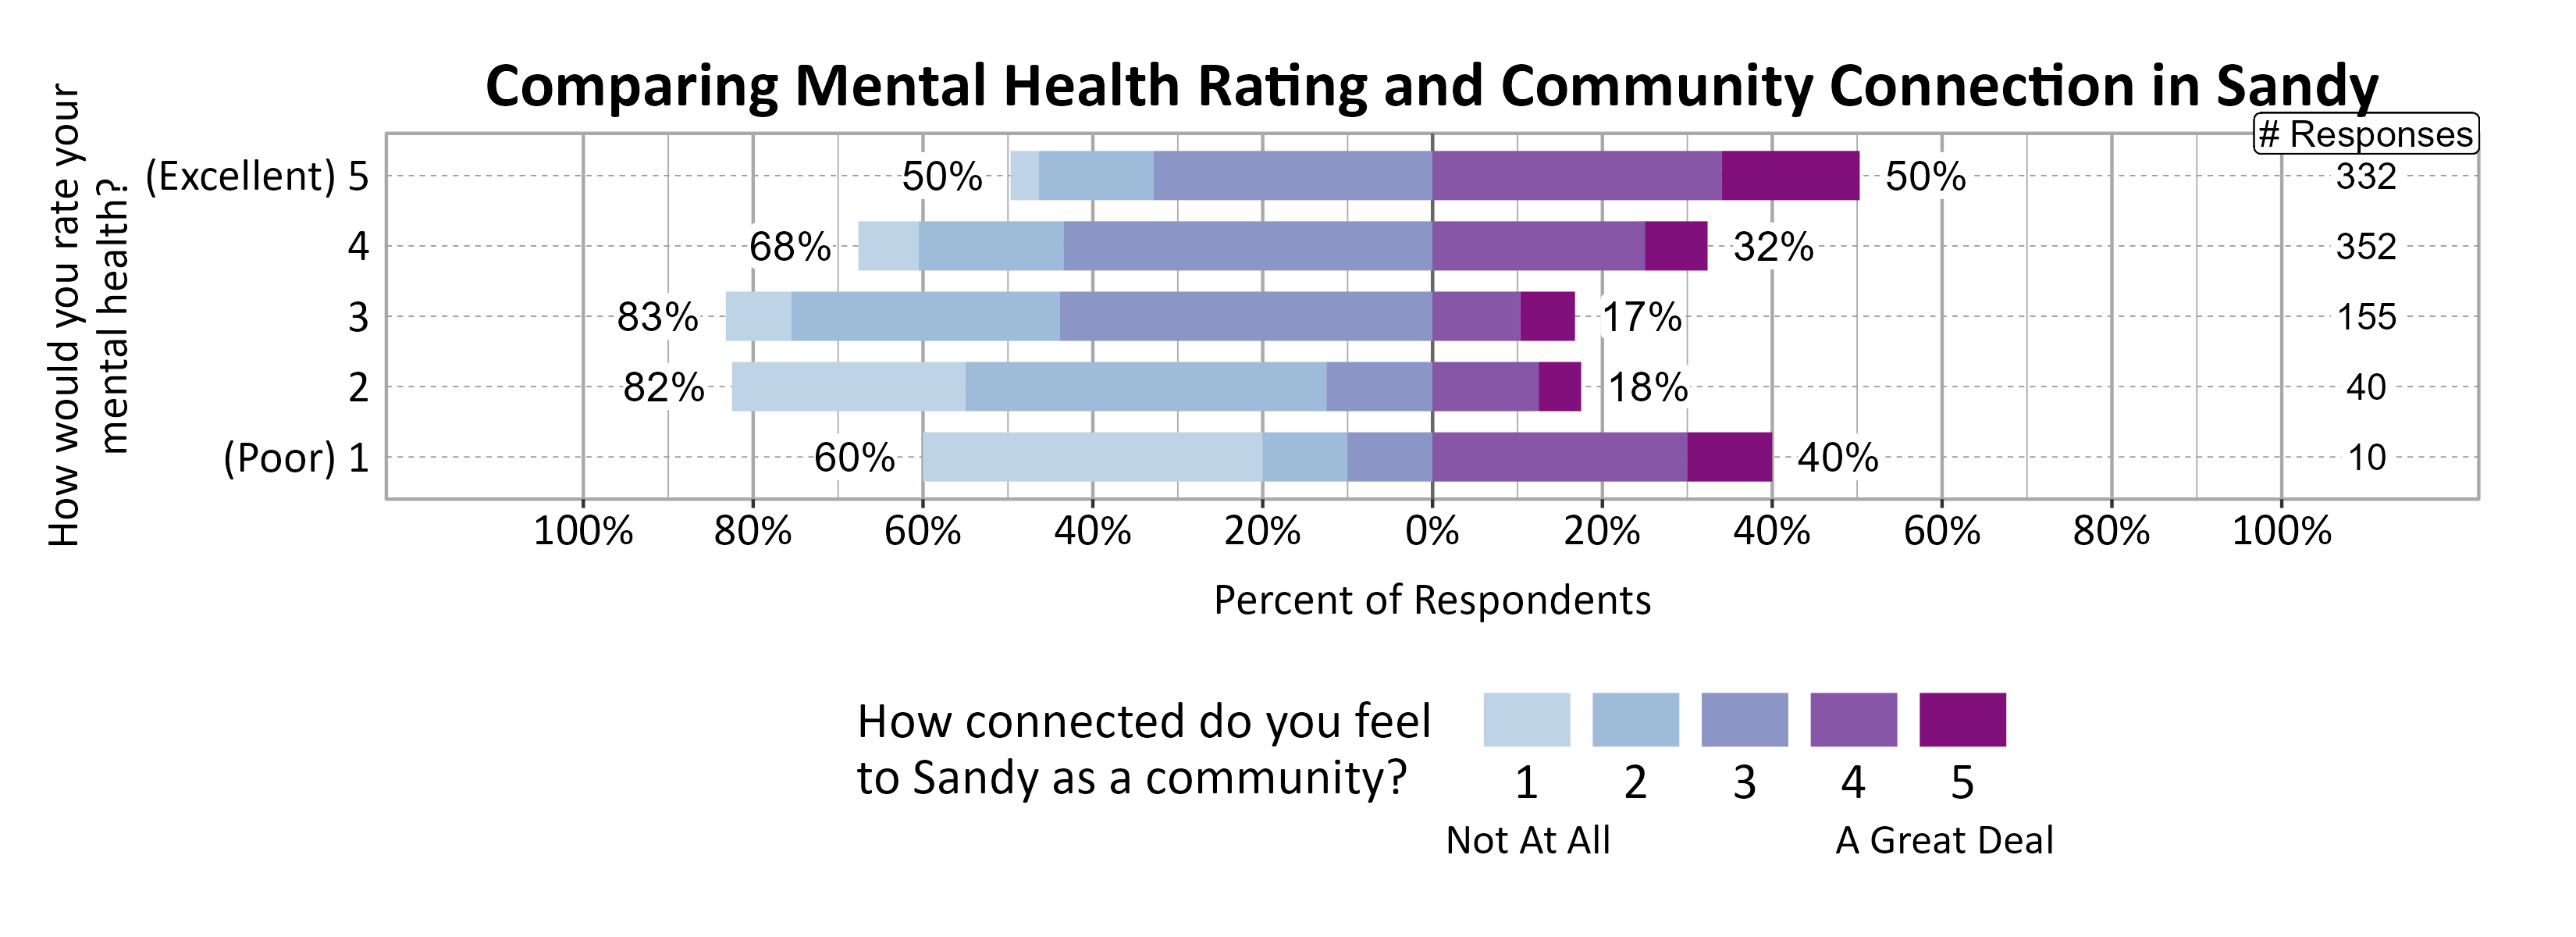
To some extent, a positive relationship was found between individuals’ community connection and overall personal wellbeing as well as mental health (with the exemption of the lowest scores).
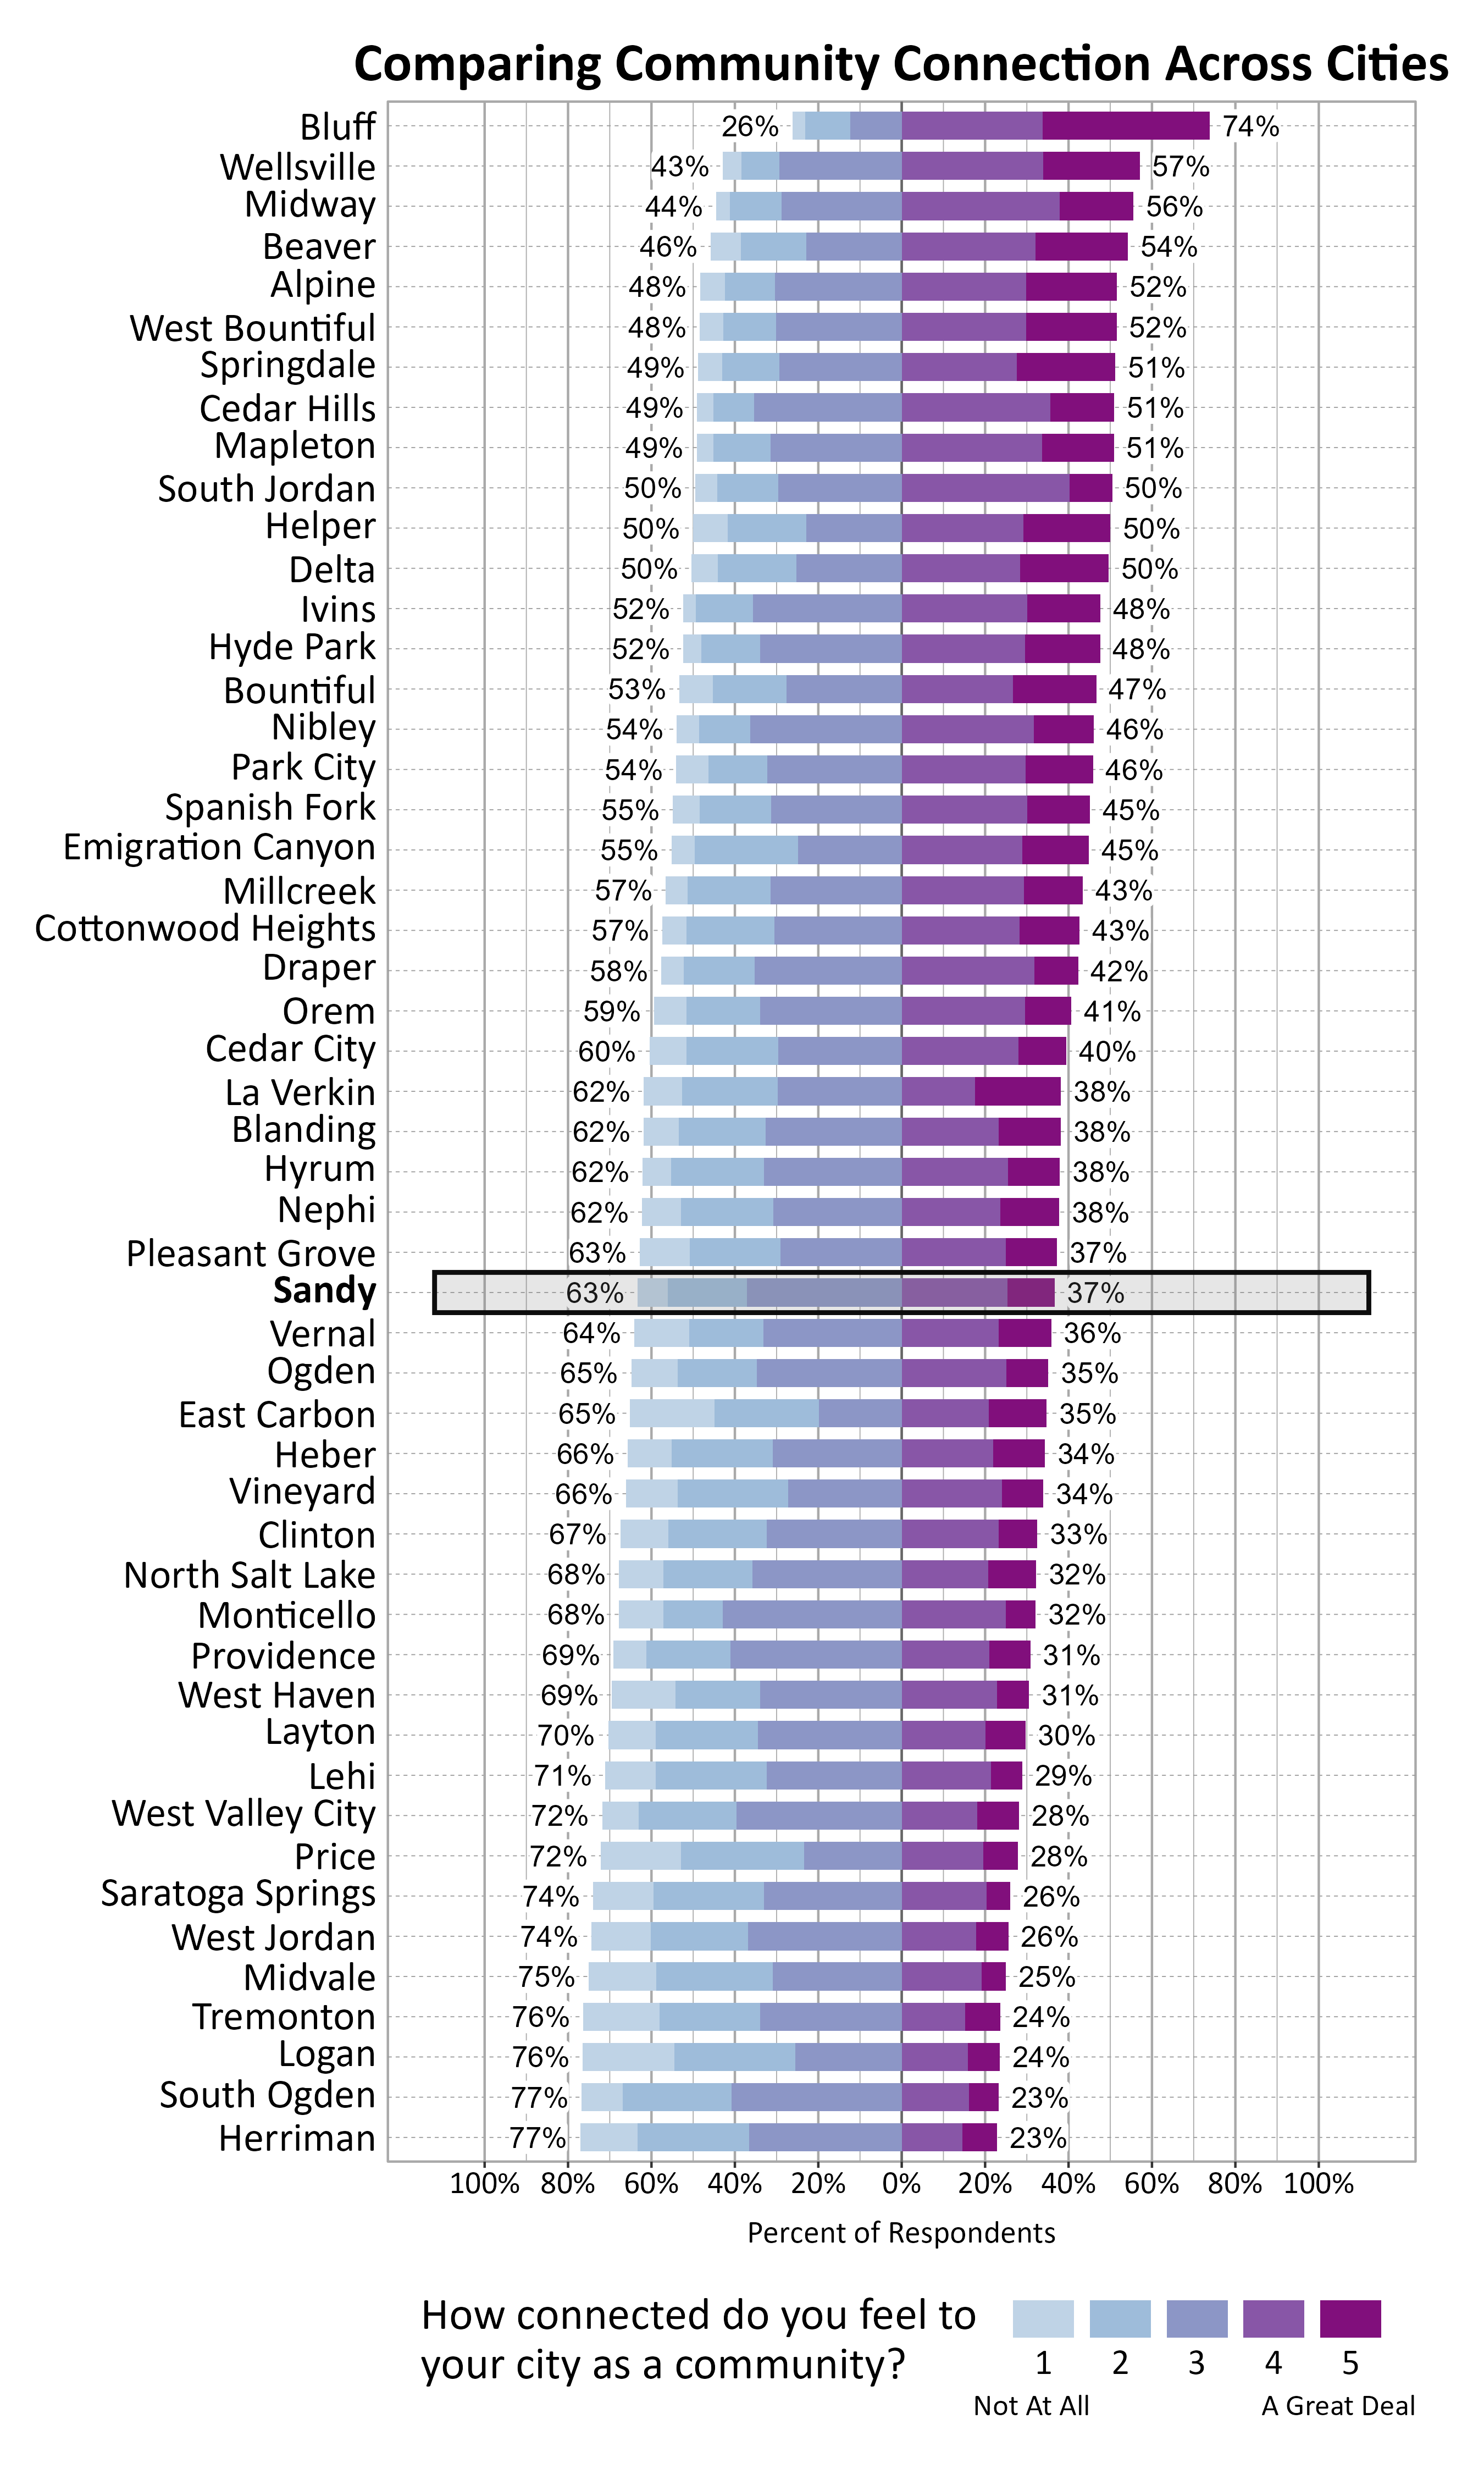
The graph below shows how Wellbeing Project cities and towns compare on feelings of community connection based on the percentage of respondents who answered 4 or a 5 on a 5-point scale from “not at all” to “a great deal” connected to their city or town. Sandy ranked 30 out of the 51 cities that participated.
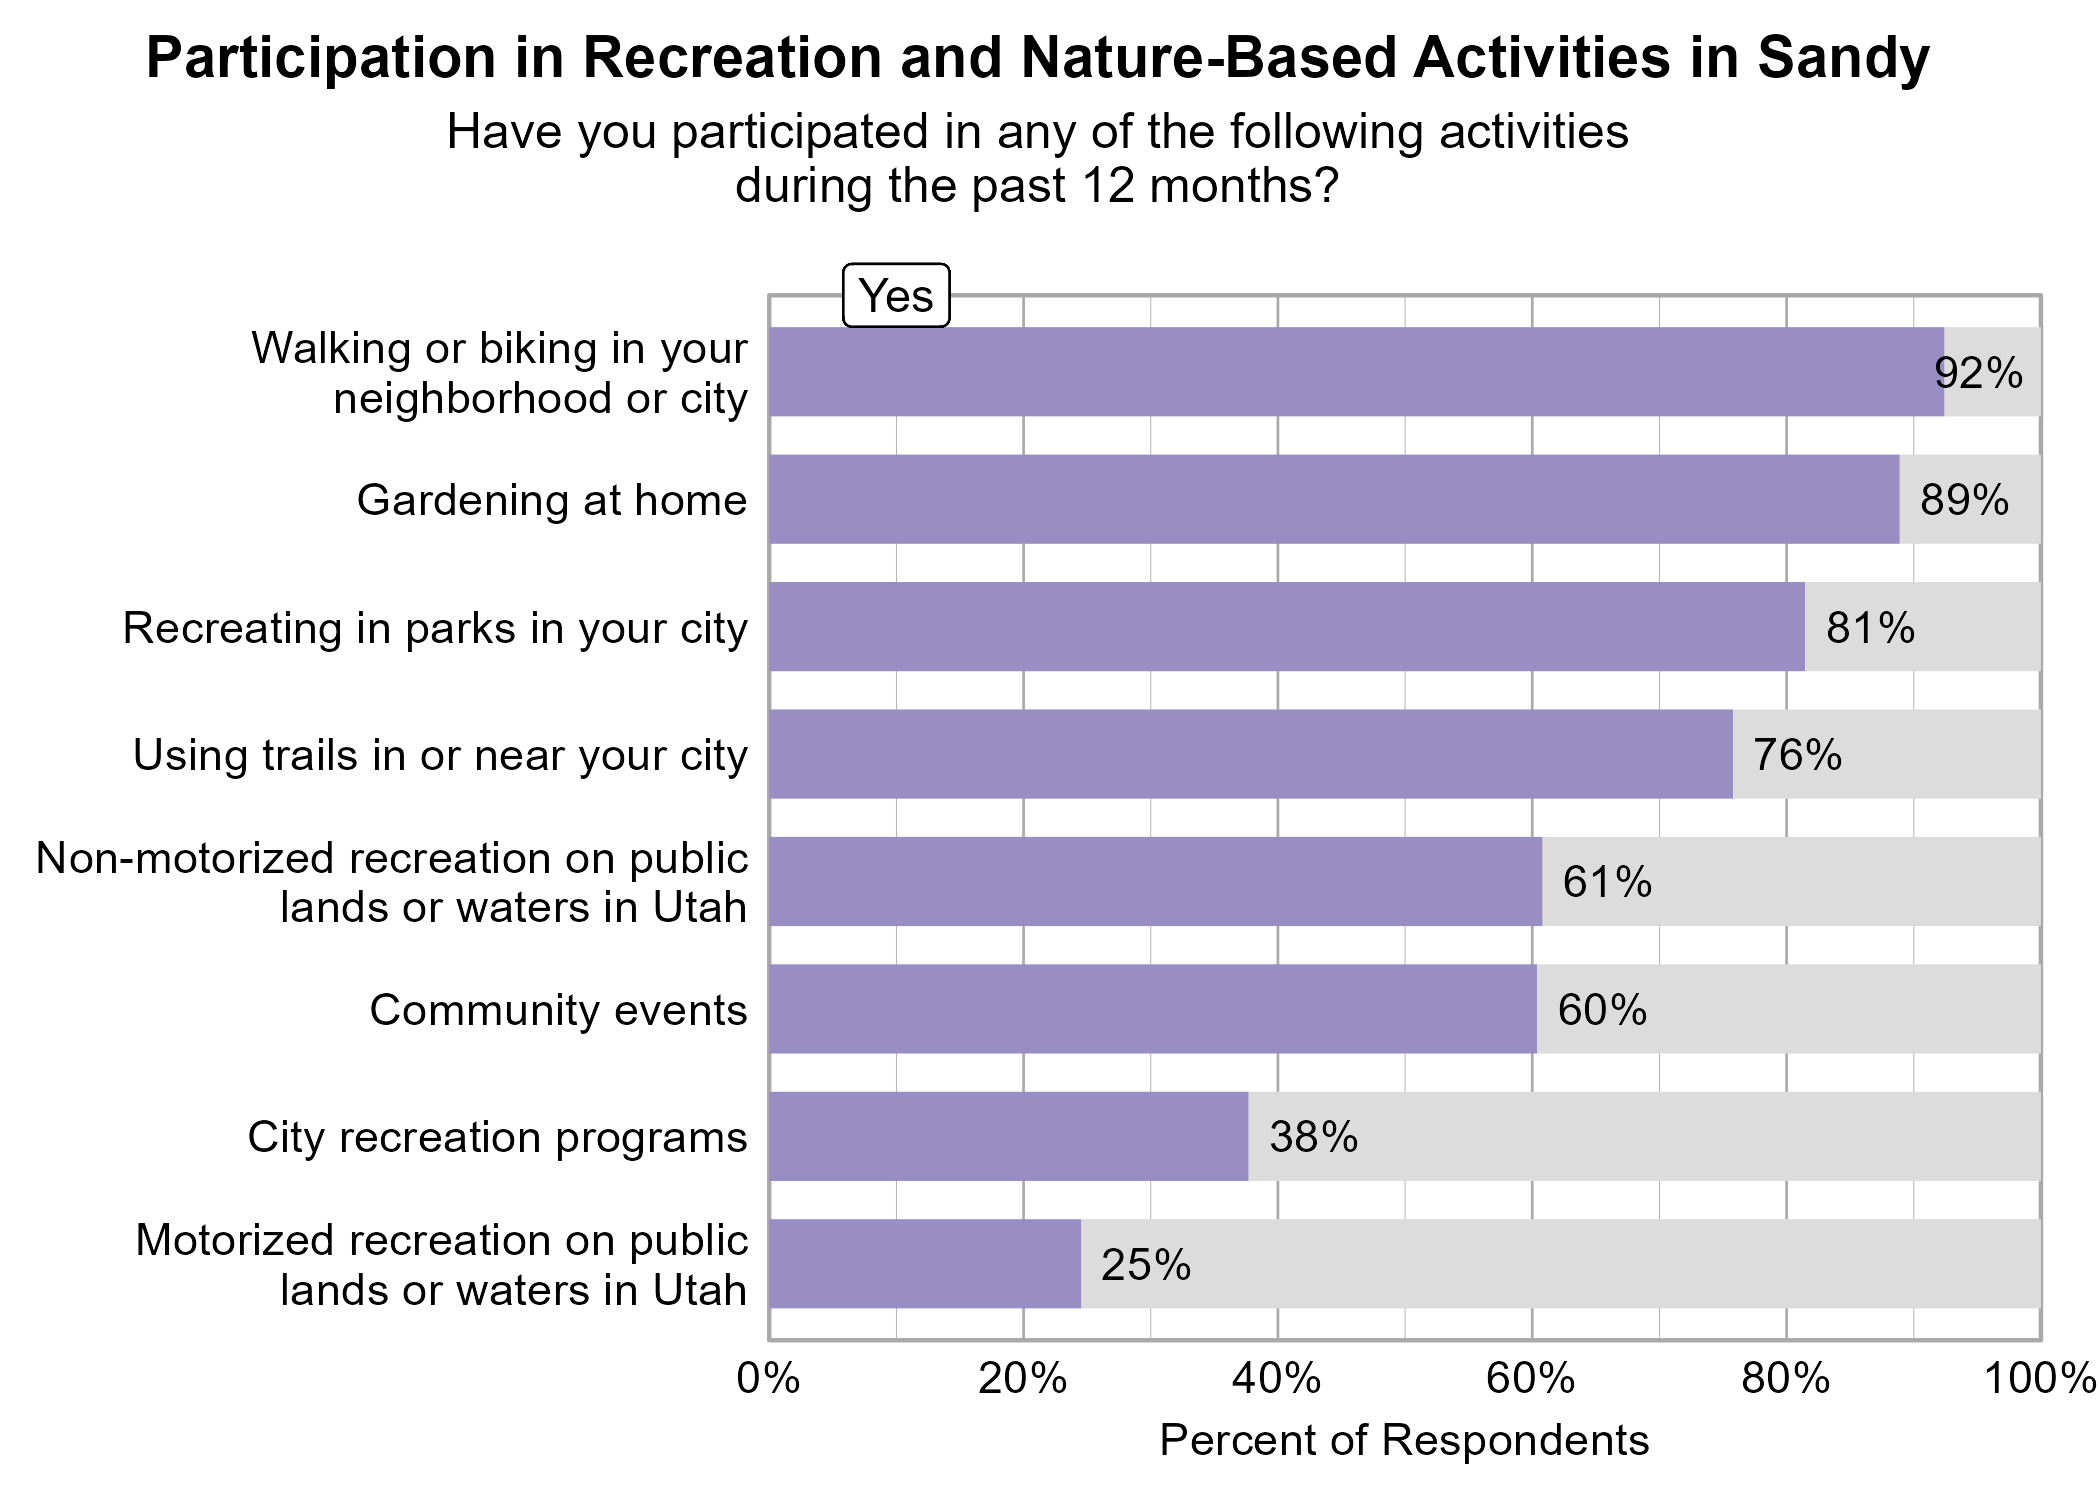
Participation in Recreation and Nature-Related Activities
Respondents were asked to indicate whether or not they participated in various activities in the last 12 months. The most popular activities were walking or biking in your neighborhood or city (92%), gardening at home (89%), and recreating in parks in your city (81%).
Participating in community events, recreating in parks in your city, using trails in or near your city, and walking or biking in your neighborhood or city were significantly related to higher ratings of personal wellbeing.
Participating in community events and walking or biking in your neighborhood or city were significantly related to higher ratings of community wellbeing.
Participating in city recreation programs, participating in community events, gardening at home, and recreating in parks in your city were significantly related to higher ratings of community connection.
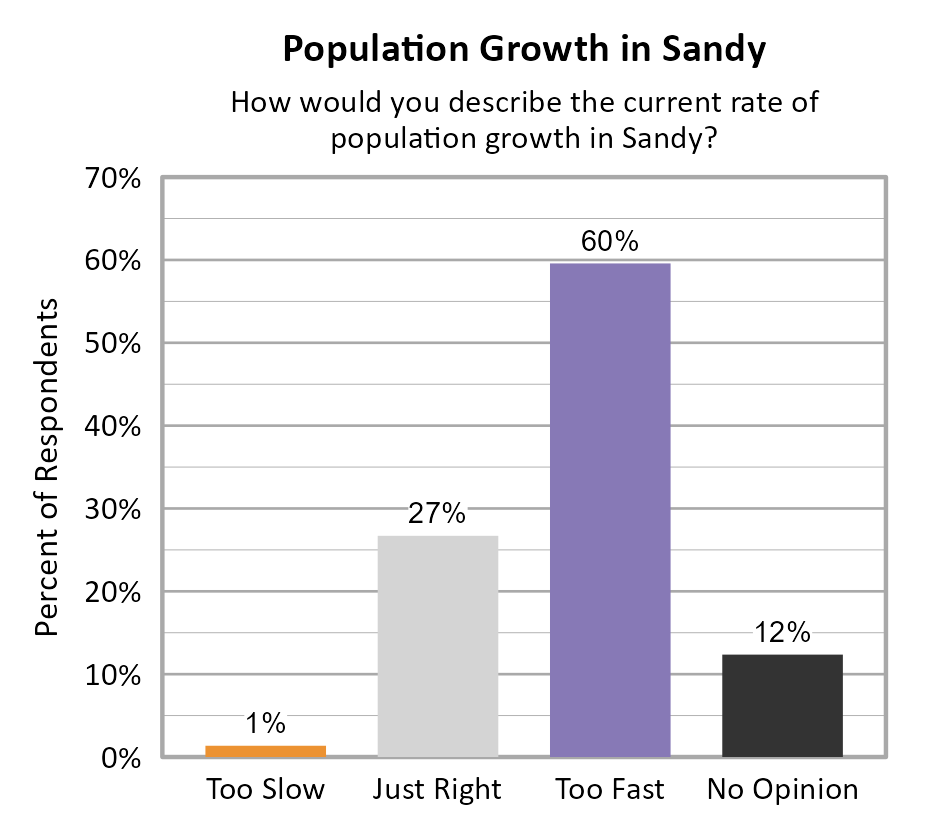
Perspectives on Population Growth and Economic Development
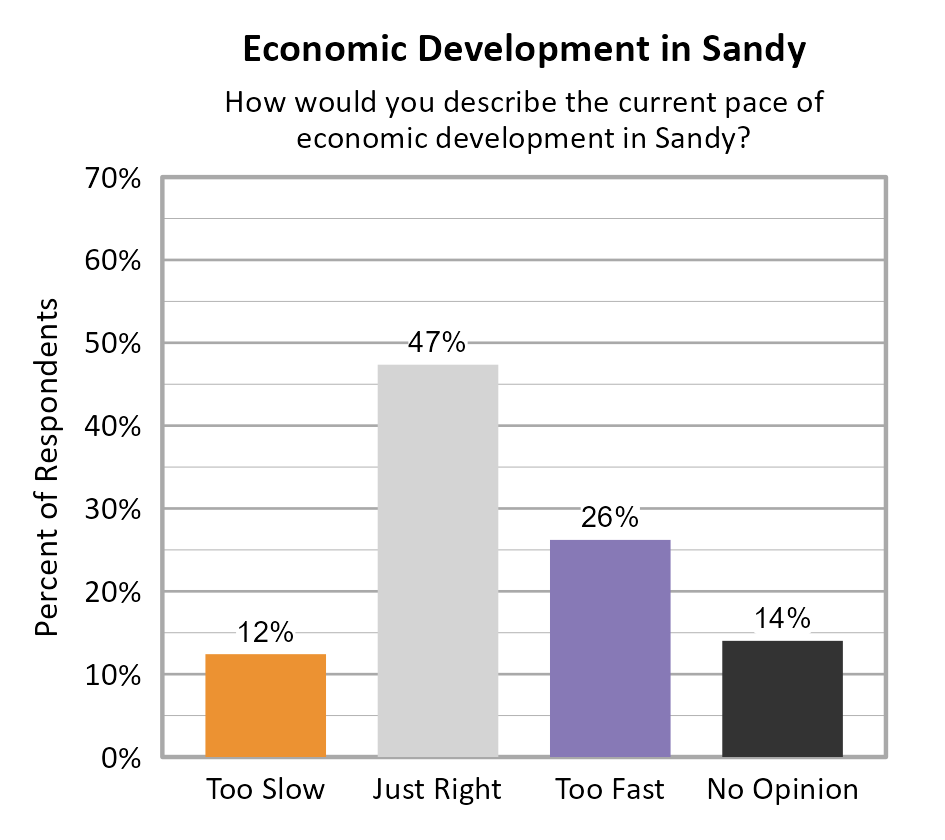
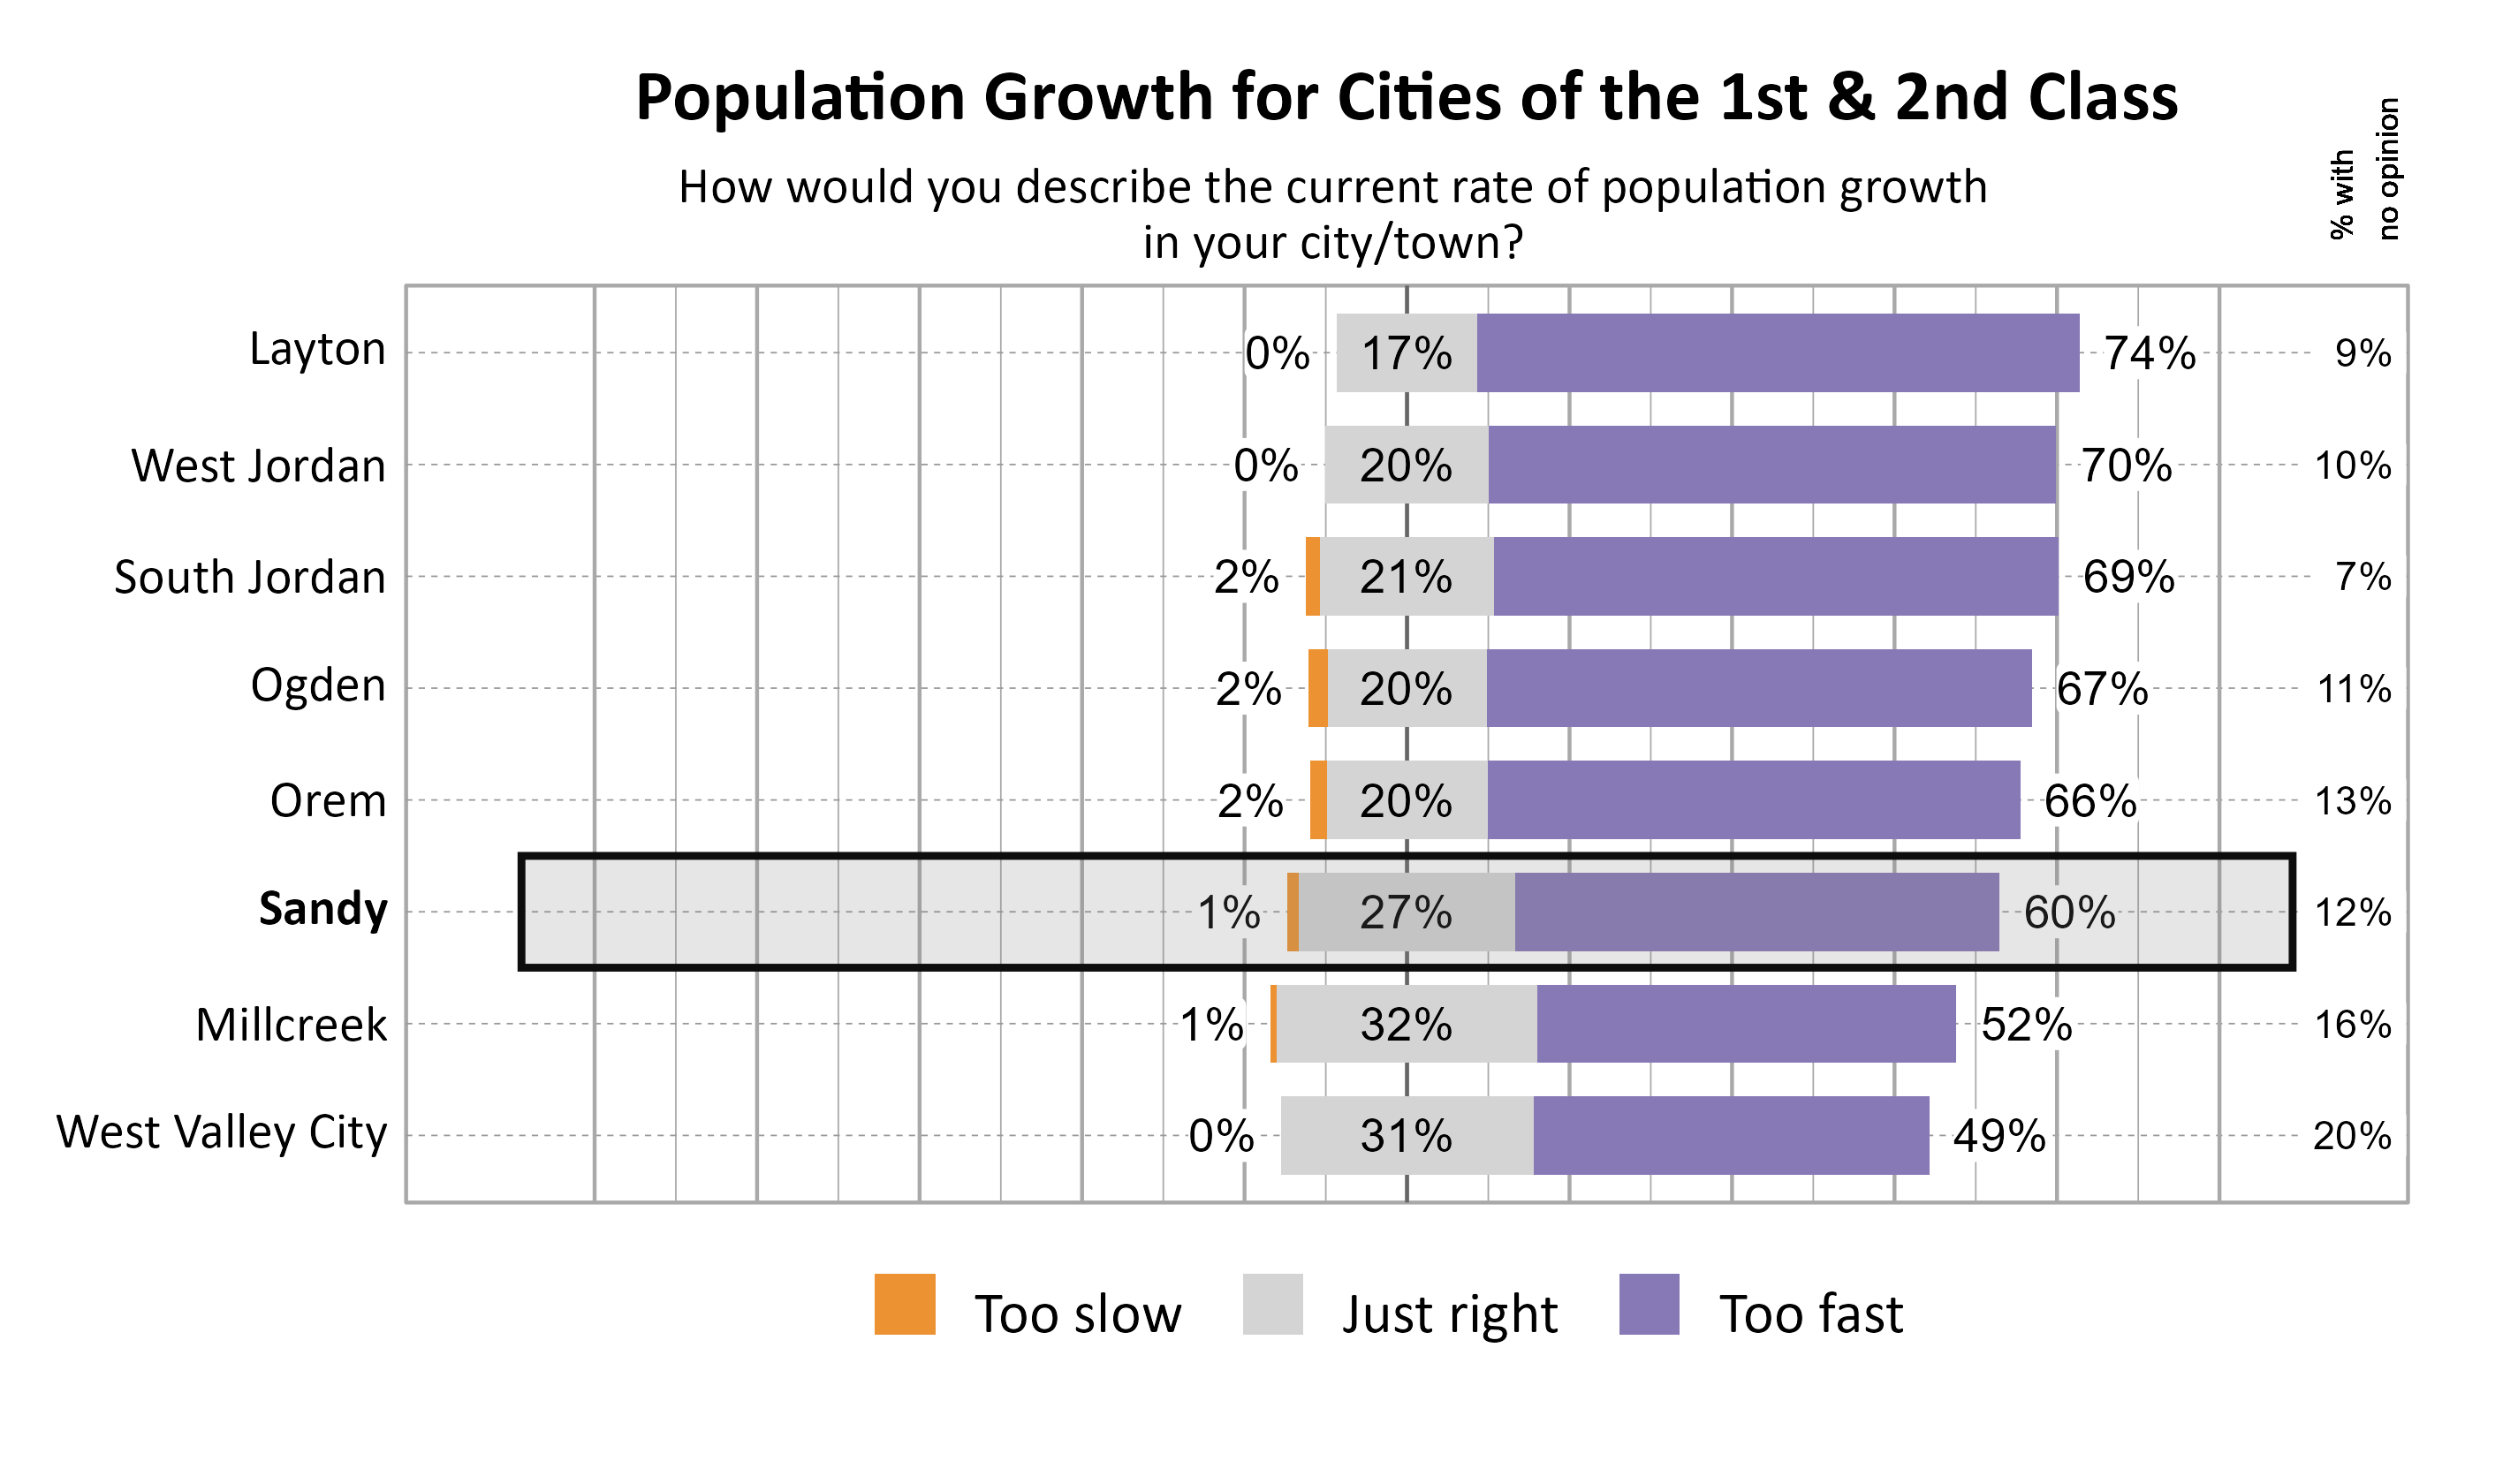
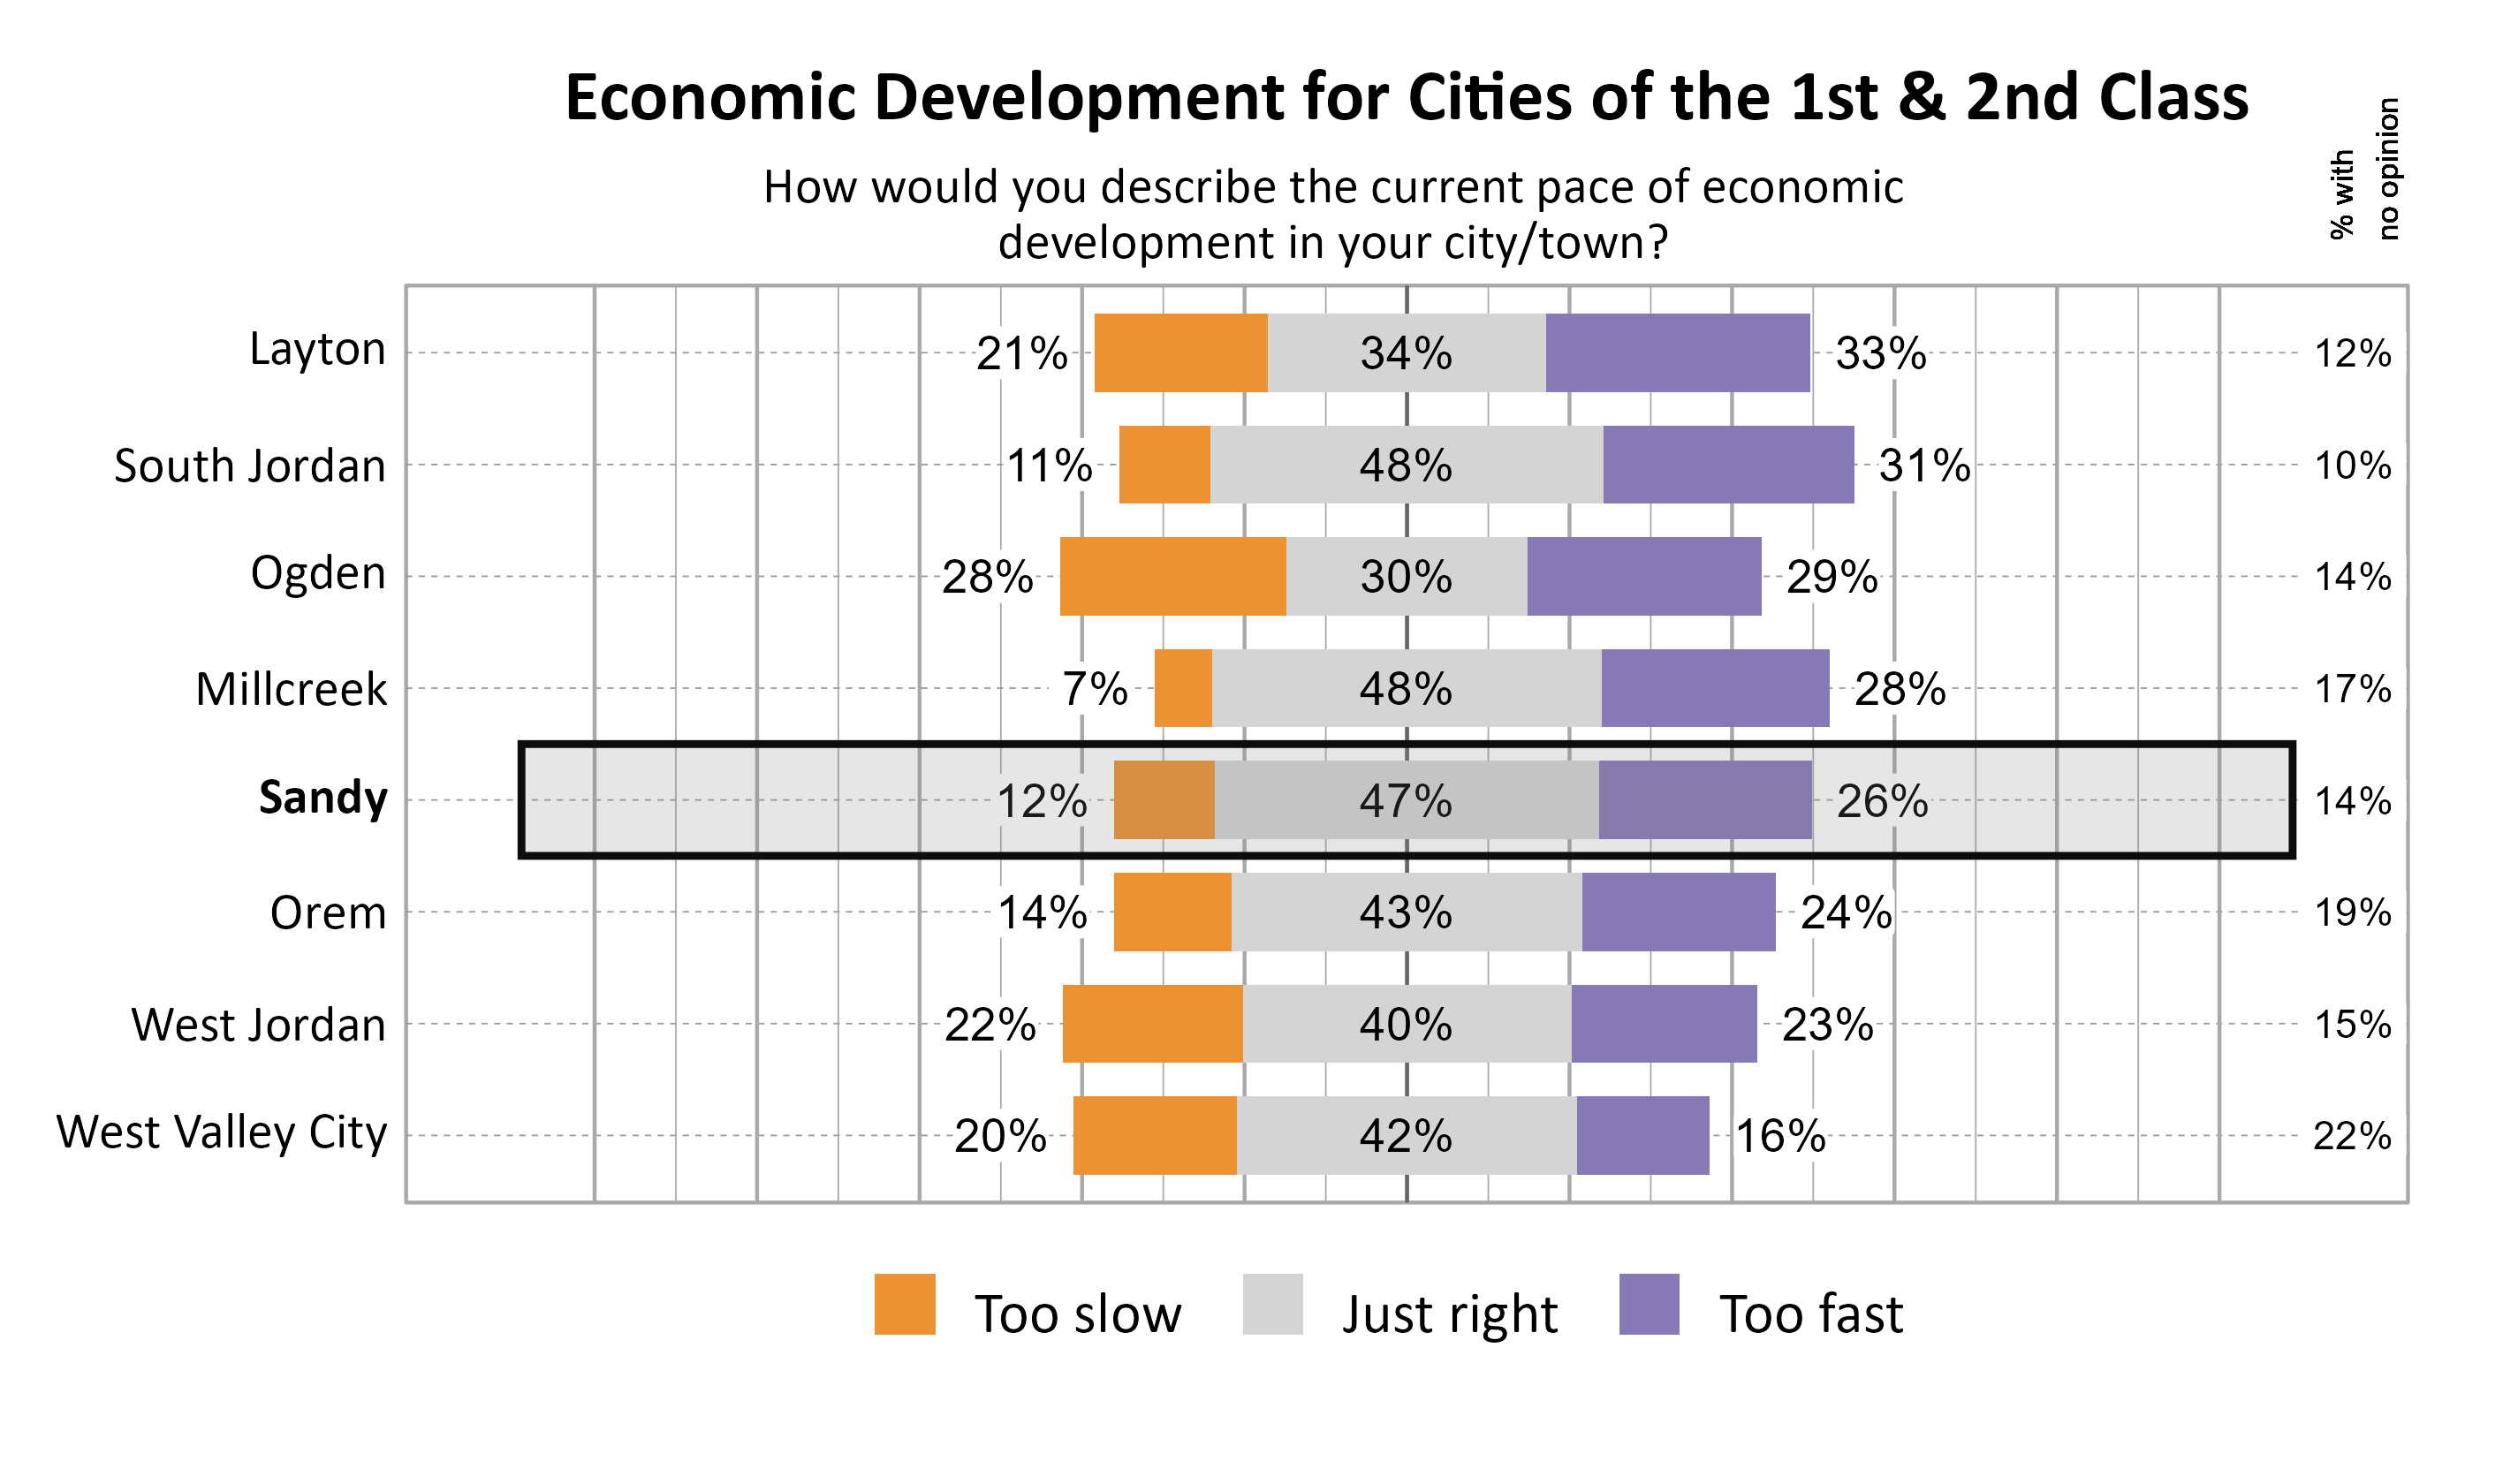
The majority of respondents in Sandy indicated that they felt the population growth was too fast (60%). For the pace of economic development, the largest proportion of respondents indicated that it was just right (47%).
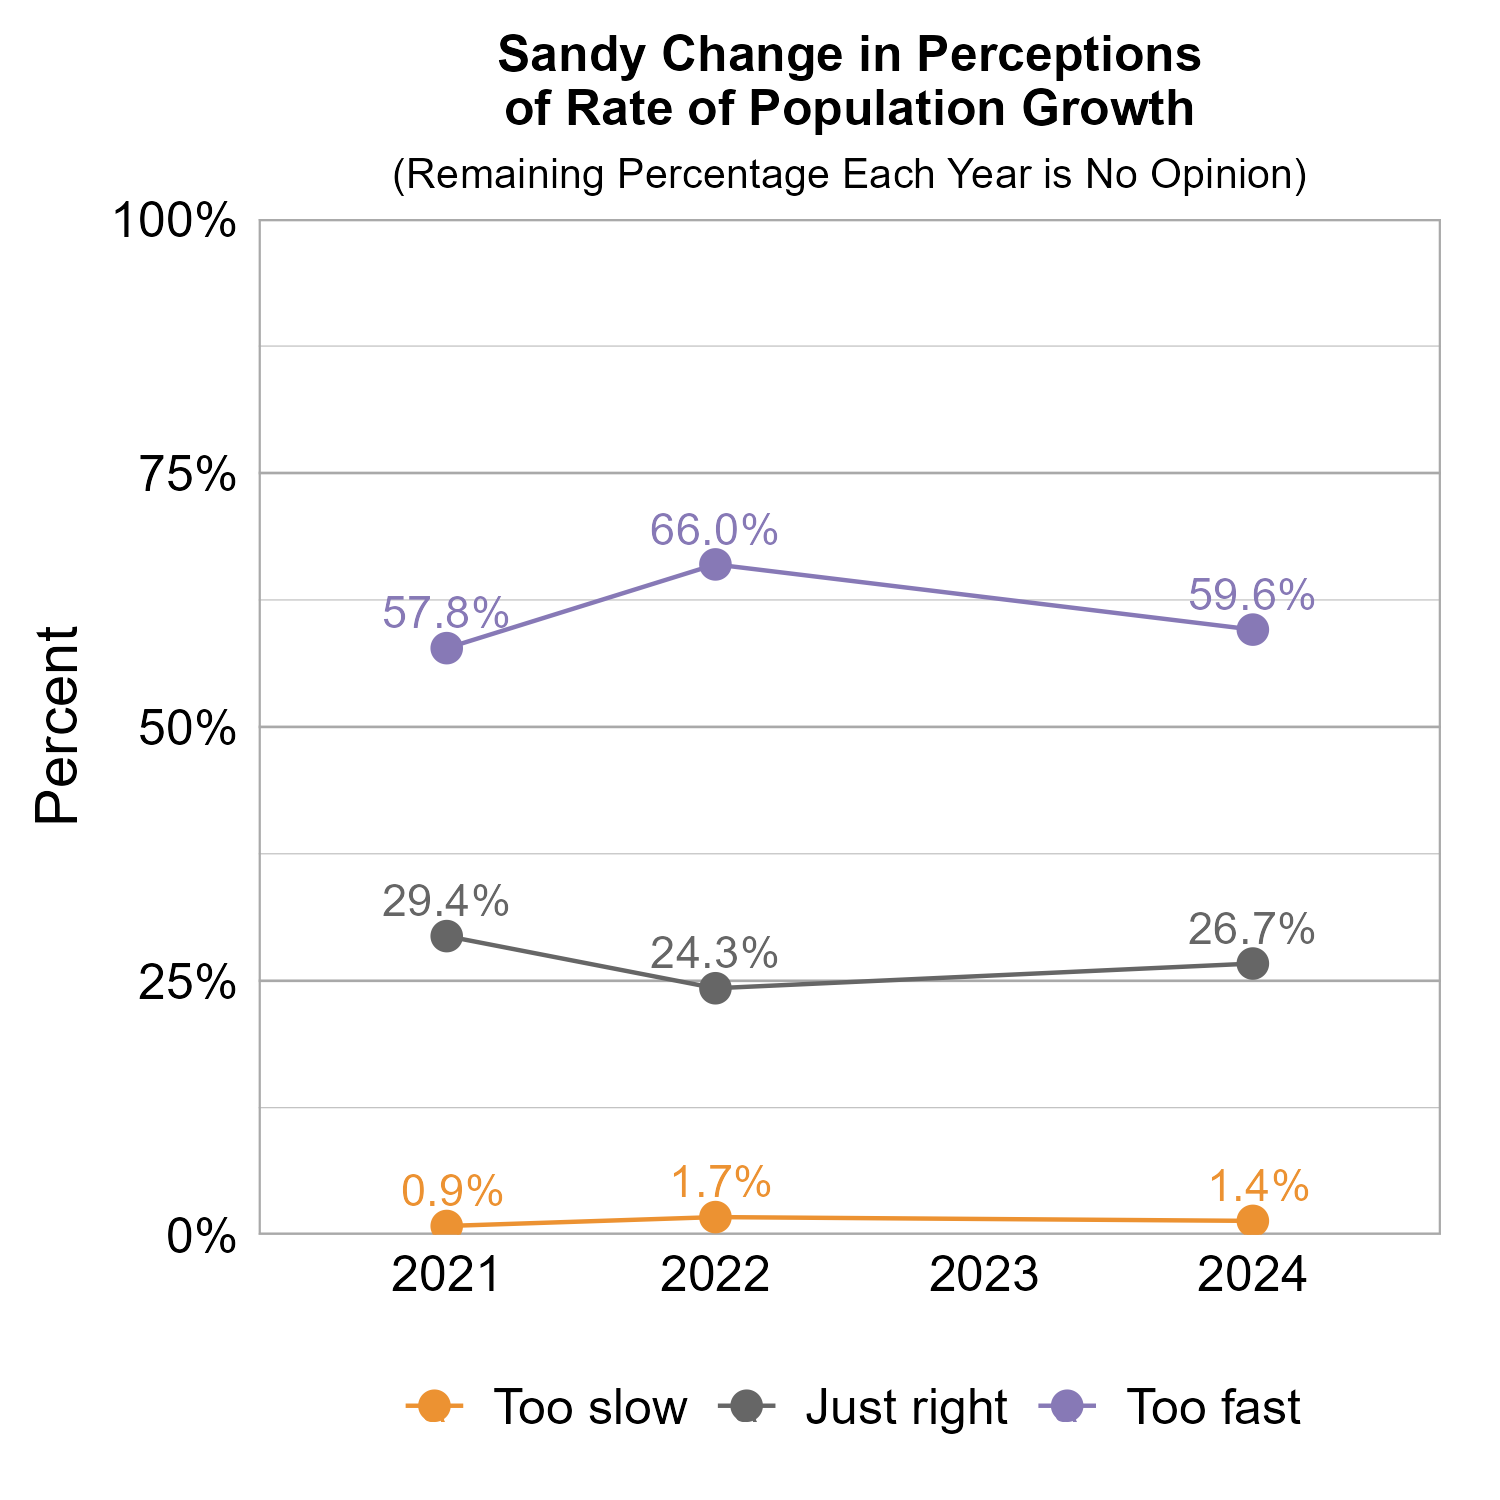
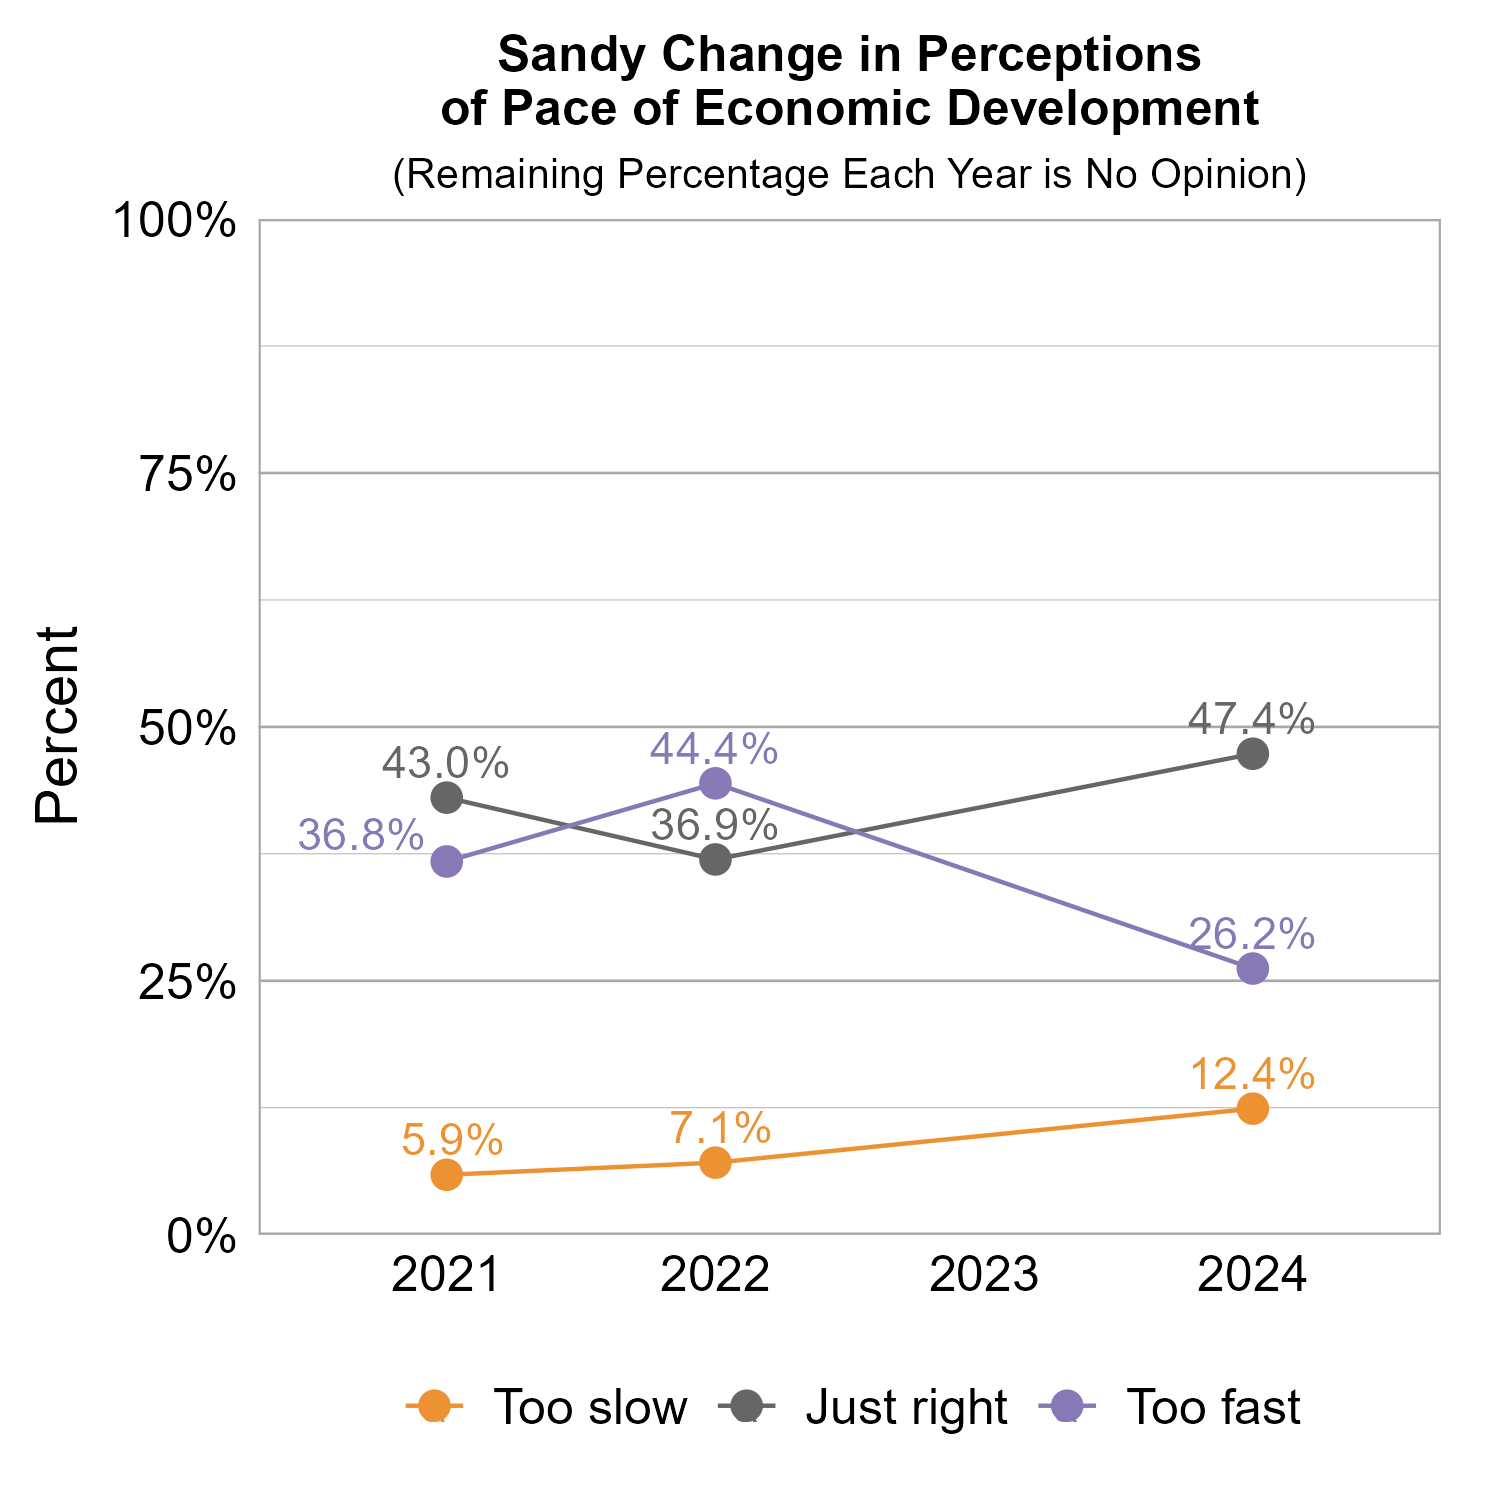
The graphs below show how perceptions of population growth and economic development in Sandy have varied across recent years of Wellbeing Surveys. The majority of respondents have indicated that the rate of population growth is too fast over the survey years. The largest proportion of respondents have switched between perceptions that the pace of economic development is just right and too fast over the survey years. In the 2024 survey, nearly half of the respondents indicated that the pace of economic growth is just right.
The graphs below show perceptions of population growth and economic development for Sandy compared to other participating cities and towns in the Cities of the 1st & 2nd Class cluster.
The graph below illustrates how many respondents perceived the pace of economic development as too slow, just right, too fast, or had no opinion, with additional breakdowns for the number of respondents who provided comments.
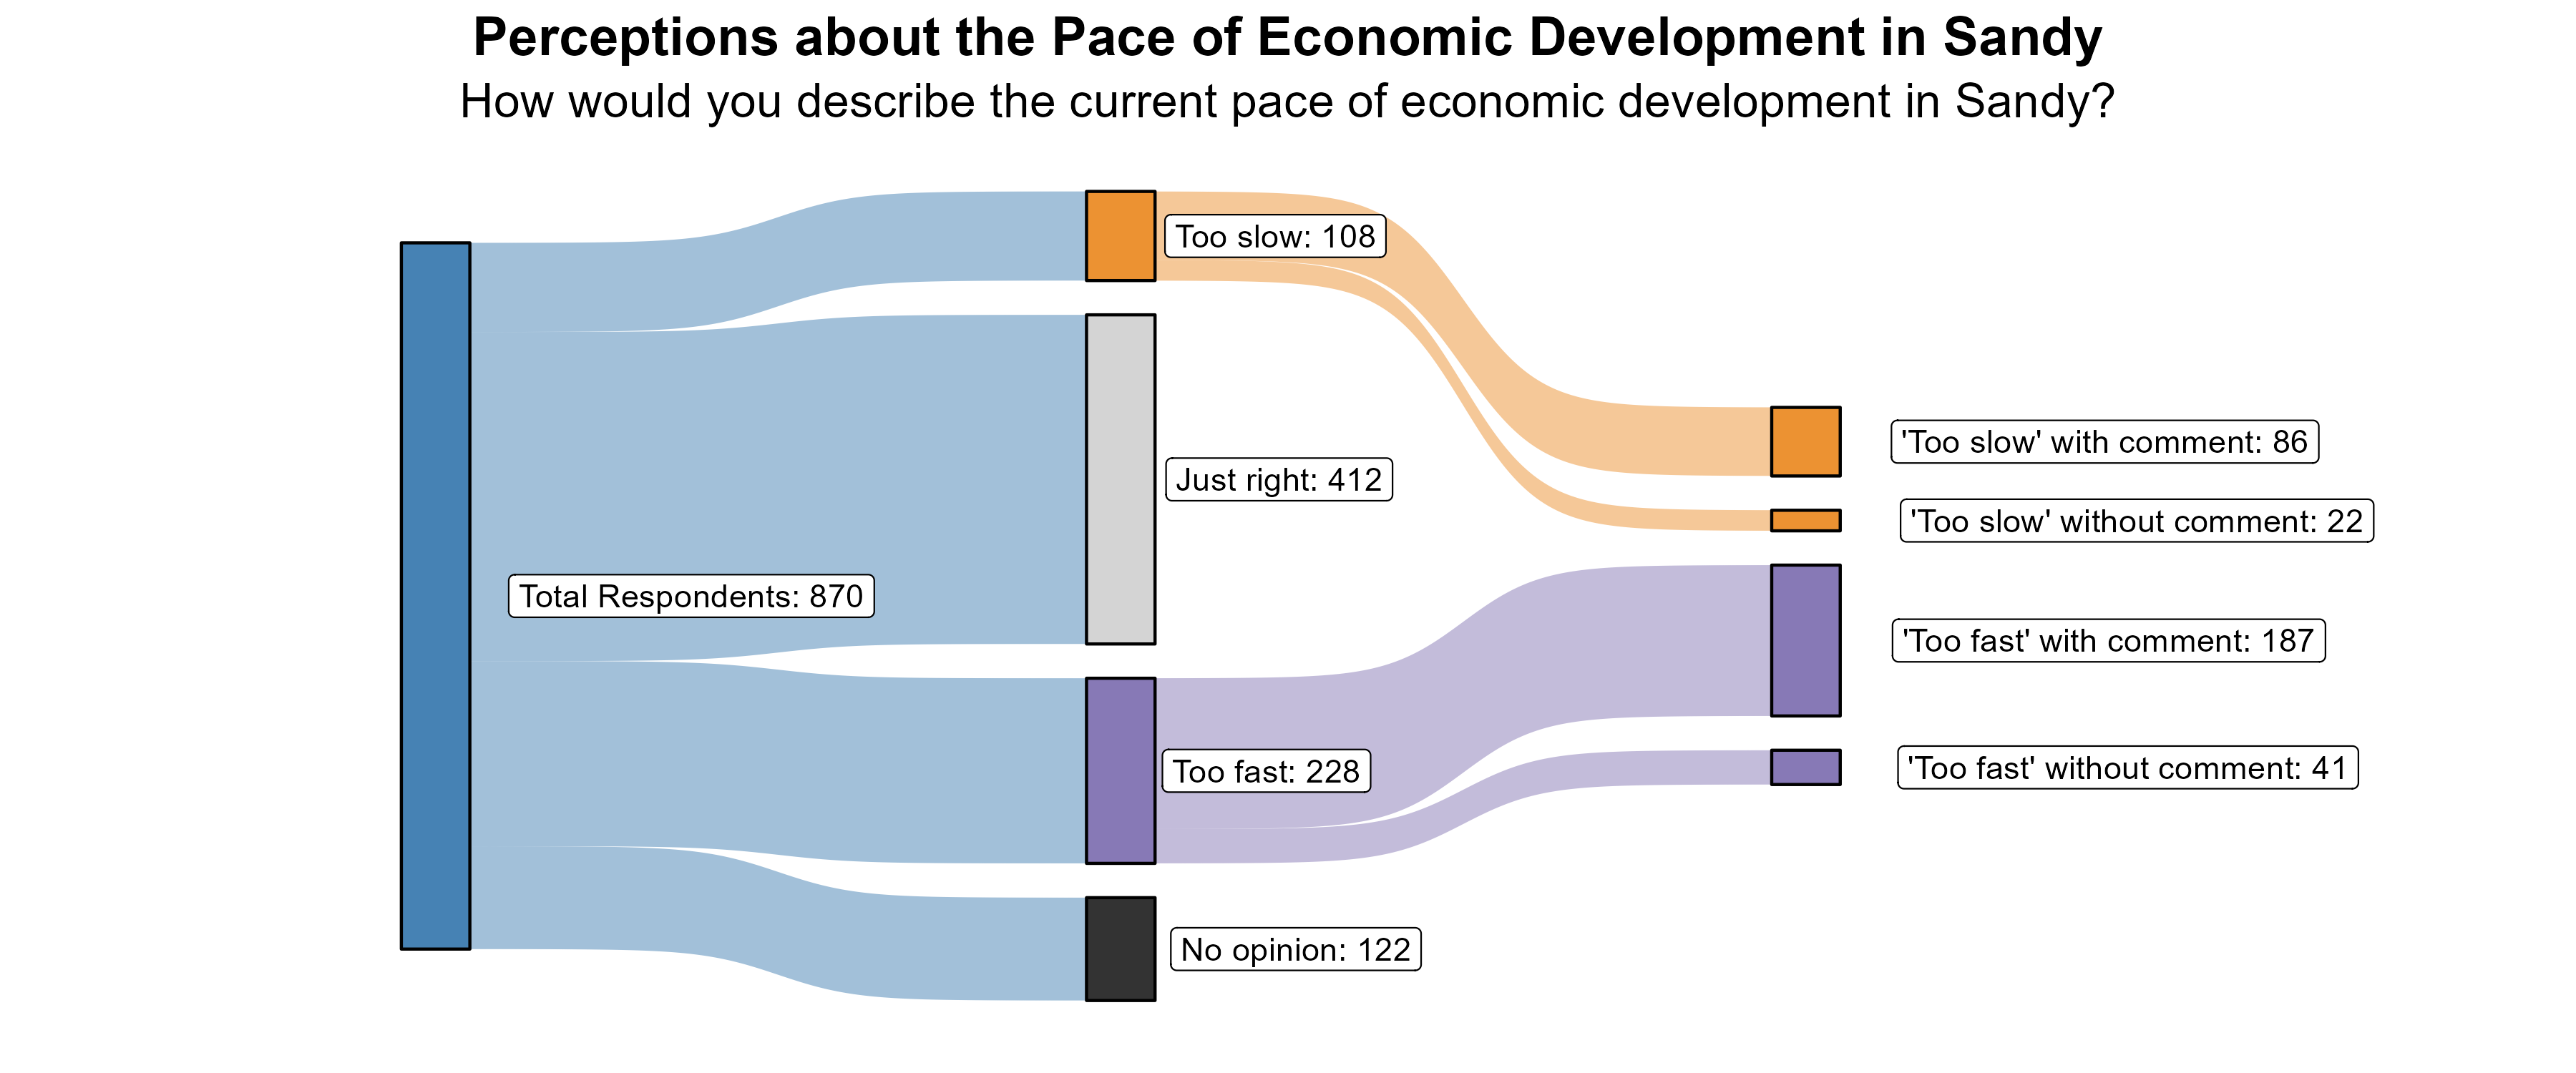
The 12% of respondents who rated the pace of economic growth as “too slow” were further asked what aspects of the local economy they would like to see more of in Sandy. Comments emphasized the need for retail development, particularly restaurants. There were a number of comments about empty buildings and the need to revitalize the mall. There were calls for increased walkability. Some mentioned the need for better employment opportunities and some mentioned taxation issues. There were also calls for more affordable housing.
Additionally, the 26% of respondents who rated the pace of economic growth as “too fast” were further asked what aspects of the local economy they feel are growing too quickly in Sandy. Comments overwhelmingly focused on rapid development of housing and commercial businesses at the expense of green space and open space and without needed infrastructure. There was an expressed need for better planning and governance. Many referred to a disappointing change in the character of Sandy. Some expressed concern about crime and safety and others about water resources.
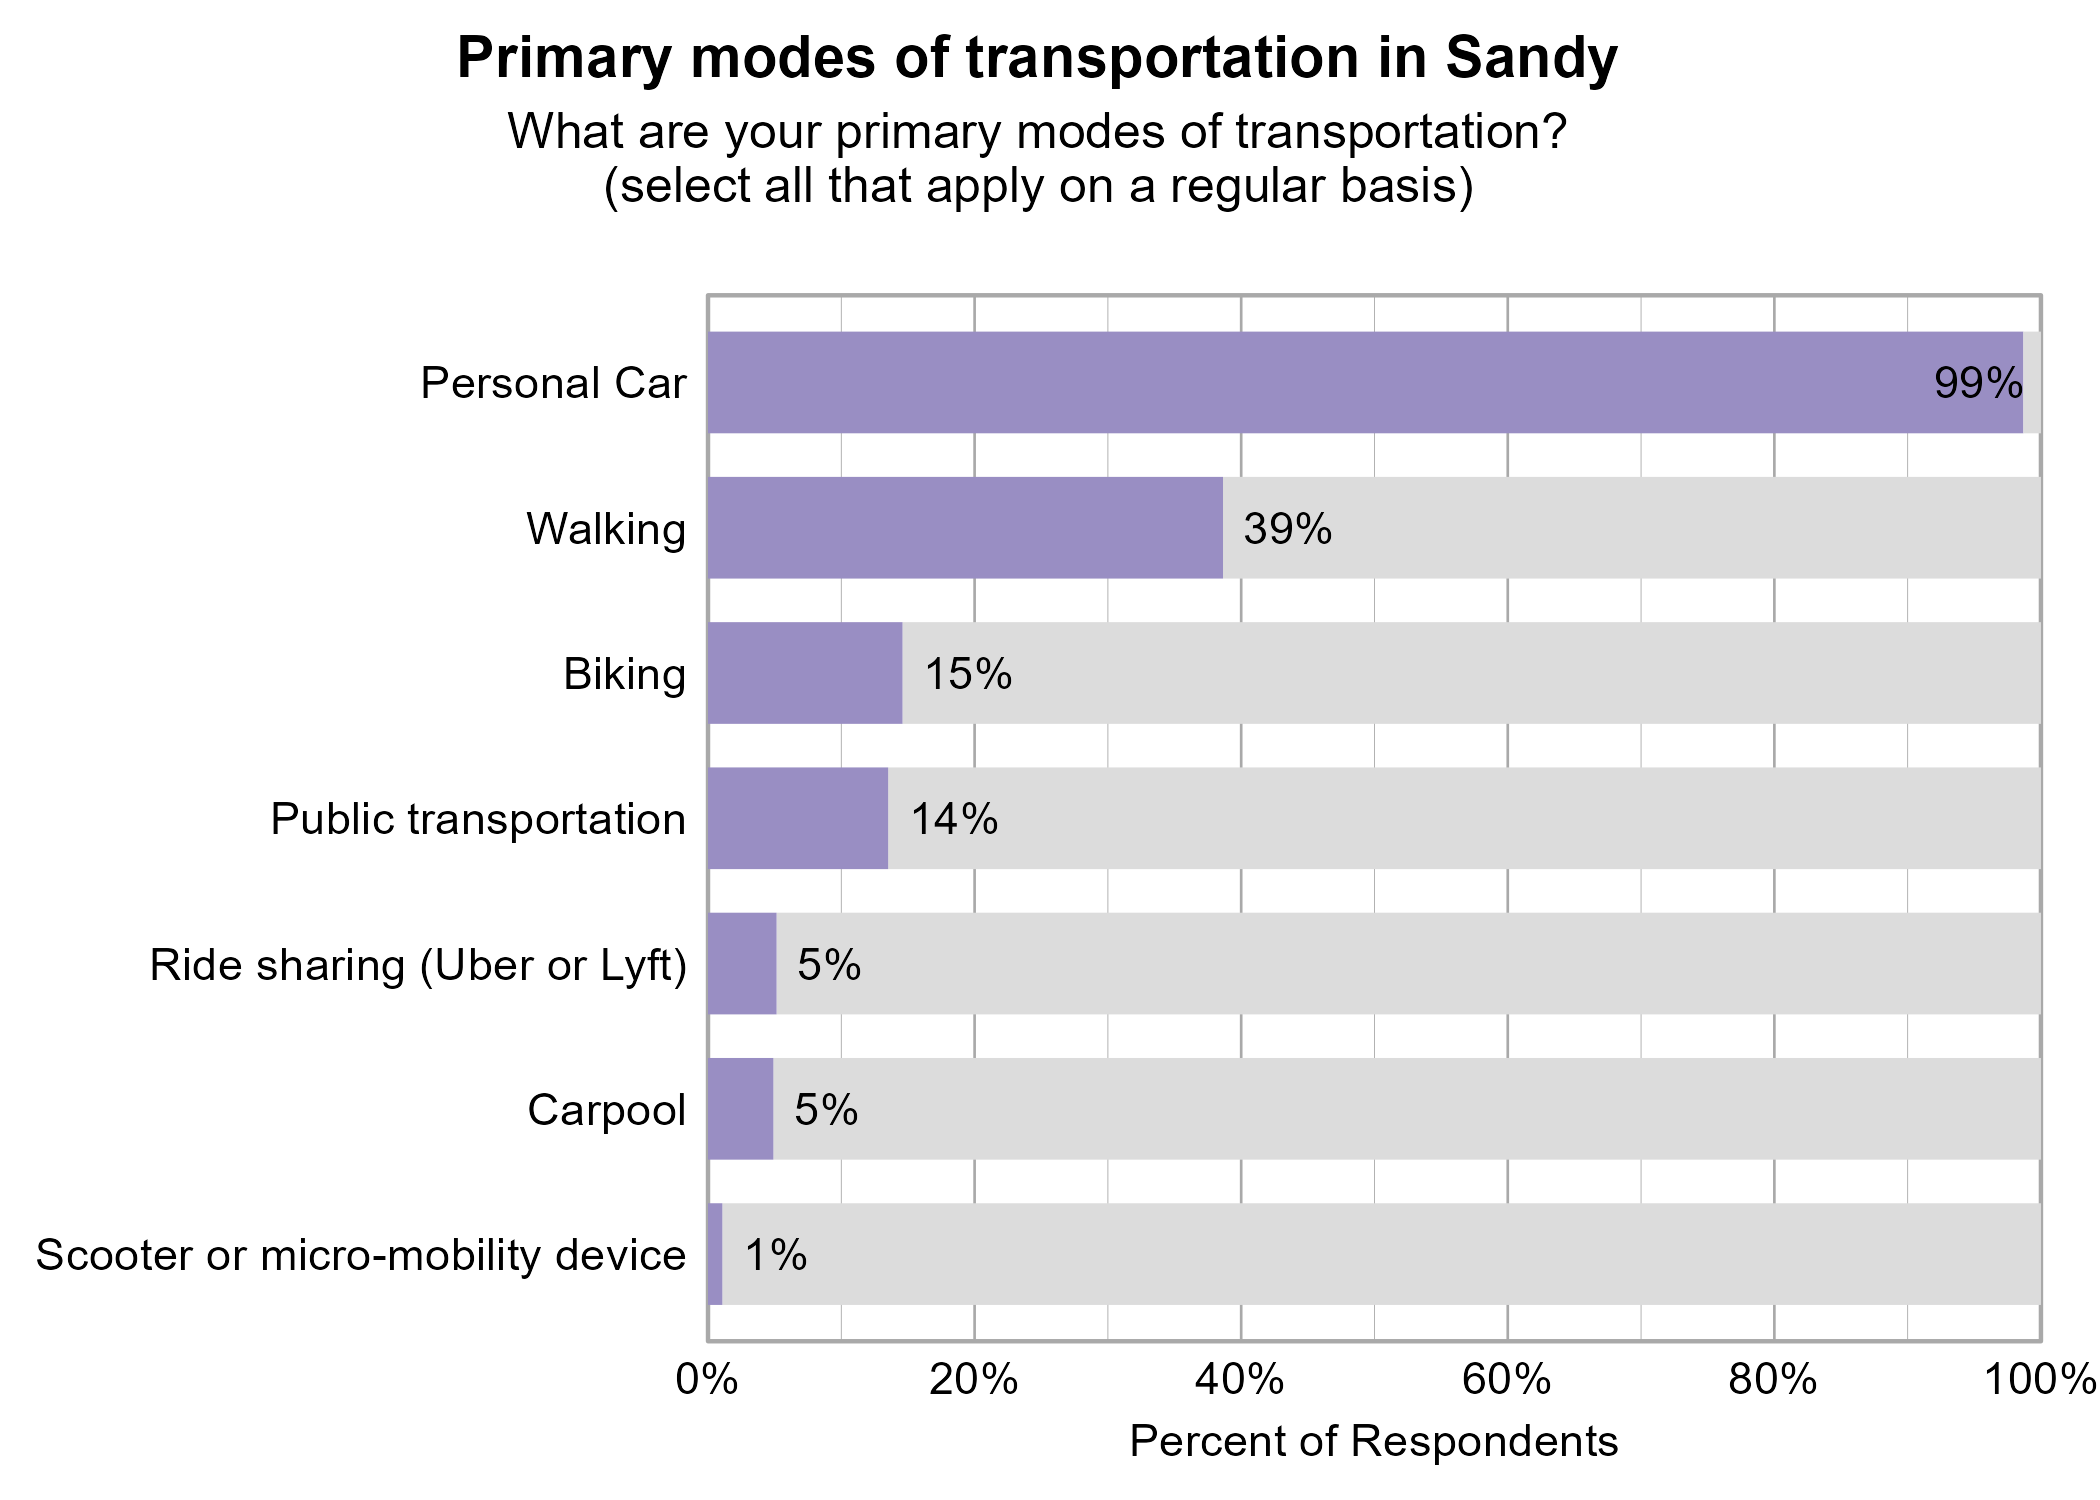
Transportation in Sandy
Respondents were asked to indicate all of their primary modes of transportation on a regular basis in Sandy. The most popular modes of transportation were personal car (99%) and walking (39%).
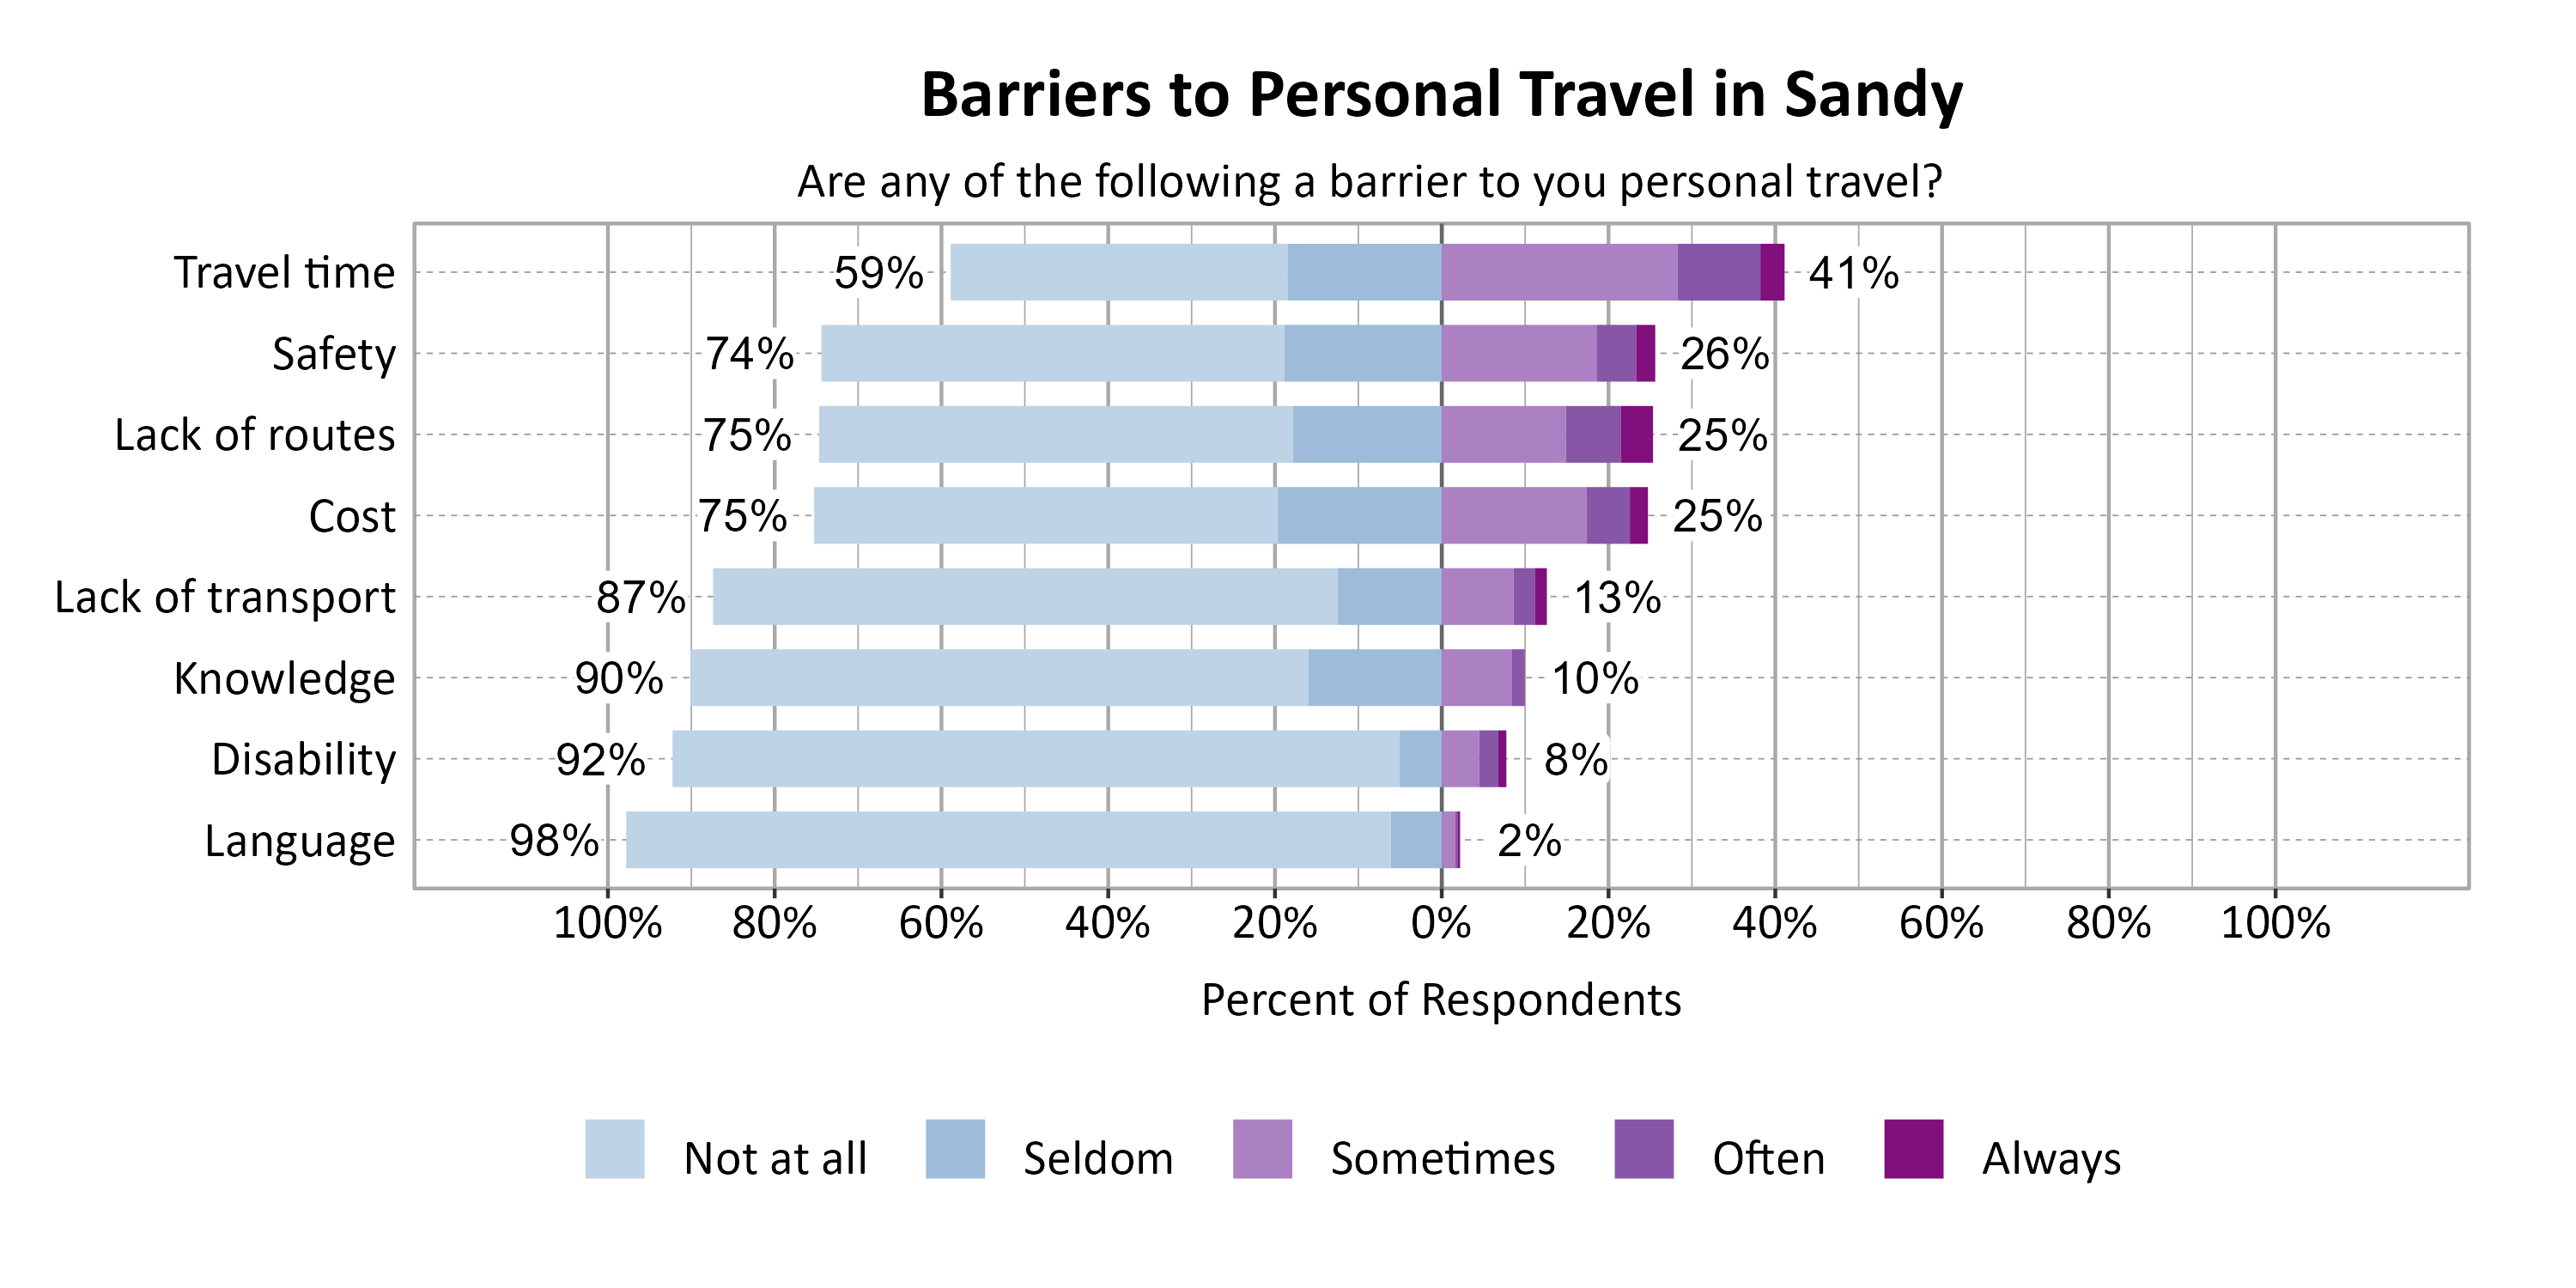
Respondents were asked to indicate the most common barriers to transportation in Sandy. The most problematic barriers were Travel time (41%), Safety (26%), Lack of routes (25%), and Cost (25%).
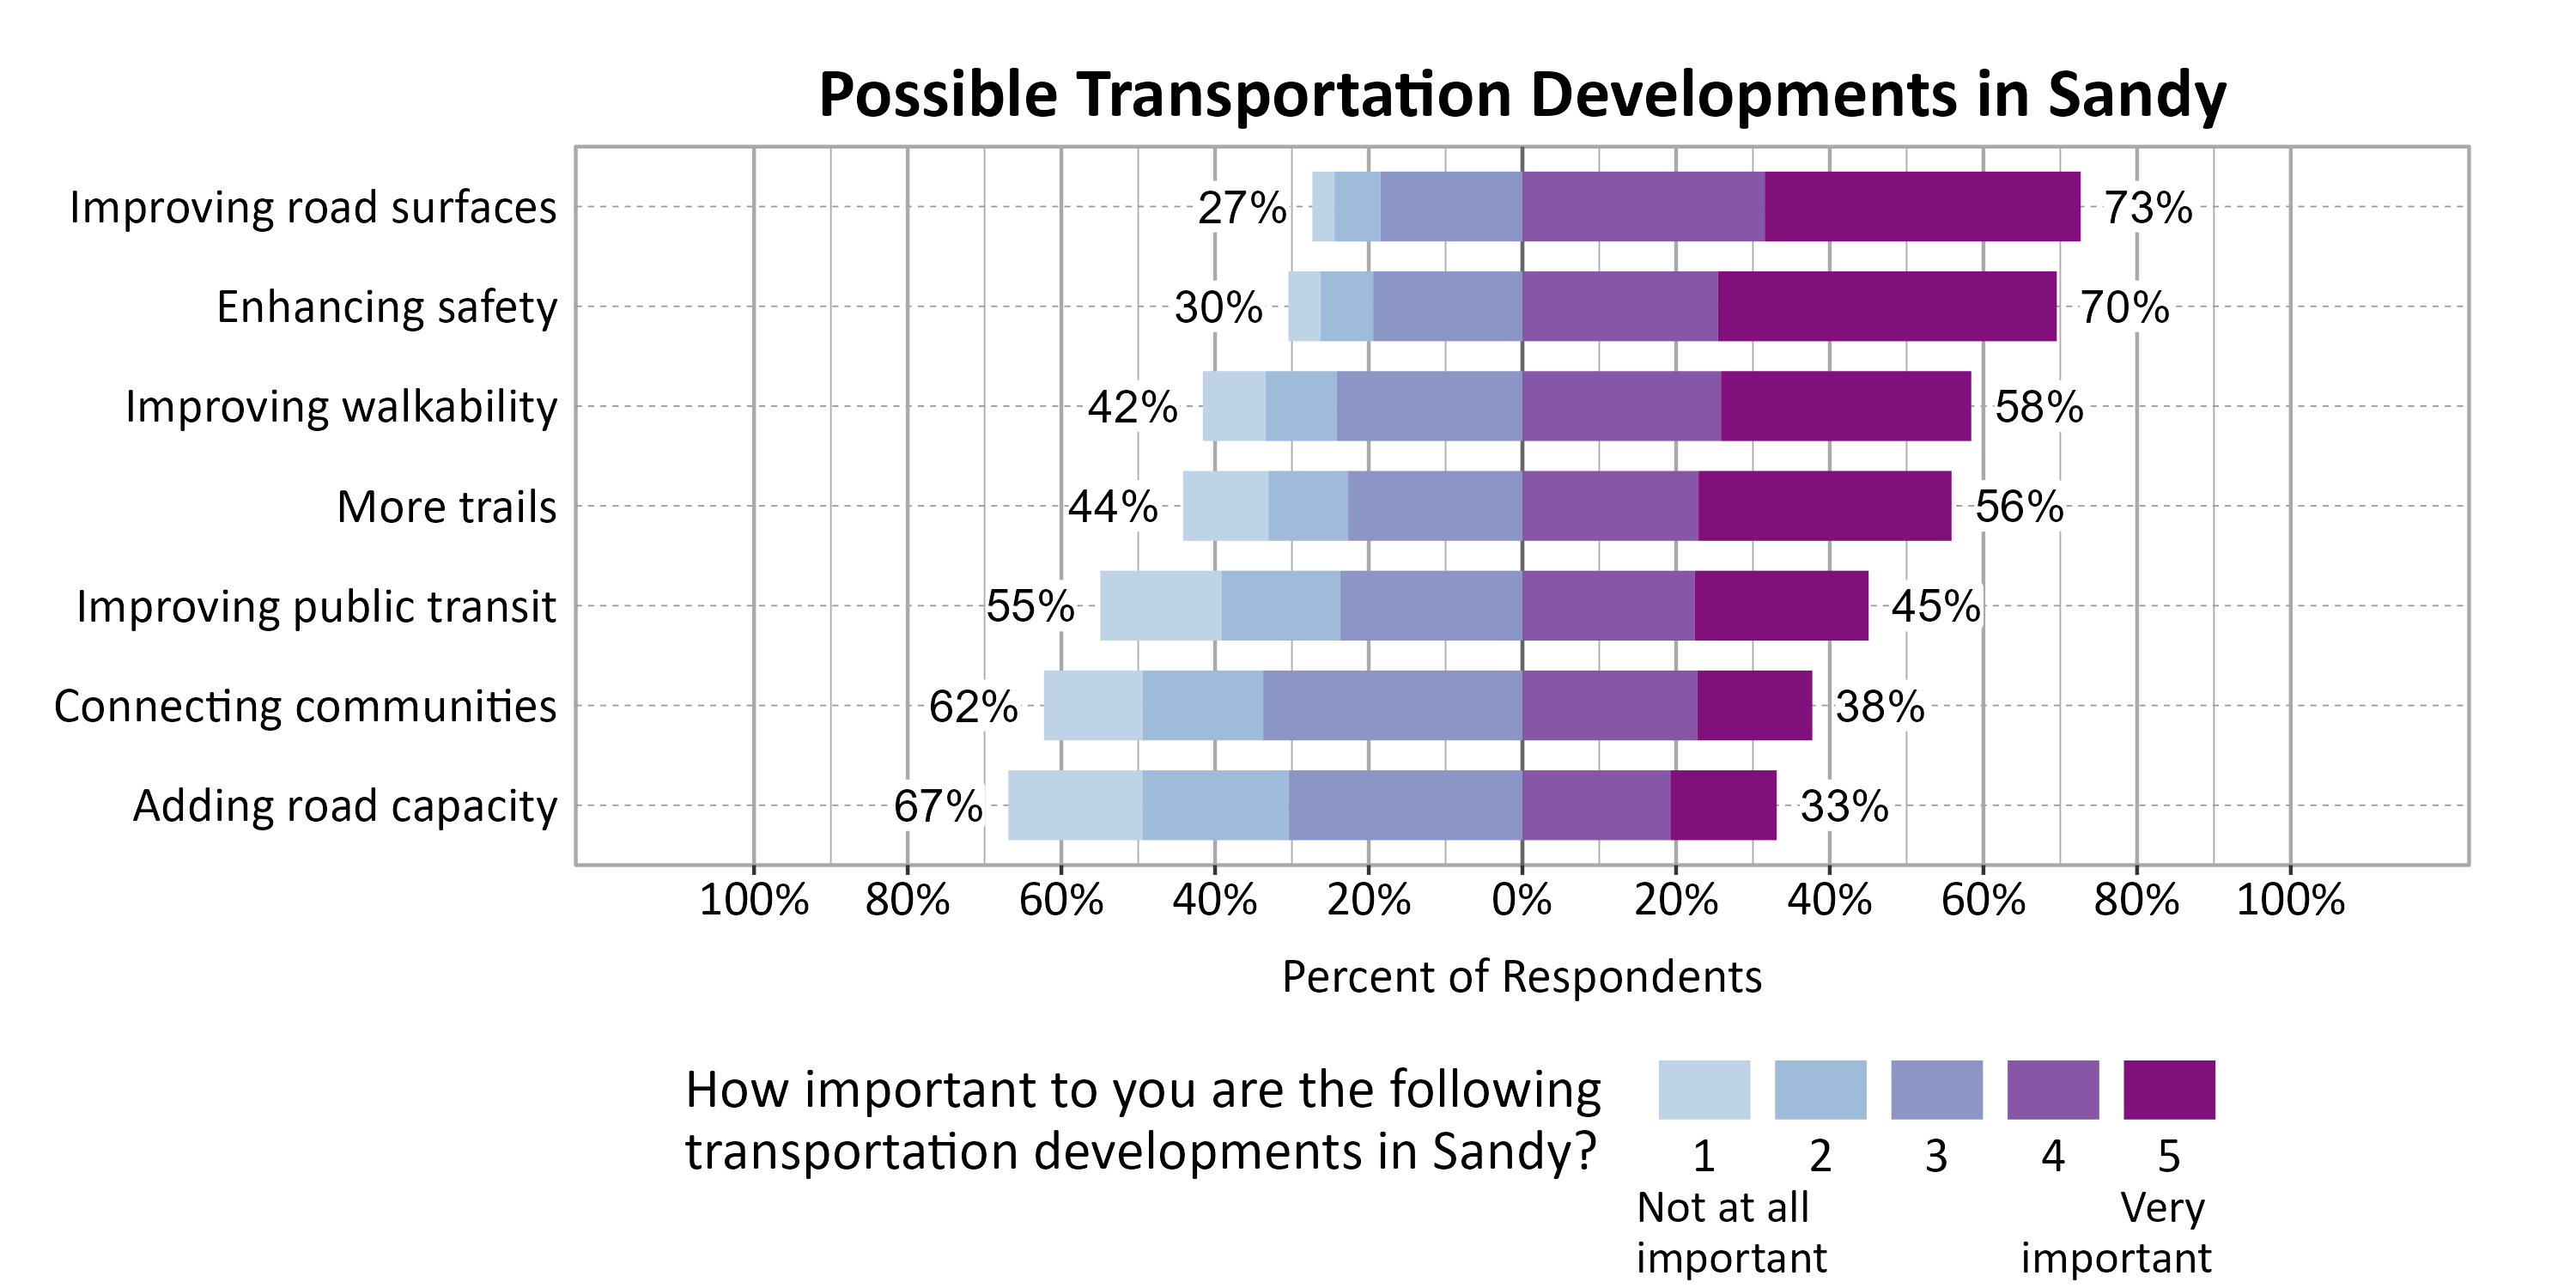
Respondents were asked to indicate the importance of a set of possible transportation developments in Sandy. The most important development to respondents were Improving road surfaces (73%), Enhancing safety (70%), and Improving walkability (58%).
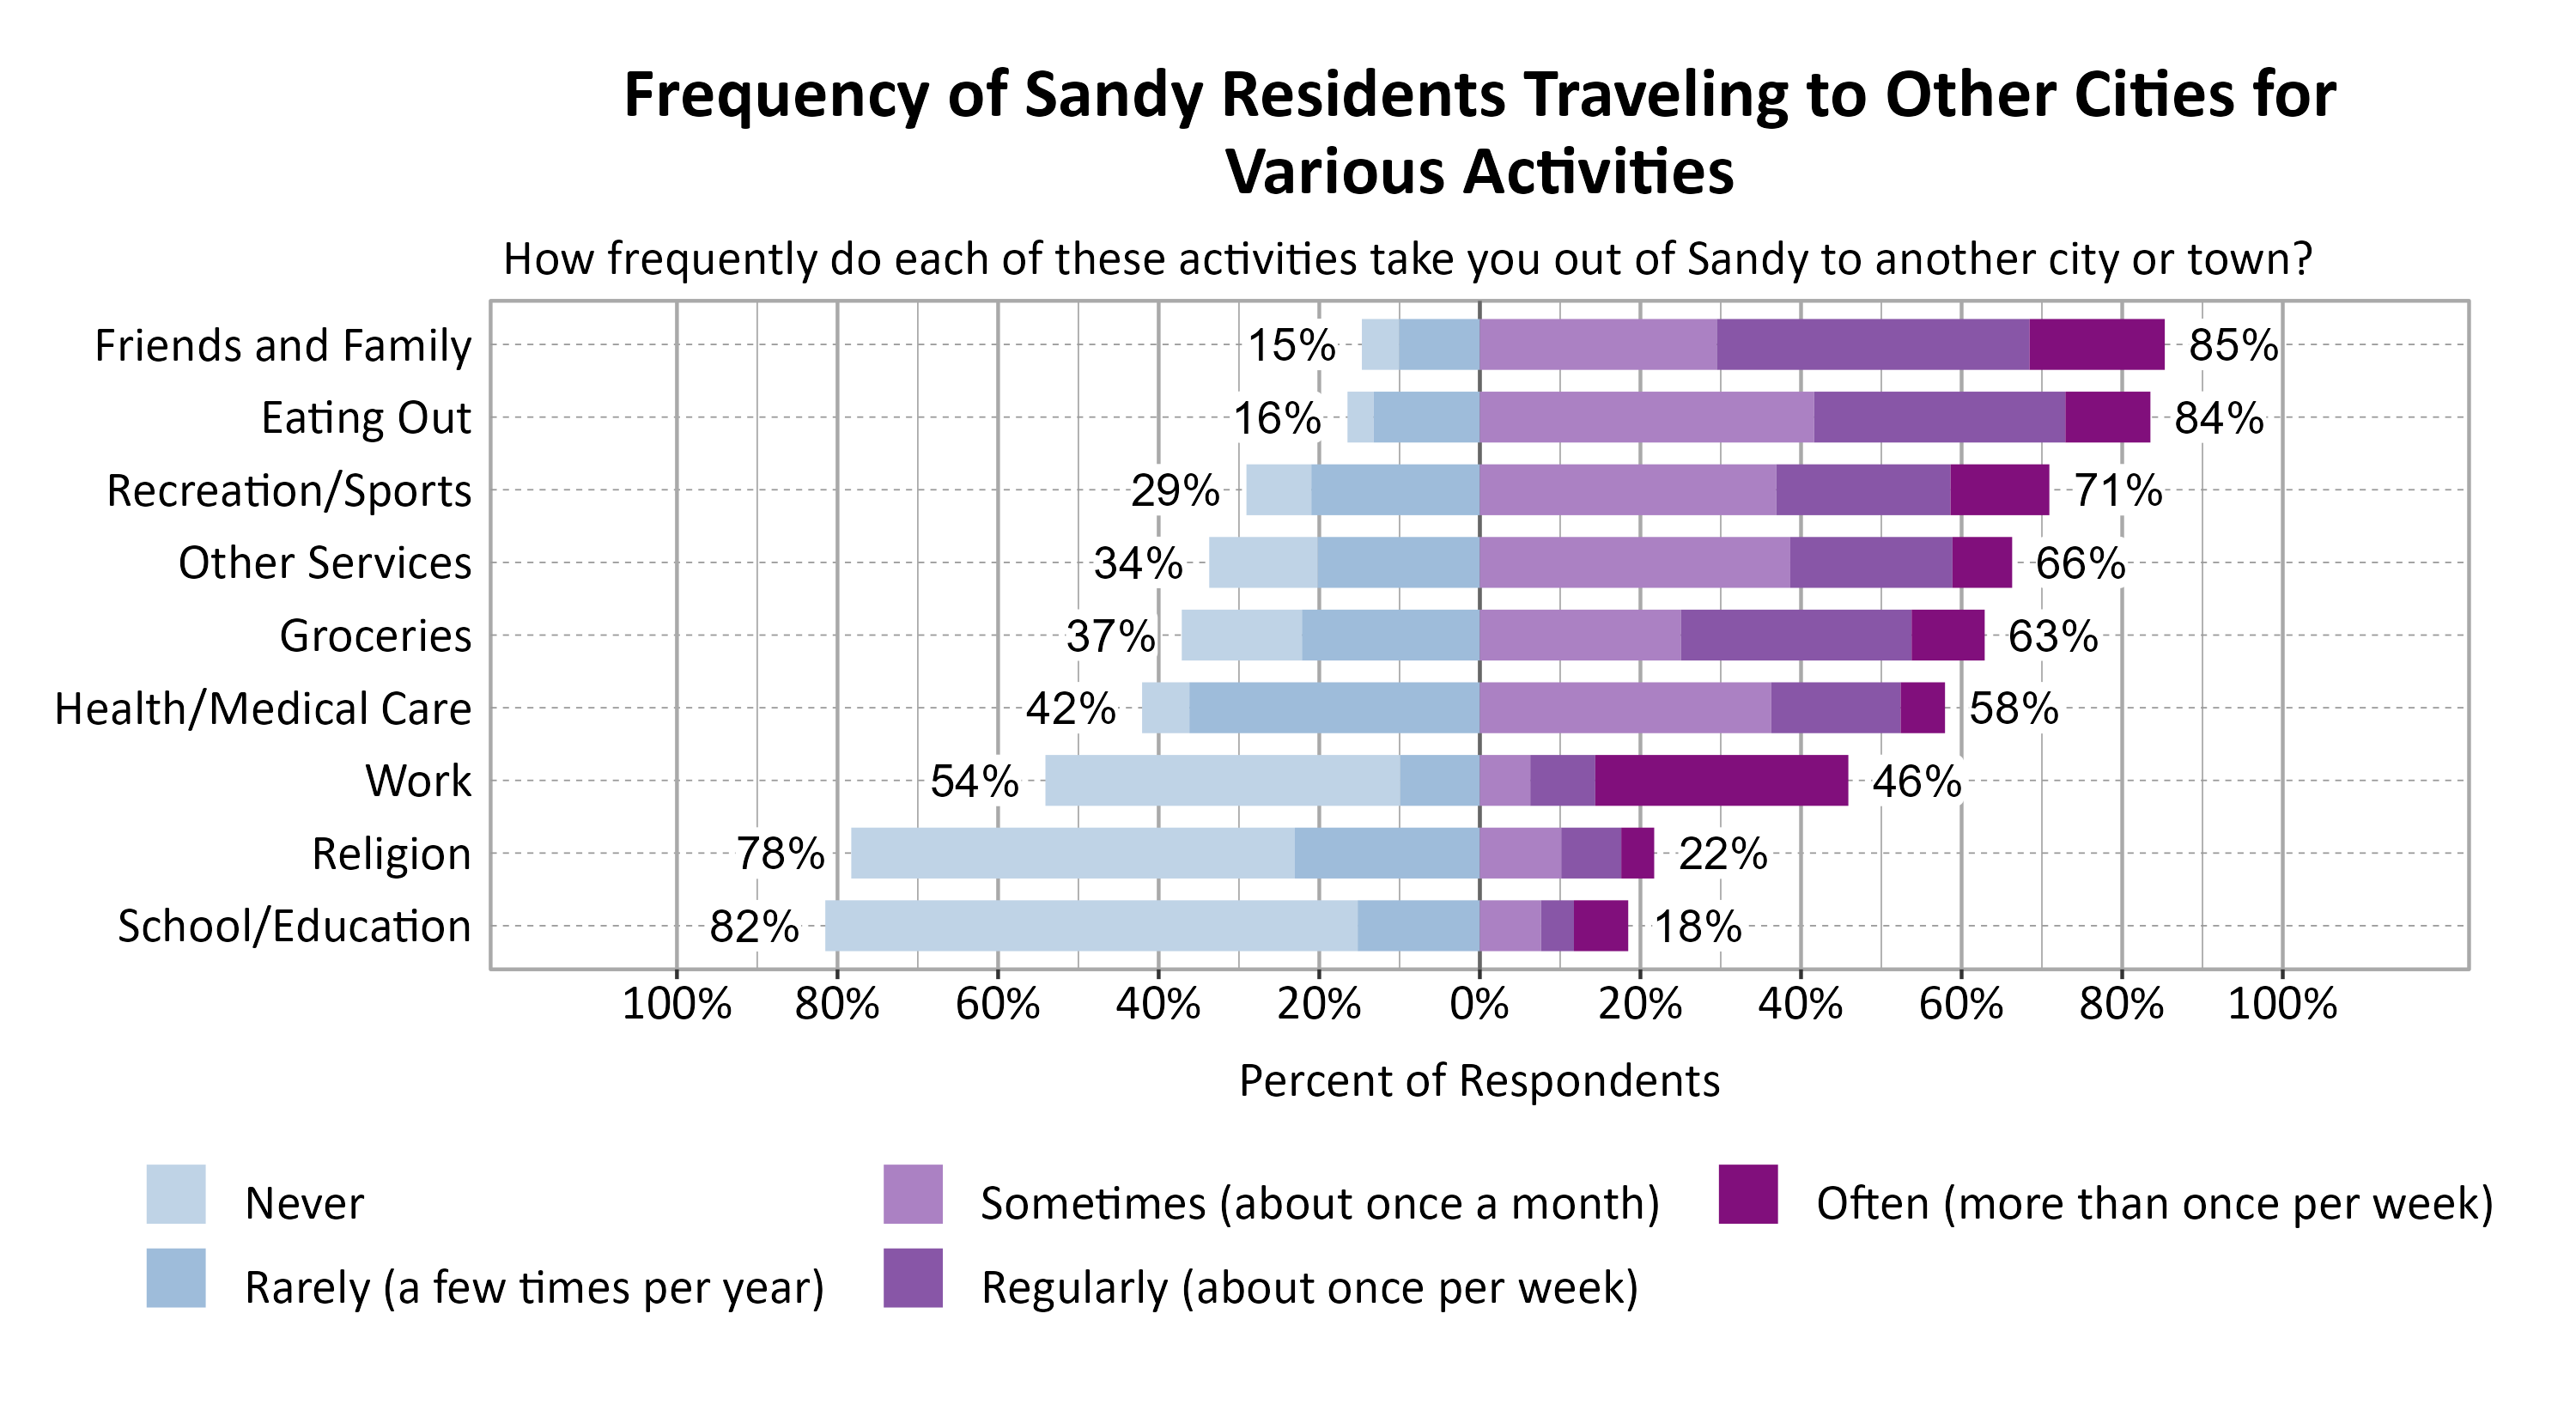
Respondents were asked to indicate how frequently various activities take them out of Sandy to another city or town. The most commonly indicated reasons for traveling to another city or town at least sometimes or once a month were Friends and Family (85%), Eating Out (84%), and Recreation/Sports (71%).
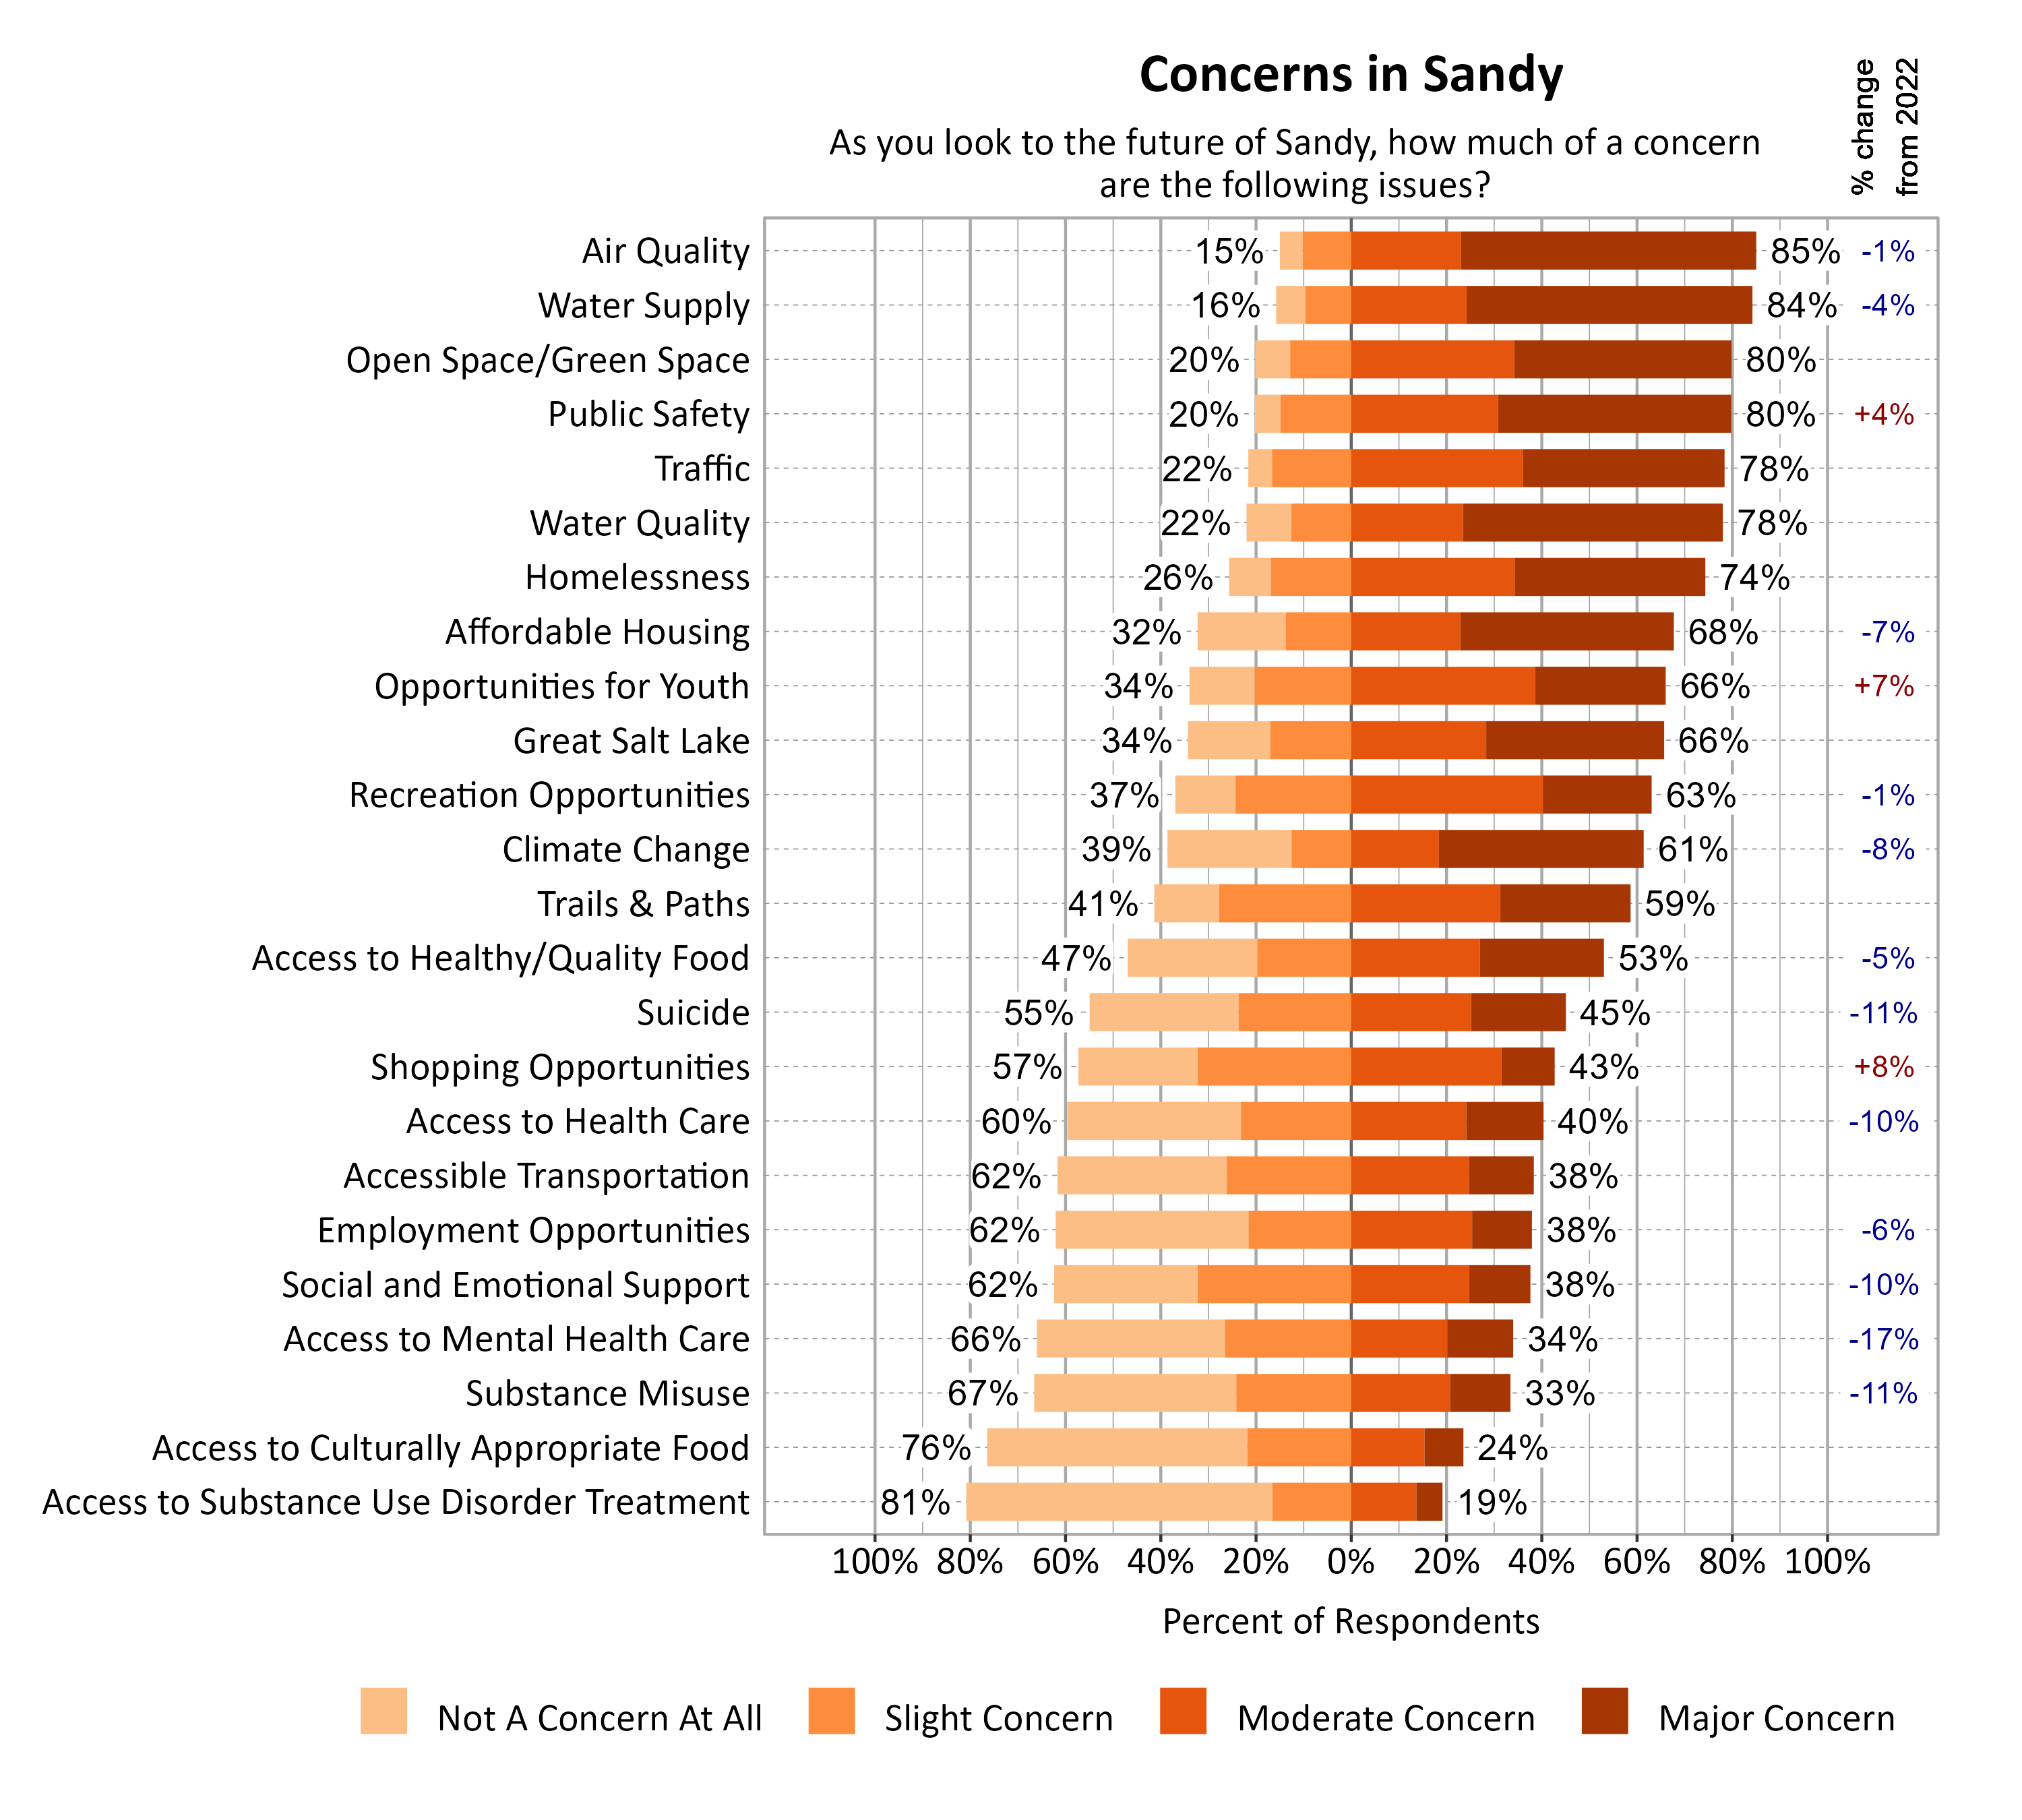
Concerns in Sandy
Survey respondents indicated the degree to which a number of possible local issues were a concern as they look to the future of Sandy. Air Quality (85%), Water Supply (84%), Open Space/Green Space (80%), and Public Safety (80%) were the top concerns. Since 2022, moderate or major concern about access to mental health care (-17%), substance misuse (-11%), suicide (-11%), access to health care (-10%), and social and emotional support (-10%) notably decreased.
Open Comments
All open comments collected in the survey were shared with city leaders. General observations and themes are shared here.
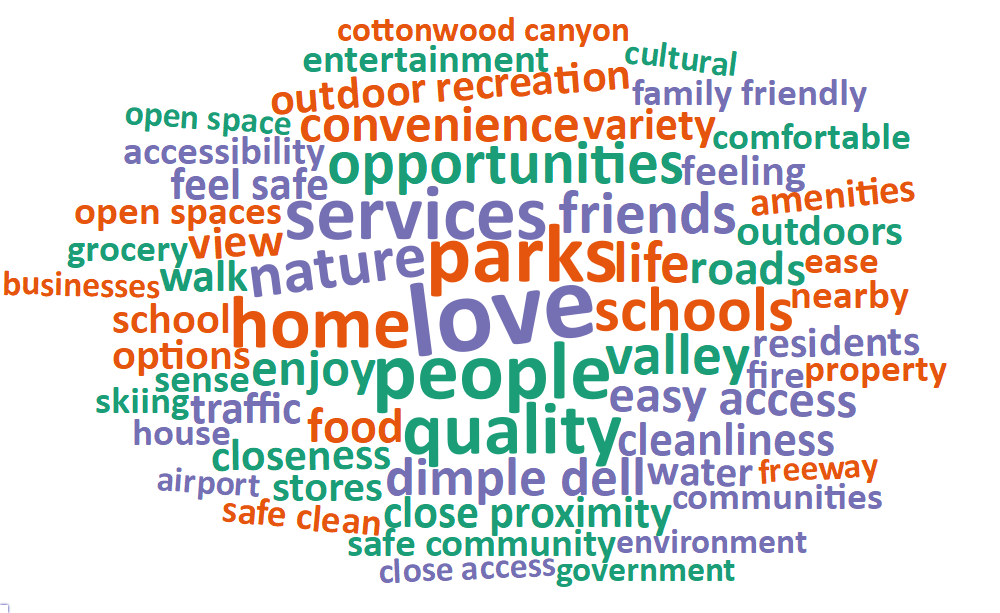
What Respondents Value Most in Sandy
Survey respondents were asked to comment on what they value most about Sandy. The most common words and phrases from all city comments are included in the word cloud below. It is possible that negative or unrelated words may appear since these words have been taken out of context, and they may not indicate the respondent’s intended meaning. Comments indicated that people value the safety, cleanliness, and low crime rate of Sandy, and several specifically appreciated the attention of Sandy’s government, the quality of their police force, and local services that help maintain safety and cleanliness (the bulk clean-up program was mentioned several times). Many valued Sandy’s location, convenience, and proximity to daily necessities and other cities. Many specified that they appreciated their proximity to both the larger SLC and Salt Lake Valley and the mountains, canyons, and outdoor recreational activities. Many value the mountain views and access to nature, and several commenters relatedly value the proximity to outdoor recreational opportunities such as hiking, skiing, etc. Many valued their neighborhoods, families, and community relationships.
Local Environmental Quality in Sandy
The 42% of respondents who rated the Local Environmental Quality domain as 1, 2, or 3 (Poor, Fair, or Moderate) were further asked if there are specific aspects of local environmental quality that they feel are problematic. Air quality was a major concern, particularly related to inversions, smog, car exhaust, and inversions. Traffic was another main concern adding to the poor air quality in Sandy. Comments also mentioned the desire for other modes of transportation, but note that it isn’t safe due to high speeds and lack of trails, bike lanes, and walking paths. The lack of green space was also a concern as growth in Sandy increases. A notable concern was the potential gondola being built in Little Cottonwood Canyon.
Improving Wellbeing in Sandy
Survey respondents were asked if there is anything that could be done to improve wellbeing in Sandy. Many responses expressed concerns about transportation, particularly traffic congestion and safety. There were also requests for more walkability, bike-ability, and protected walking/biking trails. Many felt that traffic laws aren’t being properly enforced regarding speeding, street racing, and running red lights, and some also mentioned related issues with noise pollution and/or neighborhood safety. Many mentioned concerns about rapid growth and development and increased high density housing. There were also concerns about cleanliness, appearance, and code enforcement regarding the appearances of the city and private properties. There were comments about government related to high taxes, public safety, code enforcement, and ability to listen to residents. Some commented about recreation, asking for more recreation activities, protecting current opportunities, enforcing dog etiquette (cleaning up after dogs and keeping them on leashes), and concerns related to the Little Cottonwood Canyon gondola project. Several brought up concerns about safety, increasing crime, and increasing homelessness.
Additional Comments
Respondents were also asked if they had any additional comments on wellbeing in Sandy. Many comments indicated that people are happy, they have a good quality of life, and/or that they love living in Sandy. A number of comments mentioned government, with both positive and negative views related to government listening to residents, the police department, and code enforcement/other government workers. There were comments about transportation, usually about road safety and upkeep, bike-ability and bike safety, and walkability/pedestrian friendliness. Several comments mentioned safety, with some saying that they feel safe and others expressing concerns about increased crime, homelessness, etc. and their safety. There was concern about the rate of growth and development and several mentioned the social climate, with some expressing liking their neighbors and community, but many expressing concerns about a lack of diversity and a lack of acceptance for non-LDS individuals.