South Jordan Wellbeing Survey Findings 2024
By Dr. Courtney Flint and Team
![]()
Contact Information
Dr. Courtney Flint
courtney.flint@usu.edu
435-797-8635
Summary
South Jordan is one of 51 cities participating in the Utah Wellbeing Survey Project in 2024. This project is designed to assess the wellbeing and local perspectives of city residents and to provide information to city leaders to inform general planning processes. Additional analysis is underway and this report may be updated over time.
We are grateful to all those who took the survey and to our city partners who helped to make this possible. We are grateful to a number of entities for funding: the Utah League of Cities and Towns, USU Extension, USU’s Institute for Land Water and Air, the Wasatch Front Regional Council, Utah Department of Transportation, the Utah Agricultural Experiment Station, and the cities of Alpine, Cedar Hills, Draper, Millcreek, Nephi, North Salt Lake, Ogden, Orem, Pleasant Grove, Providence, Springdale, Tremonton, West Bountiful, and West Valley City.
This report describes findings from the 2024 South Jordan survey and comparative information with other project cities. In April and early May 2024, South Jordan City advertised the survey for residents largely through electronic and printed newsletters, social media, and the city website. All city residents age 18+ were encouraged to take the online Qualtrics survey.
How many people responded?
- 206 viable surveys were recorded in this 2024 survey effort.
- The South Jordan 2022 survey had 467 responses.
- The adult population of South Jordan was estimated at 54,317, based on the American Community Survey by the U.S. Census. The 206 survey responses in 2024 represent 0.4% of the adult population and have a conservative margin of error of 6.81%.
Survey Respondent Characteristics
| Resident Statistics | |
|---|---|
| Full Time Residents of South Jordan | 99.5% |
| Part Time Residents of South Jordan | 0.5% |
| Length of Residency — Range | 0.1-52 years |
| Length of Residency — Average | 13.3 years |
| Length of Residency — Median | 10 years |
| Length of Residency 5 Years or less | 31.1% |
| ZIP Code | Percent |
|---|---|
| 84009 | 55.8% |
| 84095 | 44.2% |
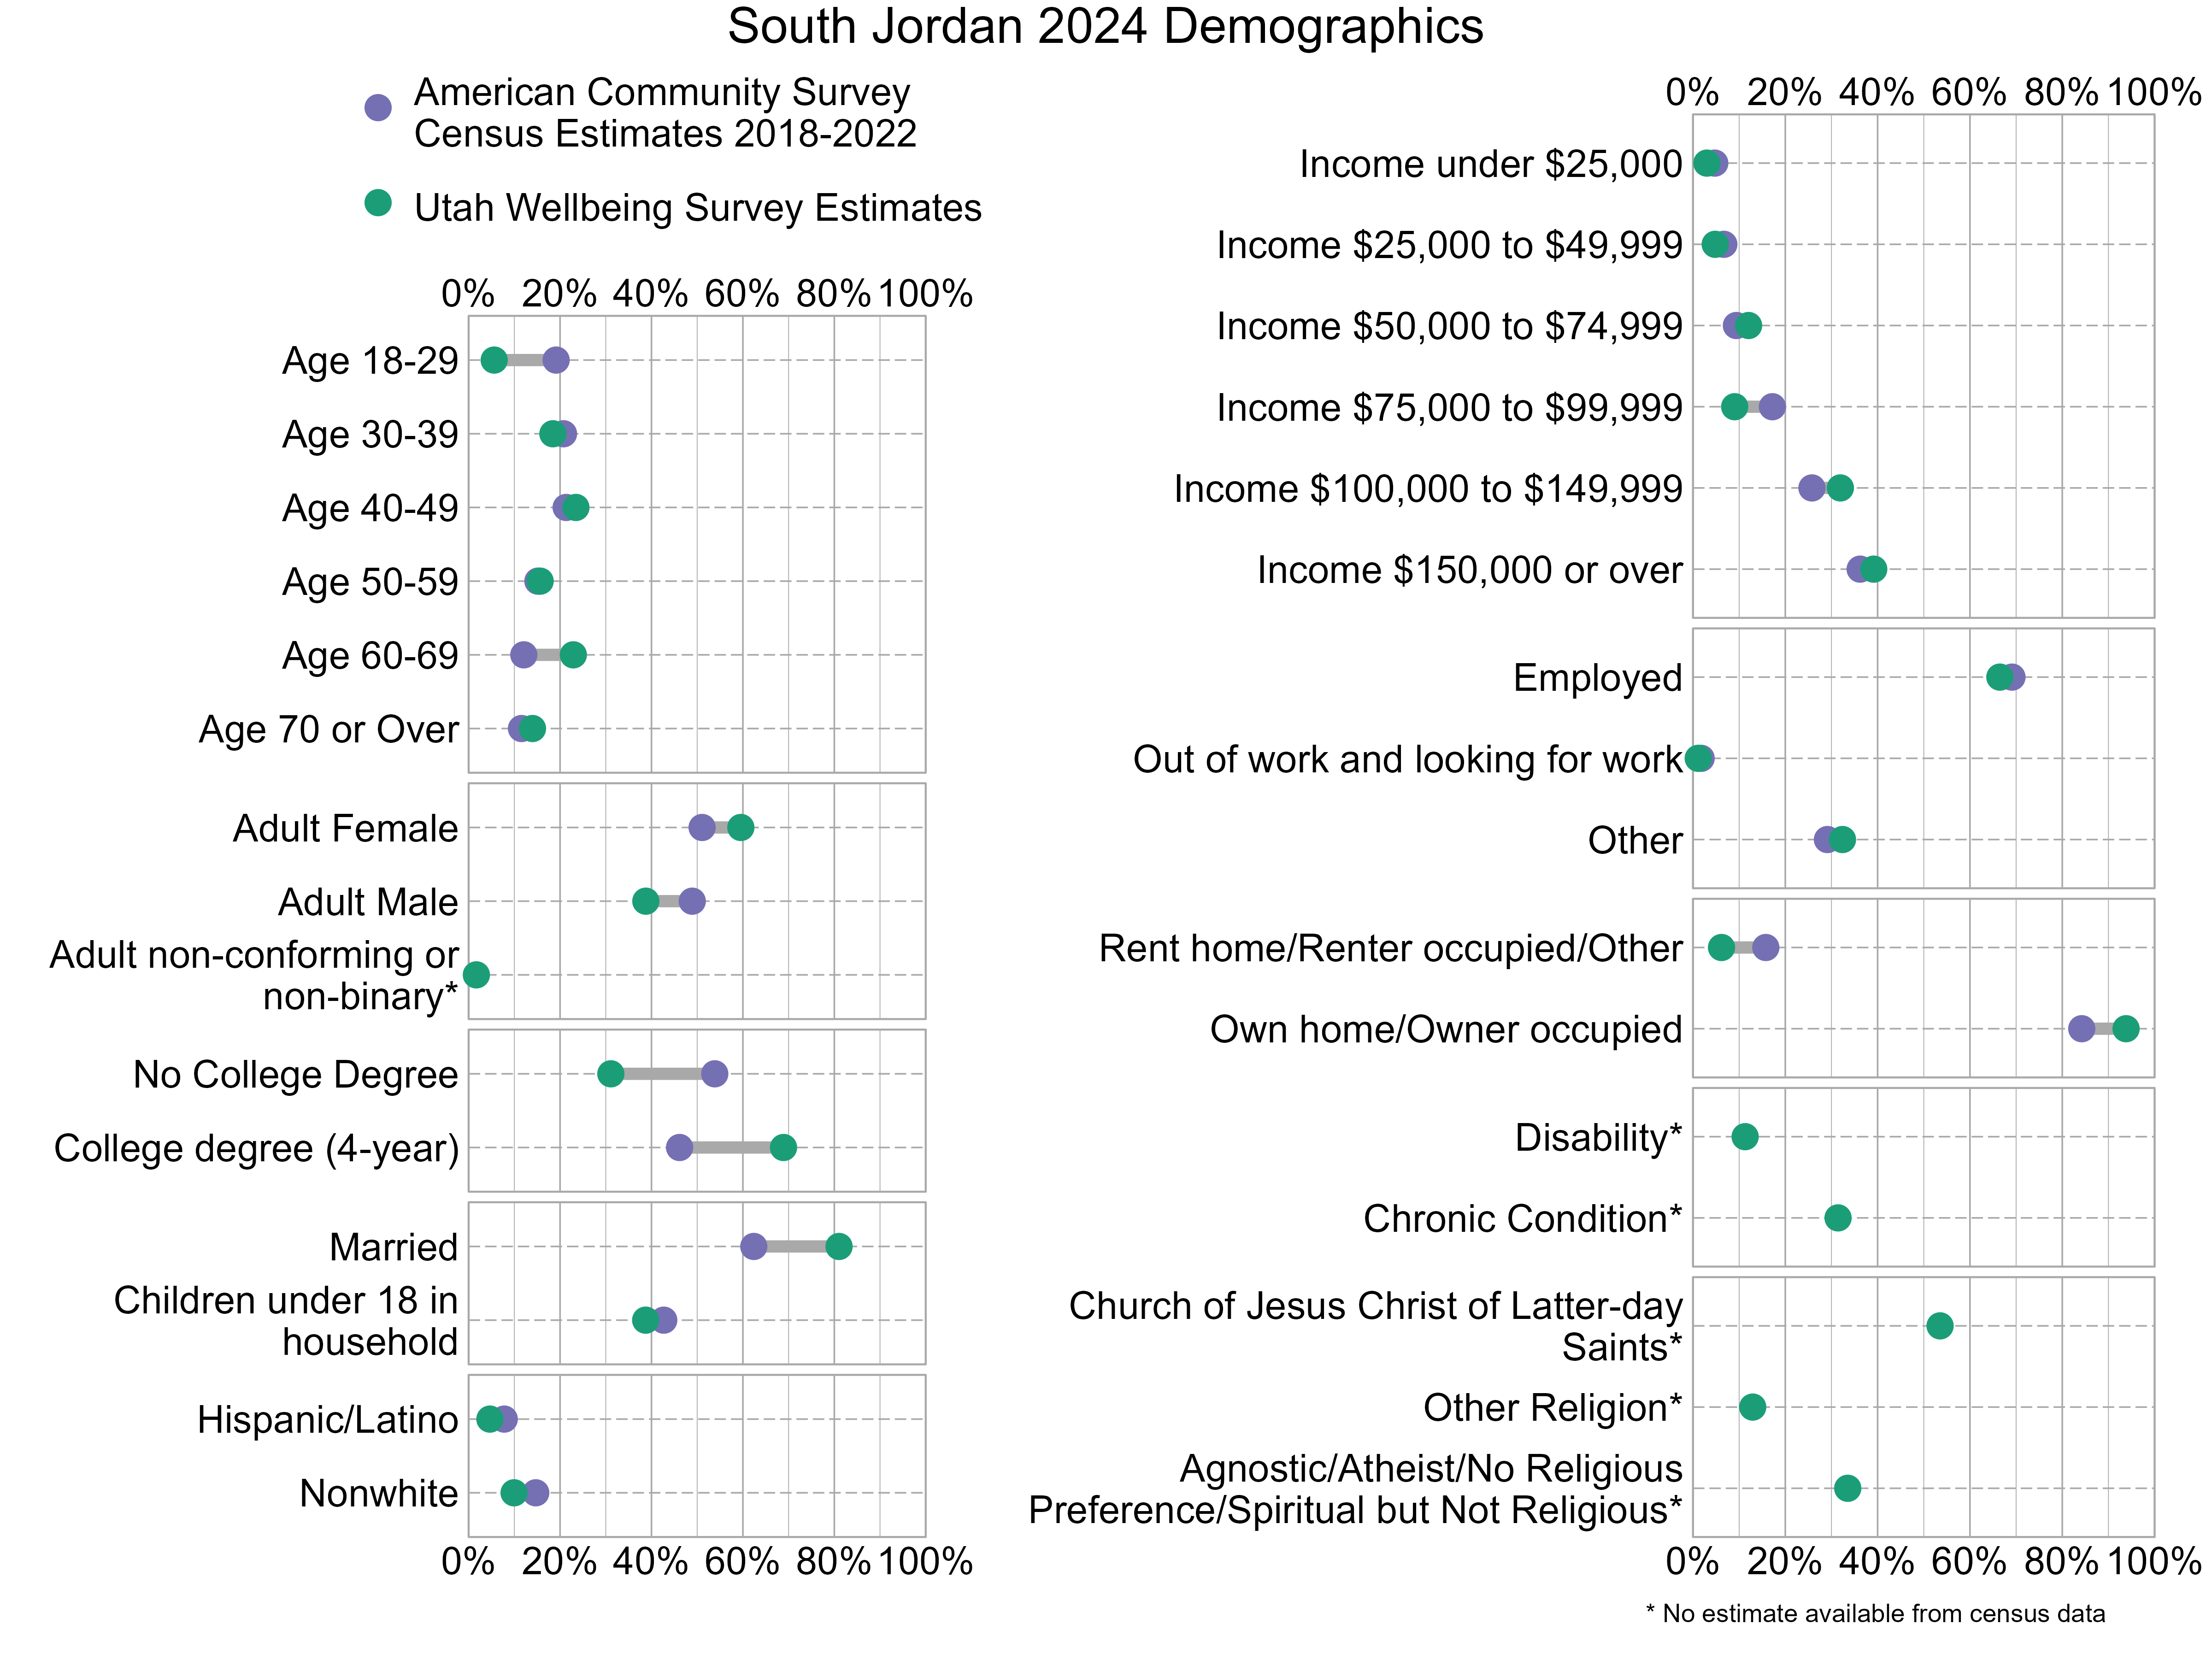
Demographic characteristics of the survey respondents were compared below with U.S. Census information from the 2018-2022 American Community Survey. In the graph below, gray bars indicate differences between the American Community Survey estimates and the Utah Wellbeing Project surveys. The wider the gray bars, the larger the differences. Also note that estimates for religious affiliation, adult non-conforming or non-binary gender, disability, and chronic conditions are unavailable from the census data. There can also be a variable margin of error in the American Community Survey estimates, and caution should be used when comparing estimates. Not all respondents provided demographic information. As the graph shows, 2024 survey respondents were not fully representative of South Jordan. People who have at least a 4-year college degree and are married were overrepresented while those who do not have a college degree were underrepresented.
Overall Personal Wellbeing and Overall Wellbeing in South Jordan
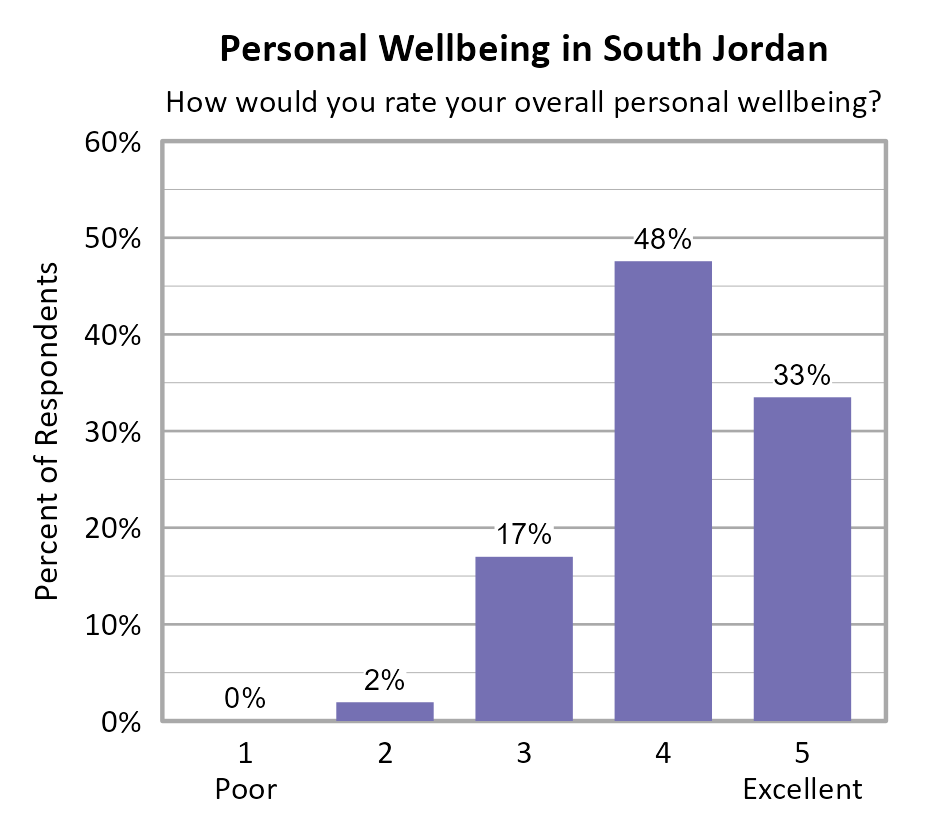
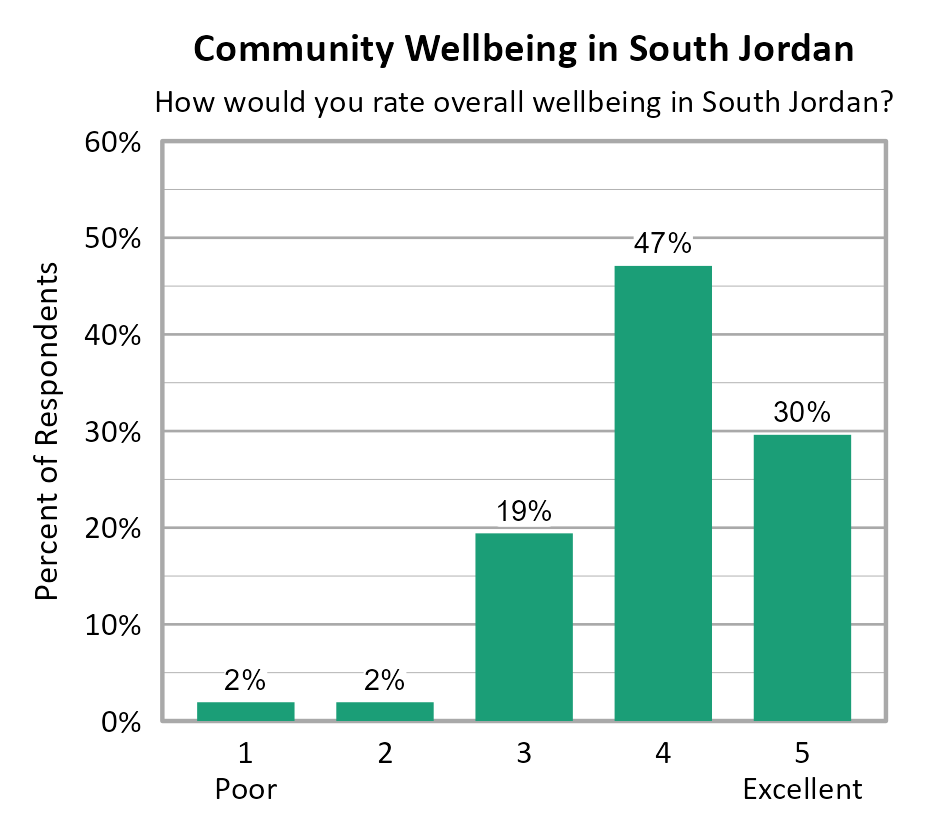
Survey participants were asked about their overall personal wellbeing and overall community wellbeing in South Jordan. These wellbeing indicators were both measured on a 5-point scale from poor (1) to excellent (5). The average personal wellbeing score in South Jordan was 4.13 with 81% of respondents indicating their wellbeing at a 4 or 5 on the 5-point scale. The average score for community wellbeing in South Jordan was 4.00 with 77% of respondents indicating community wellbeing at a 4 or 5 on the 5-point scale. In South Jordan, while ZIP code 84095 had slightly higher overall personal and community wellbeing scores than ZIP code 84009, these differences were not statistically significant.
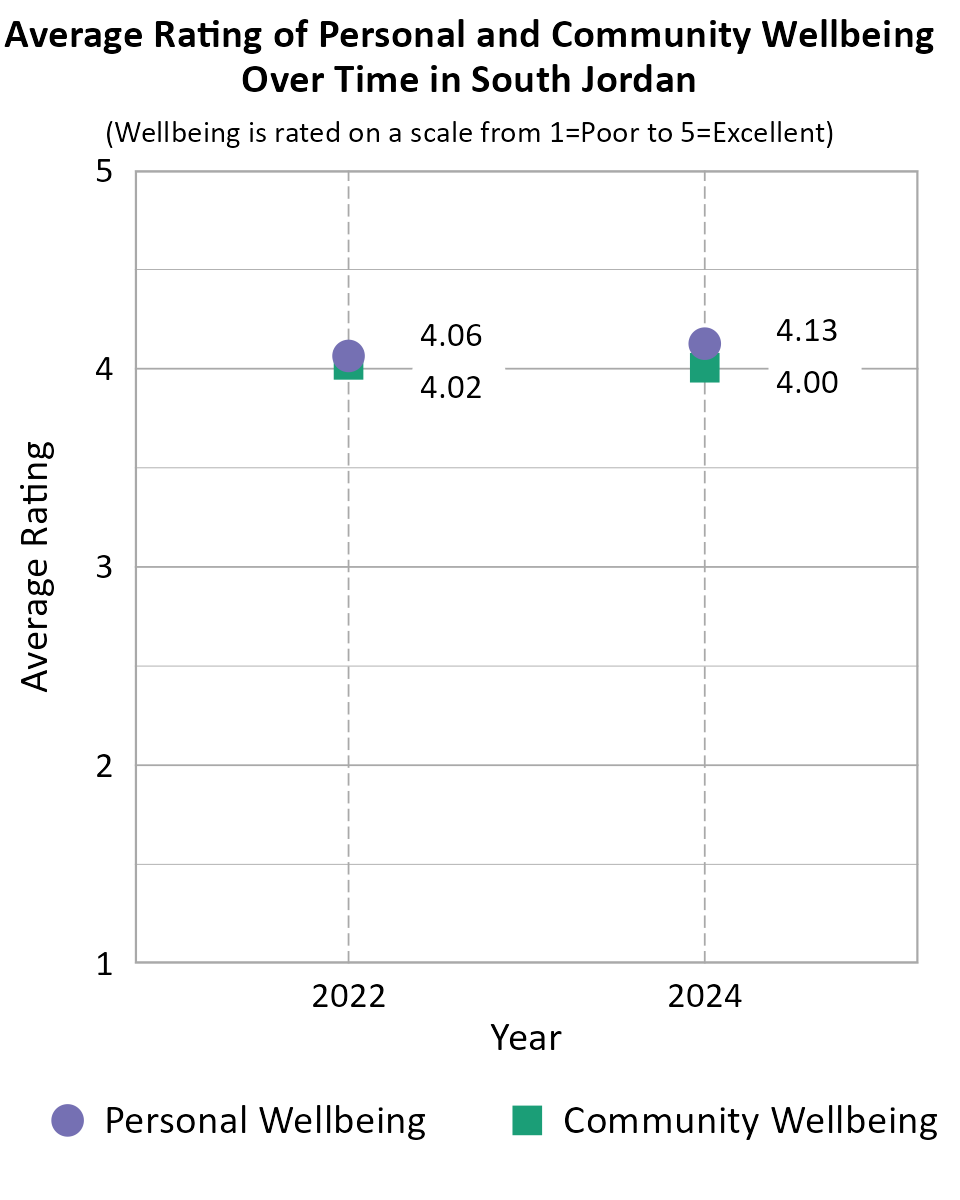
When comparing survey data from South Jordan over the years as shown in the information below, we can see that the average personal wellbeing score improved between 2022 and 2024. The average community wellbeing score remained nearly the same between 2022 and 2024. Note that the number of respondents differed between years, there is no tracking of individuals from one year to the next, and the low end of the scale was "Poor" in 2024 but "Very Poor" in prior years which may account for differences in scores over time.
Comparing Wellbeing Across Utah Cities
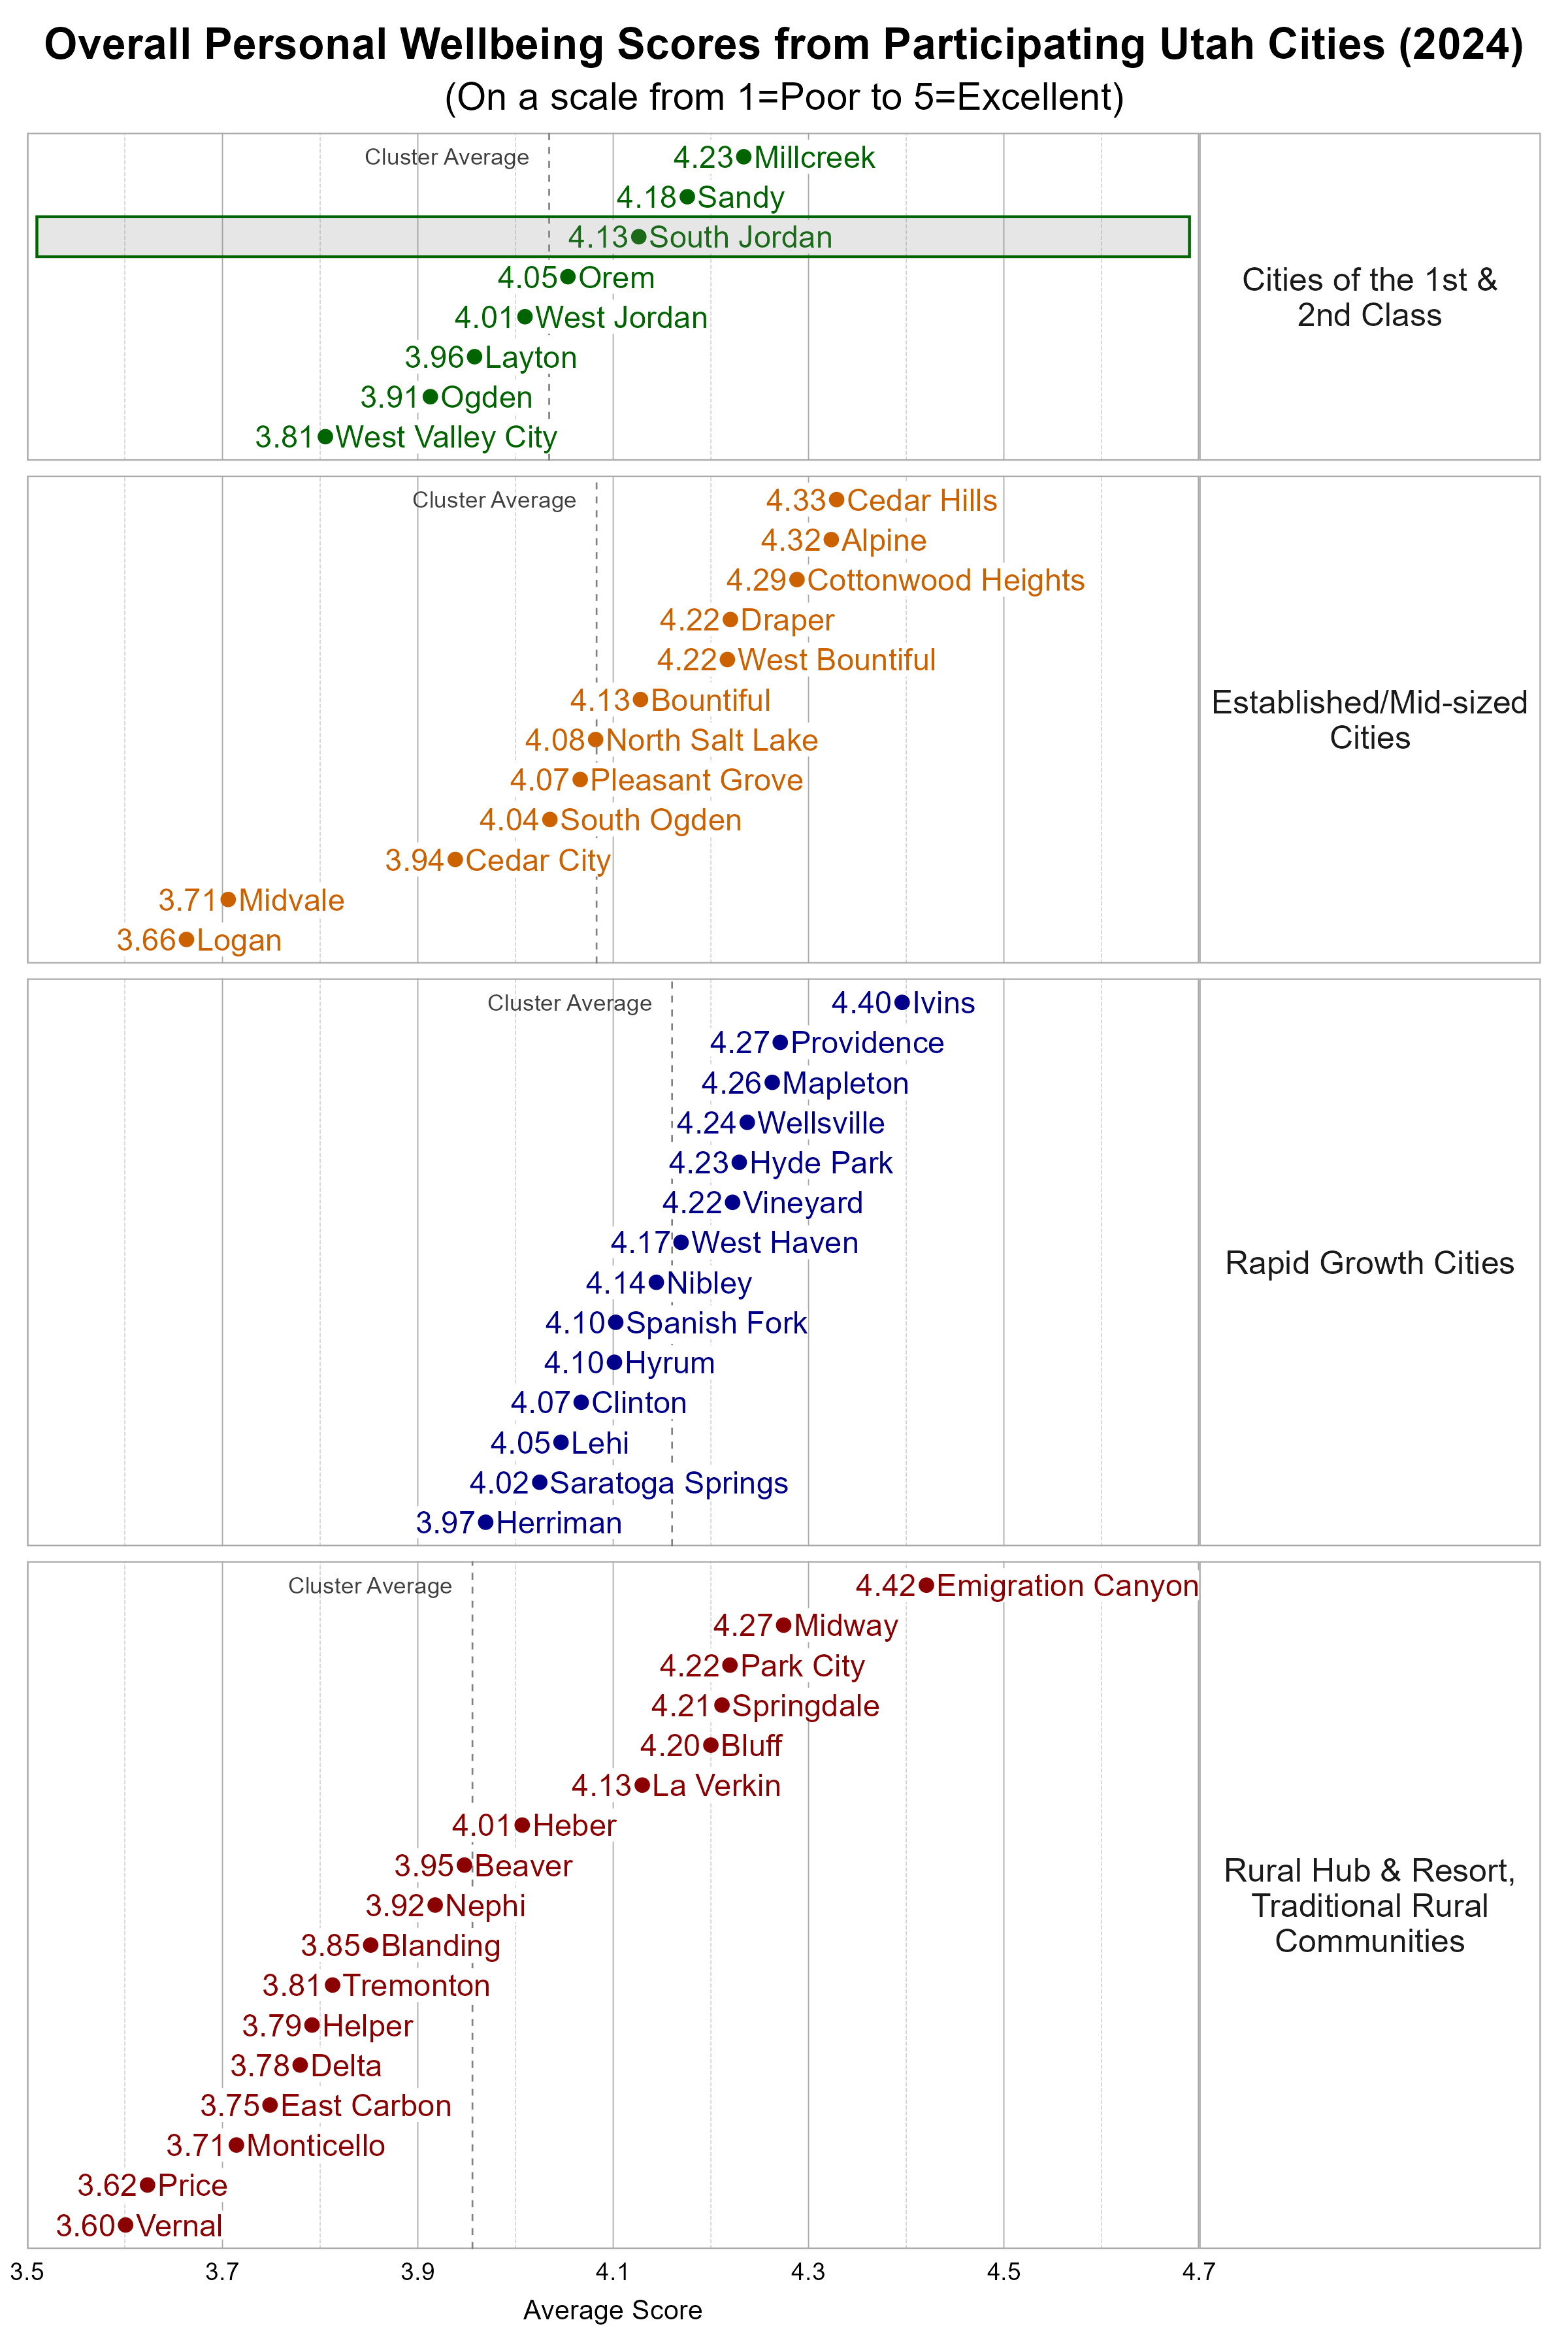
The Utah League of Cities and Towns clusters cities and towns into five different categories based on size and growth rates. We utilize these clusters in our analysis. South Jordan is classified as a City of the 1st and 2nd Class. Some cities may fit within more than one cluster.
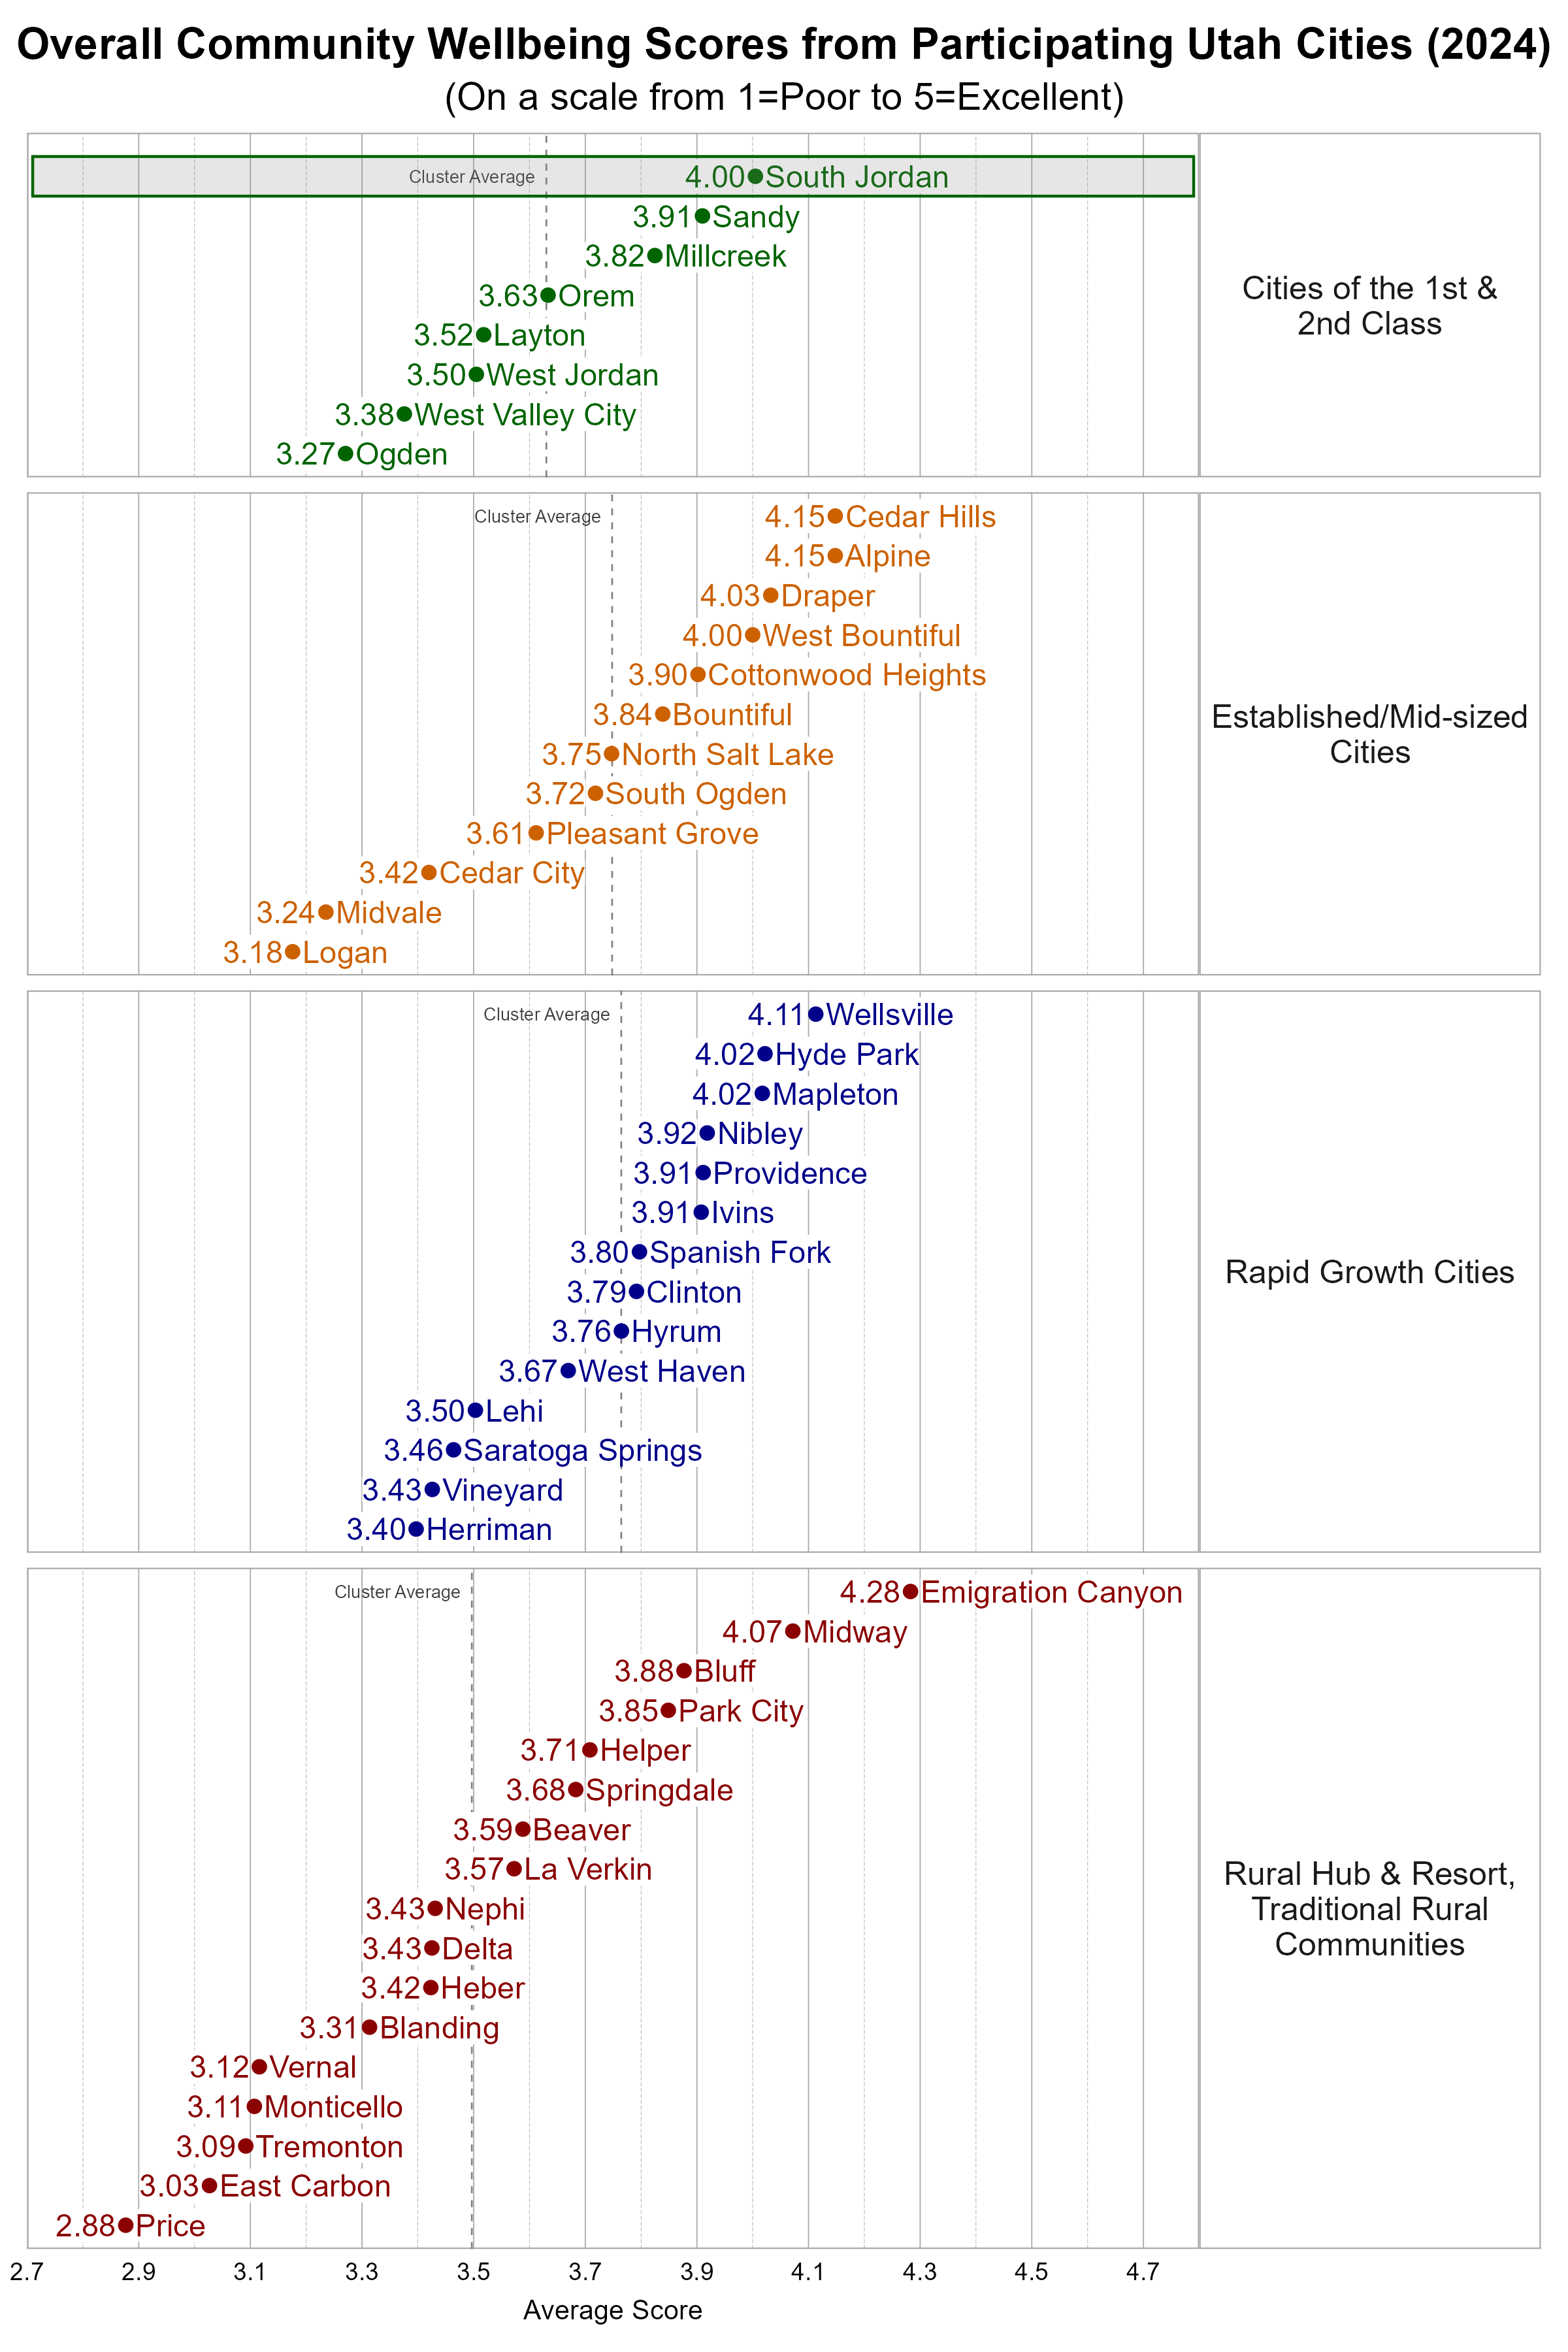
Within the more Urban city cluster, South Jordan was slightly above the average overall personal wellbeing score and well above the average overall community wellbeing score.
Wellbeing Domains in South Jordan
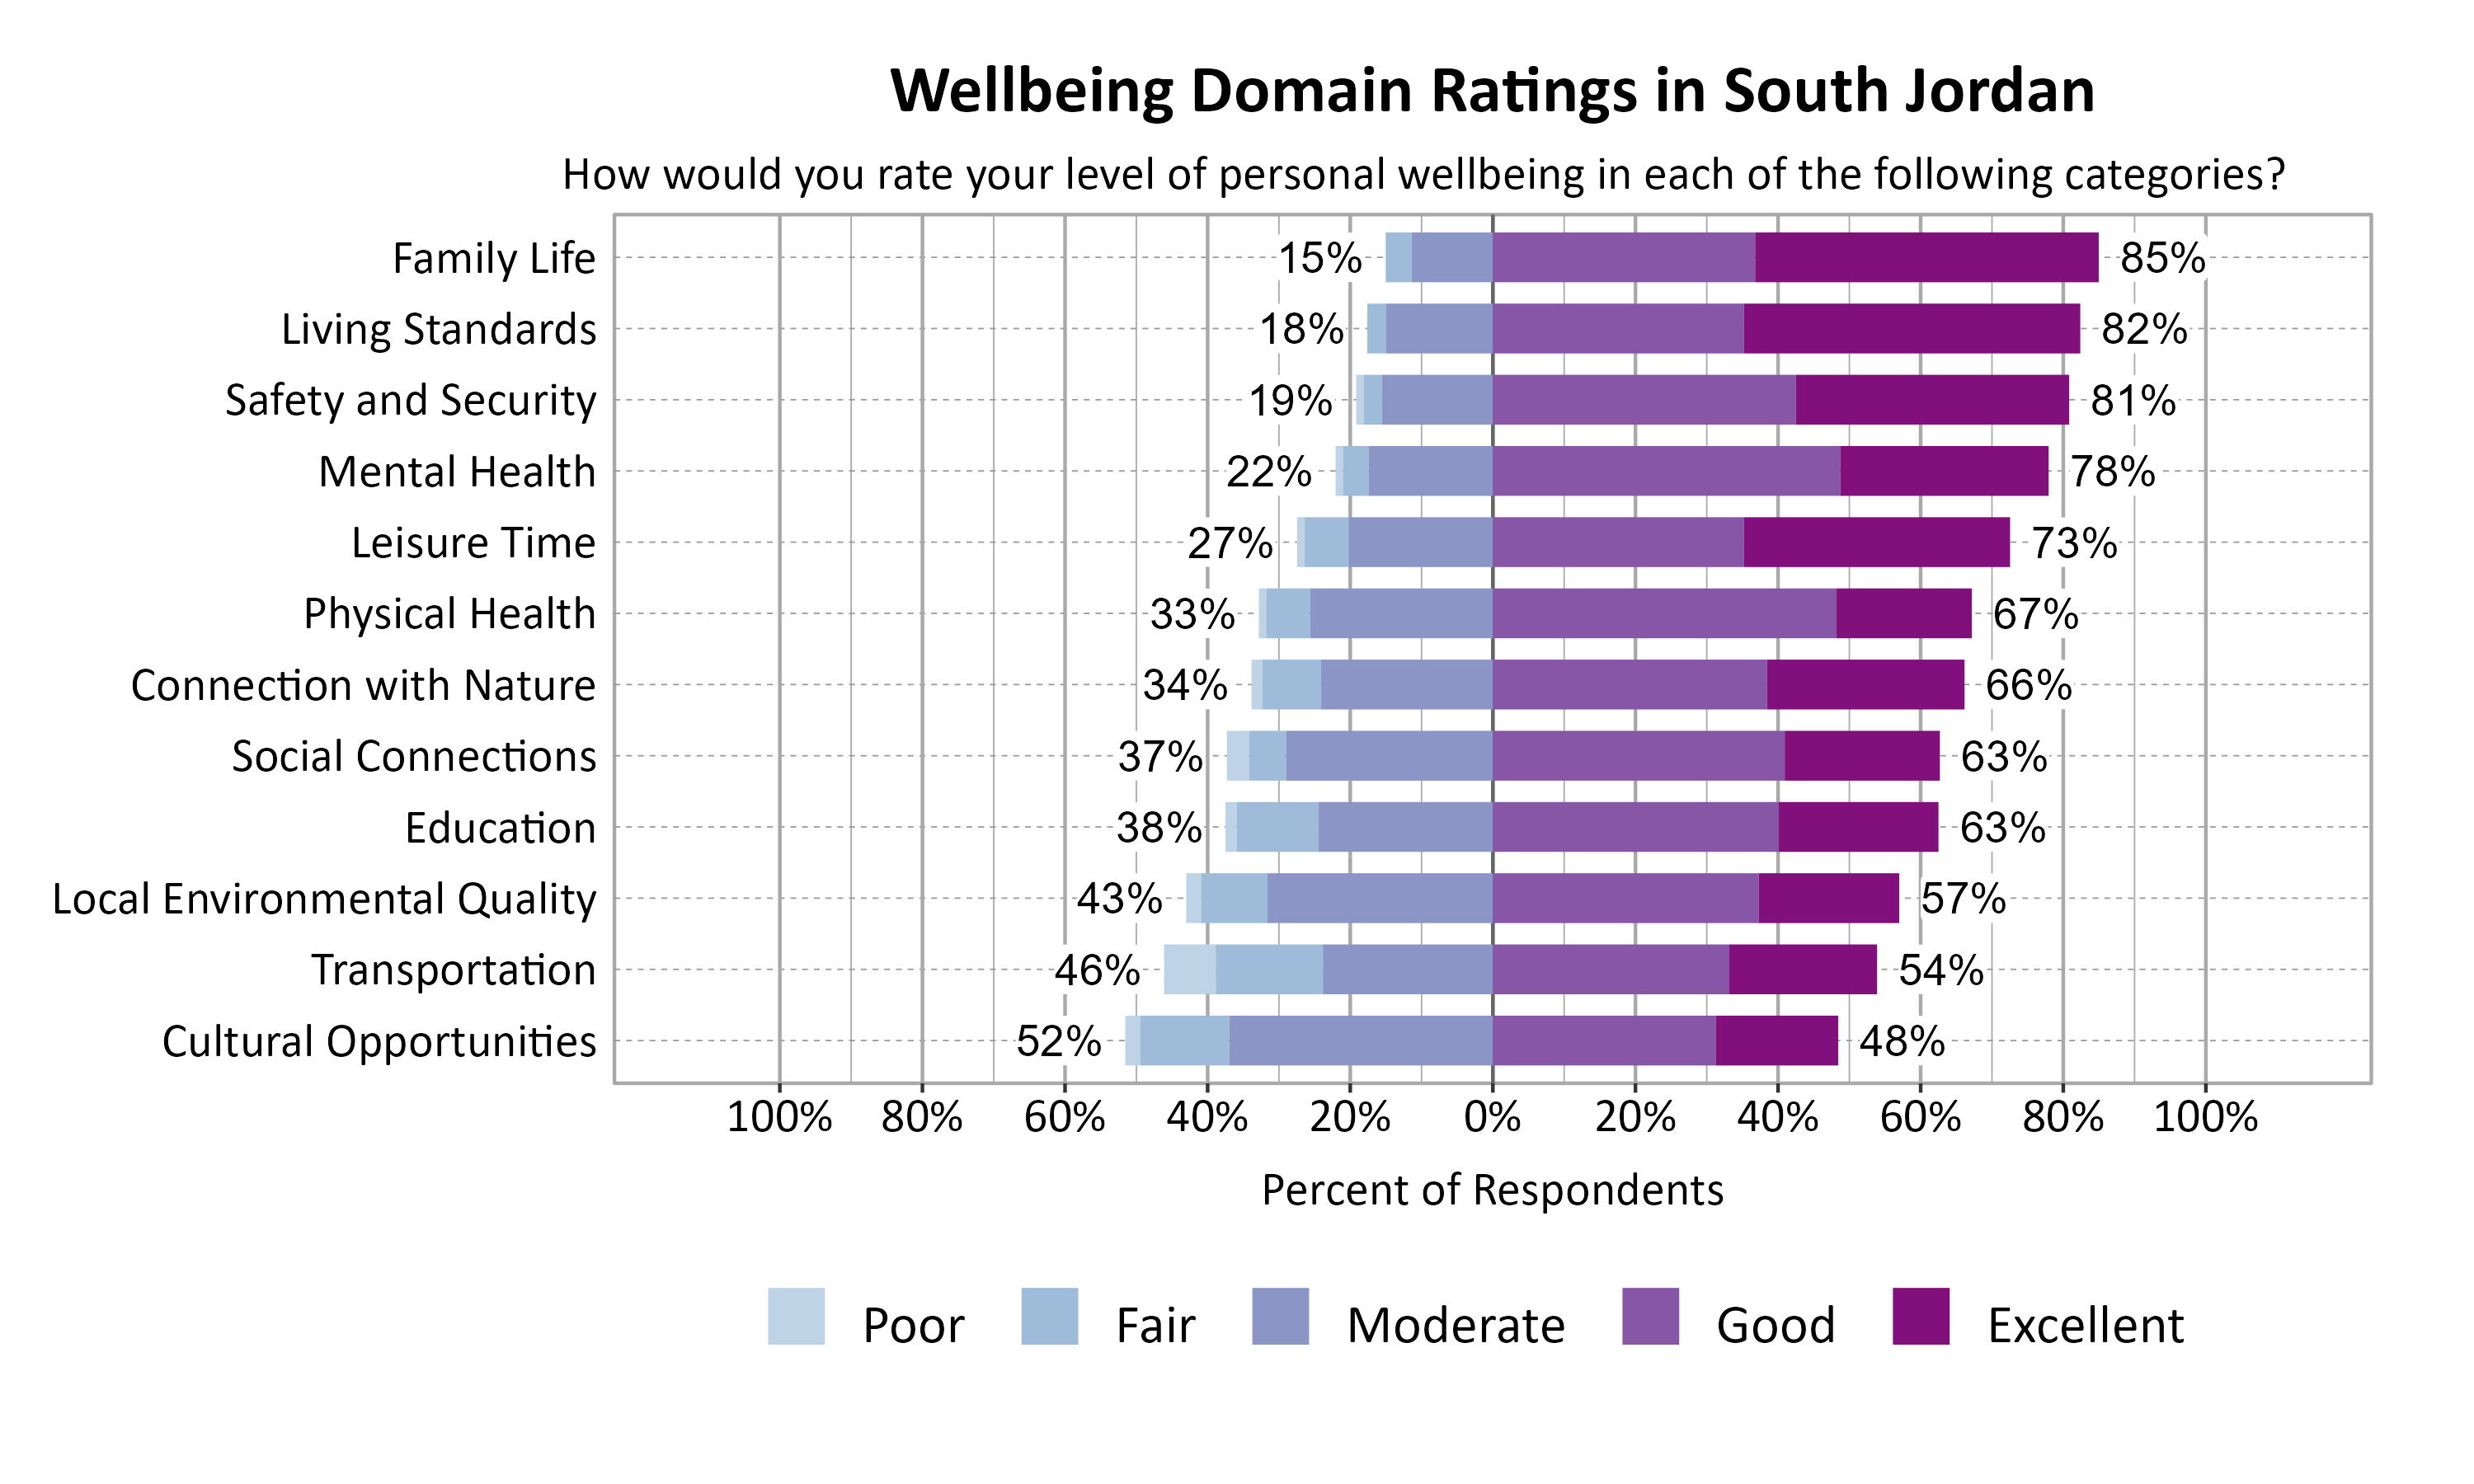
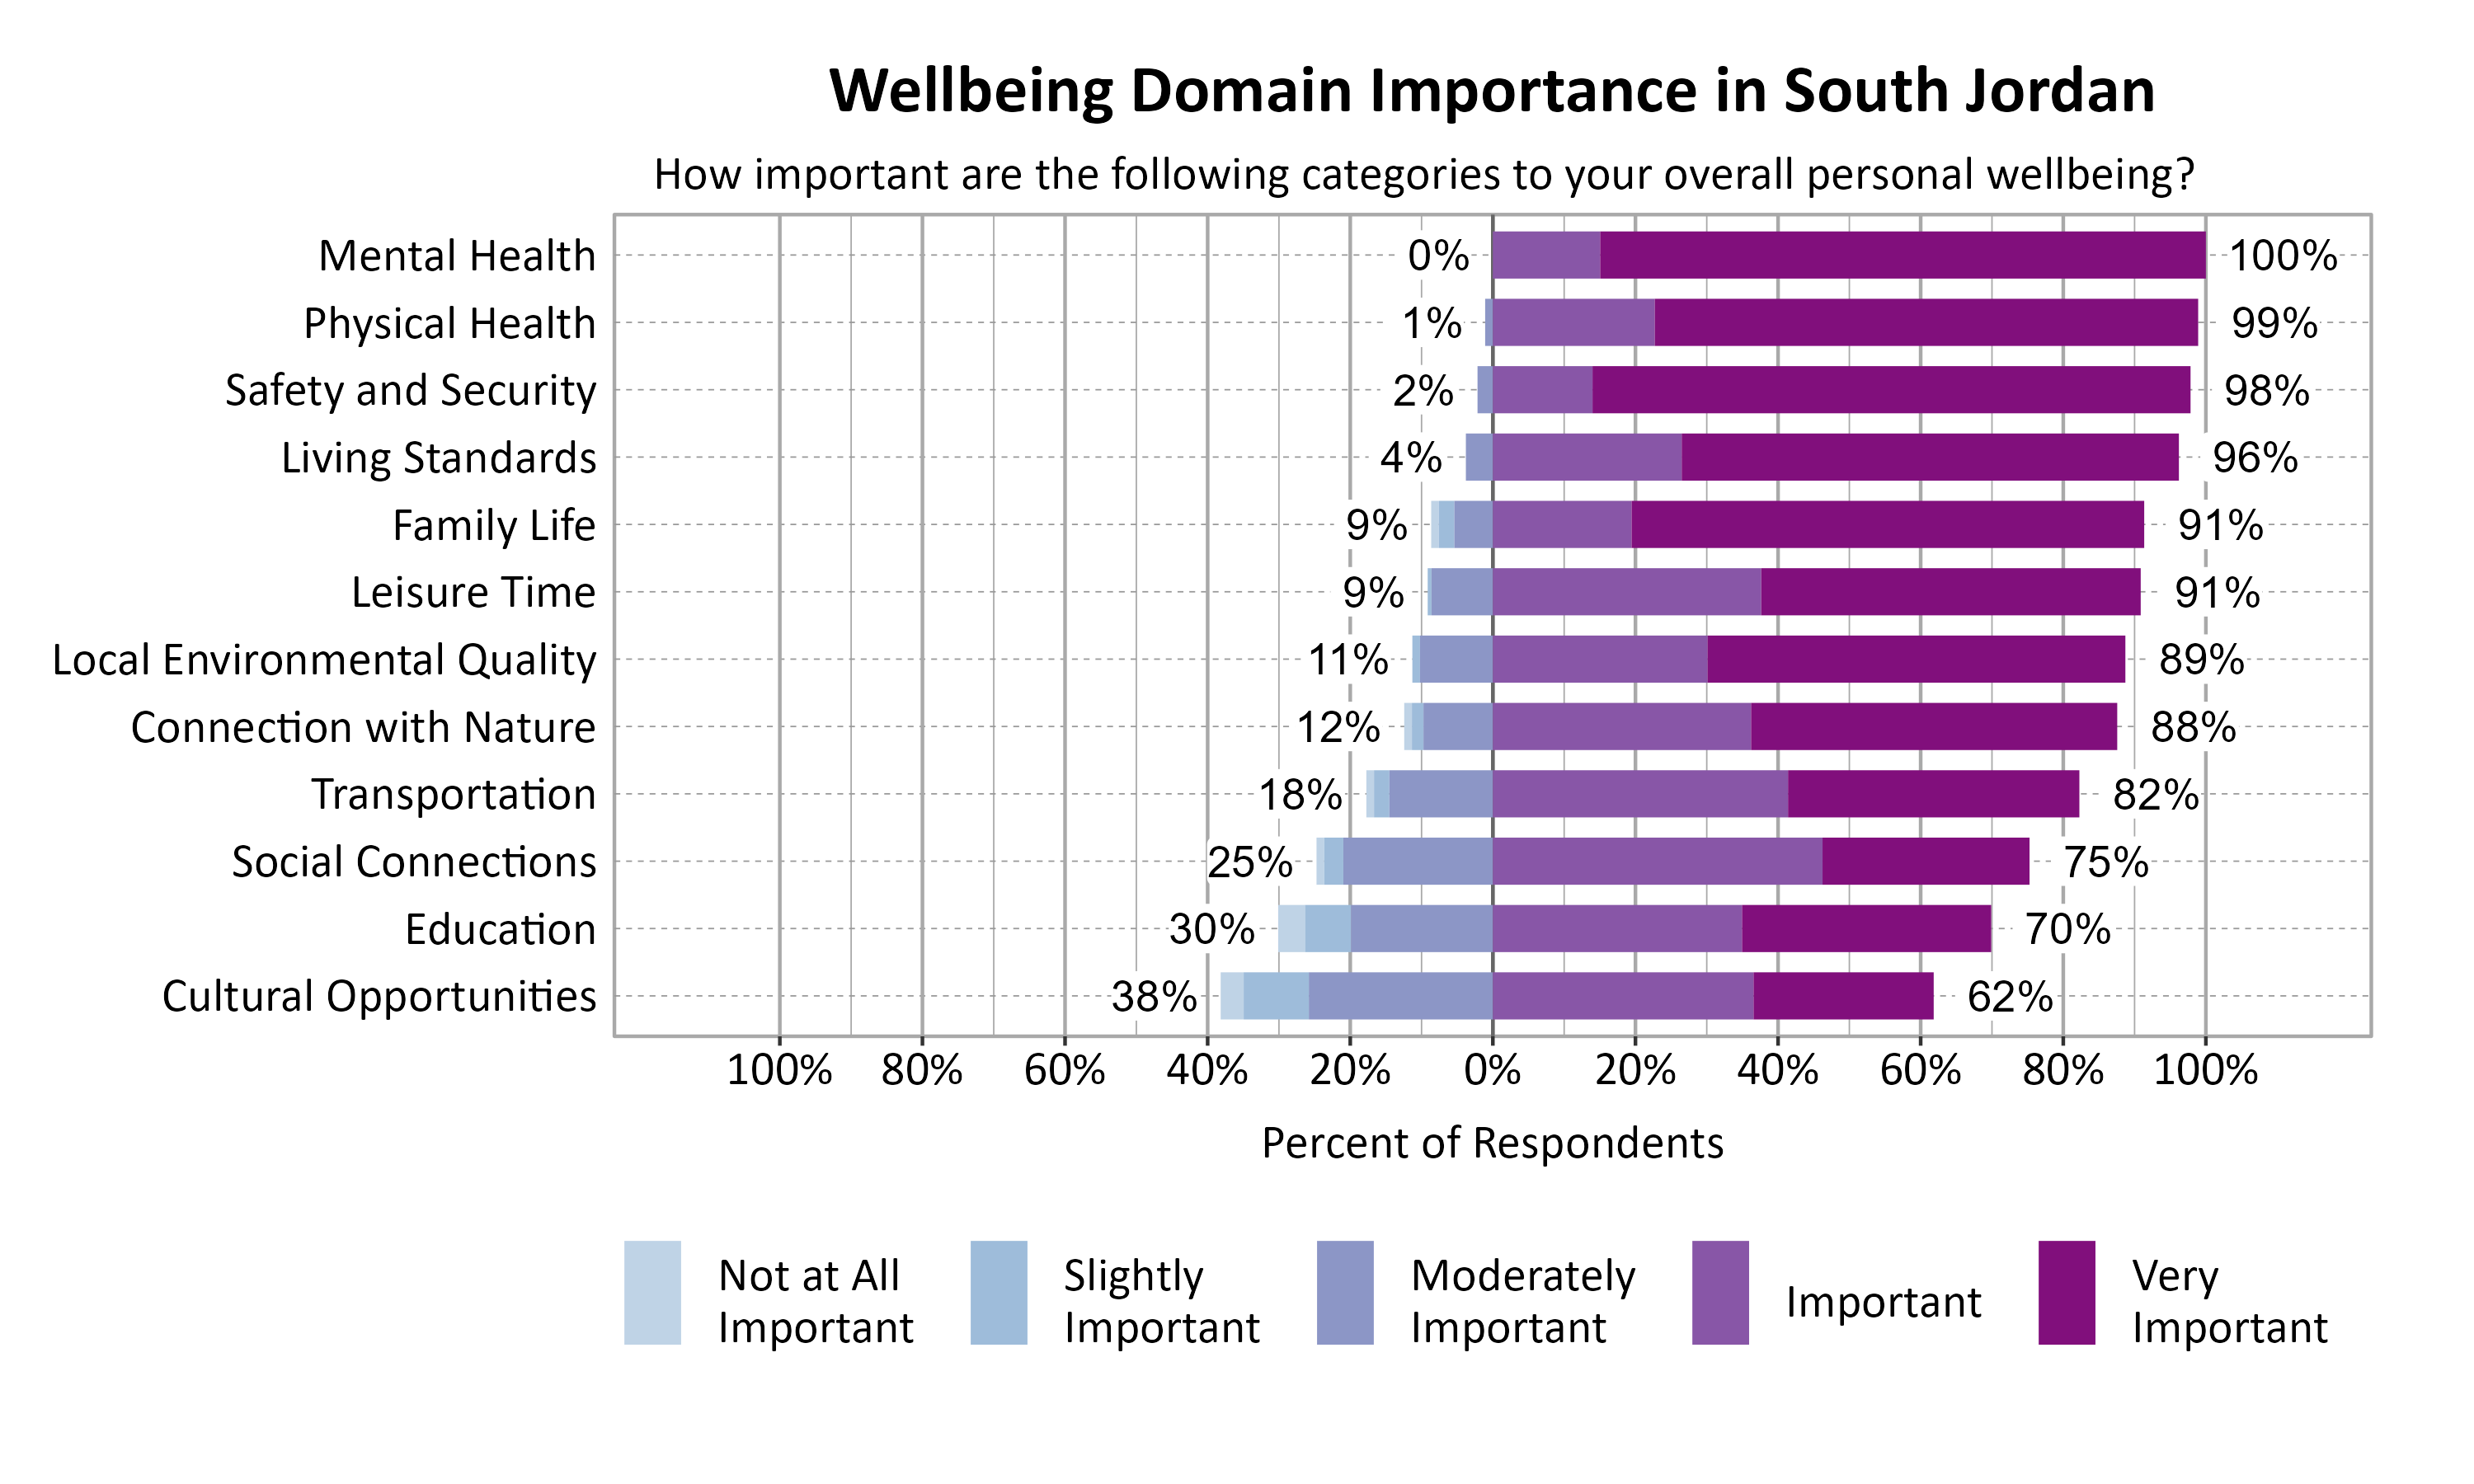
According to national and international entities that track wellbeing, there are a number of common dimensions or domains of wellbeing. Survey respondents rated twelve domains on a 5-point scale from poor to excellent. They were also asked to indicate the importance of each domain to their overall personal wellbeing on a 5-point scale from not at all important to very important. The highest rated wellbeing domains for respondents in South Jordan were Family Life (85%), Living Standards (82%), and Safety and Security (81%). The most important wellbeing domains were Mental Health (100%), Physical Health (99%), and Safety and Security (98%).
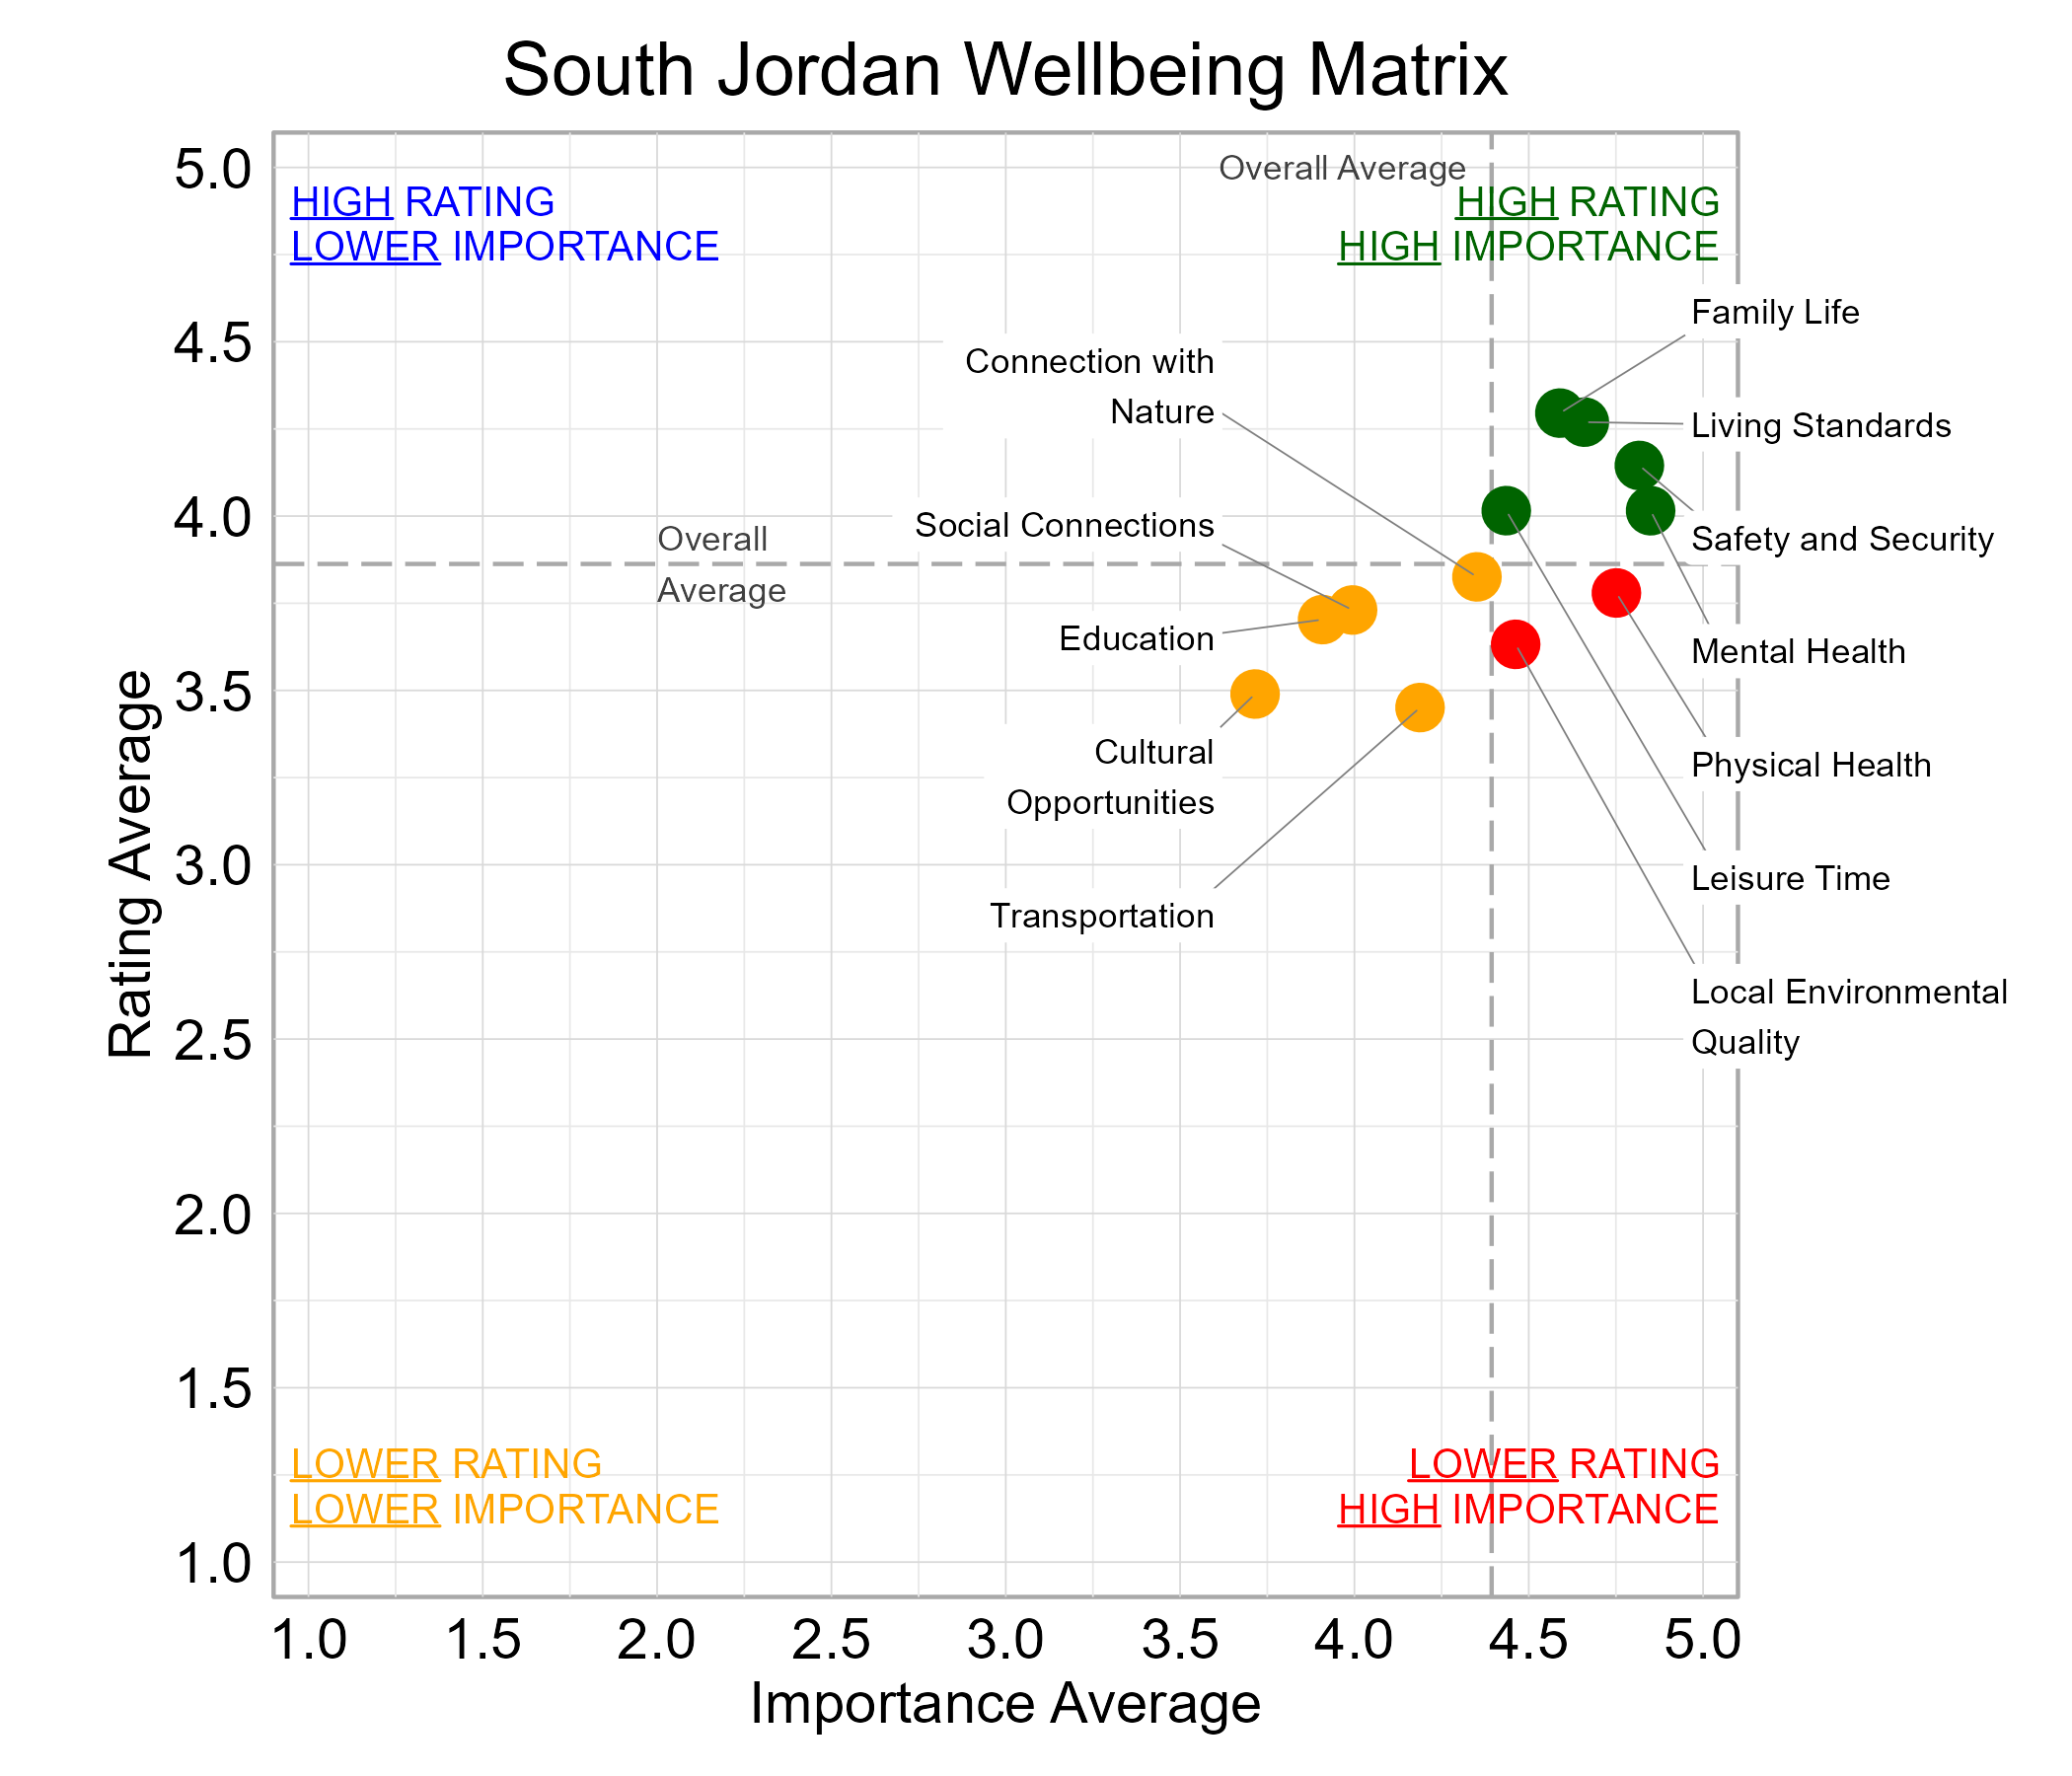
Wellbeing Matrix for South Jordan
The graph below illustrates the relationship between the average rating and the average importance of wellbeing domains for survey respondents from South Jordan. Family Life, Leisure Time, Living Standards, Mental Health, and Safety and Security were highly important and rated above average among the domains. Local Environmental Quality and Physical Health fell in the “red zone” of higher importance and lower ratings.
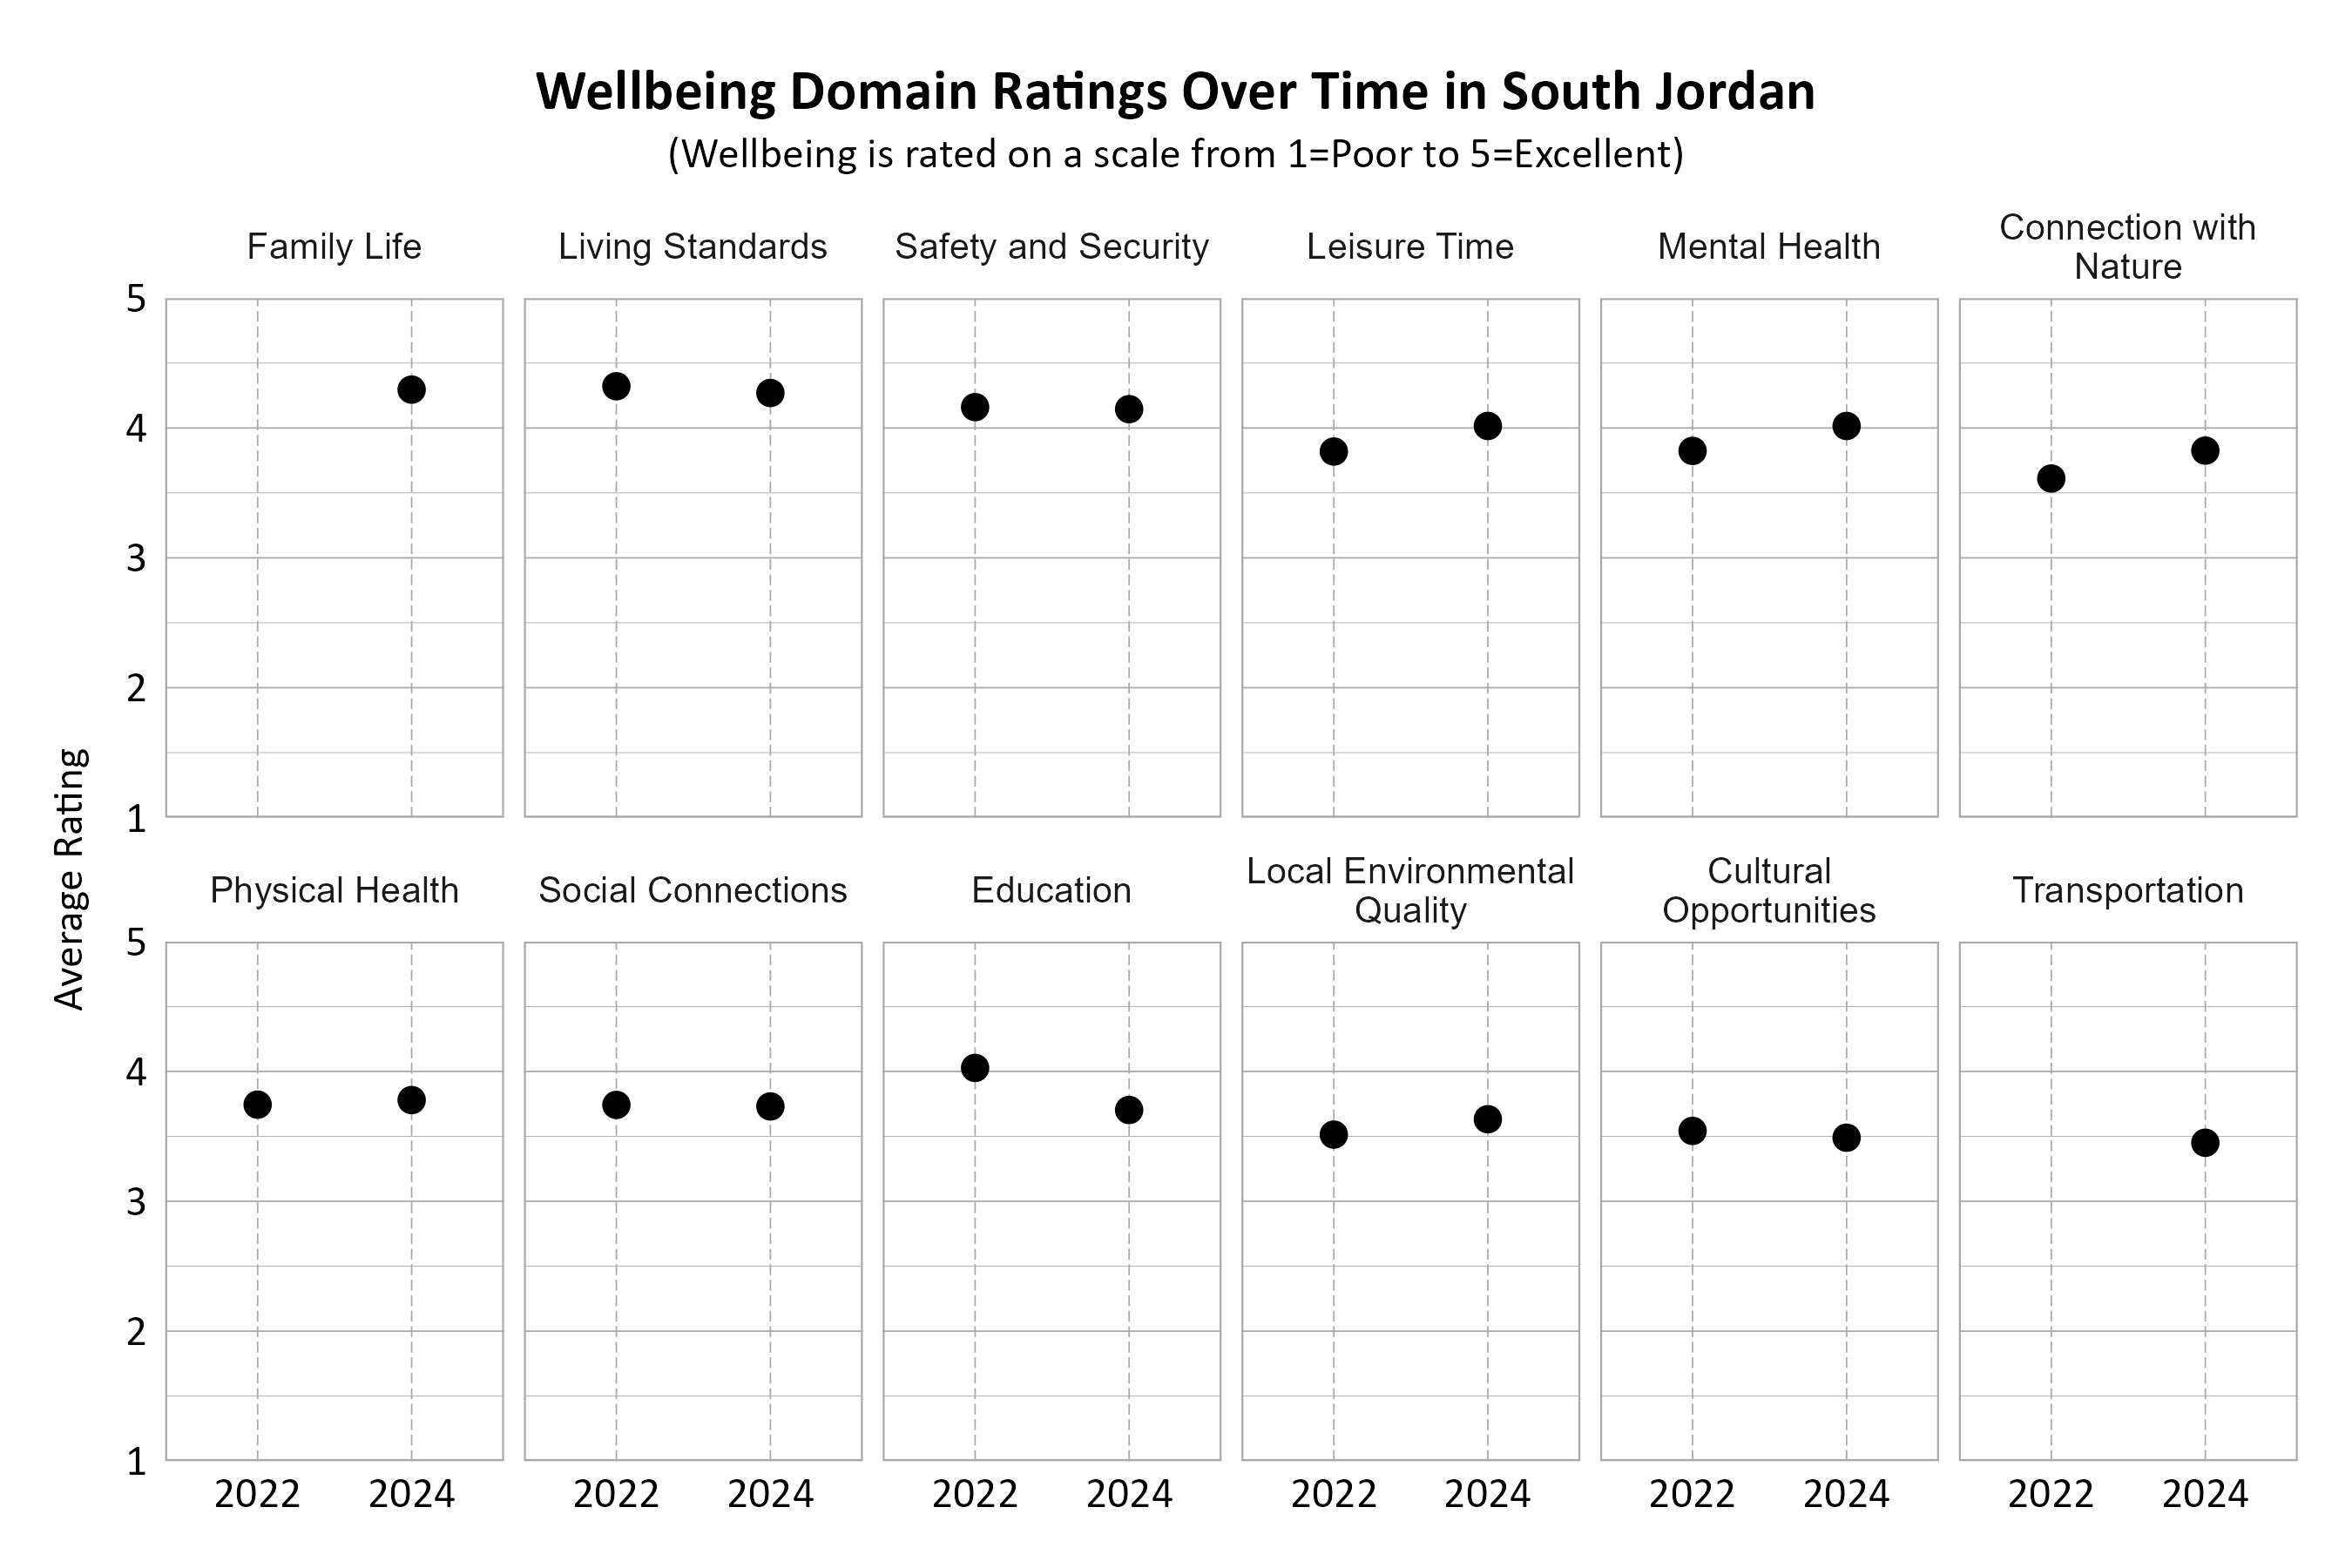
Wellbeing Domains Over Time in South Jordan
The graphs below show how the domains were rated over the years by South Jordan residents. The number of respondents changed over time. Note that the two domains Family Life and Transportation were new categories in the 2024 survey and were not measured in previous years. Most domains have either stayed the same or increased from 2022 to 2024, except for Education which decreased. Living Standards and Safety and Security have been among the highest rated domains in each survey year.
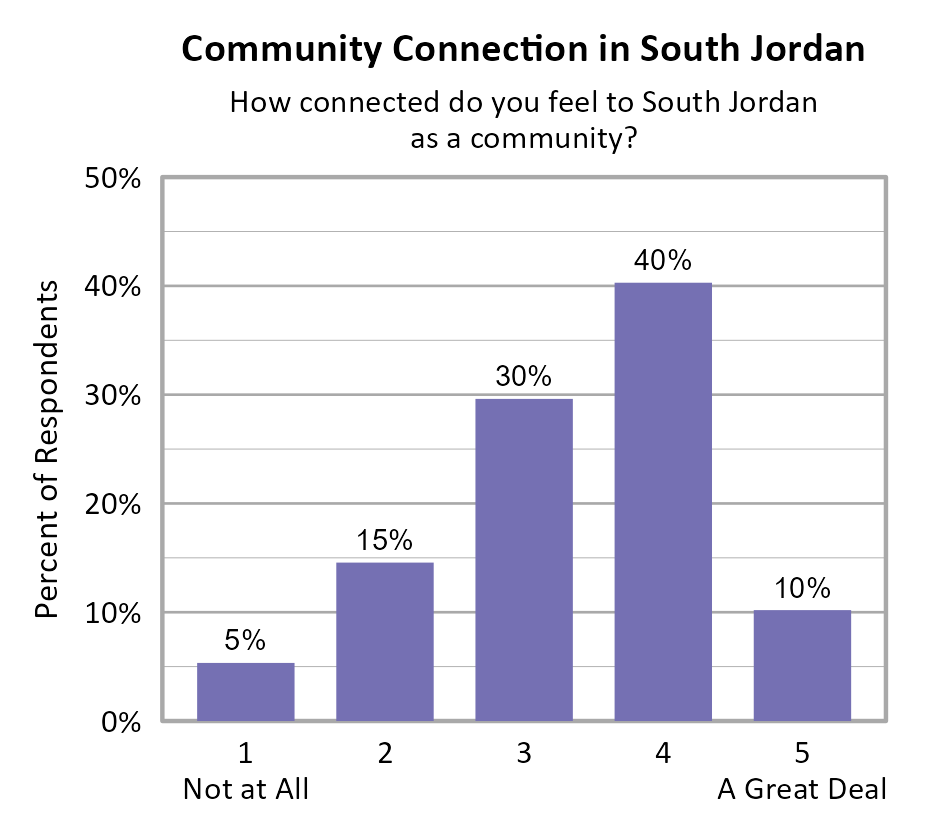
Community Connection in South Jordan
Survey participants were asked about how connected they feel to South Jordan on a 5-point scale from not at all (1) to a great deal (5), and the average score of all respondents was 3.35. In South Jordan, ZIP code 84095 had statistically higher community connection scores than ZIP code 84009.
When comparing survey data from South Jordan over the years as shown in the information below, we can see that the average community connection score improved between 2022 and 2024.
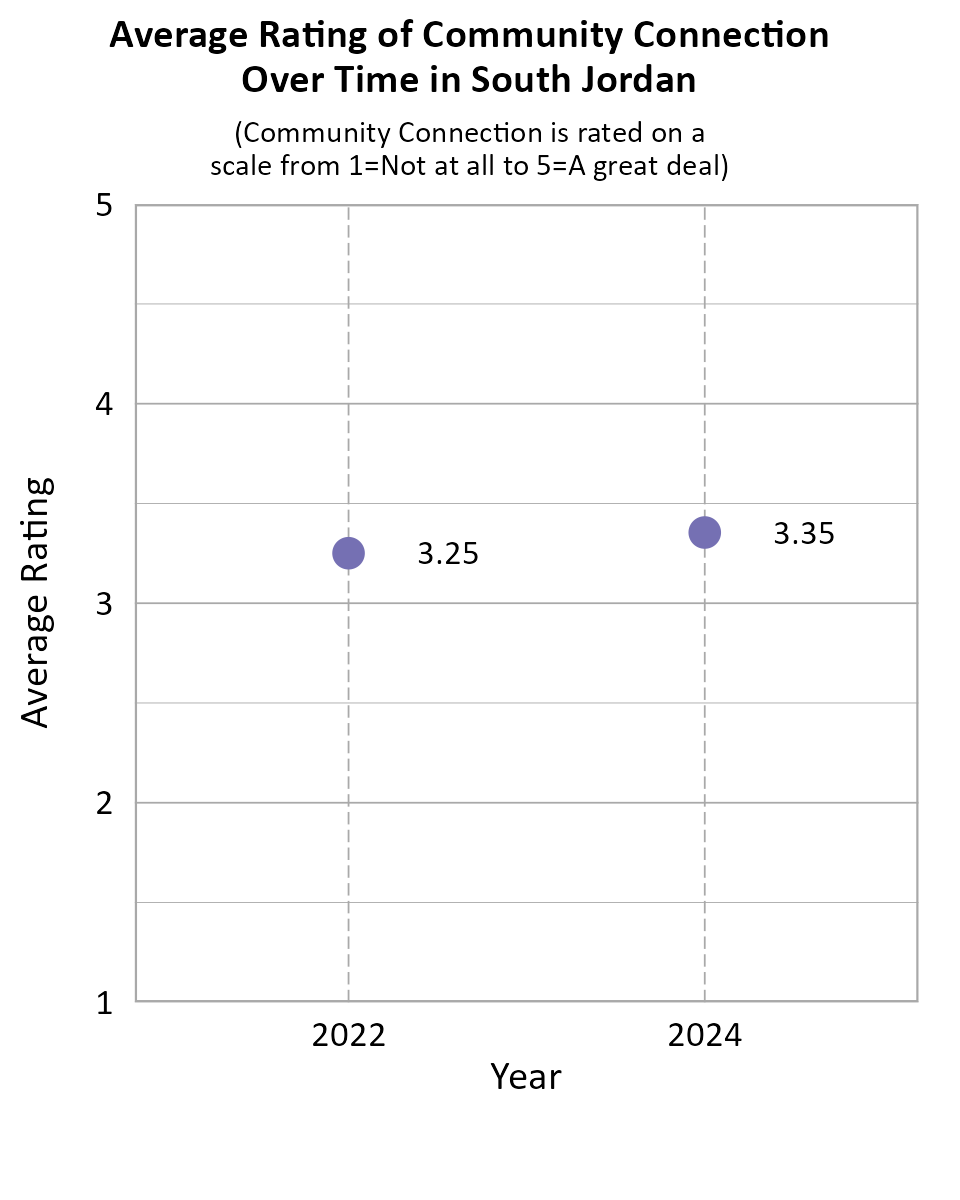
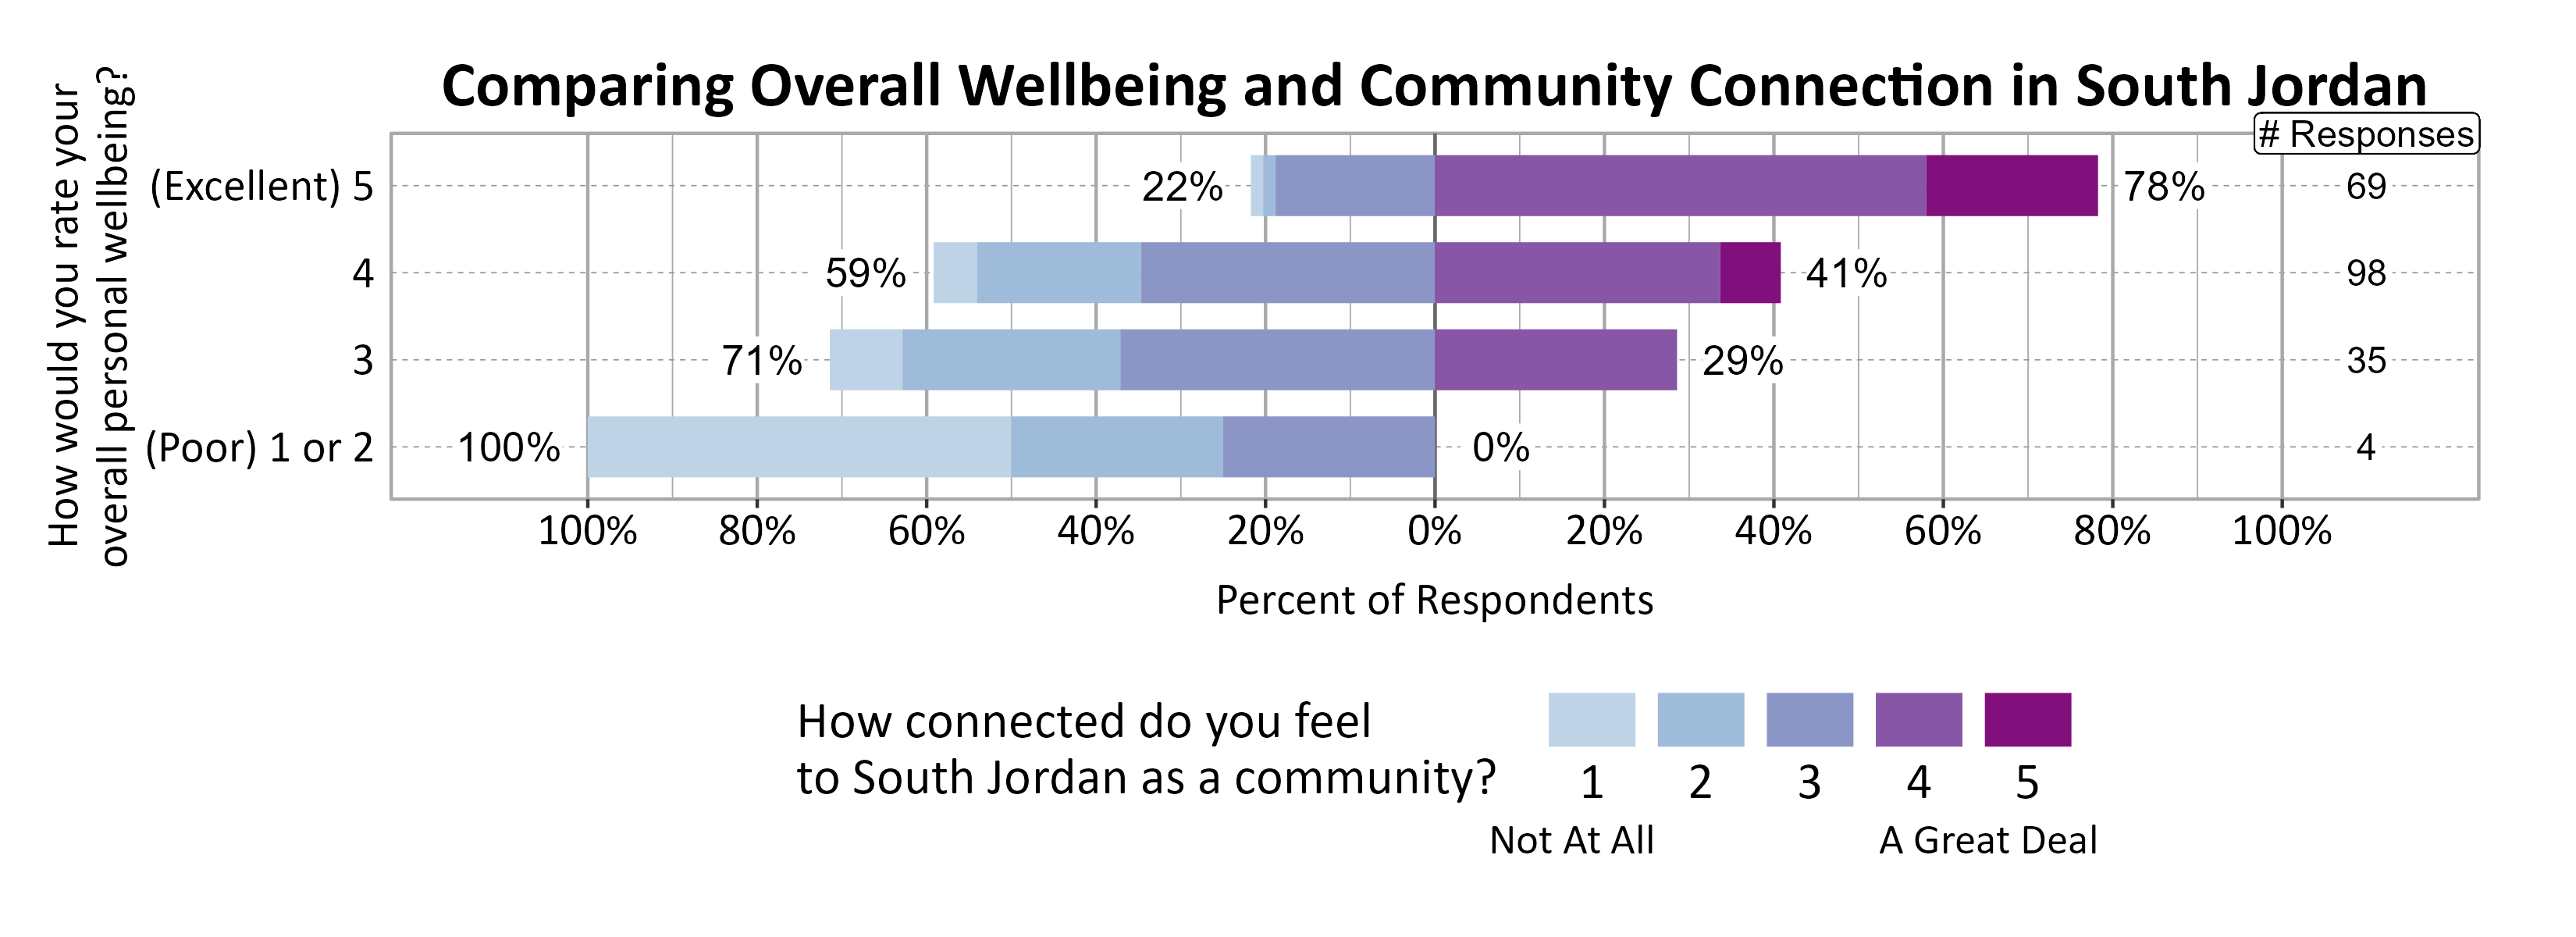
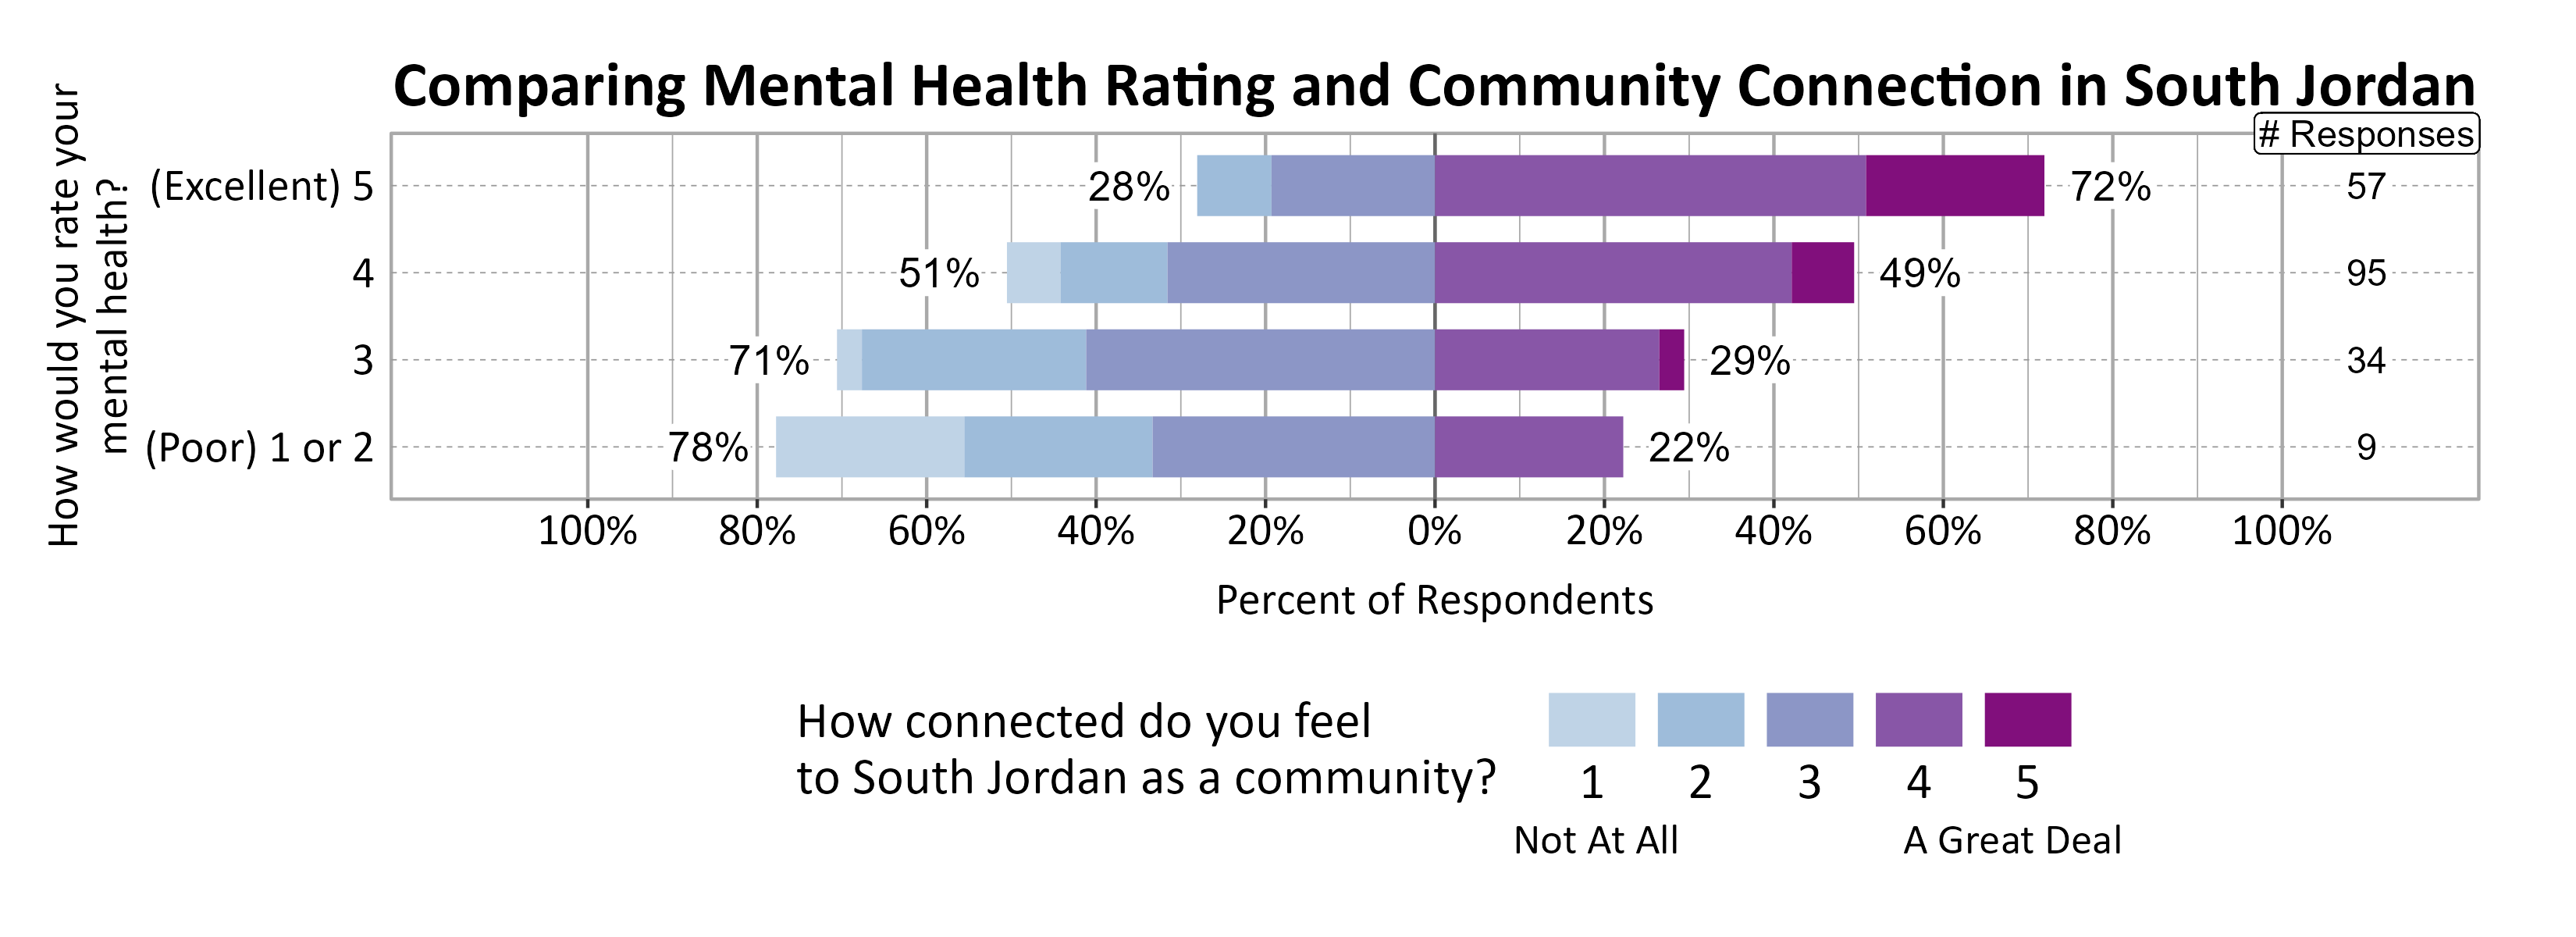
A positive relationship was found between individuals’ community connection and overall personal wellbeing as well as mental health.
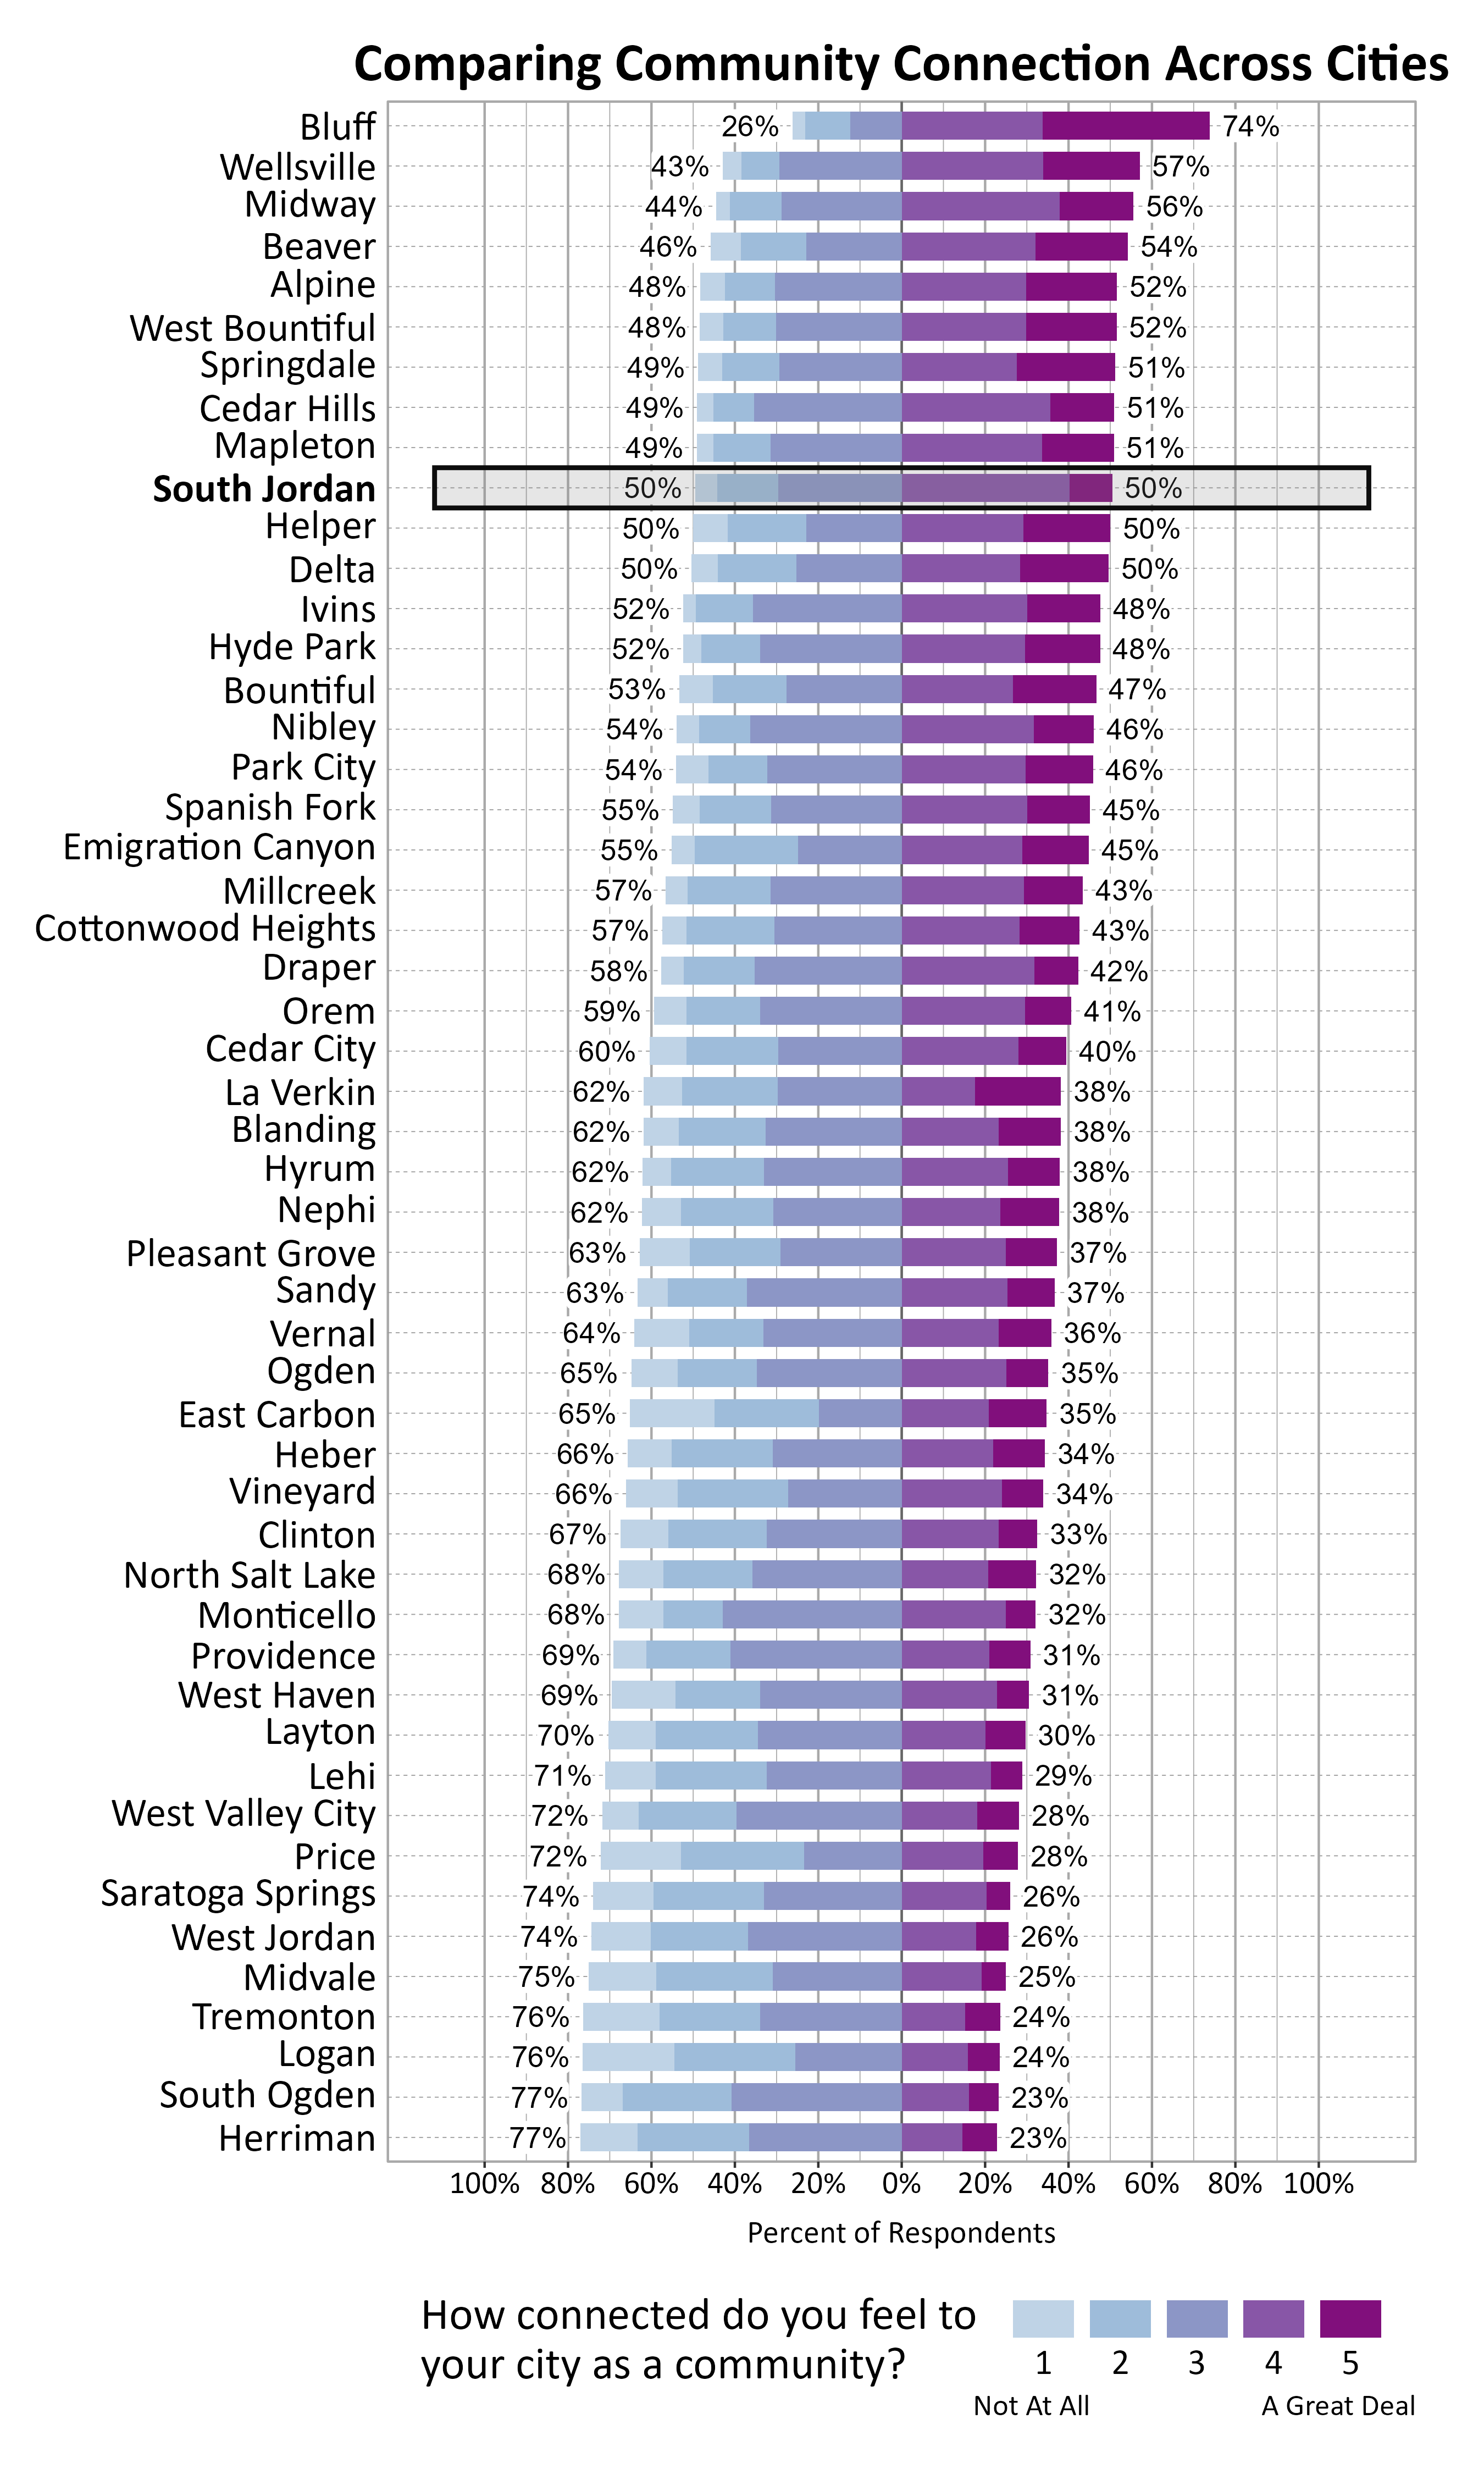
The graph below shows how Wellbeing Project cities and towns compare on feelings of community connection based on the percentage of respondents who answered 4 or a 5 on a 5-point scale from “not at all” to “a great deal” connected to their city or town. South Jordan ranked 10 out of the 51 cities that participated. This is very high compared to other urban survey locations.
Participation in Recreation and Nature-Related Activities
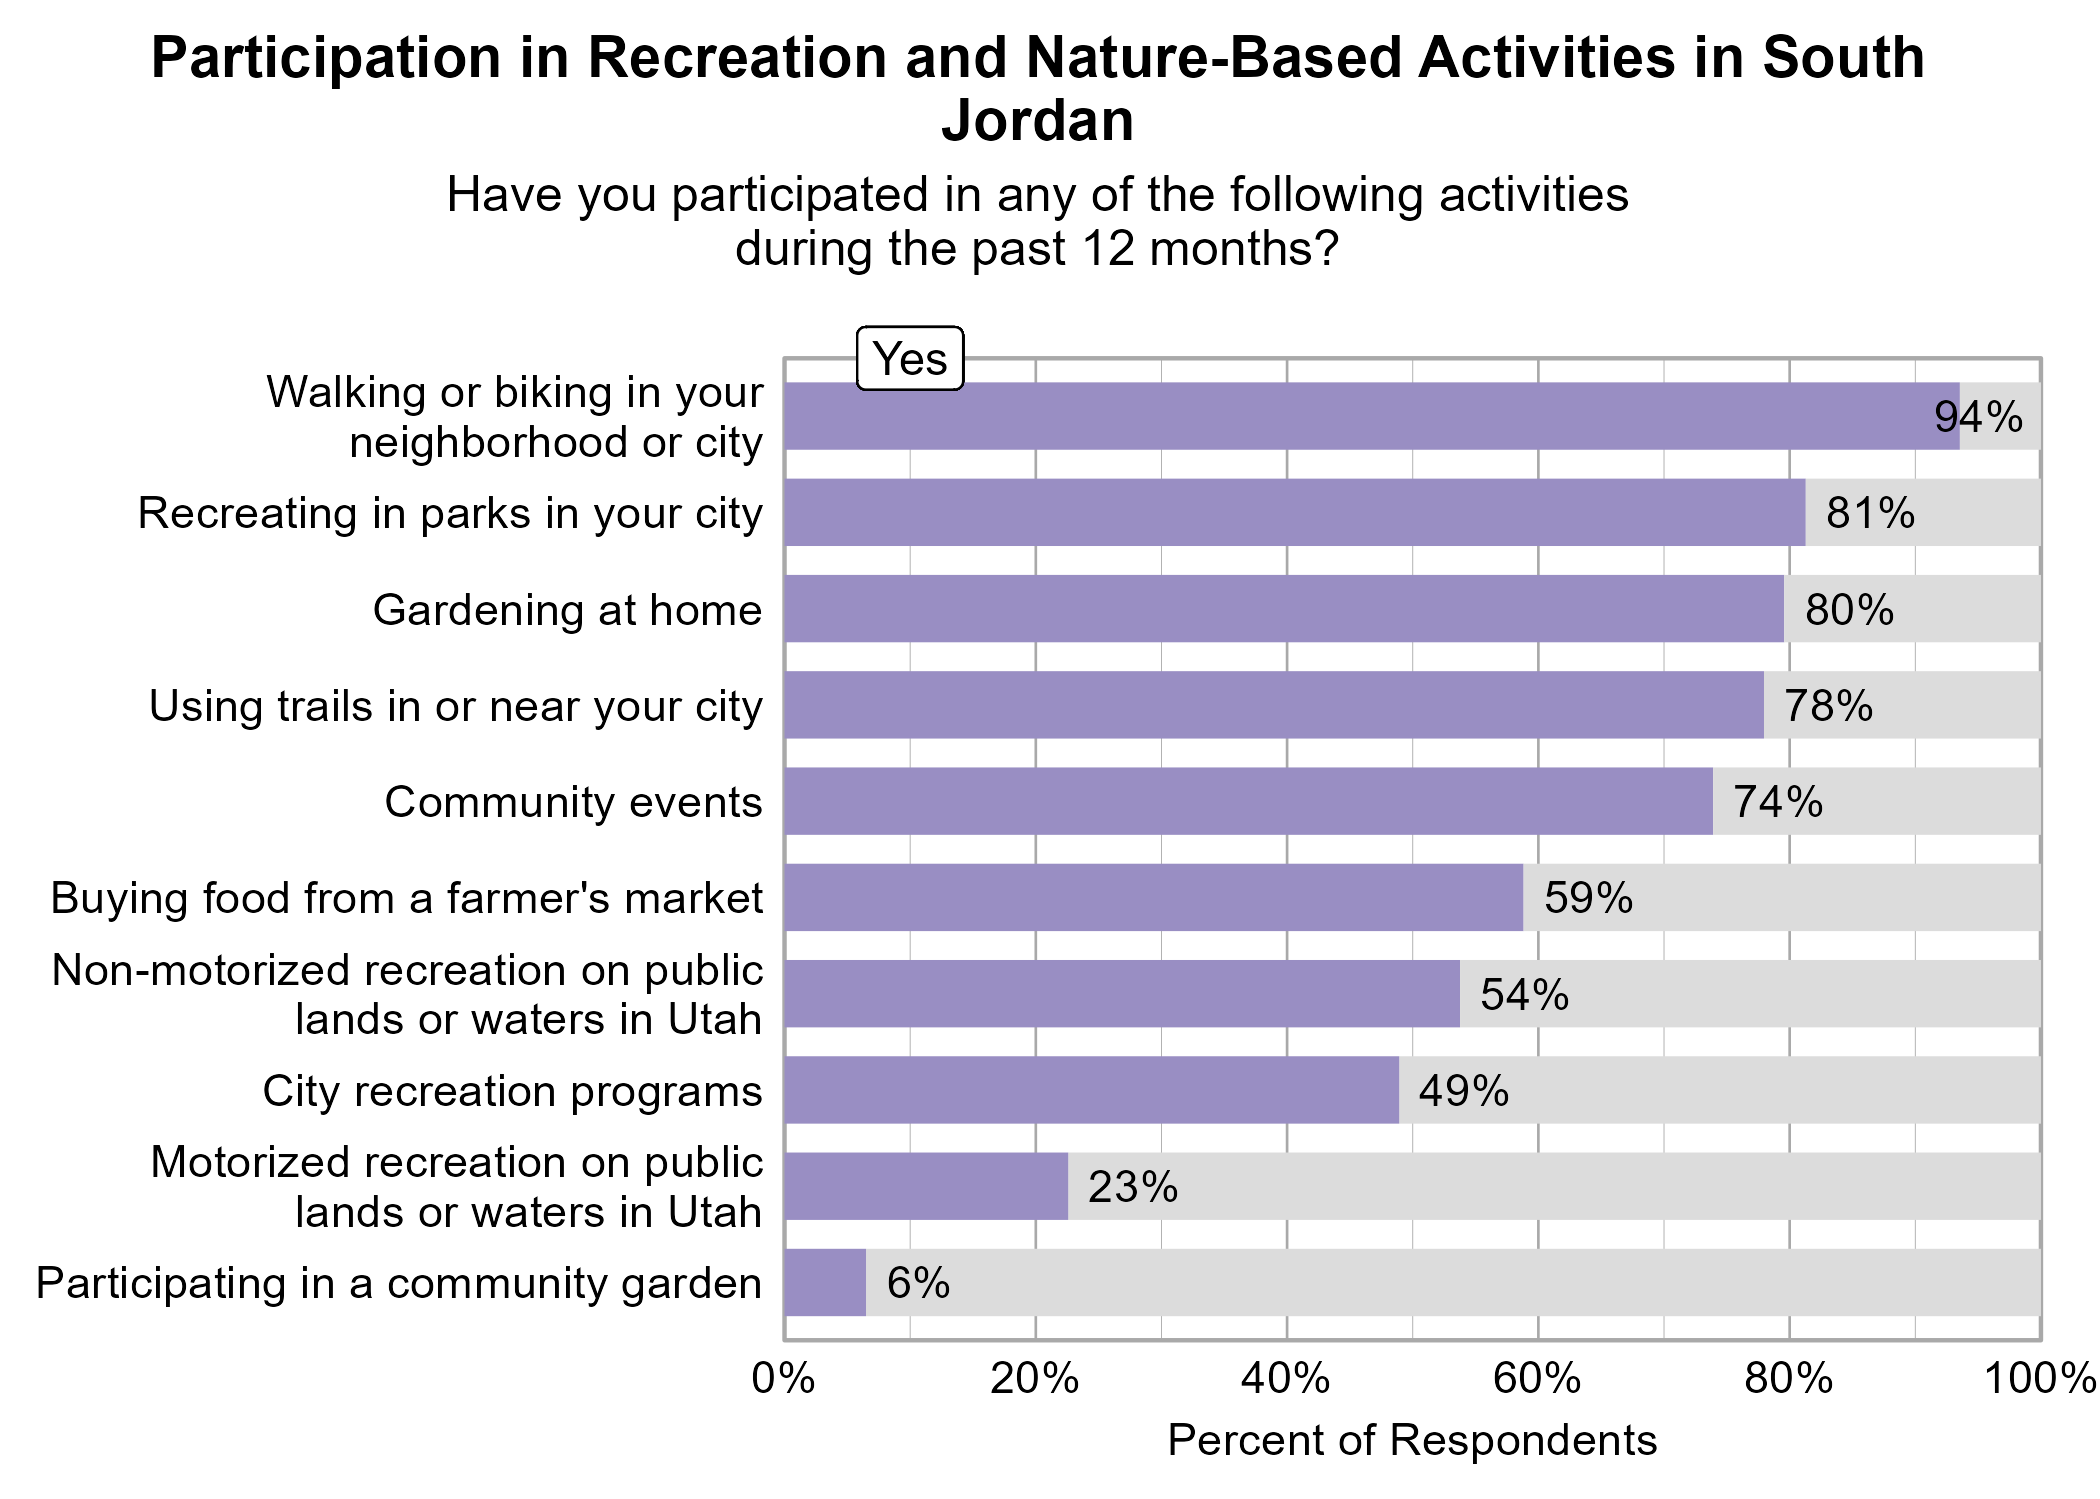
Respondents were asked to indicate whether or not they participated in various activities in the last 12 months. The most popular activities were walking or biking in your neighborhood or city (94%), recreating in parks in your city (81%), gardening at home (80%), and using trails in or near your city (78%).
Participating in city recreation programs and gardening at home were significantly related to higher ratings of personal wellbeing.
None of the recreation activities above were significantly related to higher ratings of community wellbeing.
Participating in city recreation programs, participating in community events, and motorized recreation on public lands or waters in Utah were significantly related to higher ratings of community connection.
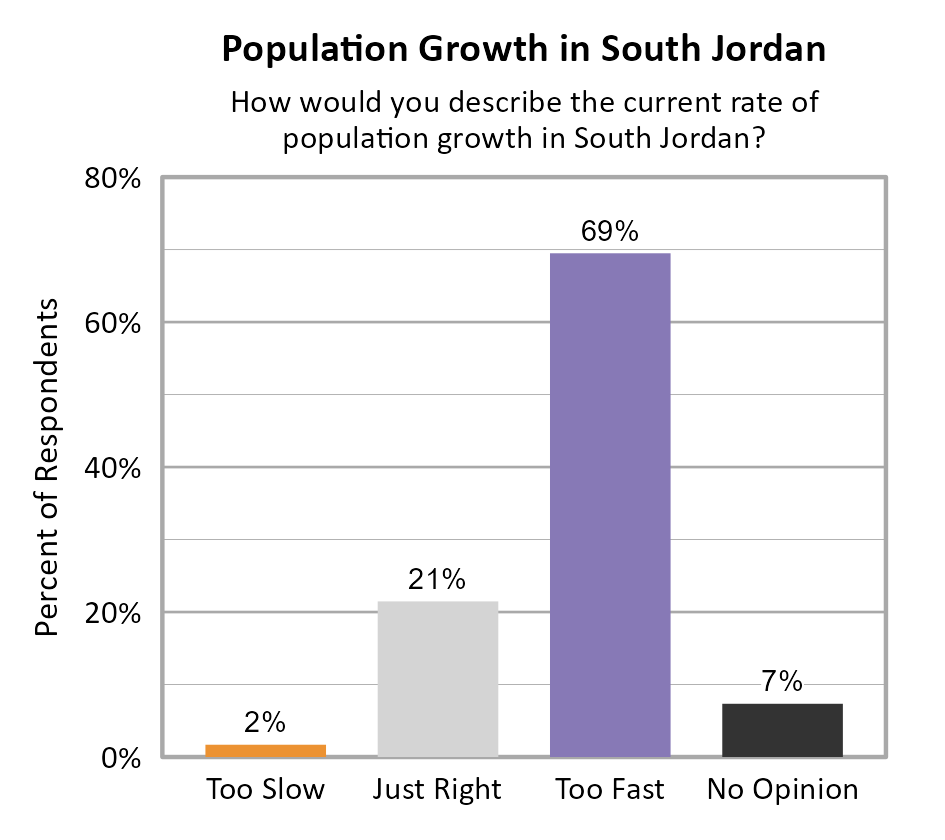
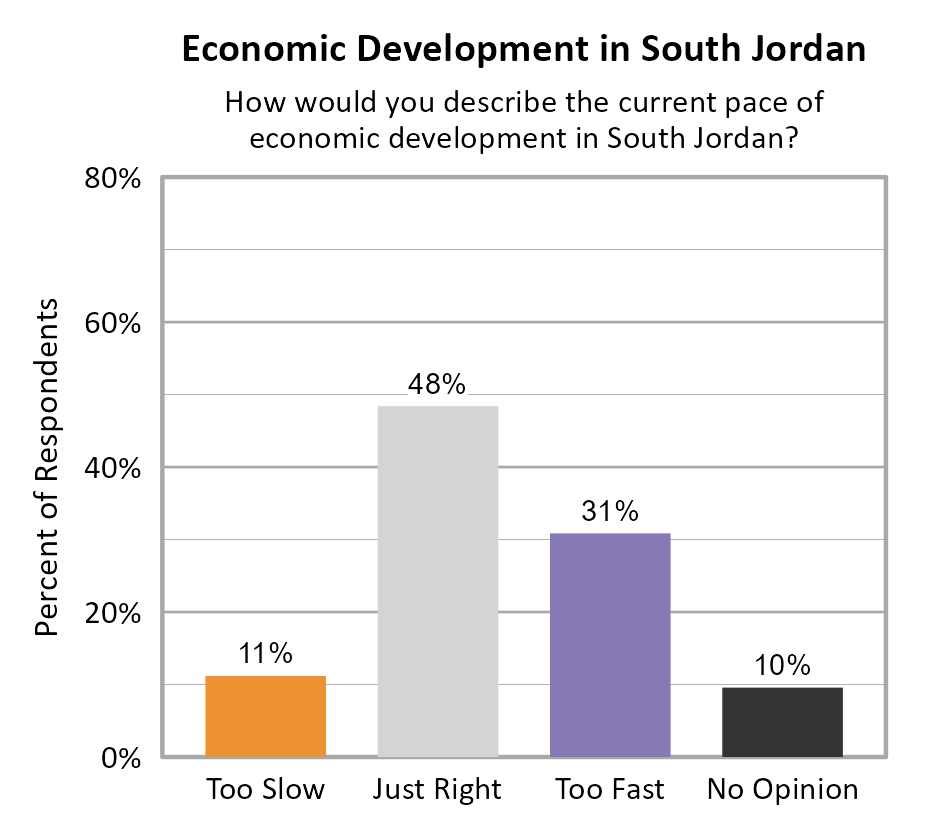
Perspectives on Population Growth and Economic Development
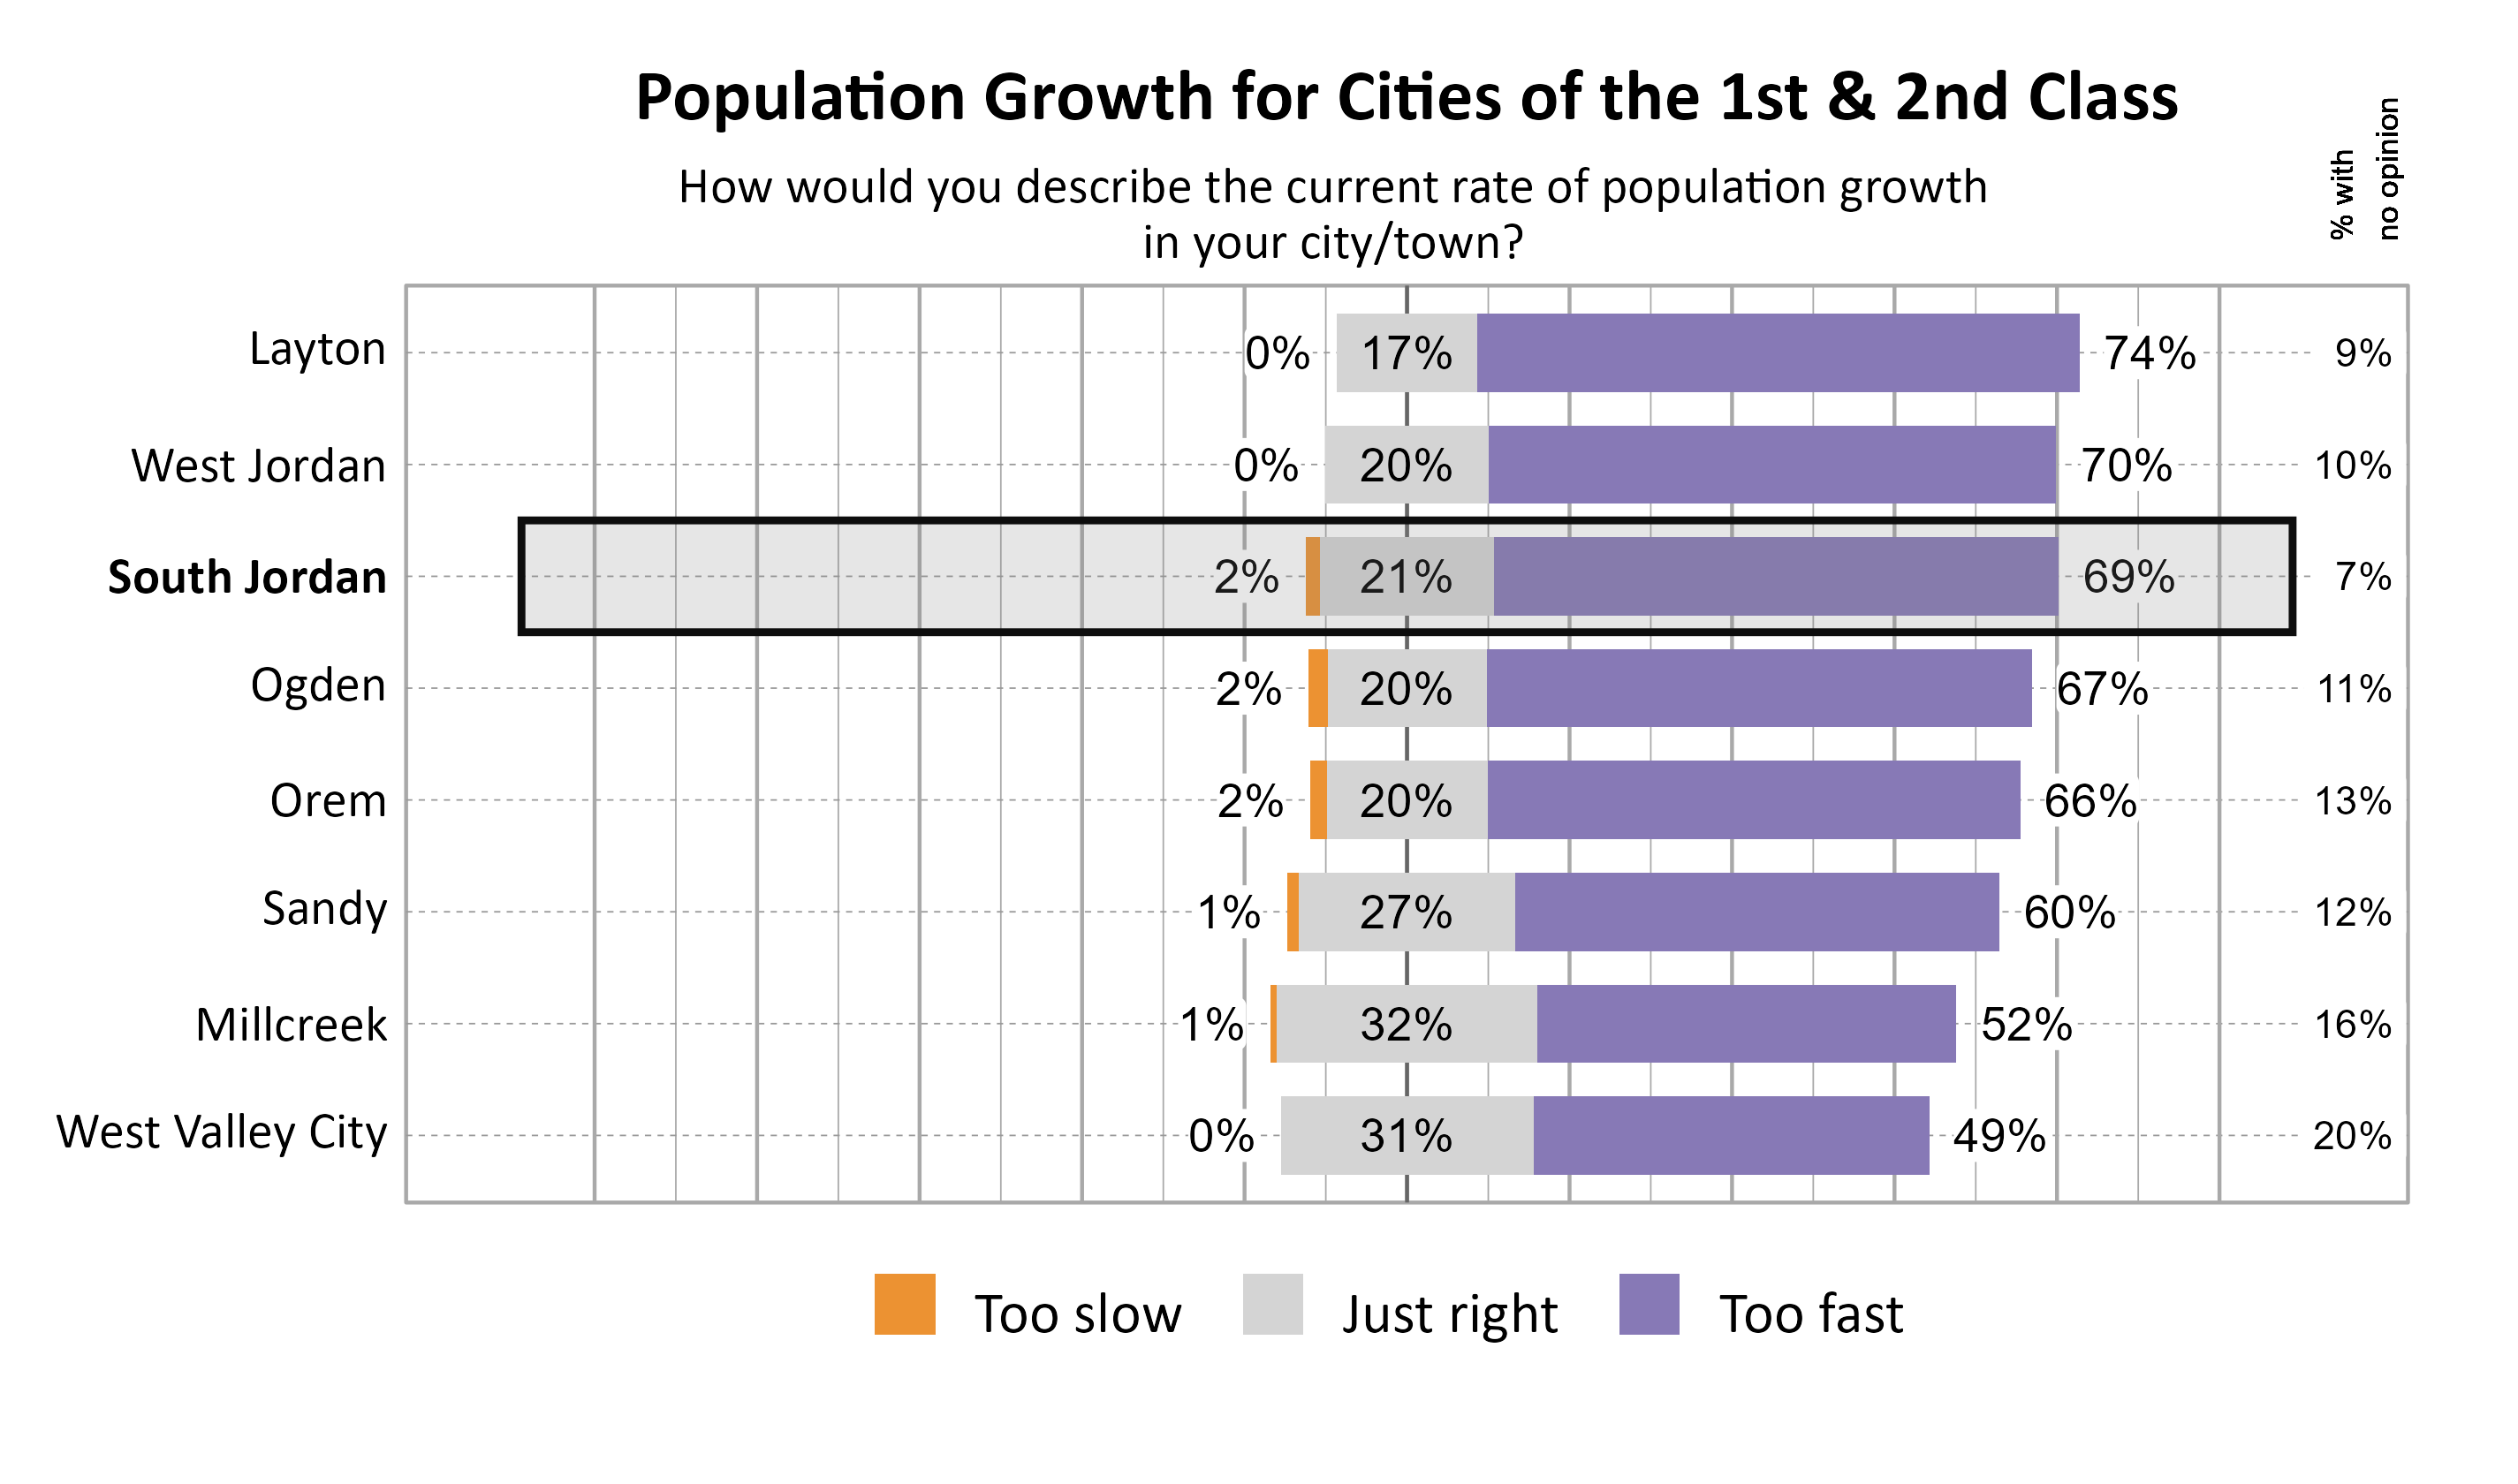
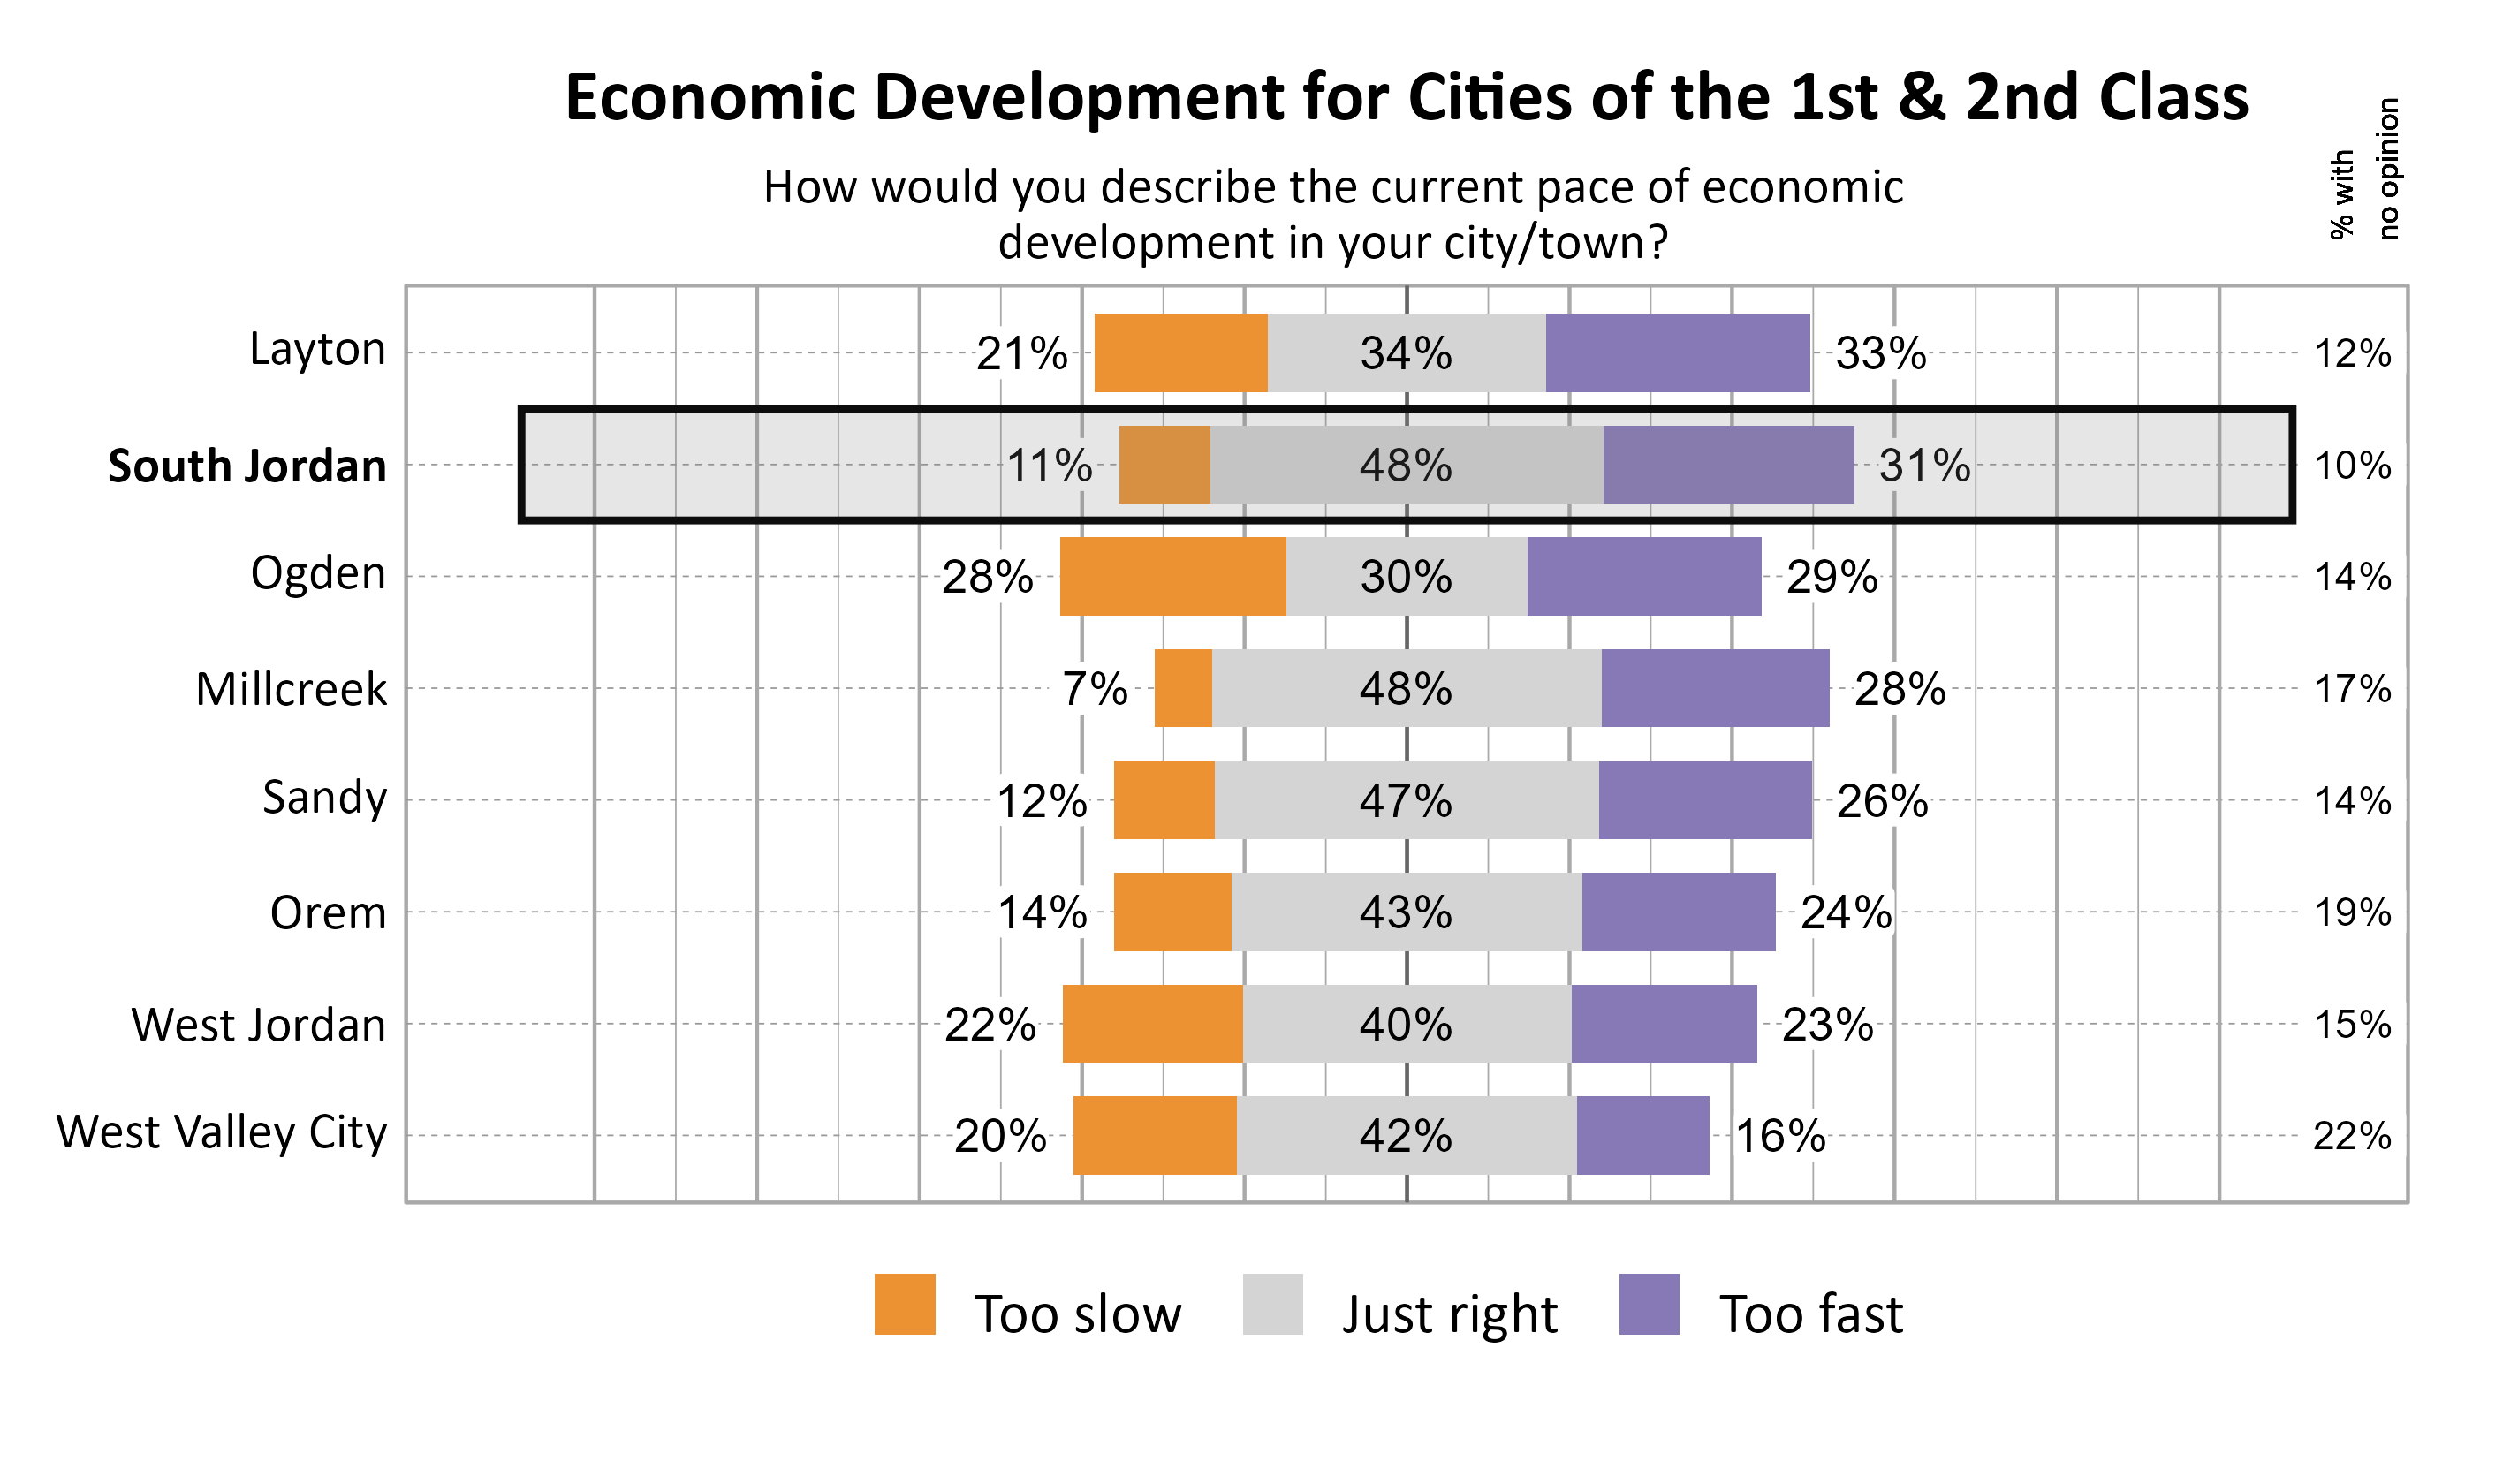
The majority of respondents in South Jordan indicated that they felt the population growth was too fast (69%). For the pace of economic development, the largest proportion of respondents indicated that it was just right (48%).
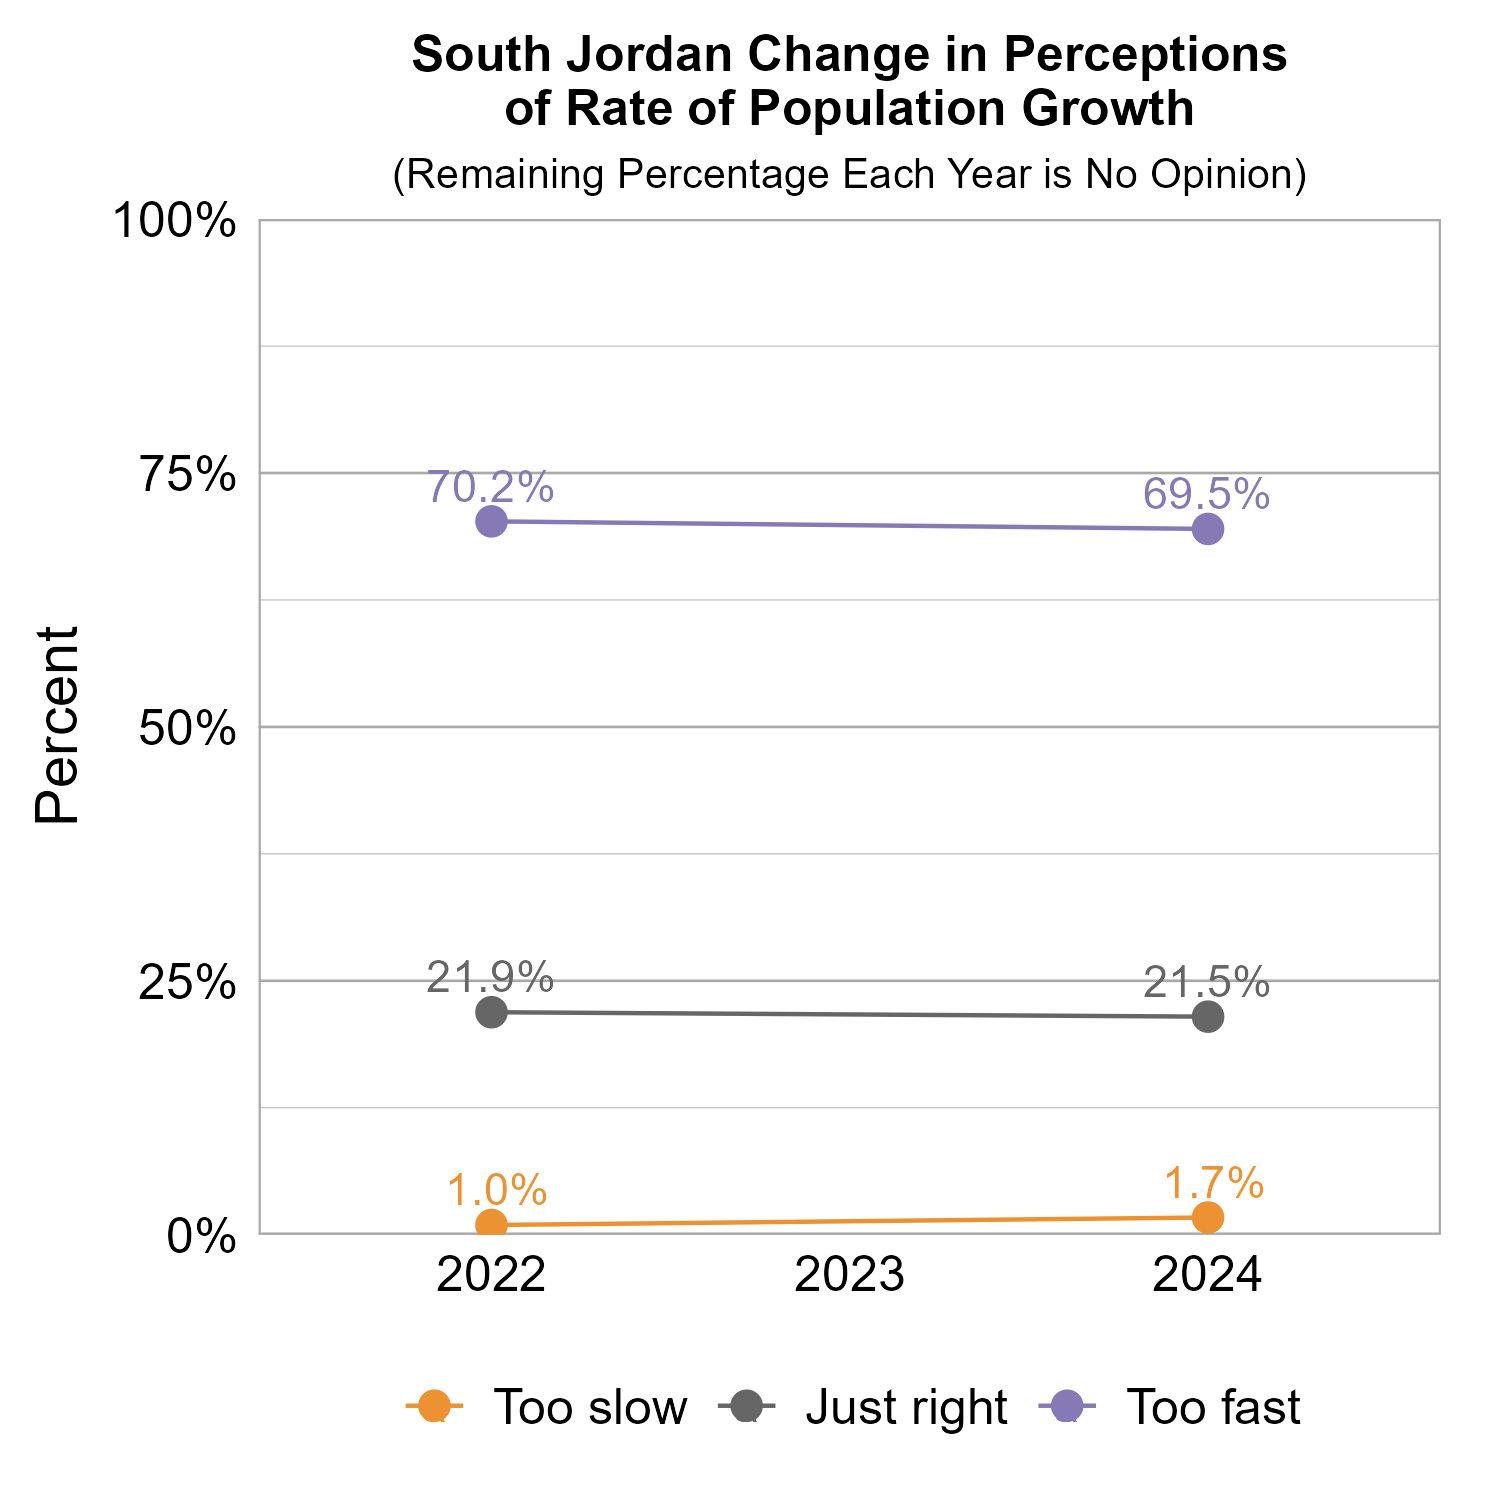
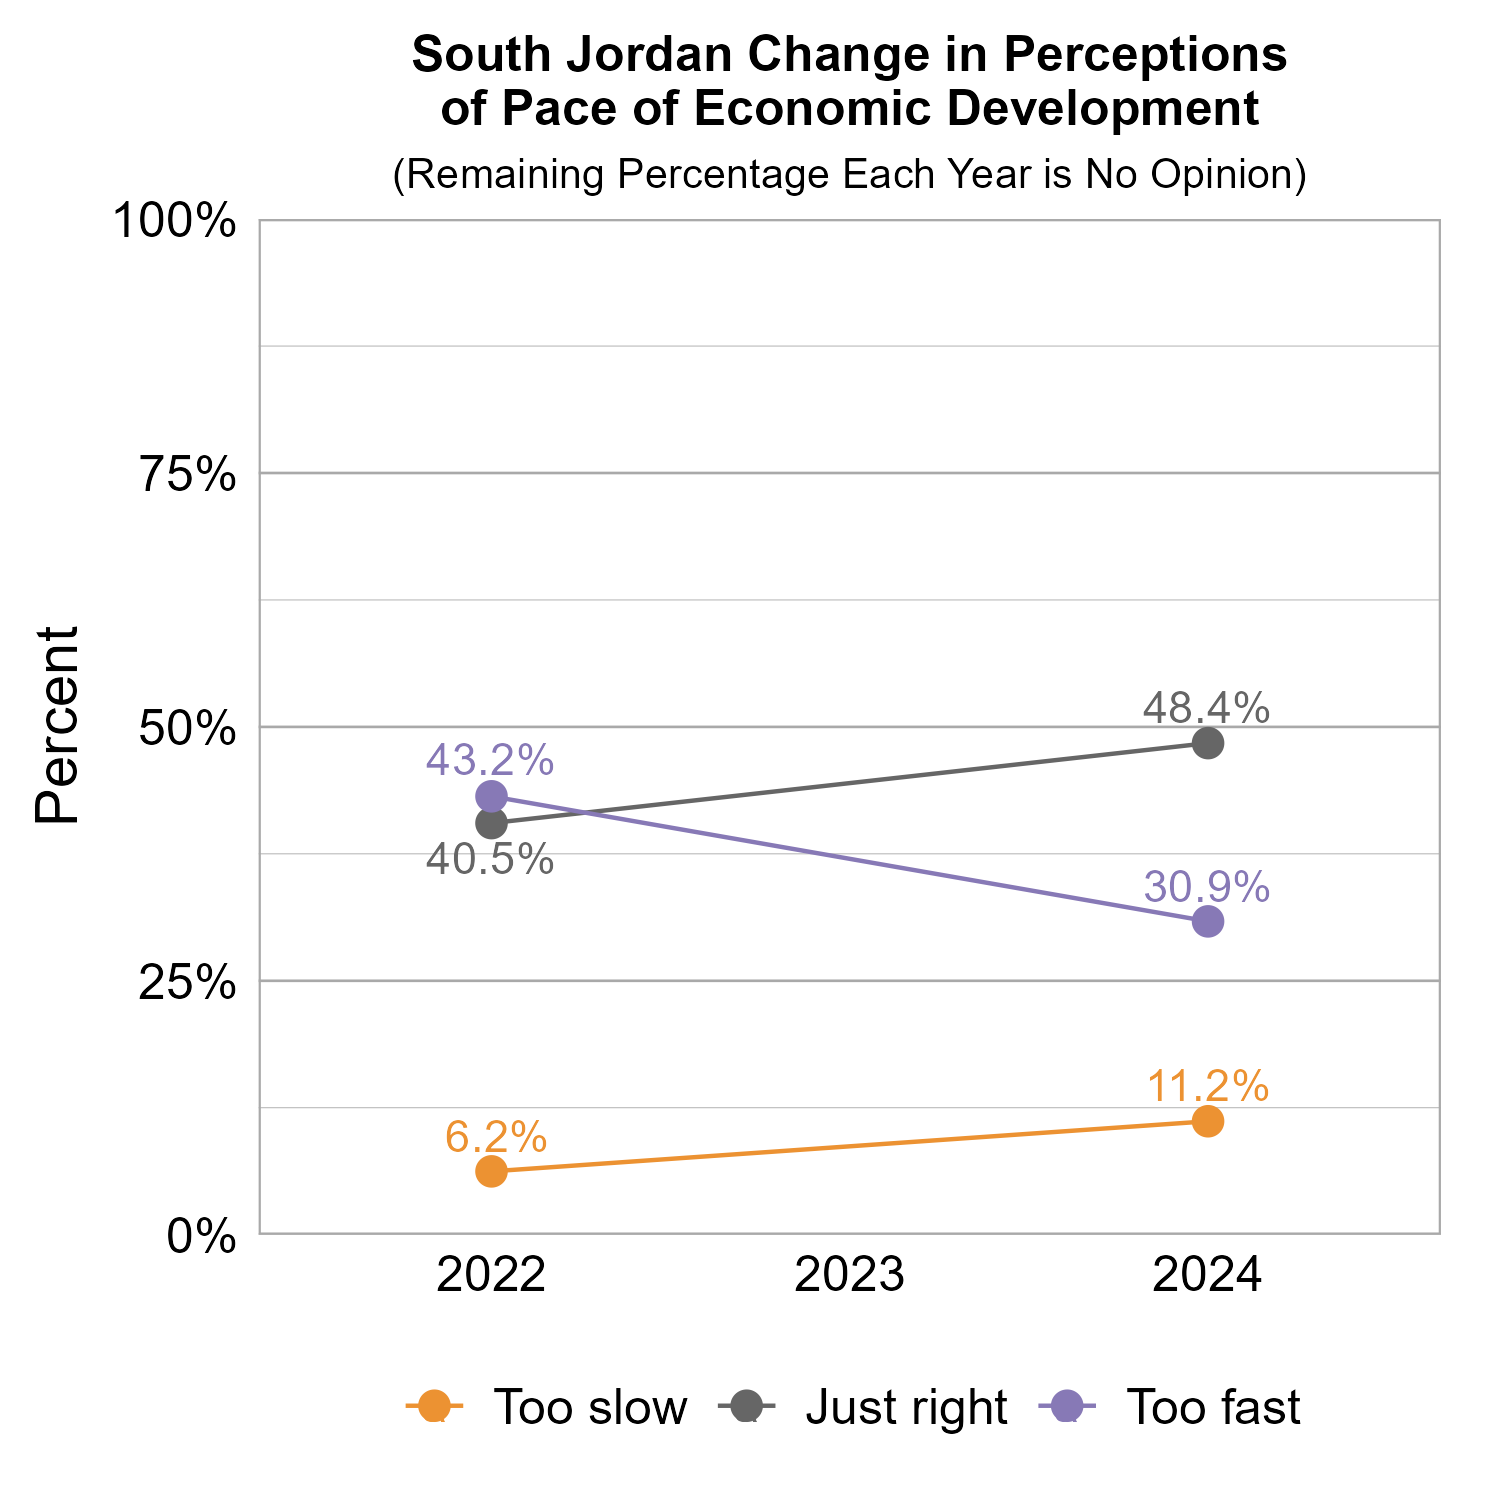
The graphs below show how perceptions of population growth and economic development in South Jordan have varied across recent years of Wellbeing Surveys. Perceptions of the rate of population growth have remained very consistent from 2022 to 2024. Perception that the pace of economic development is too just right increased from 2022 to 2024, while perception that it is too fast decreased.
The graphs below show perceptions of population growth and economic development for South Jordan compared to other participating cities and towns in the Cities of the 1st & 2nd Class cluster.
The graph below illustrates how many respondents perceived the pace of economic development as too slow, just right, too fast, or had no opinion, with additional breakdowns for the number of respondents who provided comments.
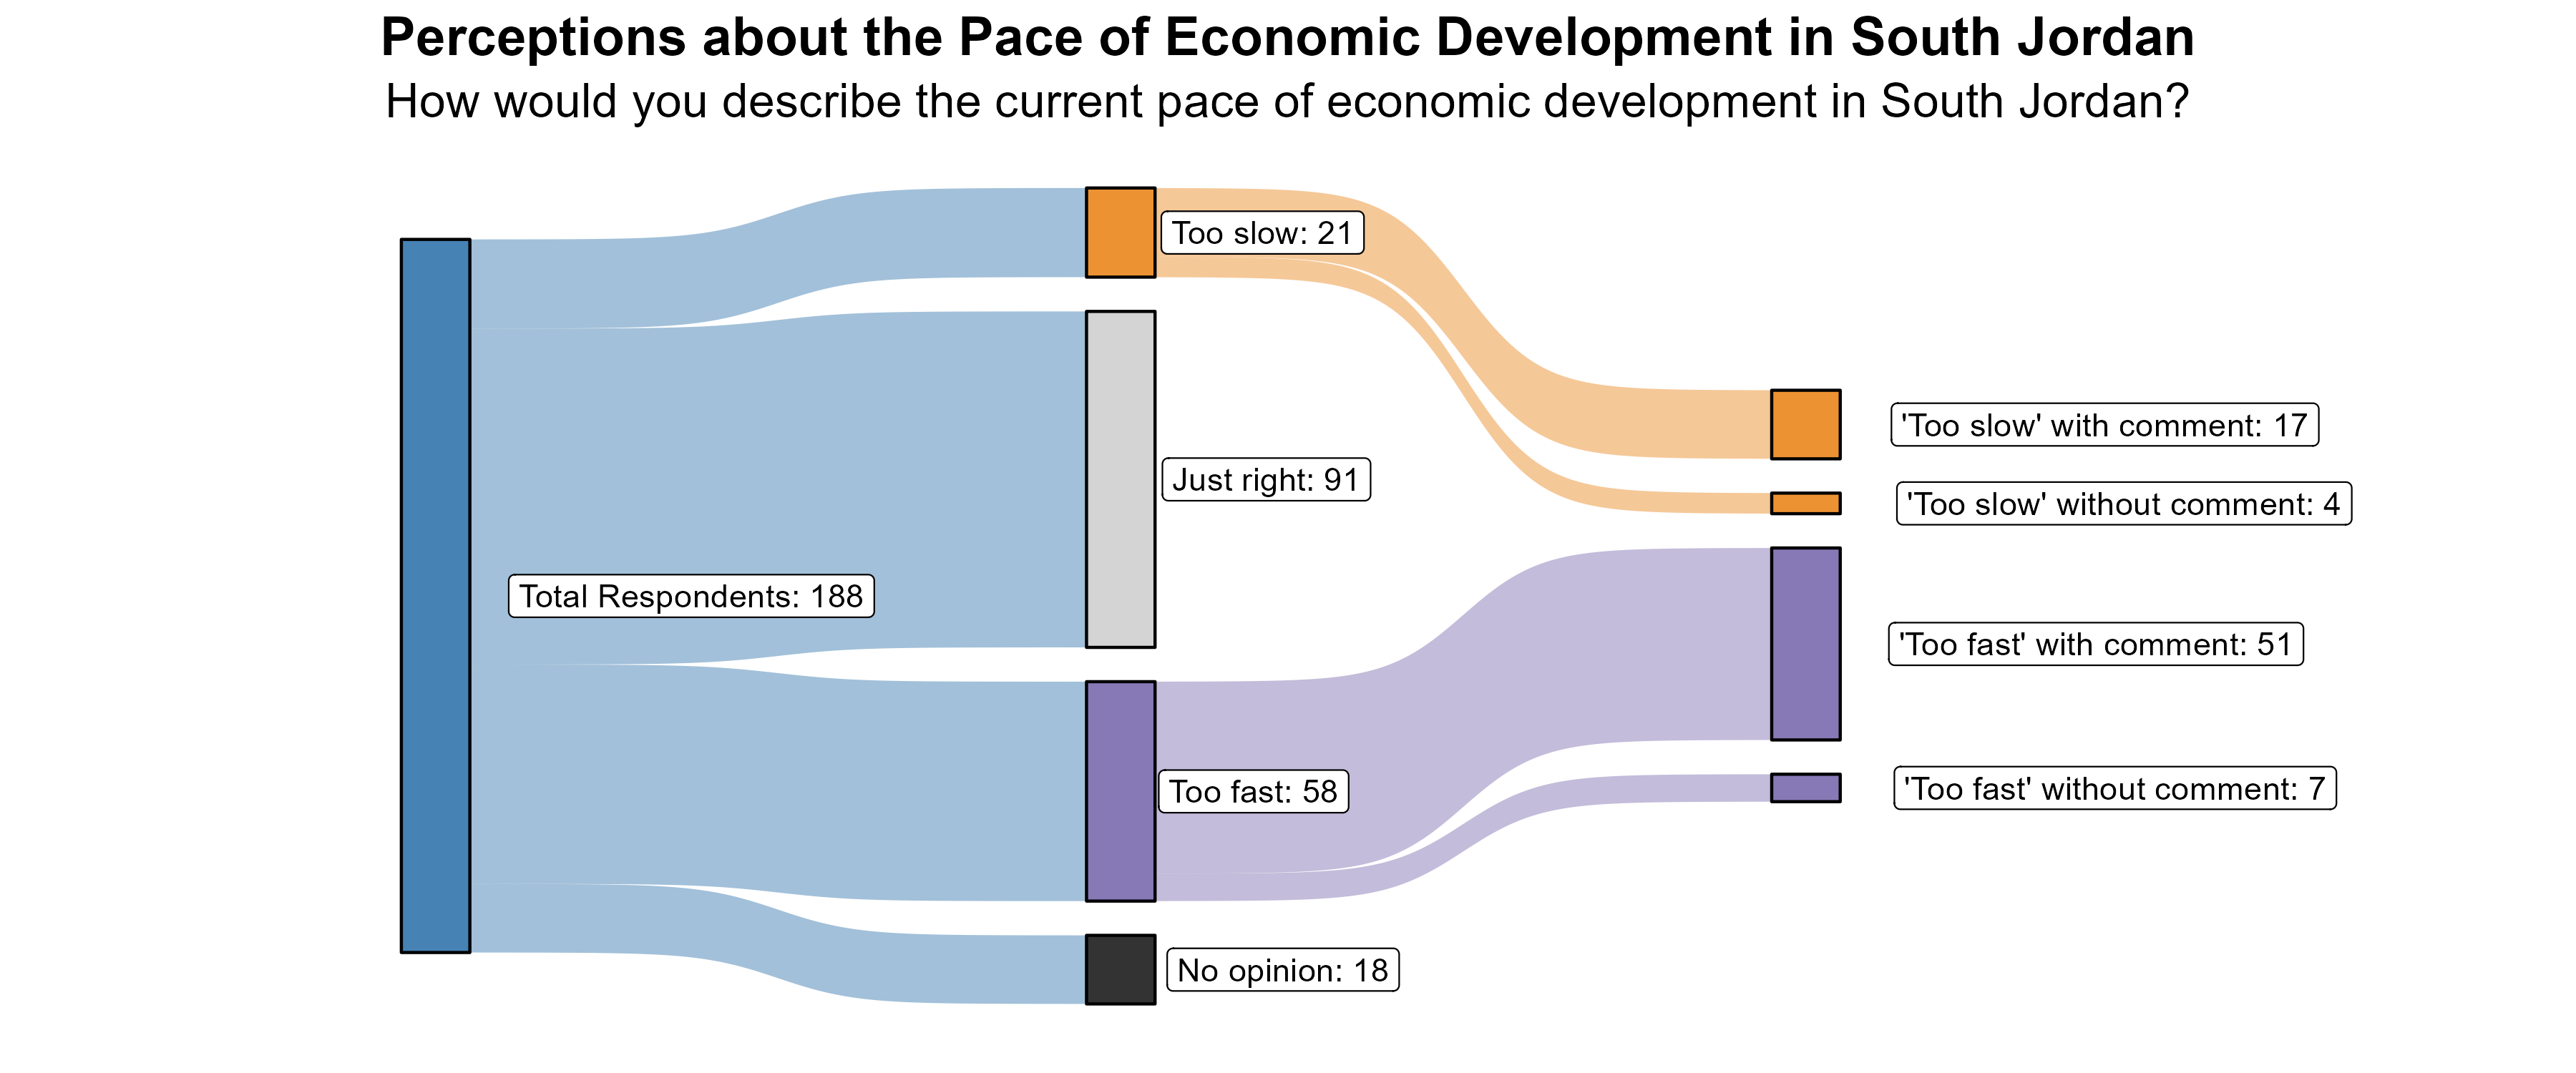
The 11% of respondents who rated the pace of economic growth as “too slow” were further asked what aspects of the local economy they would like to see more of in South Jordan. Most comments were desires for more restaurants and entertainment in the area as well as more shopping options. Some comments were made about the need for improved transportation and building up areas near transportation, like TRAX.
Additionally, the 31% of respondents who rated the pace of economic growth as “too fast” were further asked what aspects of the local economy they feel are growing too quickly in South Jordan. A majority of respondents commented on the amount of housing being built, especially high-density housing, which was said to be increasing traffic, crowding, and infrastructure issues. Several mentioned that they feel like residents are not being heard in regards to the rate or type of growth and that there is not adequate planning. There were also concerns of loss of open space and businesses opening and closing often.
Transportation in South Jordan
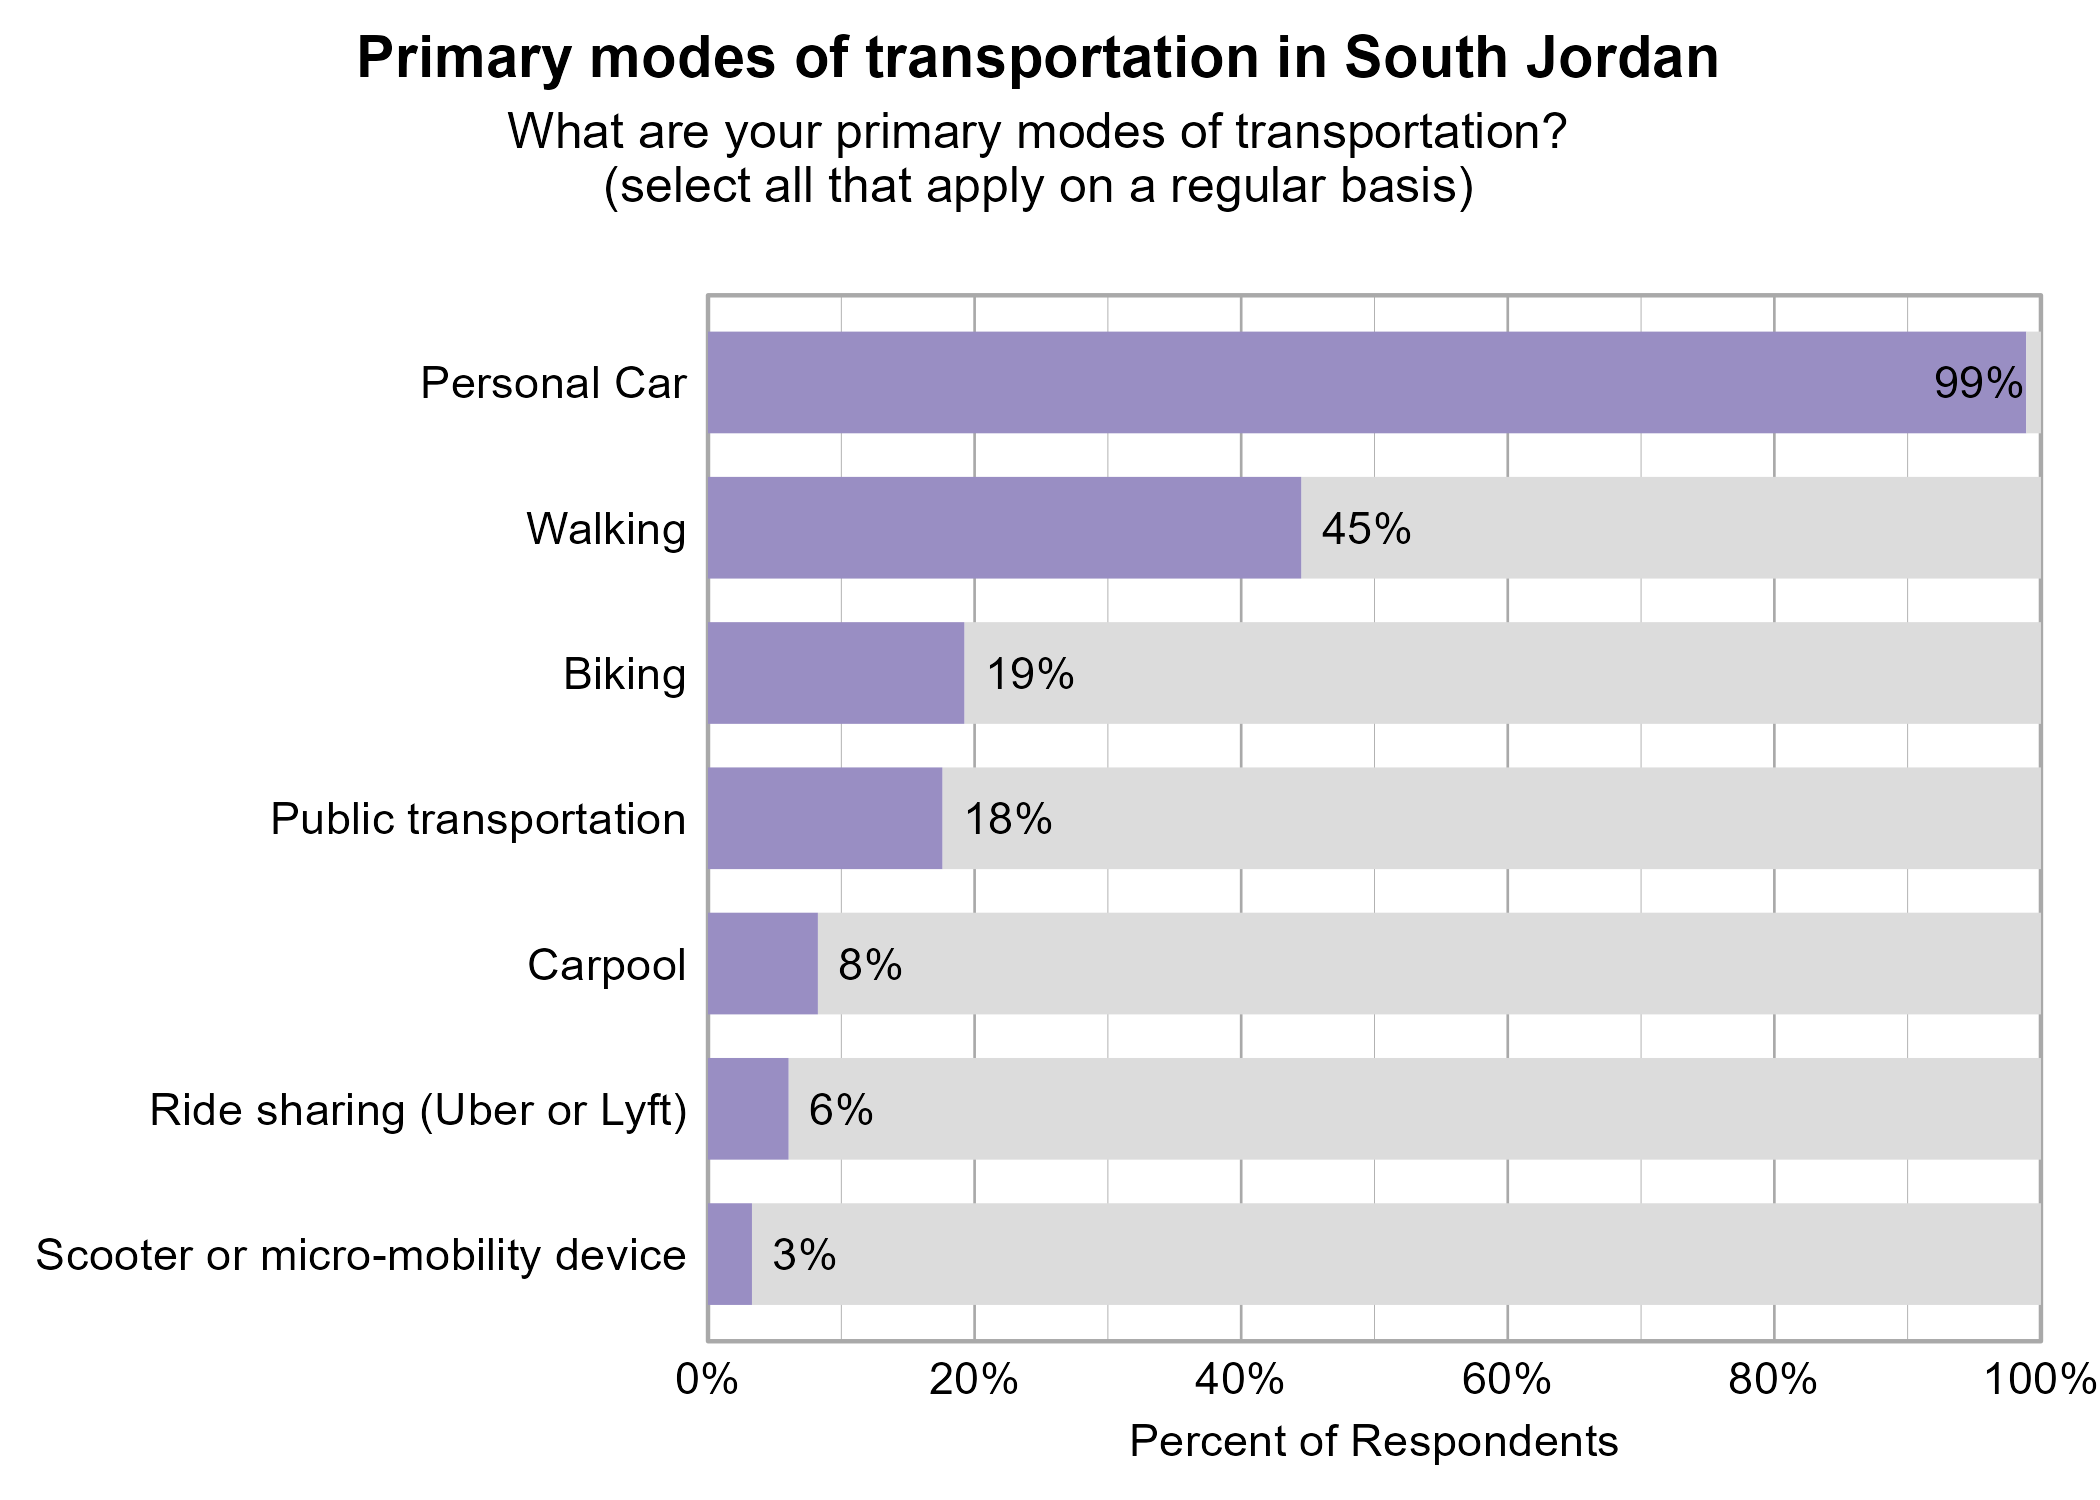
Respondents were asked to indicate all of their primary modes of transportation on a regular basis in South Jordan. The most popular modes of transportation were personal car (99%) and walking (45%).
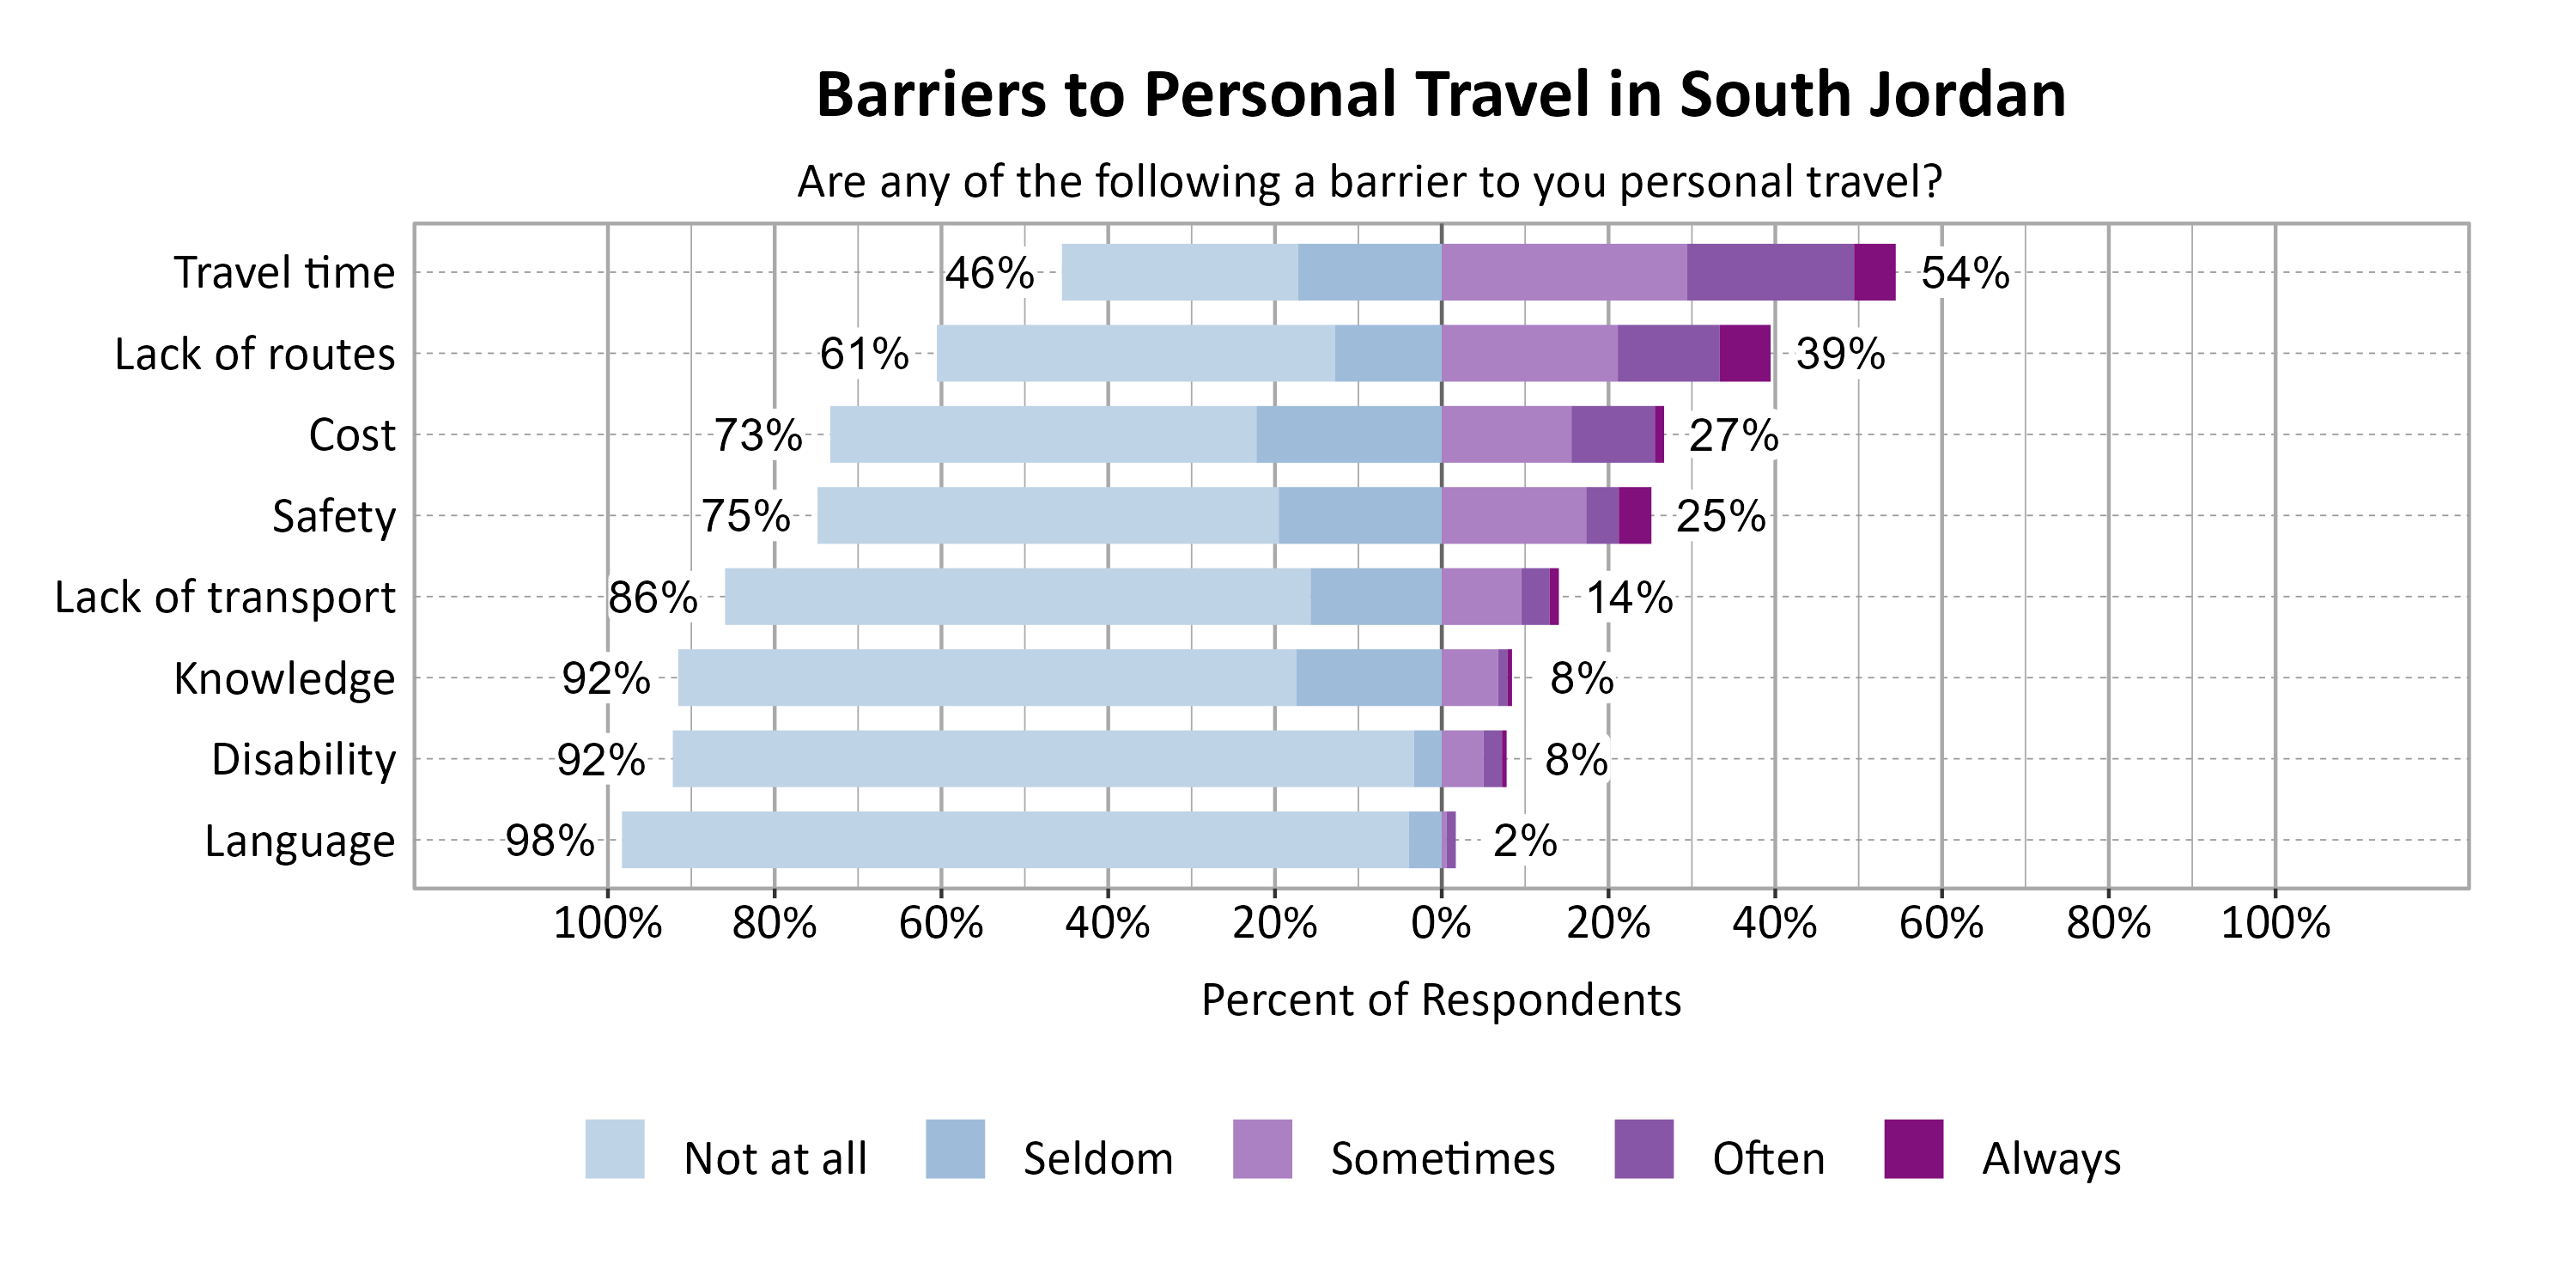
Respondents were asked to indicate the most common barriers to transportation in South Jordan. The most problematic barriers were Travel time (54%) and Lack of routes (39%).
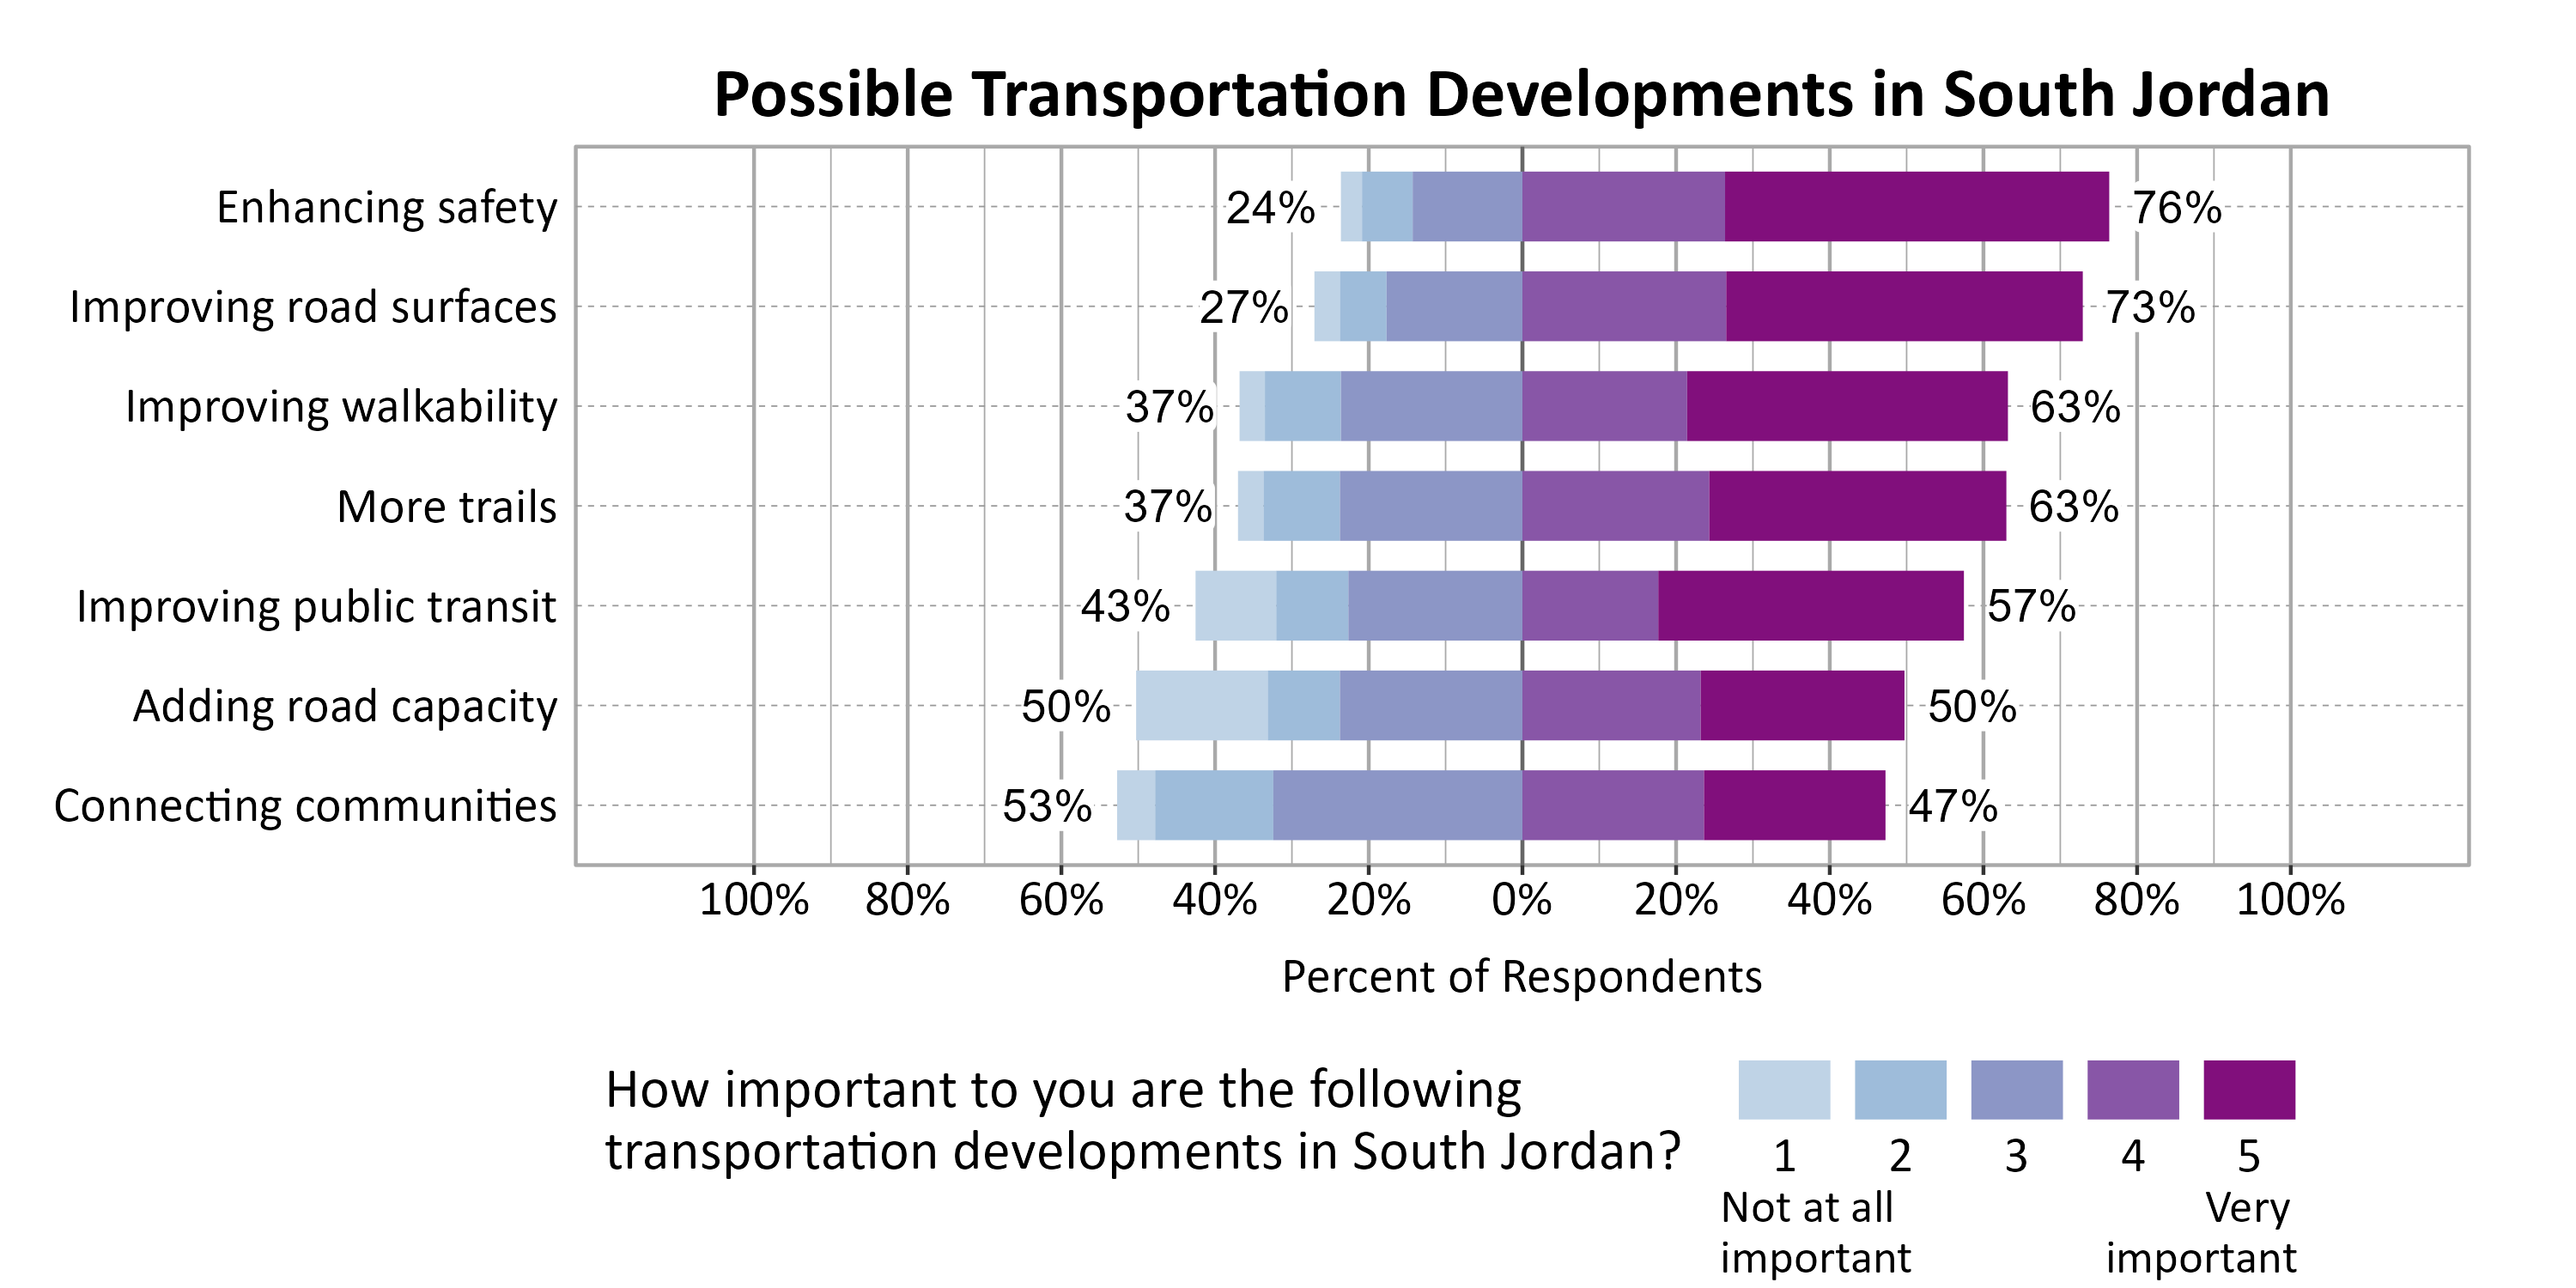
Respondents were asked to indicate the importance of a set of possible transportation developments in South Jordan. The most important development to respondents were Enhancing safety (76%), Improving road surfaces (73%), Improving walkability (63%), and More trails (63%).
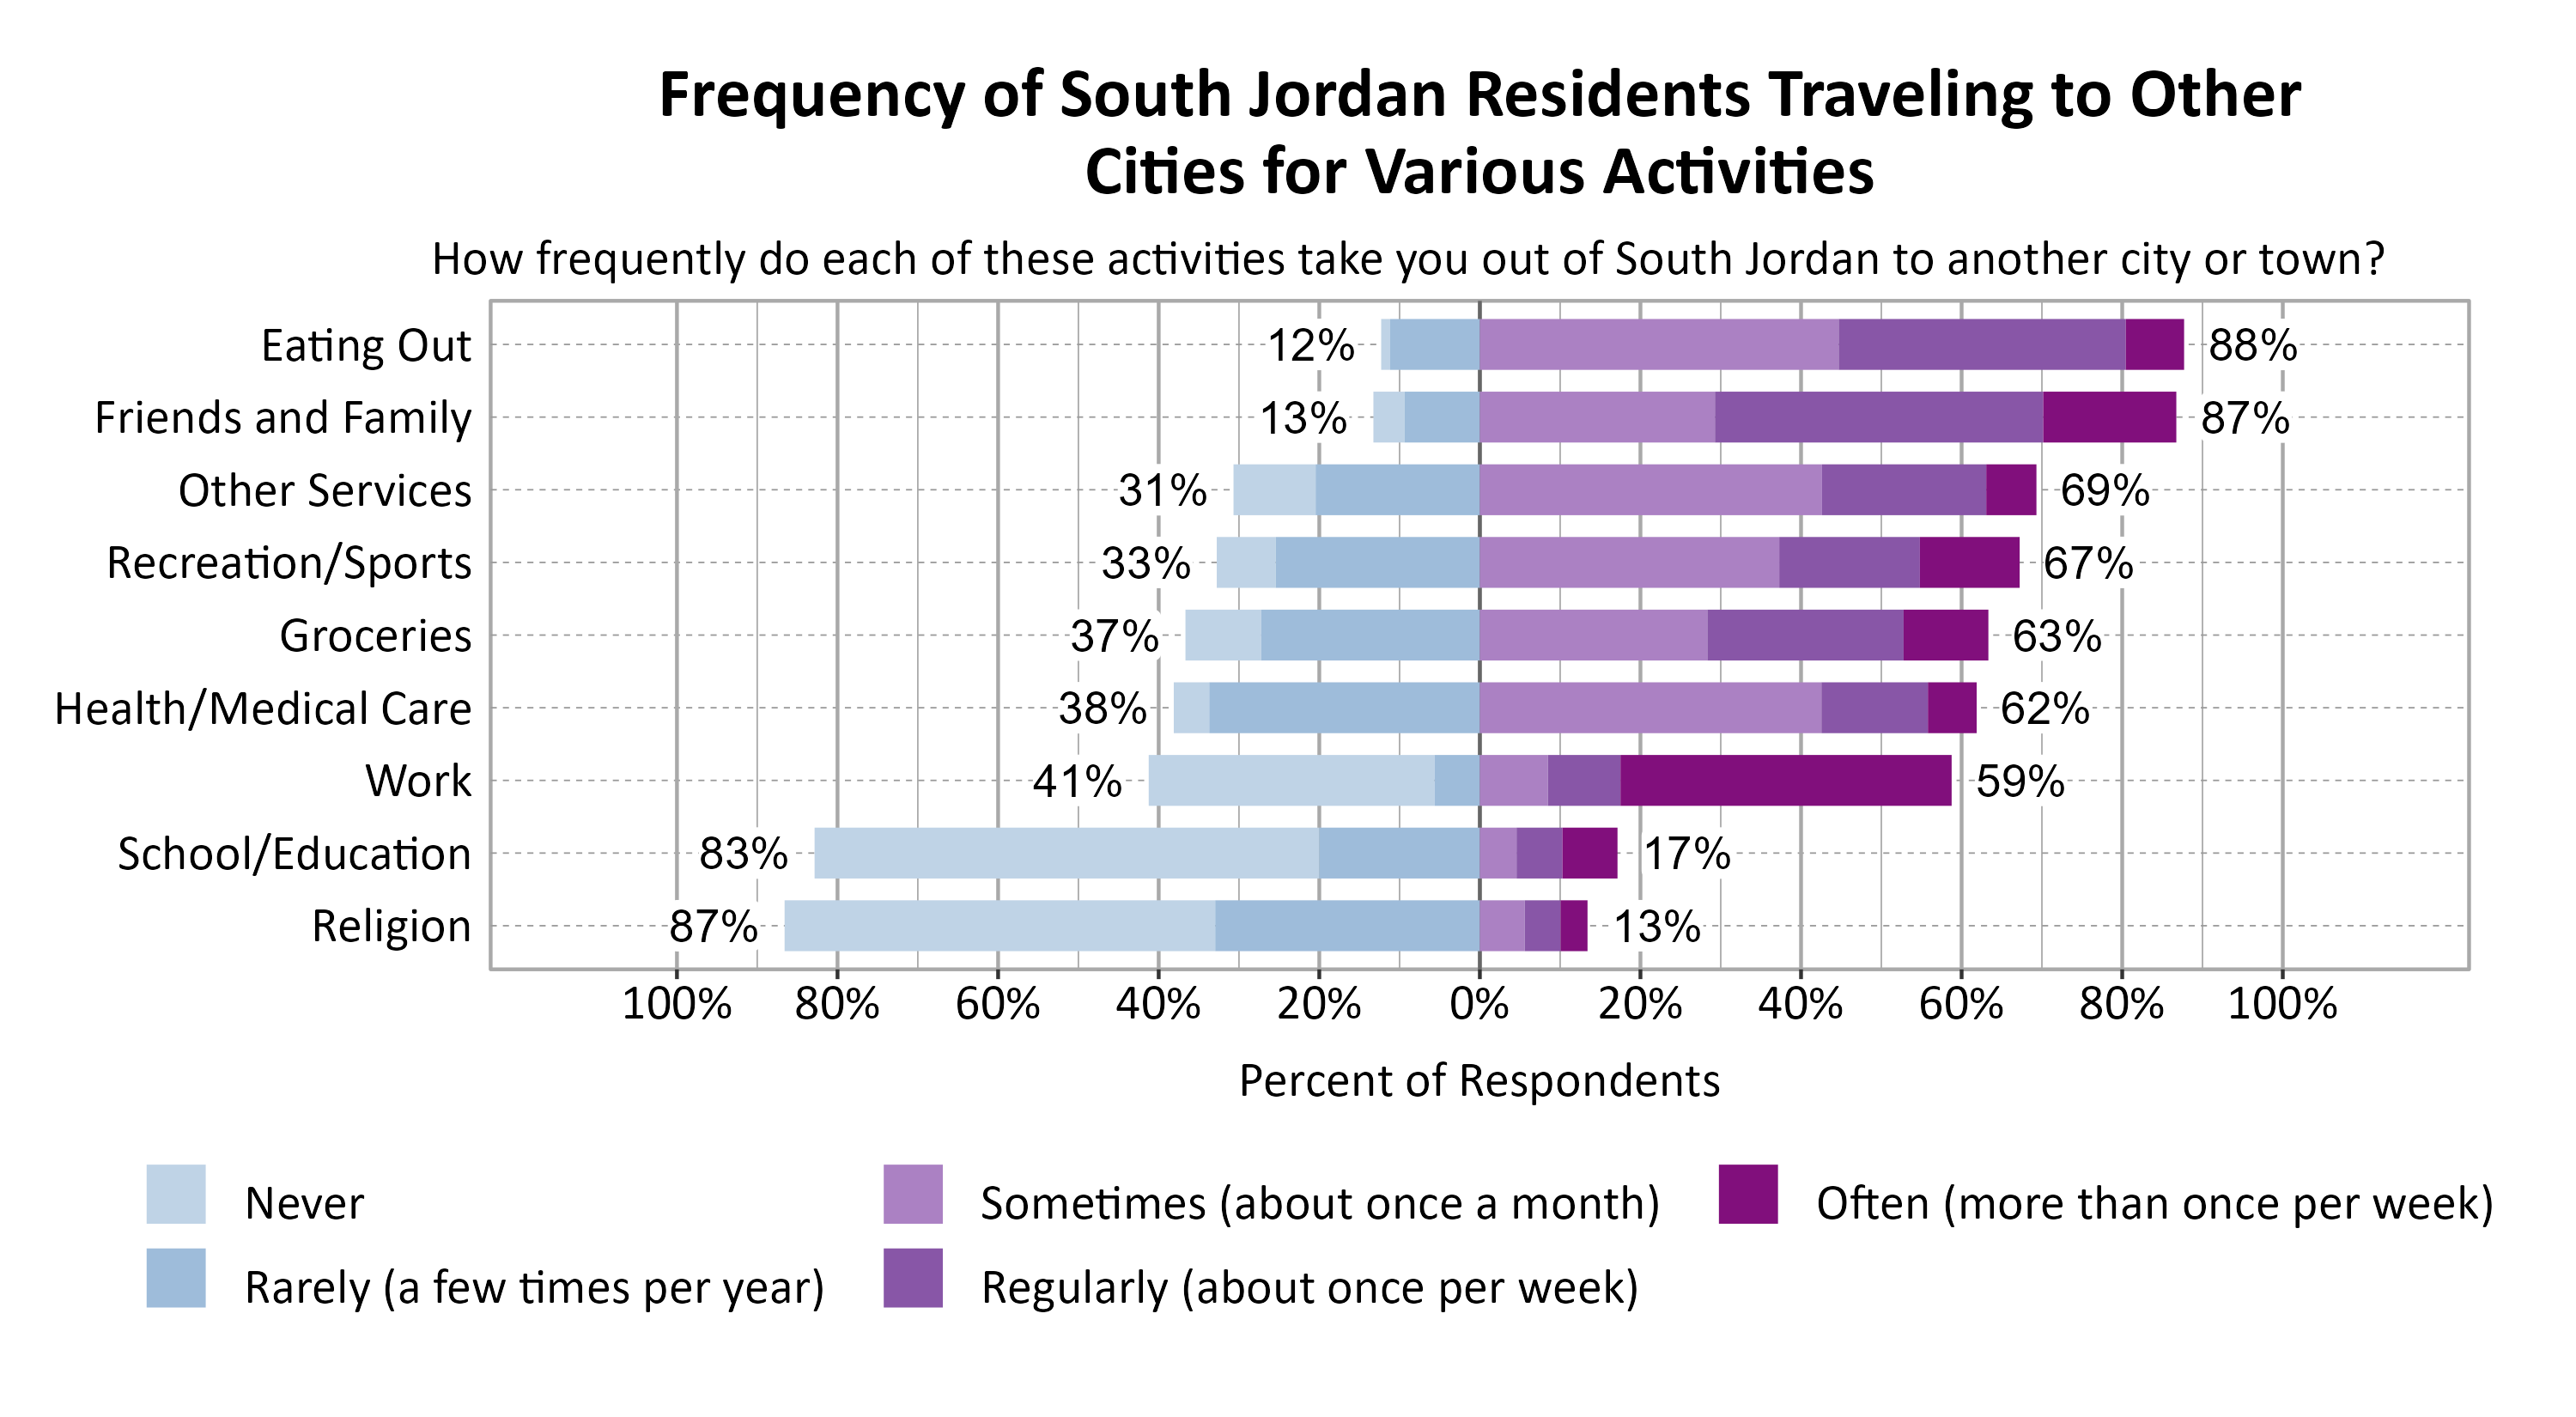
Respondents were asked to indicate how frequently various activities take them out of South Jordan to another city or town. The most commonly indicated reasons for traveling to another city or town at least sometimes or once a month were Eating Out (88%), Friends and Family (87%), and Other Services (69%).
Concerns in South Jordan
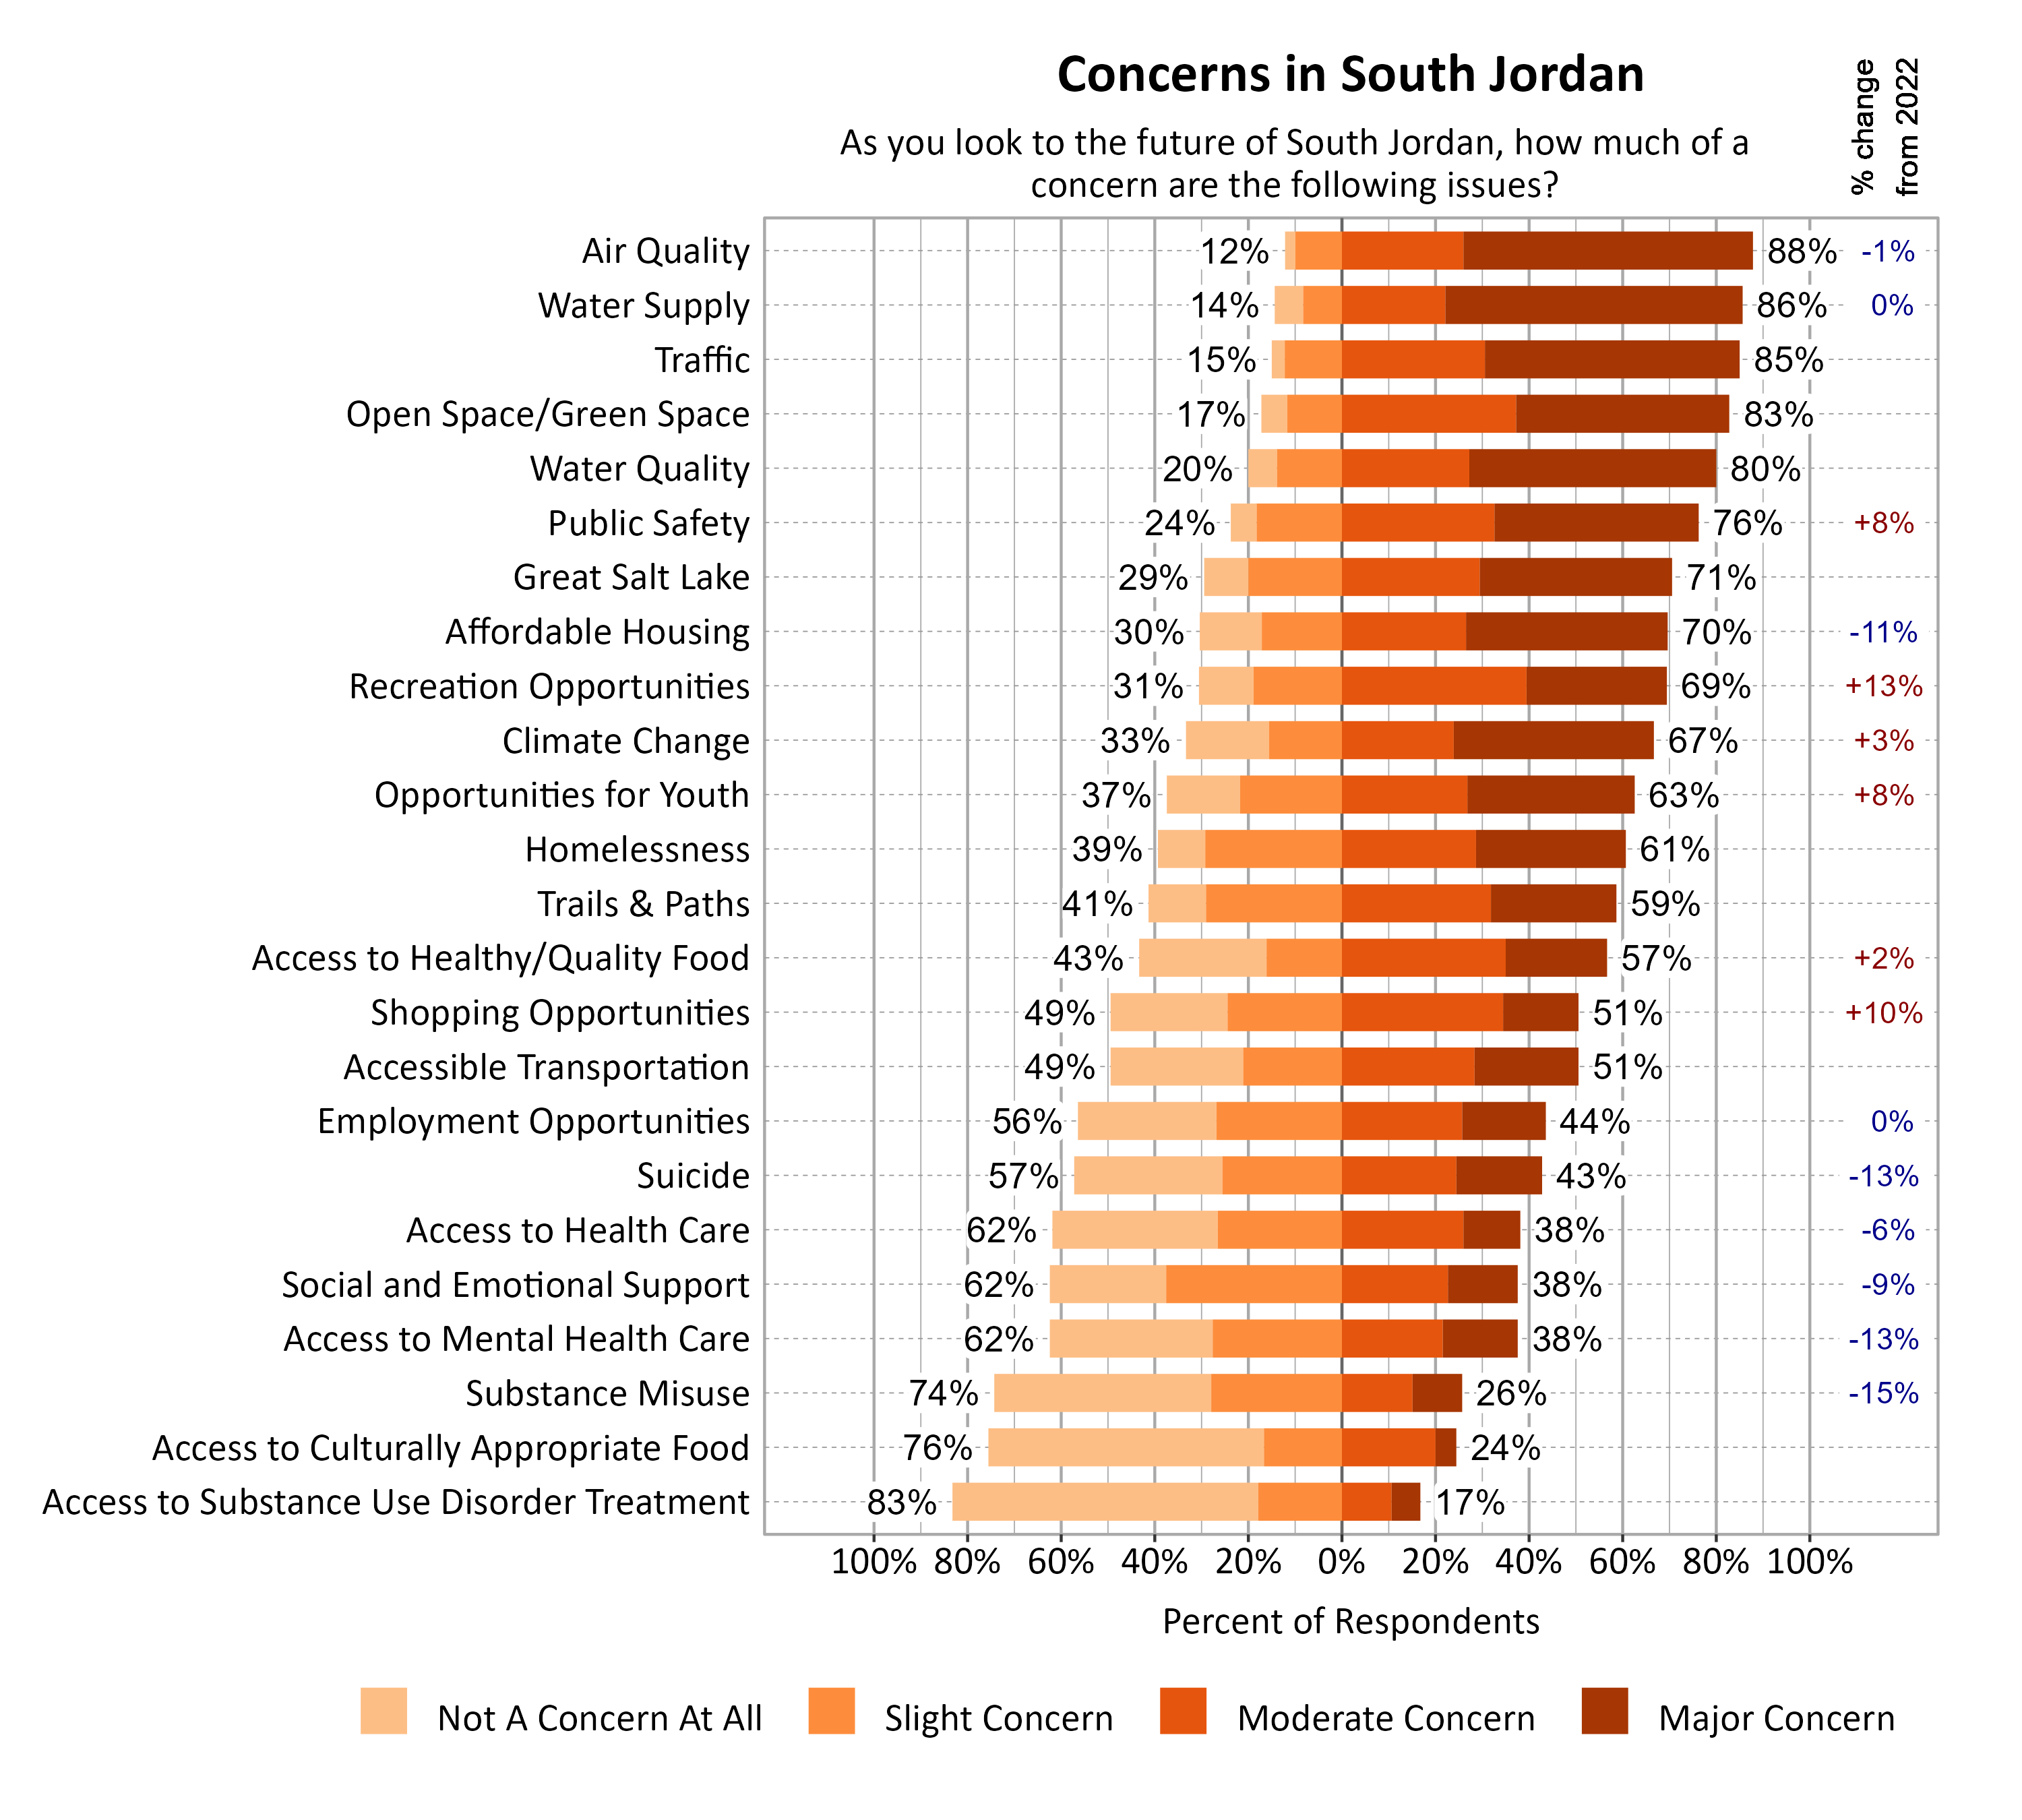
Survey respondents indicated the degree to which a number of possible local issues were a concern as they look to the future of South Jordan. Air Quality (88%), Water Supply (86%), and Traffic (85%) were the top concerns. Since 2022, moderate or major concern about recreation opportunities (+13%) and shopping opportunities (+10%) notably increased, while concern about substance misuse (-15%), suicide (-13%), access to mental health care (-13%), and affordable housing (-11%) notably decreased.
Open Comments
All open comments collected in the survey were shared with city leaders. General observations and themes are shared here.
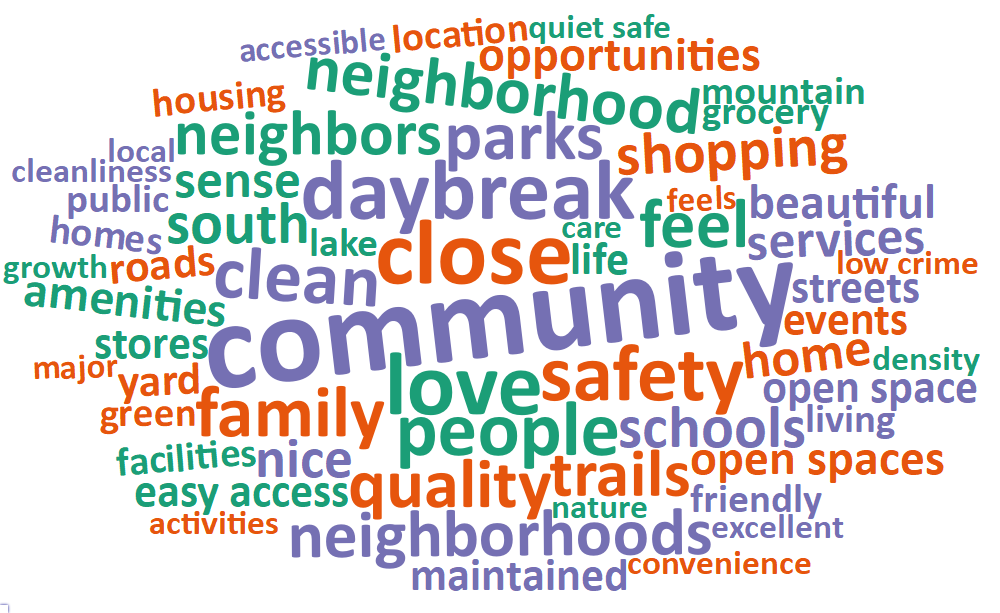
What Respondents Value Most in South Jordan
Survey respondents were asked to comment on what they value most about South Jordan. The most common words and phrases from all city comments are included in the word cloud below. It is possible that negative or unrelated words may appear since these words have been taken out of context, and they may not indicate the respondent’s intended meaning. Respondents appreciated the strong sense of community, with references to friendly and respectful neighbors, community events, and a supportive local government. Residents also valued living near their family. Many also expressed value for South Jordan’s safety, low crime rates, and security.
Local Environmental Quality in South Jordan
The 43% of respondents who rated the Local Environmental Quality domain as 1, 2, or 3 (Poor, Fair, or Moderate) were further asked if there are specific aspects of local environmental quality that they feel are problematic. Respondents express an interest in having a more walkable city, but the traffic, pollution, and rundown sidewalks make it difficult. Air quality was seen as poor due to the dust from the Great Salt Lake, Kennecott Copper Mine, and from car exhaust. Green space was seen as lacking and desired.
Improving Wellbeing in South Jordan
Survey respondents were asked if there is anything that could be done to improve wellbeing in South Jordan. Respondents expressed concern about the rapid and unchecked growth in their community, which has led to overbuilding, increased traffic congestion, and a loss of open spaces. They indicated opposition to high-density housing developments that mix apartments with single-family homes. Additionally, traffic and transportation issues were indicated as major pain points, with calls for better road connectivity, enhanced public transit options, and improved bike and pedestrian infrastructure to alleviate congestion and ensure safer travel.
Additional Comments
Respondents were also asked if they had any additional comments on wellbeing in South Jordan. Many comments highlighted the rise in traffic congestion and related issues, such as speeding and inadequate traffic law enforcement. There was a strong desire for more effective management of traffic and a call for better public transportation options to alleviate the pressure on existing roads. Many residents also expressed their satisfaction in living in South Jordan.