Springdale Wellbeing Survey Findings 2024

By Dr. Courtney Flint and Team


utah wellbeing survey logo

Contact Information

Summary

Springdale is one of 51 cities and towns participating in the Utah Wellbeing Survey Project in 2024. This project is designed to assess the wellbeing and local perspectives of residents and to provide information to city and town leaders to inform general planning processes. Additional analysis is underway and this report may be updated over time.

We are grateful to all those who took the survey and to our city partners who helped to make this possible. We are grateful to a number of entities for funding: the Utah League of Cities and Towns, USU Extension, USU’s Institute for Land Water and Air, the Wasatch Front Regional Council, Utah Department of Transportation, the Utah Agricultural Experiment Station, and the cities and towns of Alpine, Cedar Hills, Draper, Millcreek, Nephi, North Salt Lake, Ogden, Orem, Pleasant Grove, Providence, Springdale, Tremonton, West Bountiful, and West Valley City.

This report describes findings from the 2024 Springdale survey and comparative information with other project cities and towns. In March 2024, Springdale Town advertised the survey for residents largely through email, social media, newsletters, flyers, and town meetings. All town residents age 18+ were encouraged to take the online Qualtrics survey.

How many people responded?

  • 123 viable surveys were recorded in this 2024 survey effort.
  • The adult population of Springdale was estimated at 407, based on the American Community Survey by the U.S. Census. The 123 survey responses in 2024 represent 30.2% of the adult population and have a conservative margin of error of 7.39%.

Survey Respondent Characteristics

Resident Statistics
Full Time Residents of Springdale 76.4%
Part Time Residents of Springdale 23.6%
Length of Residency — Range 0.4-77 years
Length of Residency — Average 14.6 years
Length of Residency — Median 10 years
Length of Residency 5 Years or less 32.8%

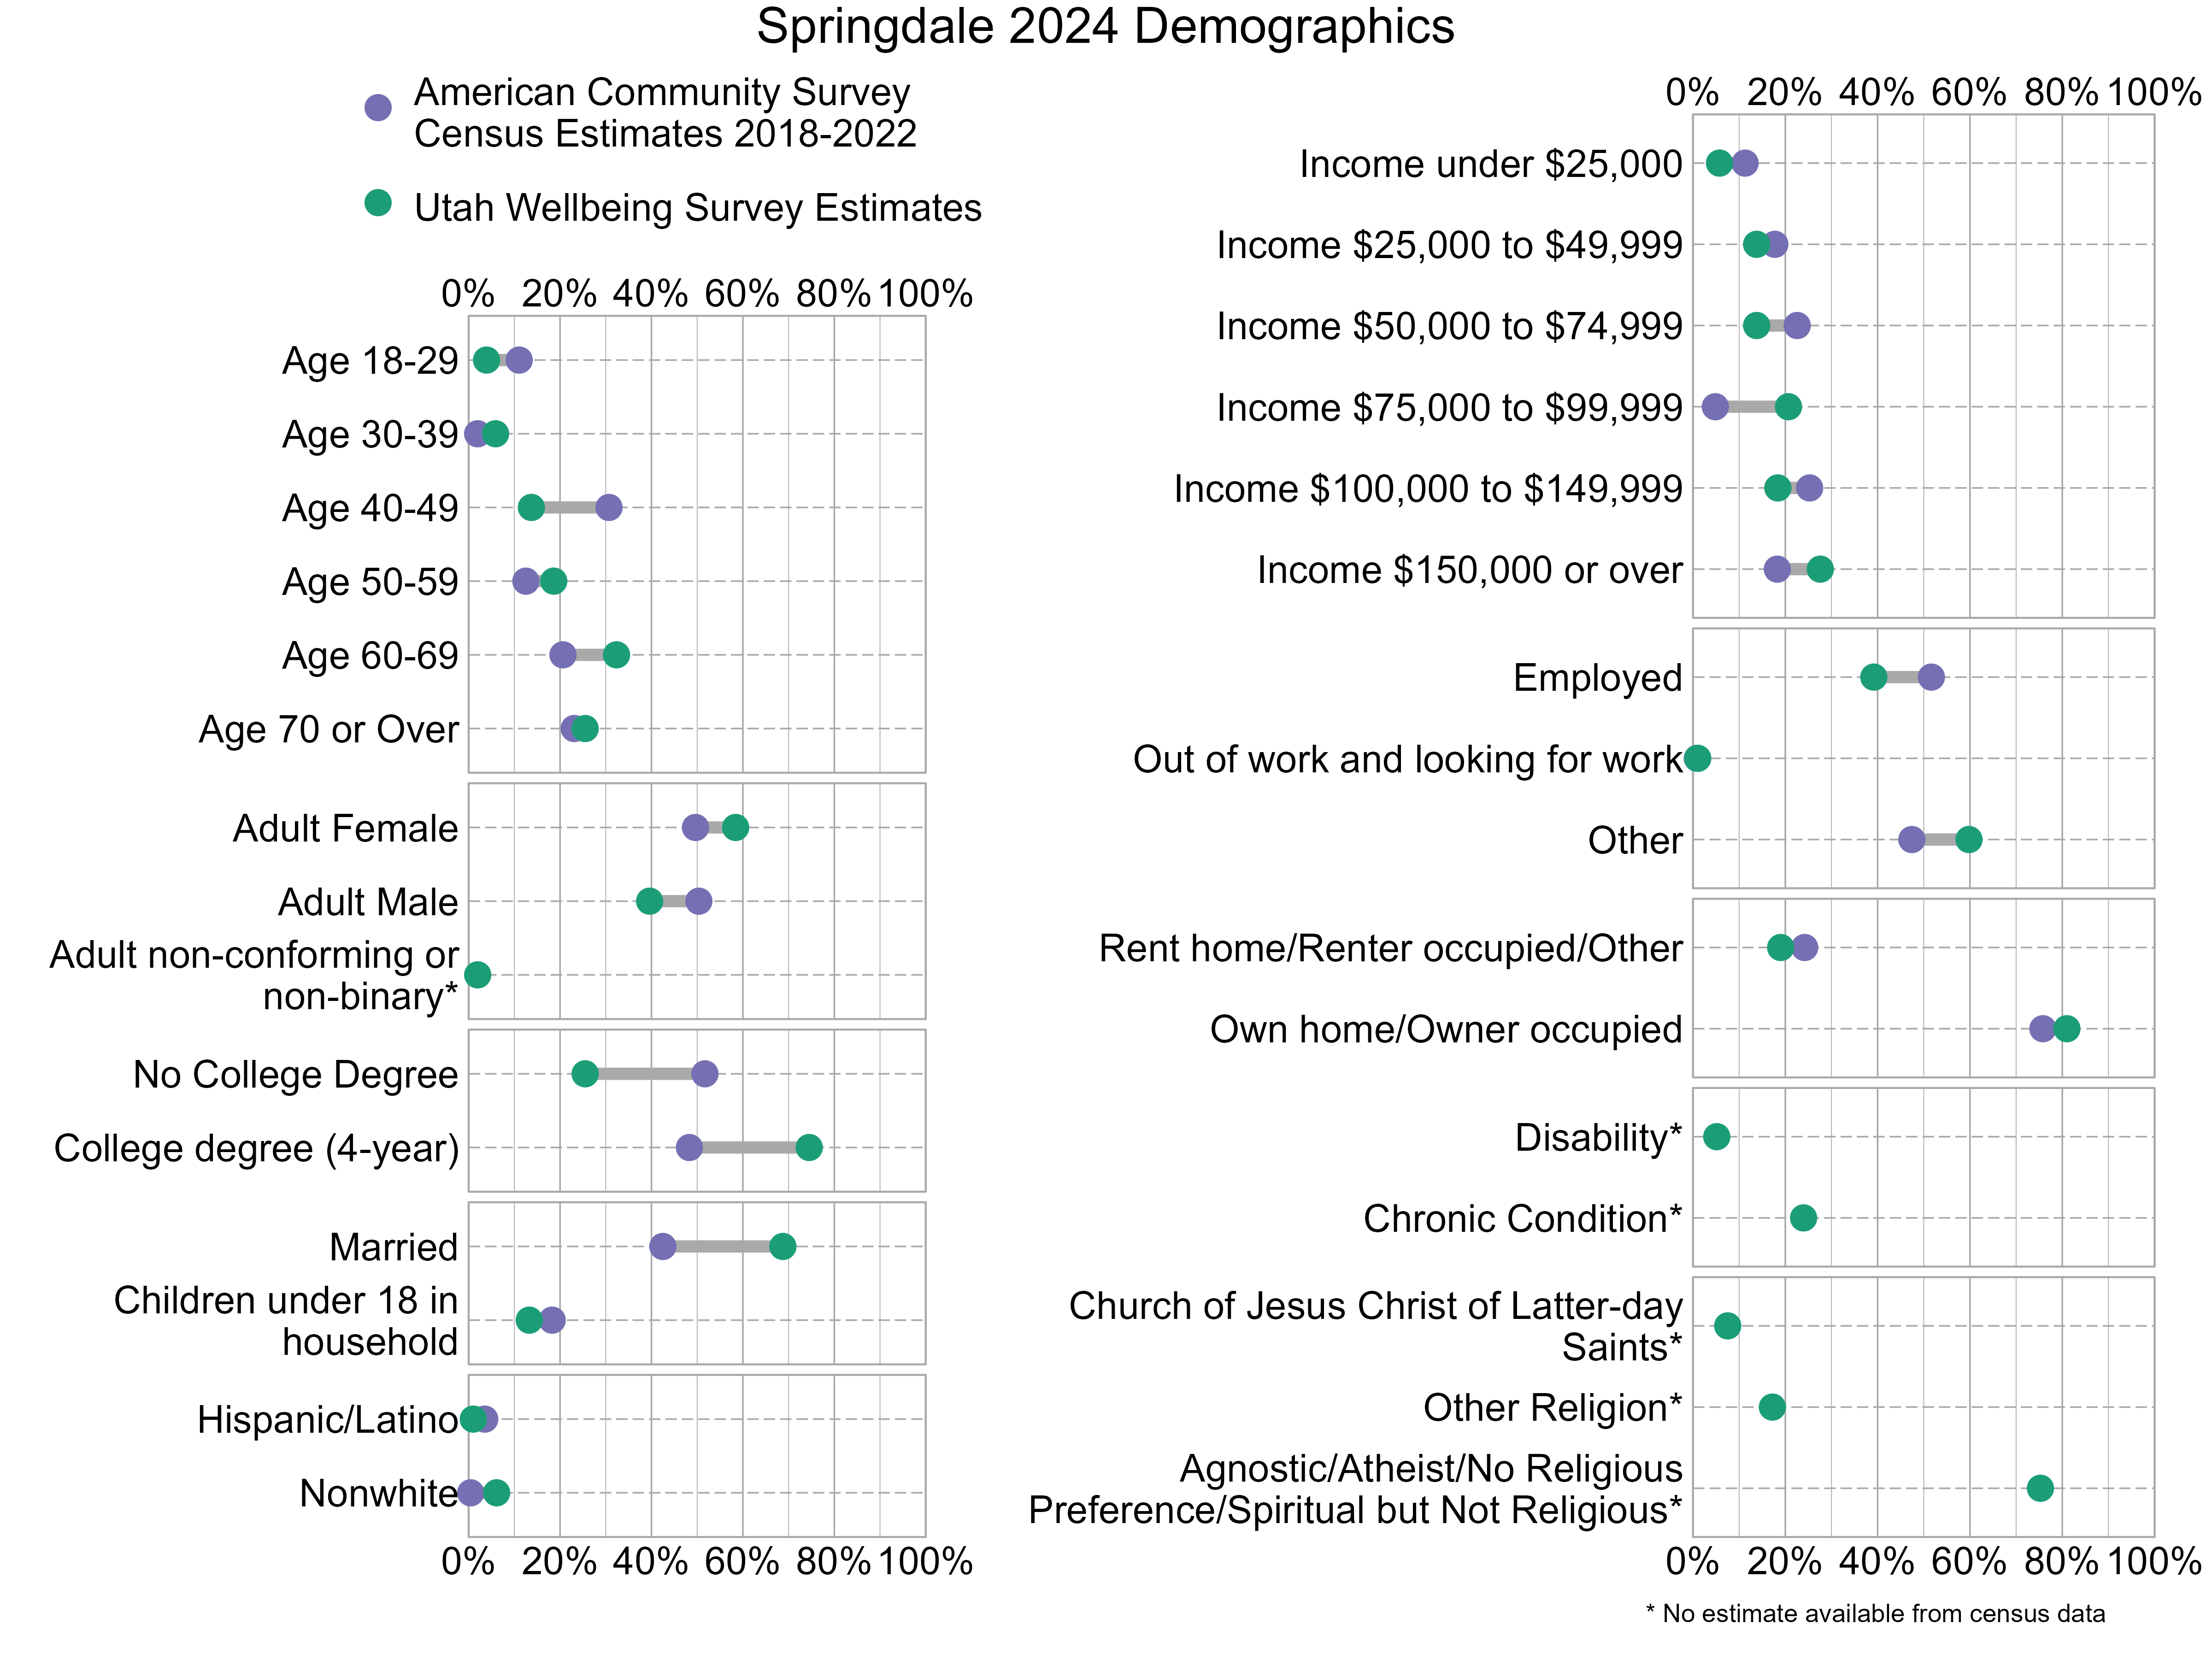
Demographic characteristics of the survey respondents were compared below with U.S. Census information from the 2018-2022 American Community Survey. In the graph below, gray bars indicate differences between the American Community Survey estimates and the Utah Wellbeing Project surveys. The wider the gray bars, the larger the differences. Also note that estimates for religious affiliation, adult non-conforming or non-binary gender, disability, and chronic conditions are unavailable from the census data. There can also be a variable margin of error in the American Community Survey estimates, and caution should be used when comparing estimates. Not all respondents provided demographic information. As the graph shows, 2024 survey respondents were not fully representative of Springdale. People who have at least a 4-year college degree, have an income $75,000 to $99,999, and are married were overrepresented while those who are age 40-49 and do not have a college degree were underrepresented.

Dot Plot. Title: Springdale 2024 Demographics. Data — Age 18-29: American Community Survey Estimate: 11%, Utah Wellbeing Survey Estimate: 4%; Age 30-39: American Community Survey Estimate: 2%, Utah Wellbeing Survey Estimate: 6%; Age 40-49: American Community Survey Estimate: 31%, Utah Wellbeing Survey Estimate: 14%; Age 50-59: American Community Survey Estimate: 13%, Utah Wellbeing Survey Estimate: 19%; Age 60-69: American Community Survey Estimate: 21%, Utah Wellbeing Survey Estimate: 32%; Age 70 or Over: American Community Survey Estimate: 23%, Utah Wellbeing Survey Estimate: 25%; Income under $25,000: American Community Survey Estimate: 11%, Utah Wellbeing Survey Estimate: 6%; Income $25,000 to $49,999: American Community Survey Estimate: 18%, Utah Wellbeing Survey Estimate: 14%; Income $50,000 to $74,999: American Community Survey Estimate: 23%, Utah Wellbeing Survey Estimate: 14%; Income $75,000 to $99,999: American Community Survey Estimate: 5%, Utah Wellbeing Survey Estimate: 21%; Income $100,000 to $149,999: American Community Survey Estimate: 25%, Utah Wellbeing Survey Estimate: 18%; Income $150,000 or over: American Community Survey Estimate: 18%, Utah Wellbeing Survey Estimate: 28%; Adult Female: American Community Survey Estimate: 50%, Utah Wellbeing Survey Estimate: 58%; Adult Male: American Community Survey Estimate: 50%, Utah Wellbeing Survey Estimate: 40%; Adult non-conforming or non-binary*: American Community Survey Estimate: NA%, Utah Wellbeing Survey Estimate: 2%; Employed: American Community Survey Estimate: 52%, Utah Wellbeing Survey Estimate: 39%; Out of work and looking for work: American Community Survey Estimate: 1%, Utah Wellbeing Survey Estimate: 1%; Other: American Community Survey Estimate: 47%, Utah Wellbeing Survey Estimate: 60%; No College Degree: American Community Survey Estimate: 52%, Utah Wellbeing Survey Estimate: 25%; College degree (4-year): American Community Survey Estimate: 48%, Utah Wellbeing Survey Estimate: 75%; Rent home/Renter occupied/Other: American Community Survey Estimate: 24%, Utah Wellbeing Survey Estimate: 19%; Own home/Owner occupied: American Community Survey Estimate: 76%, Utah Wellbeing Survey Estimate: 81%; Married: American Community Survey Estimate: 42%, Utah Wellbeing Survey Estimate: 69%; Children under 18 in household: American Community Survey Estimate: 18%, Utah Wellbeing Survey Estimate: 13%; Disability*: American Community Survey Estimate: NA%, Utah Wellbeing Survey Estimate: 5%; Chronic Condition*: American Community Survey Estimate: NA%, Utah Wellbeing Survey Estimate: 24%; Hispanic/Latino: American Community Survey Estimate: 4%, Utah Wellbeing Survey Estimate: 1%; Nonwhite: American Community Survey Estimate: 0%, Utah Wellbeing Survey Estimate: 6%; Church of Jesus Christ of Latter-day Saints*: American Community Survey Estimate: NA%, Utah Wellbeing Survey Estimate: 8%; Other Religion*: American Community Survey Estimate: NA%, Utah Wellbeing Survey Estimate: 17%; Agnostic/Atheist/No Religious Preference/Spiritual but Not Religious*: American Community Survey Estimate: NA%, Utah Wellbeing Survey Estimate: 75%

Overall Personal Wellbeing and Overall Wellbeing in Springdale

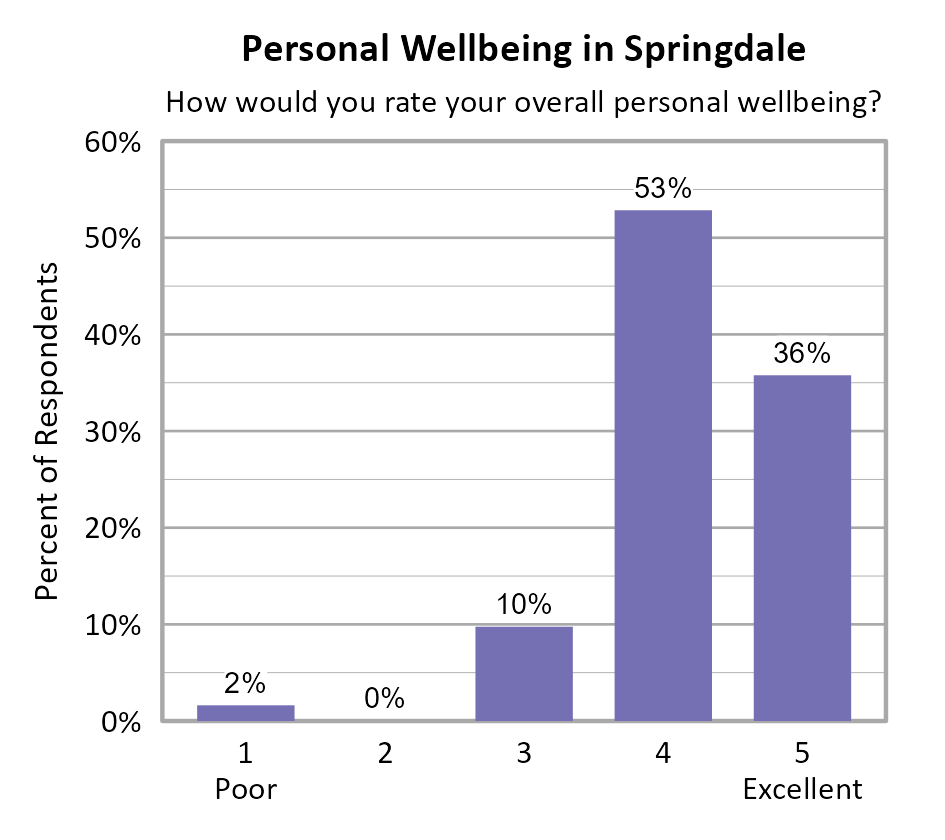
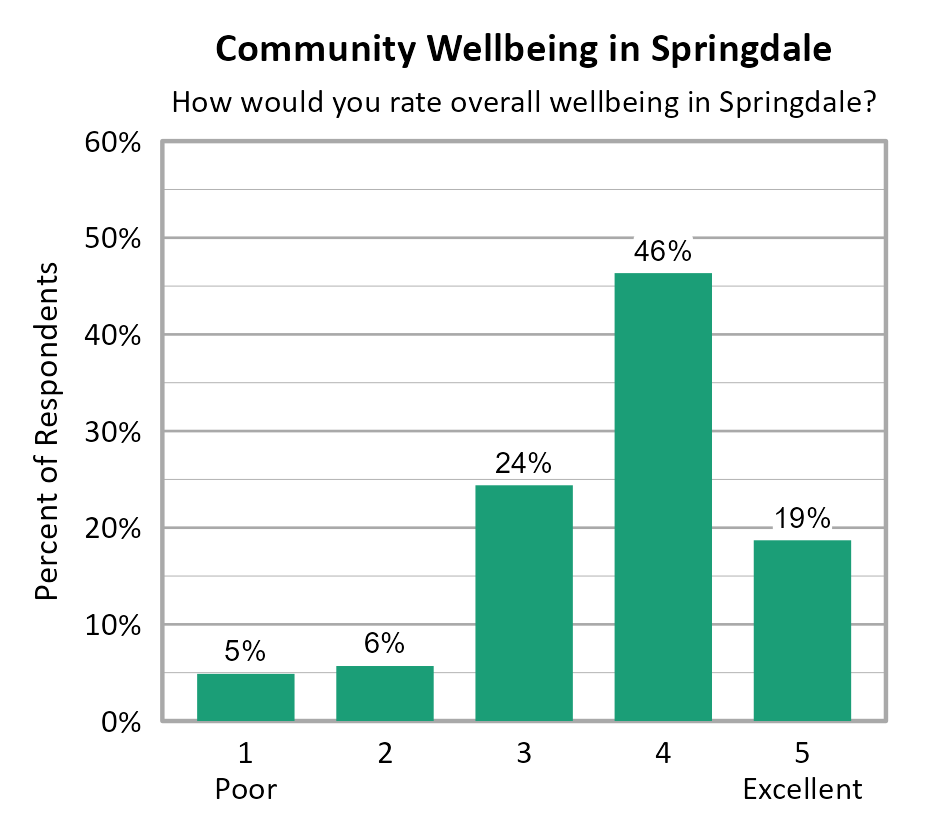
Survey participants were asked about their overall personal wellbeing and overall community wellbeing in Springdale. These wellbeing indicators were both measured on a 5-point scale from poor (1) to excellent (5). The average personal wellbeing score in Springdale was 4.21 with 89% of respondents indicating their wellbeing at a 4 or 5 on the 5-point scale. The average score for community wellbeing in Springdale was 3.68 with 65% of respondents indicating community wellbeing at a 4 or 5 on the 5-point scale.

Bar Chart. Title: Personal Wellbeing in Springdale. Subtitle: How would you rate your overall personal wellbeing? Data — 1 Poor: 2% of respondents; 2: 0% of respondents; 3: 10% of respondents; 4: 53% of respondents; 5 Excellent: 36% of respondents

Bar Chart. Title: Community Wellbeing in Springdale. Subtitle: How would you rate overall wellbeing in Springdale? Data — 1 Poor: 5% of respondents; 2: 6% of respondents; 3: 24% of respondents; 4: 46% of respondents; 5 Excellent: 19% of respondents

Comparing Wellbeing Across Utah Cities

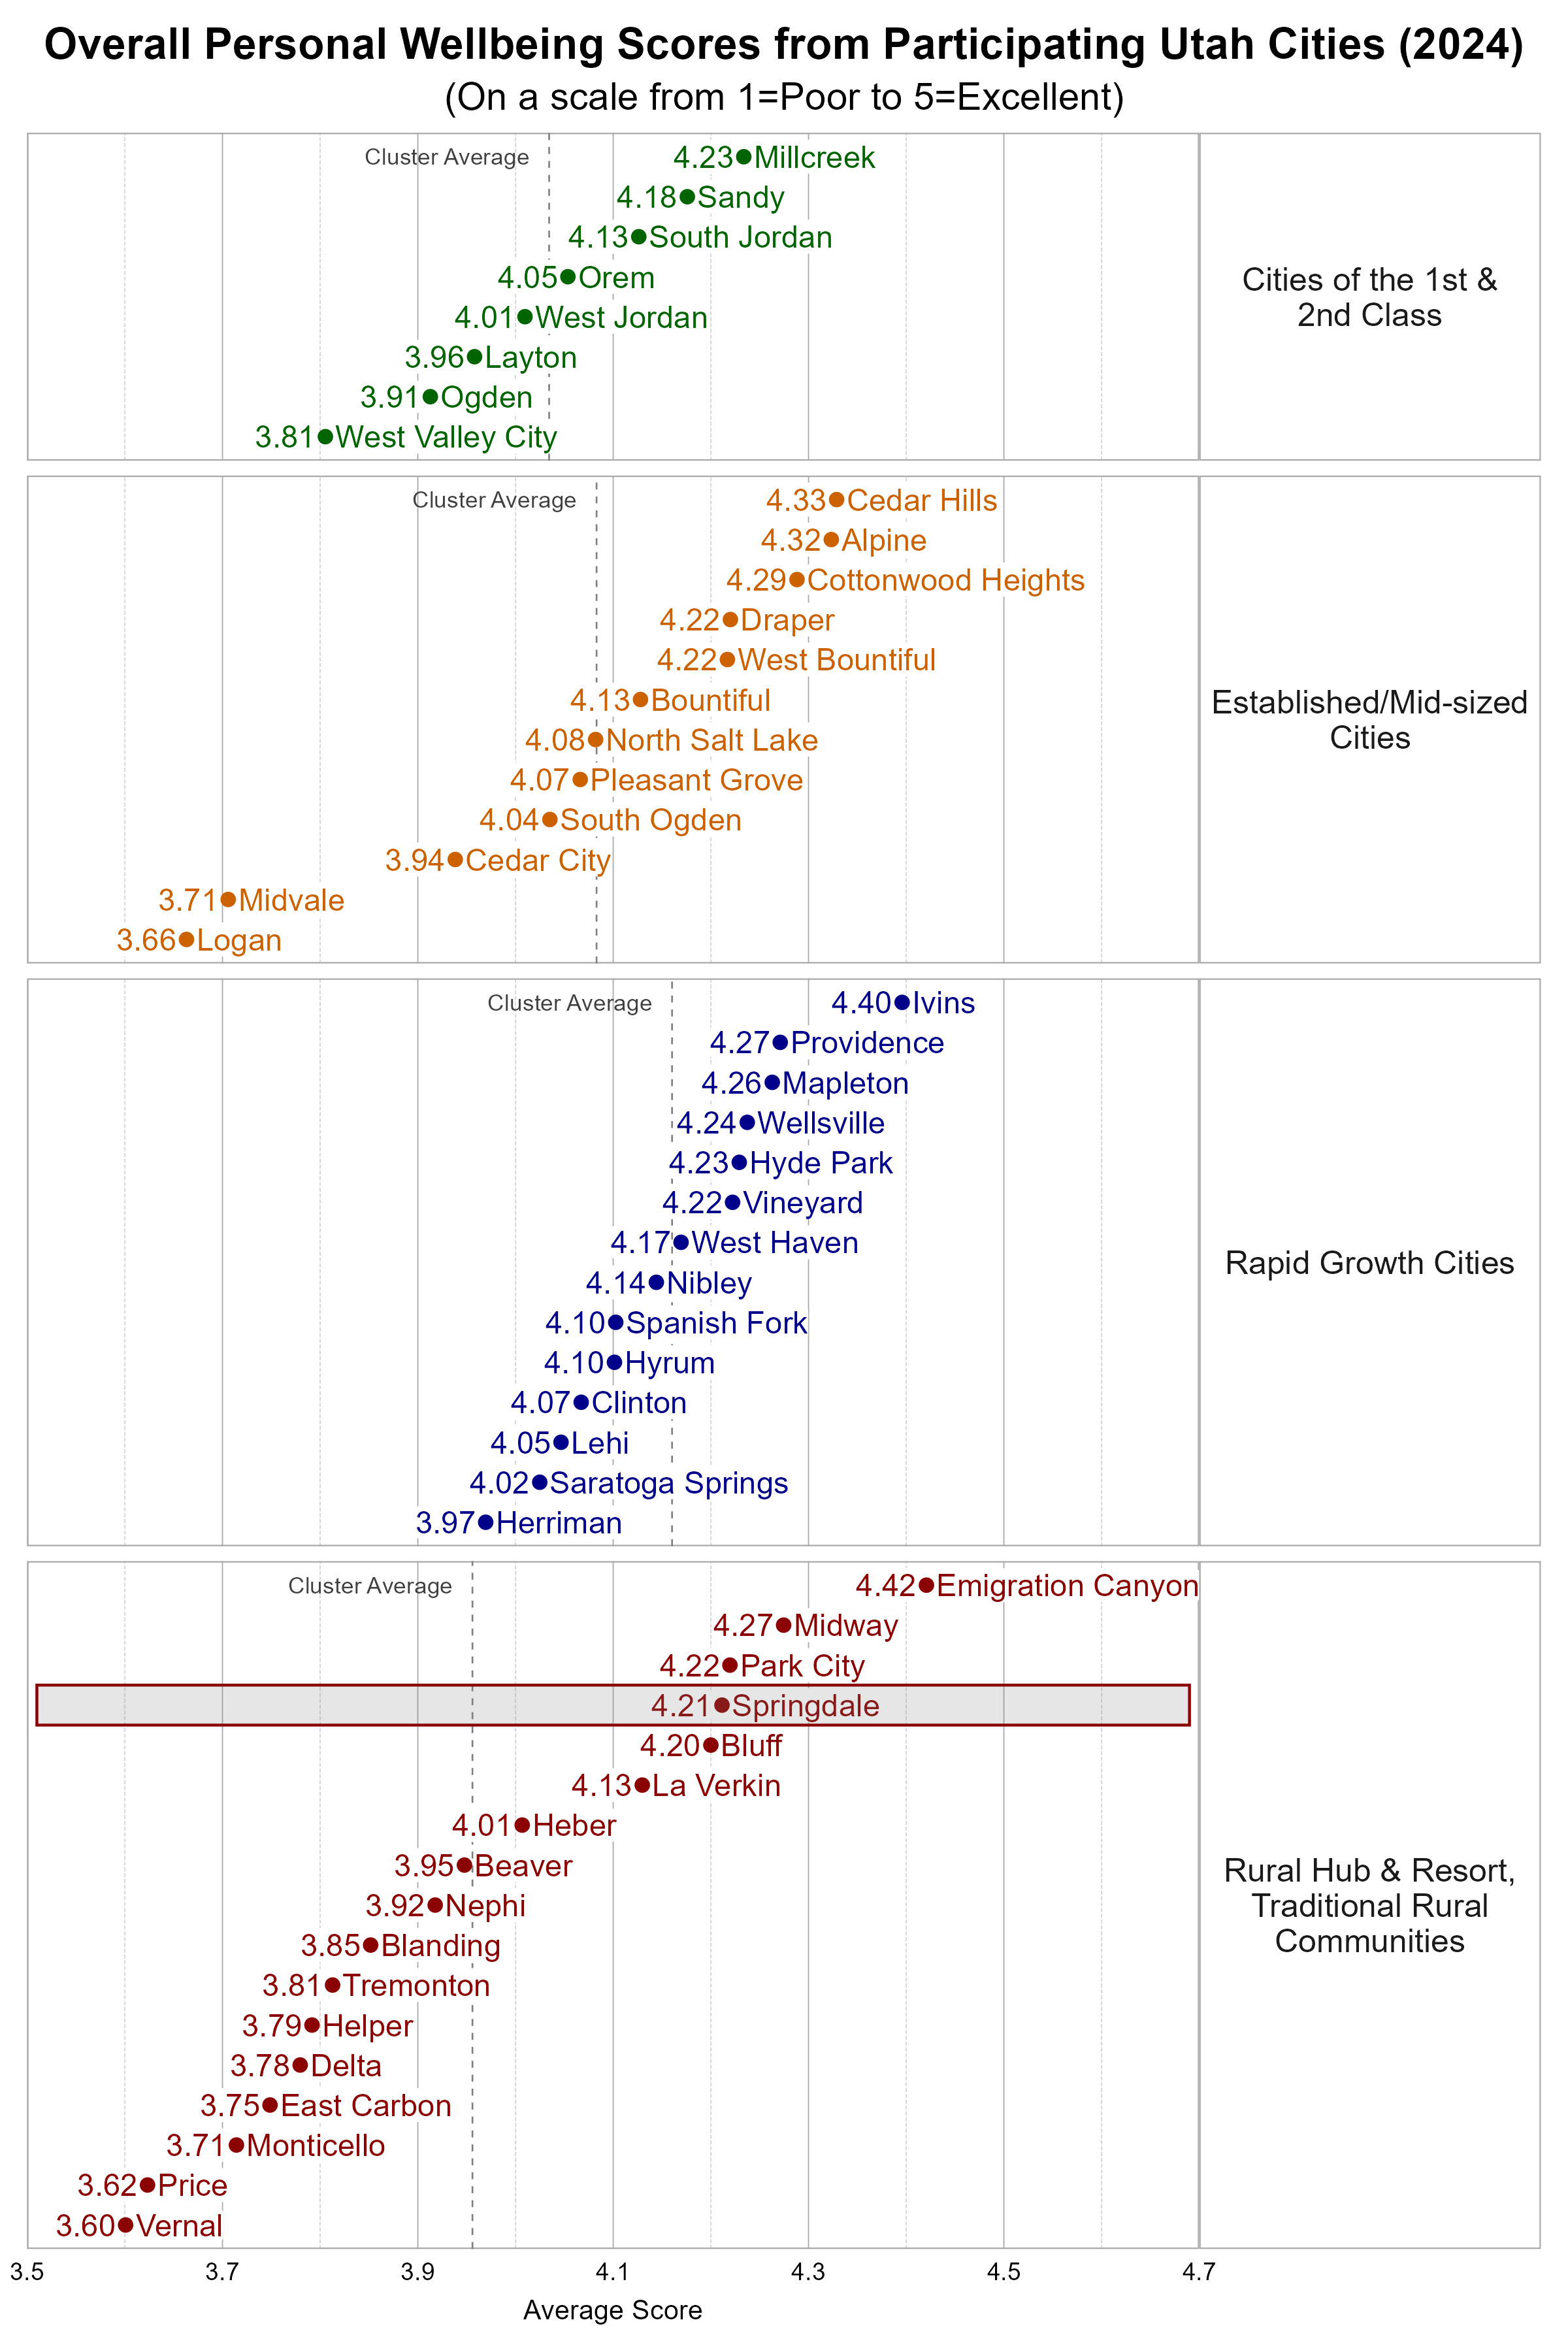
The Utah League of Cities and Towns clusters cities and towns into five different categories based on size and growth rates. We utilize these clusters in our analysis. Springdale is classified as a Rural Hub/Resort Community (and we have combined these with the Traditional Rural Communities). Some cities and towns may fit within more than one cluster.

Within the Rural cluster, Springdale was above the average overall personal wellbeing score and slightly above the average overall community wellbeing score.

Dot Plot. Title: Overall Personal Wellbeing Scores from Participating Utah Cities (2024). Subtitle: (On a scale from 1=Poor to 5=Excellent). Data — Group: Cities of the 1st & 2nd Class — West Valley City Average Score 3.81; Ogden Average Score 3.91; Layton Average Score 3.96; West Jordan Average Score 4.01; Orem Average Score 4.05; South Jordan Average Score 4.13; Sandy Average Score 4.18; Millcreek Average Score 4.23; Group: Established/Mid-sized Cities — Logan Average Score 3.66; Midvale Average Score 3.71; Cedar City Average Score 3.94; South Ogden Average Score 4.04; Pleasant Grove Average Score 4.07; North Salt Lake Average Score 4.08; Bountiful Average Score 4.13; Draper Average Score 4.22; West Bountiful Average Score 4.22; Cottonwood Heights Average Score 4.29; Alpine Average Score 4.32; Cedar Hills Average Score 4.33; Group: Rapid Growth Cities — Herriman Average Score 3.97; Saratoga Springs Average Score 4.02; Lehi Average Score 4.05; Clinton Average Score 4.07; Hyrum Average Score 4.10; Spanish Fork Average Score 4.10; Nibley Average Score 4.14; West Haven Average Score 4.17; Vineyard Average Score 4.22; Hyde Park Average Score 4.23; Wellsville Average Score 4.24; Mapleton Average Score 4.26; Providence Average Score 4.27; Ivins Average Score 4.40; Group: Rural Hub & Resort, Traditional Rural Communities — Vernal Average Score 3.60; Price Average Score 3.62; Monticello Average Score 3.71; East Carbon Average Score 3.75; Delta Average Score 3.78; Helper Average Score 3.79; Tremonton Average Score 3.81; Blanding Average Score 3.85; Nephi Average Score 3.92; Beaver Average Score 3.95; Heber Average Score 4.01; La Verkin Average Score 4.13; Bluff Average Score 4.20; Springdale Average Score 4.21; Park City Average Score 4.22; Midway Average Score 4.27; Emigration Canyon Average Score 4.42

Dot Plot. Title: Overall Community Wellbeing Scores from Participating Utah Cities (2024). Subtitle: (On a scale from 1=Poor to 5=Excellent). Data — Group: Cities of the 1st & 2nd Class — Ogden Average Score 3.27; West Valley City Average Score 3.38; West Jordan Average Score 3.50; Layton Average Score 3.52; Orem Average Score 3.63; Millcreek Average Score 3.82; Sandy Average Score 3.91; South Jordan Average Score 4.00; Group: Established/Mid-sized Cities — Logan Average Score 3.18; Midvale Average Score 3.24; Cedar City Average Score 3.42; Pleasant Grove Average Score 3.61; South Ogden Average Score 3.72; North Salt Lake Average Score 3.75; Bountiful Average Score 3.84; Cottonwood Heights Average Score 3.90; West Bountiful Average Score 4.00; Draper Average Score 4.03; Alpine Average Score 4.15; Cedar Hills Average Score 4.15; Group: Rapid Growth Cities — Herriman Average Score 3.40; Vineyard Average Score 3.43; Saratoga Springs Average Score 3.46; Lehi Average Score 3.50; West Haven Average Score 3.67; Hyrum Average Score 3.76; Clinton Average Score 3.79; Spanish Fork Average Score 3.80; Ivins Average Score 3.91; Providence Average Score 3.91; Nibley Average Score 3.92; Hyde Park Average Score 4.02; Mapleton Average Score 4.02; Wellsville Average Score 4.11; Group: Rural Hub & Resort, Traditional Rural Communities — Price Average Score 2.88; East Carbon Average Score 3.03; Tremonton Average Score 3.09; Monticello Average Score 3.11; Vernal Average Score 3.12; Blanding Average Score 3.31; Heber Average Score 3.42; Delta Average Score 3.43; Nephi Average Score 3.43; La Verkin Average Score 3.57; Beaver Average Score 3.59; Springdale Average Score 3.68; Helper Average Score 3.71; Park City Average Score 3.85; Bluff Average Score 3.88; Midway Average Score 4.07; Emigration Canyon Average Score 4.28

Wellbeing Domains in Springdale

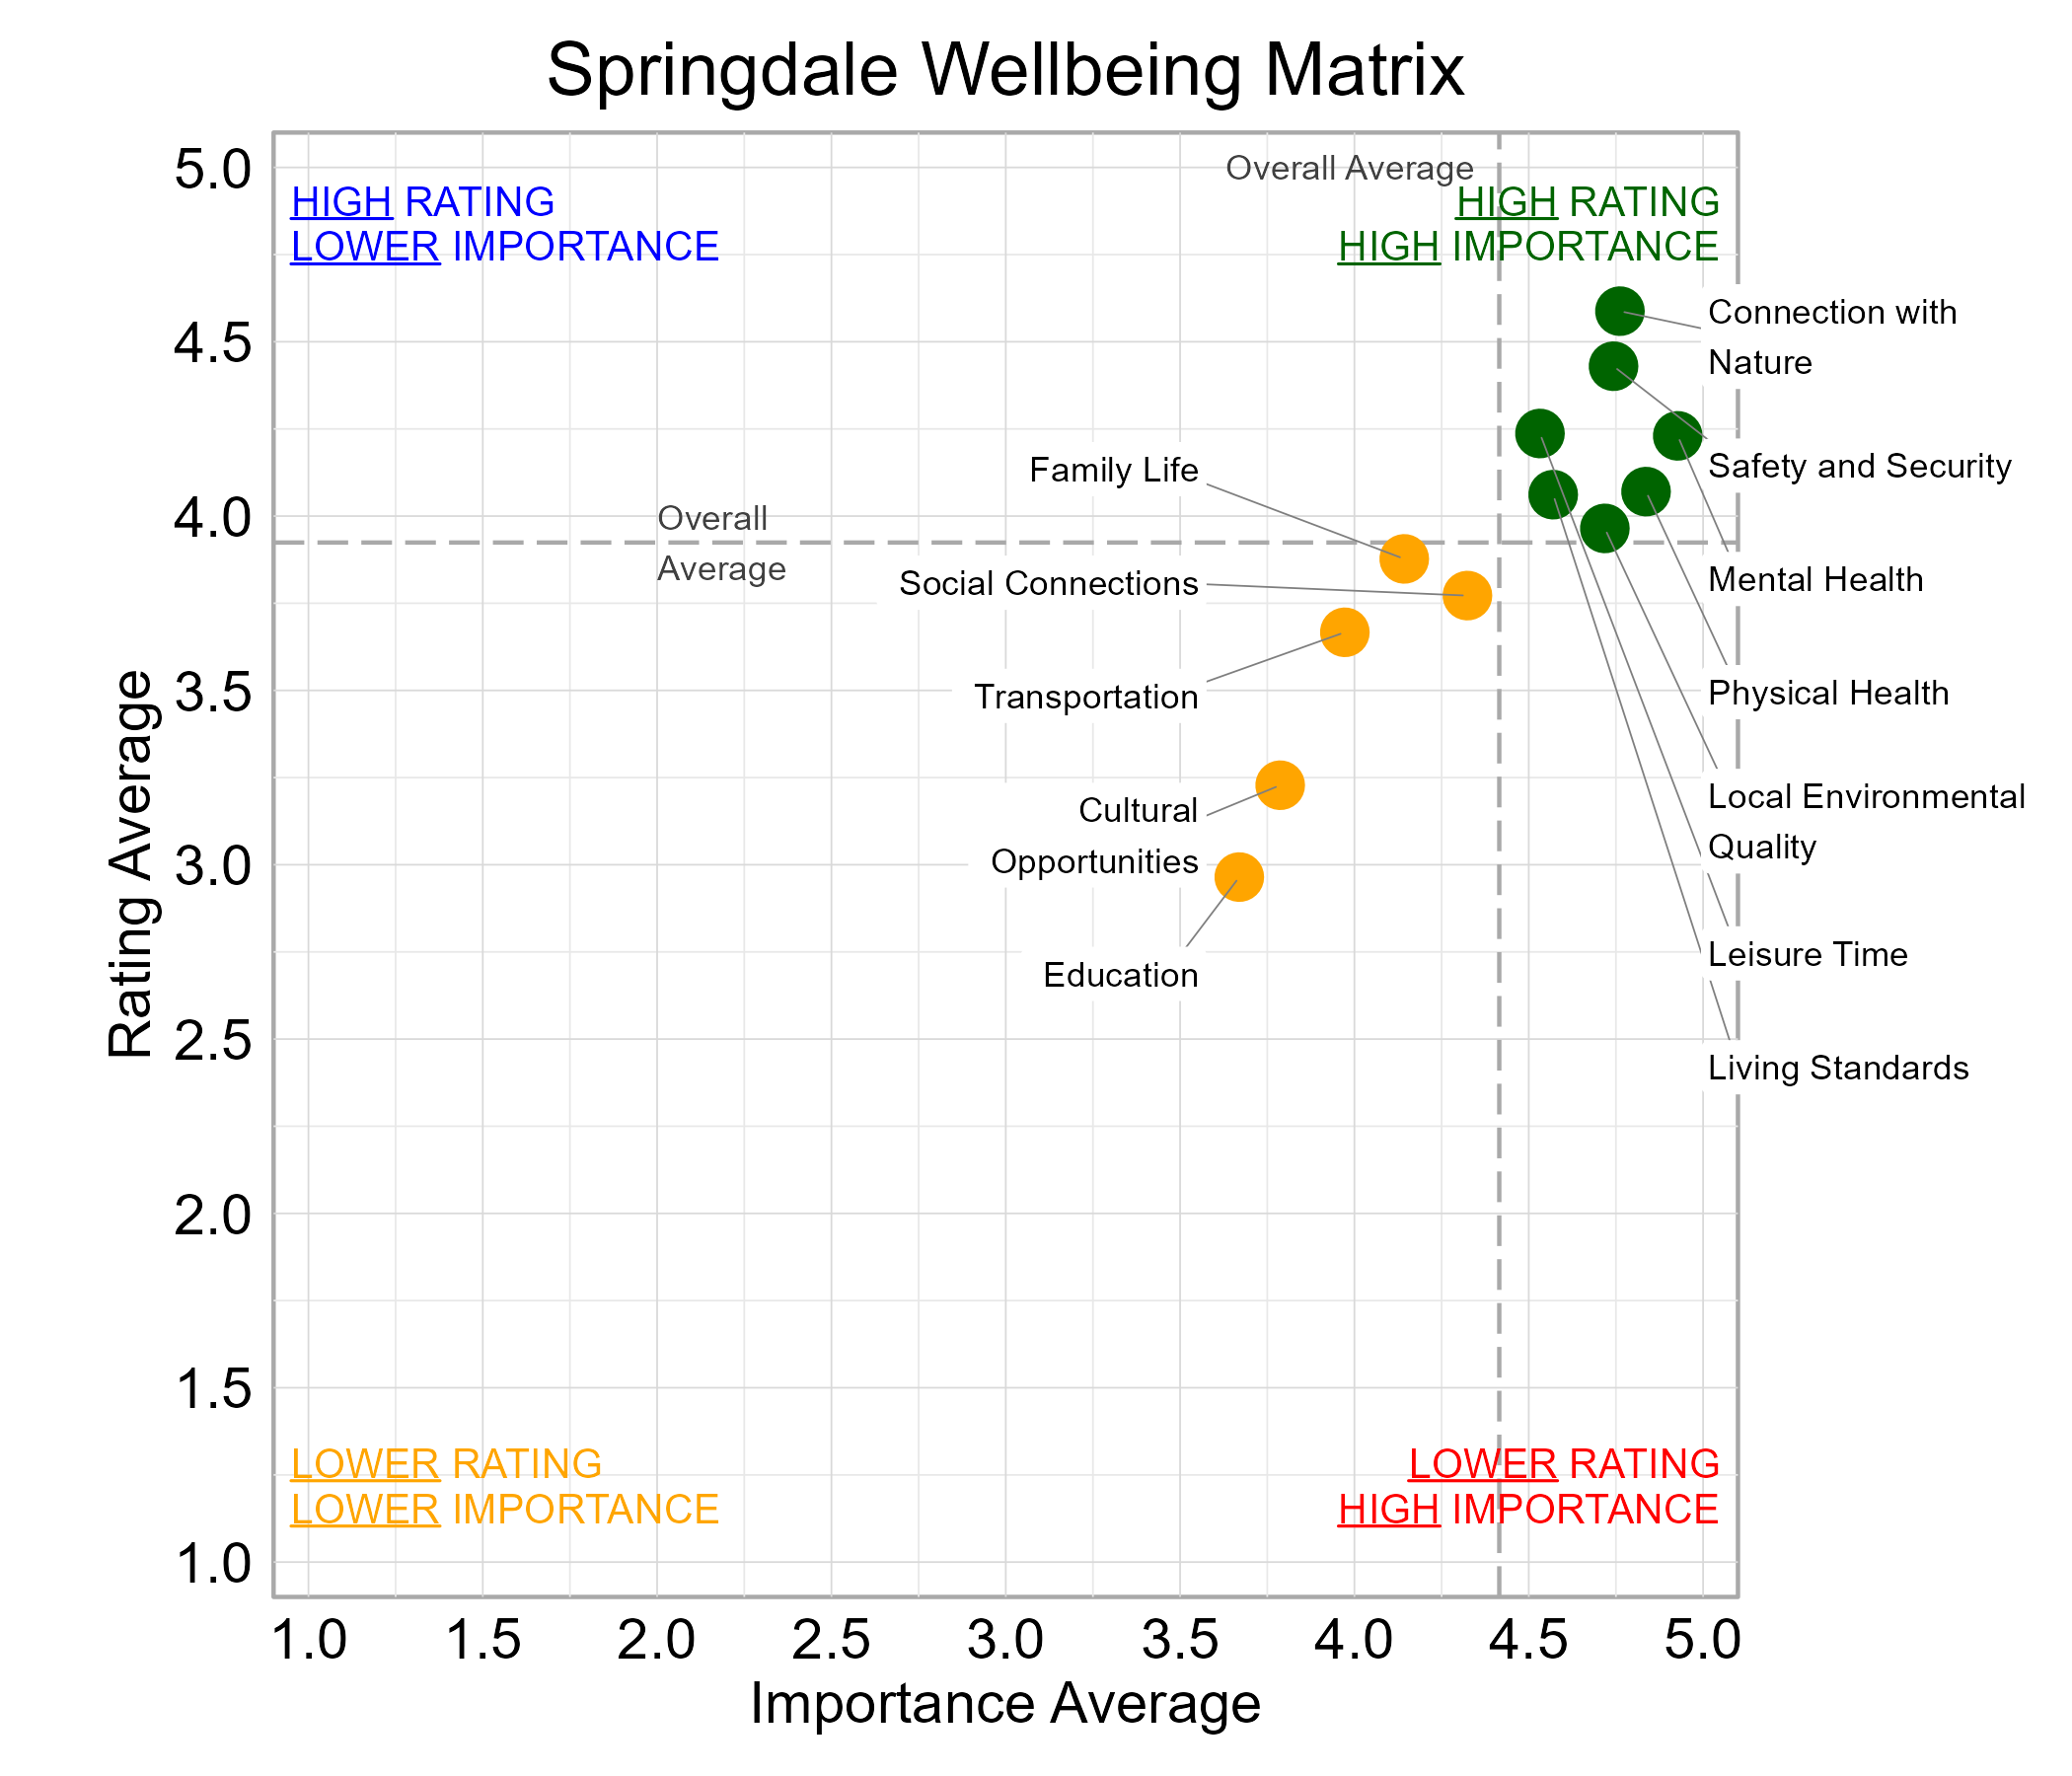
According to national and international entities that track wellbeing, there are a number of common dimensions or domains of wellbeing. Survey respondents rated twelve domains on a 5-point scale from poor to excellent. They were also asked to indicate the importance of each domain to their overall personal wellbeing on a 5-point scale from not at all important to very important. The highest rated wellbeing domains for respondents in Springdale were Connection with Nature (94%), Safety and Security (91%), and Mental Health (84%). The most important wellbeing domains were Mental Health (100%), Physical Health (97%), Local Environmental Quality (95%), Connection with Nature (95%), Living Standards (94%), and Safety and Security (94%).

Likert Graph. Title: Wellbeing Domain Ratings in Springdale. Subtitle: How would you rate your level of personal wellbeing in each of the following categories? Data — Category: Connection with Nature -  6% of respondents rated as poor, fair, or moderate while  94% rated as good or excellent; Category: Safety and Security -  9% of respondents rated as poor, fair, or moderate while  91% rated as good or excellent; Category: Mental Health - 16% of respondents rated as poor, fair, or moderate while  84% rated as good or excellent; Category: Leisure Time - 18% of respondents rated as poor, fair, or moderate while  82% rated as good or excellent; Category: Physical Health - 19% of respondents rated as poor, fair, or moderate while  81% rated as good or excellent; Category: Living Standards - 21% of respondents rated as poor, fair, or moderate while  79% rated as good or excellent; Category: Local Environmental Quality - 25% of respondents rated as poor, fair, or moderate while  75% rated as good or excellent; Category: Family Life - 33% of respondents rated as poor, fair, or moderate while  67% rated as good or excellent; Category: Social Connections - 39% of respondents rated as poor, fair, or moderate while  61% rated as good or excellent; Category: Transportation - 39% of respondents rated as poor, fair, or moderate while  61% rated as good or excellent; Category: Cultural Opportunities - 56% of respondents rated as poor, fair, or moderate while  44% rated as good or excellent; Category: Education - 67% of respondents rated as poor, fair, or moderate while  33% rated as good or excellent Likert Graph. Title: Wellbeing Domain Importance in Springdale. Subtitle: How important are the following categories to your overall personal wellbeing? Data — Category: Mental Health -  0% of respondents rated as not at all important, slightly important, or moderately important while 100% rated as important or very important; Category: Physical Health -  3% of respondents rated as not at all important, slightly important, or moderately important while  97% rated as important or very important; Category: Connection with Nature -  5% of respondents rated as not at all important, slightly important, or moderately important while  95% rated as important or very important; Category: Local Environmental Quality -  5% of respondents rated as not at all important, slightly important, or moderately important while  95% rated as important or very important; Category: Living Standards -  6% of respondents rated as not at all important, slightly important, or moderately important while  94% rated as important or very important; Category: Safety and Security -  6% of respondents rated as not at all important, slightly important, or moderately important while  94% rated as important or very important; Category: Leisure Time -  7% of respondents rated as not at all important, slightly important, or moderately important while  93% rated as important or very important; Category: Social Connections - 17% of respondents rated as not at all important, slightly important, or moderately important while  83% rated as important or very important; Category: Family Life - 25% of respondents rated as not at all important, slightly important, or moderately important while  75% rated as important or very important; Category: Transportation - 31% of respondents rated as not at all important, slightly important, or moderately important while  69% rated as important or very important; Category: Cultural Opportunities - 41% of respondents rated as not at all important, slightly important, or moderately important while  59% rated as important or very important; Category: Education - 41% of respondents rated as not at all important, slightly important, or moderately important while  59% rated as important or very important

Wellbeing Matrix for Springdale

The graph below illustrates the relationship between the average rating and the average importance of wellbeing domains for survey respondents from Springdale. Connection with Nature, Leisure Time, Living Standards, Local Environmental Quality, Mental Health, Physical Health, and Safety and Security were highly important and rated above average among the domains. No Domains fell in the “red zone” of higher importance and lower ratings.

Scatterplot. Title: Springdale Wellbeing Matrix. Subtitle: Domains are classified into four quadrants depending on their average rating and average importance as compared to the average of all the average domain ratings and the average domain importance ratings. Data — High rating, high importance (green quadrant) domains include: Connection with Nature, Leisure Time, Living Standards, Local Environmental Quality, Mental Health, Physical Health, and Safety and Security; Lower rating, lower importance (yellow quadrant) domains include: Cultural Opportunities, Education, Family Life, Social Connections, and Transportation

Community Connection in Springdale

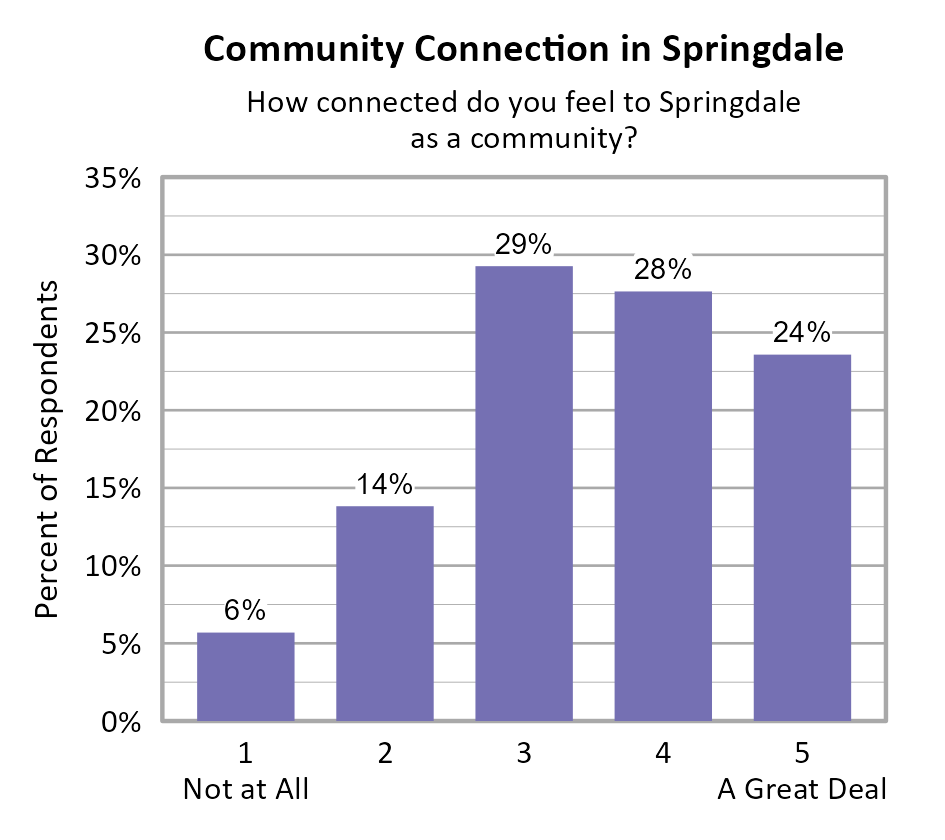
Survey participants were asked about how connected they feel to Springdale on a 5-point scale from not at all (1) to a great deal (5), and the average score of all respondents was 3.5.

Bar Chart. Title: Community Connection in Springdale. Subtitle: How connected do you feel to Springdale as a community? Data — 1 Not at All: 6% of respondents; 2: 14% of respondents; 3: 29% of respondents; 4: 28% of respondents; 5 A Great Deal: 24% of respondents

No clear relationship was found between individuals’ community connection and overall personal wellbeing or with mental health.

Likert Graph. Title: Comparing Overall Wellbeing and Community Connection in Springdale. Data — Of the 14 respondents that rate their overall personal wellbeing as a (Poor) 1, 2 or 3, 50% indicate a community connection score of 1, 2, or 3 while 50% indicate a community connection score of 4 or 5; Of the 65 respondents that rate their overall personal wellbeing as a 4,  54% indicate a community connection score of 1, 2, or 3 while 46% indicate a community connection score of 4 or 5; Of the 44 respondents that rate their overall personal wellbeing as a (Excellent) 5,  41% indicate a community connection score of 1, 2, or 3 while 59% indicate a community connection score of 4 or 5

Likert Graph. Title: Comparing Mental Health Rating and Community Connection in Springdale. Data — Of the 18 respondents that rate their mental health rating as a (Poor) 1, 2, or 3, 50% indicate a community connection score of 1, 2, or 3 while 50% indicate a community connection score of 4 or 5; Of the 47 respondents that rate their mental health rating as a 4, 60% indicate a community connection score of 1, 2, or 3 while 40% indicate a community connection score of 4 or 5; Of the 48 respondents that rate their mental health rating as a (Excellent) 5, 38% indicate a community connection score of 1, 2, or 3 while 62% indicate a community connection score of 4 or 5

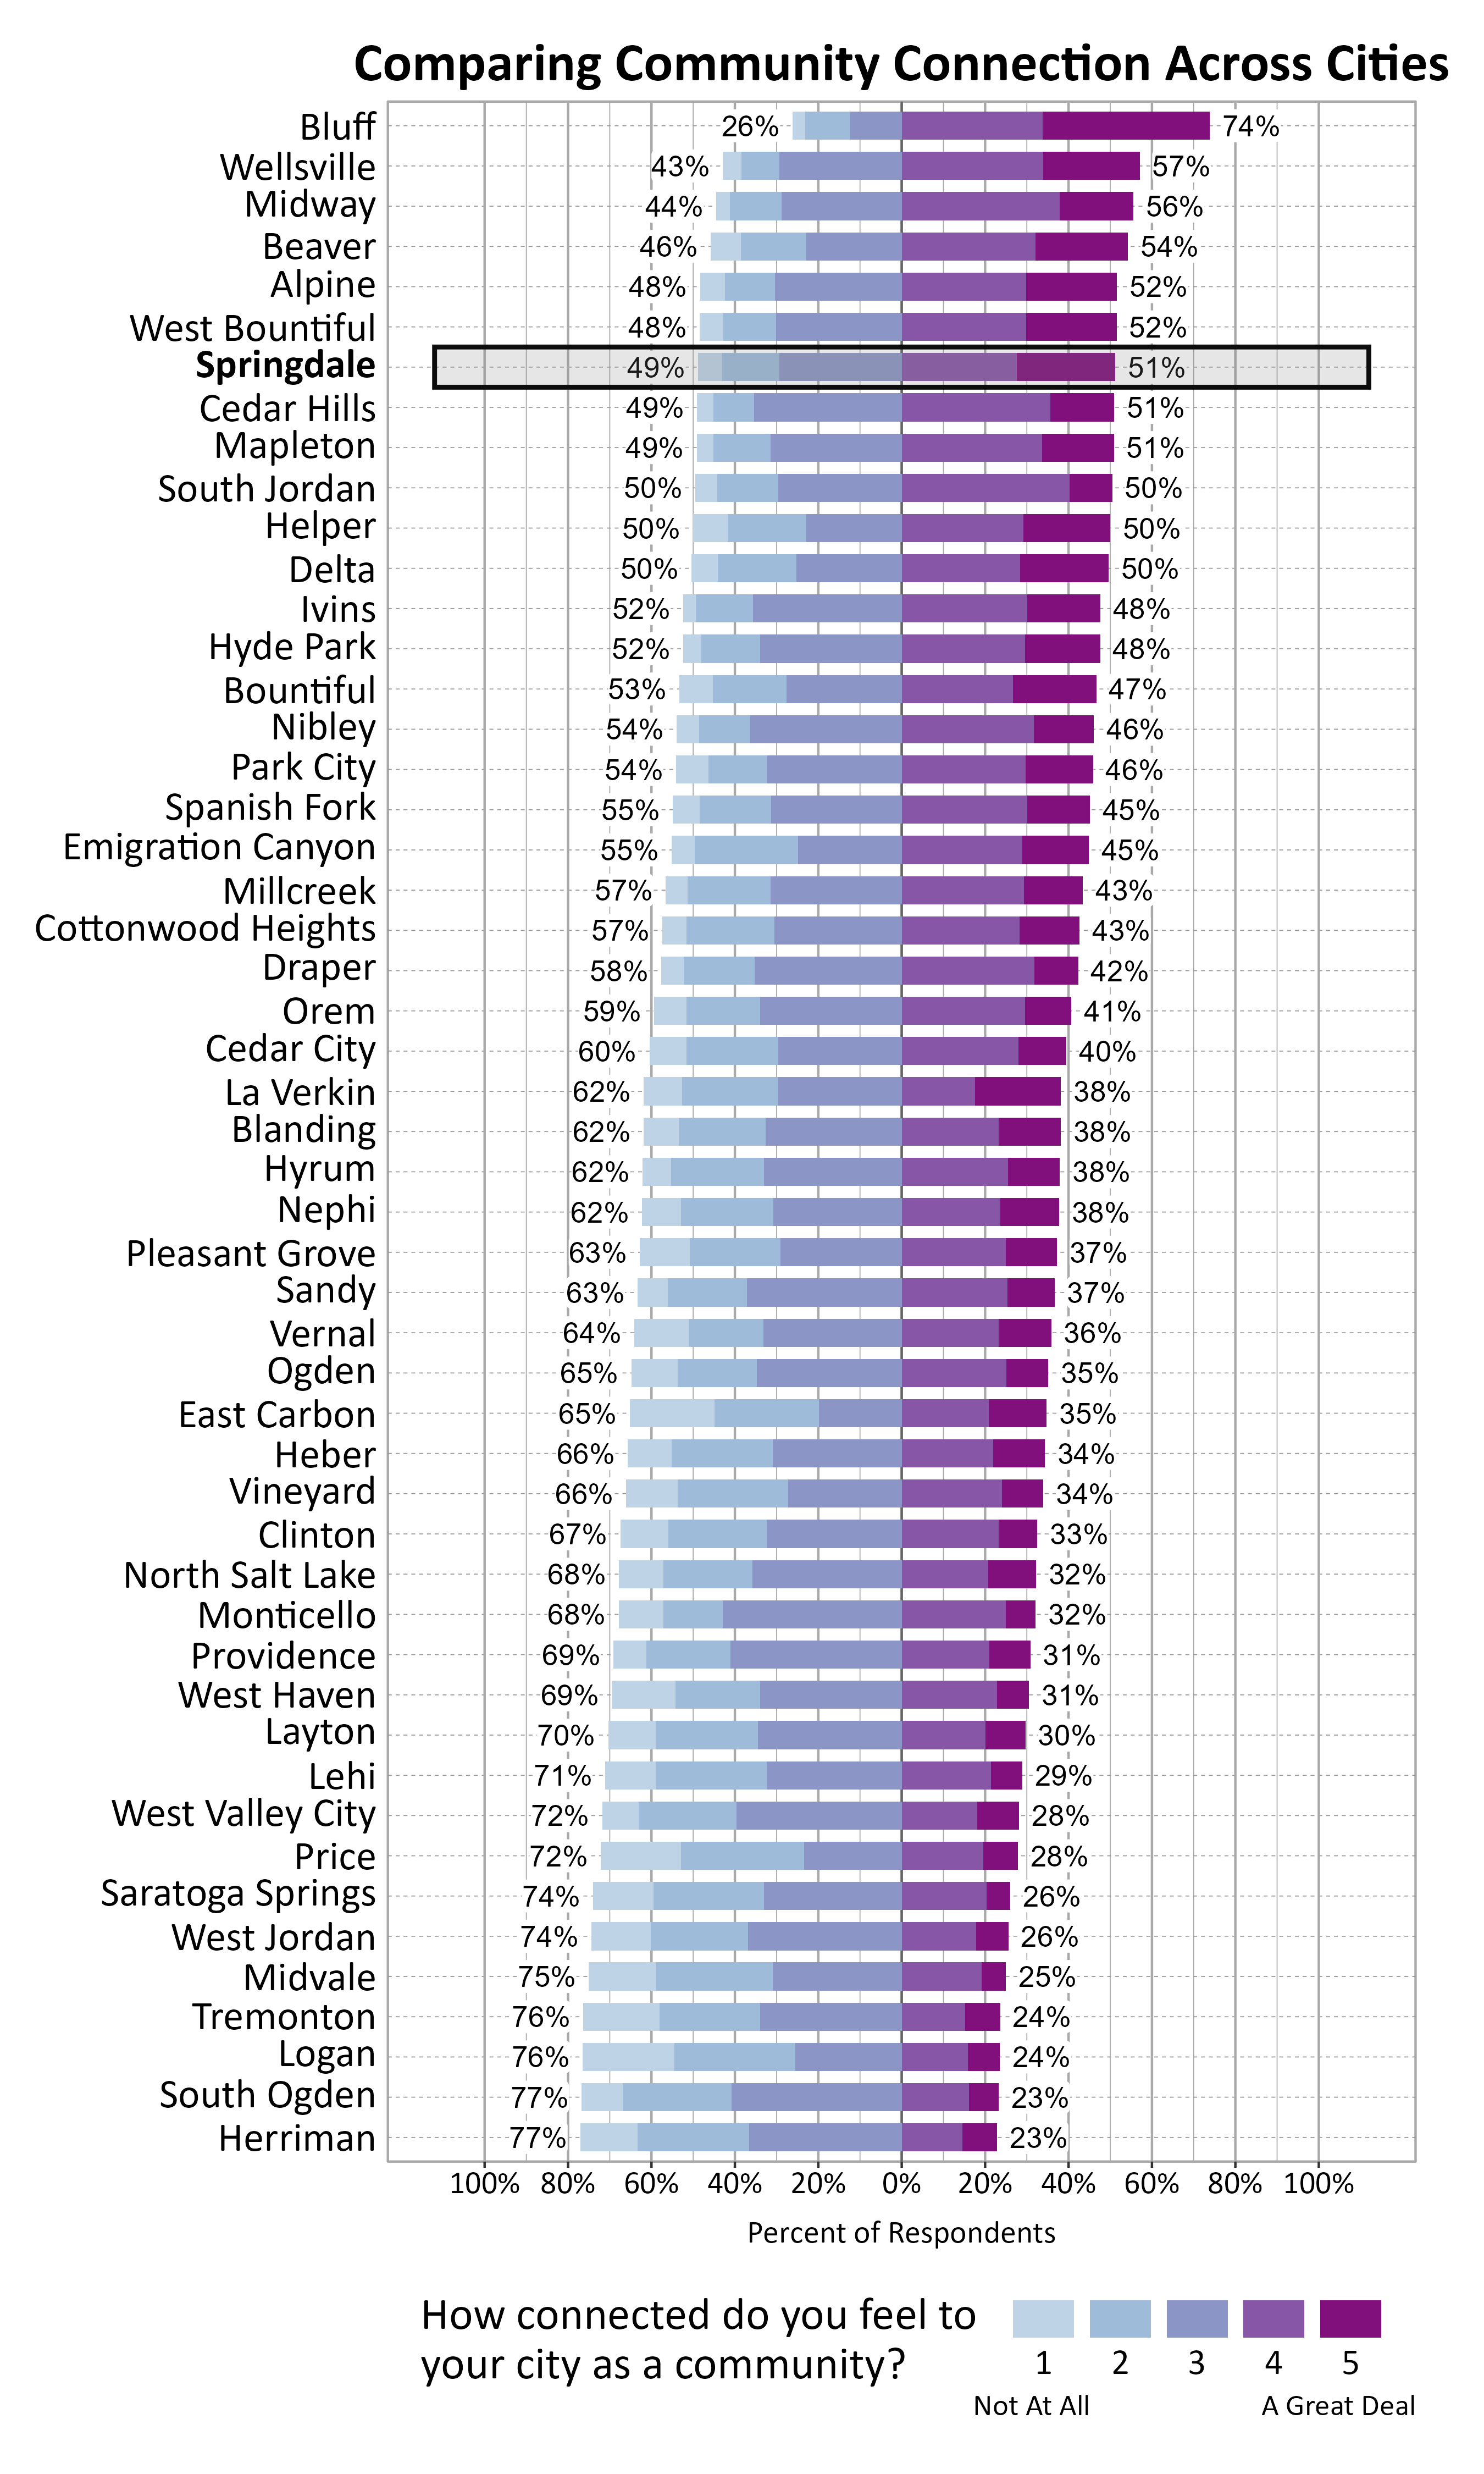
The graph below shows how Wellbeing Project cities and towns compare on feelings of community connection based on the percentage of respondents who answered 4 or a 5 on a 5-point scale from “not at all” to “a great deal” connected to their city or town. Springdale ranked 7 out of the 51 cities that participated.

Likert Graph. Title: Comparing Community Connection Across Cities. Subtitle: How connected do you feel to your city as a community? 1 being not at all and 5 being a great deal. Data — City: Bluff 26% of respondents indicated a community connection score of 1, 2, or 3 while 74% of respondents indicated a community connection score of 4 or 5; City: Wellsville 43% of respondents indicated a community connection score of 1, 2, or 3 while 57% of respondents indicated a community connection score of 4 or 5; City: Midway 44% of respondents indicated a community connection score of 1, 2, or 3 while 56% of respondents indicated a community connection score of 4 or 5; City: Beaver 46% of respondents indicated a community connection score of 1, 2, or 3 while 54% of respondents indicated a community connection score of 4 or 5; City: Alpine 48% of respondents indicated a community connection score of 1, 2, or 3 while 52% of respondents indicated a community connection score of 4 or 5; City: West Bountiful 48% of respondents indicated a community connection score of 1, 2, or 3 while 52% of respondents indicated a community connection score of 4 or 5; City: Springdale 49% of respondents indicated a community connection score of 1, 2, or 3 while 51% of respondents indicated a community connection score of 4 or 5; City: Cedar Hills 49% of respondents indicated a community connection score of 1, 2, or 3 while 51% of respondents indicated a community connection score of 4 or 5; City: Mapleton 49% of respondents indicated a community connection score of 1, 2, or 3 while 51% of respondents indicated a community connection score of 4 or 5; City: South Jordan 50% of respondents indicated a community connection score of 1, 2, or 3 while 50% of respondents indicated a community connection score of 4 or 5; City: Helper 50% of respondents indicated a community connection score of 1, 2, or 3 while 50% of respondents indicated a community connection score of 4 or 5; City: Delta 50% of respondents indicated a community connection score of 1, 2, or 3 while 50% of respondents indicated a community connection score of 4 or 5; City: Ivins 52% of respondents indicated a community connection score of 1, 2, or 3 while 48% of respondents indicated a community connection score of 4 or 5; City: Hyde Park 52% of respondents indicated a community connection score of 1, 2, or 3 while 48% of respondents indicated a community connection score of 4 or 5; City: Bountiful 53% of respondents indicated a community connection score of 1, 2, or 3 while 47% of respondents indicated a community connection score of 4 or 5; City: Nibley 54% of respondents indicated a community connection score of 1, 2, or 3 while 46% of respondents indicated a community connection score of 4 or 5; City: Park City 54% of respondents indicated a community connection score of 1, 2, or 3 while 46% of respondents indicated a community connection score of 4 or 5; City: Spanish Fork 55% of respondents indicated a community connection score of 1, 2, or 3 while 45% of respondents indicated a community connection score of 4 or 5; City: Emigration Canyon 55% of respondents indicated a community connection score of 1, 2, or 3 while 45% of respondents indicated a community connection score of 4 or 5; City: Millcreek 57% of respondents indicated a community connection score of 1, 2, or 3 while 43% of respondents indicated a community connection score of 4 or 5; City: Cottonwood Heights 57% of respondents indicated a community connection score of 1, 2, or 3 while 43% of respondents indicated a community connection score of 4 or 5; City: Draper 58% of respondents indicated a community connection score of 1, 2, or 3 while 42% of respondents indicated a community connection score of 4 or 5; City: Orem 59% of respondents indicated a community connection score of 1, 2, or 3 while 41% of respondents indicated a community connection score of 4 or 5; City: Cedar City 60% of respondents indicated a community connection score of 1, 2, or 3 while 40% of respondents indicated a community connection score of 4 or 5; City: La Verkin 62% of respondents indicated a community connection score of 1, 2, or 3 while 38% of respondents indicated a community connection score of 4 or 5; City: Blanding 62% of respondents indicated a community connection score of 1, 2, or 3 while 38% of respondents indicated a community connection score of 4 or 5; City: Hyrum 62% of respondents indicated a community connection score of 1, 2, or 3 while 38% of respondents indicated a community connection score of 4 or 5; City: Nephi 62% of respondents indicated a community connection score of 1, 2, or 3 while 38% of respondents indicated a community connection score of 4 or 5; City: Pleasant Grove 63% of respondents indicated a community connection score of 1, 2, or 3 while 37% of respondents indicated a community connection score of 4 or 5; City: Sandy 63% of respondents indicated a community connection score of 1, 2, or 3 while 37% of respondents indicated a community connection score of 4 or 5; City: Vernal 64% of respondents indicated a community connection score of 1, 2, or 3 while 36% of respondents indicated a community connection score of 4 or 5; City: Ogden 65% of respondents indicated a community connection score of 1, 2, or 3 while 35% of respondents indicated a community connection score of 4 or 5; City: East Carbon 65% of respondents indicated a community connection score of 1, 2, or 3 while 35% of respondents indicated a community connection score of 4 or 5; City: Heber 66% of respondents indicated a community connection score of 1, 2, or 3 while 34% of respondents indicated a community connection score of 4 or 5; City: Vineyard 66% of respondents indicated a community connection score of 1, 2, or 3 while 34% of respondents indicated a community connection score of 4 or 5; City: Clinton 67% of respondents indicated a community connection score of 1, 2, or 3 while 33% of respondents indicated a community connection score of 4 or 5; City: North Salt Lake 68% of respondents indicated a community connection score of 1, 2, or 3 while 32% of respondents indicated a community connection score of 4 or 5; City: Monticello 68% of respondents indicated a community connection score of 1, 2, or 3 while 32% of respondents indicated a community connection score of 4 or 5; City: Providence 69% of respondents indicated a community connection score of 1, 2, or 3 while 31% of respondents indicated a community connection score of 4 or 5; City: West Haven 69% of respondents indicated a community connection score of 1, 2, or 3 while 31% of respondents indicated a community connection score of 4 or 5; City: Layton 70% of respondents indicated a community connection score of 1, 2, or 3 while 30% of respondents indicated a community connection score of 4 or 5; City: Lehi 71% of respondents indicated a community connection score of 1, 2, or 3 while 29% of respondents indicated a community connection score of 4 or 5; City: West Valley City 72% of respondents indicated a community connection score of 1, 2, or 3 while 28% of respondents indicated a community connection score of 4 or 5; City: Price 72% of respondents indicated a community connection score of 1, 2, or 3 while 28% of respondents indicated a community connection score of 4 or 5; City: Saratoga Springs 74% of respondents indicated a community connection score of 1, 2, or 3 while 26% of respondents indicated a community connection score of 4 or 5; City: West Jordan 74% of respondents indicated a community connection score of 1, 2, or 3 while 26% of respondents indicated a community connection score of 4 or 5; City: Midvale 75% of respondents indicated a community connection score of 1, 2, or 3 while 25% of respondents indicated a community connection score of 4 or 5; City: Tremonton 76% of respondents indicated a community connection score of 1, 2, or 3 while 24% of respondents indicated a community connection score of 4 or 5; City: Logan 76% of respondents indicated a community connection score of 1, 2, or 3 while 24% of respondents indicated a community connection score of 4 or 5; City: South Ogden 77% of respondents indicated a community connection score of 1, 2, or 3 while 23% of respondents indicated a community connection score of 4 or 5; City: Herriman 77% of respondents indicated a community connection score of 1, 2, or 3 while 23% of respondents indicated a community connection score of 4 or 5

Participation in Recreation and Nature-Related Activities

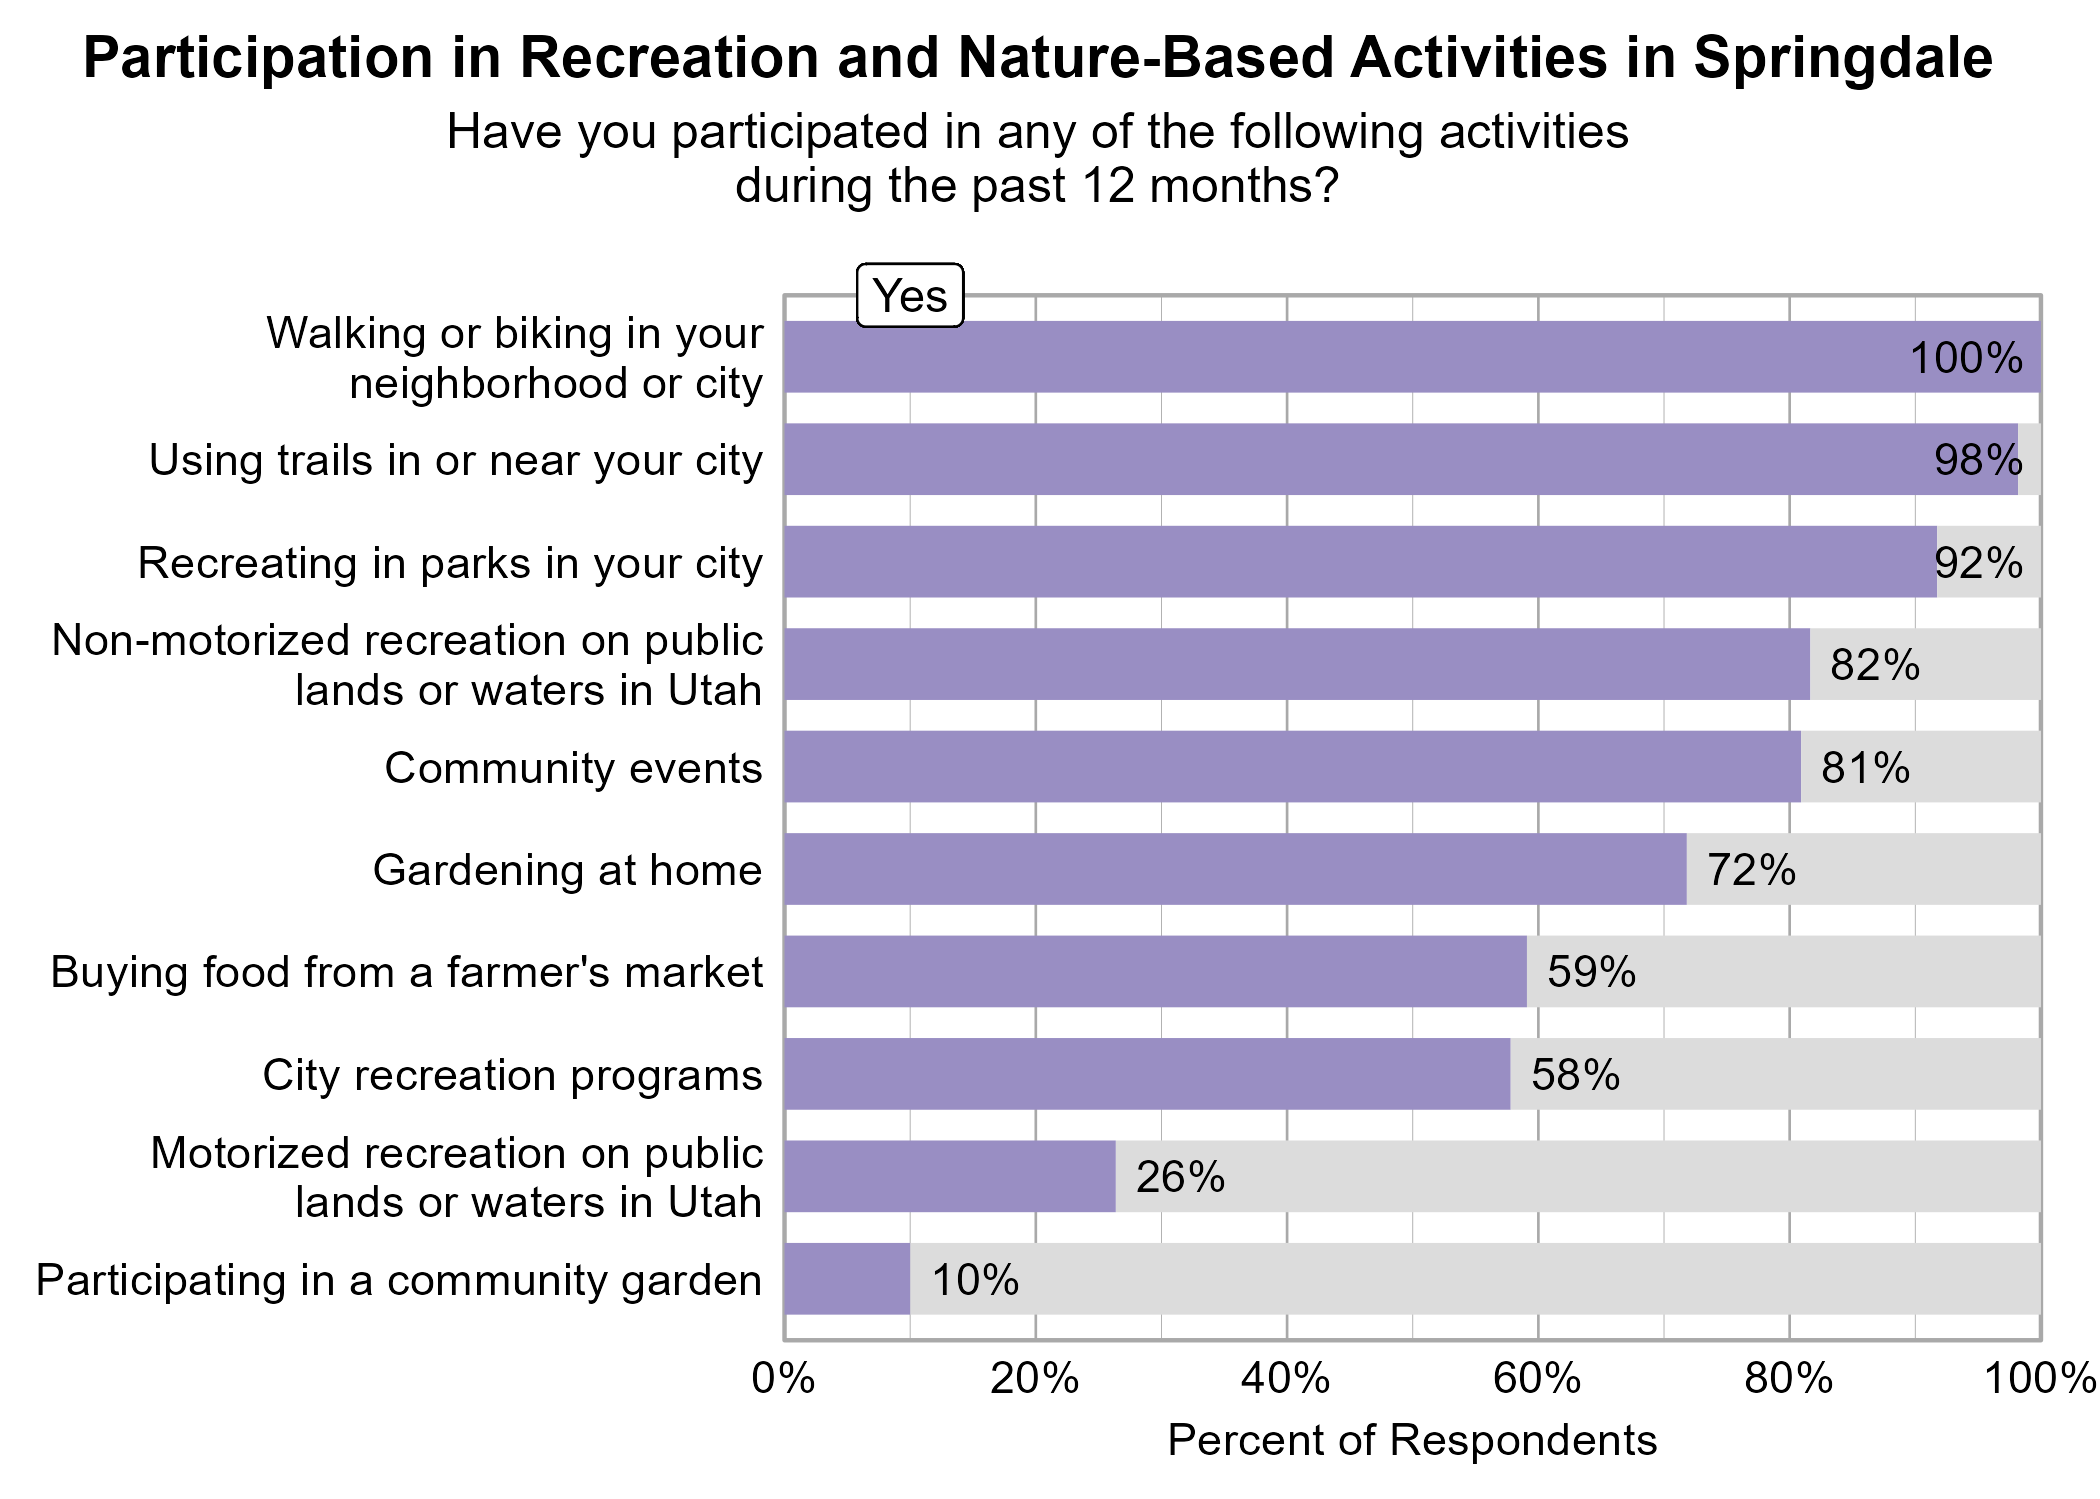
Respondents were asked to indicate whether or not they participated in various activities in the last 12 months. The most popular activities were walking or biking in your neighborhood or city (100%), using trails in or near your city (98%), and recreating in parks in your city (92%).

Bar Graph. Title: Participation in Recreation and Nature-Based Activities in Springdale. Subtitle: Have you participated in any of the following activities during the past 12 months? Data — 100% of respondents indicated yes to Walking or biking in your neighborhood or city; 98% of respondents indicated yes to Using trails in or near your city; 92% of respondents indicated yes to Recreating in parks in your city; 82% of respondents indicated yes to Non-motorized recreation on public lands or waters in Utah; 81% of respondents indicated yes to Community events; 72% of respondents indicated yes to Gardening at home; 59% of respondents indicated yes to Buying food from a farmer's market; 58% of respondents indicated yes to City recreation programs; 26% of respondents indicated yes to Motorized recreation on public lands or waters in Utah; 10% of respondents indicated yes to Participating in a community garden

None of the recreation activities above were significantly related to higher ratings of personal wellbeing or community wellbeing.

Participating in city recreation programs was significantly related to higher ratings of community connection.

Perspectives on Population Growth and Economic Development

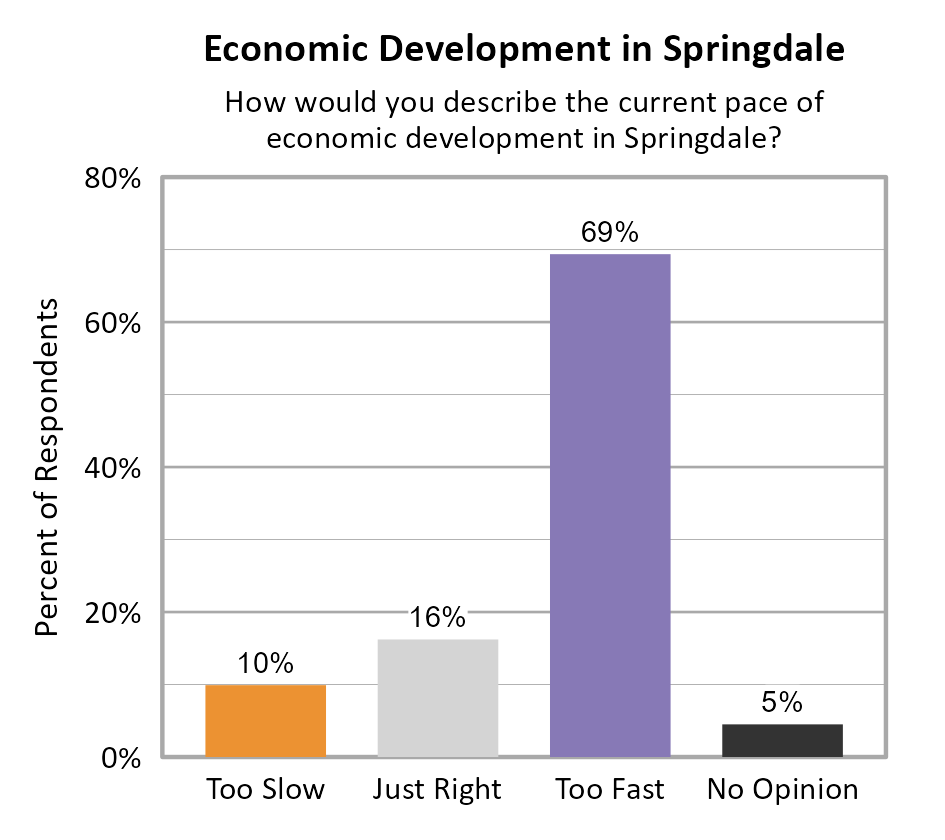
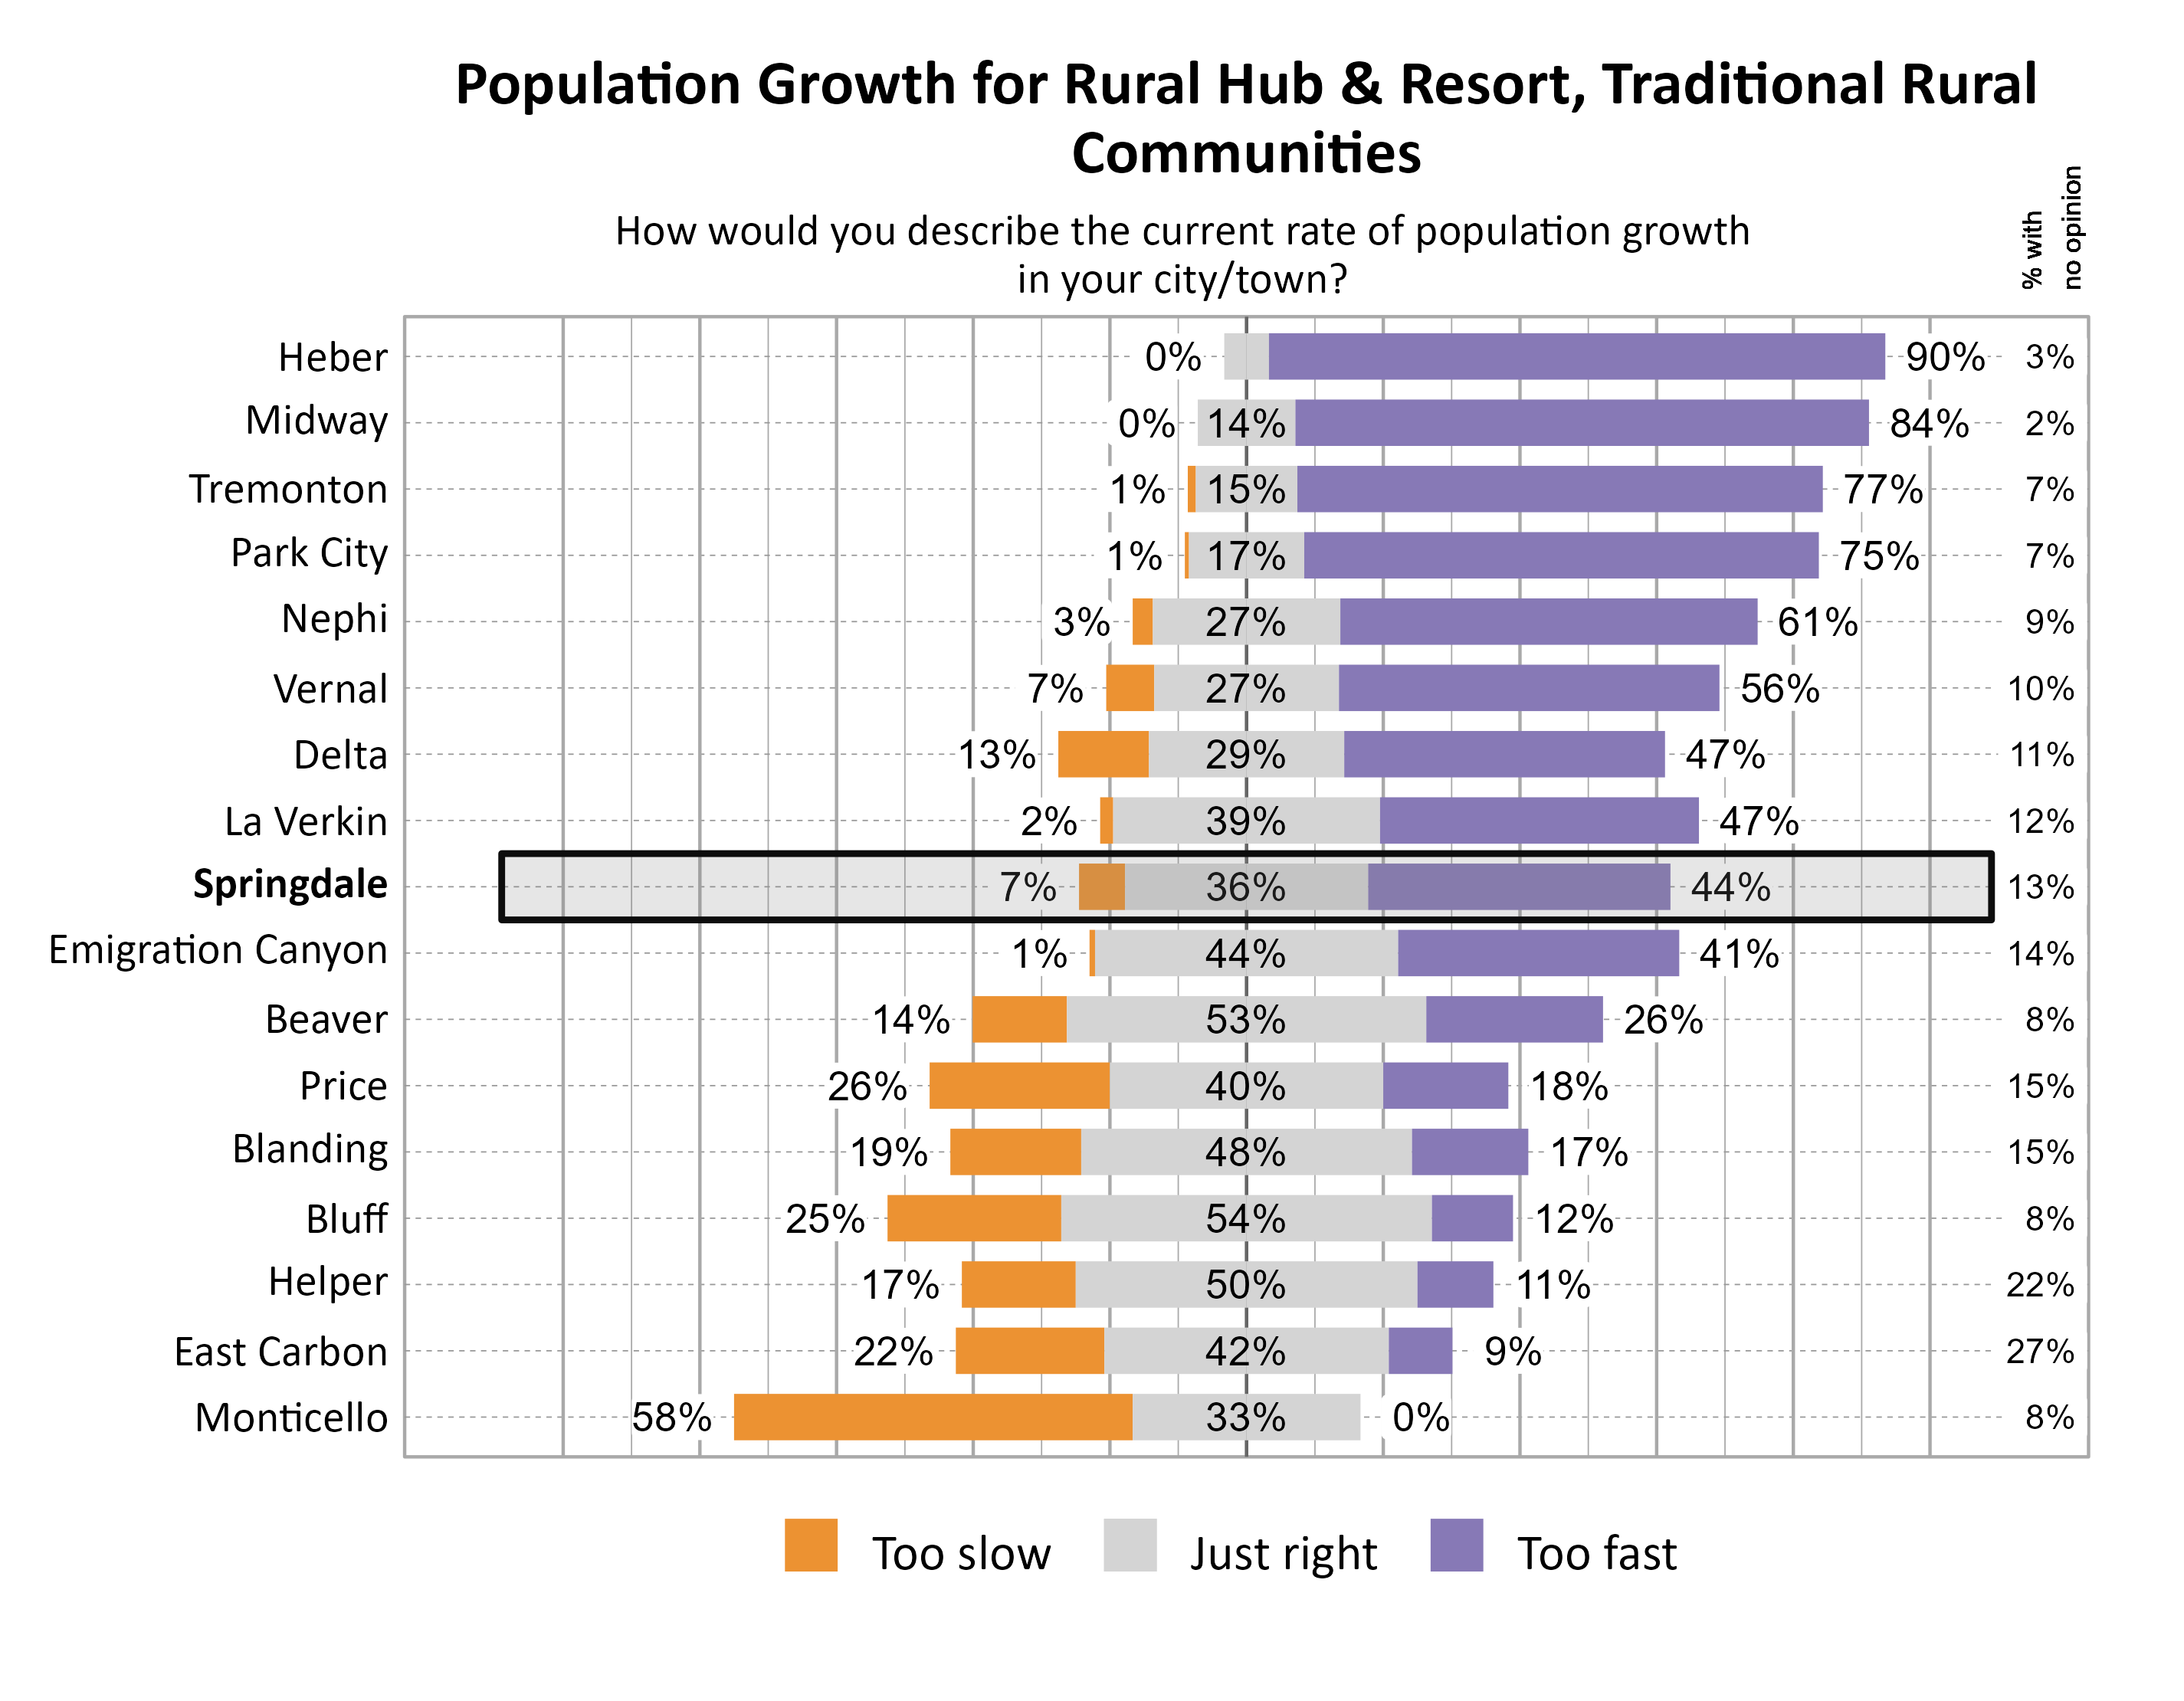
Respondents in Springdale were split between opinions that population growth was too fast (44%) and just right (36%). For the pace of economic development, the majority of respondents indicated that it was too fast (69%).

Bar Chart. Title: Population Growth in Springdale. Subtitle: How would you describe the current rate of population growth in Springdale? Data — Too Slow: 7% of respondents; Just Right: 36% of respondents; Too Fast: 44% of respondents; No Opinion: 13% of respondents

Bar Chart. Title: Economic Development in Springdale. Subtitle: How would you describe the current pace of economic development in Springdale? Data — Too Slow: 10% of respondents; Just Right: 16% of respondents; Too Fast: 69% of respondents; No Opinion: 5% of respondents

The graphs below show perceptions of population growth and economic development for Springdale compared to other participating cities and towns in the Rural cluster.

Likert Graph. Title: Population Growth for Rural Hub & Resort, Traditional Rural Communities. Subtitle: How would you describe the current rate of population growth in your city/town? Data — City: Heber  0% of respondents indicated that it was too slow,  7% indicated that it was just right, 90% indicated that it was too fast, and  3% had no opinion; City: Midway  0% of respondents indicated that it was too slow, 14% indicated that it was just right, 84% indicated that it was too fast, and  2% had no opinion; City: Tremonton  1% of respondents indicated that it was too slow, 15% indicated that it was just right, 77% indicated that it was too fast, and  7% had no opinion; City: Park City  1% of respondents indicated that it was too slow, 17% indicated that it was just right, 75% indicated that it was too fast, and  7% had no opinion; City: Nephi  3% of respondents indicated that it was too slow, 27% indicated that it was just right, 61% indicated that it was too fast, and  9% had no opinion; City: Vernal  7% of respondents indicated that it was too slow, 27% indicated that it was just right, 56% indicated that it was too fast, and 10% had no opinion; City: Delta 13% of respondents indicated that it was too slow, 29% indicated that it was just right, 47% indicated that it was too fast, and 11% had no opinion; City: La Verkin  2% of respondents indicated that it was too slow, 39% indicated that it was just right, 47% indicated that it was too fast, and 12% had no opinion; City: Springdale  7% of respondents indicated that it was too slow, 36% indicated that it was just right, 44% indicated that it was too fast, and 13% had no opinion; City: Emigration Canyon  1% of respondents indicated that it was too slow, 44% indicated that it was just right, 41% indicated that it was too fast, and 14% had no opinion; City: Beaver 14% of respondents indicated that it was too slow, 53% indicated that it was just right, 26% indicated that it was too fast, and  8% had no opinion; City: Price 26% of respondents indicated that it was too slow, 40% indicated that it was just right, 18% indicated that it was too fast, and 15% had no opinion; City: Blanding 19% of respondents indicated that it was too slow, 48% indicated that it was just right, 17% indicated that it was too fast, and 15% had no opinion; City: Bluff 25% of respondents indicated that it was too slow, 54% indicated that it was just right, 12% indicated that it was too fast, and  8% had no opinion; City: Helper 17% of respondents indicated that it was too slow, 50% indicated that it was just right, 11% indicated that it was too fast, and 22% had no opinion; City: East Carbon 22% of respondents indicated that it was too slow, 42% indicated that it was just right,  9% indicated that it was too fast, and 27% had no opinion; City: Monticello 58% of respondents indicated that it was too slow, 33% indicated that it was just right,  0% indicated that it was too fast, and  8% had no opinion

Likert Graph. Title: Economic Development for Rural Hub & Resort, Traditional Rural Communities. Subtitle: How would you describe the current pace of economic development in your city/town? Data — City: Springdale 10% of respondents indicated that it was too slow, 16% indicated that it was just right, 69% indicated that it was too fast, and  5% had no opinion; City: Park City 13% of respondents indicated that it was too slow, 27% indicated that it was just right, 49% indicated that it was too fast, and 11% had no opinion; City: Heber 22% of respondents indicated that it was too slow, 20% indicated that it was just right, 49% indicated that it was too fast, and 10% had no opinion; City: Midway 12% of respondents indicated that it was too slow, 41% indicated that it was just right, 35% indicated that it was too fast, and 11% had no opinion; City: La Verkin 28% of respondents indicated that it was too slow, 33% indicated that it was just right, 28% indicated that it was too fast, and 11% had no opinion; City: Tremonton 51% of respondents indicated that it was too slow, 16% indicated that it was just right, 24% indicated that it was too fast, and 10% had no opinion; City: Nephi 35% of respondents indicated that it was too slow, 36% indicated that it was just right, 19% indicated that it was too fast, and 11% had no opinion; City: Delta 52% of respondents indicated that it was too slow, 28% indicated that it was just right, 16% indicated that it was too fast, and  5% had no opinion; City: Vernal 48% of respondents indicated that it was too slow, 28% indicated that it was just right, 15% indicated that it was too fast, and  9% had no opinion; City: Emigration Canyon  8% of respondents indicated that it was too slow, 56% indicated that it was just right, 15% indicated that it was too fast, and 22% had no opinion; City: Helper 45% of respondents indicated that it was too slow, 40% indicated that it was just right, 10% indicated that it was too fast, and  5% had no opinion; City: Bluff 37% of respondents indicated that it was too slow, 46% indicated that it was just right, 10% indicated that it was too fast, and  8% had no opinion; City: Beaver 54% of respondents indicated that it was too slow, 33% indicated that it was just right,  7% indicated that it was too fast, and  6% had no opinion; City: Price 76% of respondents indicated that it was too slow, 12% indicated that it was just right,  3% indicated that it was too fast, and  9% had no opinion; City: Blanding 61% of respondents indicated that it was too slow, 24% indicated that it was just right,  3% indicated that it was too fast, and 12% had no opinion; City: East Carbon 68% of respondents indicated that it was too slow, 19% indicated that it was just right,  2% indicated that it was too fast, and 11% had no opinion; City: Monticello 76% of respondents indicated that it was too slow, 12% indicated that it was just right,  0% indicated that it was too fast, and 12% had no opinion

The graph below illustrates how many respondents perceived the pace of economic development as too slow, just right, too fast, or had no opinion, with additional breakdowns for the number of respondents who provided comments.

Sankey Graph. Title: Perceptions about the Pace of Economic Development in Springdale. Subtitle: How would you describe the current pace of economic development in Springdale? (In Number of Respondents). Data — Total Respondents: 111; No opinion: 5; Too fast: 77; Just right: 18; Too slow: 11; 'Too fast' without comment: 6; 'Too fast' with comment: 71; 'Too slow' without comment: 2; 'Too slow' with comment: 9

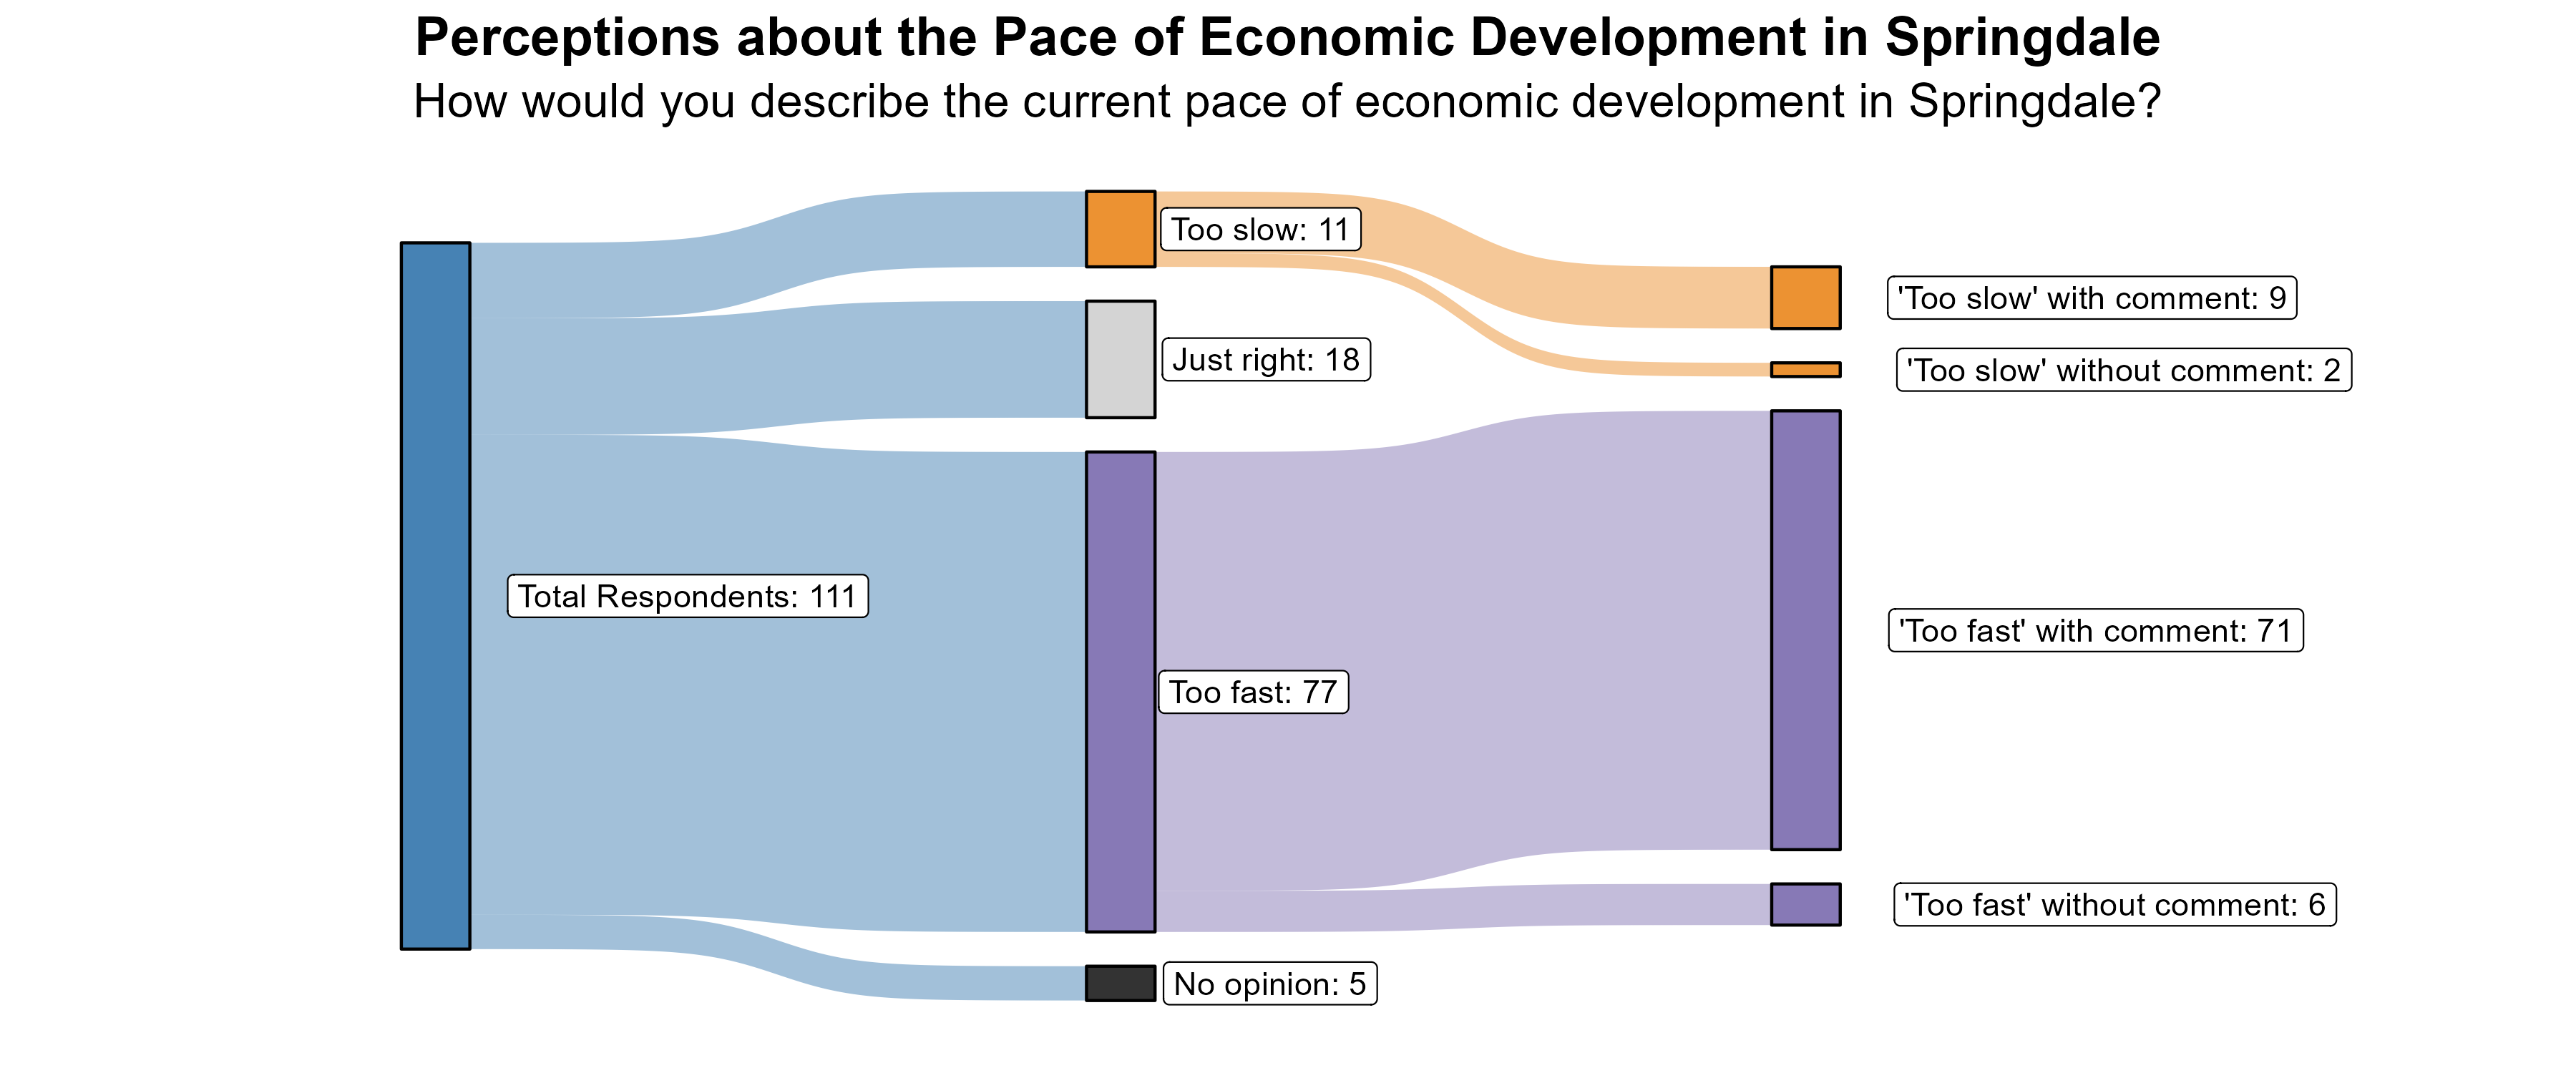
The 10% of respondents who rated the pace of economic growth as “too slow” were further asked what aspects of the local economy they would like to see more of in Springdale. Most comments focused on wanting more restaurants and shopping options in Springdale. Respondents also mentioned a desire to revive the town in general – address empty buildings, add trails, improve infrastructure, and increase housing options.

Additionally, the 69% of respondents who rated the pace of economic growth as “too fast” were further asked what aspects of the local economy they feel are growing too quickly in Springdale. Many respondents commented on the lack of diverse businesses and a number of them feel that there are too many e-bike rental shops. On a similar vein, many people mentioned that growth is targeted to benefit tourists more than locals, in both retail and in housing. The most common complaint was that there are too many nightly rentals and transient lodging places but not enough affordable housing options for those who live in Springdale.

Transportation in Springdale

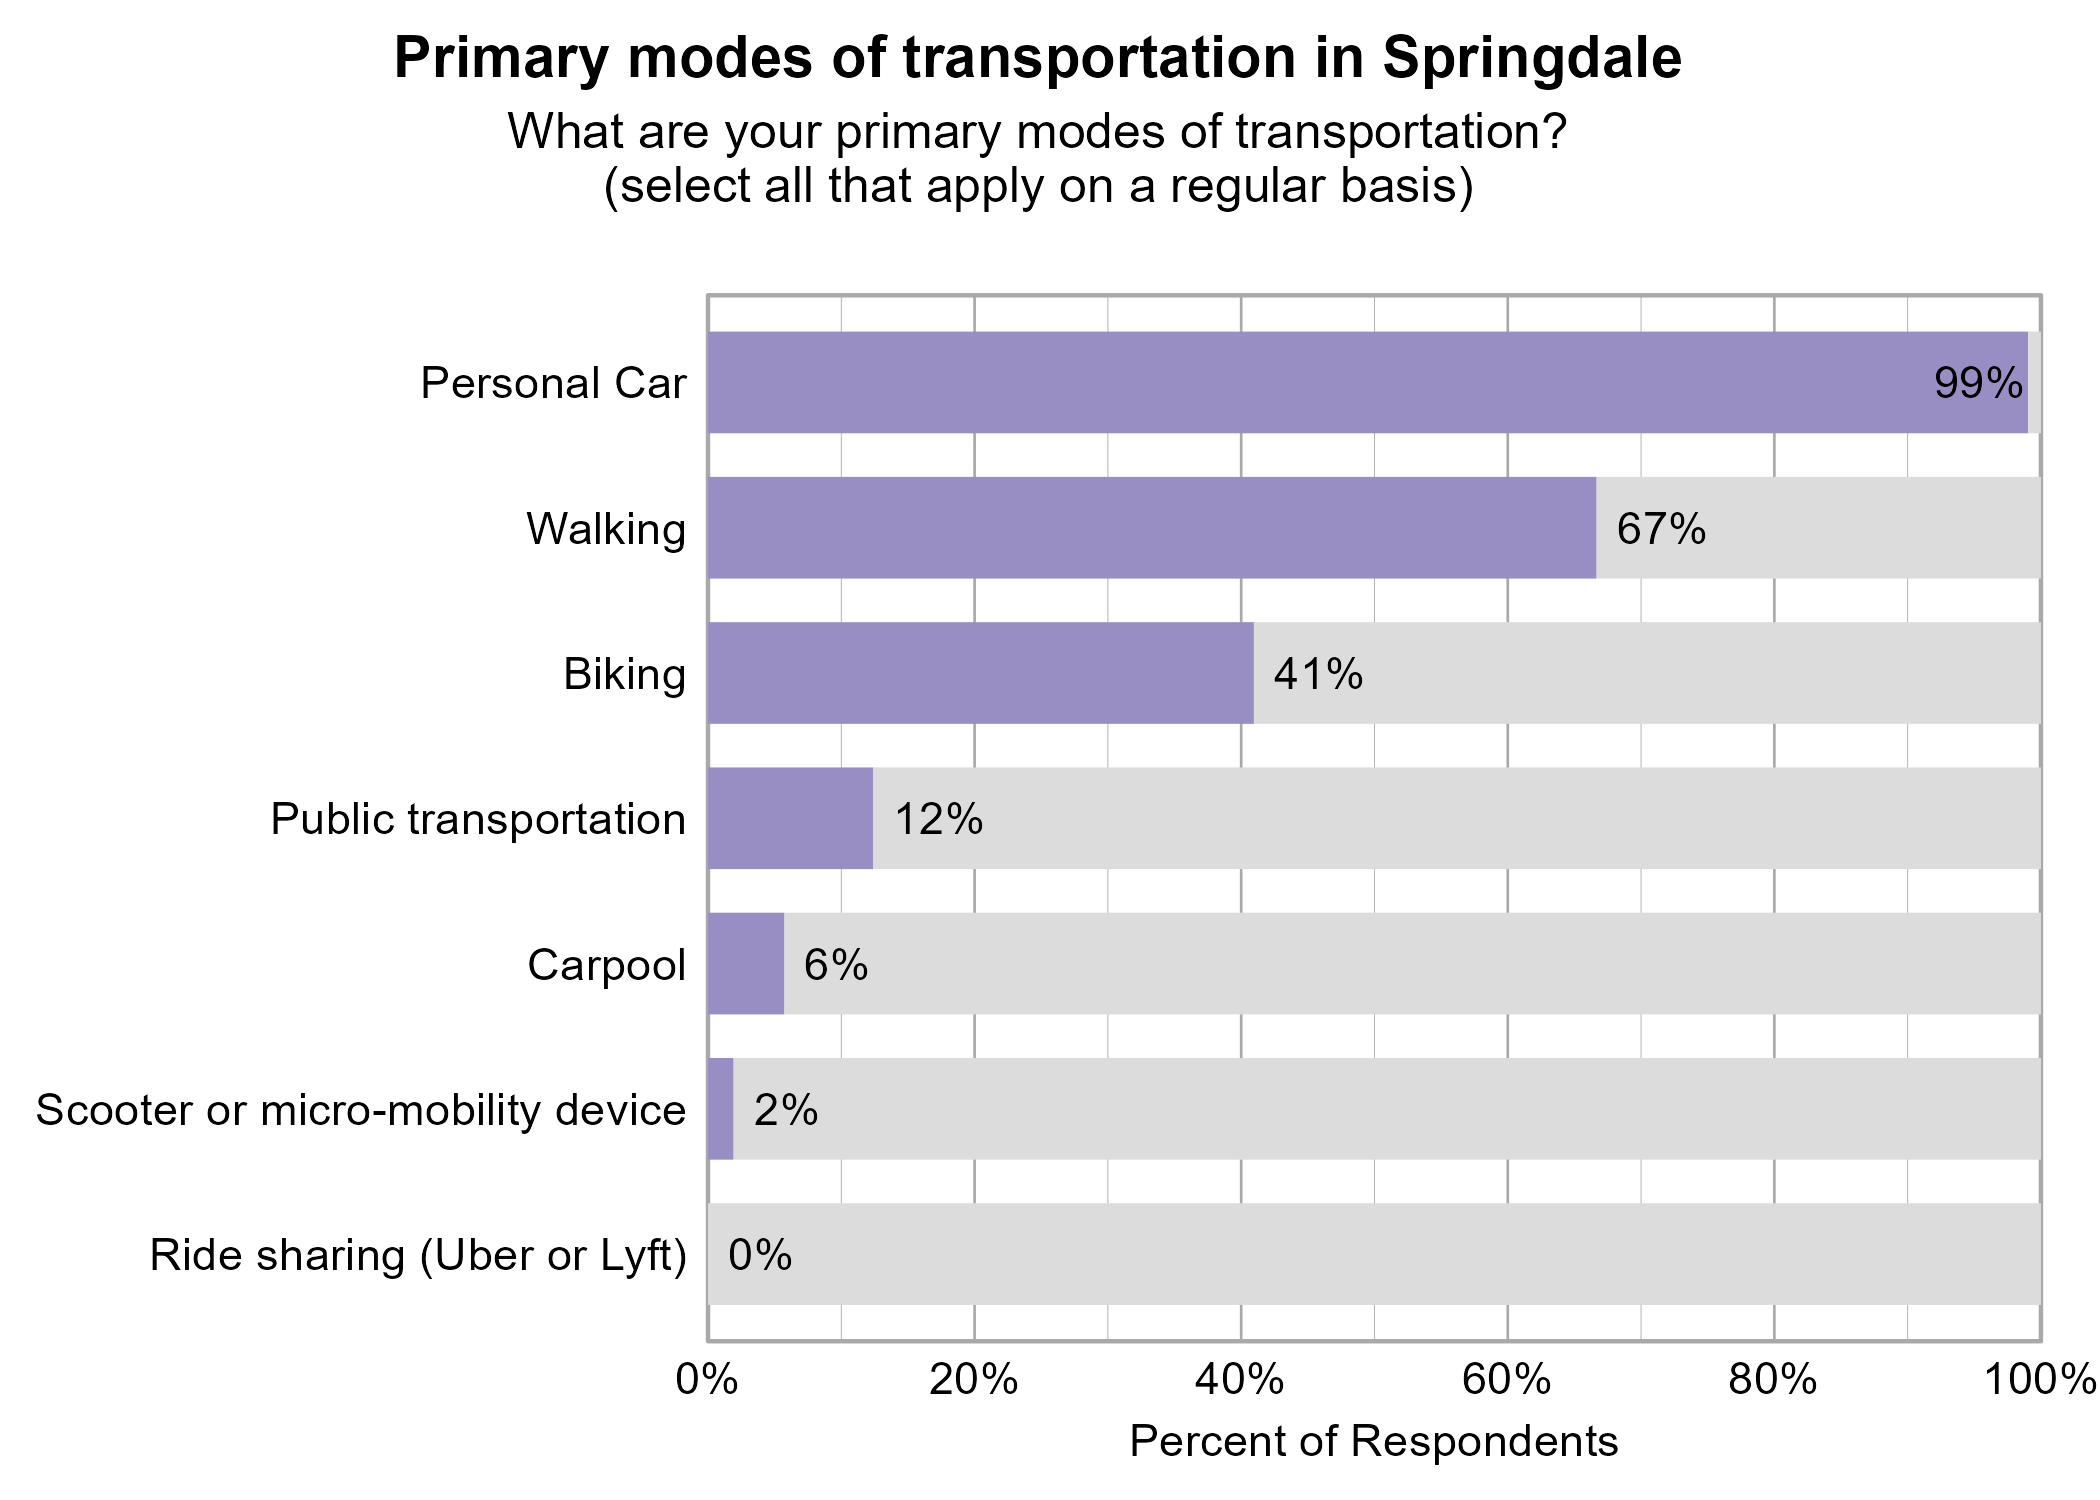
Respondents were asked to indicate all of their primary modes of transportation on a regular basis in Springdale. The most popular modes of transportation were personal car (99%) and walking (67%).

Bar Graph. Title: Primary modes of transportation in Springdale. Subtitle: What are your primary modes of transportation? (select all that apply on a regular basis) Data — 99% of respondents indicated yes to Personal Car; 67% of respondents indicated yes to Walking; 41% of respondents indicated yes to Biking; 12% of respondents indicated yes to Public transportation; 6% of respondents indicated yes to Carpool; 2% of respondents indicated yes to Scooter or micro-mobility device; 0% of respondents indicated yes to Ride sharing (Uber or Lyft)

Respondents were asked to indicate the most common barriers to transportation in Springdale. The most problematic barriers were Travel time (50%) and Cost (27%).

Likert Graph. Title: Barriers to Personal Travel in Springdale. Subtitle: Are any of the following a barrier to you personal travel? Data — Category: Travel time - 50% of respondents indicated it was not a barrier or seldom a barrier, while 50% of respondents indicated it was sometimes, often, or always a barrier; Category: Cost - 73% of respondents indicated it was not a barrier or seldom a barrier, while 27% of respondents indicated it was sometimes, often, or always a barrier; Category: Lack of routes - 75% of respondents indicated it was not a barrier or seldom a barrier, while 25% of respondents indicated it was sometimes, often, or always a barrier; Category: Safety - 83% of respondents indicated it was not a barrier or seldom a barrier, while 17% of respondents indicated it was sometimes, often, or always a barrier; Category: Disability - 88% of respondents indicated it was not a barrier or seldom a barrier, while 12% of respondents indicated it was sometimes, often, or always a barrier; Category: Lack of transport - 88% of respondents indicated it was not a barrier or seldom a barrier, while 12% of respondents indicated it was sometimes, often, or always a barrier; Category: Knowledge - 95% of respondents indicated it was not a barrier or seldom a barrier, while  5% of respondents indicated it was sometimes, often, or always a barrier; Category: Language - 99% of respondents indicated it was not a barrier or seldom a barrier, while  1% of respondents indicated it was sometimes, often, or always a barrier

Respondents were asked to indicate the importance of a set of possible transportation developments in Springdale. The most important development to respondents were Improving walkability (56%), Enhancing safety (55%), and More trails (55%).

Likert Graph. Title: Possible Transportation Developments in Springdale. Subtitle: On a scale of 1 - Not at all important to 5 - Very important, please rate the importance of the following developments to you. Data — Category: Improving walkability - 44% of respondents indicated it 1, 2, or 3, while 56% of respondents rated it a 4 or 5.; Category: Enhancing safety - 45% of respondents indicated it 1, 2, or 3, while 55% of respondents rated it a 4 or 5.; Category: More trails - 45% of respondents indicated it 1, 2, or 3, while 55% of respondents rated it a 4 or 5.; Category: Connecting communities - 62% of respondents indicated it 1, 2, or 3, while 38% of respondents rated it a 4 or 5.; Category: Improving public transit - 64% of respondents indicated it 1, 2, or 3, while 36% of respondents rated it a 4 or 5.; Category: Improving road surfaces - 70% of respondents indicated it 1, 2, or 3, while 30% of respondents rated it a 4 or 5.; Category: Adding road capacity - 78% of respondents indicated it 1, 2, or 3, while 22% of respondents rated it a 4 or 5.

Respondents were asked to indicate how frequently various activities take them out of Springdale to another city or town. The most commonly indicated reasons for traveling to another city or town at least sometimes or once a month were Groceries (99%), Friends and Family (65%), Health/Medical Care (63%), and Eating Out (63%).

Likert Graph. Title: Frequency of Springdale Residents Traveling to Other Cities for Various Activities. Subtitle: How frequently do each of these activities take you out of Springdale to another city or town? Data — Category: Groceries -  1% of respondents indicated it was never or rarely and 99% of respondents indicated it was sometimes, regularly, often; Category: Friends and Family - 35% of respondents indicated it was never or rarely and 65% of respondents indicated it was sometimes, regularly, often; Category: Eating Out - 37% of respondents indicated it was never or rarely and 63% of respondents indicated it was sometimes, regularly, often; Category: Health/Medical Care - 37% of respondents indicated it was never or rarely and 63% of respondents indicated it was sometimes, regularly, often; Category: Other Services - 42% of respondents indicated it was never or rarely and 58% of respondents indicated it was sometimes, regularly, often; Category: Recreation/Sports - 45% of respondents indicated it was never or rarely and 55% of respondents indicated it was sometimes, regularly, often; Category: Work - 75% of respondents indicated it was never or rarely and 25% of respondents indicated it was sometimes, regularly, often; Category: School/Education - 83% of respondents indicated it was never or rarely and 17% of respondents indicated it was sometimes, regularly, often; Category: Religion - 89% of respondents indicated it was never or rarely and 11% of respondents indicated it was sometimes, regularly, often

Concerns in Springdale

Survey respondents indicated the degree to which a number of possible local issues were a concern as they look to the future of Springdale. Traffic (88%), Water Supply (88%), and Water Quality (86%) were the top concerns.

Likert Graph. Title: Concerns in Springdale. Subtitle: As you look to the future of Springdale, how much of a concern are the following issues? Data — Category: Traffic - 12% of respondents indicated not a concern at all or slight concern while 88% of respondents indicated a moderate or major concern; Category: Water Supply - 12% of respondents indicated not a concern at all or slight concern while 88% of respondents indicated a moderate or major concern; Category: Water Quality - 14% of respondents indicated not a concern at all or slight concern while 86% of respondents indicated a moderate or major concern; Category: Open Space/Green Space - 21% of respondents indicated not a concern at all or slight concern while 79% of respondents indicated a moderate or major concern; Category: Climate Change - 30% of respondents indicated not a concern at all or slight concern while 70% of respondents indicated a moderate or major concern; Category: Trails & Paths - 31% of respondents indicated not a concern at all or slight concern while 69% of respondents indicated a moderate or major concern; Category: Air Quality - 32% of respondents indicated not a concern at all or slight concern while 68% of respondents indicated a moderate or major concern; Category: Public Safety - 35% of respondents indicated not a concern at all or slight concern while 65% of respondents indicated a moderate or major concern; Category: Access to Health Care - 36% of respondents indicated not a concern at all or slight concern while 64% of respondents indicated a moderate or major concern; Category: Access to Healthy/Quality Food - 39% of respondents indicated not a concern at all or slight concern while 61% of respondents indicated a moderate or major concern; Category: Recreation Opportunities - 40% of respondents indicated not a concern at all or slight concern while 60% of respondents indicated a moderate or major concern; Category: Opportunities for Youth - 44% of respondents indicated not a concern at all or slight concern while 56% of respondents indicated a moderate or major concern; Category: Affordable Housing - 47% of respondents indicated not a concern at all or slight concern while 53% of respondents indicated a moderate or major concern; Category: Social and Emotional Support - 53% of respondents indicated not a concern at all or slight concern while 47% of respondents indicated a moderate or major concern; Category: Shopping Opportunities - 55% of respondents indicated not a concern at all or slight concern while 45% of respondents indicated a moderate or major concern; Category: Access to Mental Health Care - 58% of respondents indicated not a concern at all or slight concern while 42% of respondents indicated a moderate or major concern; Category: Suicide - 58% of respondents indicated not a concern at all or slight concern while 42% of respondents indicated a moderate or major concern; Category: Accessible Transportation - 62% of respondents indicated not a concern at all or slight concern while 38% of respondents indicated a moderate or major concern; Category: Employment Opportunities - 63% of respondents indicated not a concern at all or slight concern while 38% of respondents indicated a moderate or major concern; Category: Homelessness - 62% of respondents indicated not a concern at all or slight concern while 38% of respondents indicated a moderate or major concern; Category: Great Salt Lake - 64% of respondents indicated not a concern at all or slight concern while 36% of respondents indicated a moderate or major concern; Category: Access to Culturally Appropriate Food - 73% of respondents indicated not a concern at all or slight concern while 27% of respondents indicated a moderate or major concern; Category: Substance Misuse - 74% of respondents indicated not a concern at all or slight concern while 26% of respondents indicated a moderate or major concern; Category: Access to Substance Use Disorder Treatment - 79% of respondents indicated not a concern at all or slight concern while 21% of respondents indicated a moderate or major concern

Open Comments

All open comments collected in the survey were shared with city leaders. General observations and themes are shared here.

What Respondents Value Most in Springdale

Survey respondents were asked to comment on what they value most about Springdale. The most common words and phrases from all city comments are included in the word cloud below. It is possible that negative or unrelated words may appear since these words have been taken out of context, and they may not indicate the respondent’s intended meaning. In Springdale, respondents indicated that they value their proximity to natural amenities and beauty above all else in their community. The social climate was also highly noted as a point of what resident’s value most and small town feel was often used to describe Springdale.

A word cloud of most common words about what respondents value most in their city

Local Environmental Quality in Springdale

The 25% of respondents who rated the Local Environmental Quality domain as 1, 2, or 3 (Poor, Fair, or Moderate) were further asked if there are specific aspects of local environmental quality that they feel are problematic. Traffic and congestion in Springdale were mentioned as well as expressed desires for city leaders to take more initiative when it comes to managing tourism and conserving wildlife and natural amenities in Springdale.

Improving Wellbeing in Springdale

Survey respondents were asked if there is anything that could be done to improve wellbeing in Springdale. Springdale residents noted growth and development impacts related to transportation and recreation and tourism as points of needed improvement. Congestion through the town was said to affect alternate modes of transportation threatening the safety of bikers and pedestrians. Comments calling for improvements surrounding recreation and tourism focused mainly on how high the levels of tourism have risen and that residents would prefer fewer tourists and better management.

Additional Comments

Respondents were also asked if they had any additional comments on wellbeing in Springdale. Growth and development and recreation and tourism were common themes related to wellbeing. Short term rentals and housing developments were mentioned as decreasing the local feel and bringing in more tourists. Comments suggested that levels of tourism have increased causing congestion in traffic with impacts on locals’ daily life.