Utah Statewide Wellbeing Survey Report
By Dr. Courtney Flint, Nicolas Holden, and Team
![]()
Contact Information
Dr. Courtney Flint
courtney.flint@usu.edu
435-797-8635
Summary
The Utah Wellbeing Survey project is designed to assess the wellbeing and local perspectives of city residents and to provide information to city leaders to inform their general planning processes. Over the years, we have found that each city and town has a unique experience and the Utah Wellbeing Survey allows for focused analysis at the community level. Survey questions include rating and importance of twelve different domains or categories of wellbeing, participation in recreation and nature-related activities, perspectives on local population growth and economic development, transportation perspectives, concerns for the future, and an array of demographic characteristic questions.
How was the survey conducted?
In 2024, 51 cities and towns took part in the Utah Wellbeing Survey. Most participated early in the year, with Ogden and Alpine participating later. The survey for each city and town was available online through Qualtrics for at least three weeks. Participating cities advertised the surveys in a variety of ways, including social media, newsletters, utility bills, websites, flyers, local news media, emails, apps, and other local mechanisms. All residents in the participating cities and towns age 18+ were encouraged to take the survey.
How many people responded?
A total of 16,712 completed surveys were recorded during this 2024 effort, bringing the total number of surveys completed for the Utah Wellbeing Project since 2019 up to 41,971. Response numbers for each city are listed further in the report.
Additional Information
Reports summarizing city-specific results from the survey can be found on the Utah Wellbeing Project Website. This information may help city and town leaders refine their messaging with residents on key issues, affirm existing plans, and support future planning. Findings may have practical implications for spending and providing services.
This project benefits from a partnership with the Utah League of Cities and Towns, which helps cities and towns envision ways to use the findings from the wellbeing survey to inform their general planning processes. The project also benefits from funding from the Wasatch Front Regional Council, Utah State University Extension, USU’s Institute for Land Water and Air, and the Utah Agricultural Experiment Station as well as a number of city and town governments (Alpine, Cedar Hills, Draper, Millcreek, Nephi, North Salt Lake, Ogden, Orem, Pleasant Grove, Providence, Springdale, Tremonton, West Bountiful, and West Valley City).
Survey Cities and Towns Responses
This effort builds upon previous survey efforts in 2019-2023. The map below highlights the cities participating in the survey project in 2024.

The Utah League of Cities and Towns clusters cities and towns into five different categories based on size and growth rates. We utilize these clusters in our analysis, and we have combined the Rural Hub/Resort Communities with the Traditional Rural Communities. Some cities may fit within more than one cluster. Below is each participating city with their number of survey responses for 2024 organized by the cluster used in analysis.
Cities of the 1st & 2nd Class
Layton (334)
Millcreek (291)
Ogden (780)
Orem (1361)
Sandy (955)
South Jordan (206)
West Jordan (309)
West Valley City (149)
Established/Mid-sized Cities
Alpine (399)
Bountiful (211)
Cedar City (762)
Cedar Hills (365)
Cottonwood Heights (347)
Draper (650)
Logan (757)
Midvale (68)
North Salt Lake (439)
Pleasant Grove (317)
South Ogden (142)
West Bountiful (295)
Rapid Growth Cities
Clinton (461)
Herriman (131)
Hyde Park (227)
Hyrum (306)
Ivins (336)
Lehi (322)
Mapleton (175)
Nibley (319)
Providence (214)
Saratoga Springs (403)
Spanish Fork (419)
Vineyard (162)
Wellsville (177)
West Haven (118)
Rural Hub & Resort, Traditional Rural Communities
Beaver (153)
Blanding (236)
Bluff (65)
Delta (127)
East Carbon (187)
Emigration Canyon (145)
Heber (437)
Helper (48)
La Verkin (131)
Midway (153)
Monticello (28)
Nephi (450)
Park City (205)
Price (292)
Springdale (123)
Tremonton (534)
Vernal (491)
Survey Respondent Characteristics
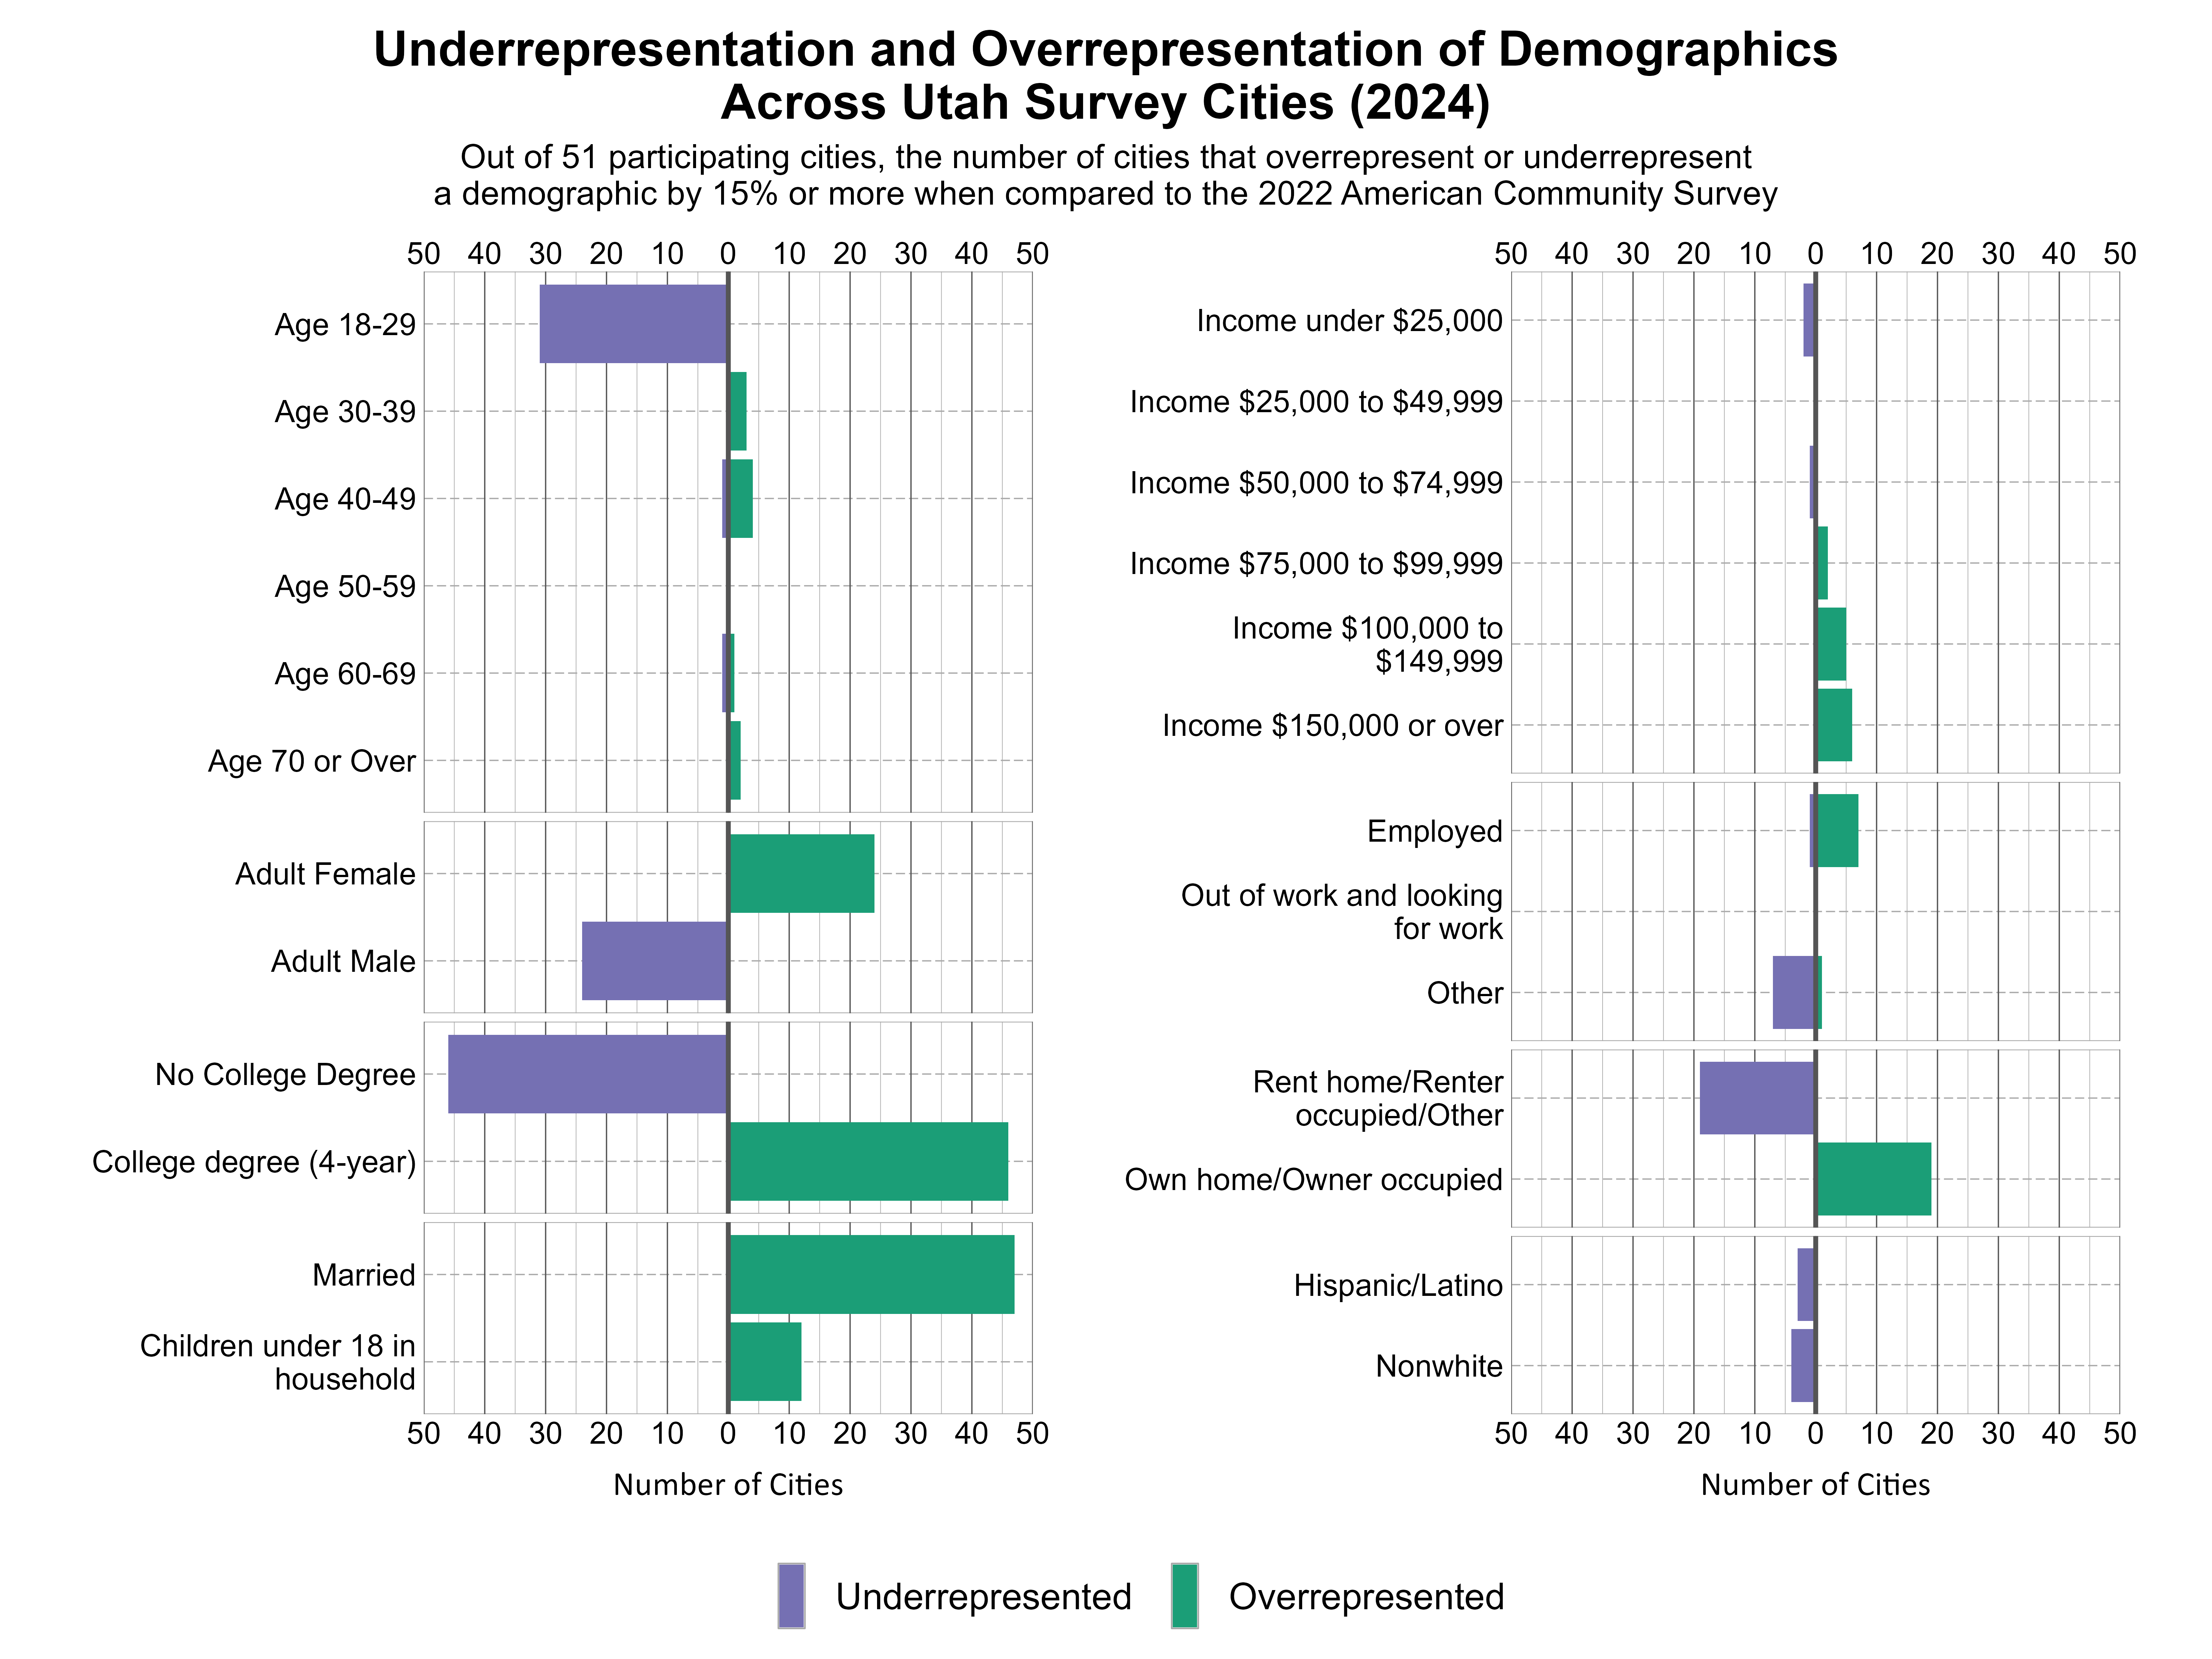
For each survey city, demographic characteristics of the survey respondents were compared with U.S. Census information from the 2018-2022 American Community Survey. In the graph below, commonly misrepresented demographics across survey cities are shown. As the graph shows, 2024 survey respondents were not fully representative of their city. Those who are ages 18-29, adult males, without a college degree, and are renters were consistently underrepresented, while those who are adult females, with a college degree, are married, have children under 18 in their household, and are owners were consistently overrepresented. There is quite strong representation across those age 30+, income groups, and employment types.
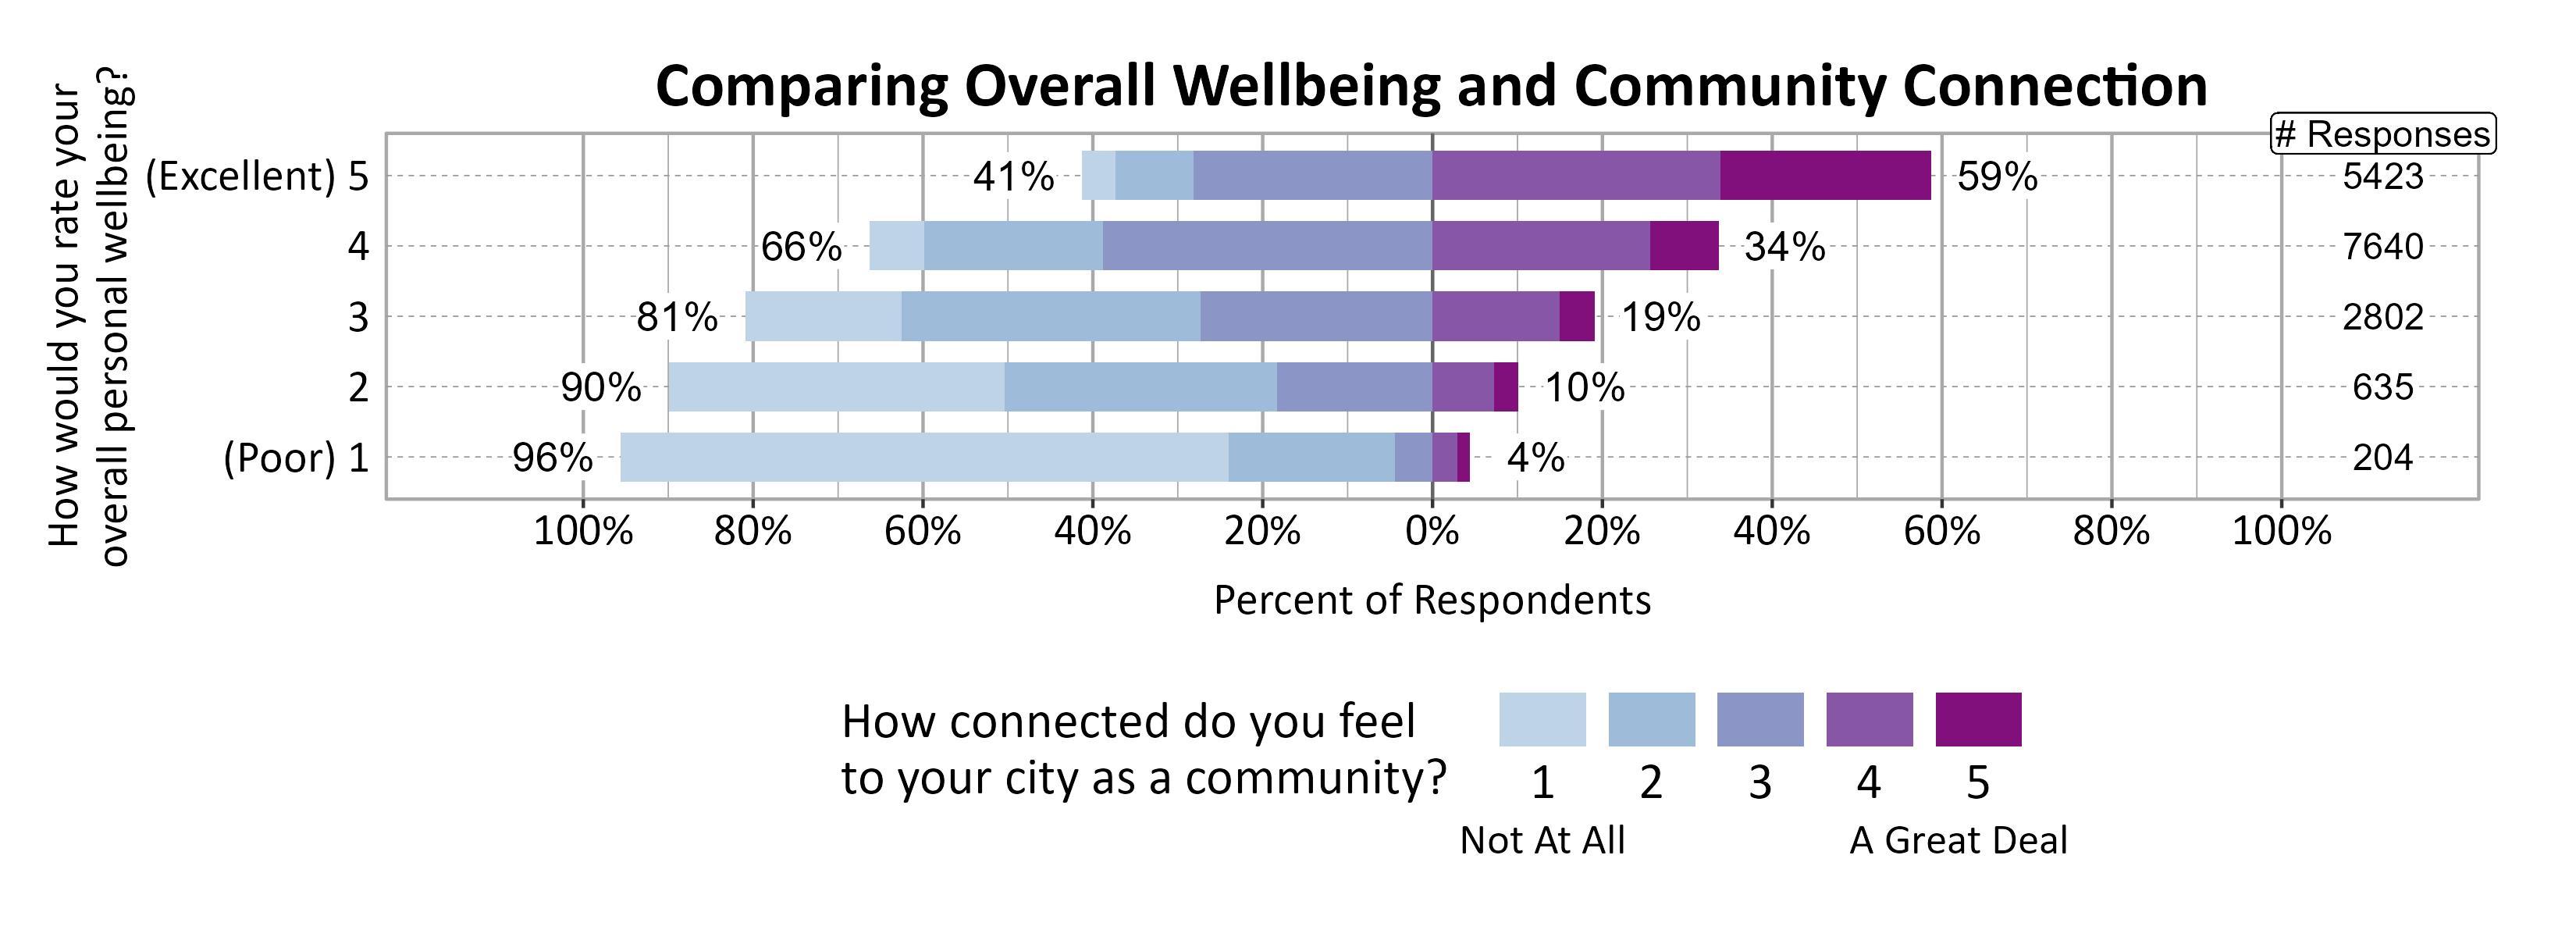
Overall Personal Wellbeing and Community Wellbeing in Cities
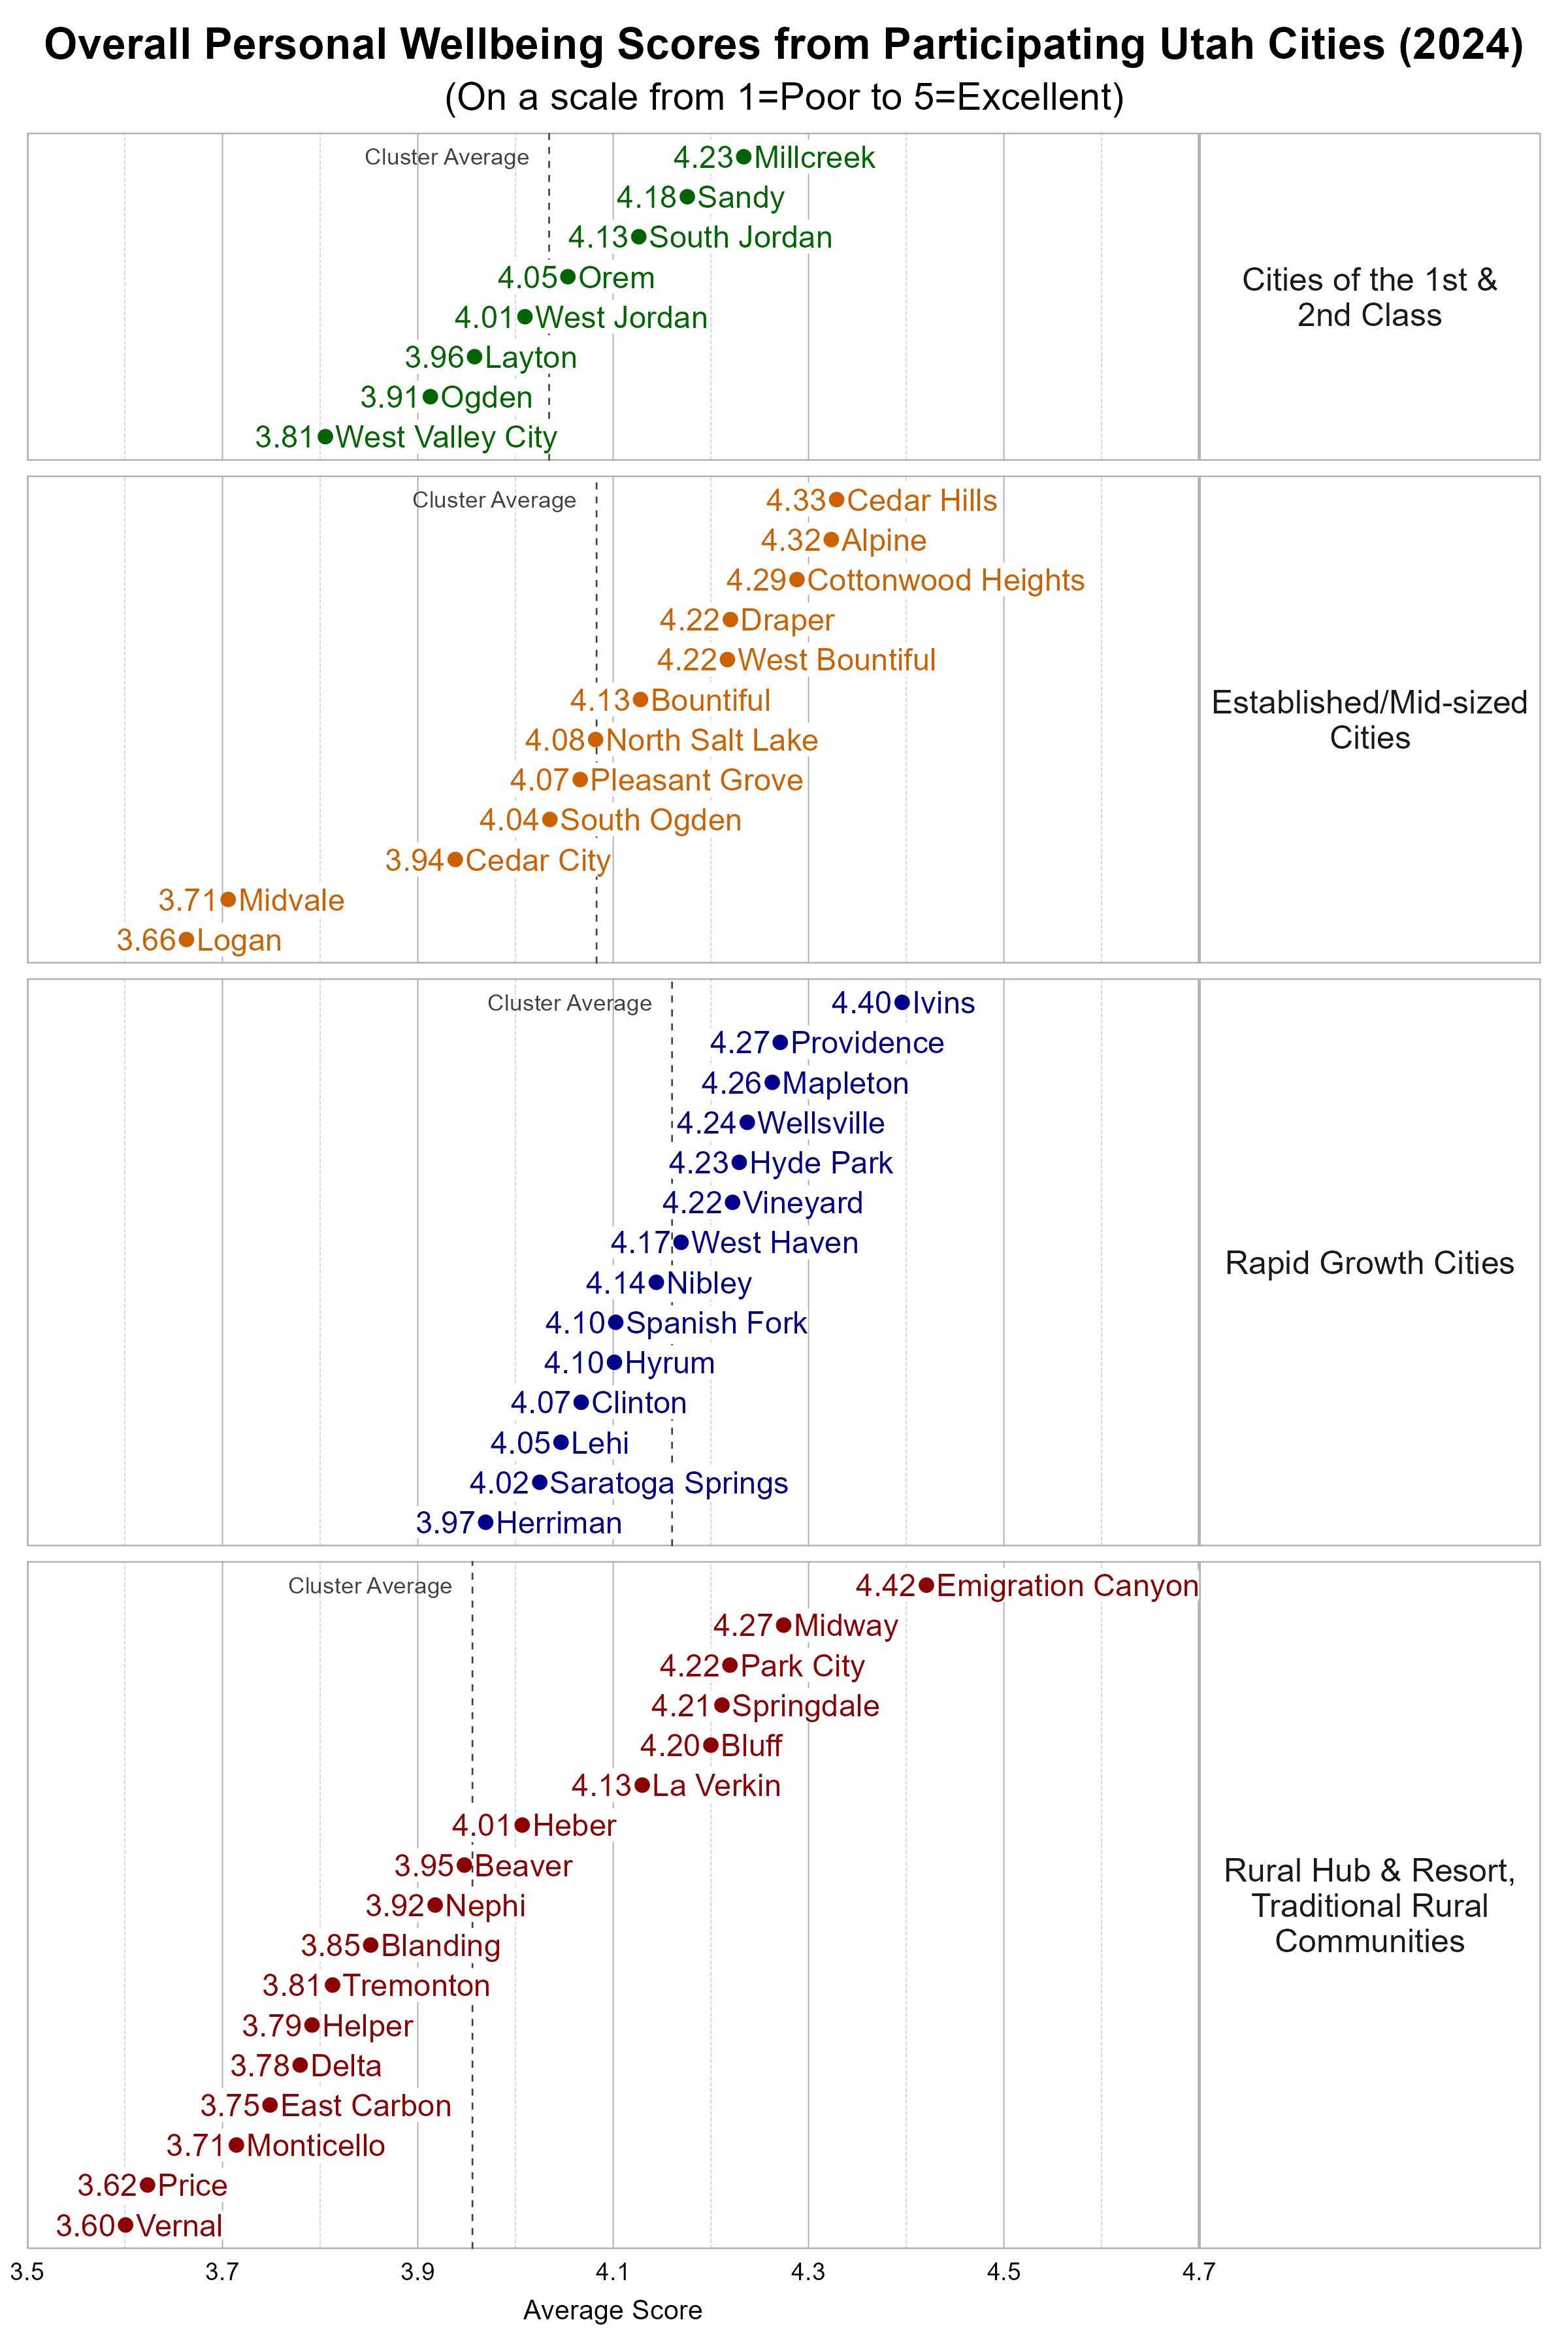
The average of the participating cities’ average overall personal wellbeing scores for all surveyed cities was 4.05 on a scale from 1 (Poor) to 5 (Excellent). The average of the participating cities’ average overall community wellbeing scores for all surveyed cities was 3.65. The figure below shows the average overall personal and community wellbeing scores for each city within their cluster type. A key finding is that overall personal wellbeing is generally quite high among respondents, but there is considerable variability within the clusters of cities and towns.

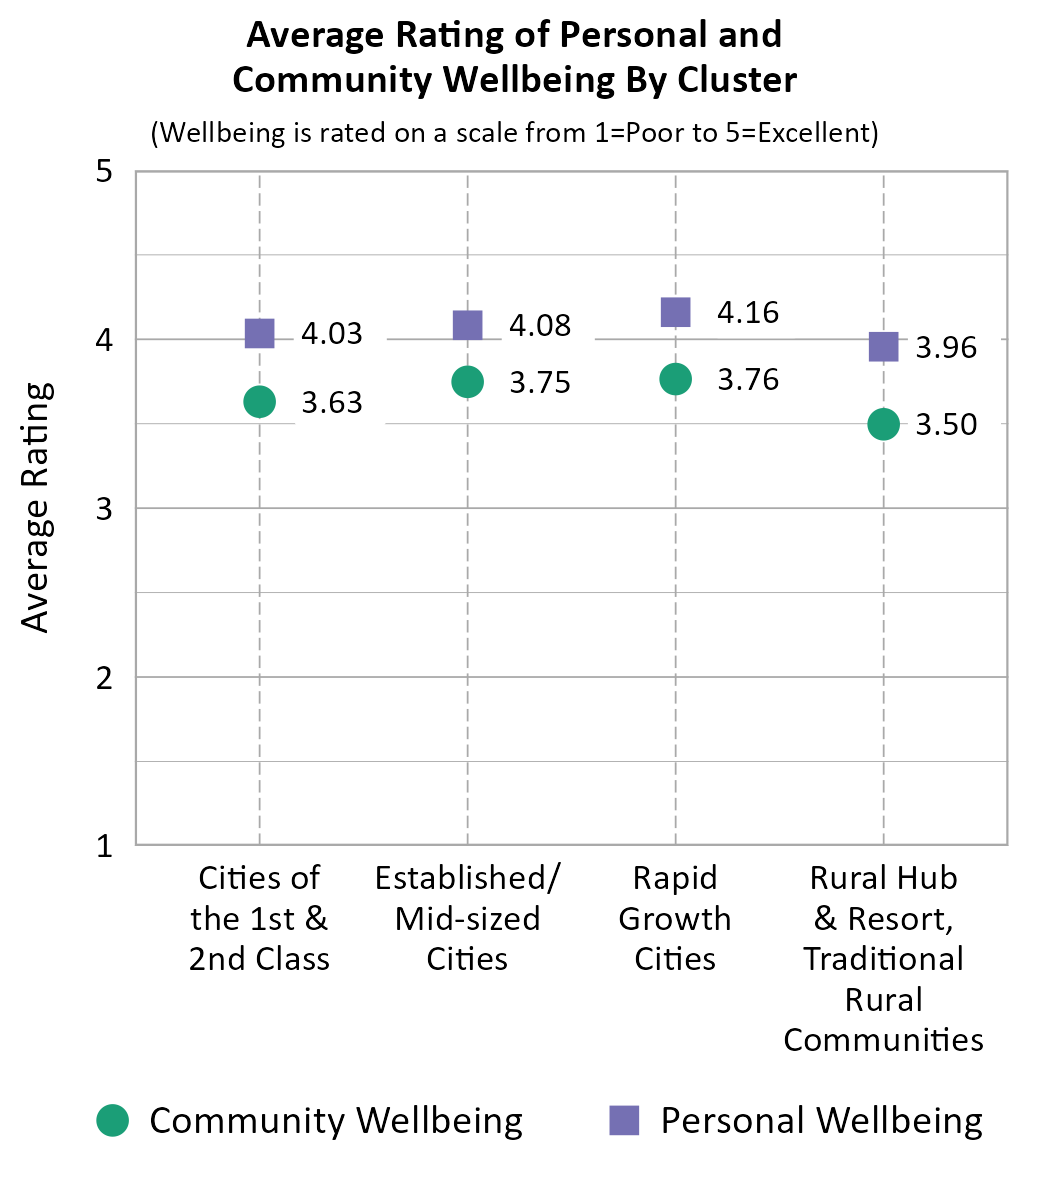
The graph below shows the average of the average overall personal and community wellbeing scores for each cluster. While the cluster average of the average overall personal and community wellbeing scores was lower for the Rural cluster, this cluster also exhibits the greatest heterogeneity of scores.
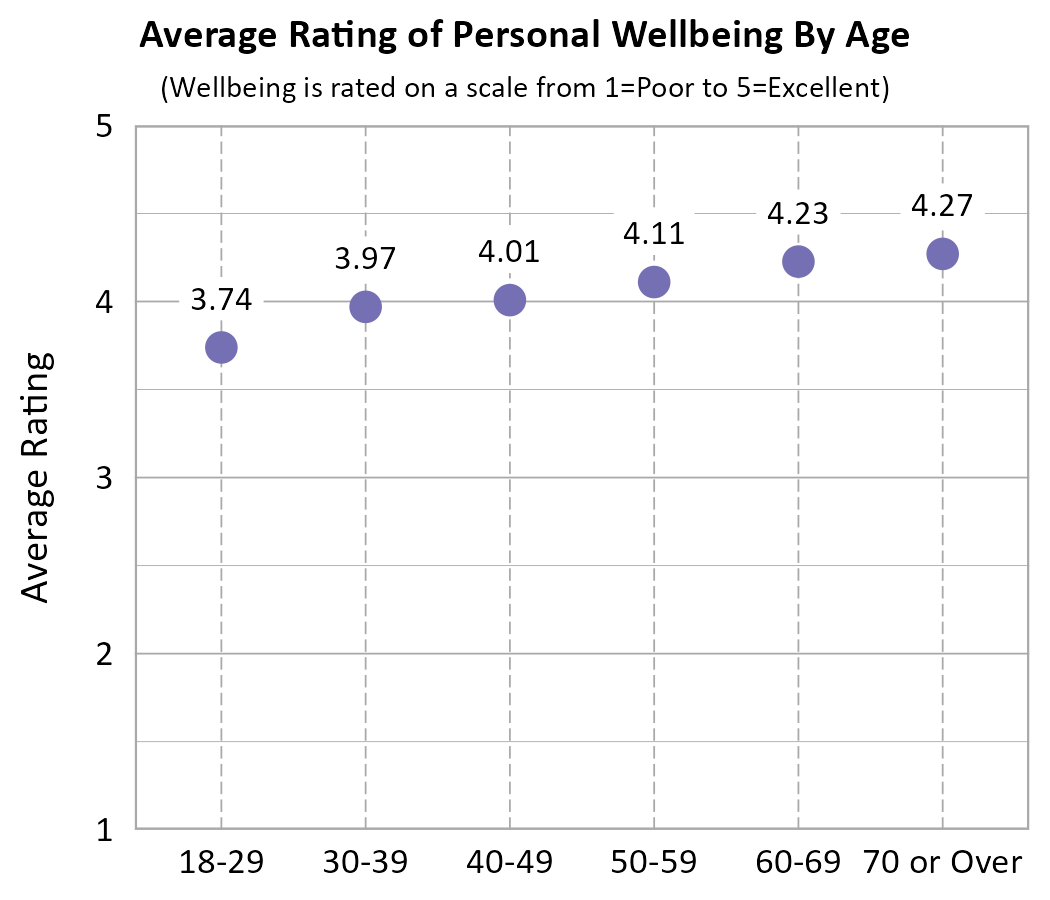
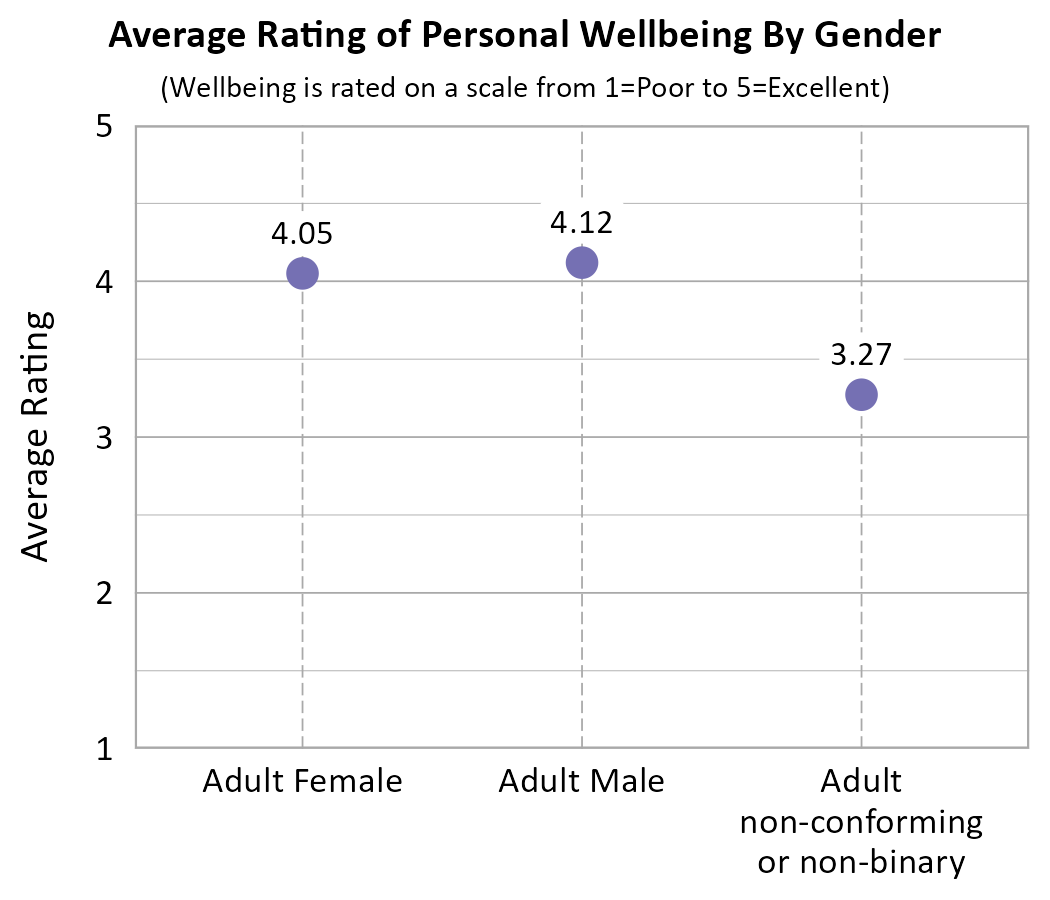
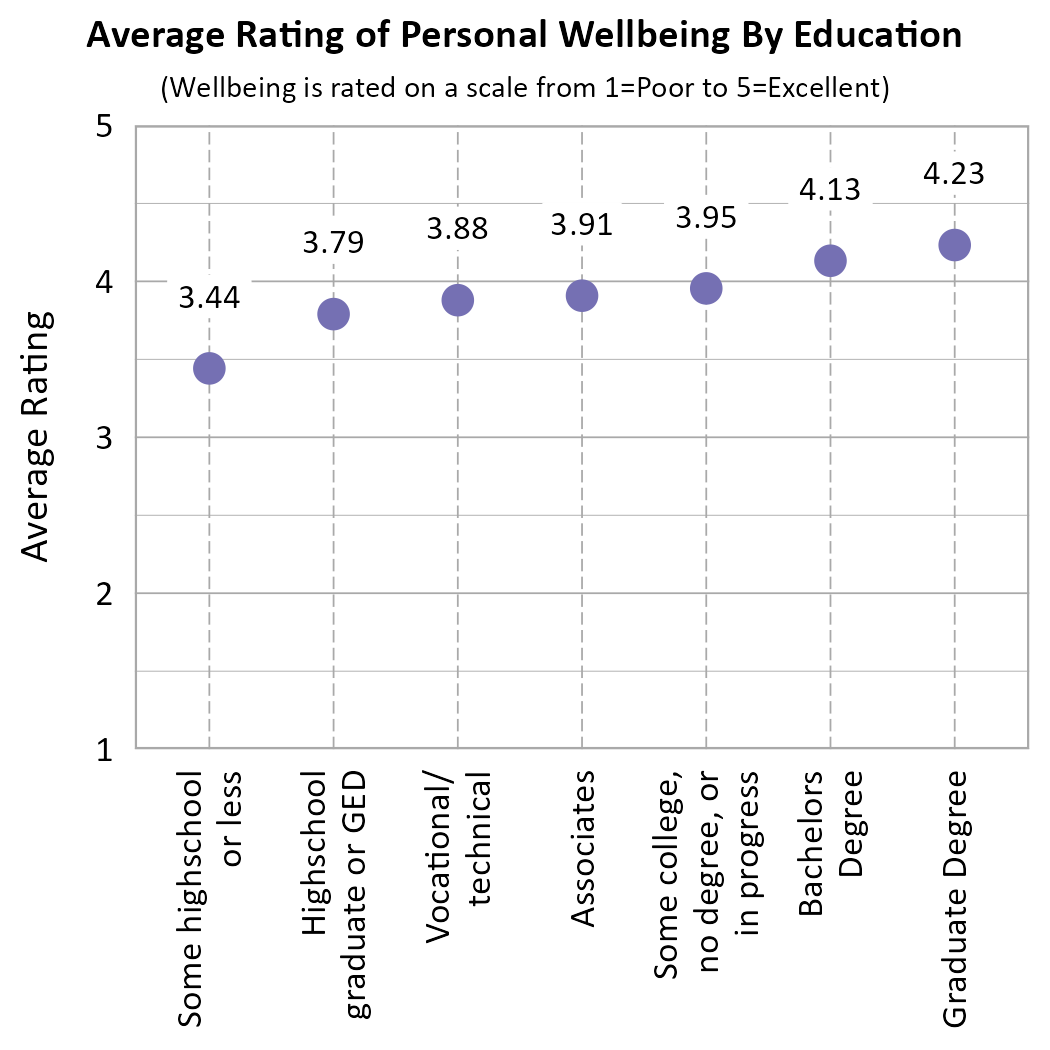
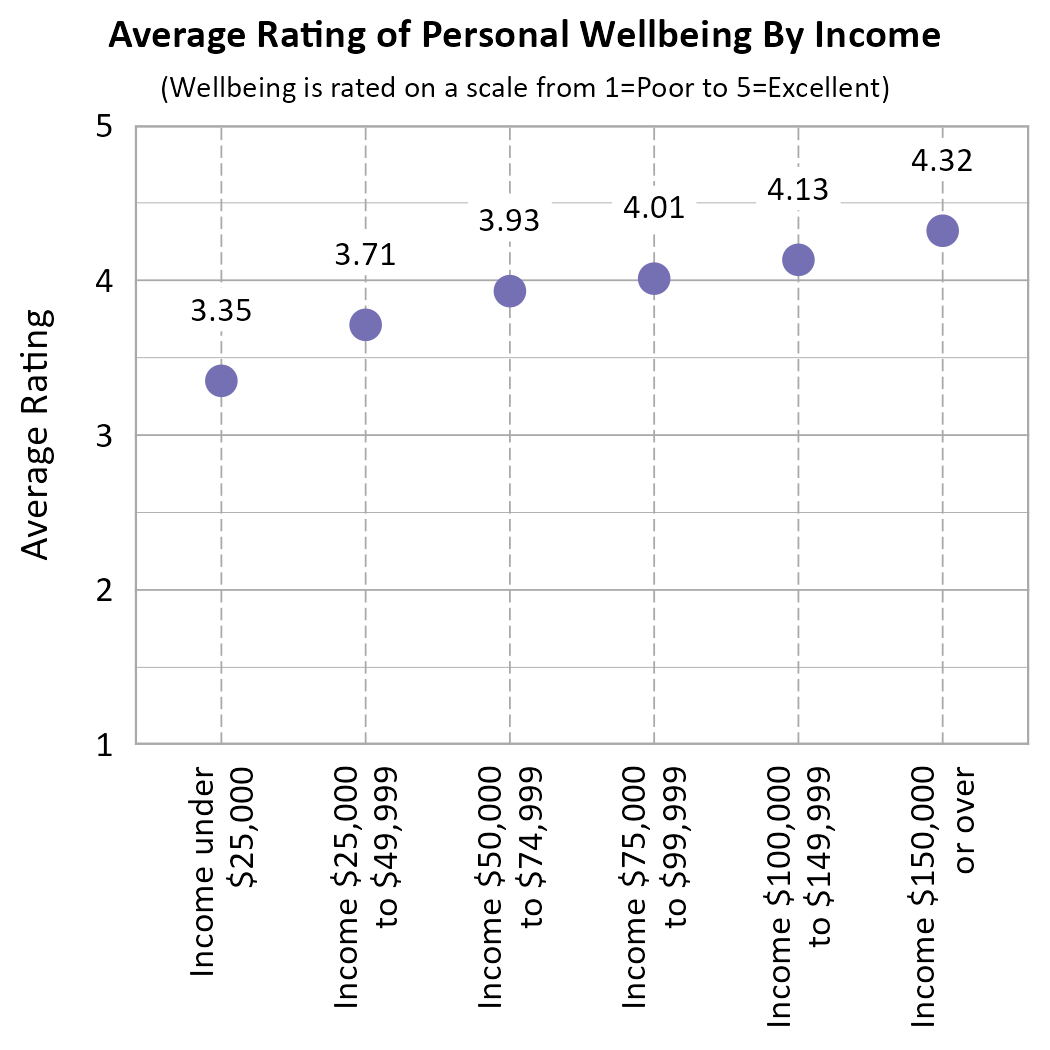
Overall Personal Wellbeing By Demographics
A deeper analysis of demographic characteristics and wellbeing is ongoing and findings will be updated over time. The graphs below highlight a few key demographic findings. Wellbeing appears to improve with age, income and education. Male respondents had the highest average level of personal wellbeing followed closely by females, but those whose gender is non-binary or non-conforming had a substantially lower average rating for personal wellbeing.
Wellbeing Domains
The survey asked respondents to both rate their wellbeing for twelve domains and indicate the importance of these domains to their overall wellbeing. The matrix graph below shows the relationship between the ratings and the importance of the twelve wellbeing domains for the combined and unweighted statewide data. These variables were measured on 5-point scales. For all Utahns surveyed in 2024, the highest rated domains were Family Life, Safety and Security, and Living Standards. The most important domains were Mental Health, Safety and Security, and Physical Health. Statewide, no domains fell in the “red zone” quadrant for higher importance and lower than average ratings, however, Local Environmental Quality, Physical Health, and Leisure Time approached this zone. The individual city matrix graphs varied considerably, and the domain scores also varied across demographic groups. This graph has not been weighted by population, sample size or demographics.

Some cities and towns had wellbeing domains or categories that fell in the “red zone” showing that the domains were of high importance, but rated lower than average for that city. Local Environmental Quality was the most common “red zone” category, followed by Physical Health, Leisure Time, and Living Standards. Safety and Security, Education, and Mental Health were “red zone” categories for a few locations.
Red Zone Domains for Study Cities (Domains with High Importance Scores and Lower Ratings)
| Local Environmental Quality | Physical Health | Leisure Time | Living Standards |
|
Bountiful |
Alpine |
Beaver |
Beaver |
| Safety and Security | Education | Mental Health | None |
|
Midvale |
Beaver |
Logan |
Bluff |
Community Connection
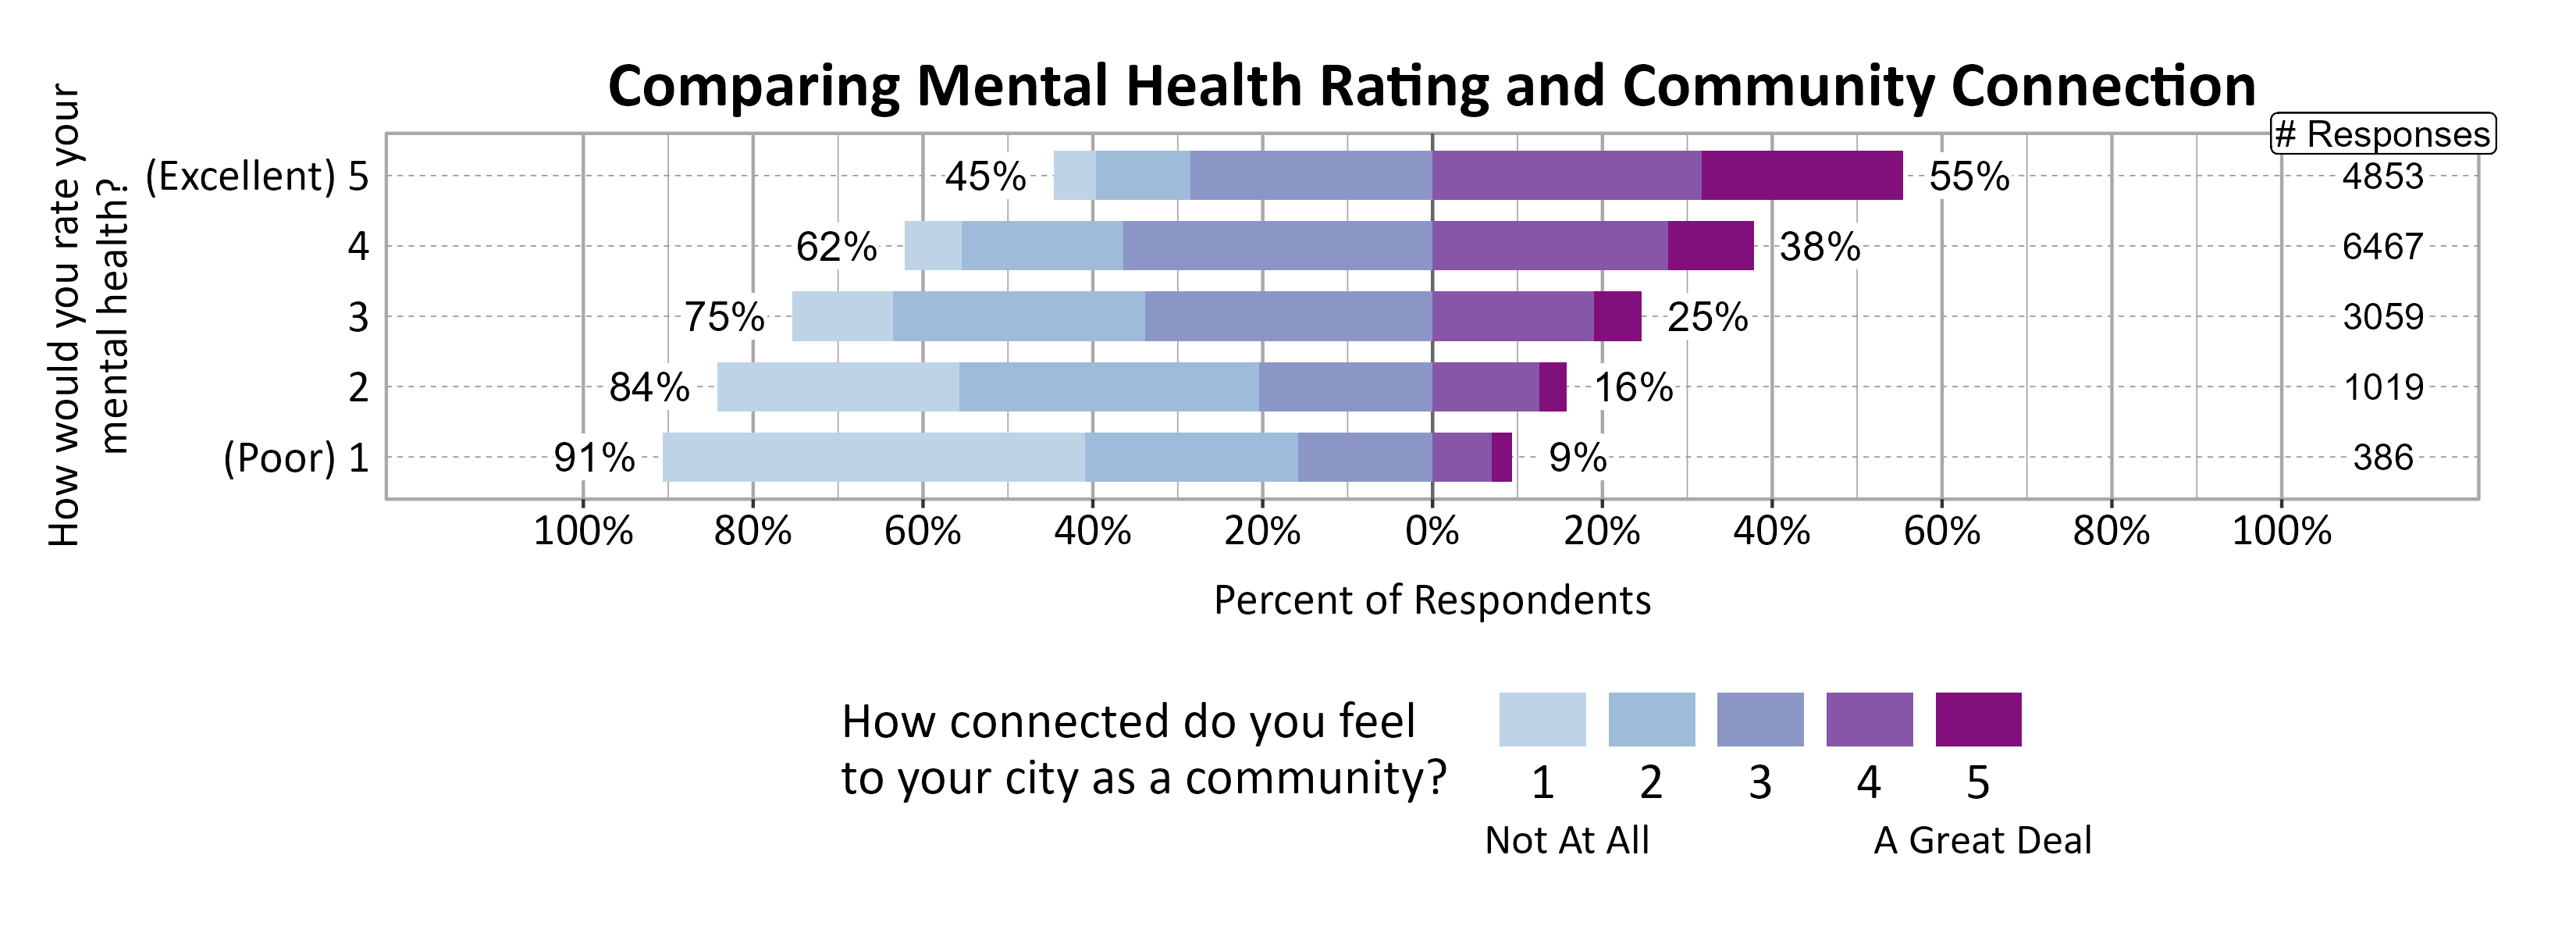
Survey participants were asked about how connected they feel to their city on a 5-point scale from not at all (1) to a great deal (5), and the average score of all the participating cities was 3.15. The graph below shows how Wellbeing Project cities and towns compare on feelings of community connection based on the percentage of respondents who answered 4 or a 5 on a 5-point scale from “not at all” to “a great deal” connected to their city or town. Grouping cities into their clusters, we see that variability of community connections scores is consistent within each cluster and each cluster exhibits a similar range of scores, with Bluff as a notable outlier.
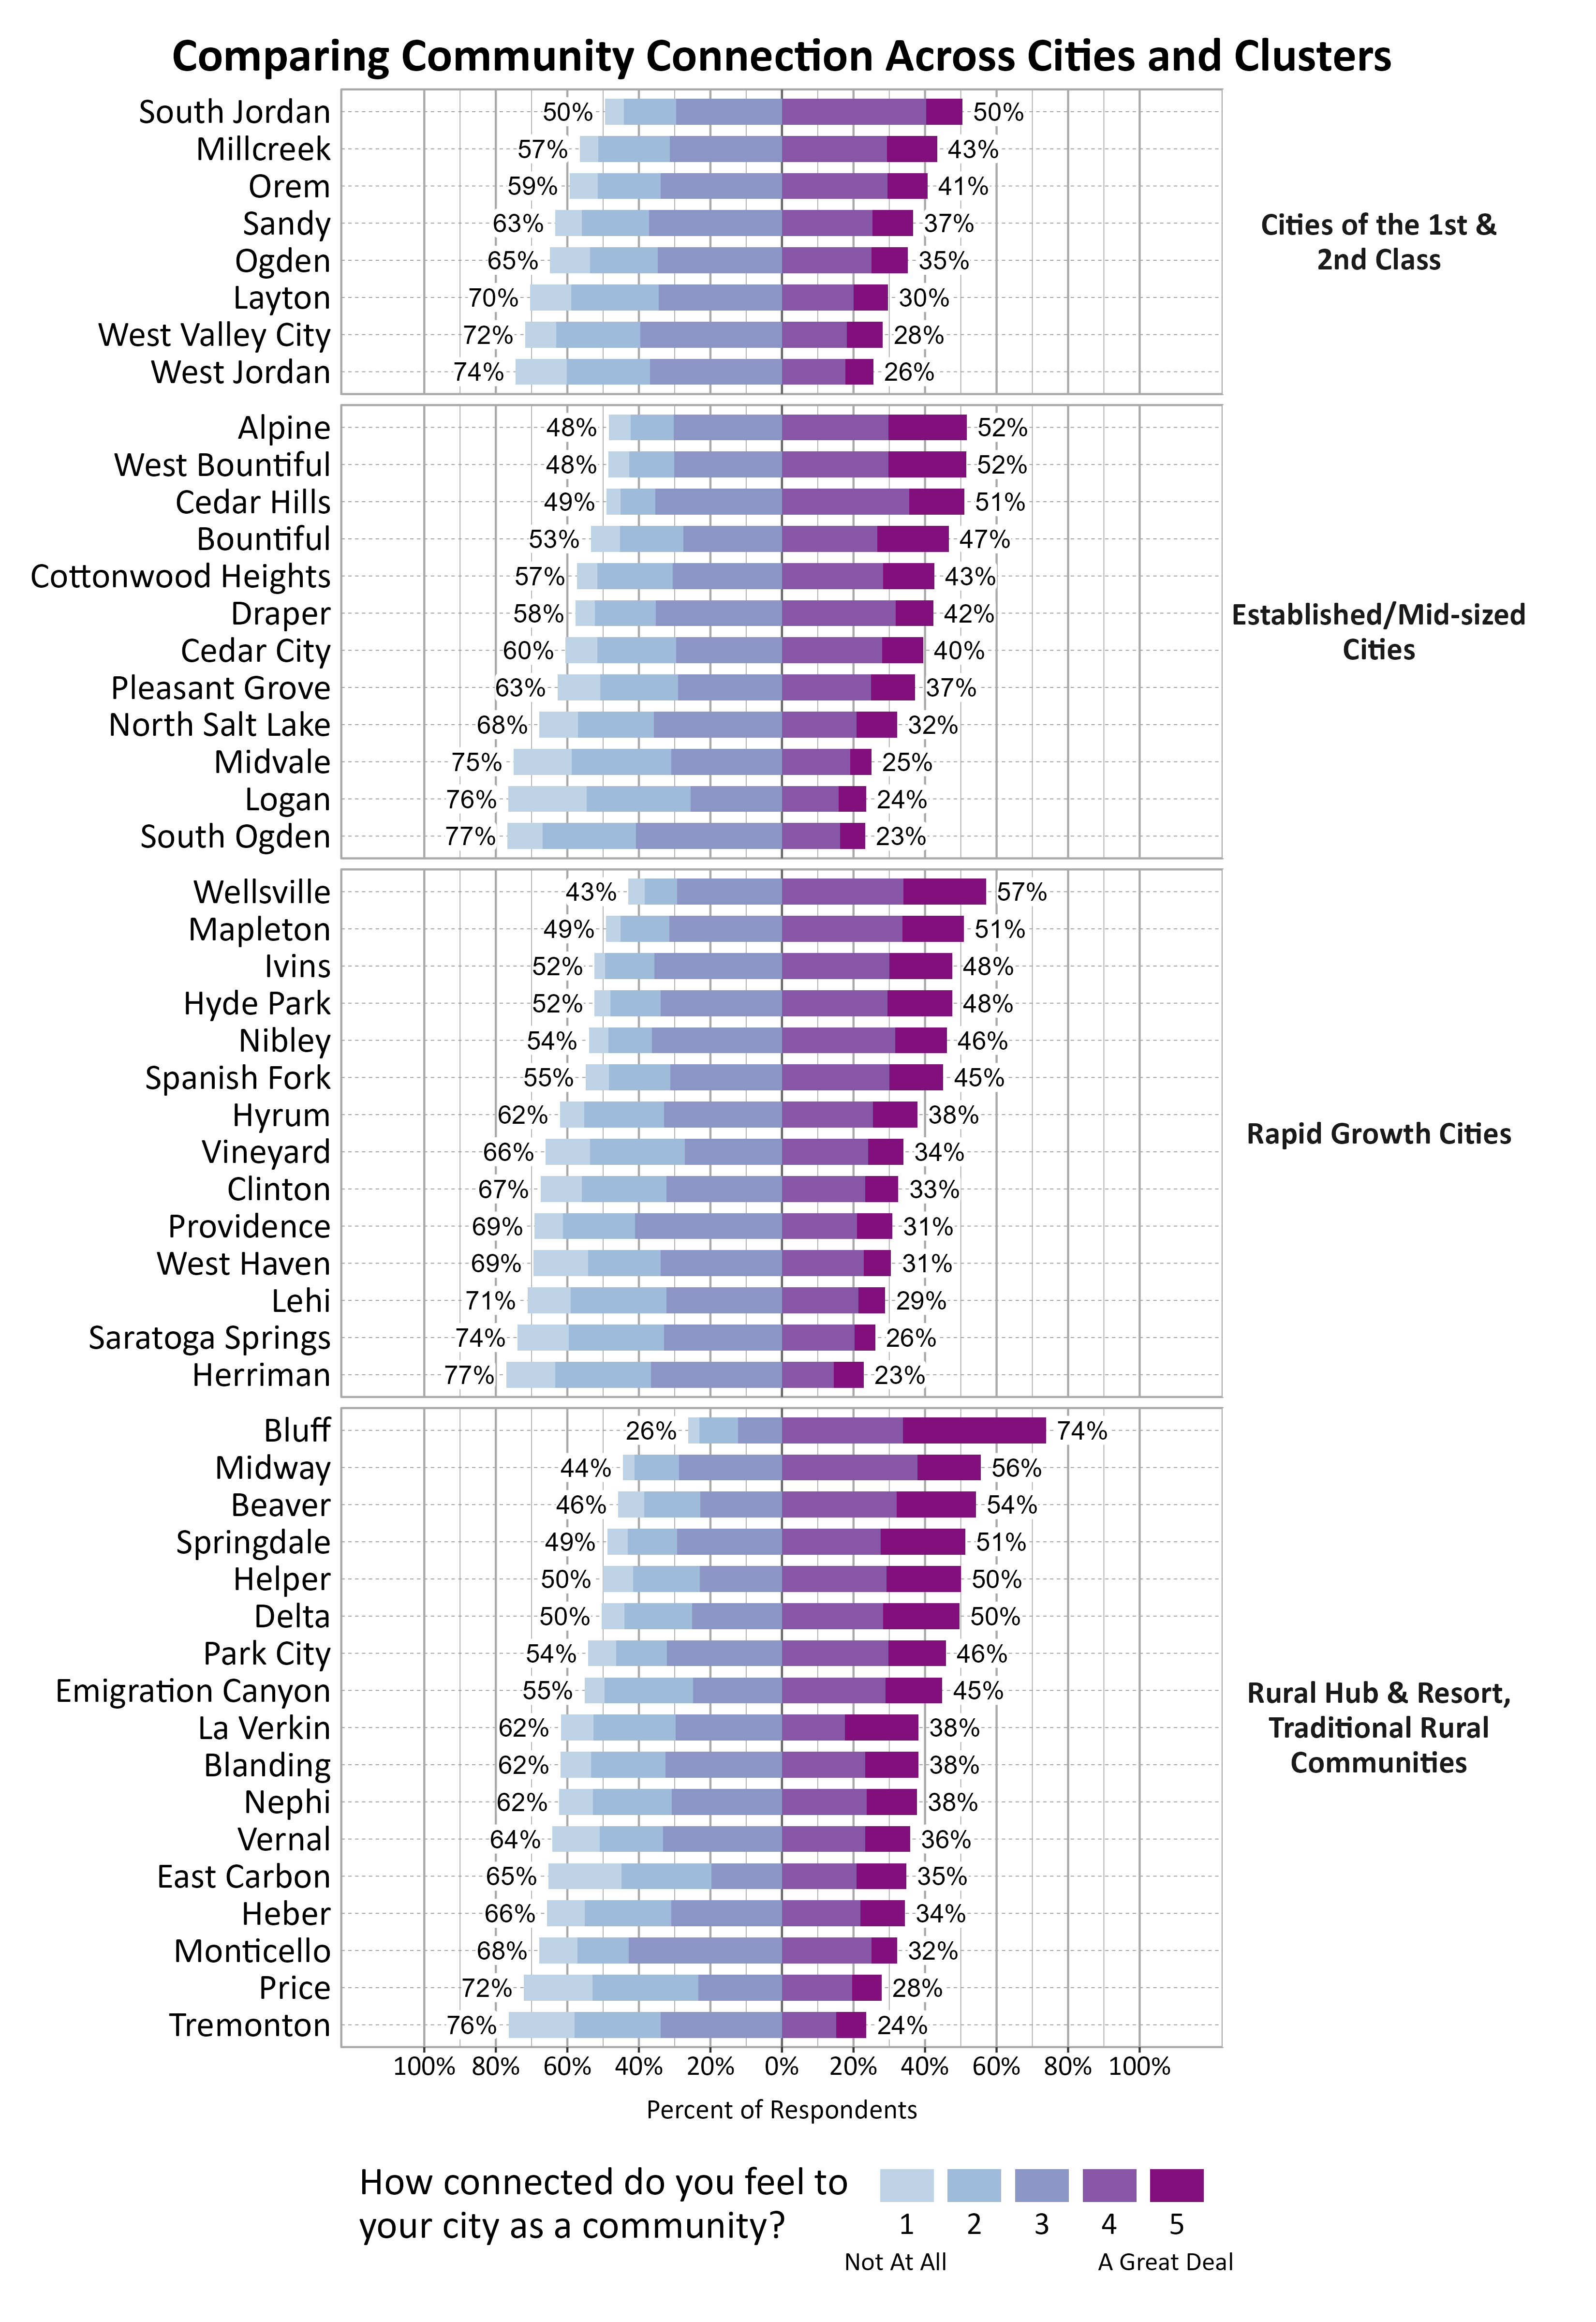
A key finding is that across the state, those with higher levels of community connectedness reported higher levels of personal wellbeing and mental health. There were only a few communities that did not show this pattern clearly. This relationship has not been weighted by city population, city sample proportion, or demographic variables.
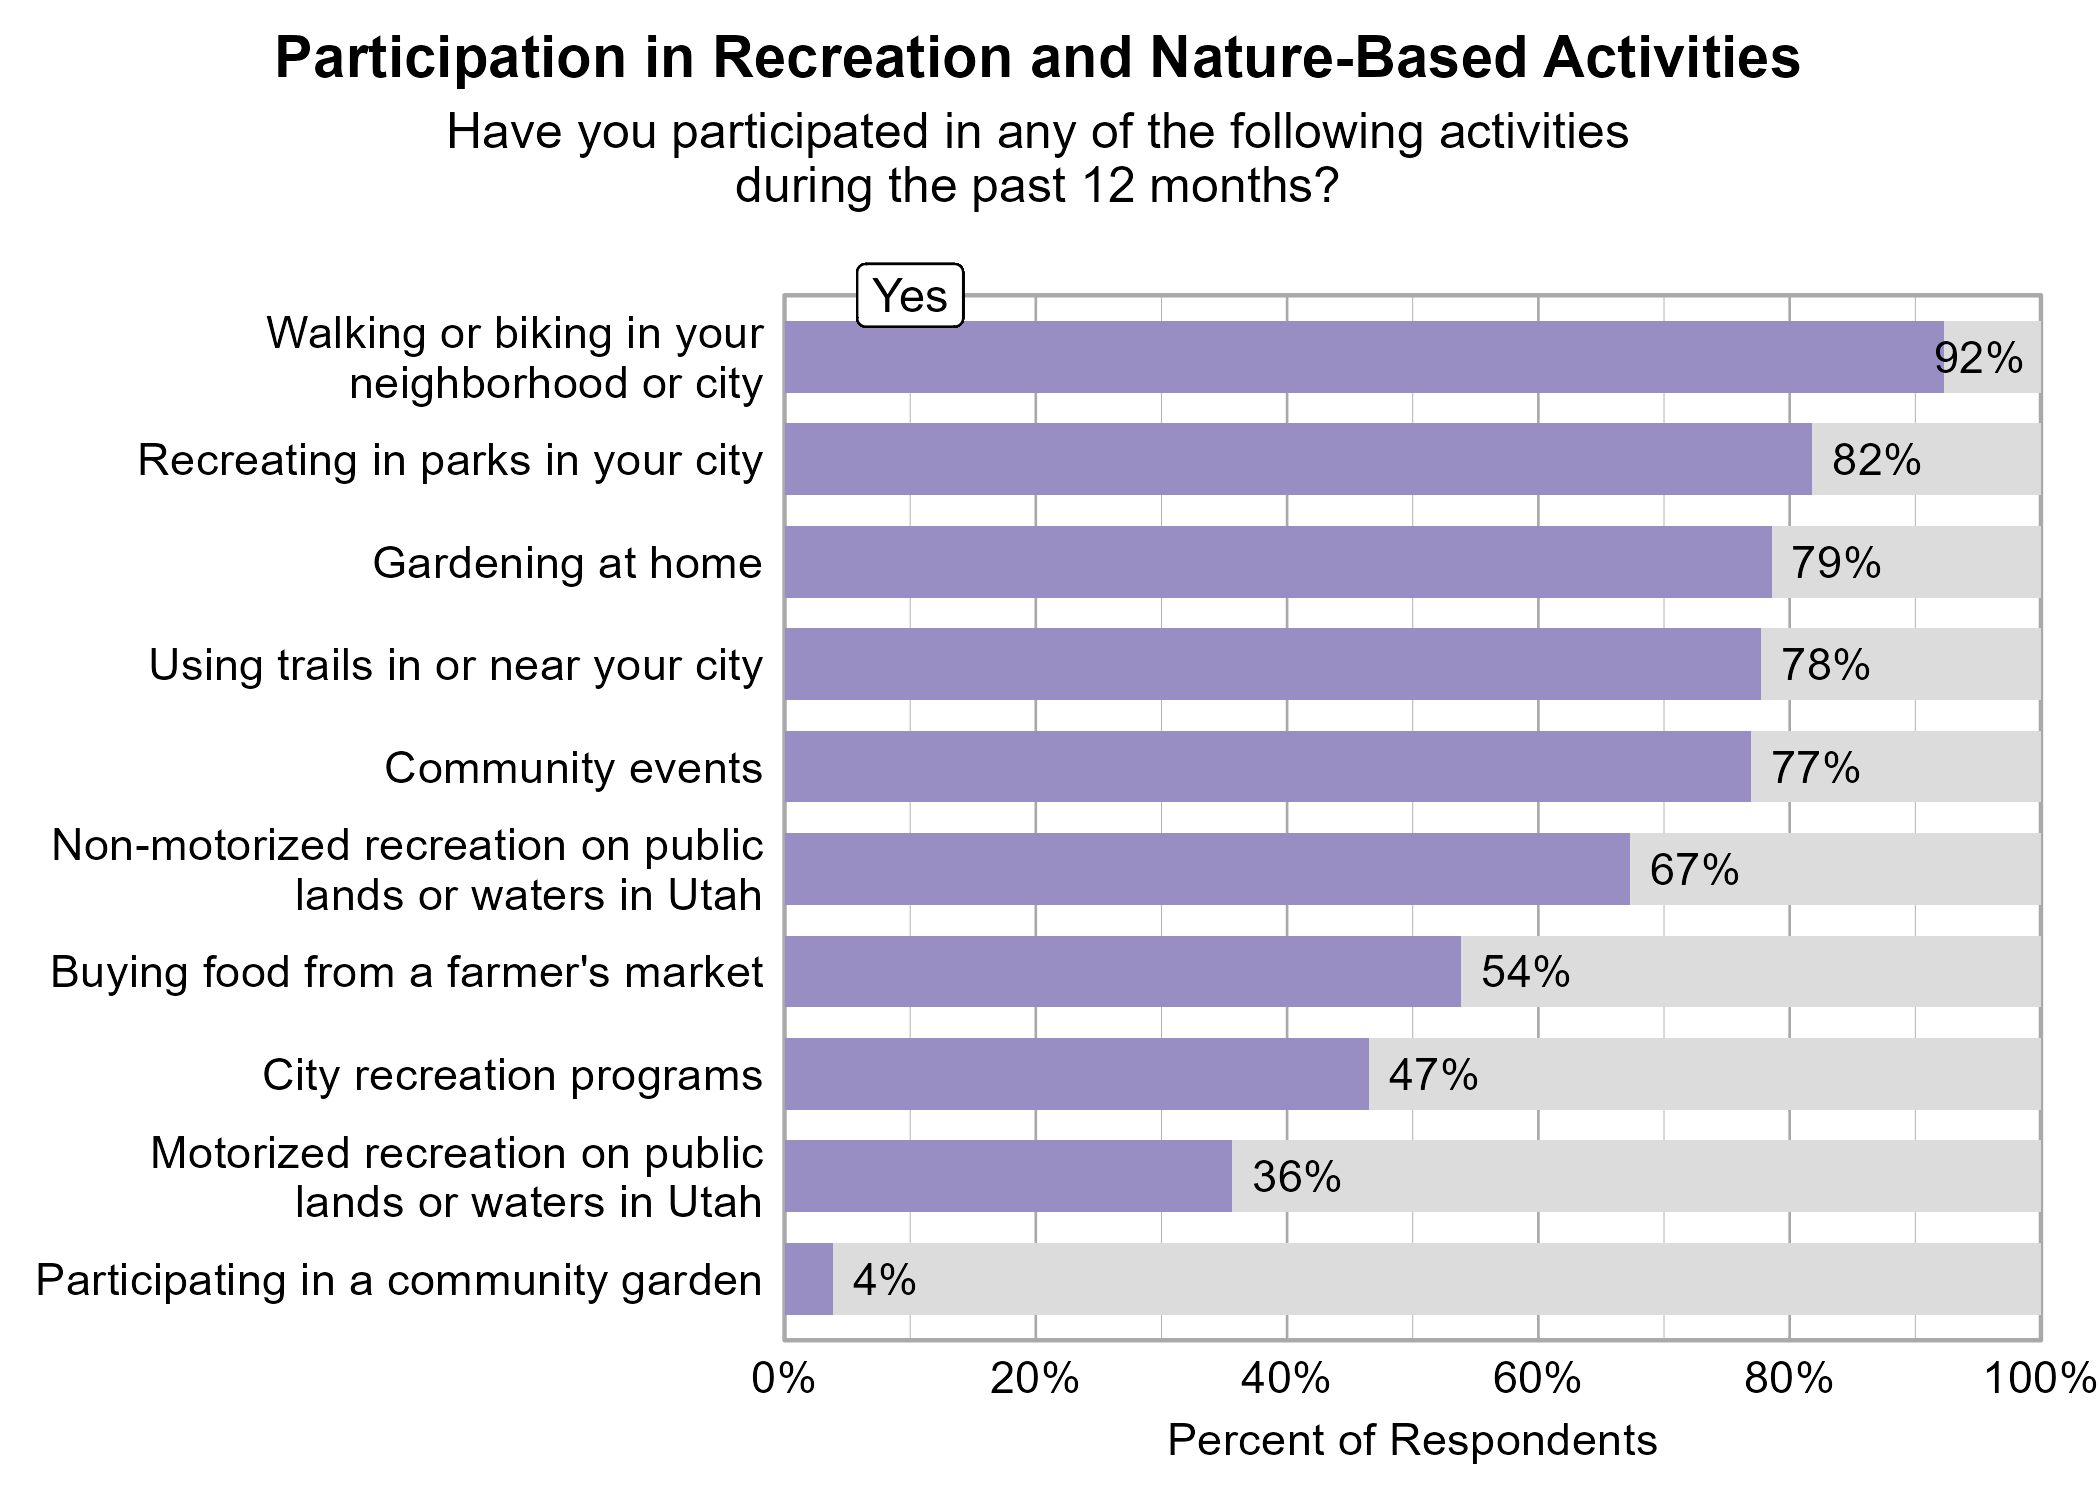
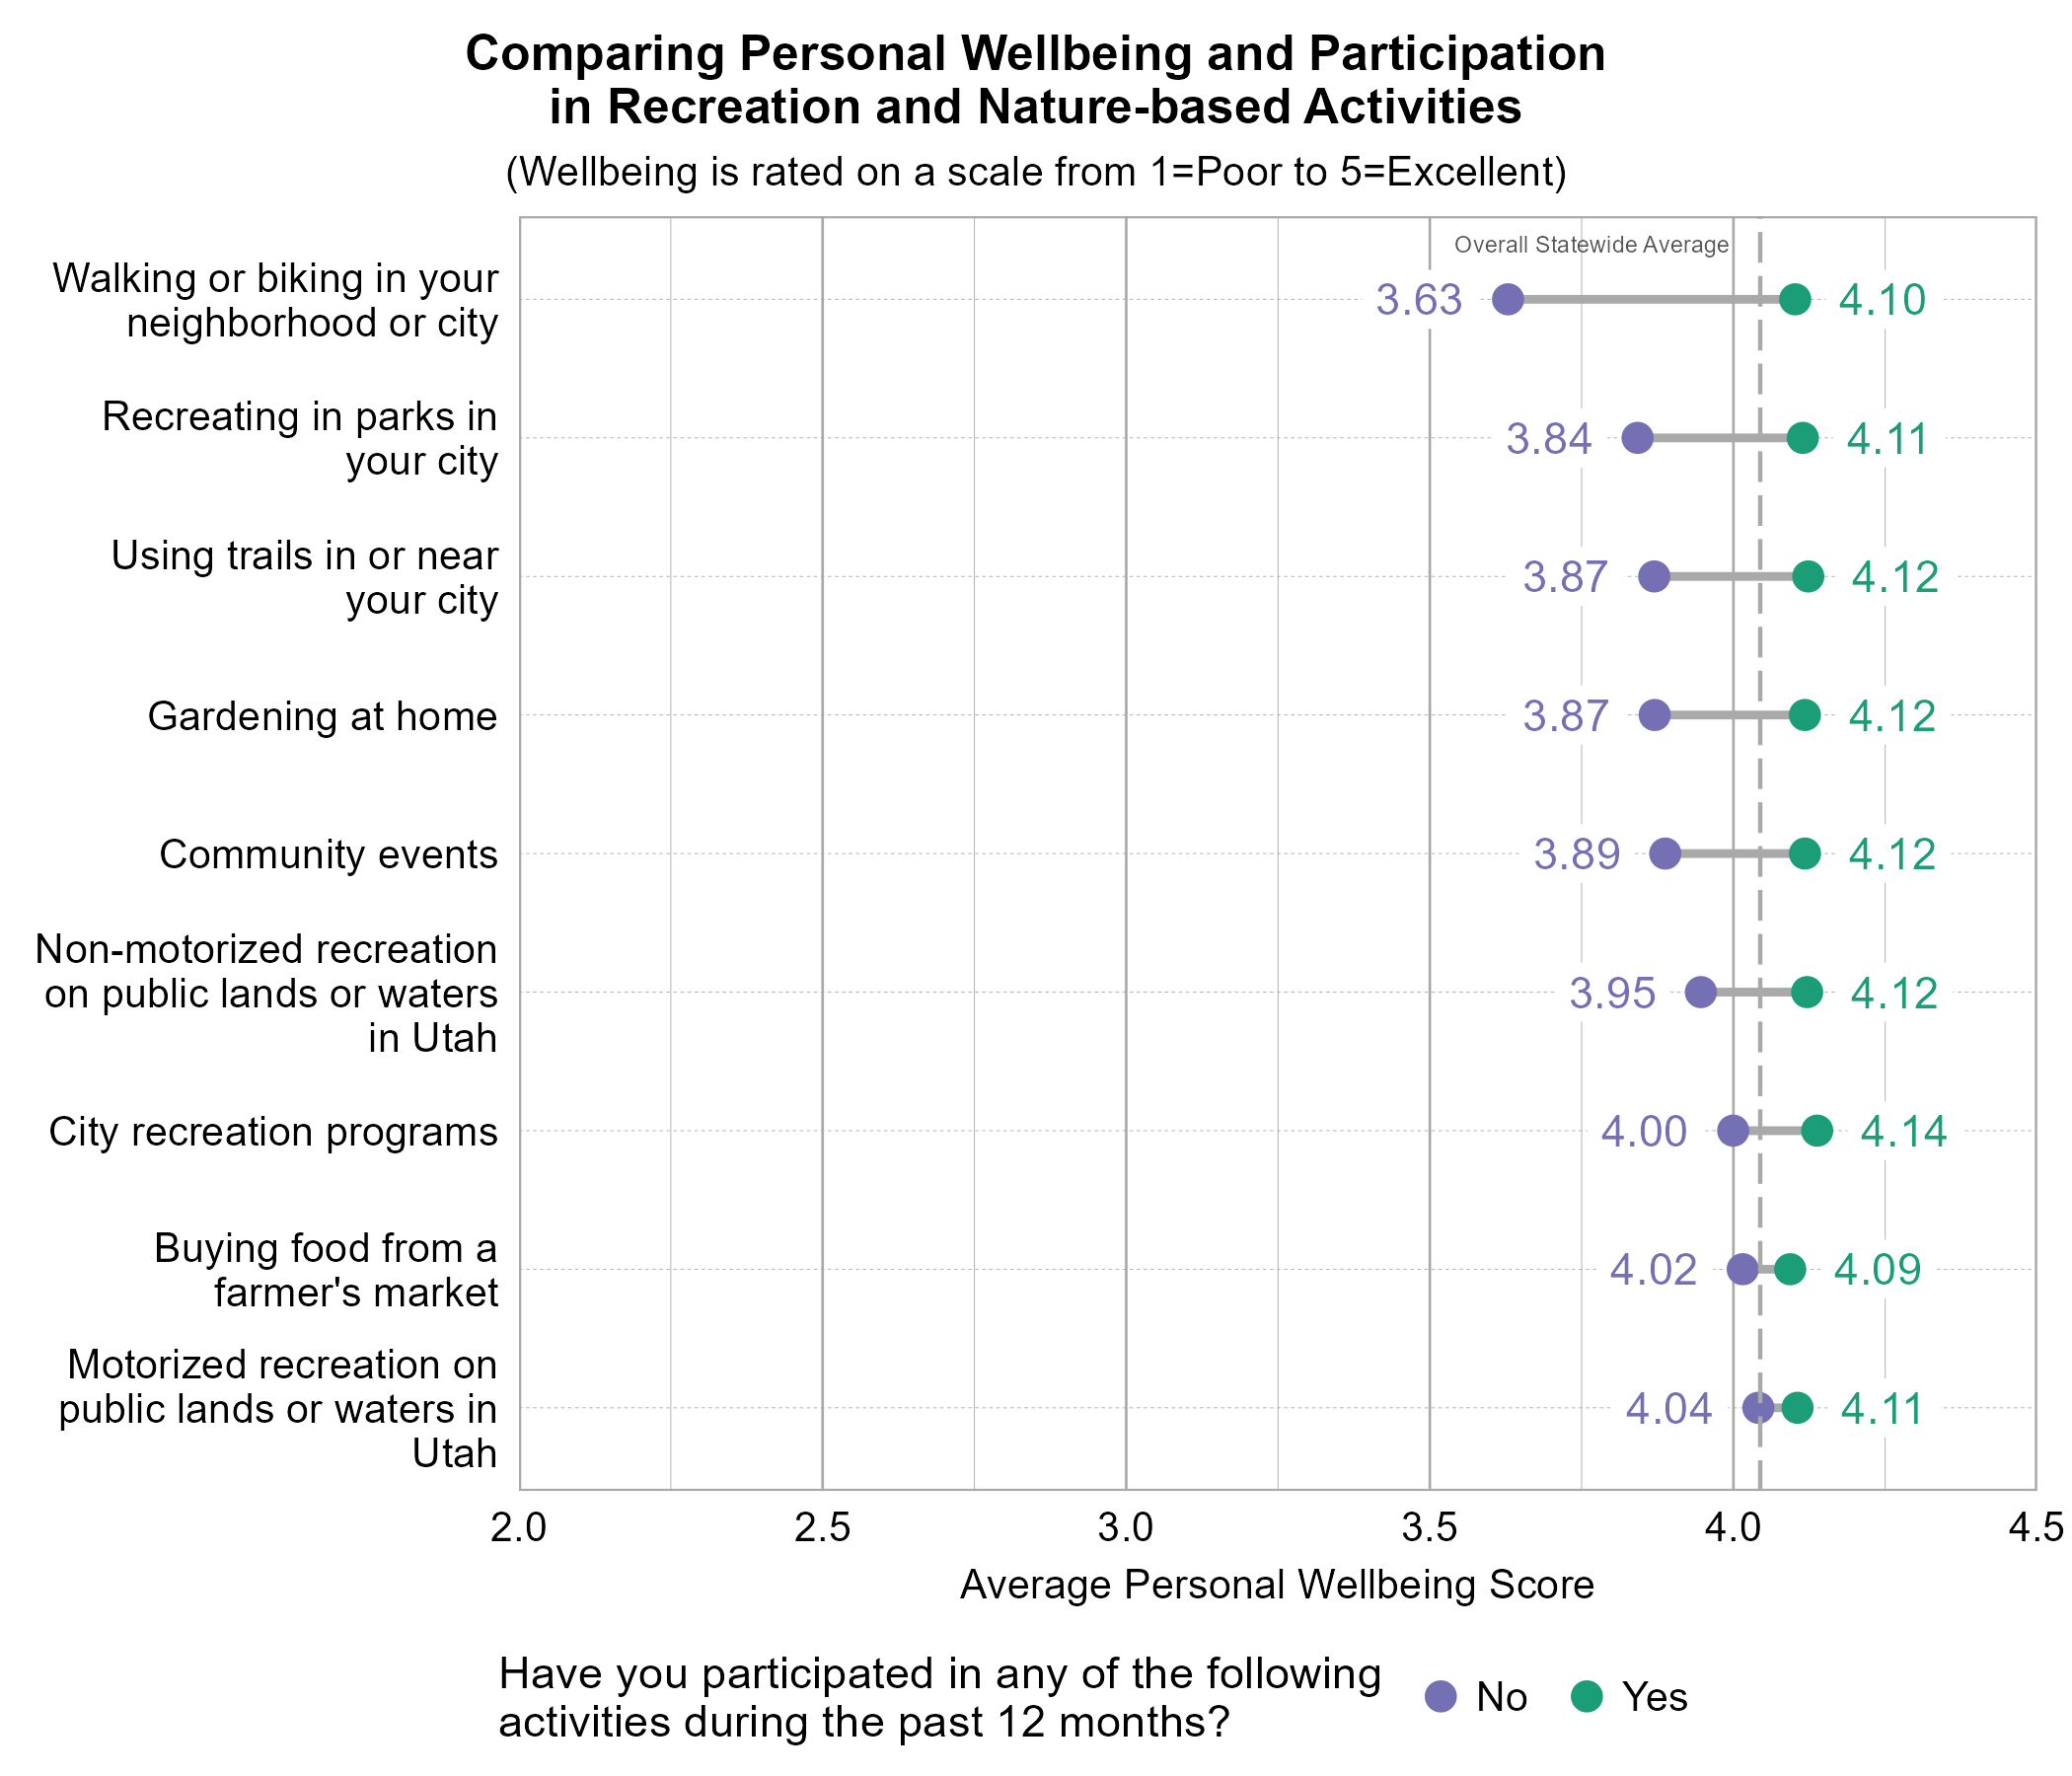
Participation in Recreation and Nature-Related Activities
Respondents were asked to indicate whether or not they participated in various activities in the last 12 months. A key finding is that respondents are generally very highly active! The most popular activities were walking or biking in your neighborhood or city (92%), recreating in parks in your city (82%), gardening at home (79%), using trails in or near your city (78%), and community events (77%).
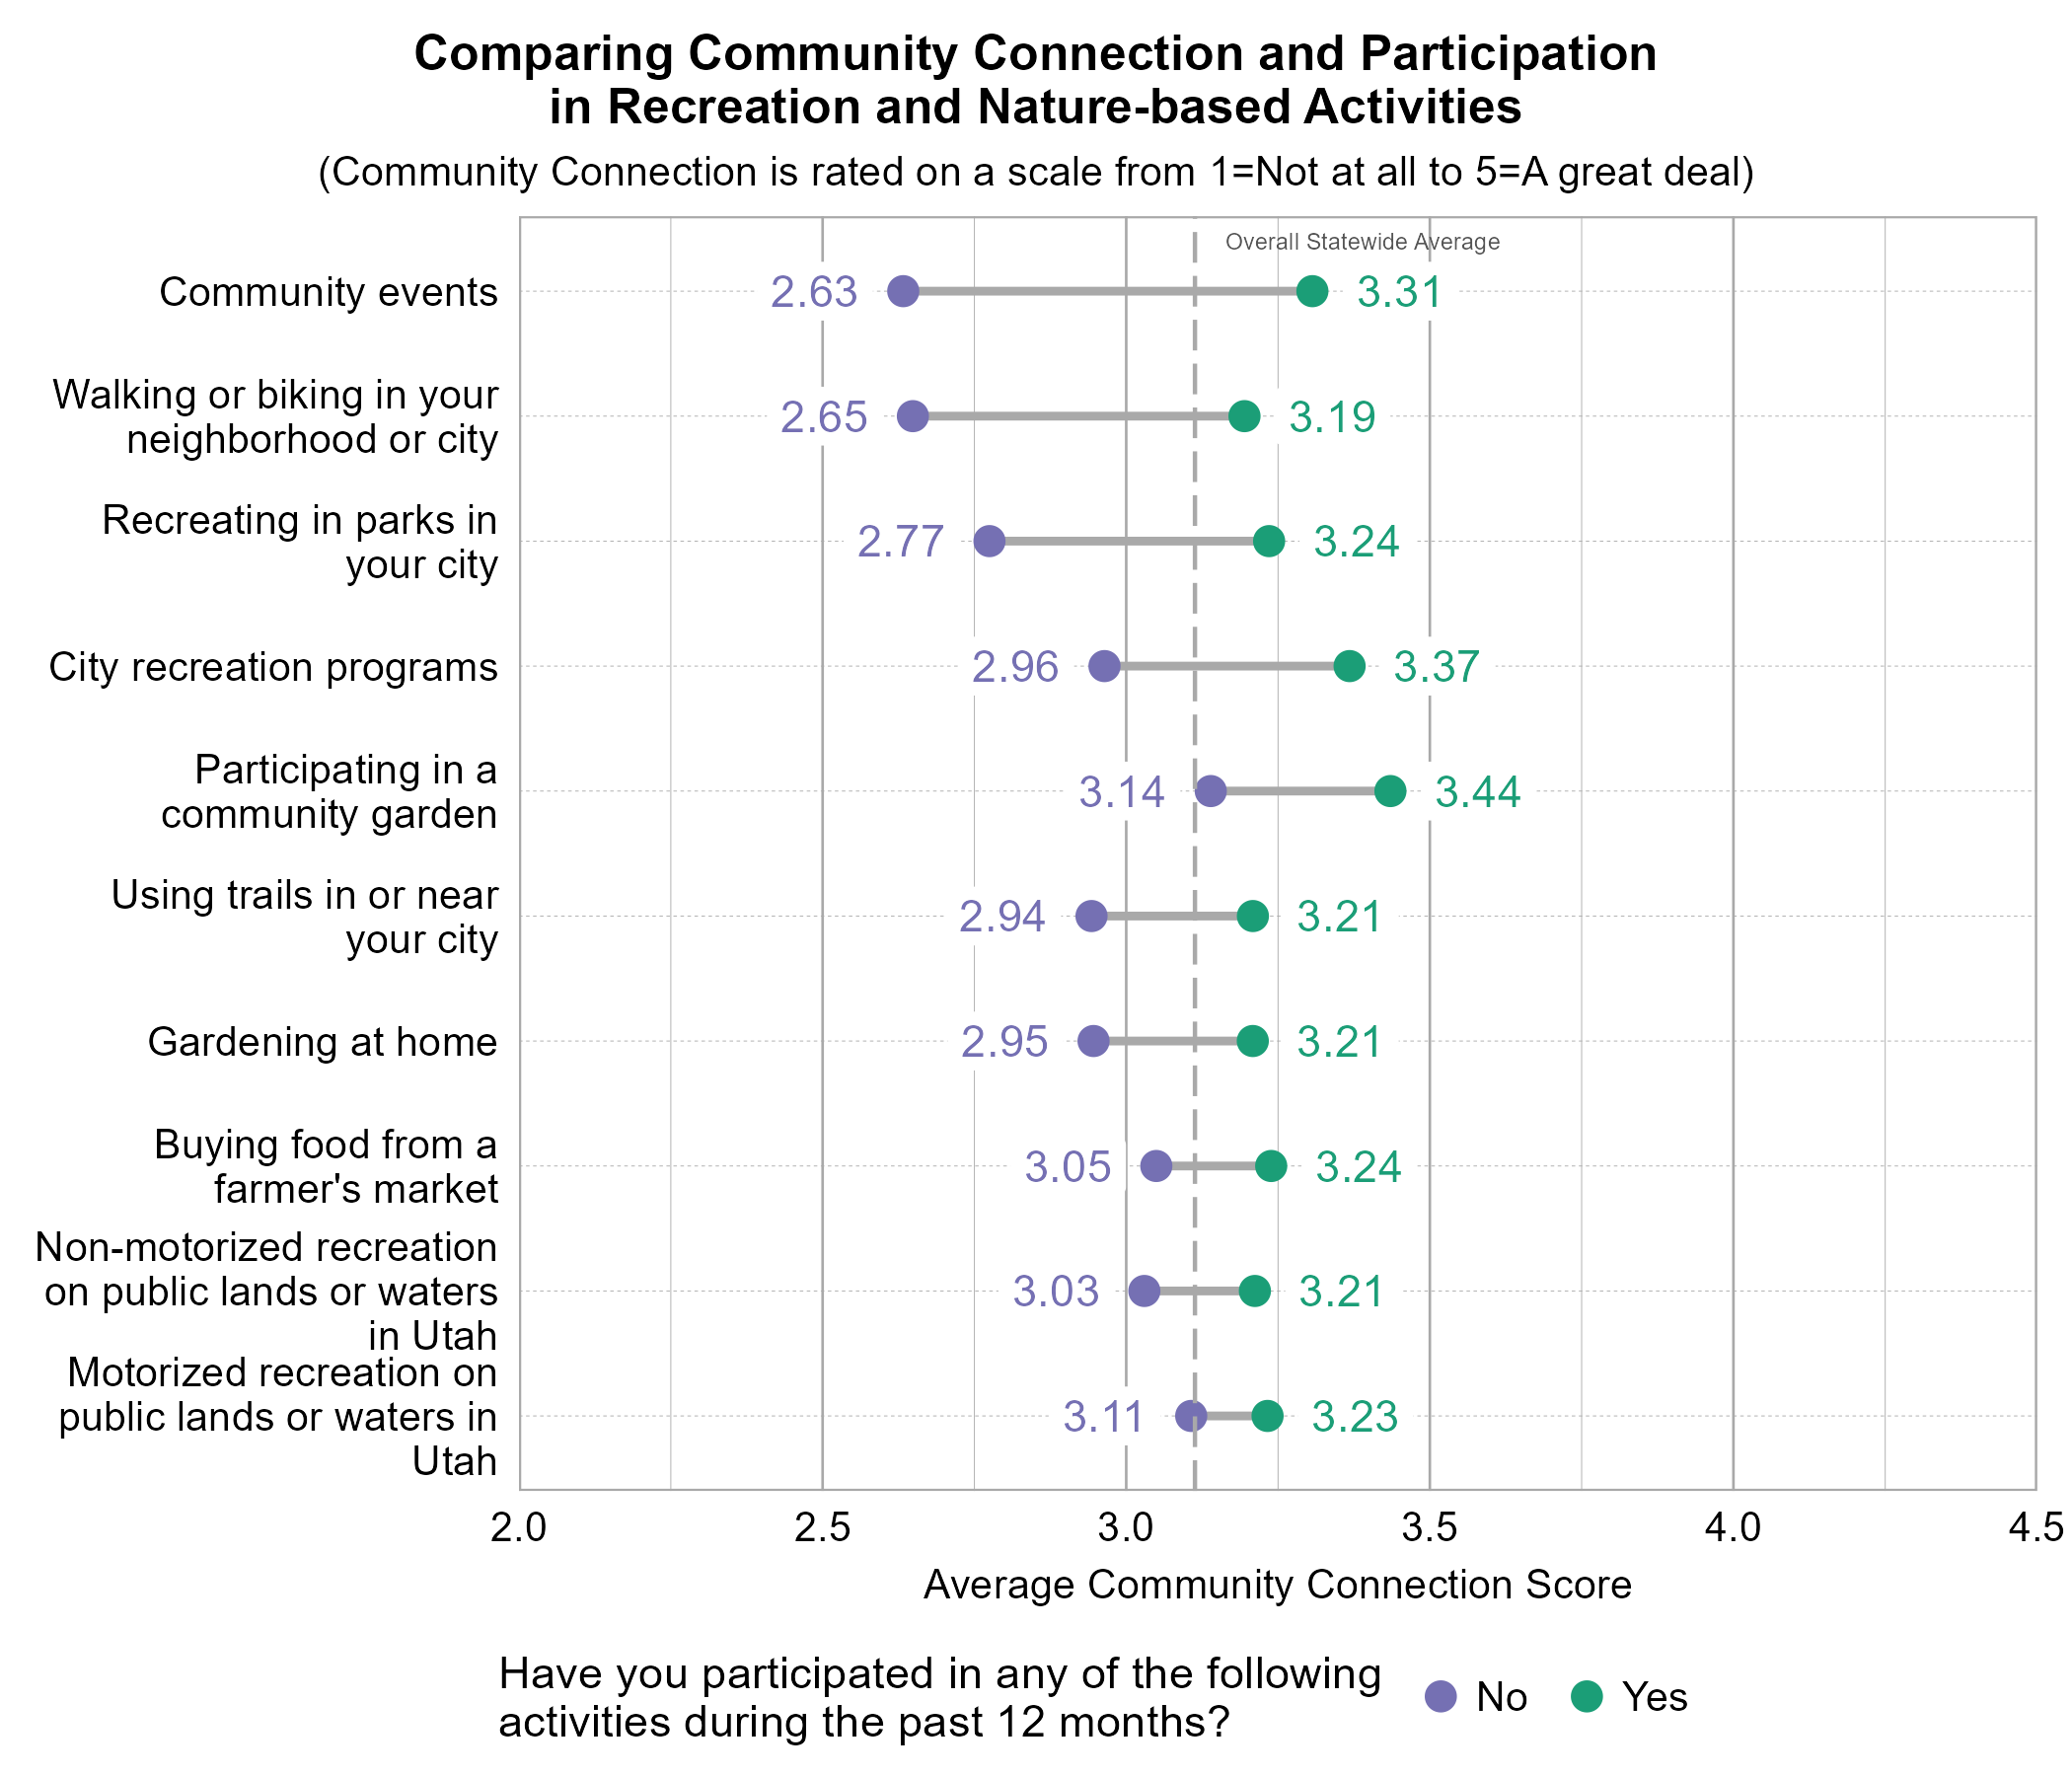
A key finding is that those who participated in recreational activities were found to be statistically correlated with higher personal wellbeing, community wellbeing, and community connection, and the differences between the two groups are highlighted in the graphs below.

Perspectives on Population Growth and Economic Development
There were considerable differences in perspectives over population growth versus economic growth across the study cities. A key finding is that respondents from all but the most rural cities felt population growth was too fast. There was more variation in perspectives on the pace of economic development.
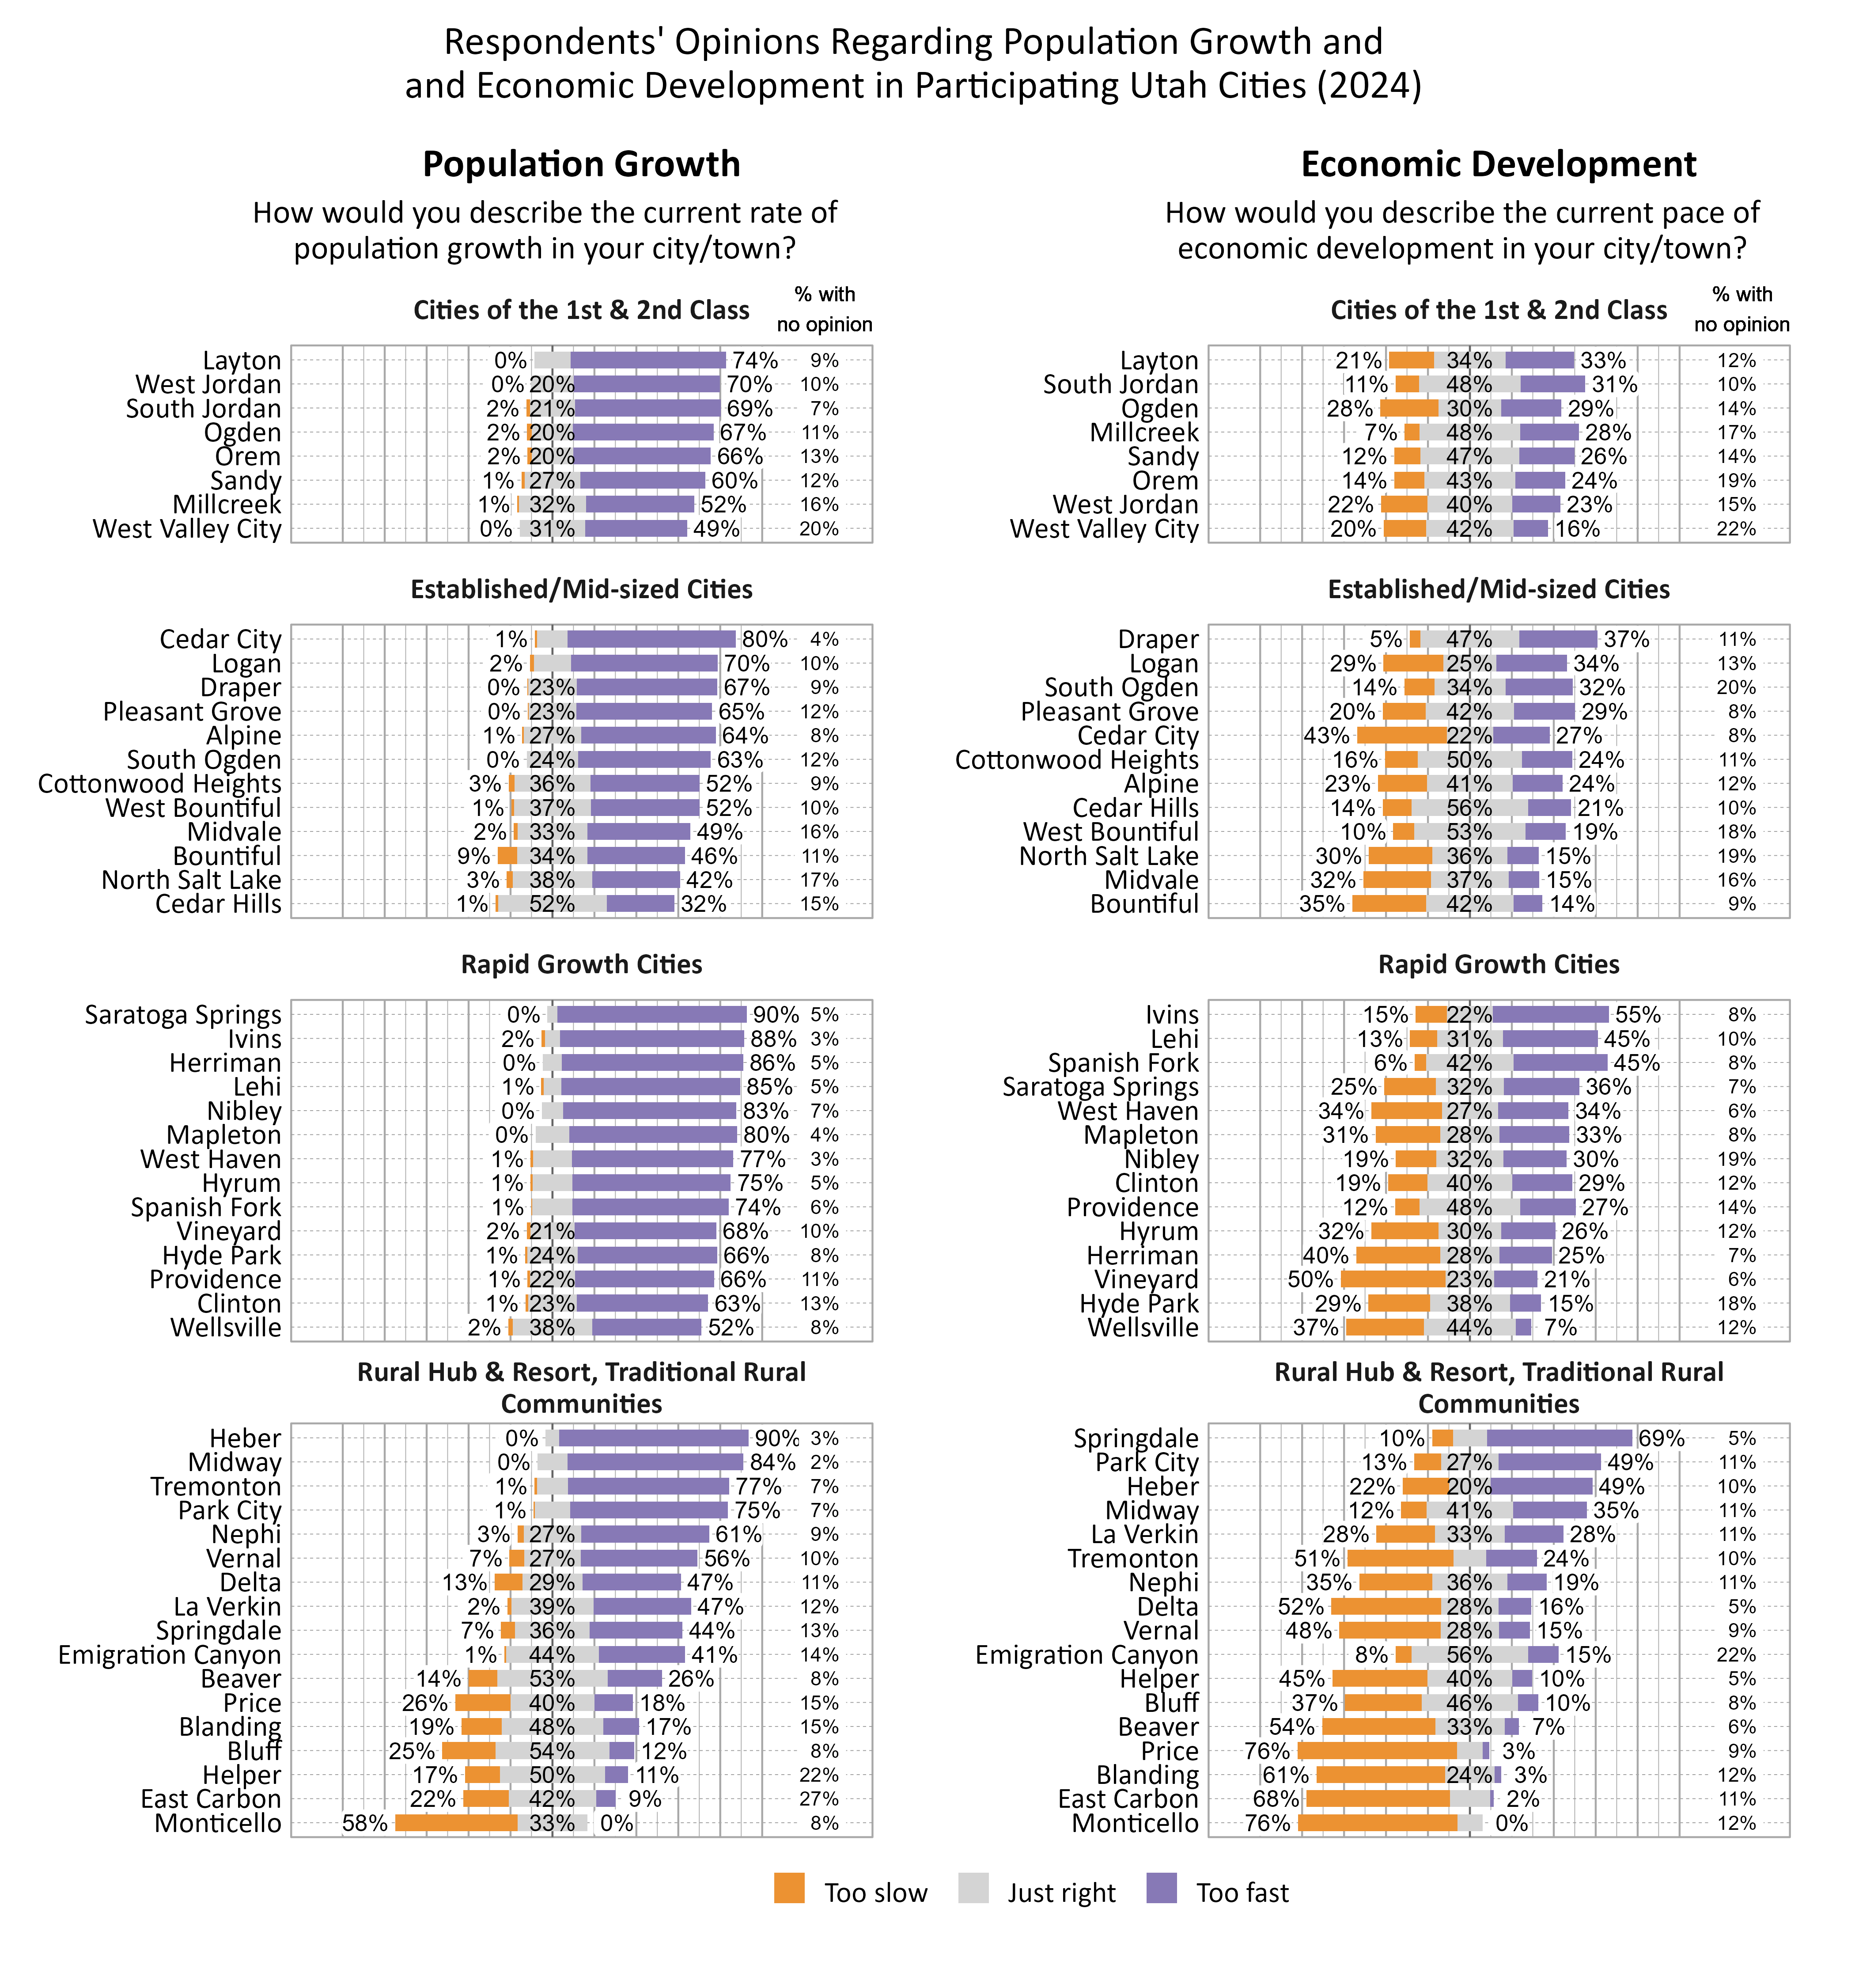
A key finding is that perceptions of population growth and the pace of economic development are not always strongly aligned with actual measures of these growth areas. A comparison between the the census data and the perceived growth rates is shown below.

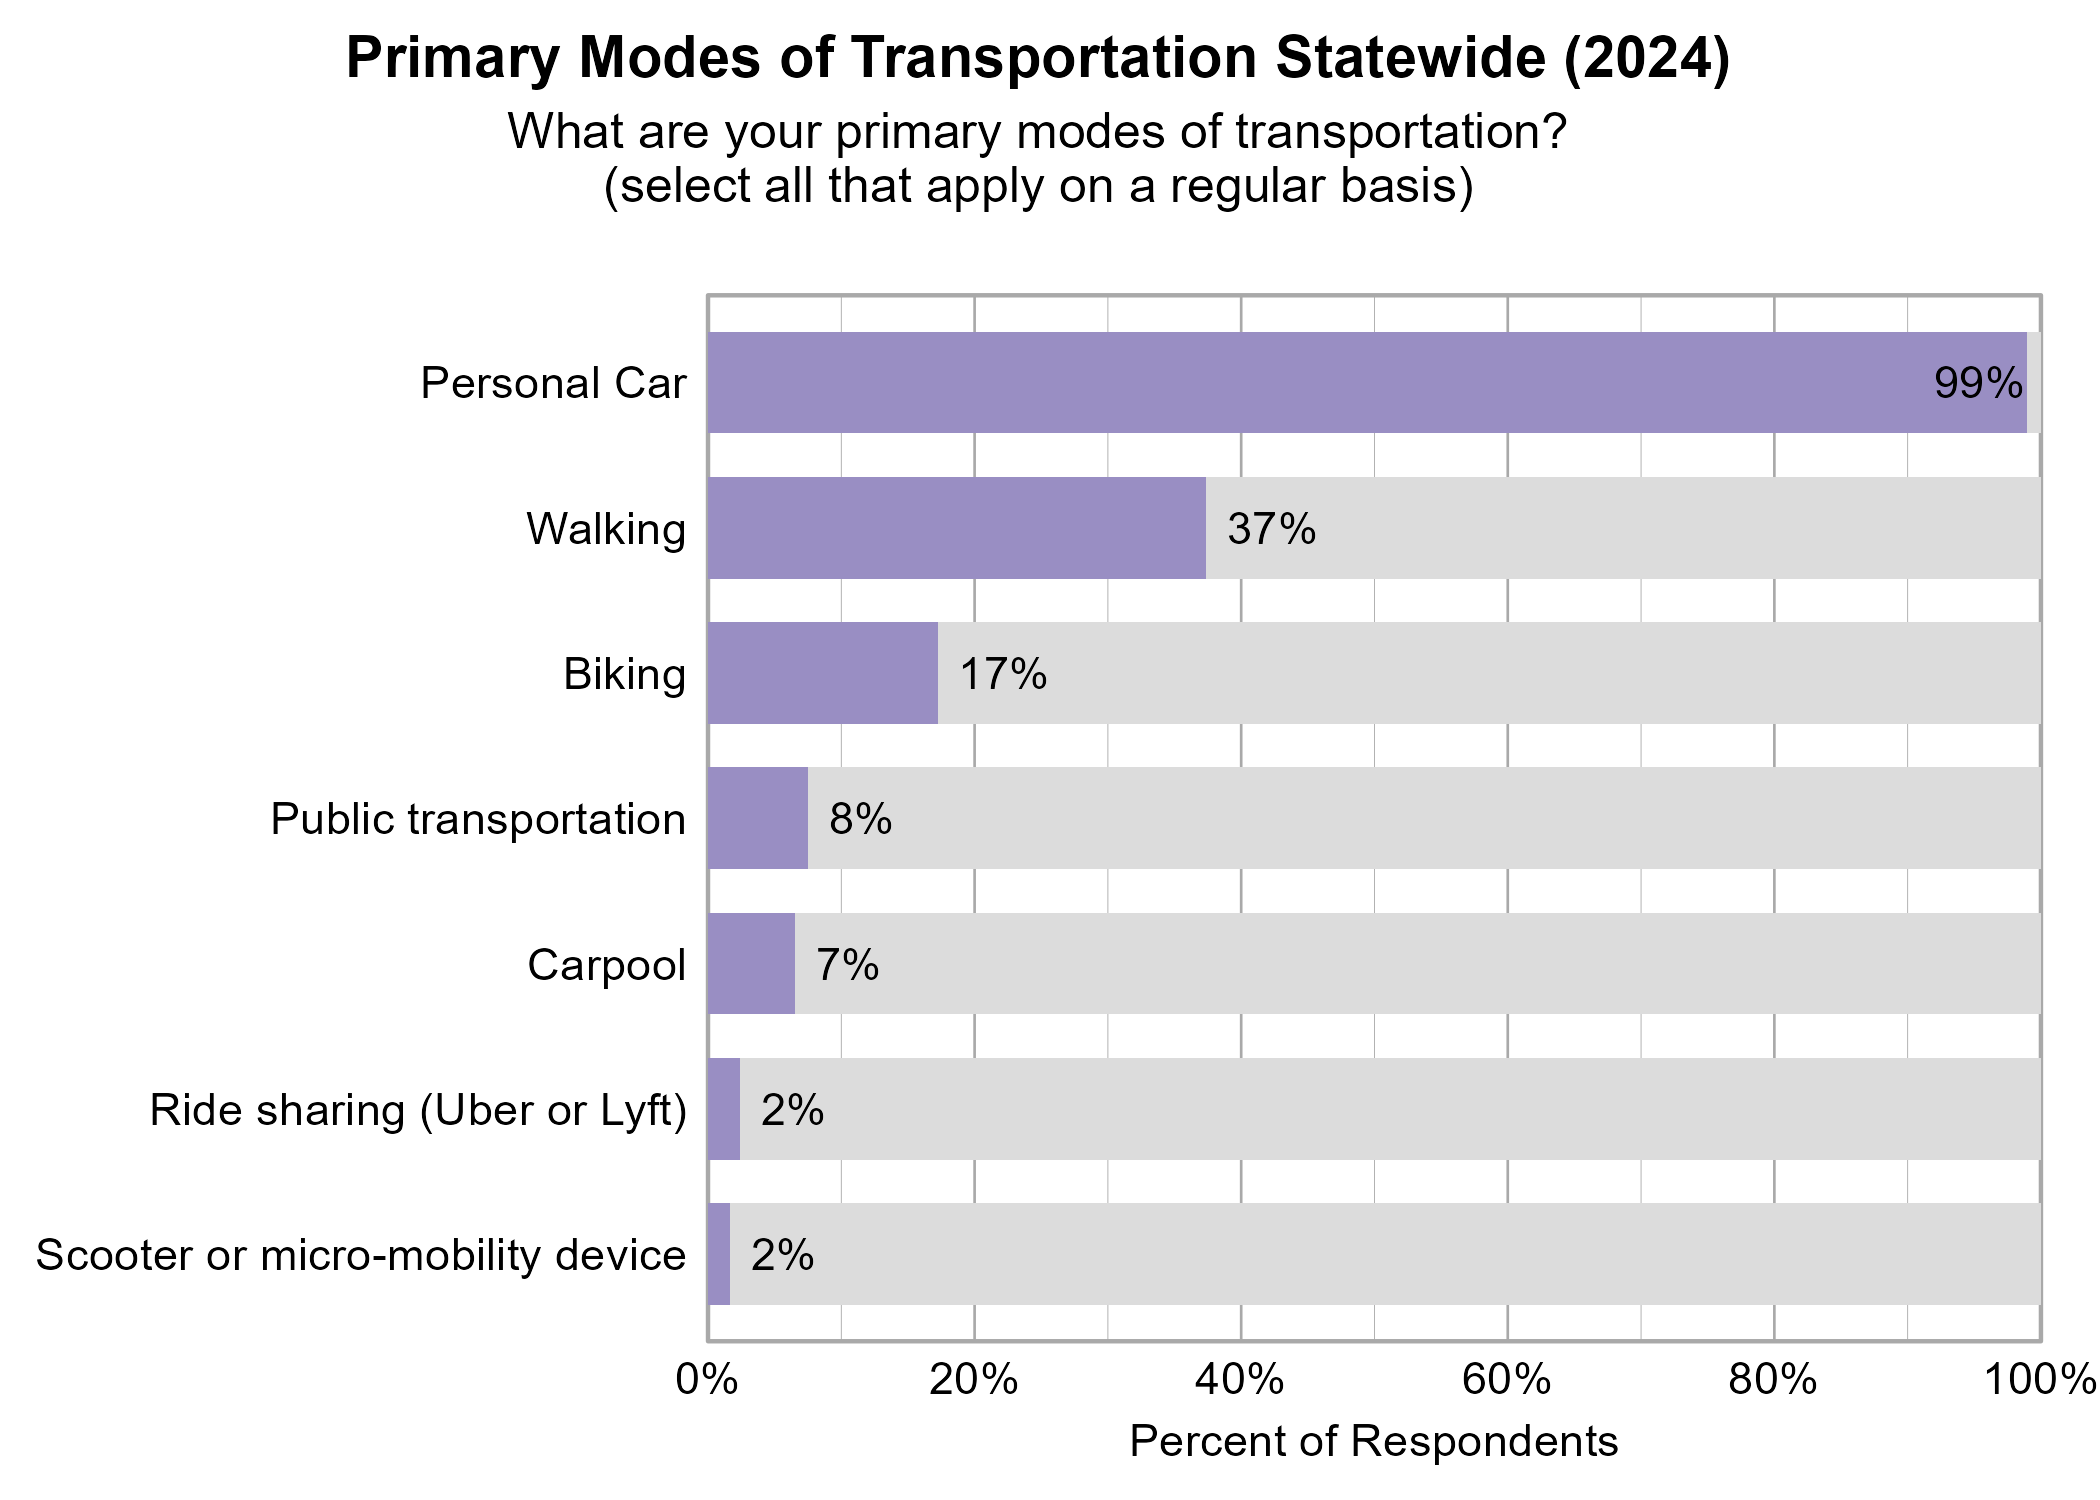
Transportation in Utah
A few questions in the survey were added by UDOT's Travelwise Program. Respondents were asked to indicate all of their primary modes of transportation on a regular basis in their city. Statewide, the most popular modes of transportation were personal car (99%) and walking (37%).
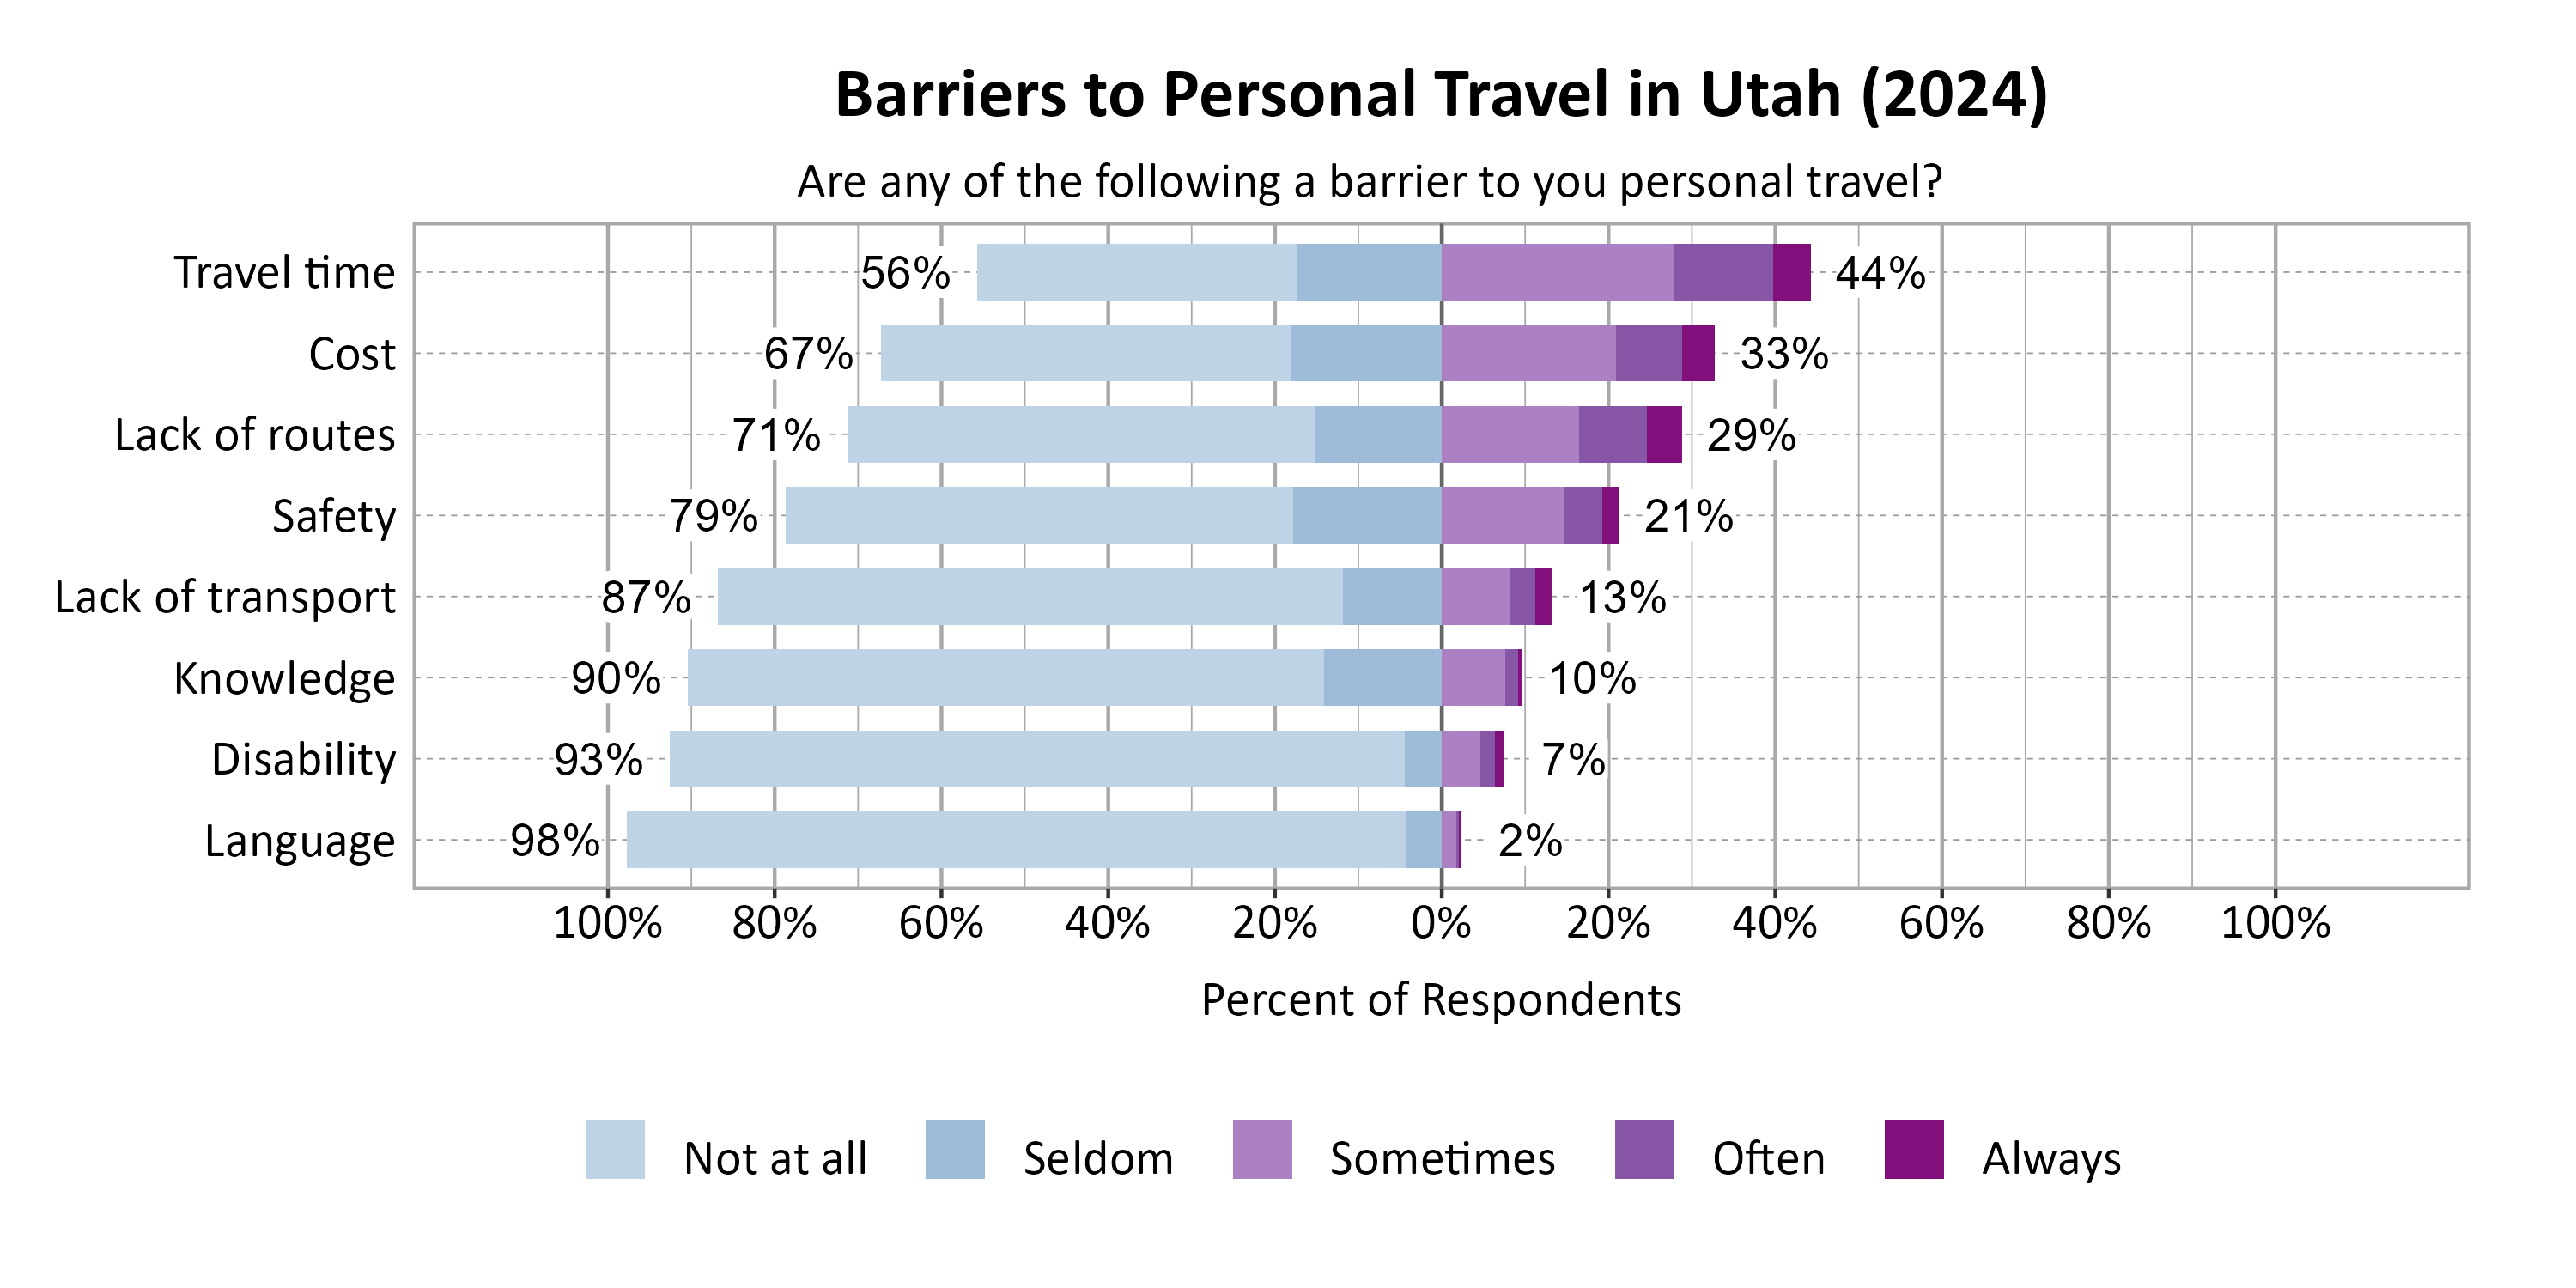
Respondents were asked to indicate the most common barriers to transportation in their city. Statewide, the most problematic barriers were Travel time (44%) and Cost (33%).
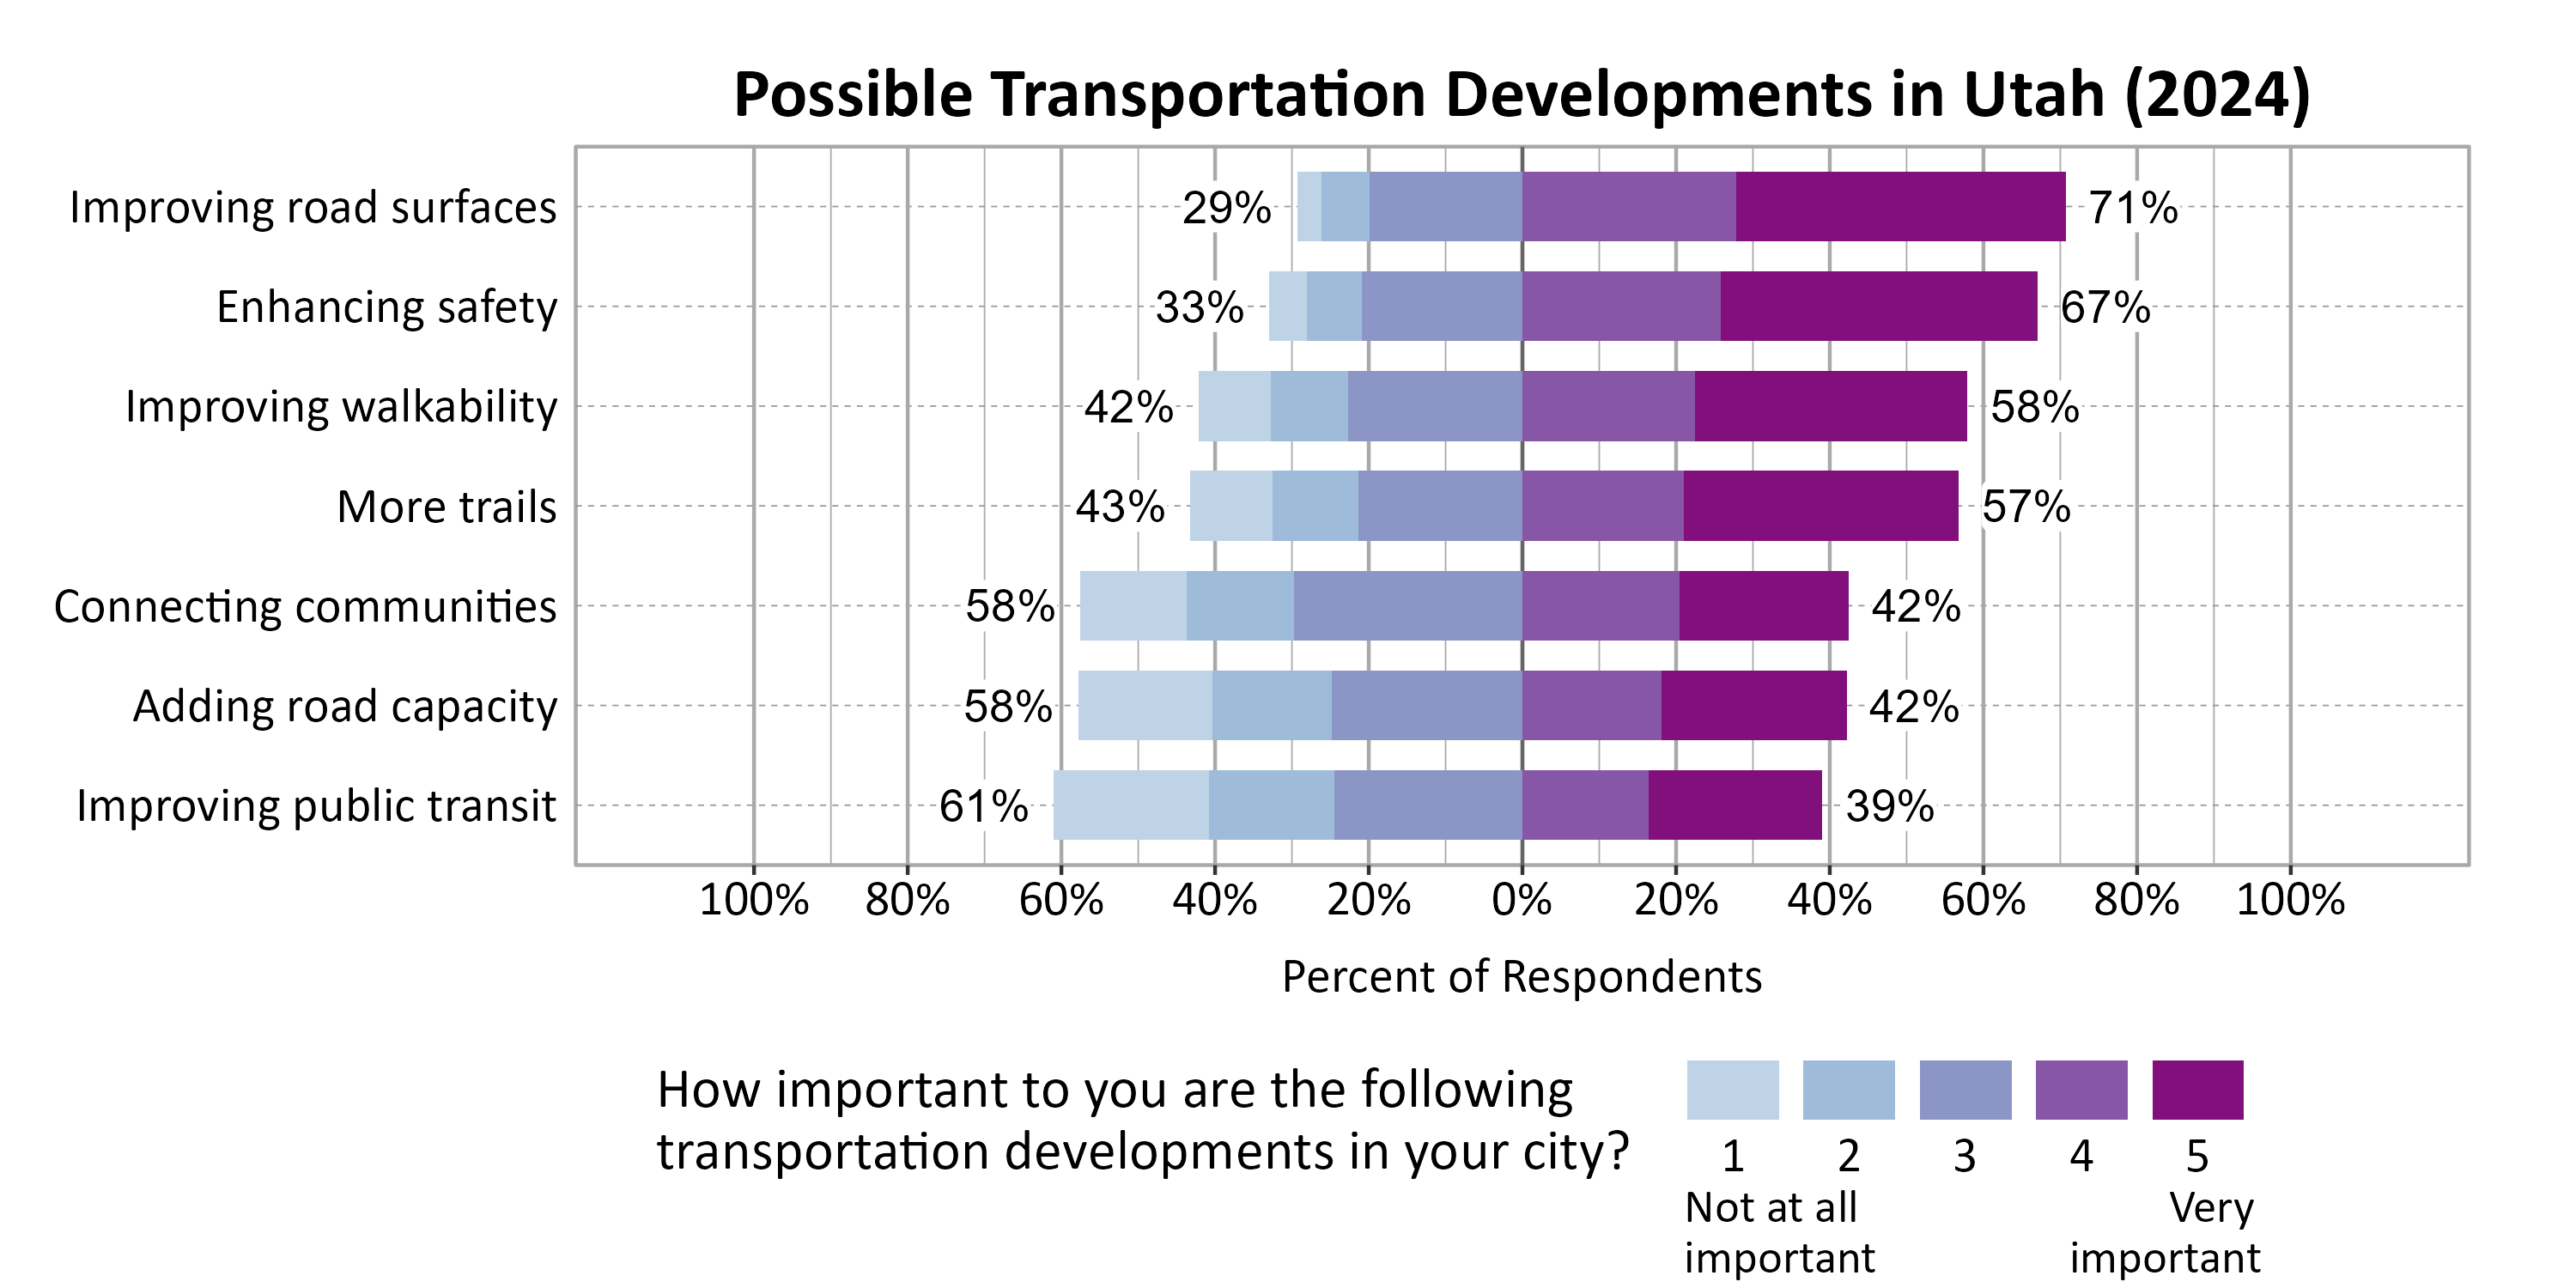
Respondents were asked to indicate the importance of a set of possible transportation developments in their city. Statewide, the most important development to respondents were Improving road surfaces (71%), Enhancing safety (67%), Improving walkability (58%), and More trails (57%).
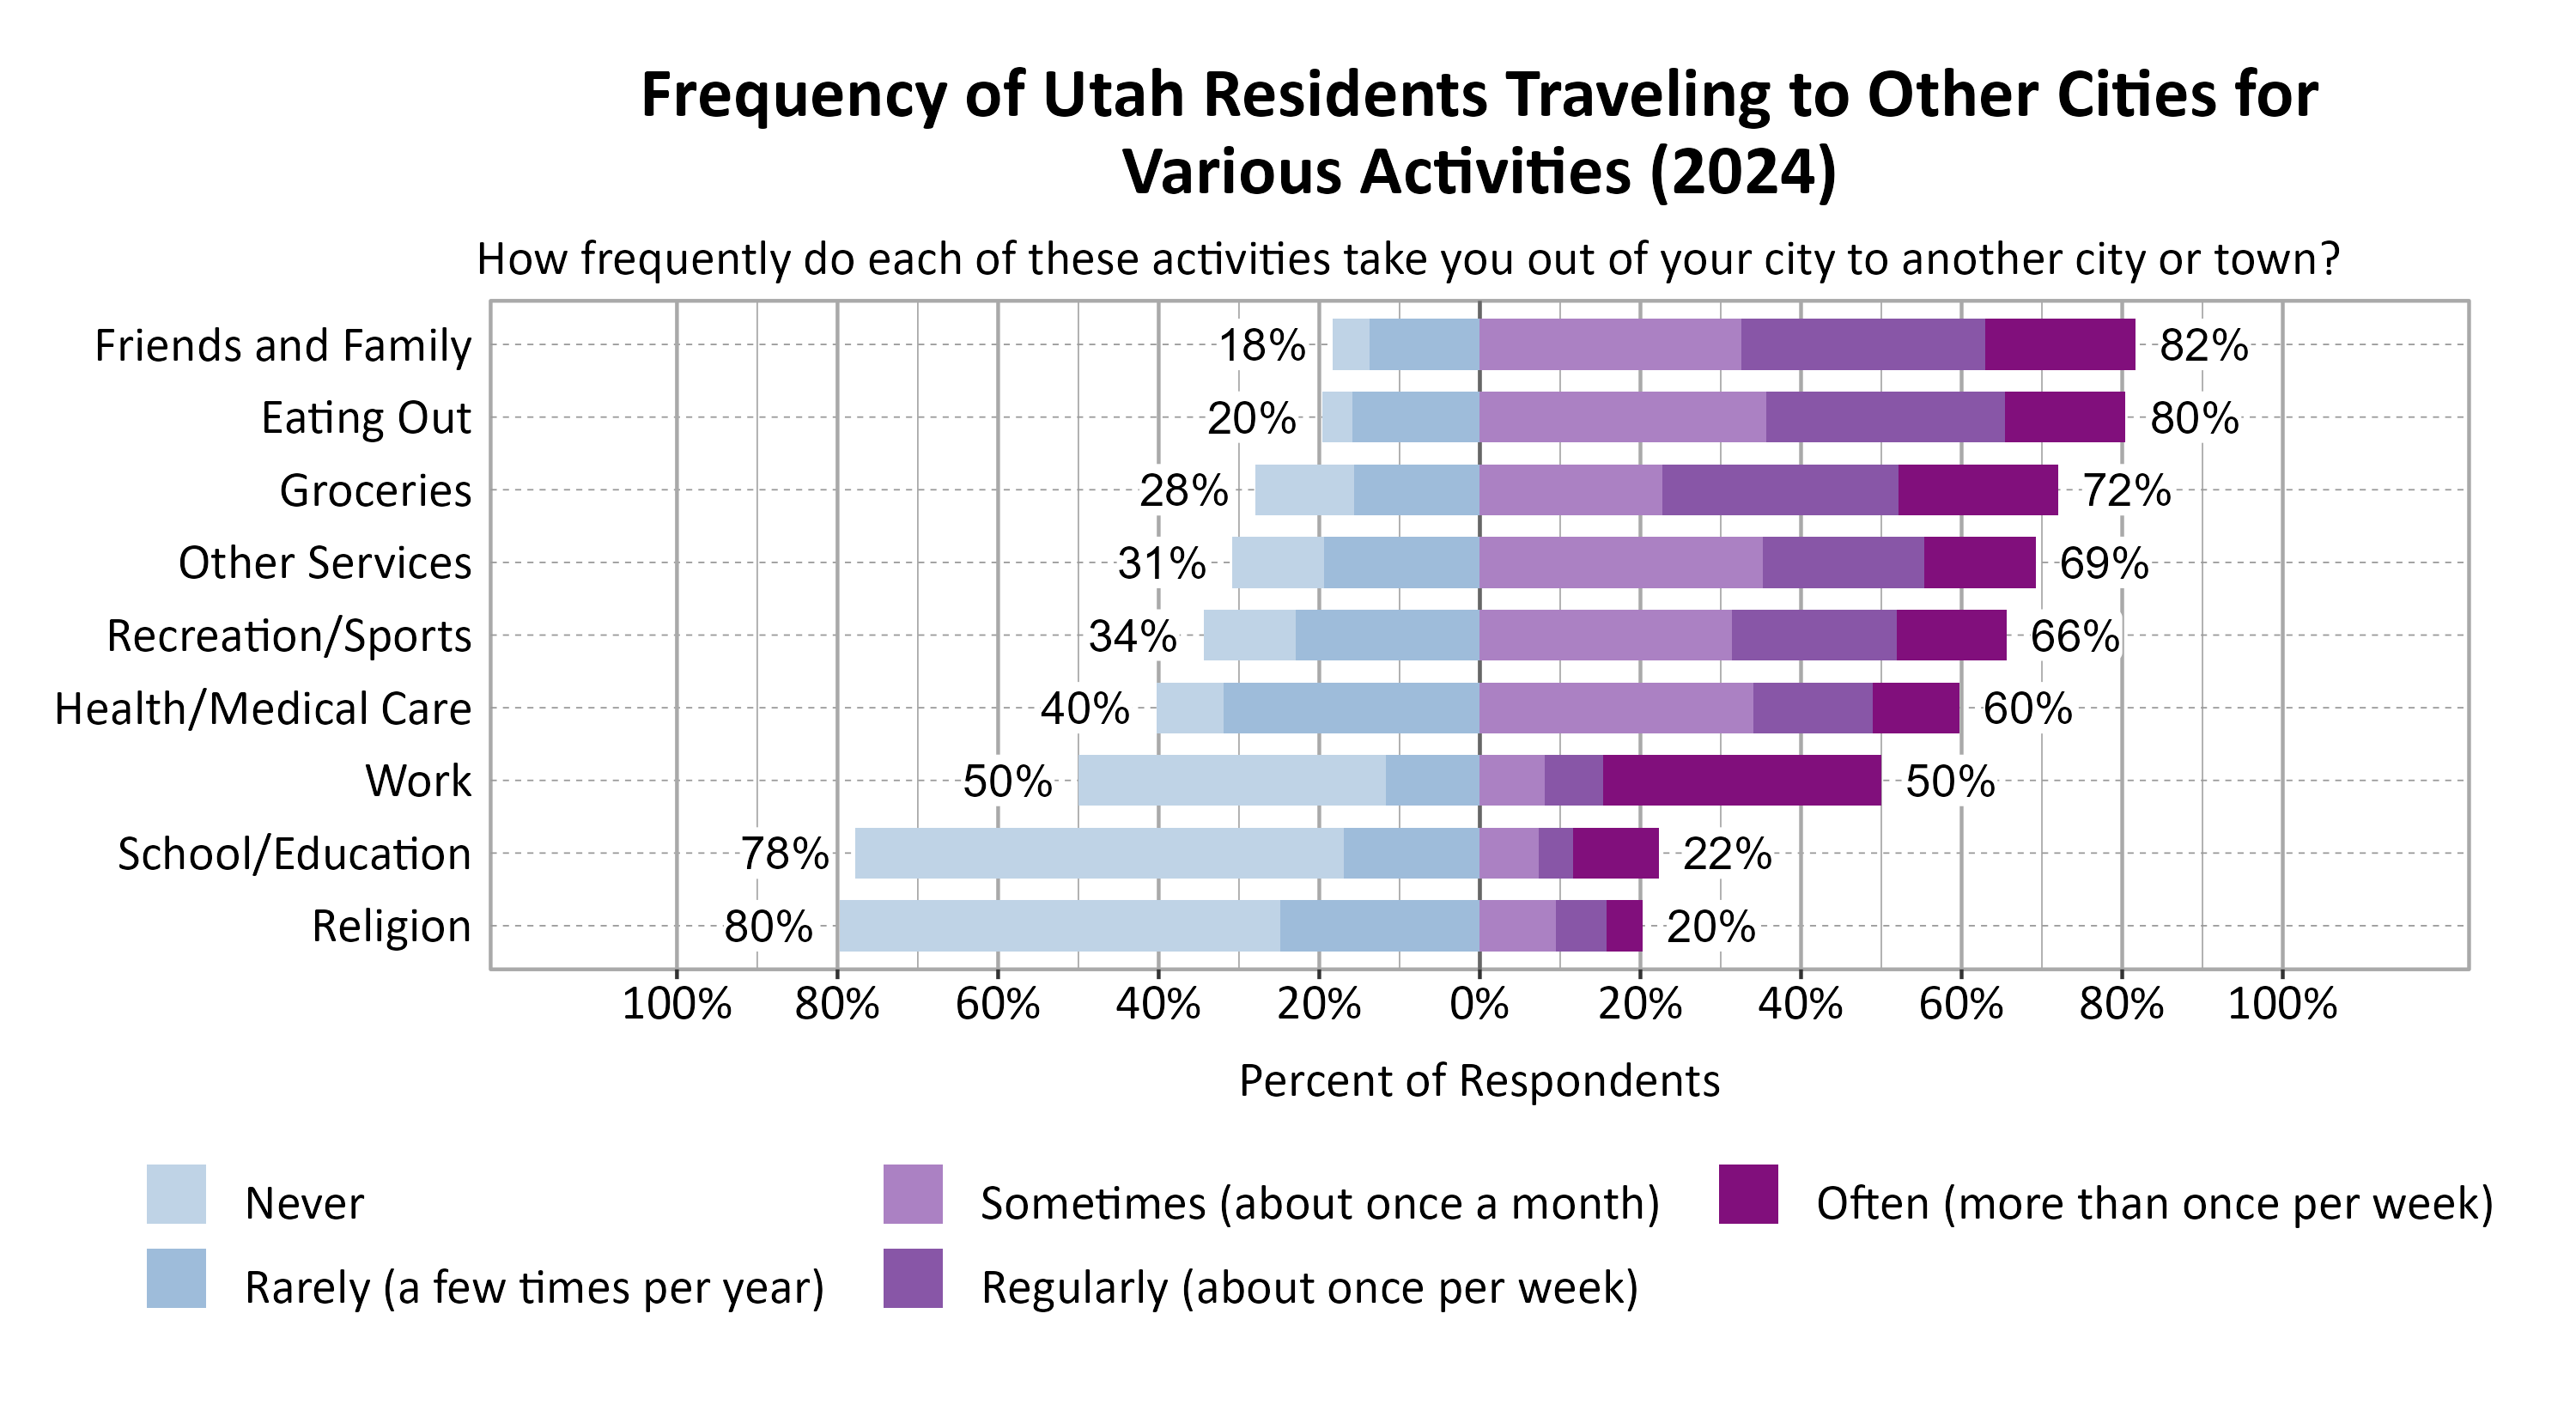
Respondents were asked to indicate how frequently various activities take them out of your city to another city or town. The most commonly indicated reasons for traveling to another city or town at least sometimes or once a month were Friends and Family (82%), Eating Out (80%), and Groceries (72%).
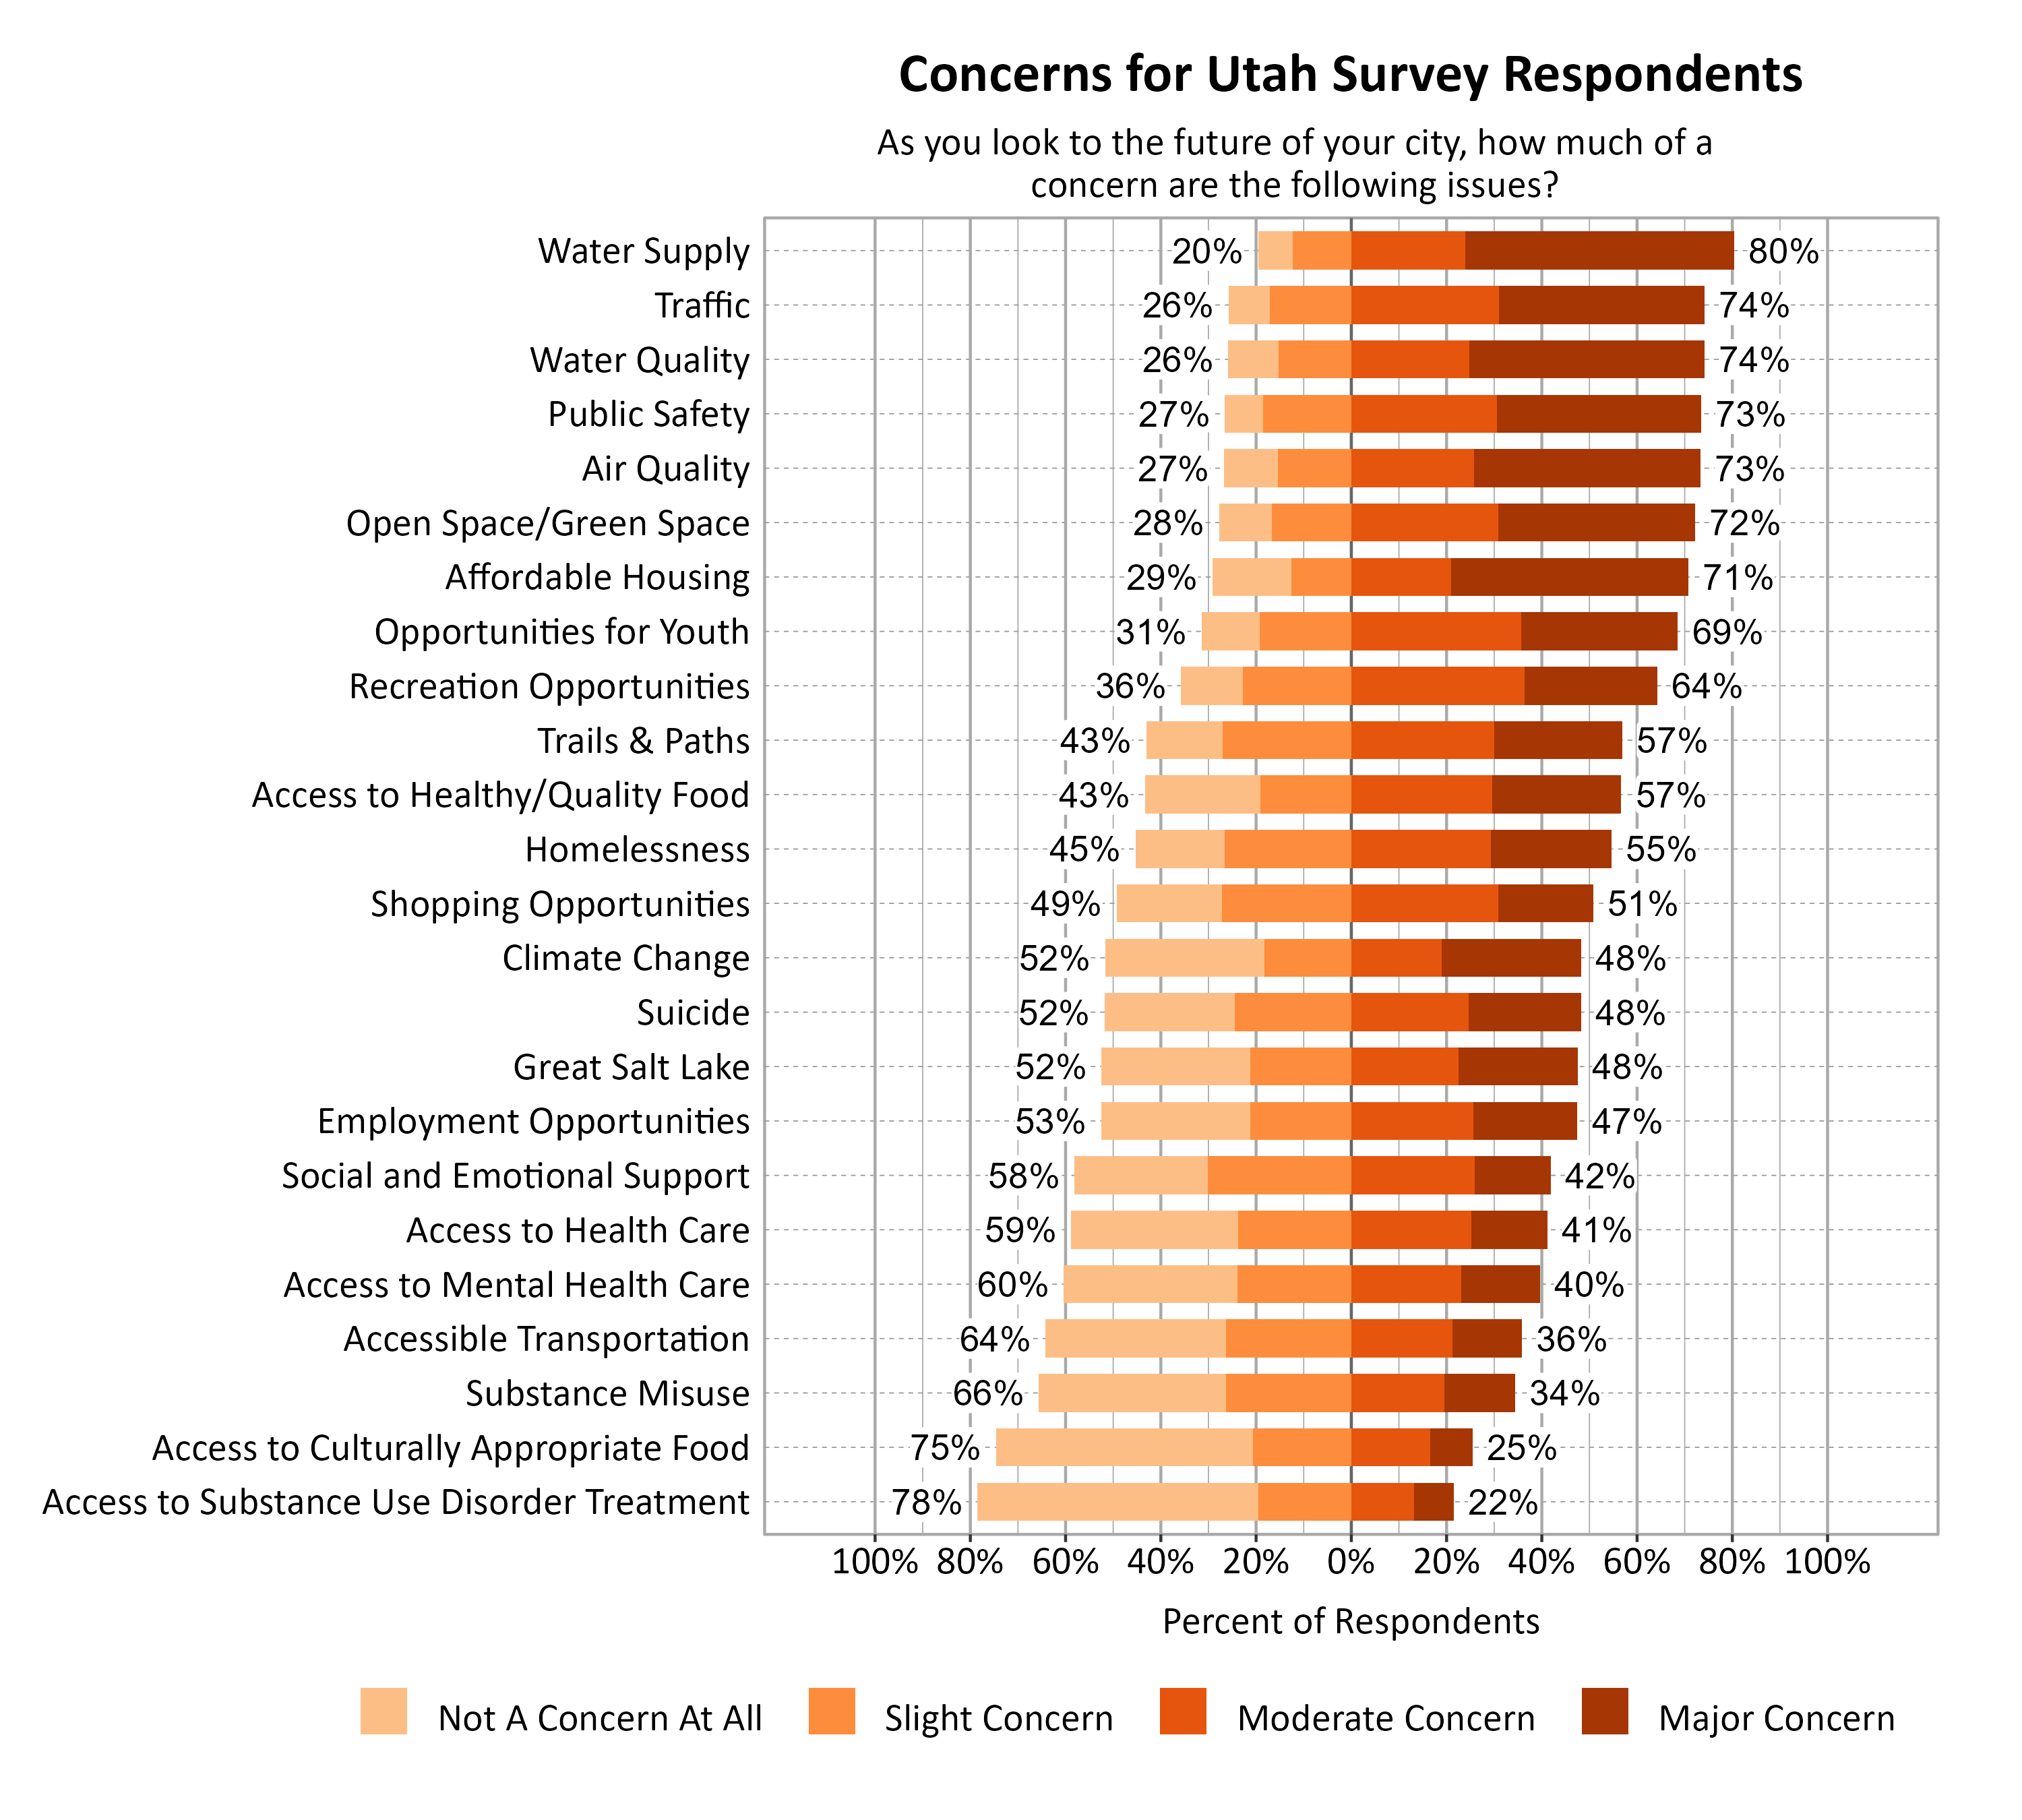
Concerns for the Future of Utah Cities
The graph below shows the aggregate concerns for all 2024 respondents across Utah. Statewide, the top three concerns were Water Supply, Water Quality, and Traffic.
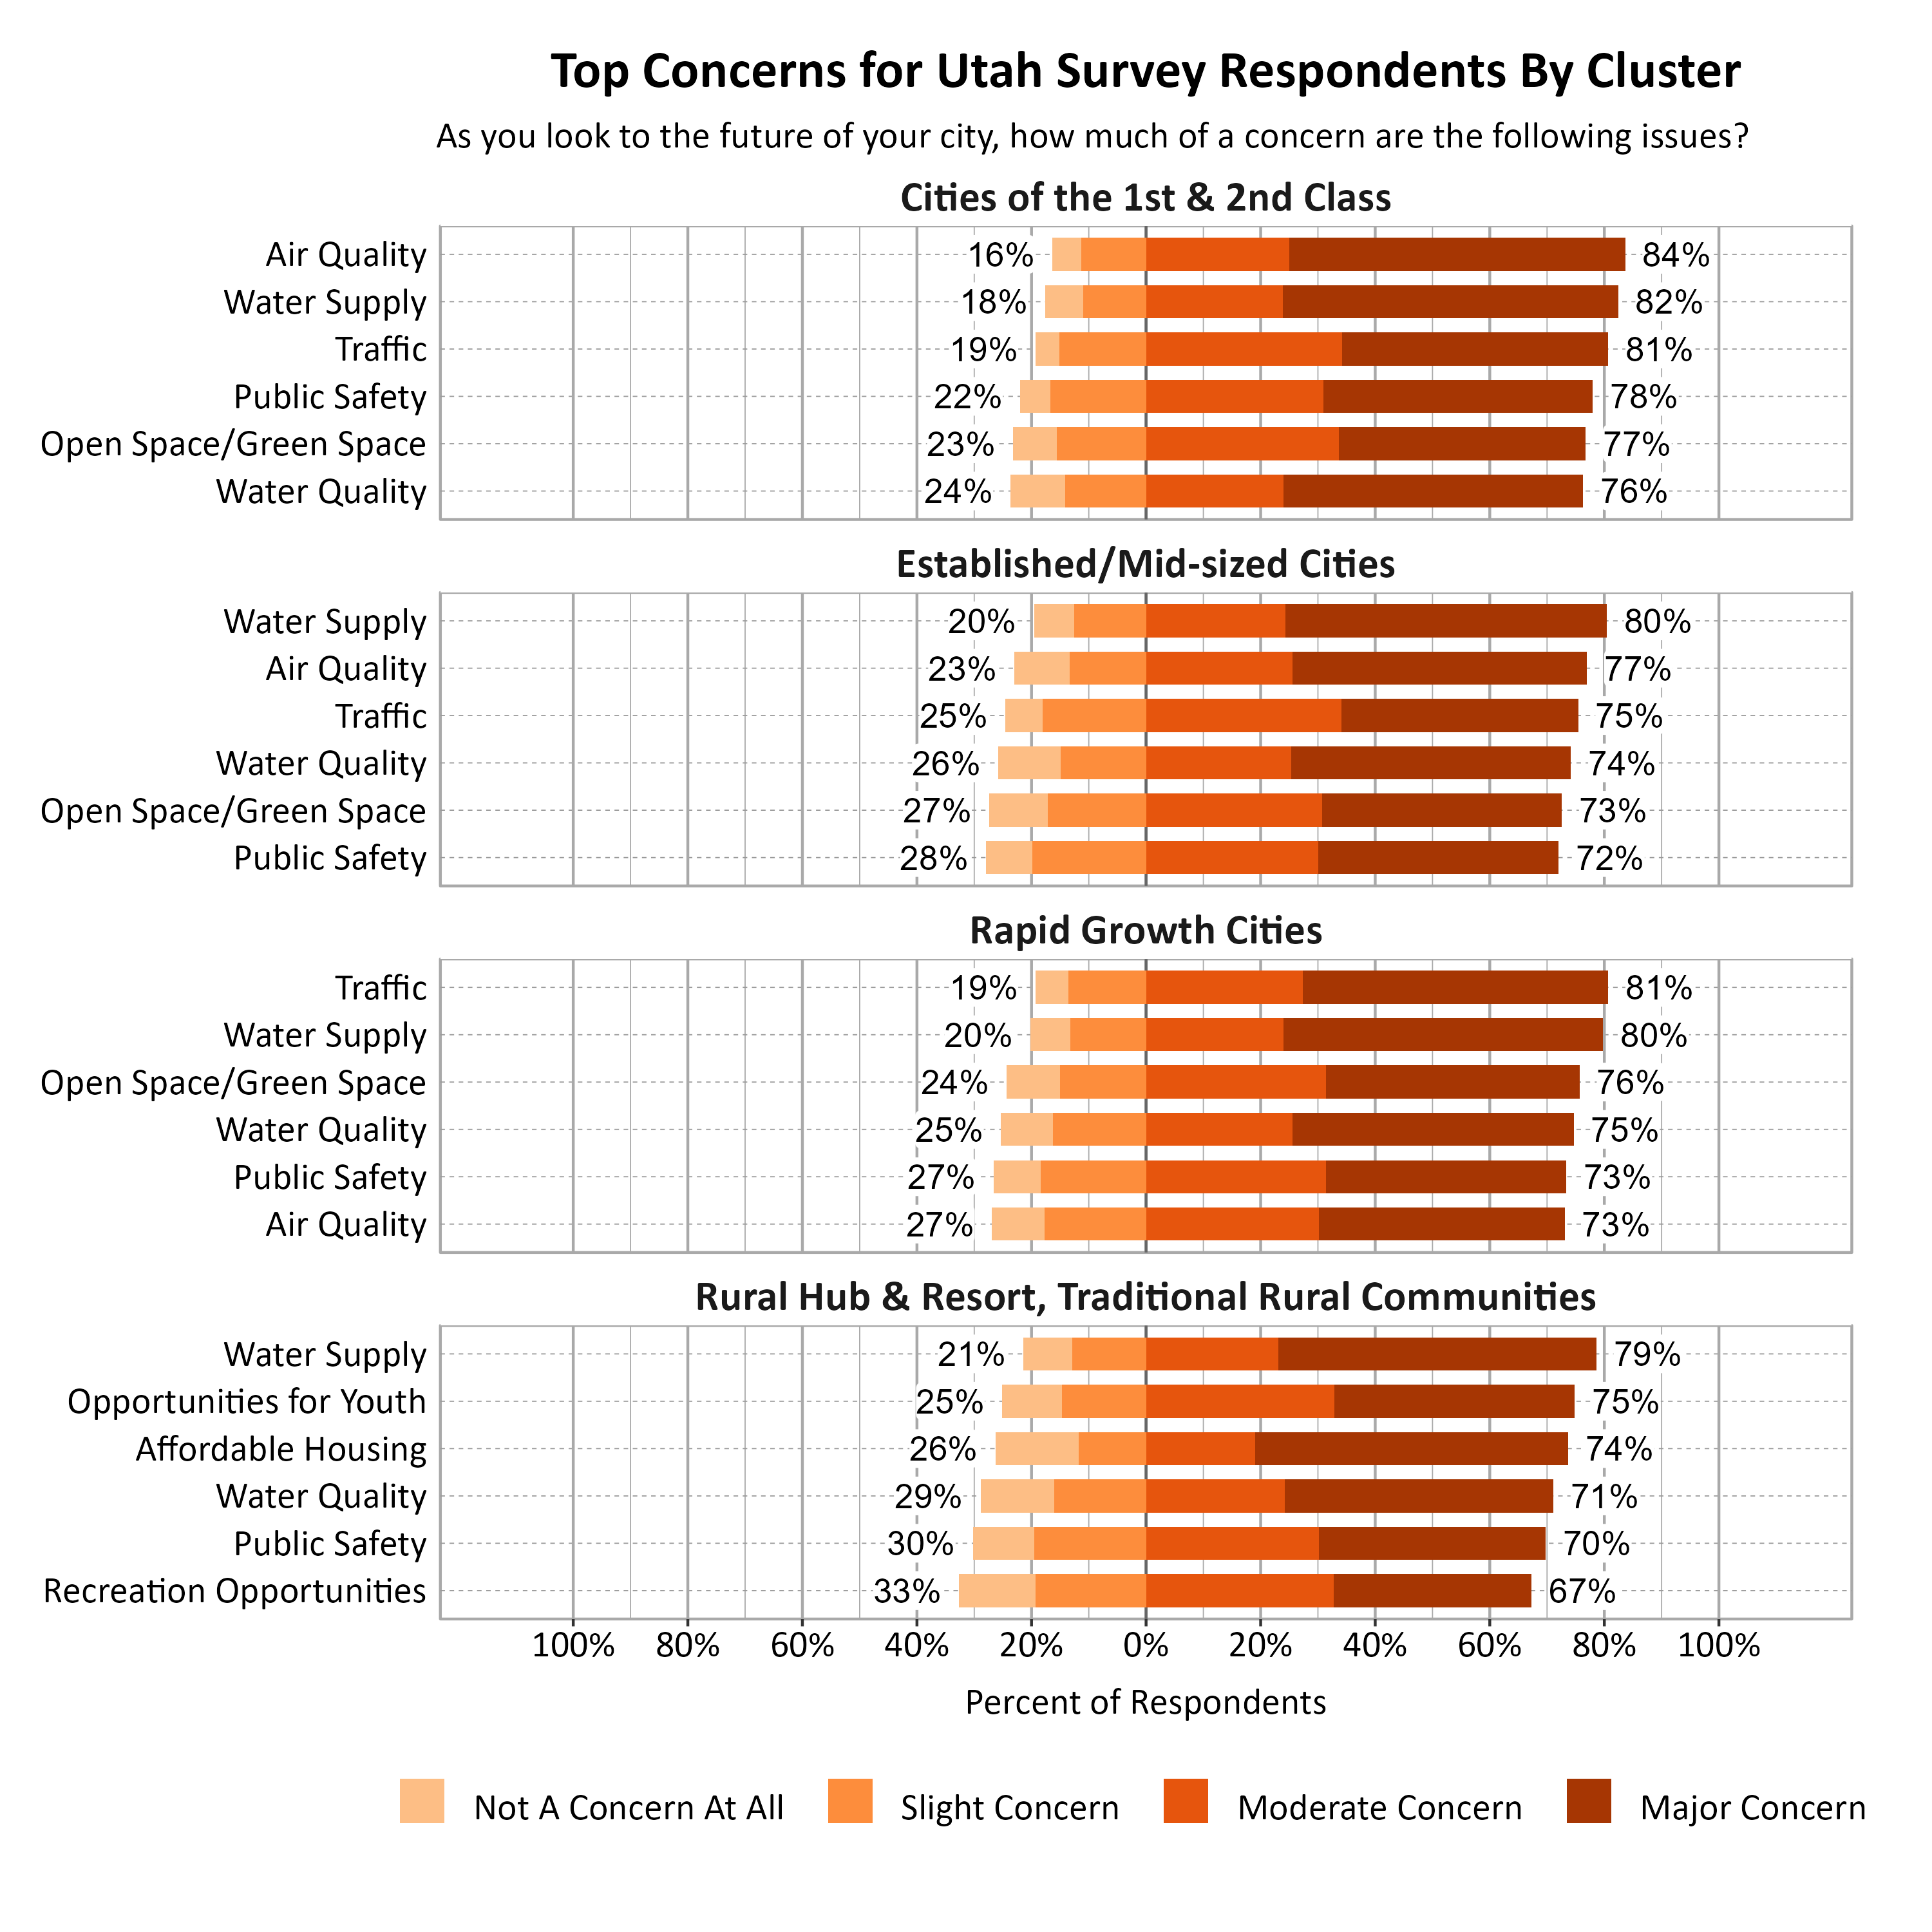
Top concerns also varied across cities and clusters. Concerns for each city are found in their city report. Water Supply, Water Quality, and Public Safety, were in the top 6 concerns across all four city clusters. Traffic, Air Quality, and Open Space/Green Space were in the top concerns for each cluster except the Rural cluster. Opportunities for Youth, Affordable Housing and Recreational Opportunities were other top concerns for the Rural cluster.
Analysis of the 2024 Utah Wellbeing Survey continues and updates will be posted on our website. Please contact us if you have any further questions.