Vernal Wellbeing Survey Findings 2024
By Dr. Courtney Flint and Team
![]()
Contact Information
Dr. Courtney Flint
courtney.flint@usu.edu
435-797-8635
Summary
Vernal is one of 51 cities participating in the Utah Wellbeing Survey Project in 2024. This project is designed to assess the wellbeing and local perspectives of city residents and to provide information to city leaders to inform general planning processes. Additional analysis is underway and this report may be updated over time.
We are grateful to all those who took the survey and to our city partners who helped to make this possible. We are grateful to a number of entities for funding: the Utah League of Cities and Towns, USU Extension, USU’s Institute for Land Water and Air, the Wasatch Front Regional Council, Utah Department of Transportation, the Utah Agricultural Experiment Station, and the cities of Alpine, Cedar Hills, Draper, Millcreek, Nephi, North Salt Lake, Ogden, Orem, Pleasant Grove, Providence, Springdale, Tremonton, West Bountiful, and West Valley City.
This report describes findings from the 2024 Vernal survey and comparative information with other project cities. In March and April 2024, Vernal City advertised the survey for residents largely through social media and coordinating with other local entities. All city residents age 18+ were encouraged to take the online Qualtrics survey.
How many people responded?
- 491 viable surveys were recorded in this 2024 survey effort.
- The Vernal 2021 survey had 98 responses.
- The adult population of Vernal was estimated at 6,971, based on the American Community Survey by the U.S. Census. The 491 survey responses in 2024 represent 7.0% of the adult population and have a conservative margin of error of 4.26%.
Survey Respondent Characteristics
| Resident Statistics | |
|---|---|
| Full Time Residents of Vernal | 97.1% |
| Part Time Residents of Vernal | 2.9% |
| Length of Residency — Range | 0.5-84 years |
| Length of Residency — Average | 22.9 years |
| Length of Residency — Median | 20 years |
| Length of Residency 5 Years or less | 18.4% |
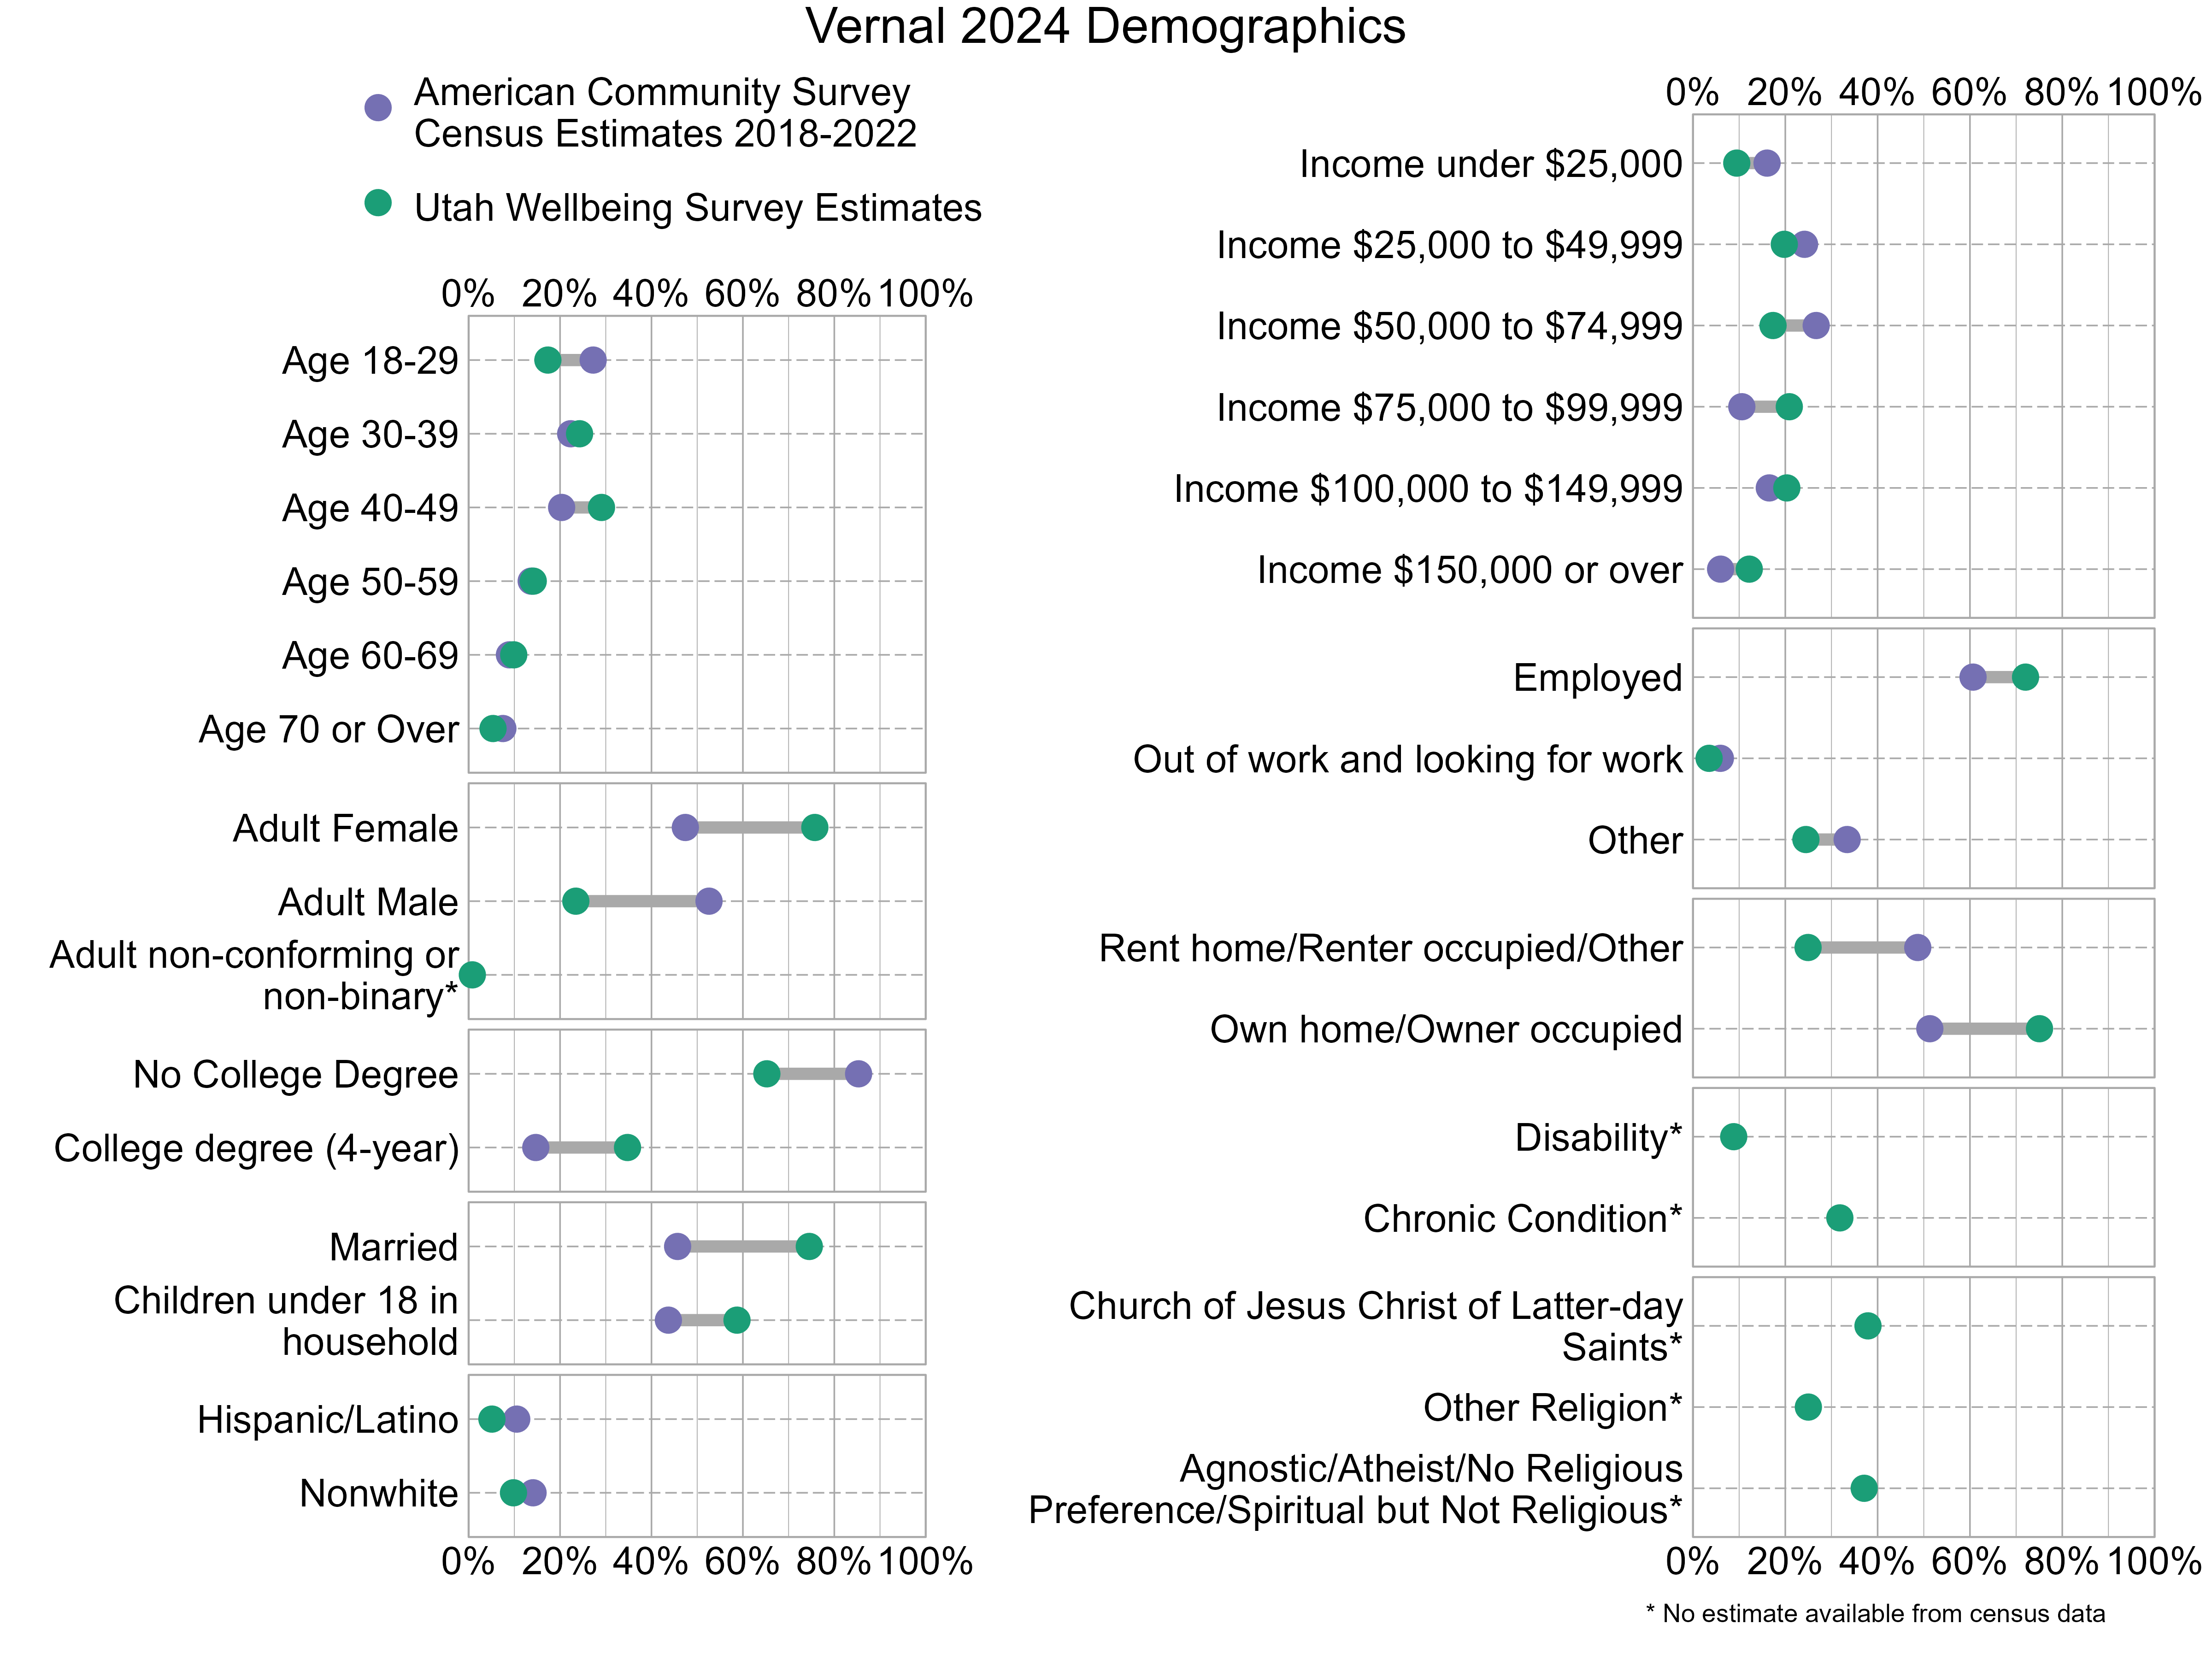
Demographic characteristics of the survey respondents were compared below with U.S. Census information from the 2018-2022 American Community Survey. In the graph below, gray bars indicate differences between the American Community Survey estimates and the Utah Wellbeing Project surveys. The wider the gray bars, the larger the differences. Also note that estimates for religious affiliation, adult non-conforming or non-binary gender, disability, and chronic conditions are unavailable from the census data. There can also be a variable margin of error in the American Community Survey estimates, and caution should be used when comparing estimates. Not all respondents provided demographic information. As the graph shows, 2024 survey respondents were not fully representative of Vernal. People who are adult females, have at least a 4-year college degree, are married, have children under 18 in their household, and own their homes were overrepresented while those who are adult males, do not have a college degree, and are renters were underrepresented.
Overall Personal Wellbeing and Overall Wellbeing in Vernal
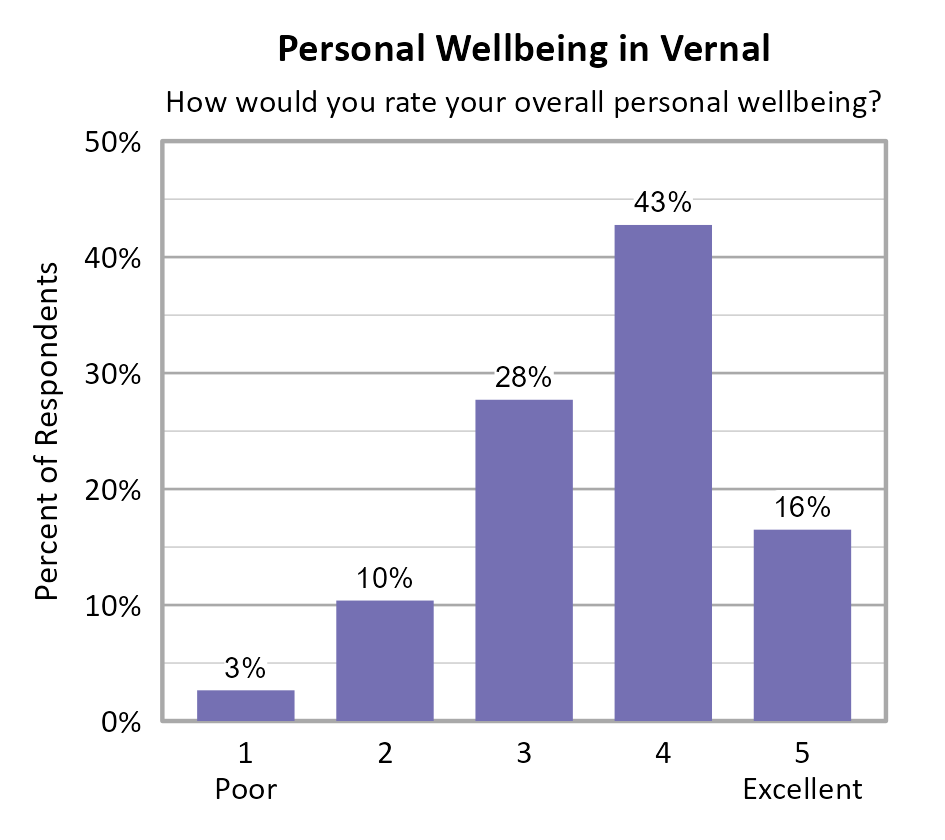
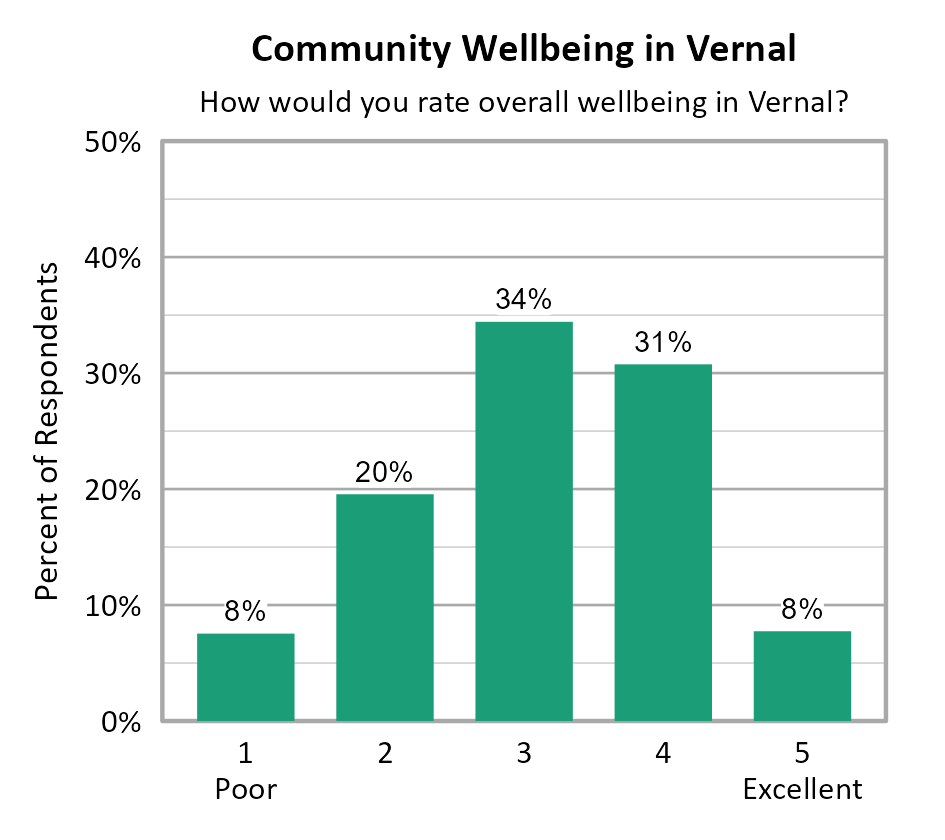
Survey participants were asked about their overall personal wellbeing and overall community wellbeing in Vernal. These wellbeing indicators were both measured on a 5-point scale from poor (1) to excellent (5). The average personal wellbeing score in Vernal was 3.60 with 59% of respondents indicating their wellbeing at a 4 or 5 on the 5-point scale. The average score for community wellbeing in Vernal was 3.12 with 38% of respondents indicating community wellbeing at a 4 or 5 on the 5-point scale.
When comparing survey data from Vernal over the years as shown in the information below, we can see that both the average personal wellbeing score and the average community wellbeing score declined between 2021 and 2024. Note that the number of respondents differed between years, there is no tracking of individuals from one year to the next, and the low end of the scale was "Poor" in 2024 but "Very Poor" in prior years which may account for differences in scores over time.

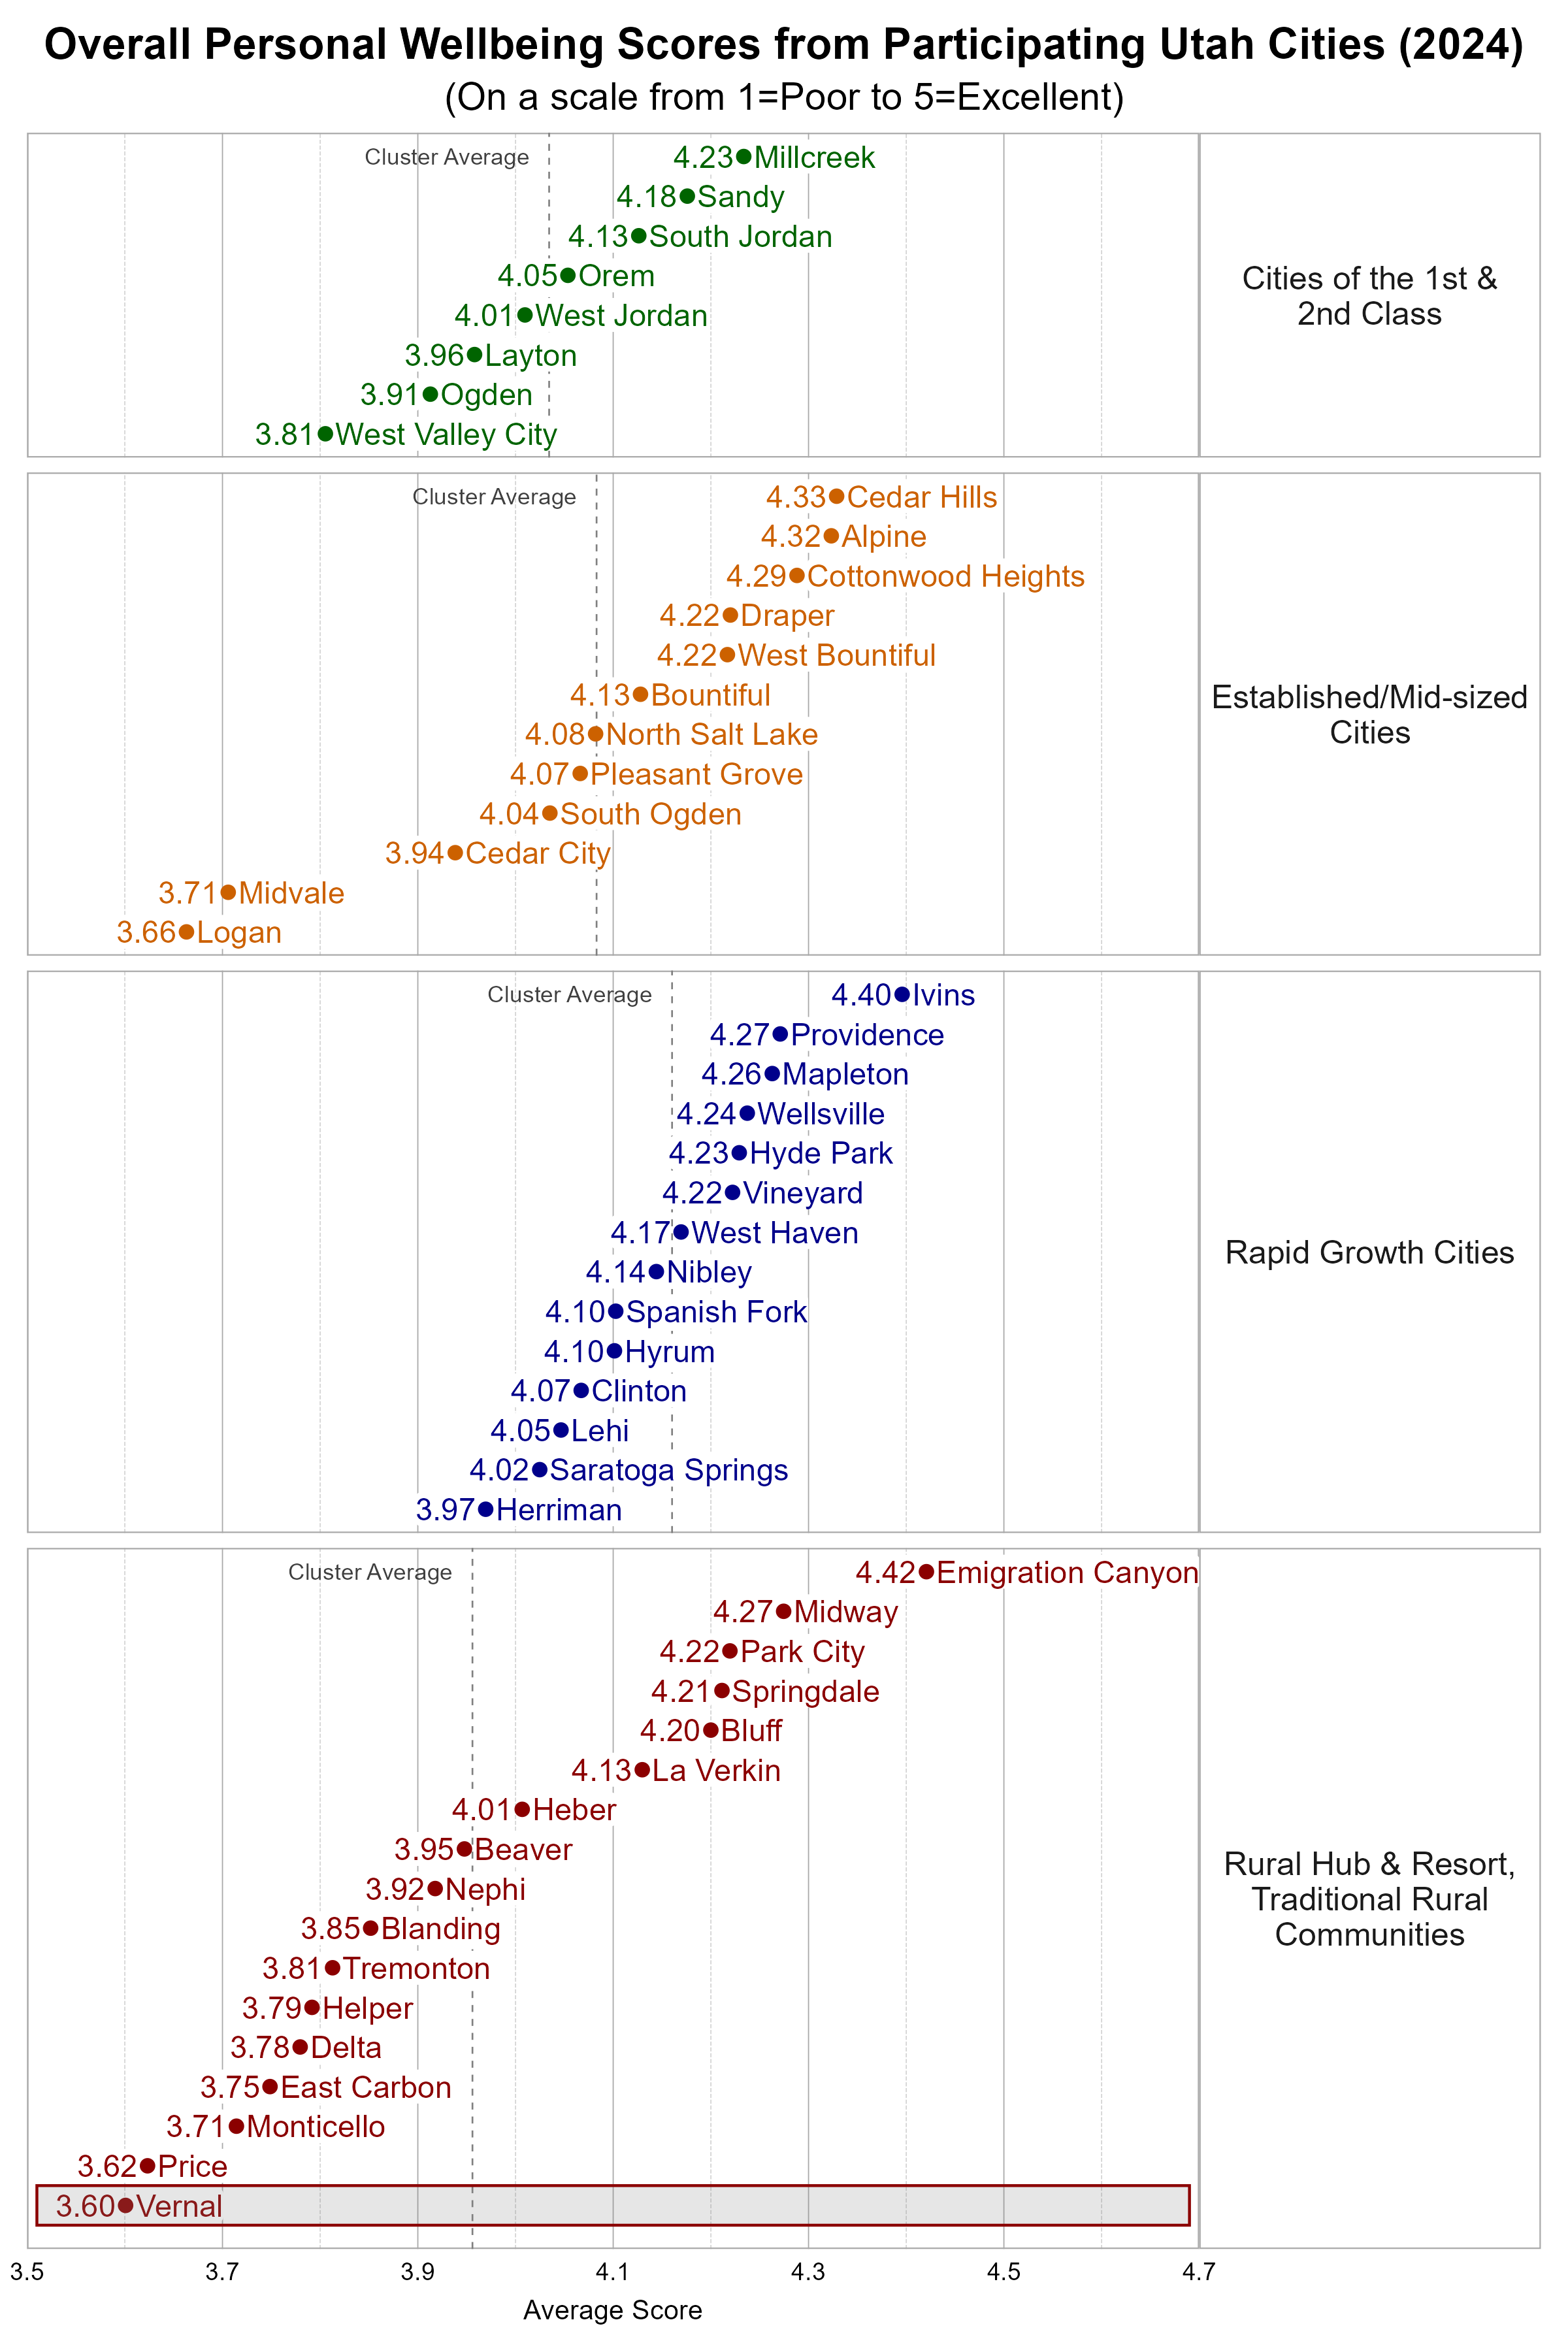
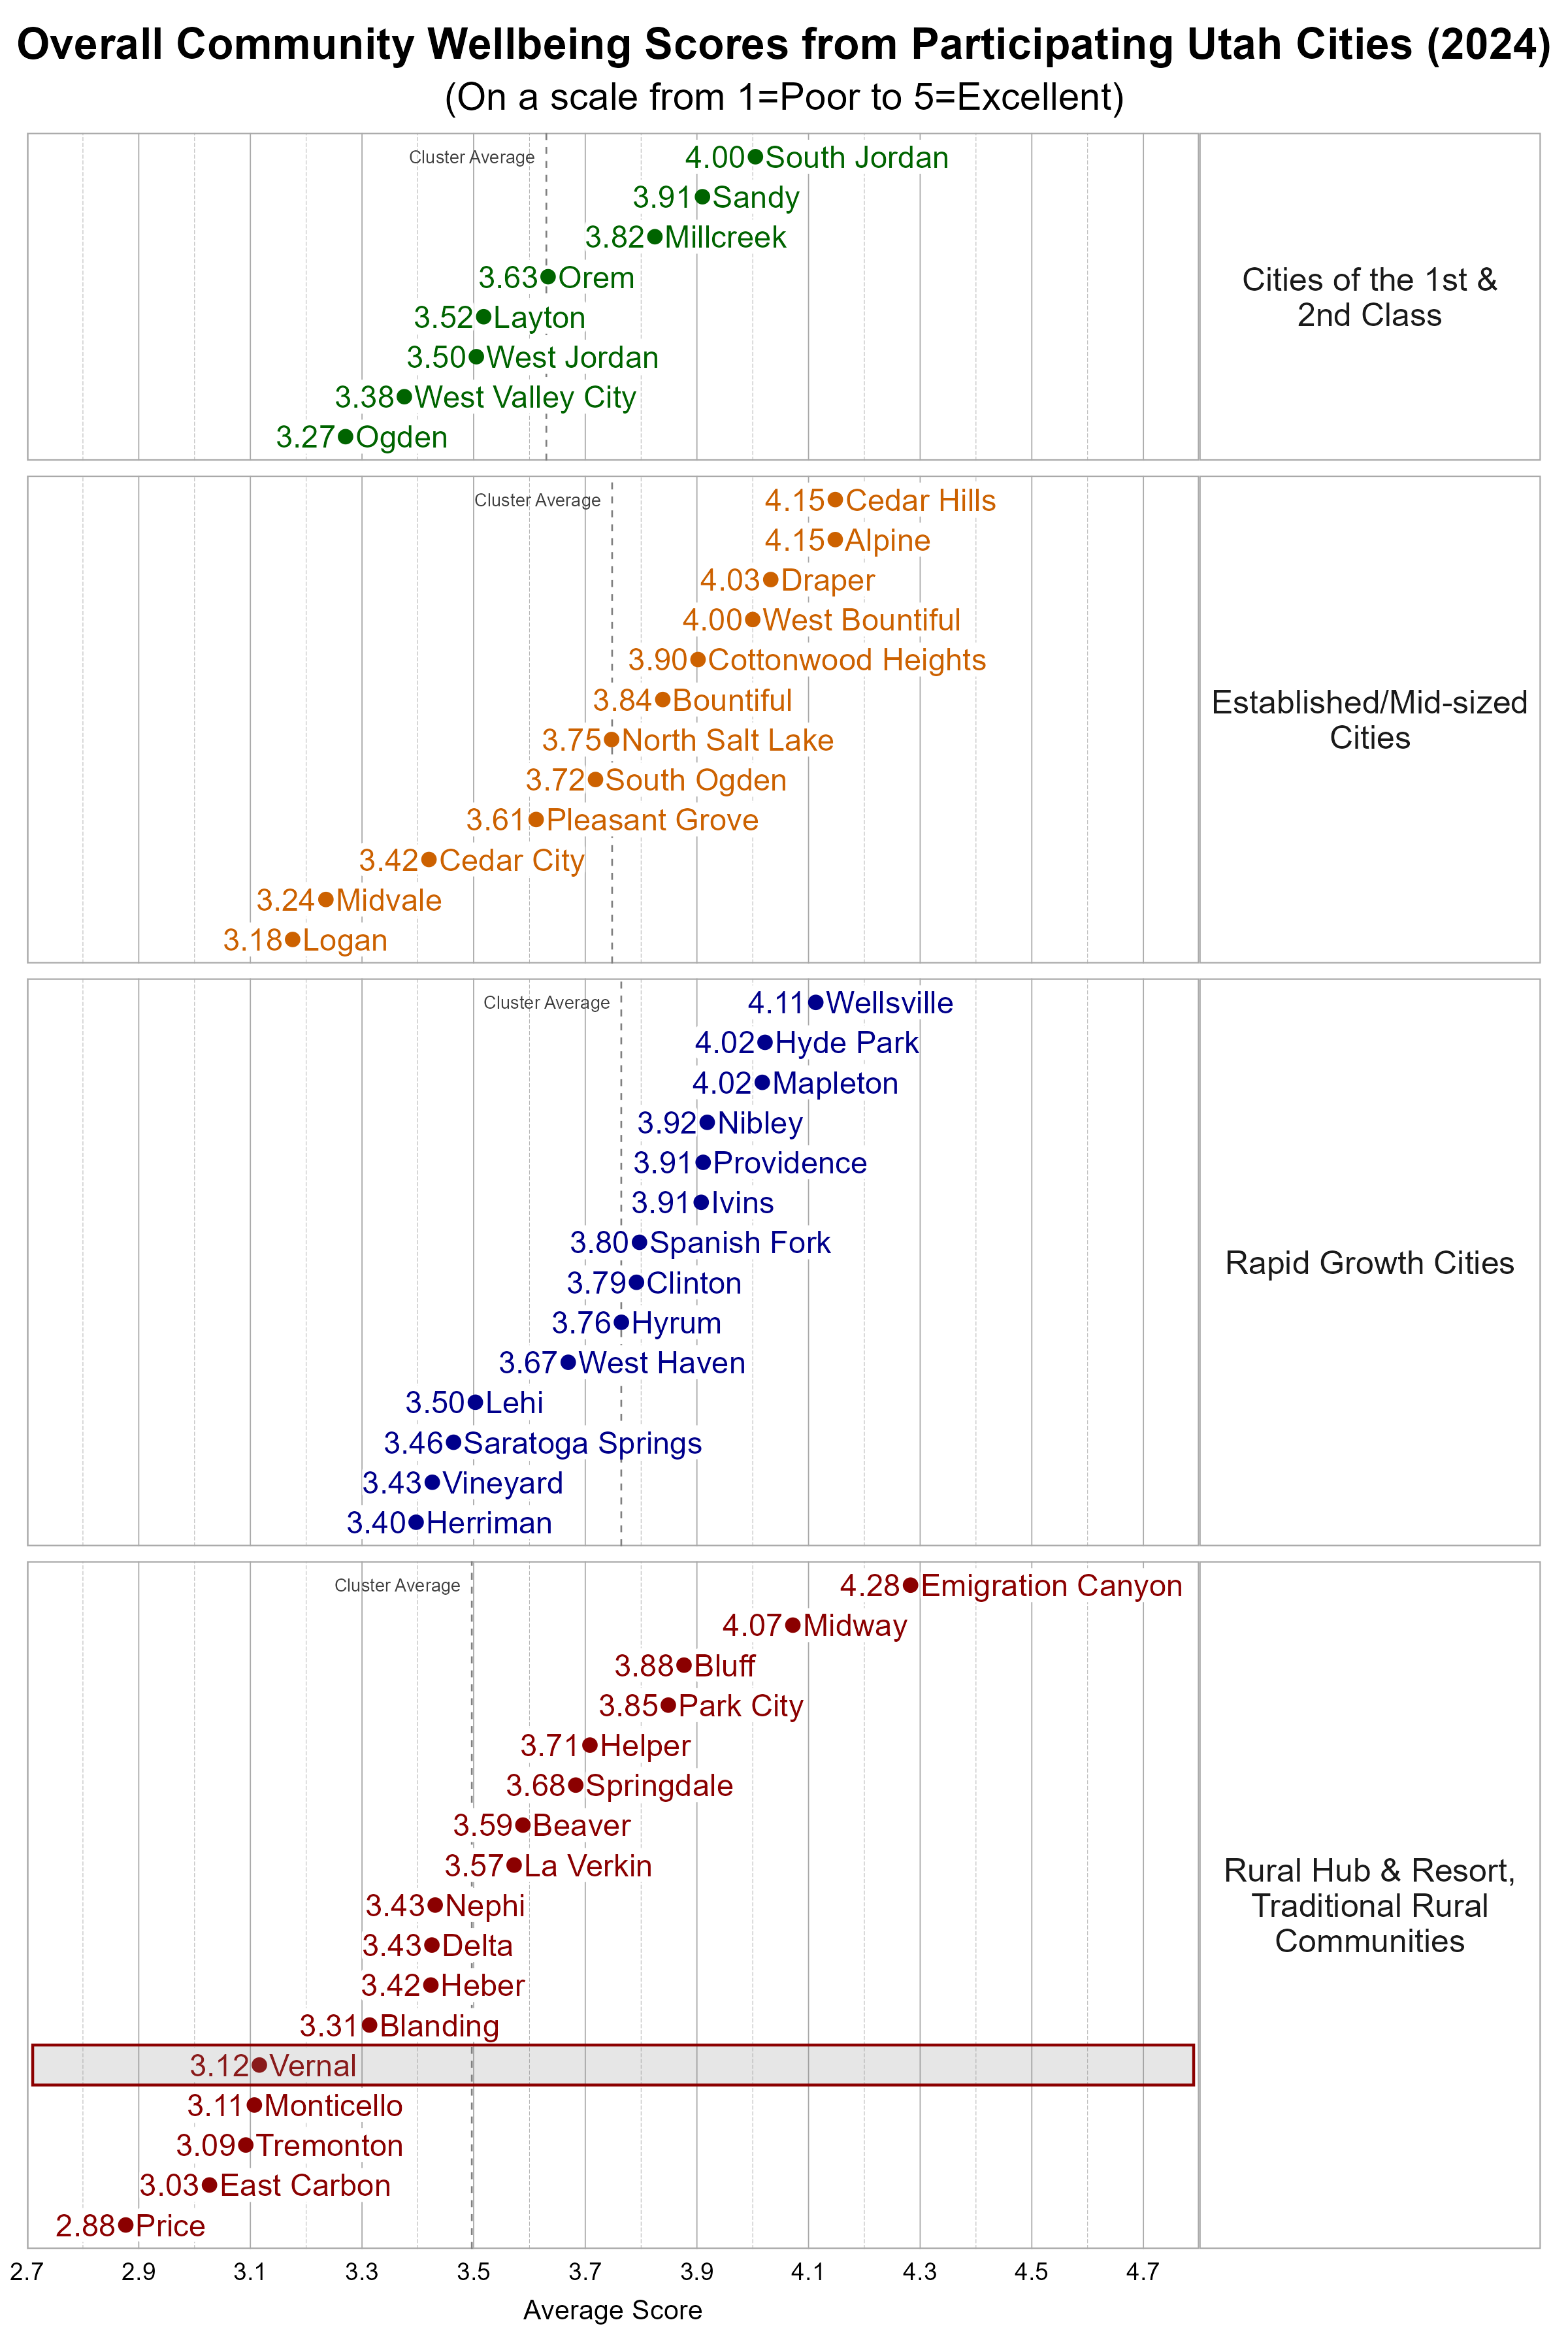
Comparing Wellbeing Across Utah Cities
The Utah League of Cities and Towns clusters cities and towns into five different categories based on size and growth rates. We utilize these clusters in our analysis. Vernal is classified as a Rural Hub/Resort Community (and we have combined these with the Traditional Rural Communities). Some cities may fit within more than one cluster.
Within the Rural city cluster, Vernal was below the average overall personal wellbeing score and below the average overall community wellbeing score.
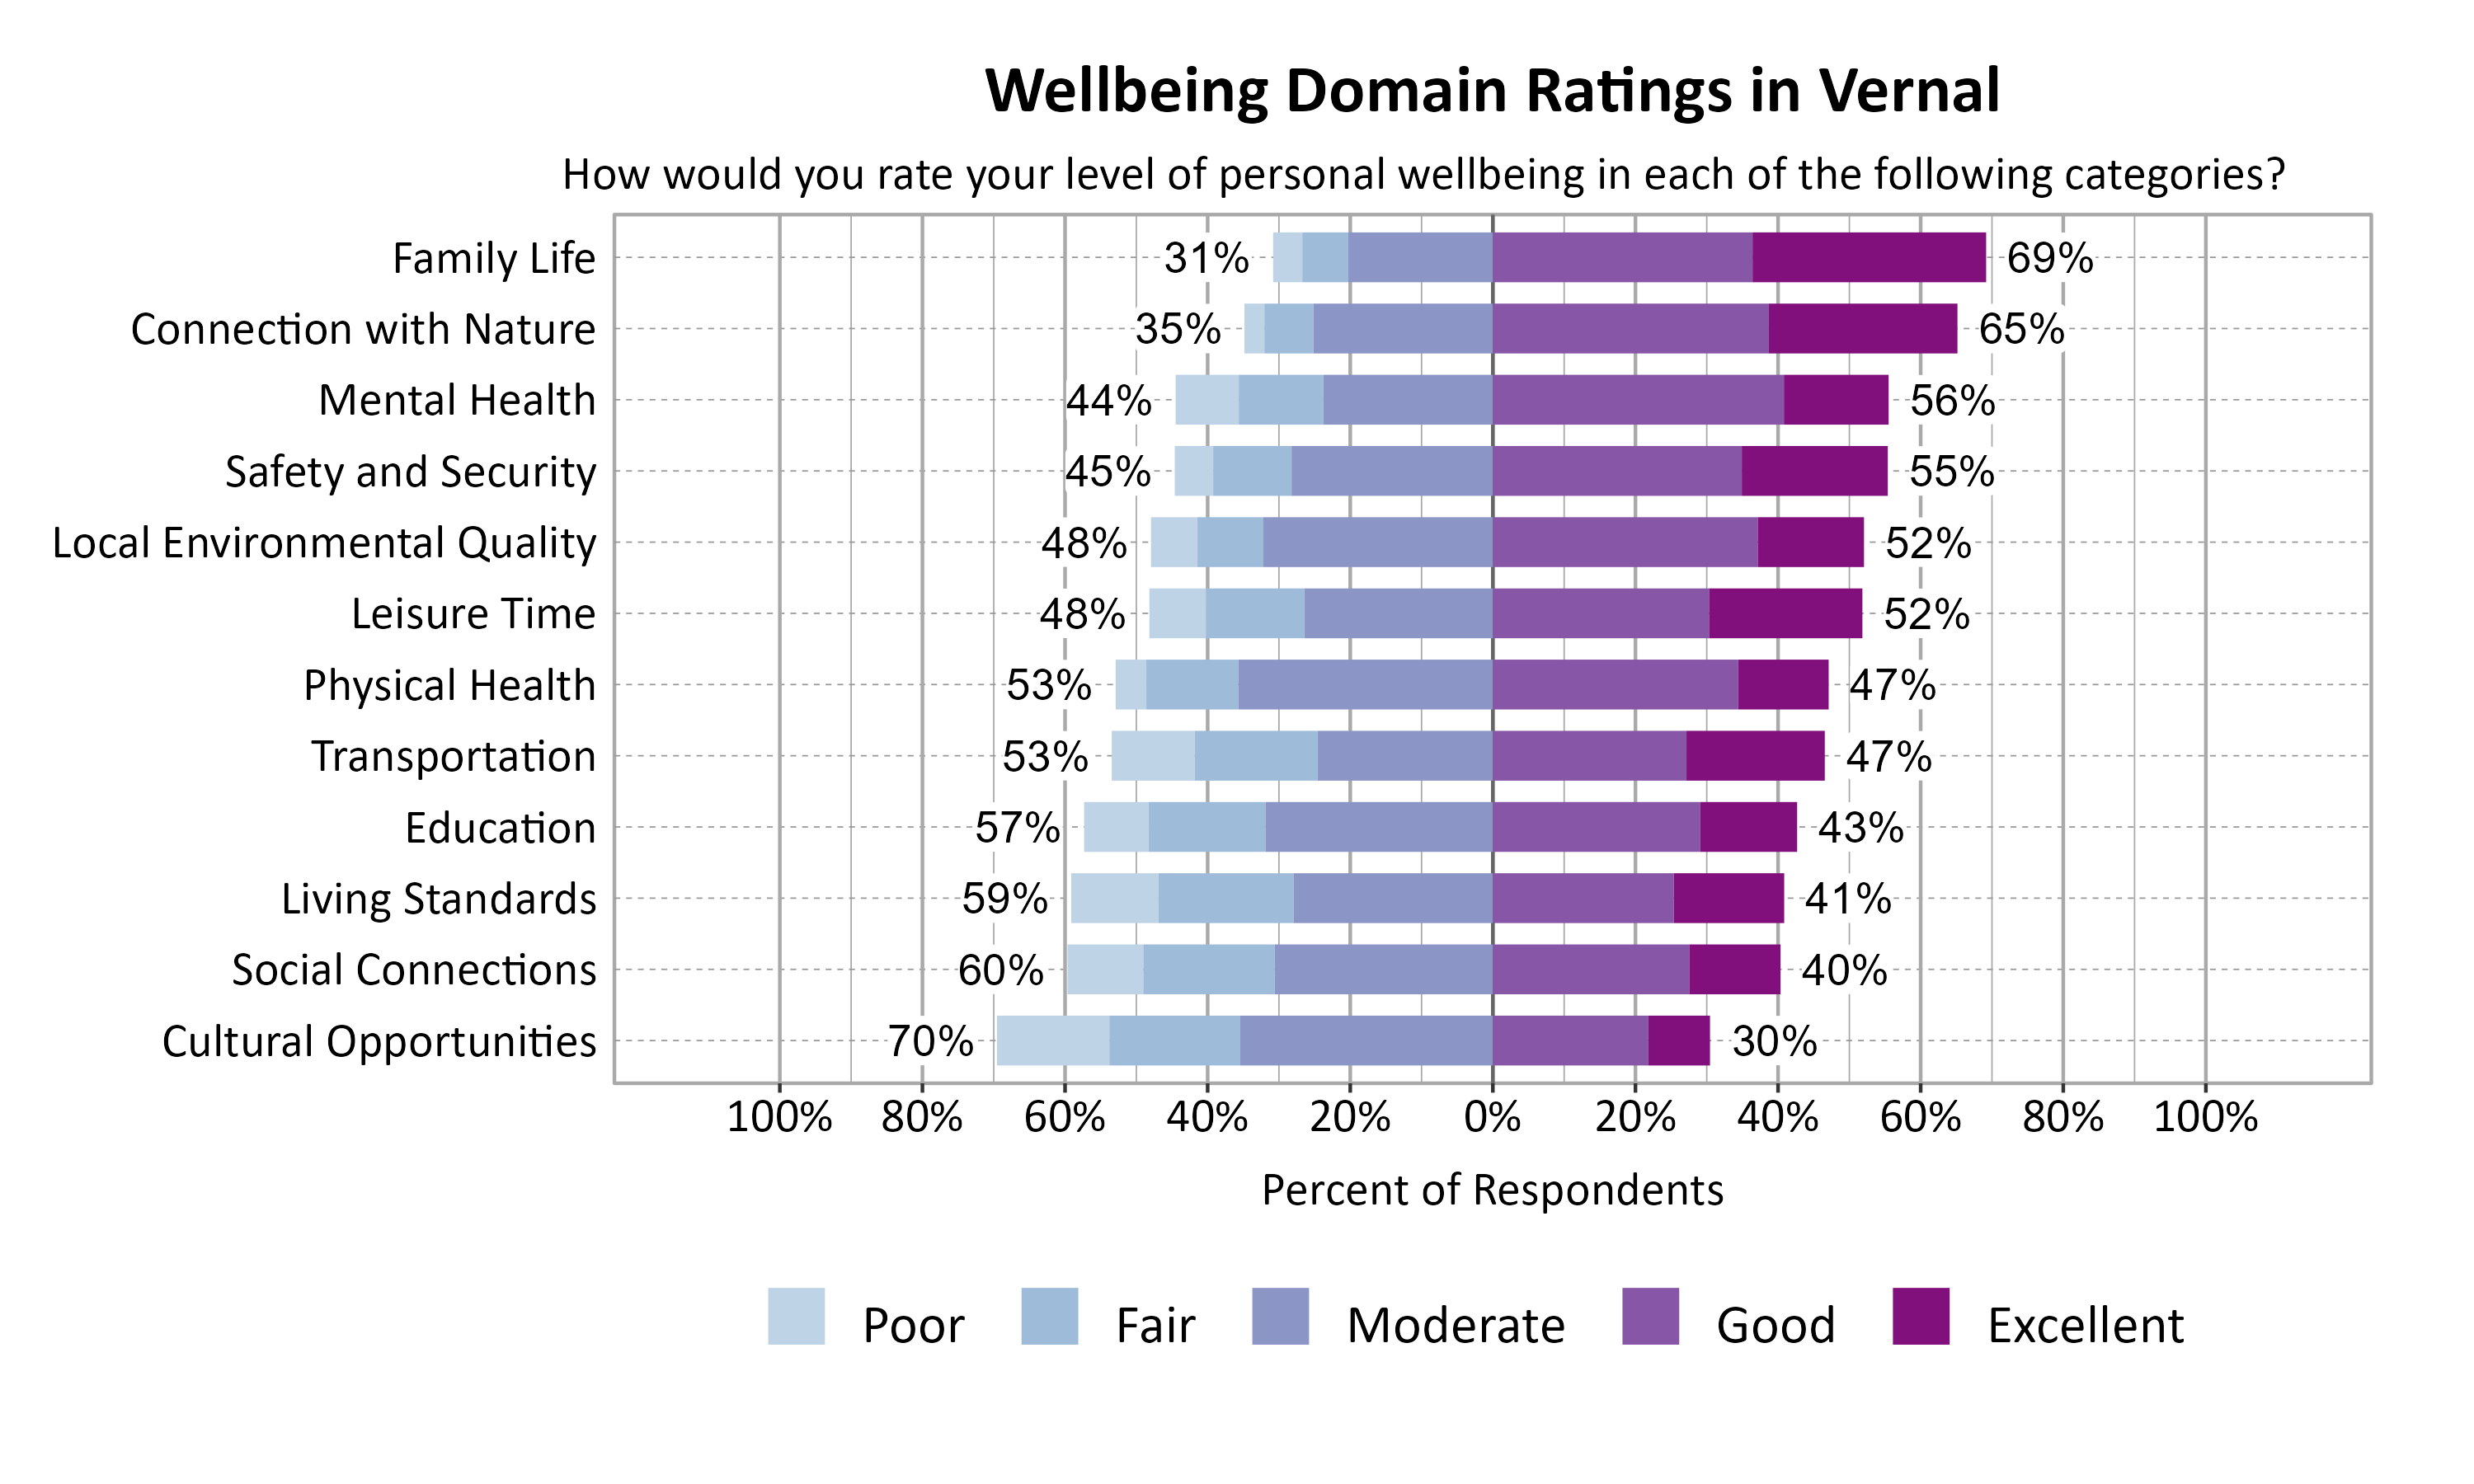
Wellbeing Domains in Vernal
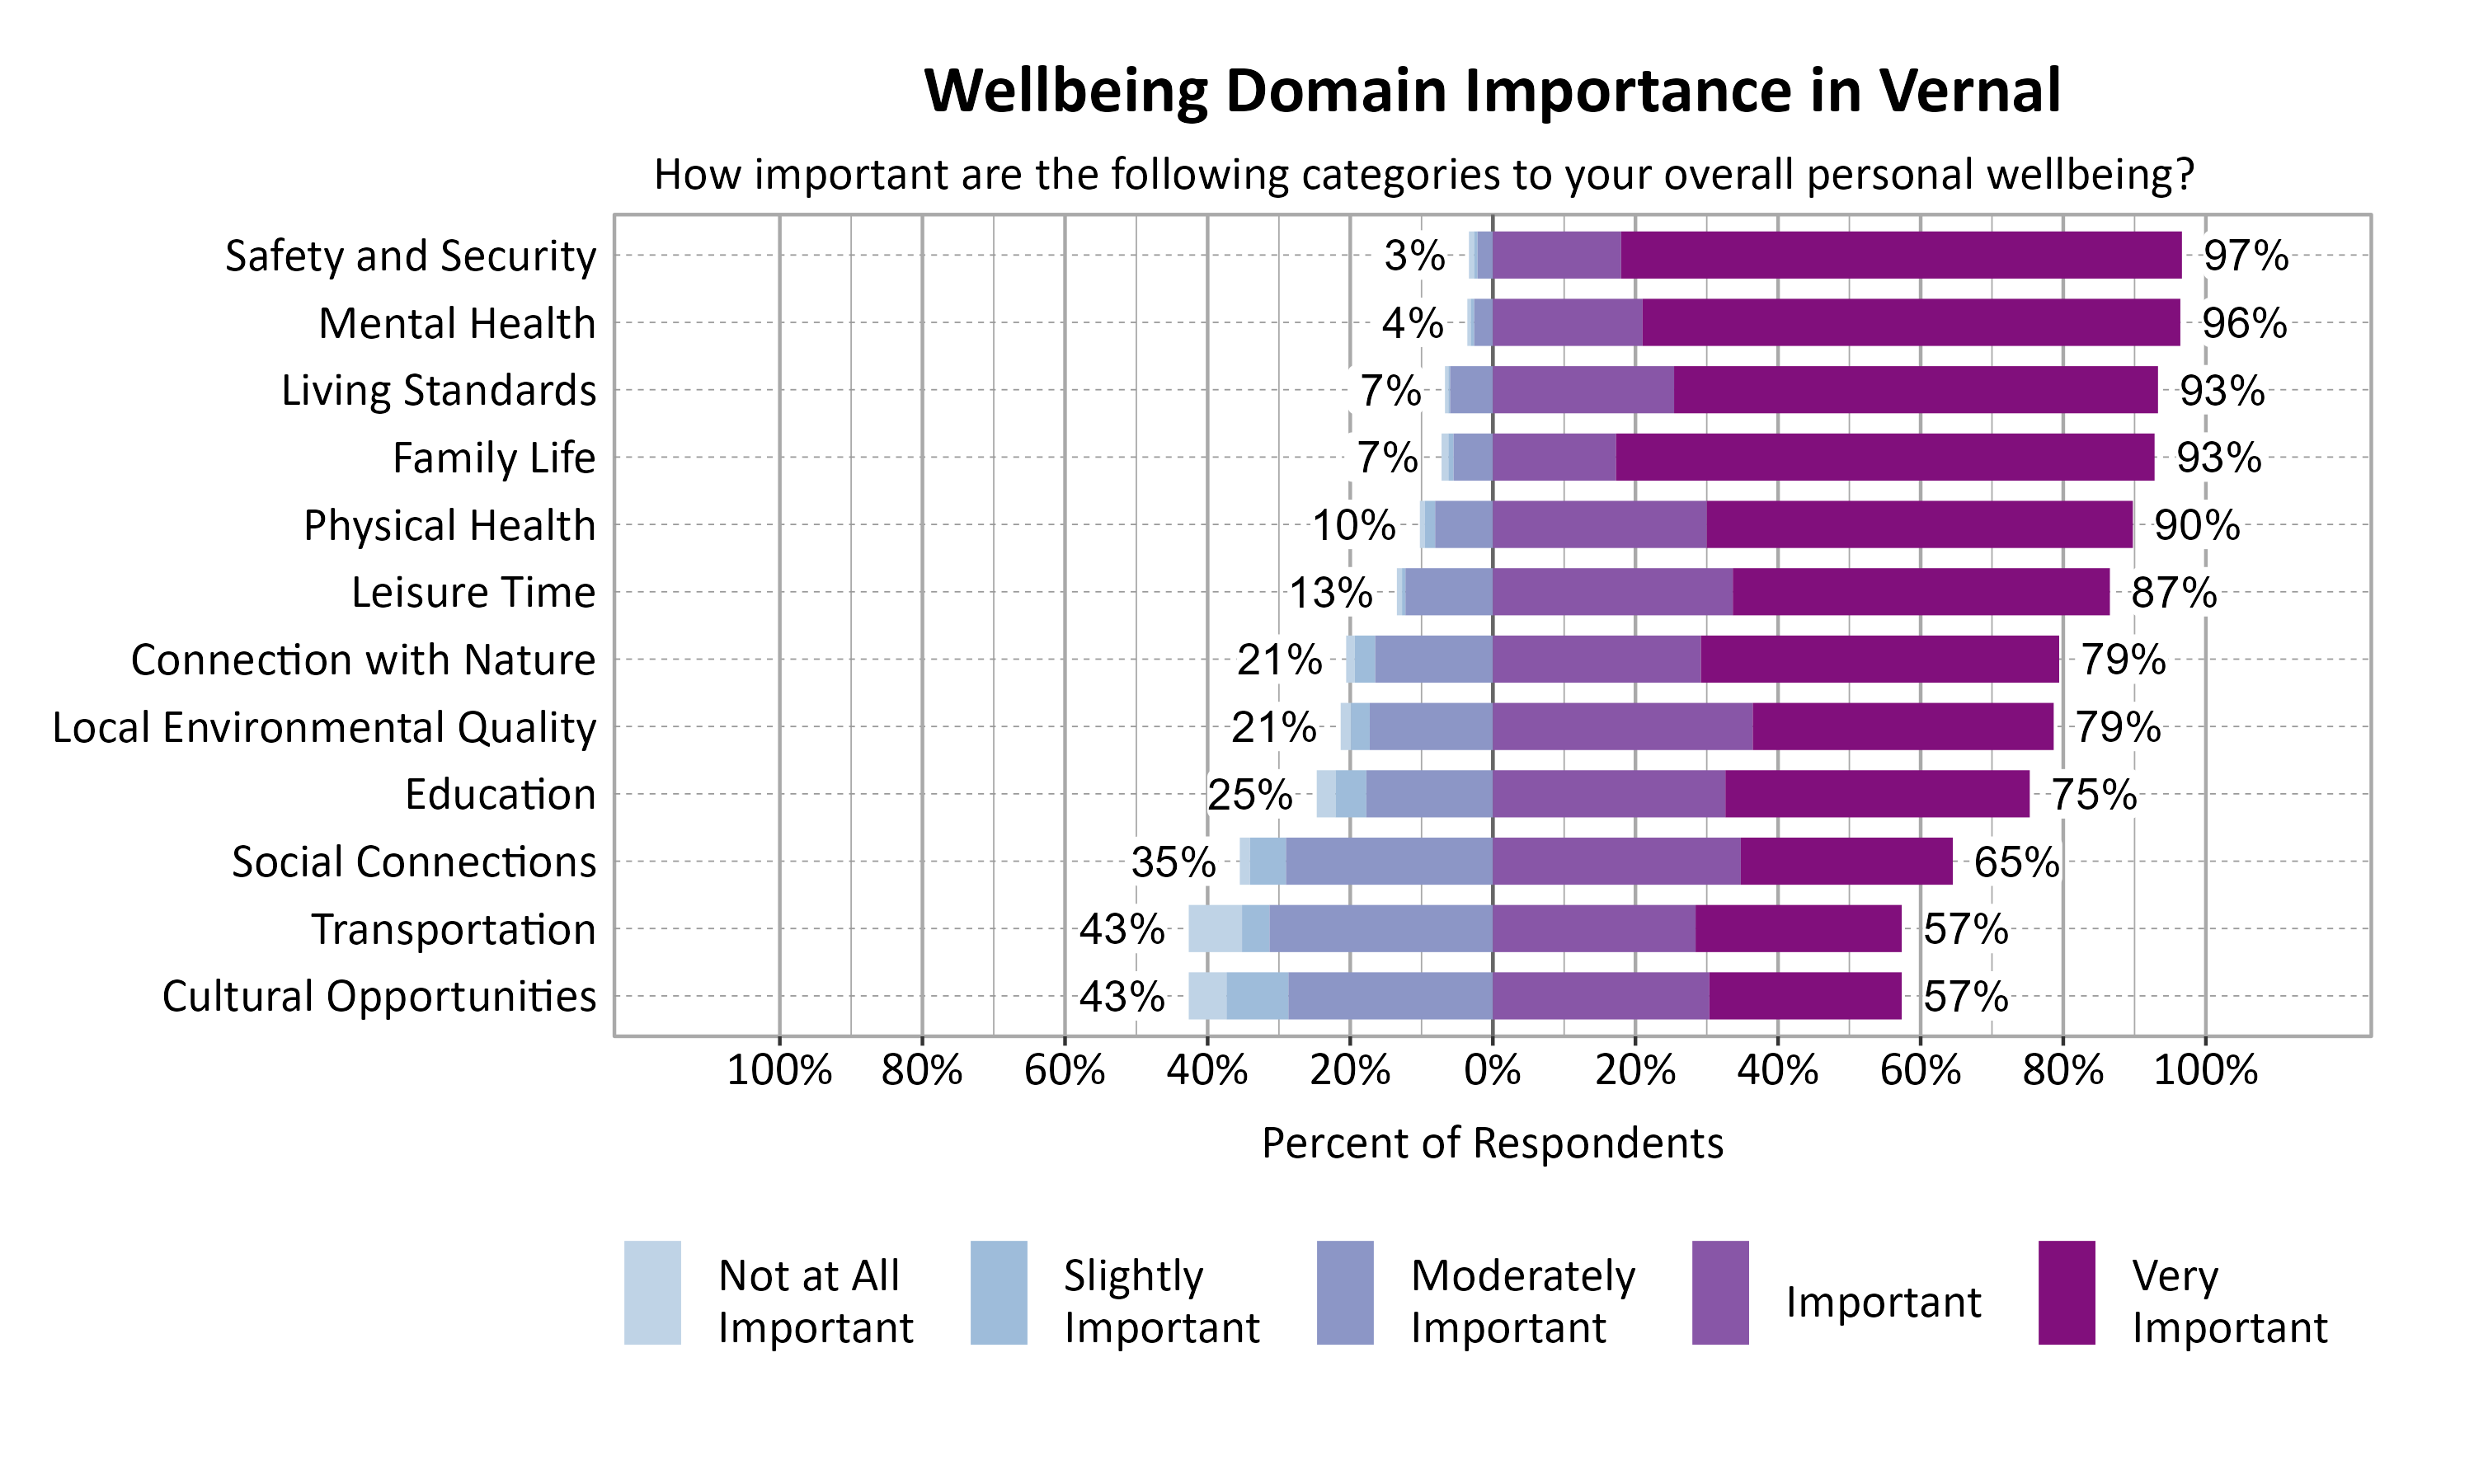
According to national and international entities that track wellbeing, there are a number of common dimensions or domains of wellbeing. Survey respondents rated twelve domains on a 5-point scale from poor to excellent. They were also asked to indicate the importance of each domain to their overall personal wellbeing on a 5-point scale from not at all important to very important. The highest rated wellbeing domains for respondents in Vernal were Family Life (69%), Connection with Nature (65%), Mental Health (56%), and Safety and Security (55%). The most important wellbeing domains were Safety and Security (97%), Mental Health (96%), Living Standards (93%), and Family Life (93%).
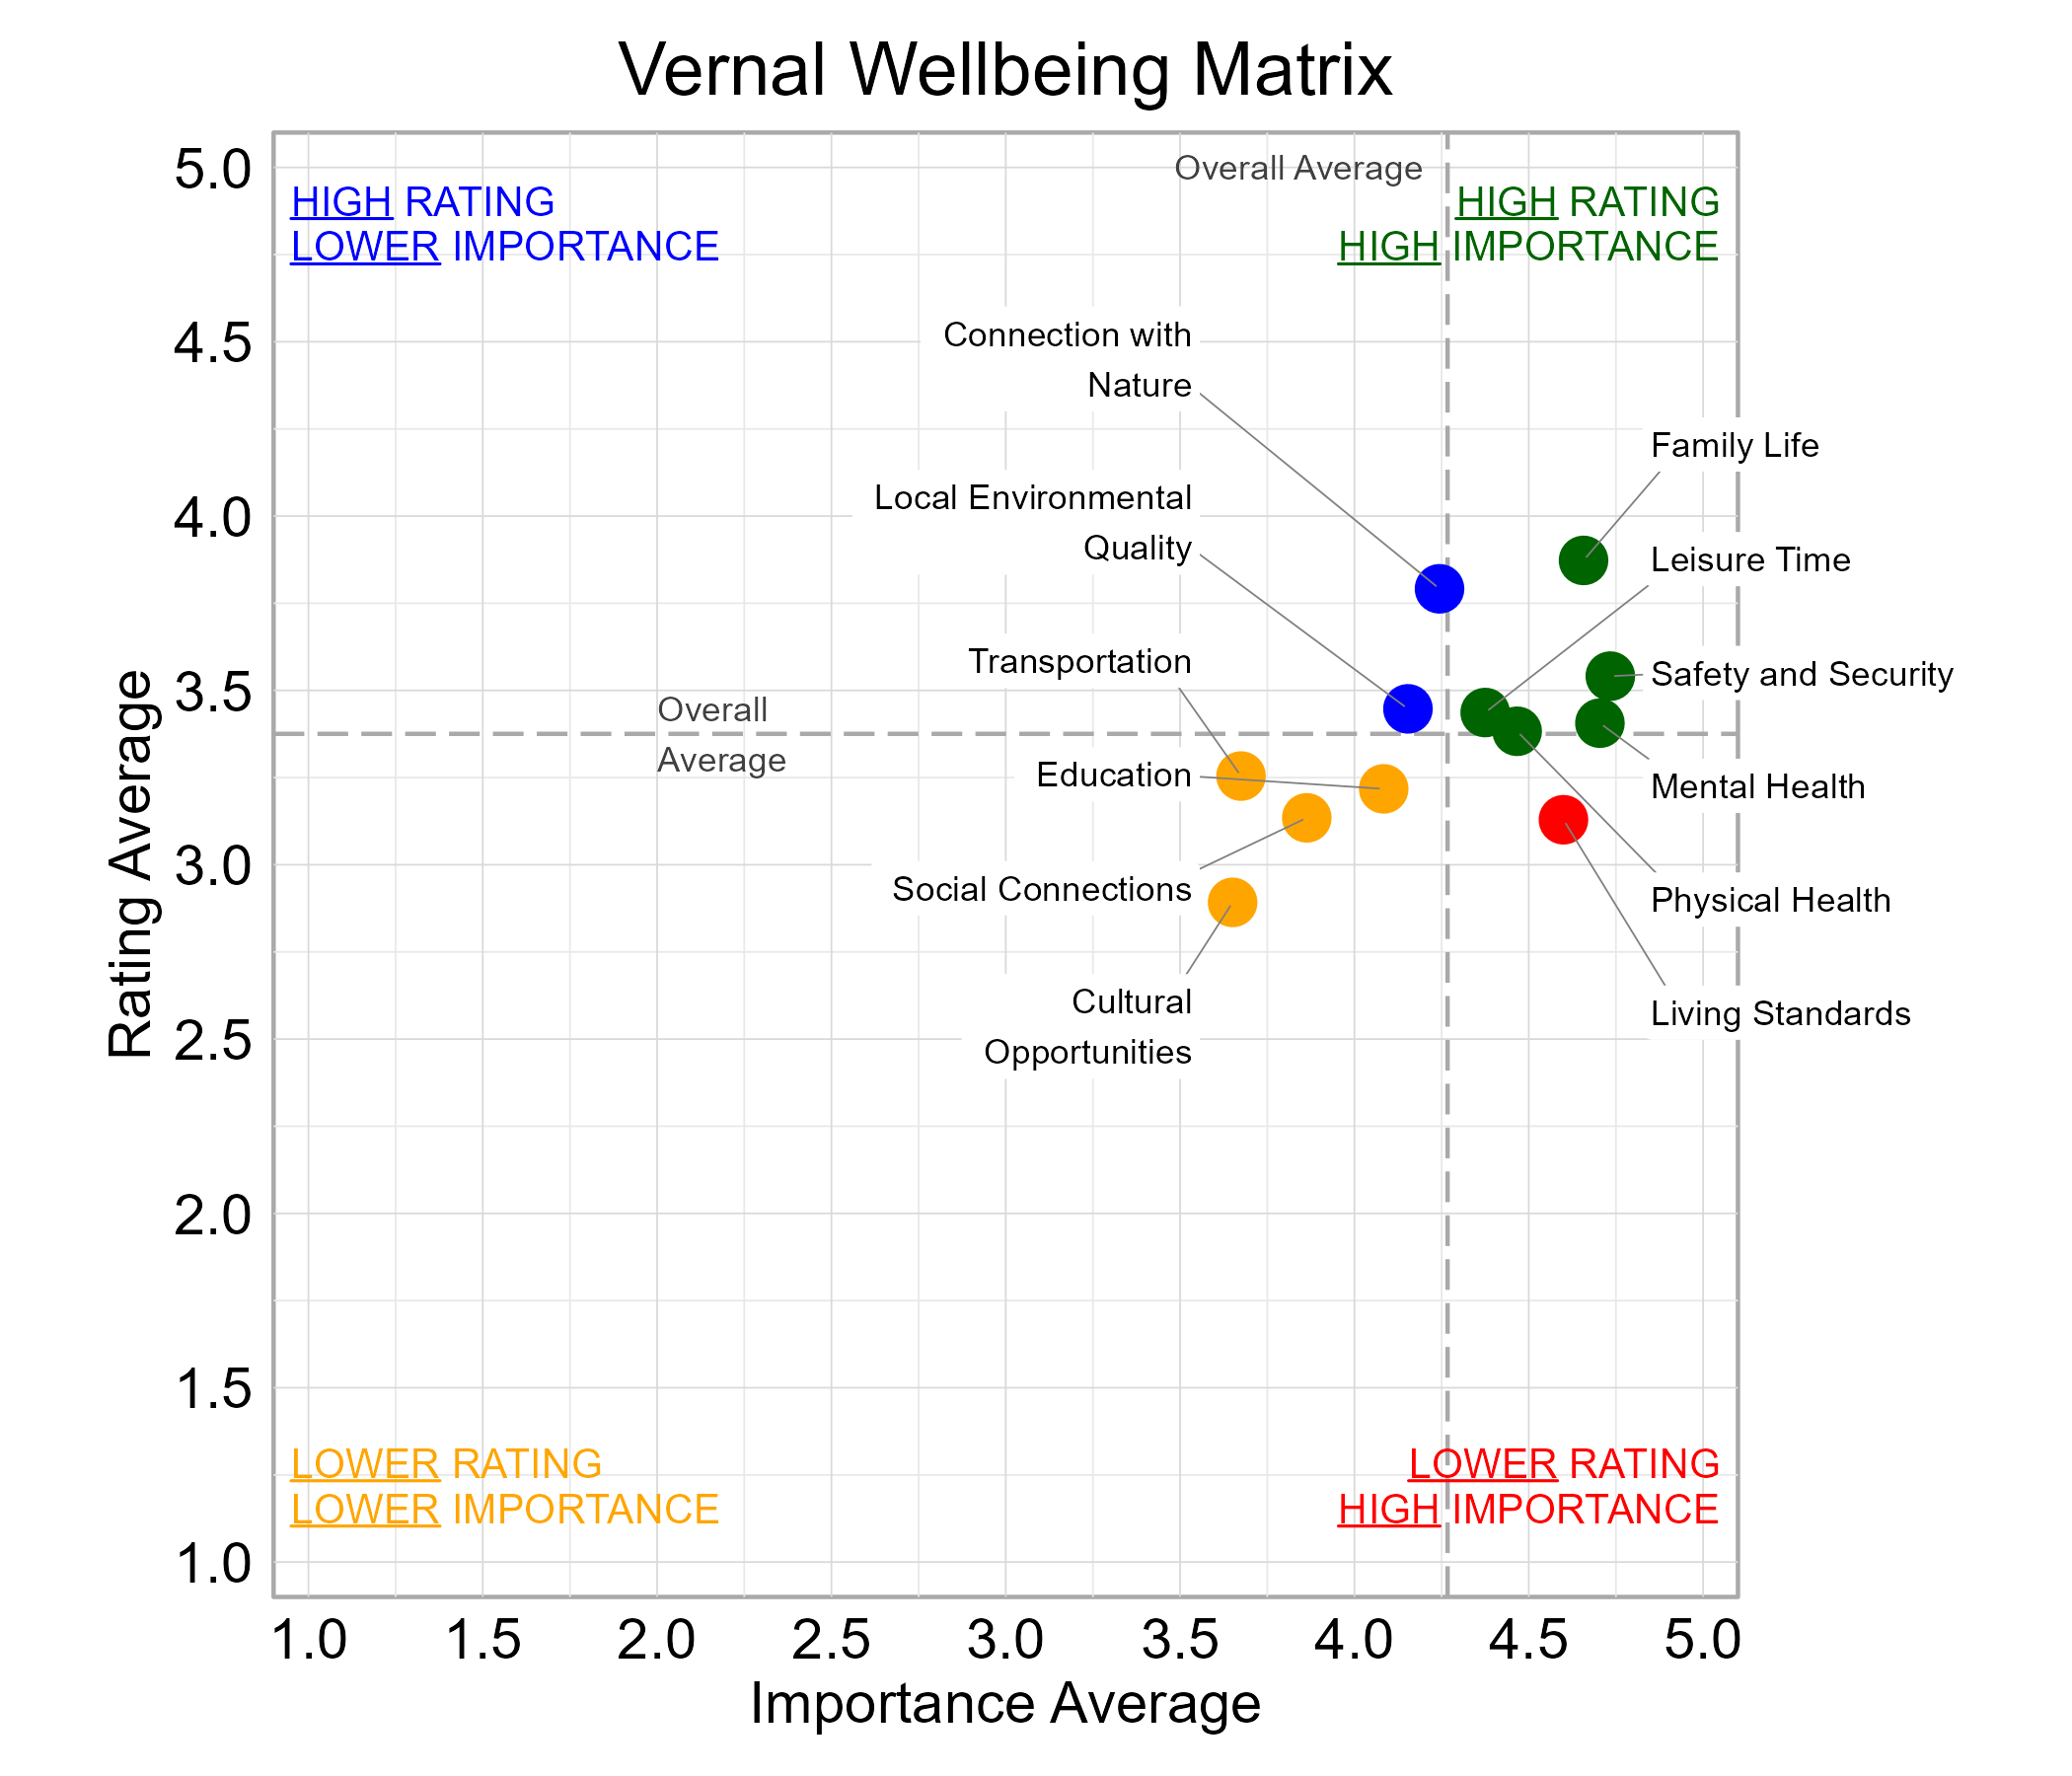
Wellbeing Matrix for Vernal
The graph below illustrates the relationship between the average rating and the average importance of wellbeing domains for survey respondents from Vernal. Family Life, Leisure Time, Mental Health, Physical Health, and Safety and Security were highly important and rated above average among the domains. Living Standards fell in the “red zone” of higher importance and lower ratings.
Wellbeing Domains Over Time in Vernal
The graphs below show how the domains were rated over the years by Vernal residents. The number of respondents changed over time. Note that the two domains Family Life and Transportation were new categories in the 2024 survey and were not measured in previous years. The domains were varied in changes between 2021 and 2024, with the largest increase in Mental Health and the largest decrease in Living Standards. Connection with Nature and Safety and Security were consistently among the top rated domains in each survey year, while Cultural Opportunities was among the lowest.

Community Connection in Vernal
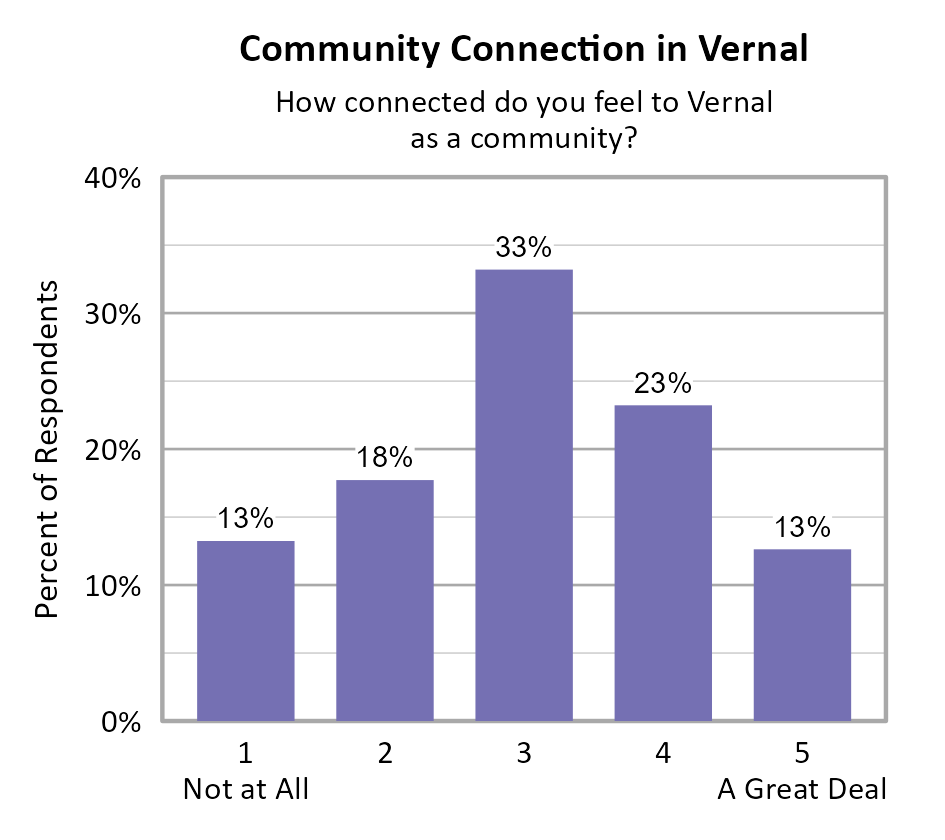
Survey participants were asked about how connected they feel to Vernal on a 5-point scale from not at all (1) to a great deal (5), and the average score of all respondents was 3.04.
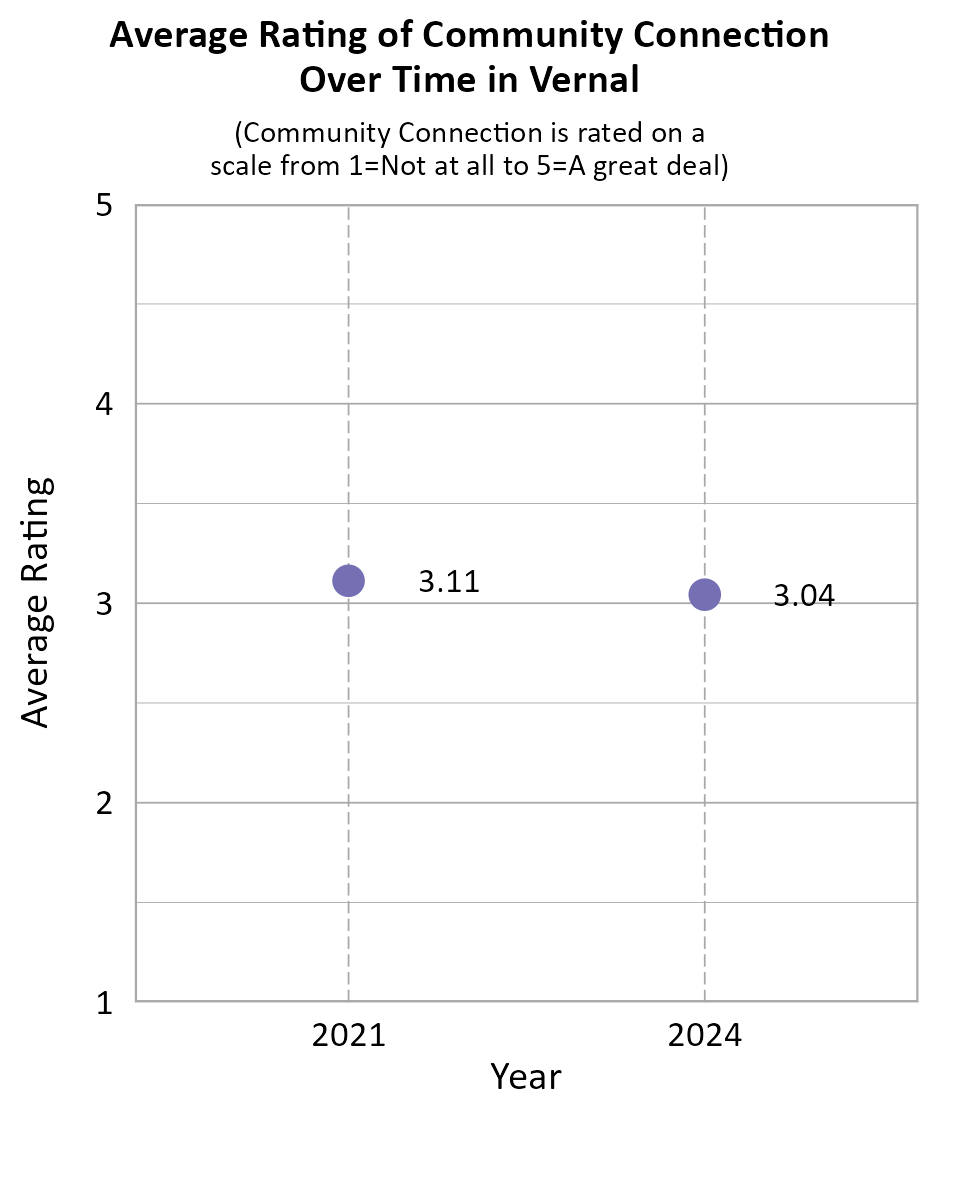
When comparing survey data from Vernal over the years as shown in the information below, we can see that the average community connection score declined slightly between 2021 and 2024.
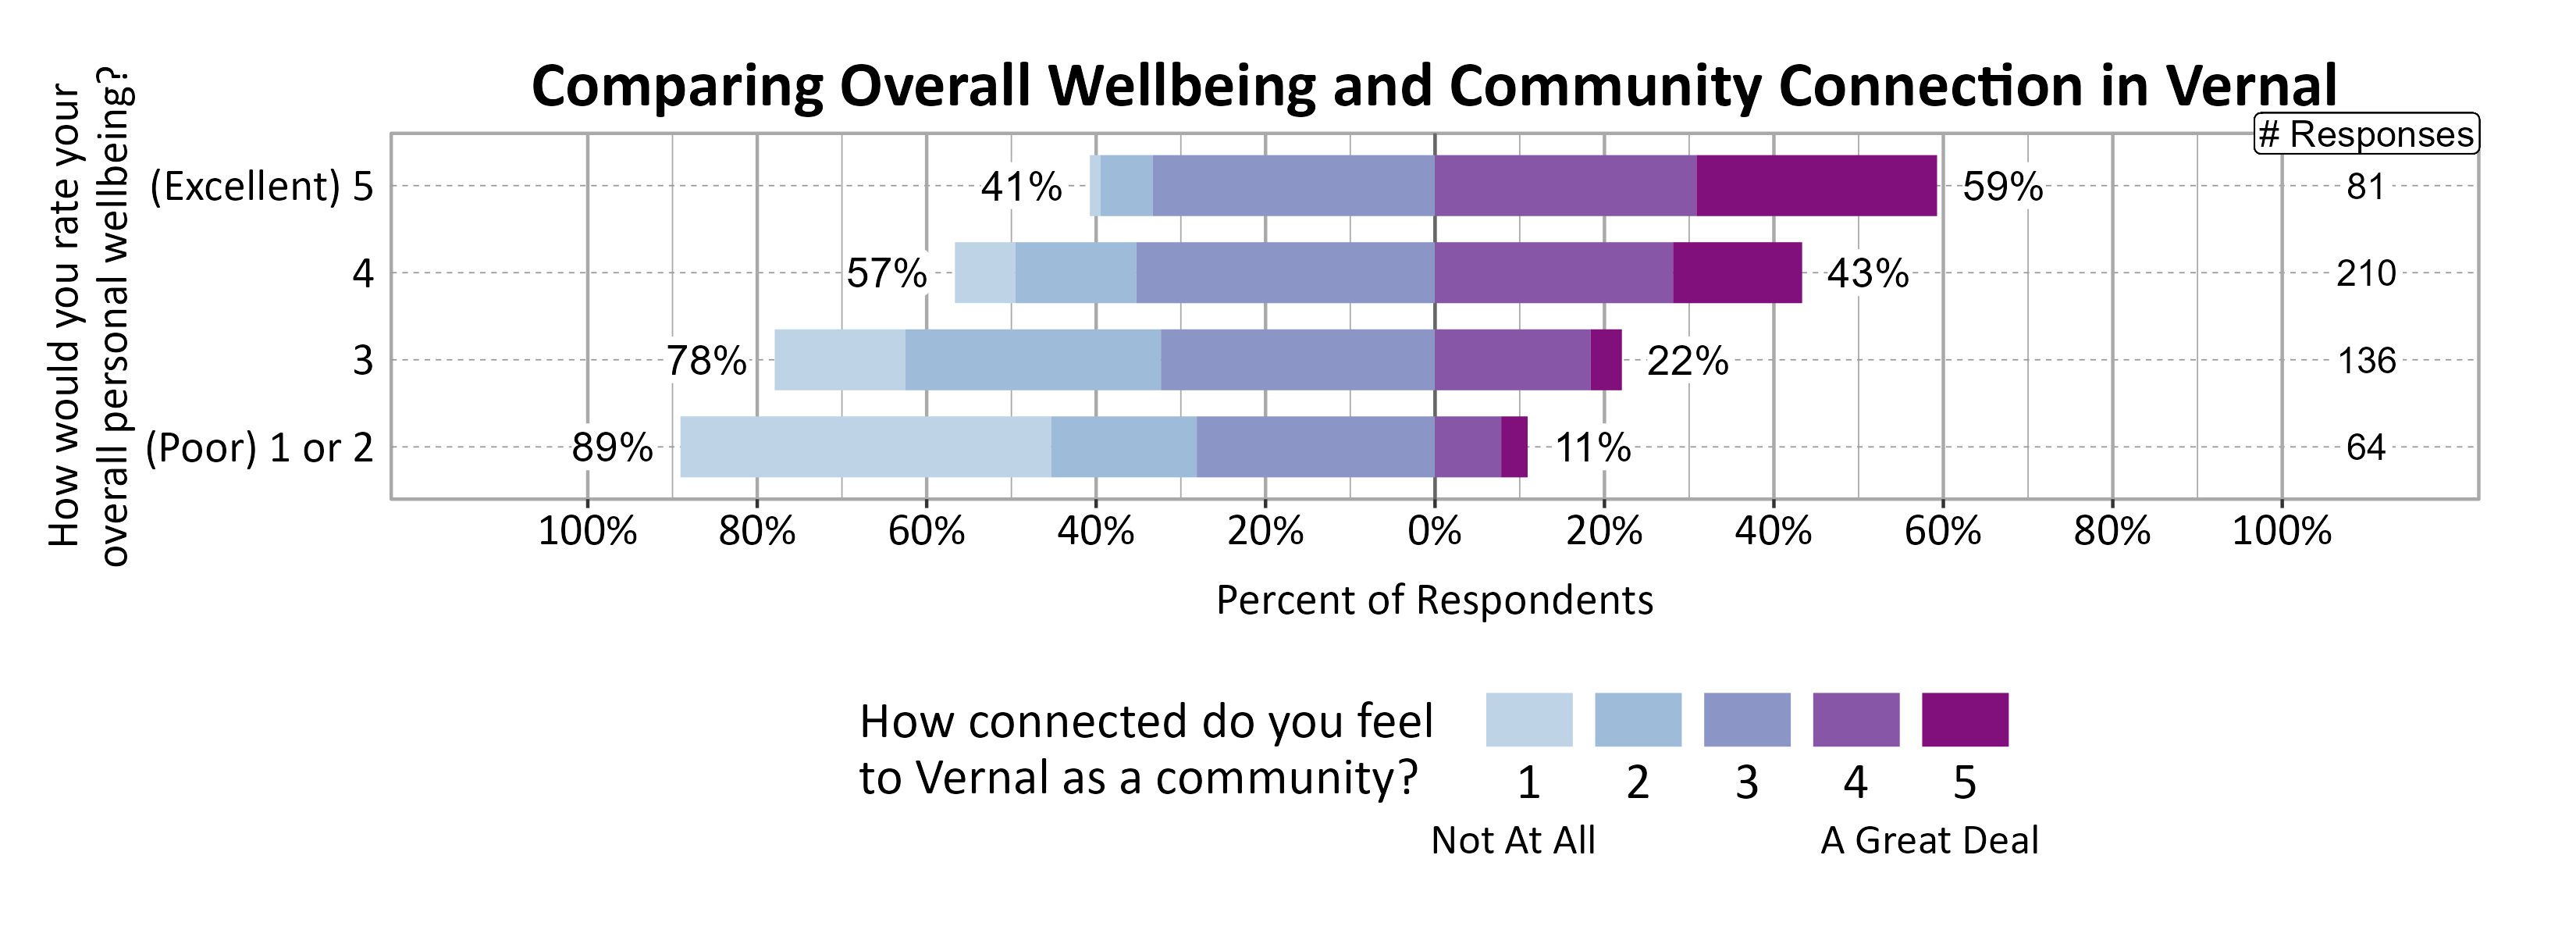
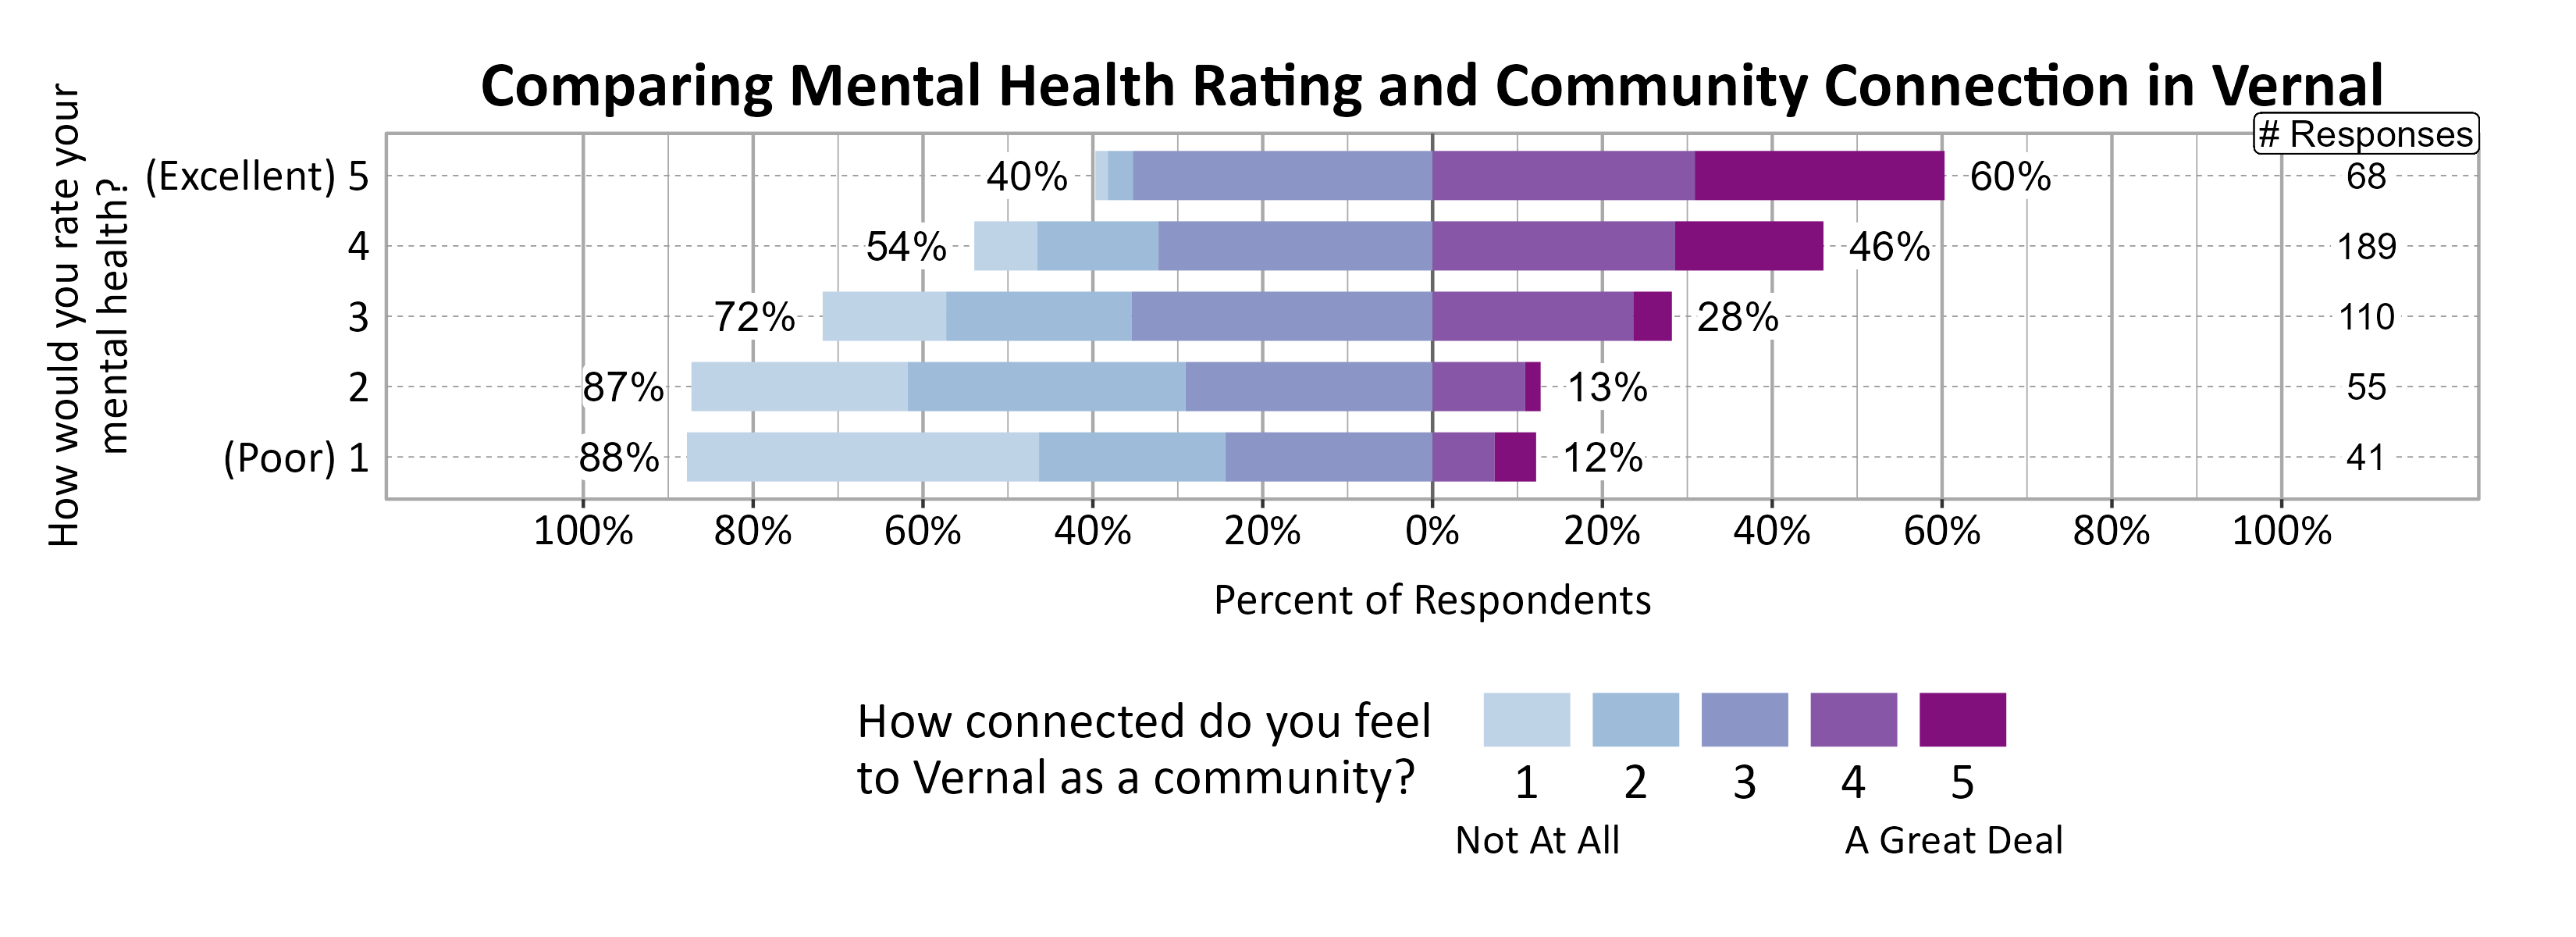
A positive relationship was found between individuals’ community connection and overall personal wellbeing as well as mental health.
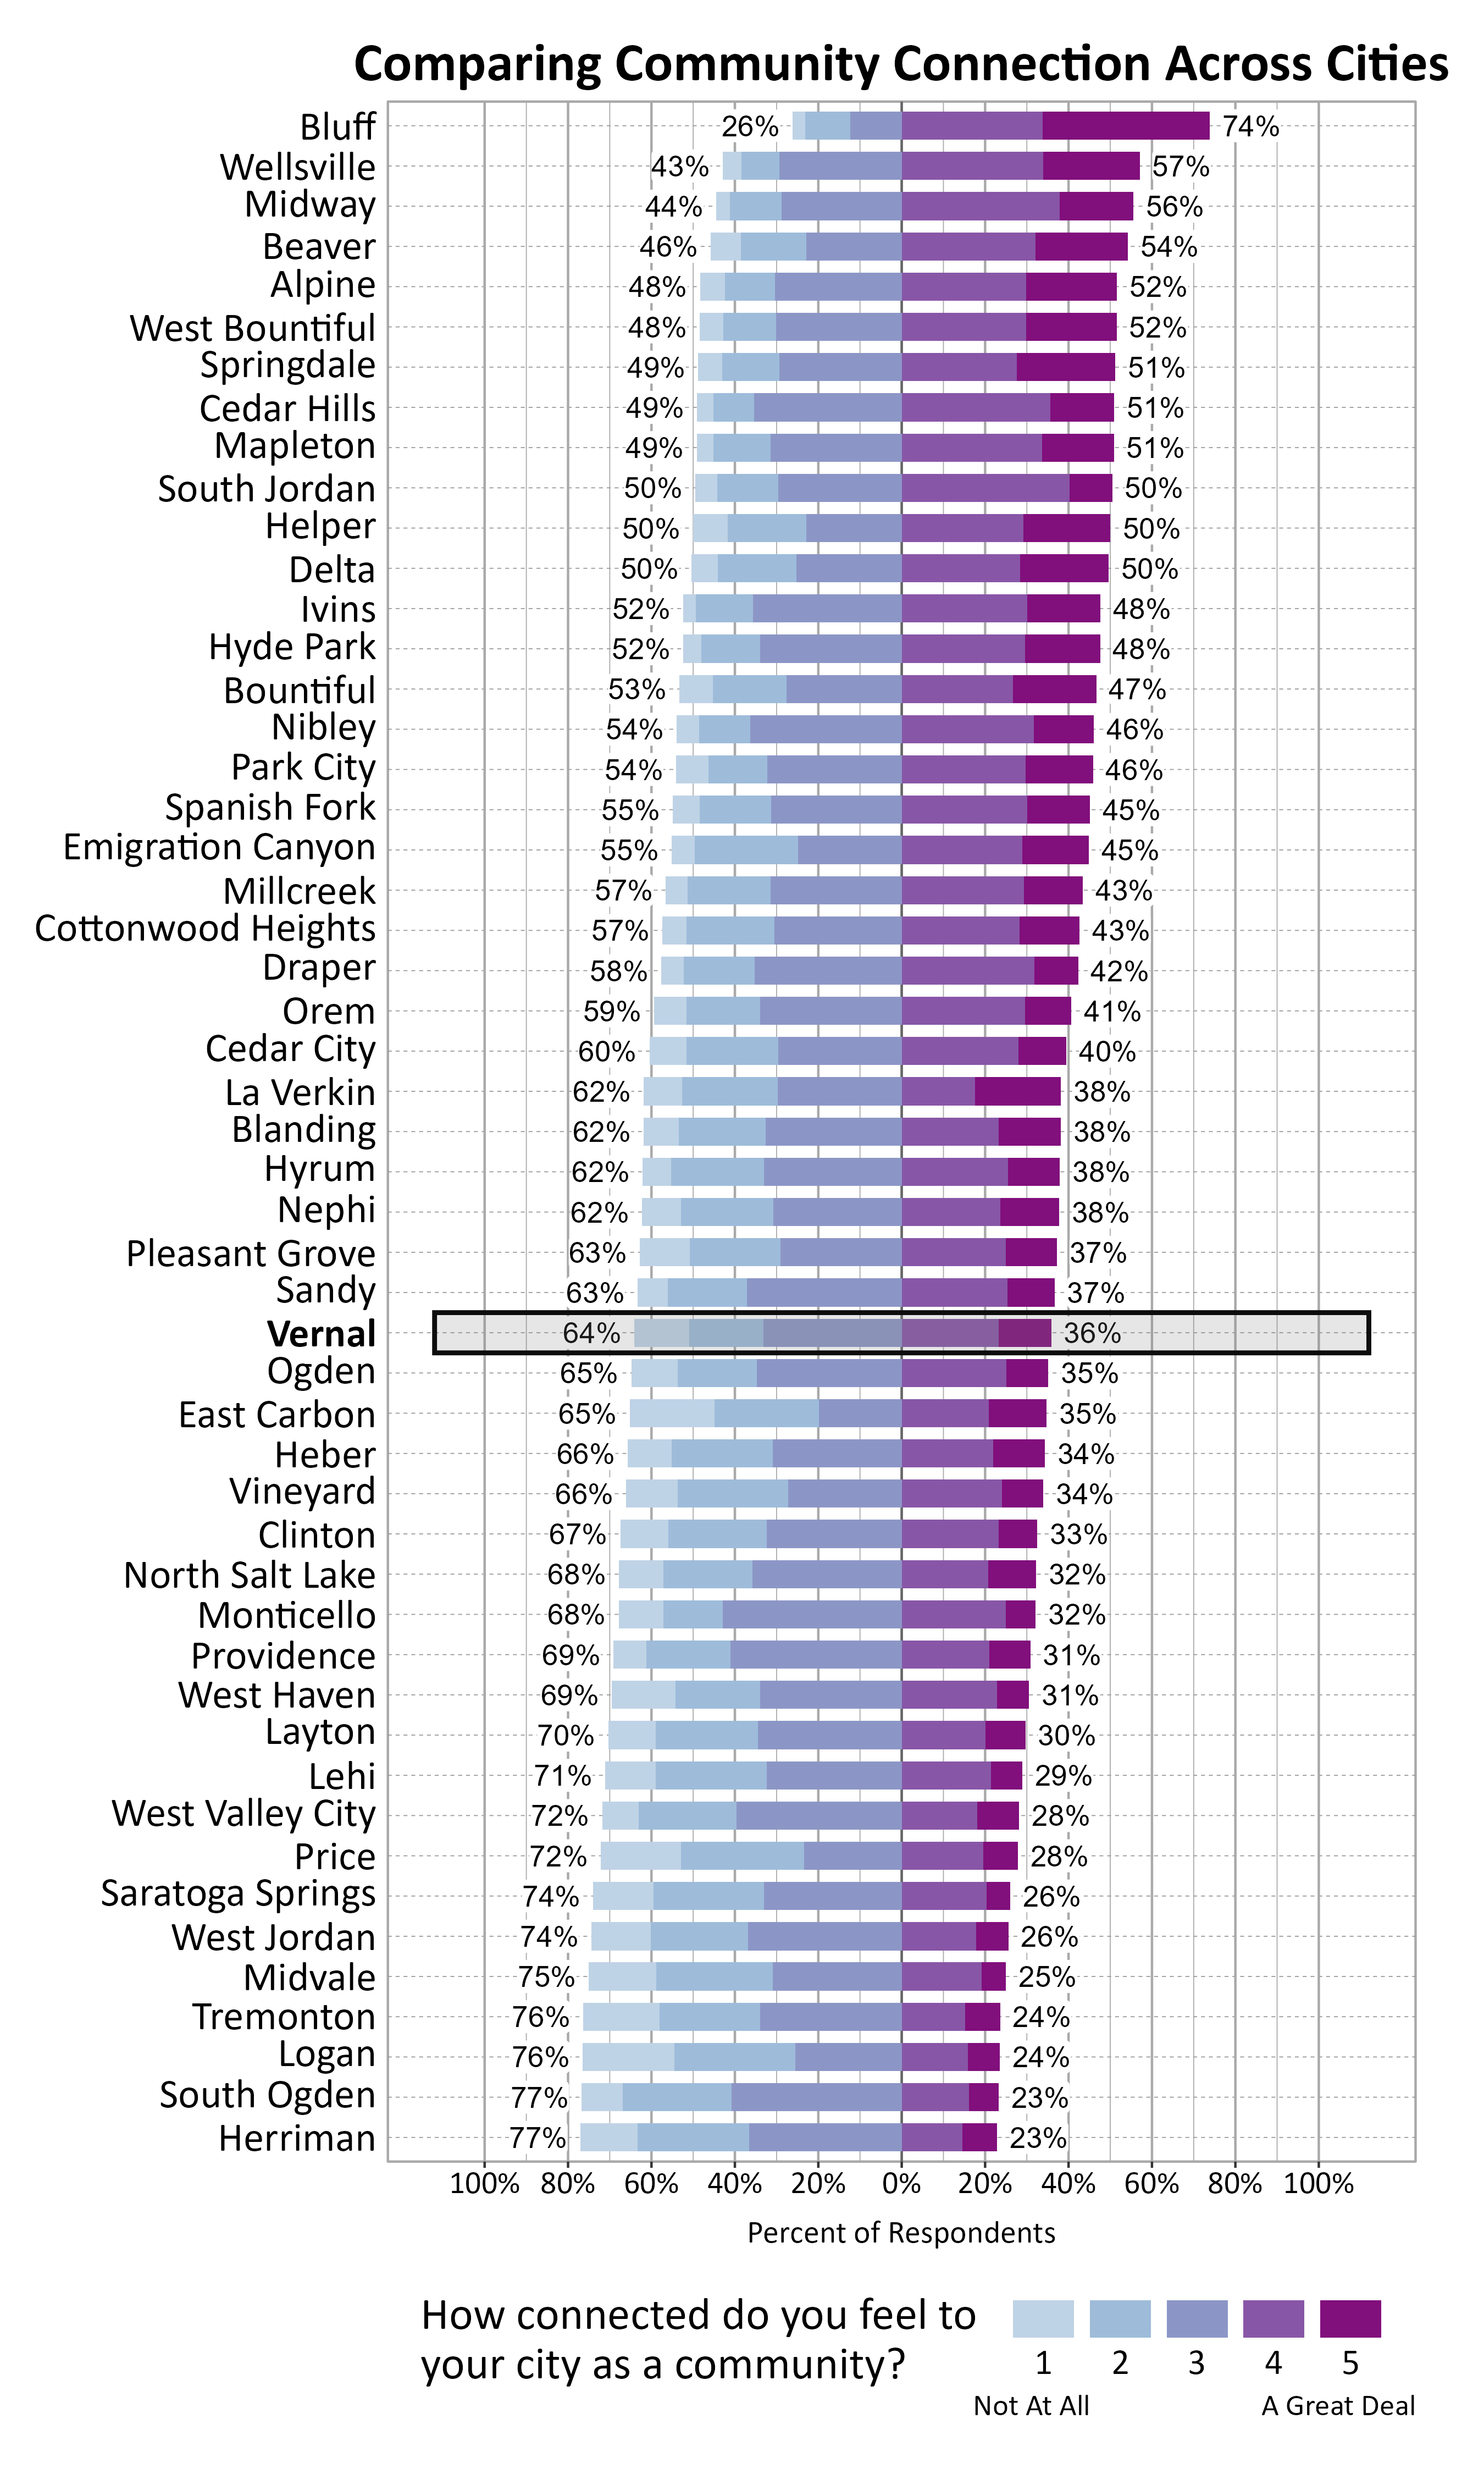
The graph below shows how Wellbeing Project cities and towns compare on feelings of community connection based on the percentage of respondents who answered 4 or a 5 on a 5-point scale from “not at all” to “a great deal” connected to their city or town. Vernal ranked 31 out of the 51 cities that participated.
Participation in Recreation and Nature-Related Activities
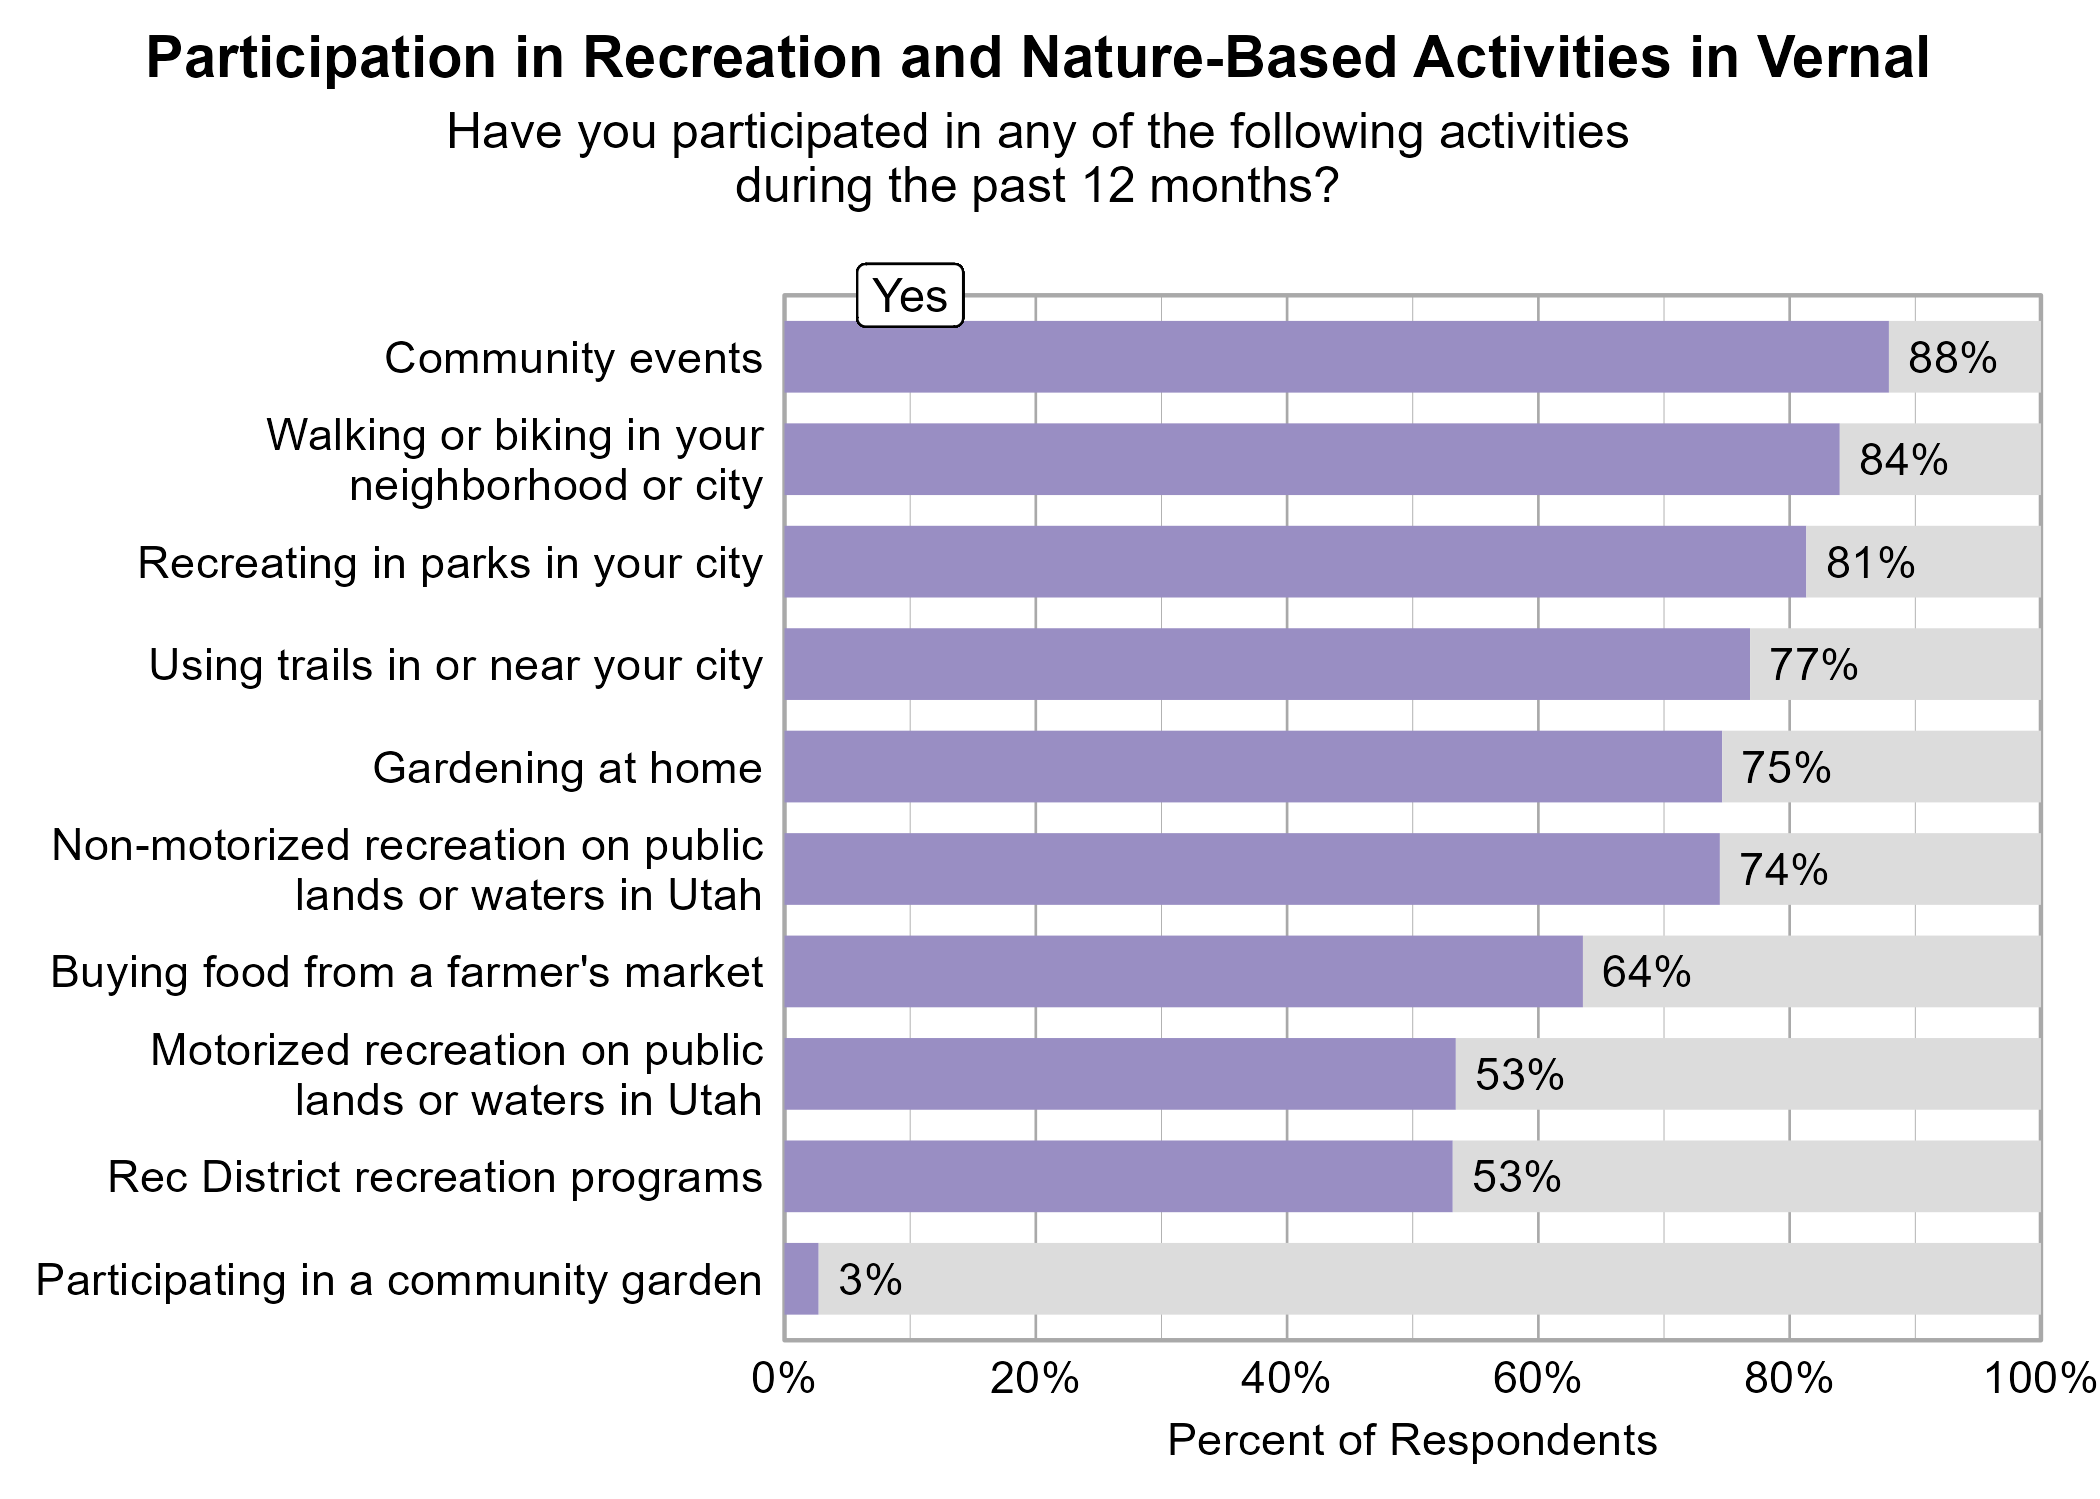
Respondents were asked to indicate whether or not they participated in various activities in the last 12 months. The most popular activities were community events (88%), walking or biking in your neighborhood or city (84%), and recreating in parks in your city (81%).
Buying food from a farmer's market, participating in Rec District recreation programs, participating in community events, gardening at home, non-motorized recreation on public lands or waters in Utah, recreating in parks in your city, using trails in or near your city, and walking or biking in your neighborhood or city were significantly related to higher ratings of personal wellbeing.
Buying food from a farmer's market, participating in community events, gardening at home, motorized recreation on public lands or waters in Utah, and recreating in parks in your city were significantly related to higher ratings of community wellbeing.
Buying food from a farmer's market, participating in Rec District recreation programs, participating in community events, motorized recreation on public lands or waters in Utah, non-motorized recreation on public lands or waters in Utah, recreating in parks in your city, using trails in or near your city, and walking or biking in your neighborhood or city were significantly related to higher ratings of community connection.
Perspectives on Population Growth and Economic Development
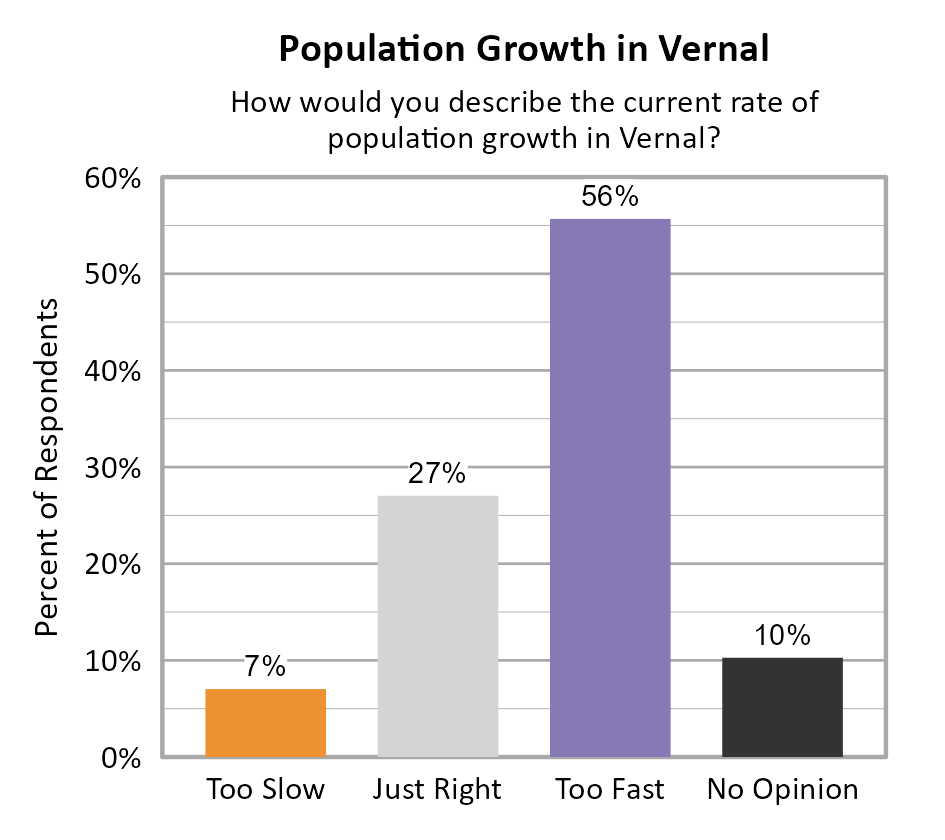
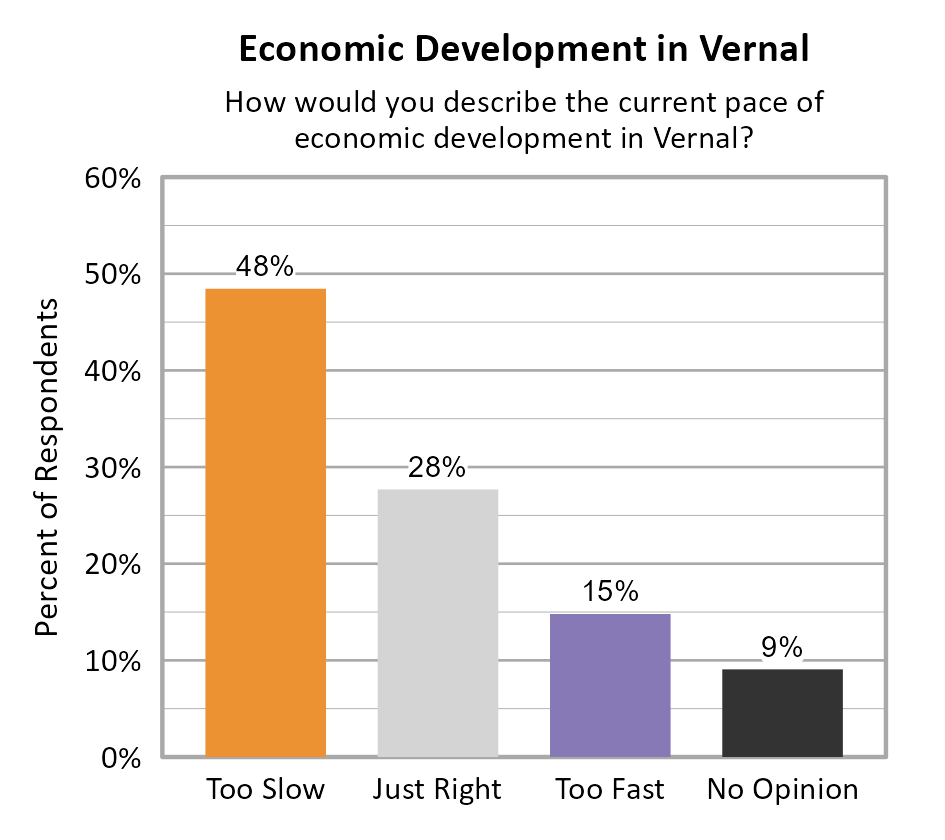
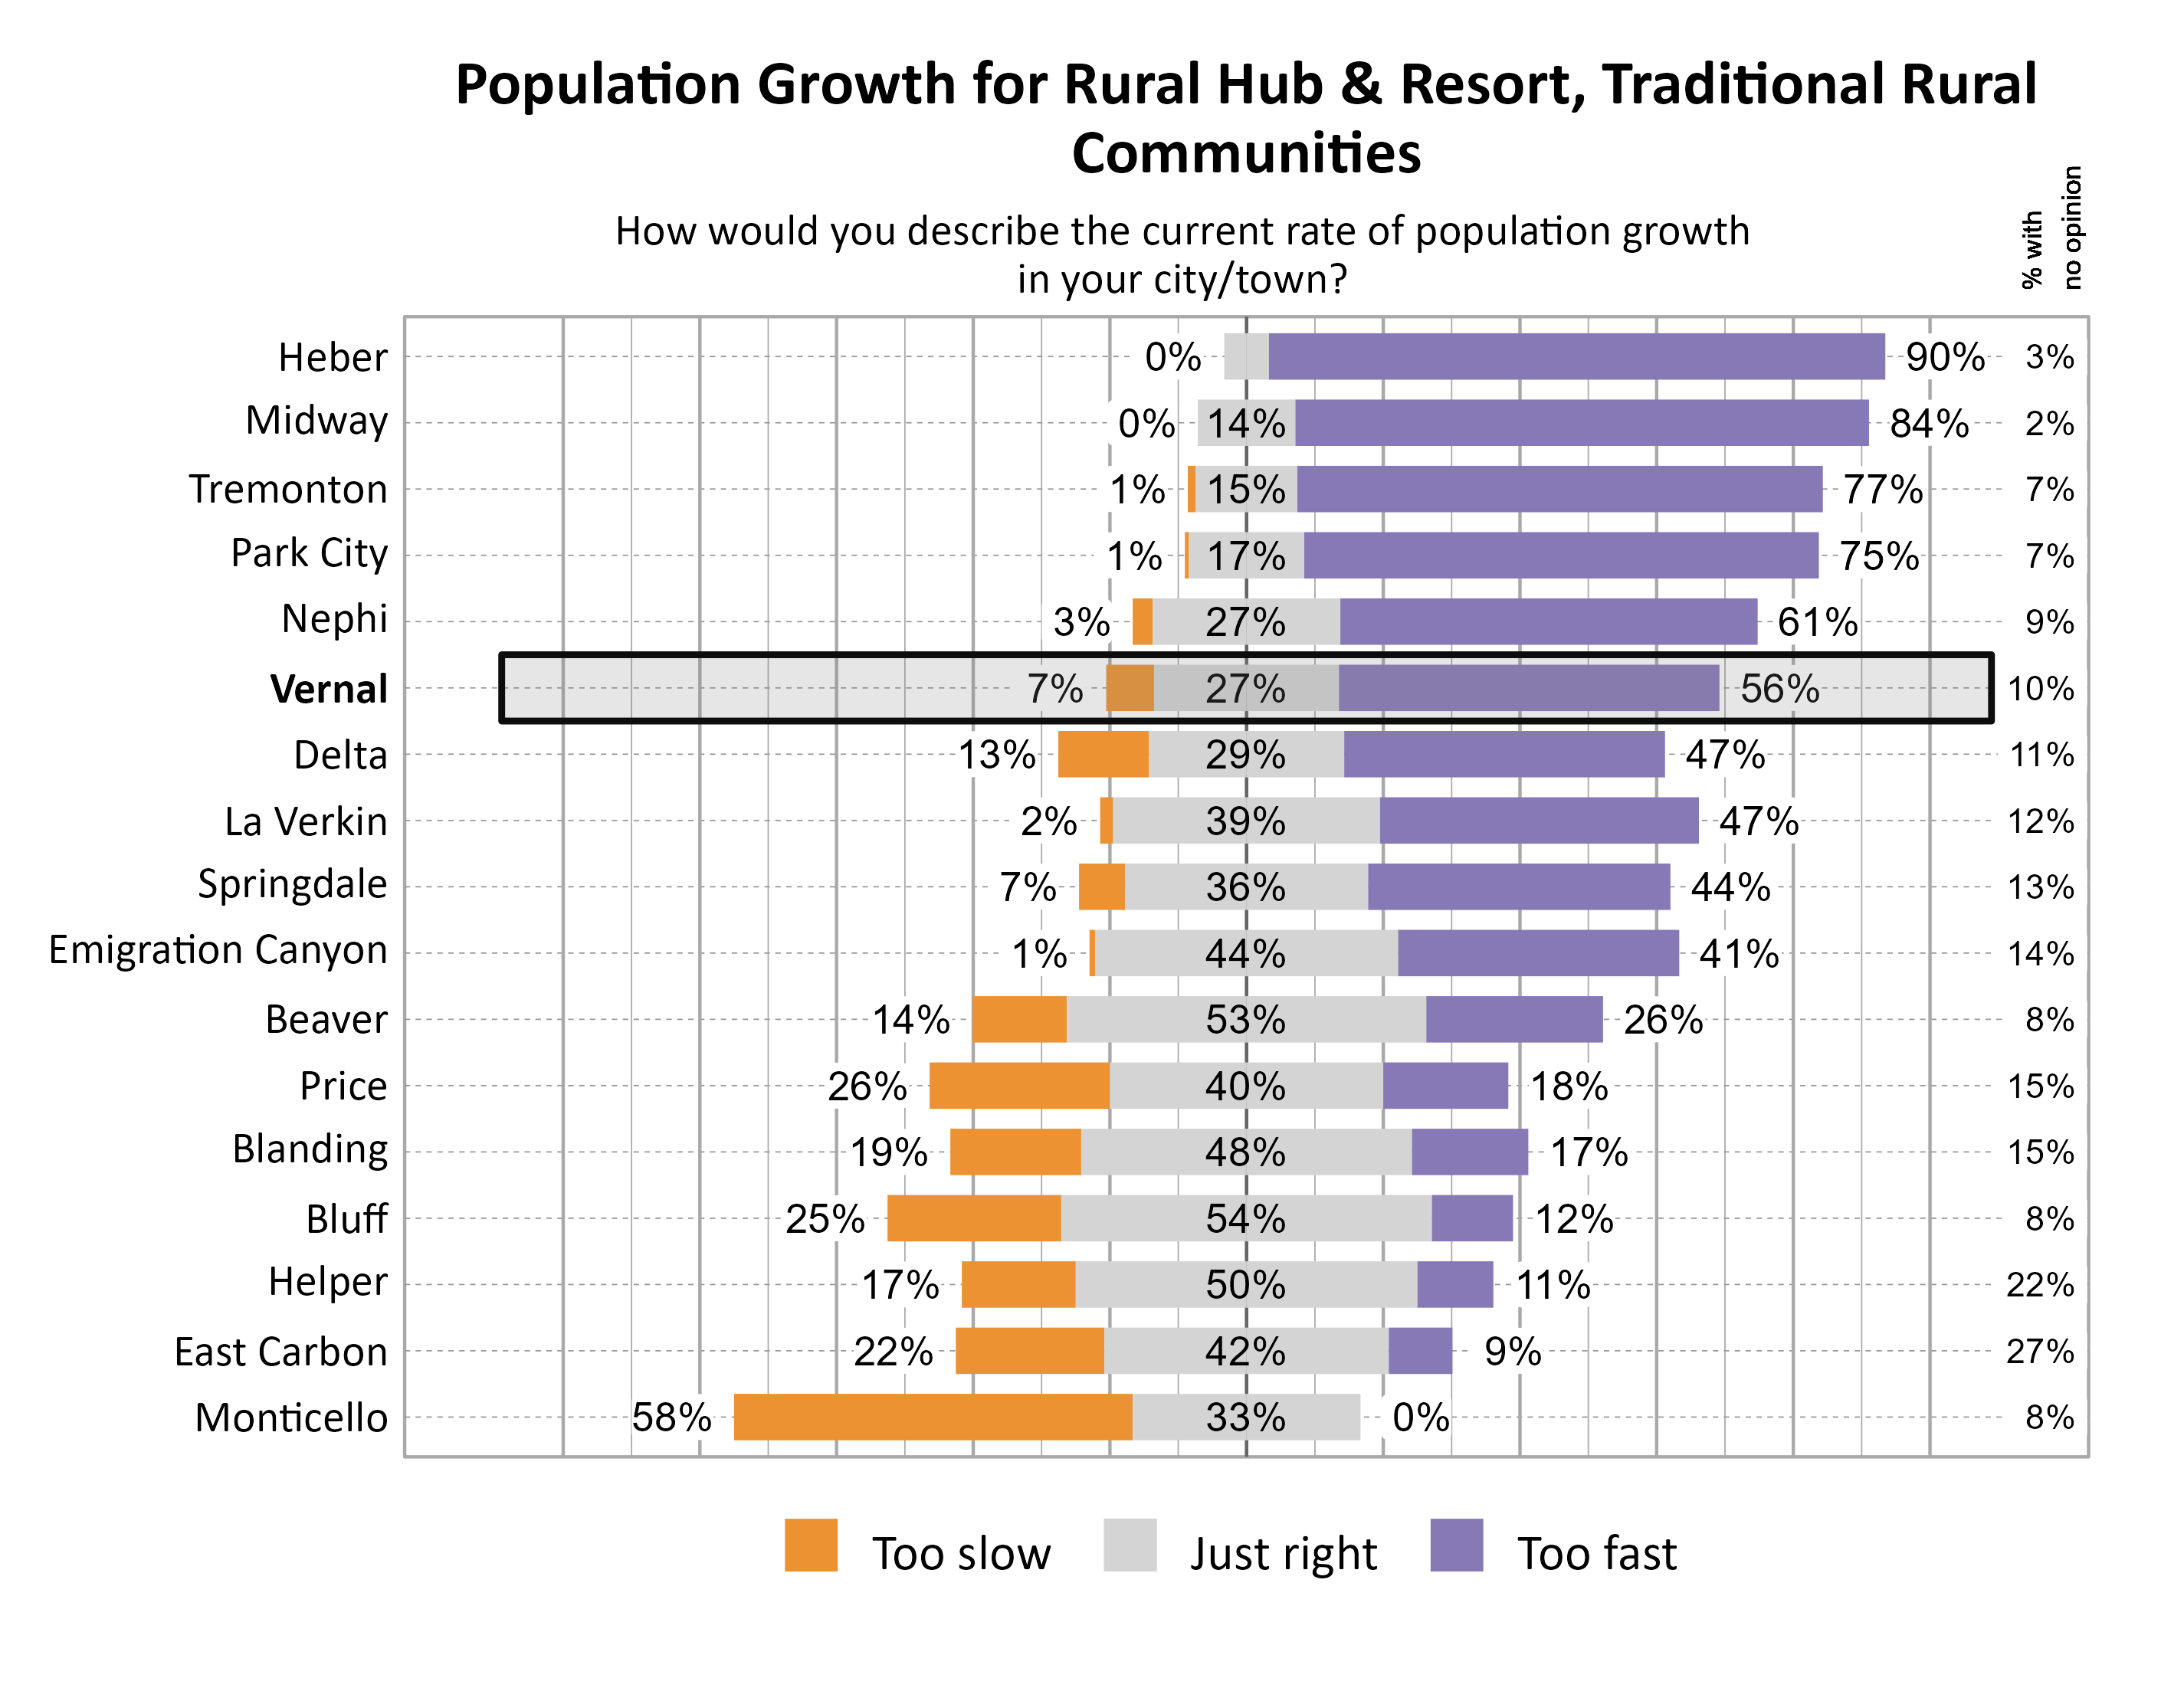
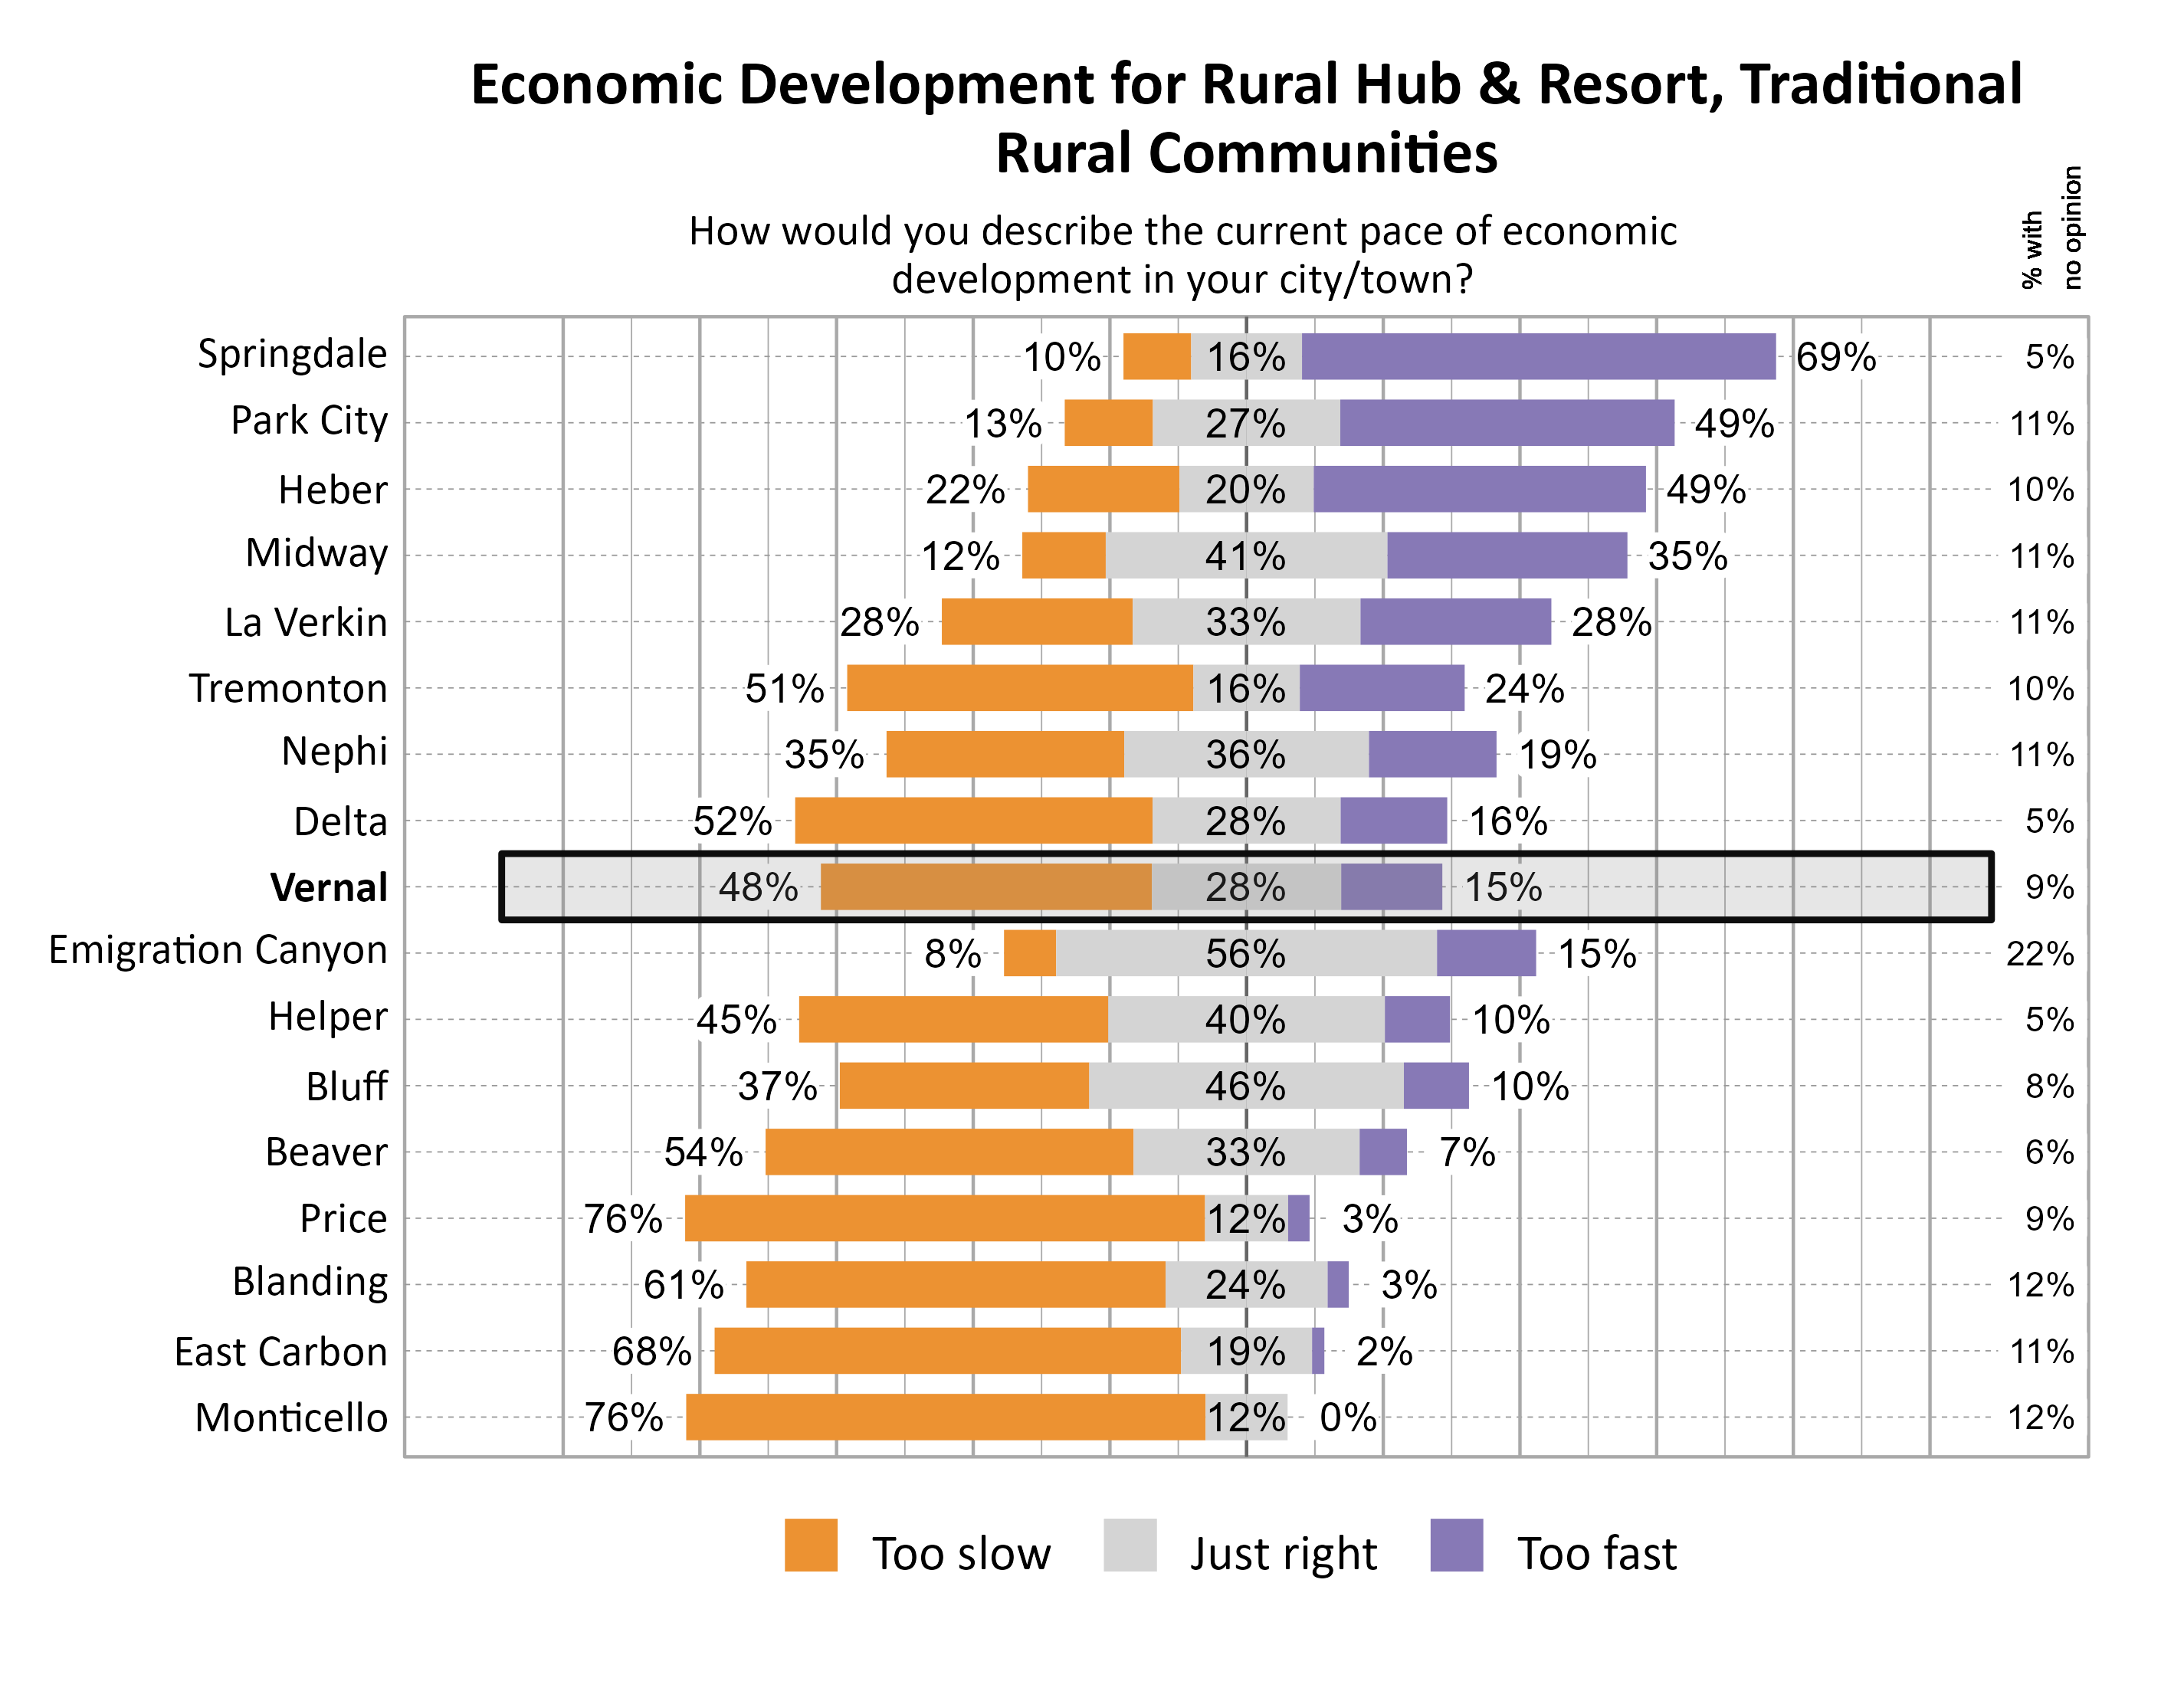
The majority of respondents in Vernal indicated that they felt the population growth was too fast (56%). For the pace of economic development, the largest proportion of respondents indicated that it was too slow (48%).
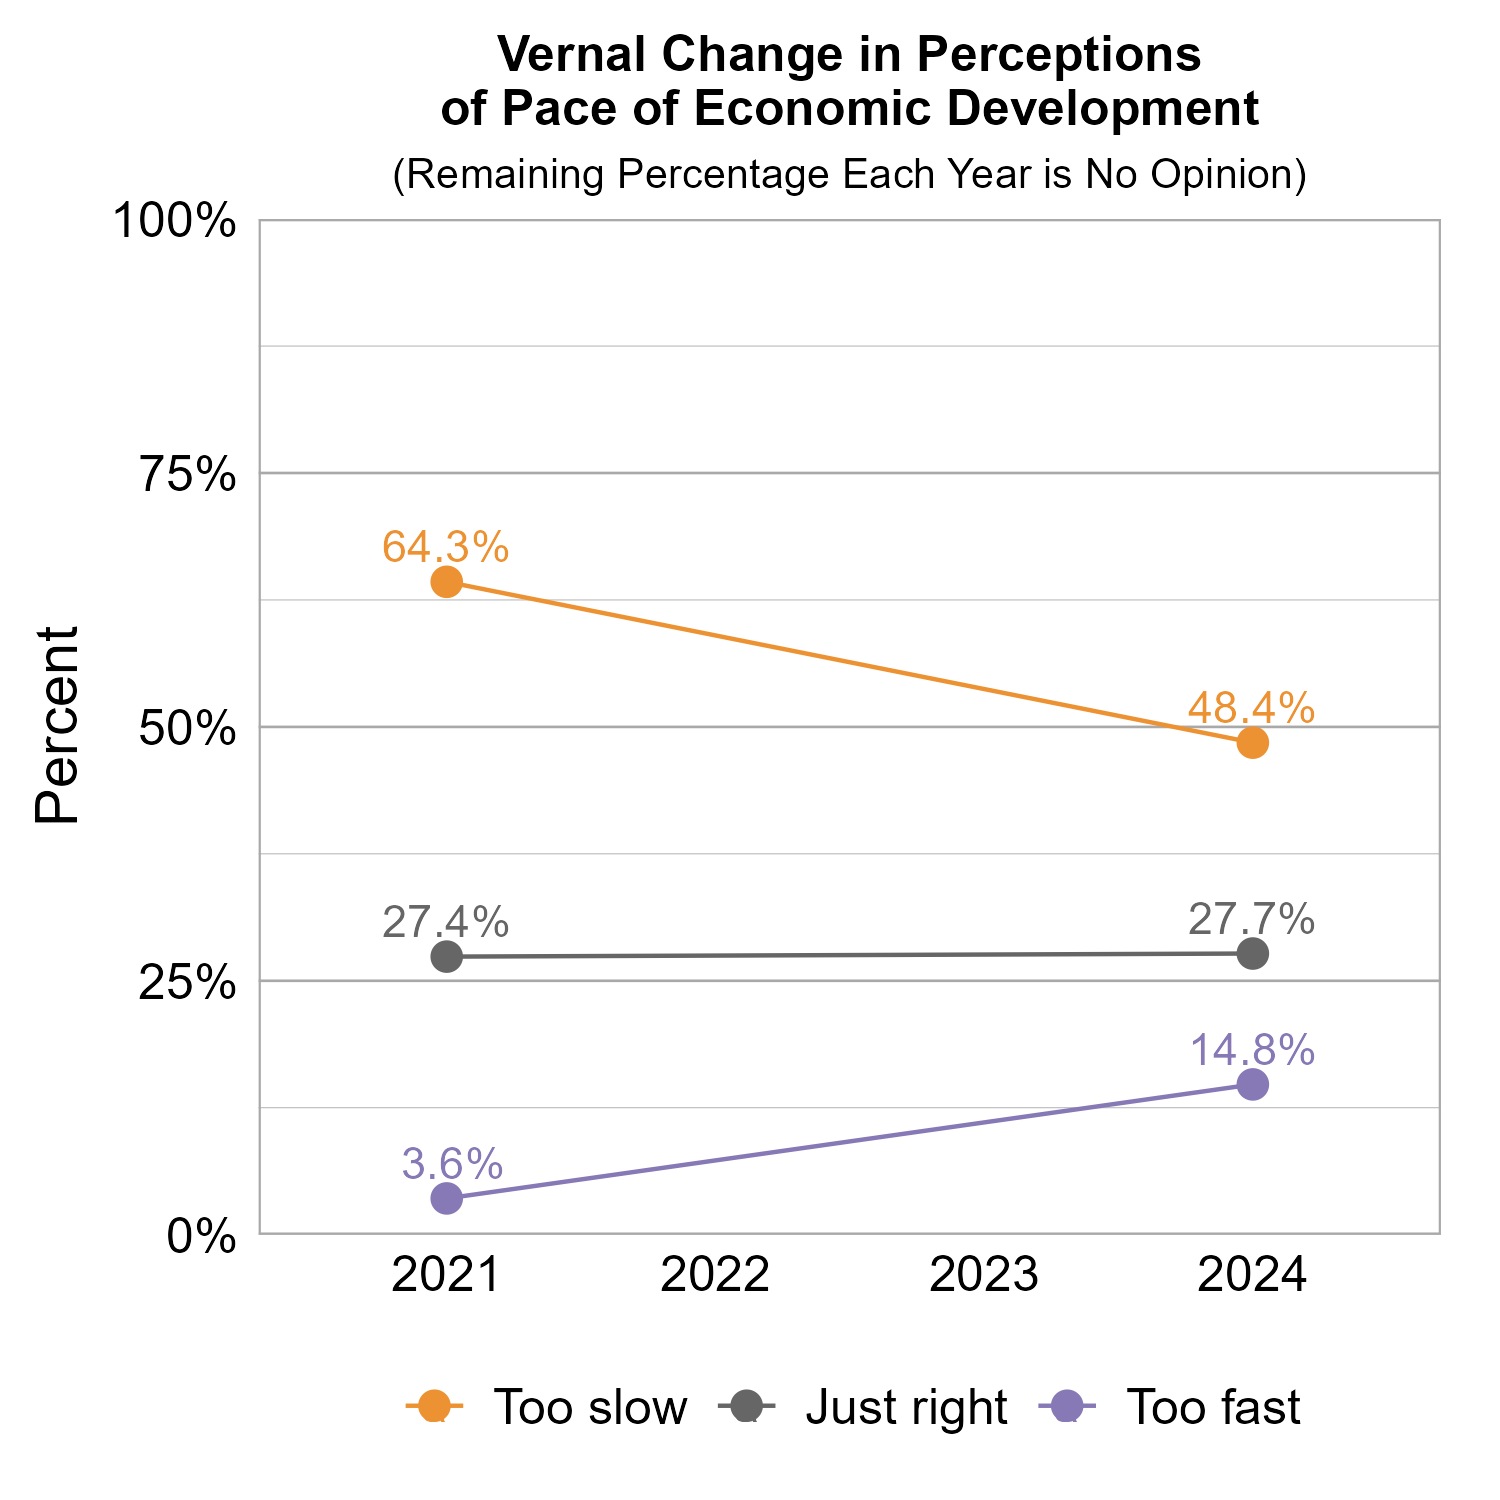
The graphs below show how perceptions of population growth and economic development in Vernal have varied across recent years of Wellbeing Surveys. Perception that the rate of population growth is too fast dramatically increased from 2021 to 2024. The largest proportion of respondents indicated that the pace of economic development was too slow in both survey years, with a decrease from 2021 to 2024.

The graphs below show perceptions of population growth and economic development for Vernal compared to other participating cities and towns in the Rural cluster.
The graph below illustrates how many respondents perceived the pace of economic development as too slow, just right, too fast, or had no opinion, with additional breakdowns for the number of respondents who provided comments.
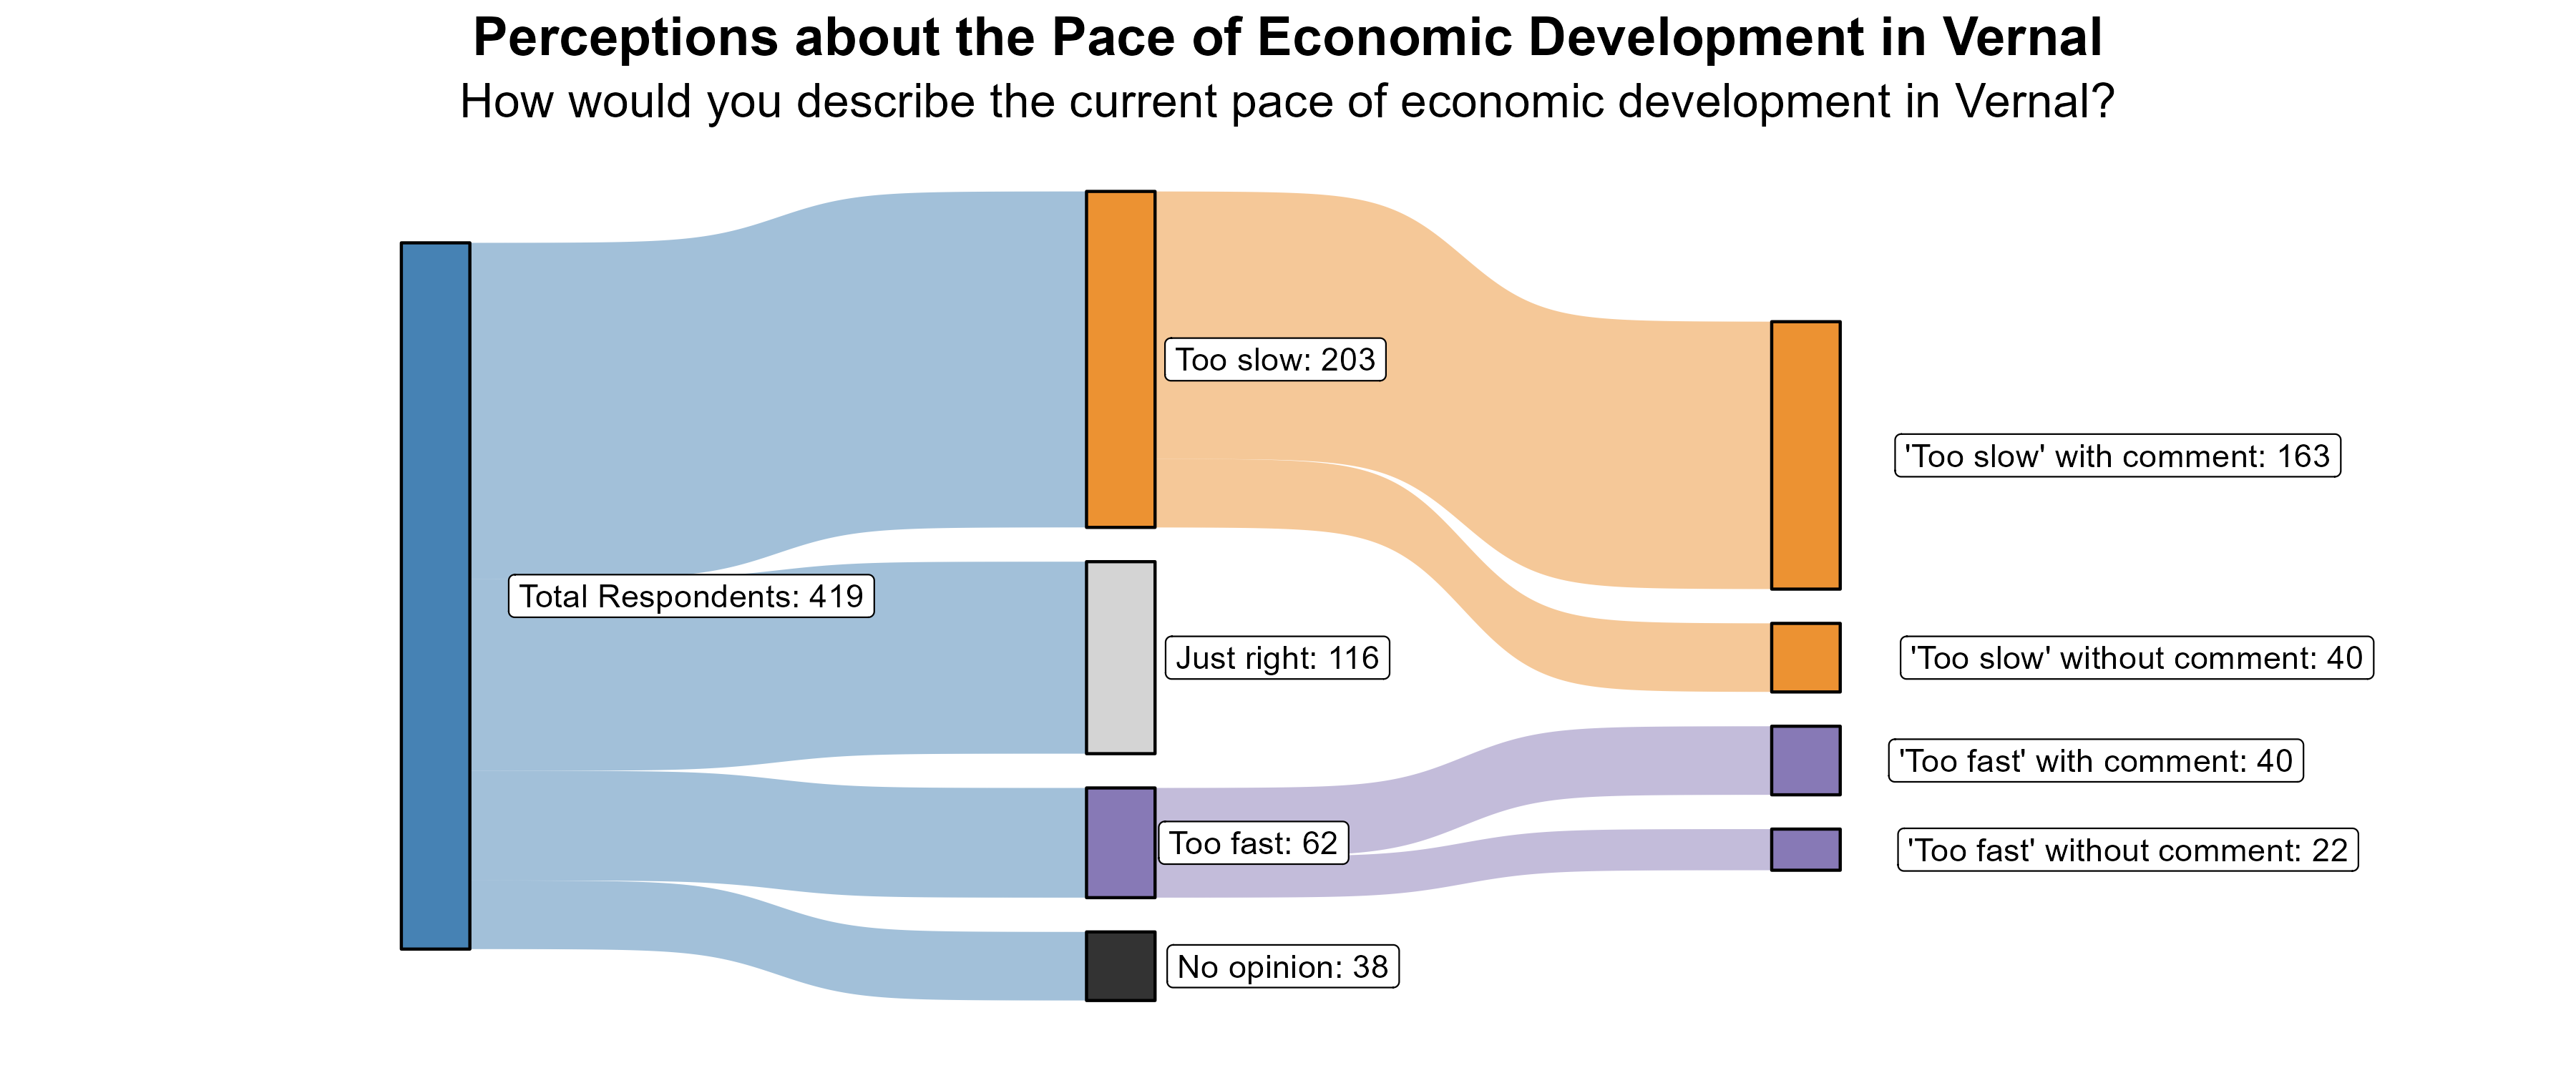
The 48% of respondents who rated the pace of economic growth as “too slow” were further asked what aspects of the local economy they would like to see more of in Vernal. The most common comment addressed the desire for more retail opportunities particularly more shopping, restaurants, and entertainment options in Vernal. Another common request was for more diversified job opportunities. Comments expressed the desire to see jobs beyond those in the oil industry and worry about the place being a boom-and-bust town. There were also comments about the cost of living being outside their means and a desire for more affordable housing and shopping.
Additionally, the 15% of respondents who rated the pace of economic growth as “too fast” were further asked what aspects of the local economy they feel are growing too quickly in Vernal. The few comments included a sadness over losing the small-town culture of Vernal, a lack of job opportunities, not enough housing supply, and a lack of proper city planning surrounding economic growth and the future.
Transportation in Vernal
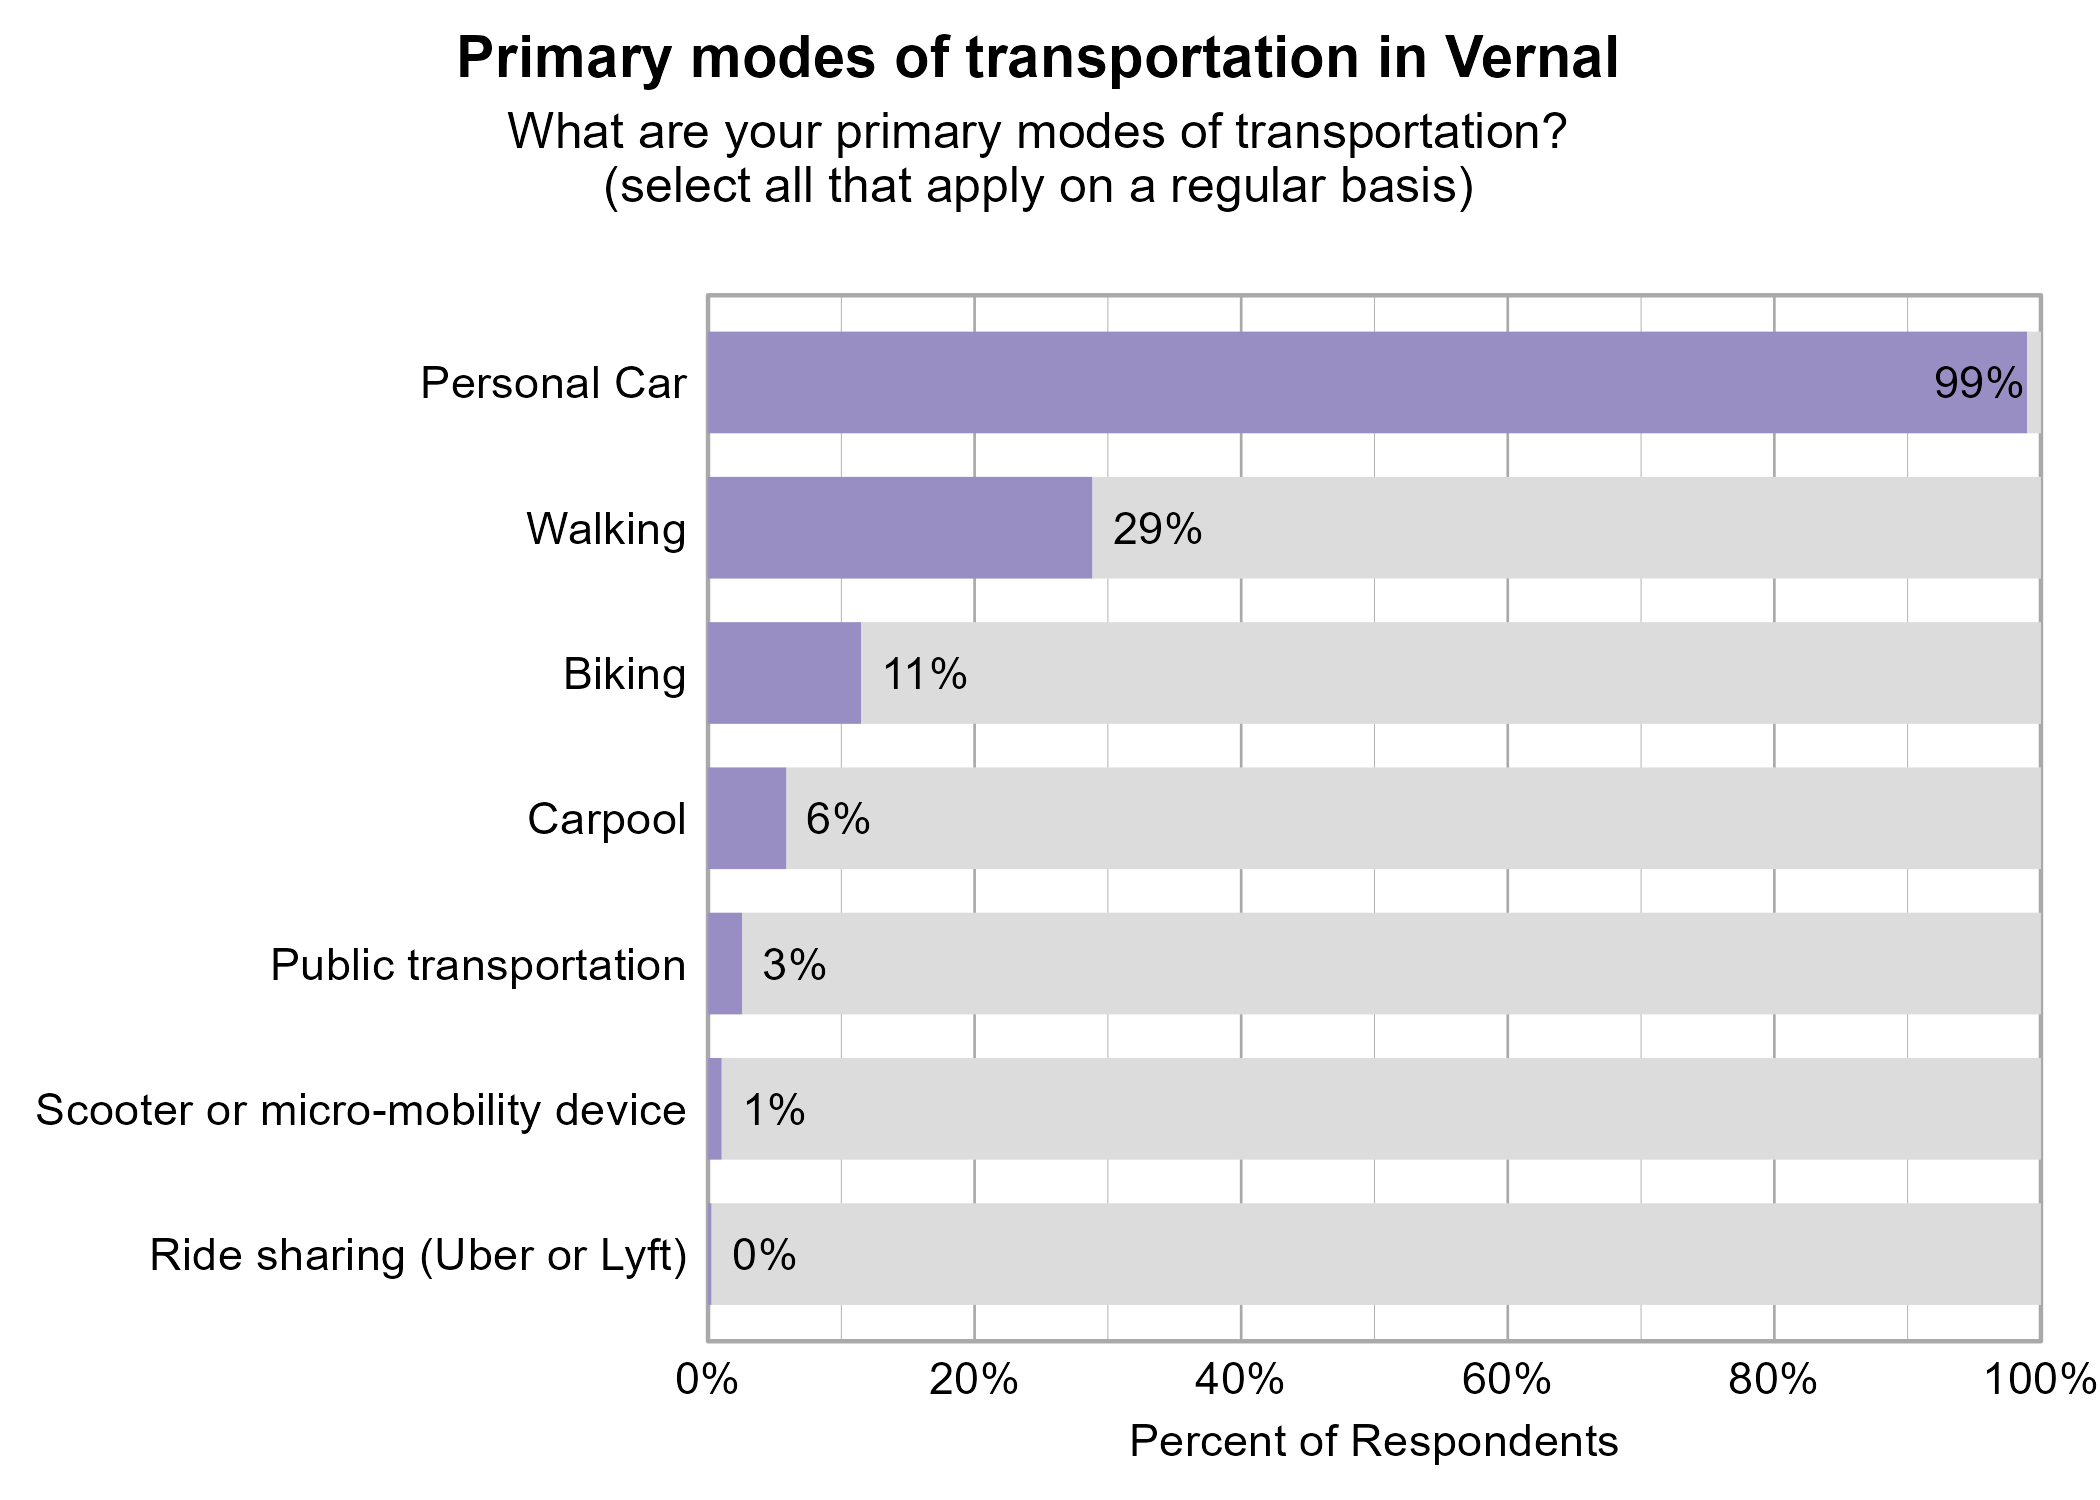
Respondents were asked to indicate all of their primary modes of transportation on a regular basis in Vernal. The most popular modes of transportation were personal car (99%) and walking (29%).
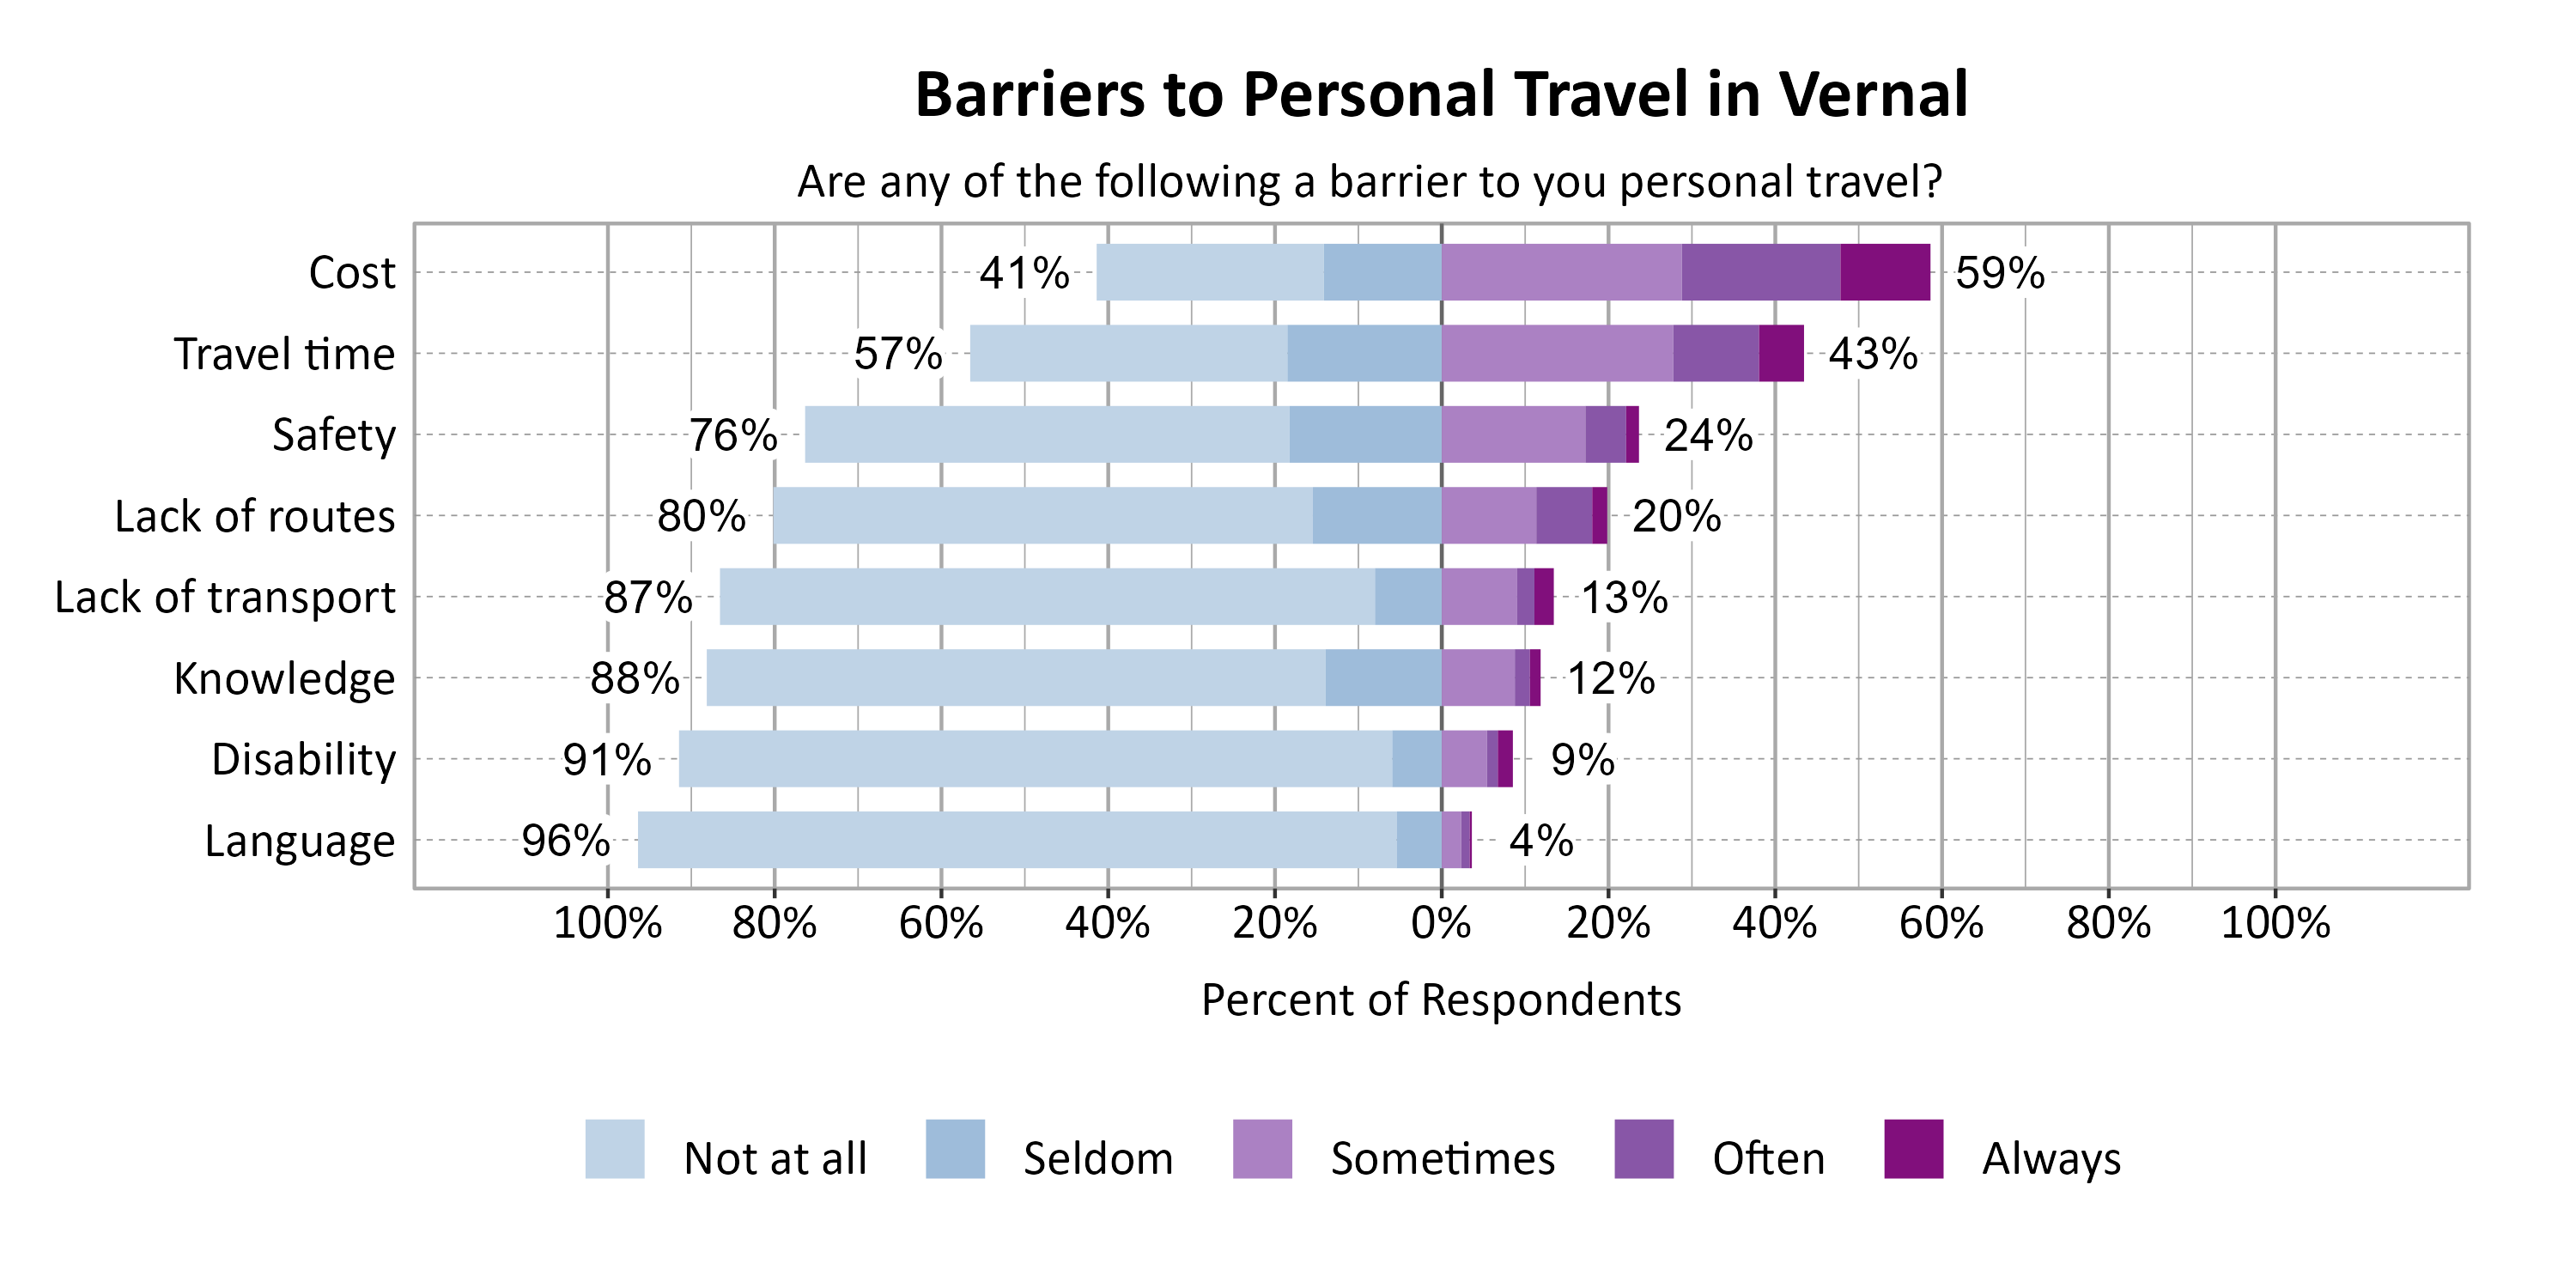
Respondents were asked to indicate the most common barriers to transportation in Vernal. The most problematic barriers were Cost (59%) and Travel time (43%).
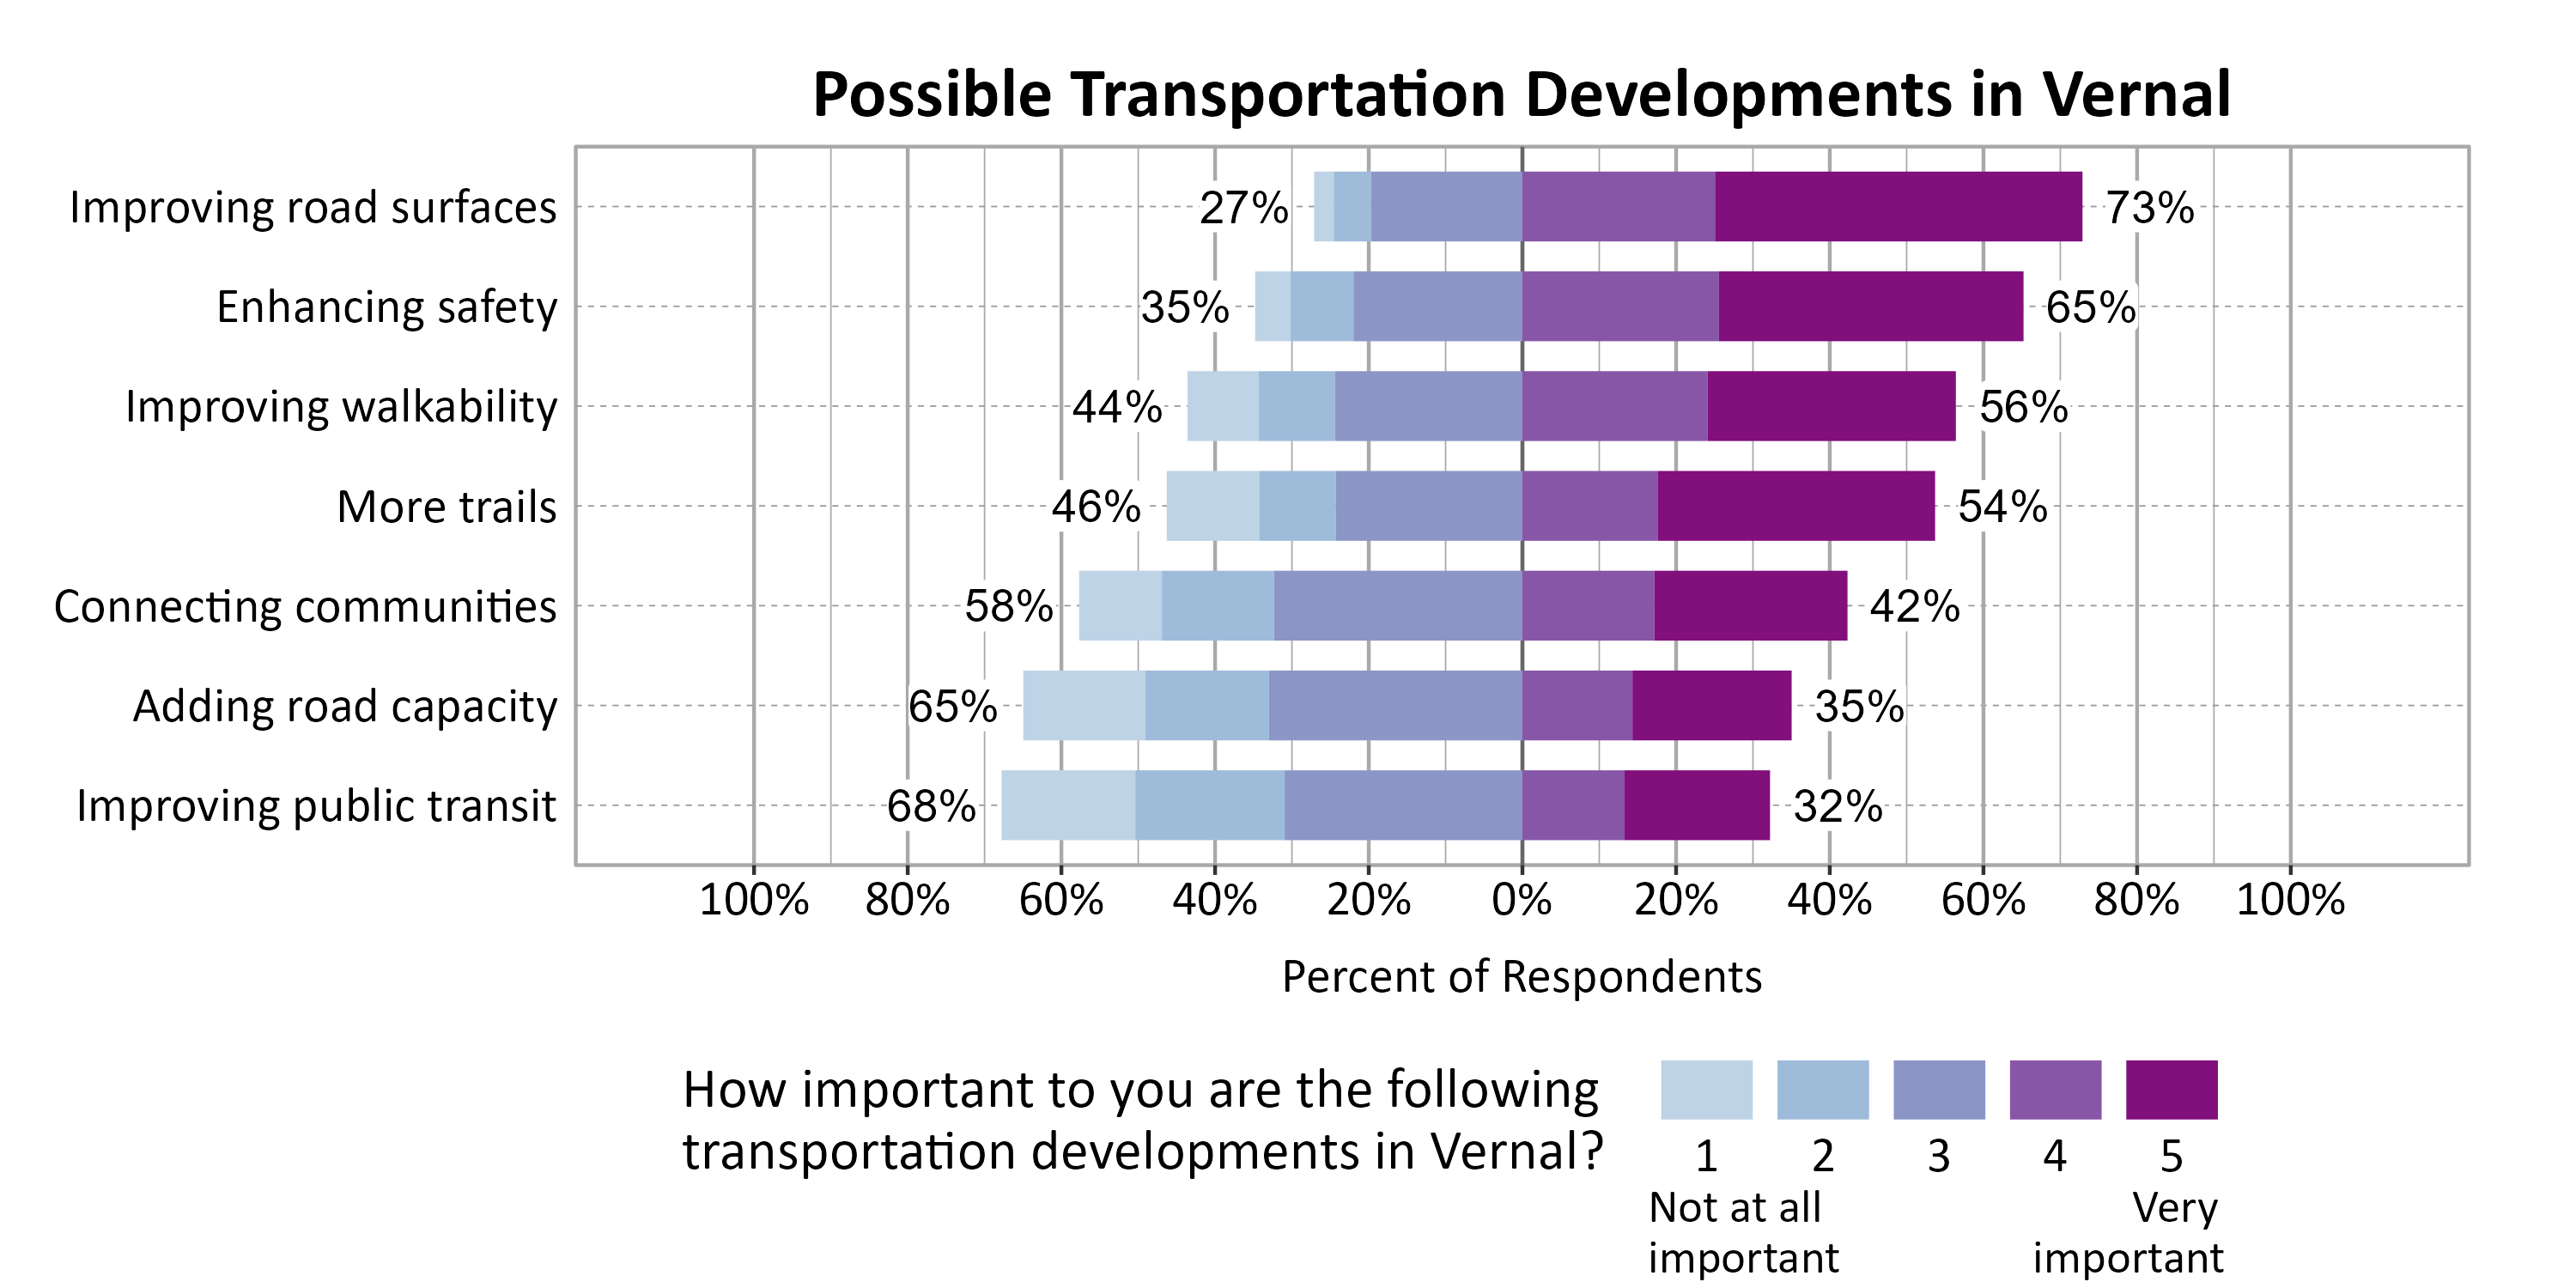
Respondents were asked to indicate the importance of a set of possible transportation developments in Vernal. The most important development to respondents were Improving road surfaces (73%), Enhancing safety (65%), and Improving walkability (56%).
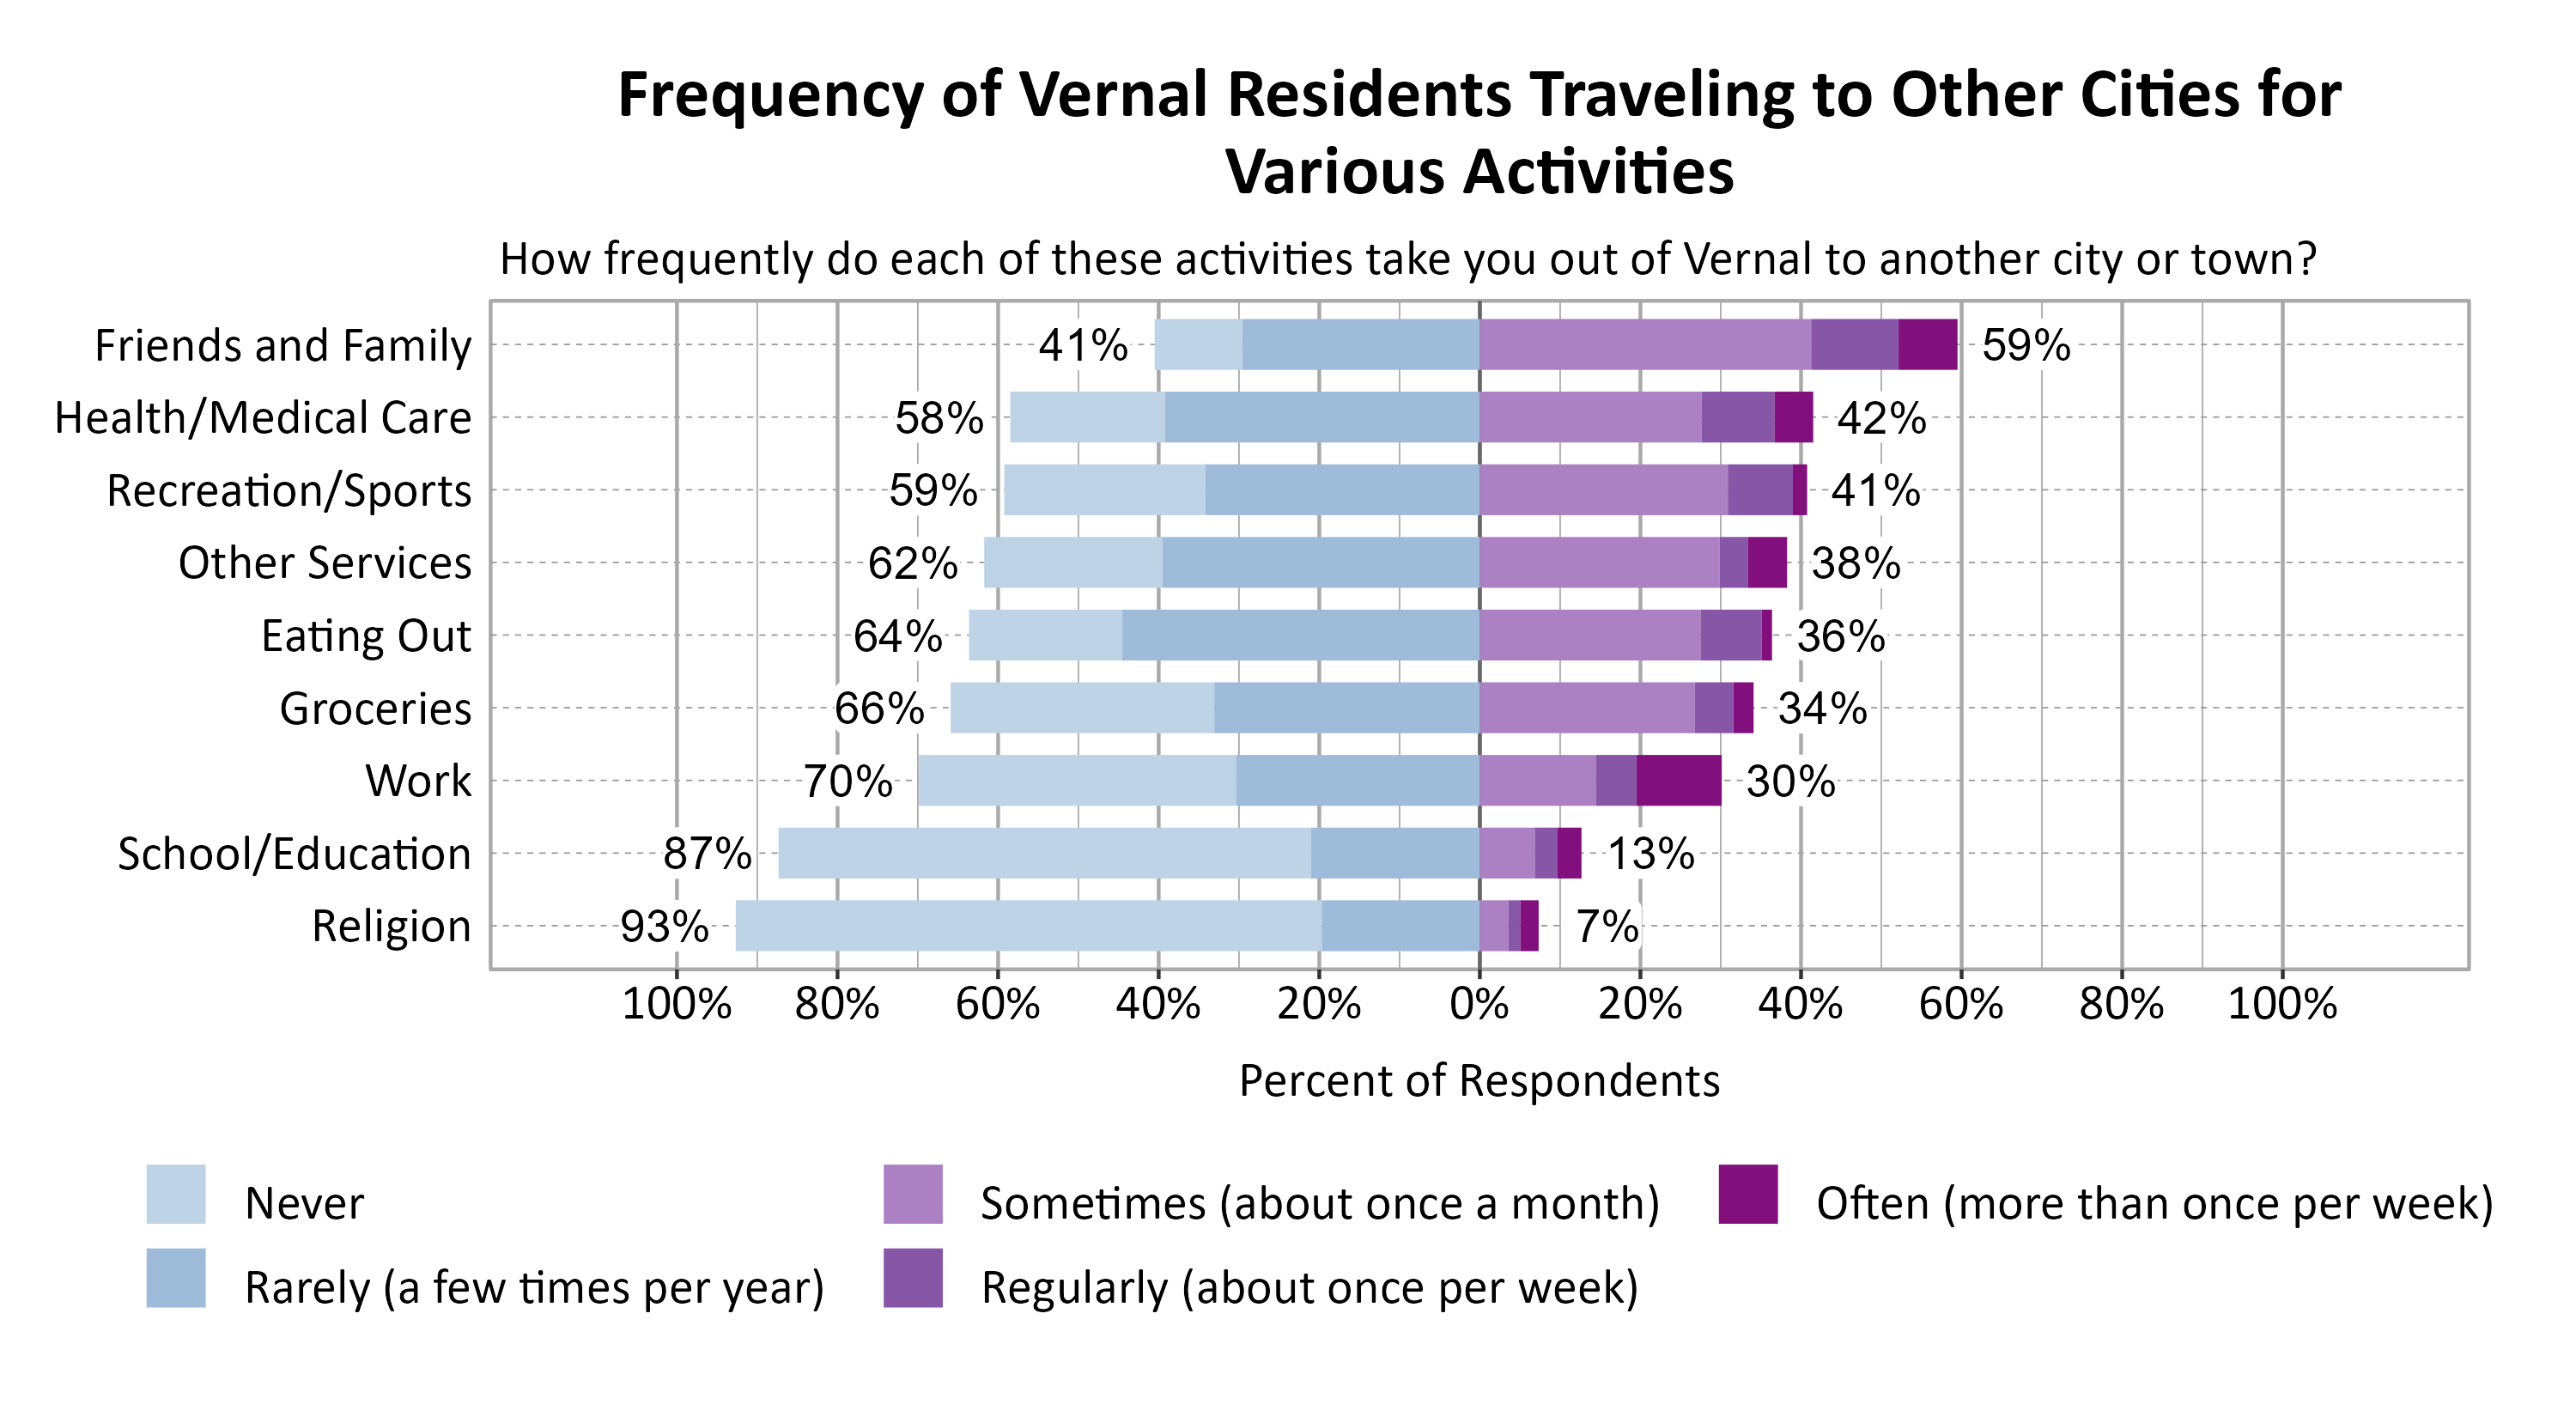
Respondents were asked to indicate how frequently various activities take them out of Vernal to another city or town. The most commonly indicated reasons for traveling to another city or town at least sometimes or once a month were Friends and Family (59%), Health/Medical Care (42%), and Recreation/Sports (41%).
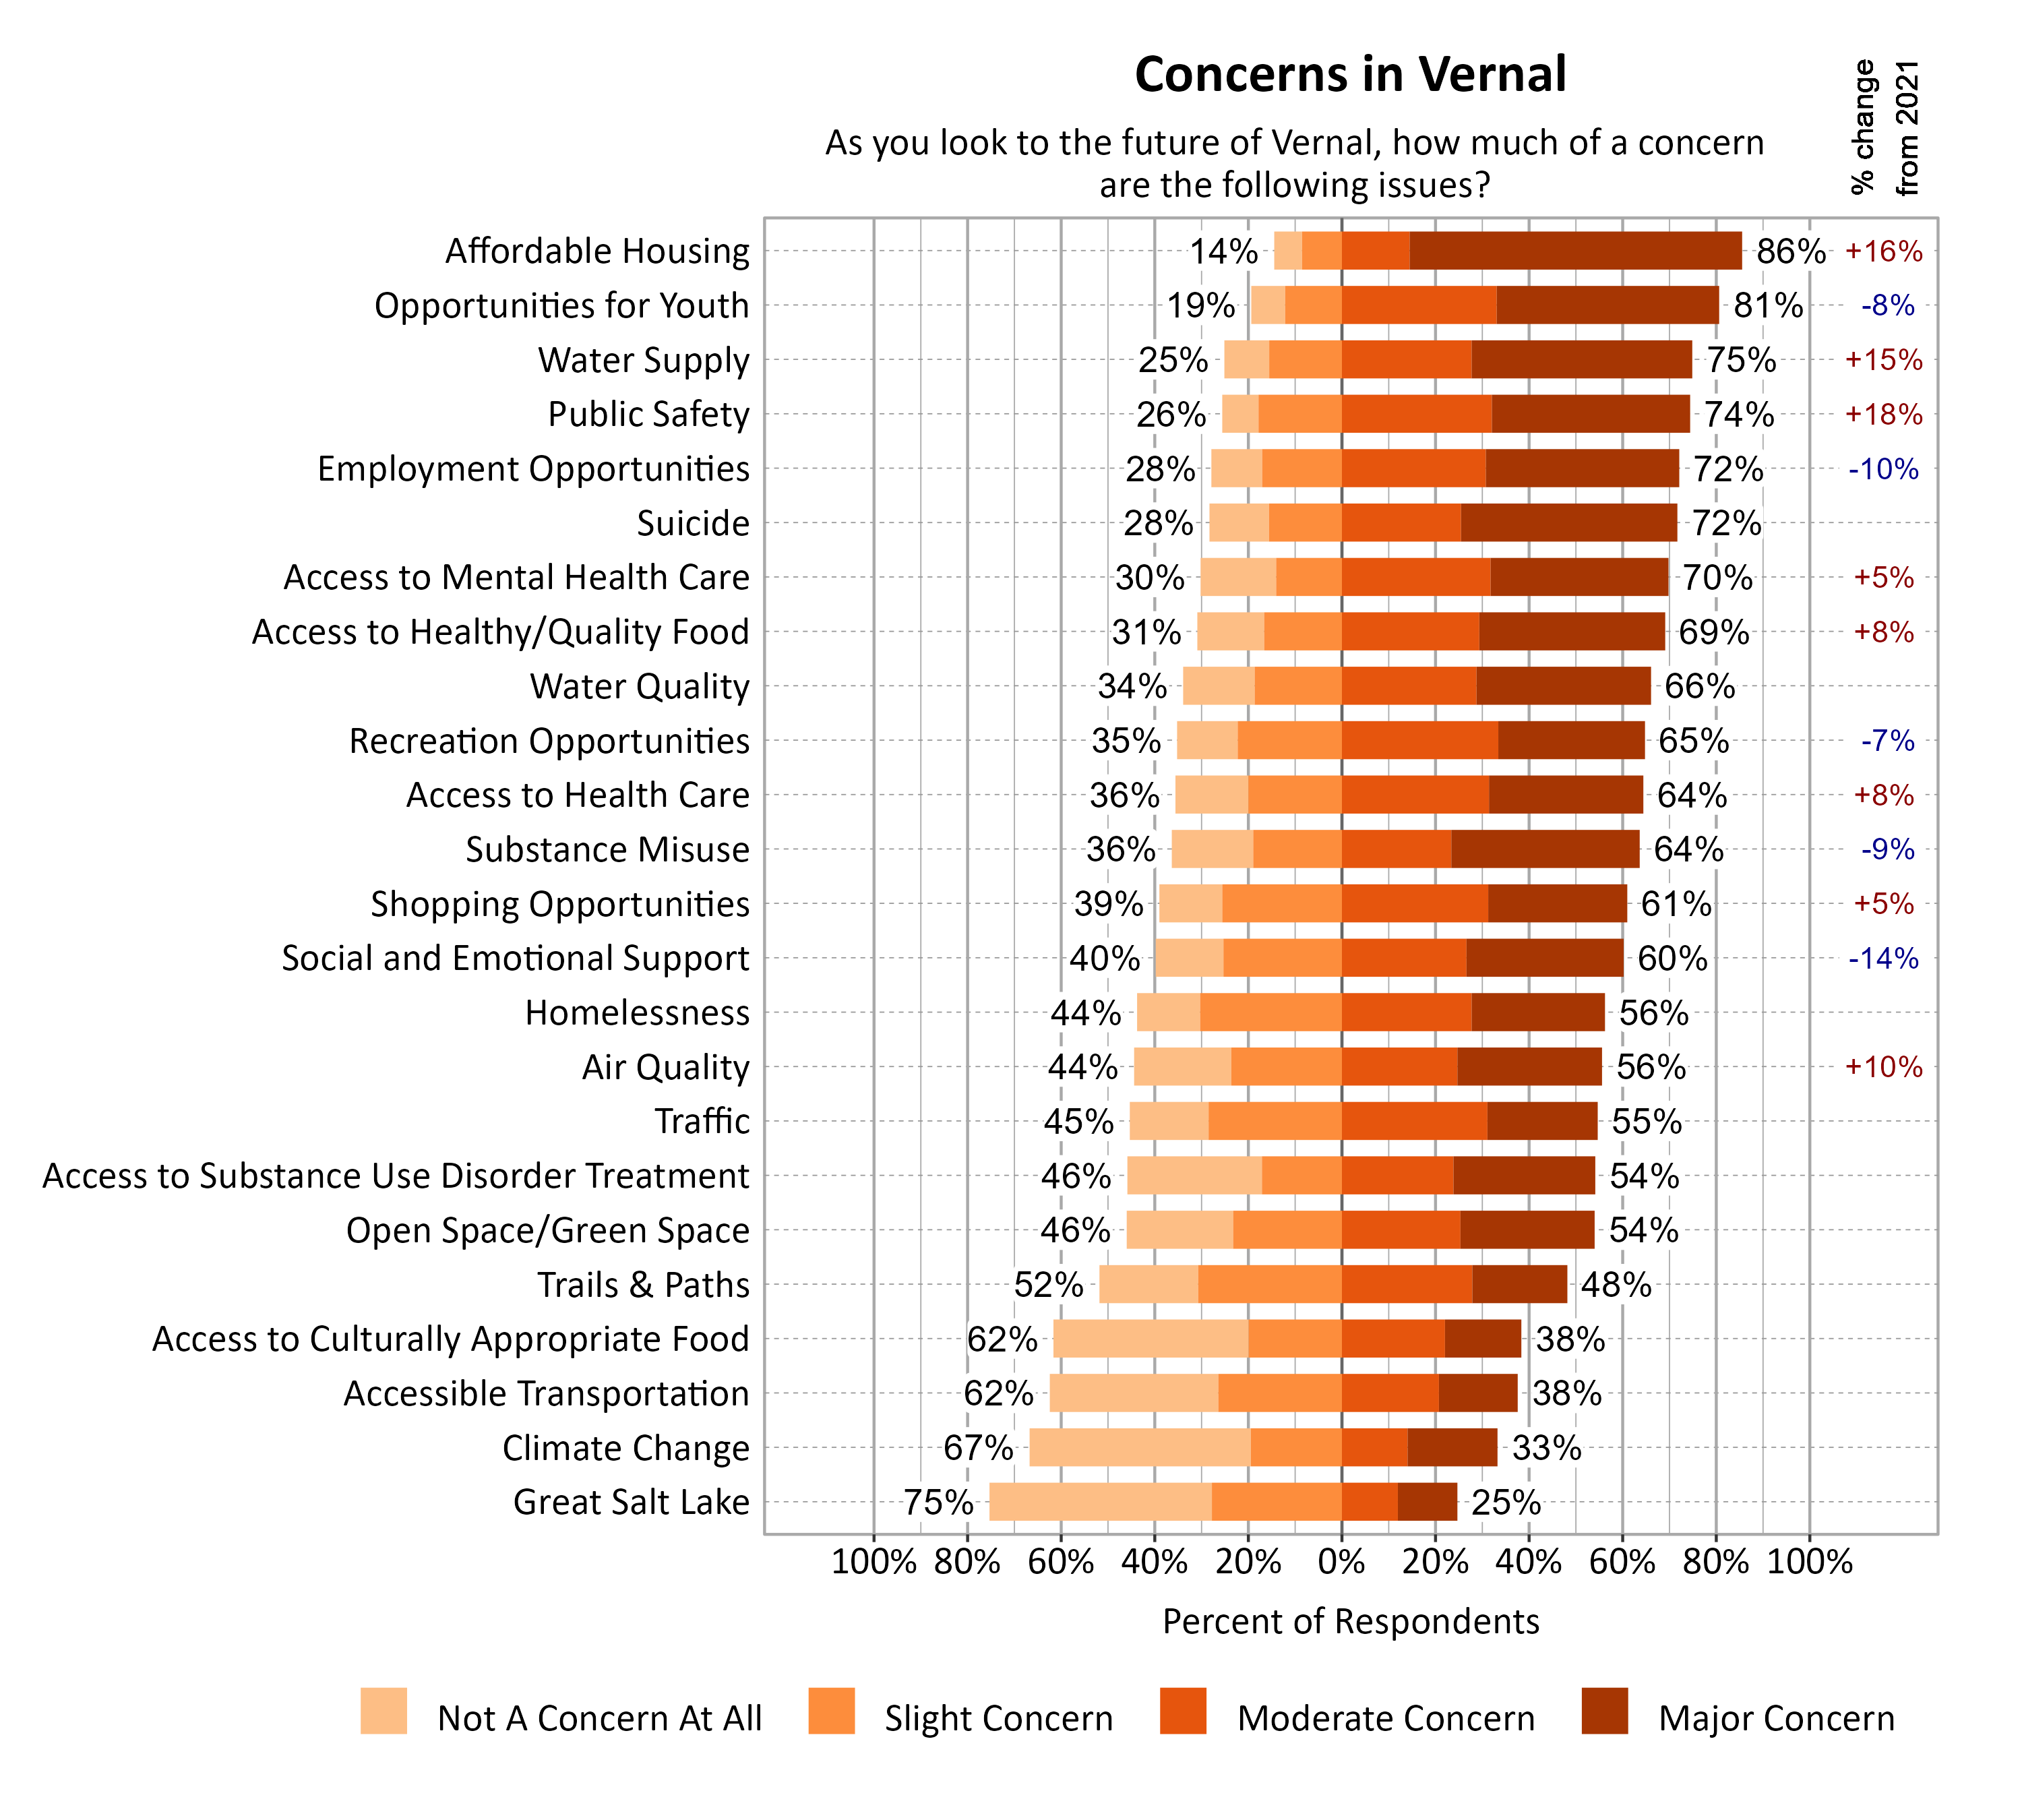
Concerns in Vernal
Survey respondents indicated the degree to which a number of possible local issues were a concern as they look to the future of Vernal. Affordable Housing (86%), Opportunities for Youth (81%), Water Supply (75%), and Public Safety (74%) were the top concerns. Since 2021, moderate or major concern about public safety (+18%), affordable housing (+16%), water supply (+15%), and air quality (+10%) notably increased, while concern about social and emotional support (-14%) and employment opportunities (-10%) notably decreased.
Additional Questions for Vernal
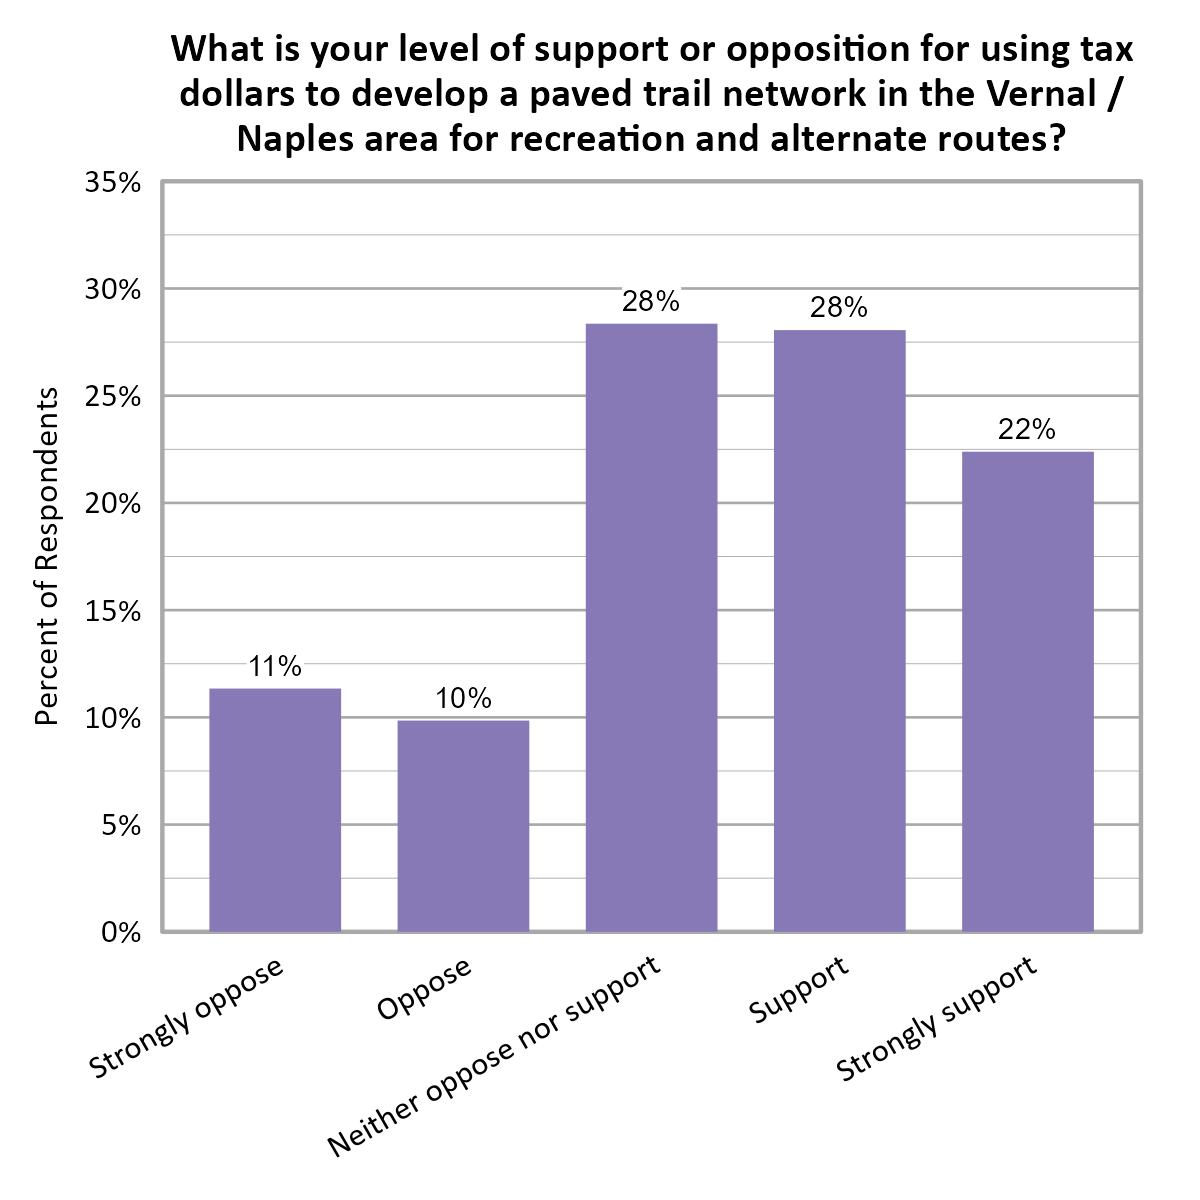
Proposed Paved Trail
Respondents were asked to indicate their level of support or opposition for using tax dollars to develop a paved trail network in the Vernal/Naples area for recreation and alternate routes. 50% of respondents indicated they supported or strongly supported it, 21% indicated that they oppose or strongly oppose it, and 28% indicated that they neither oppose nor support it.
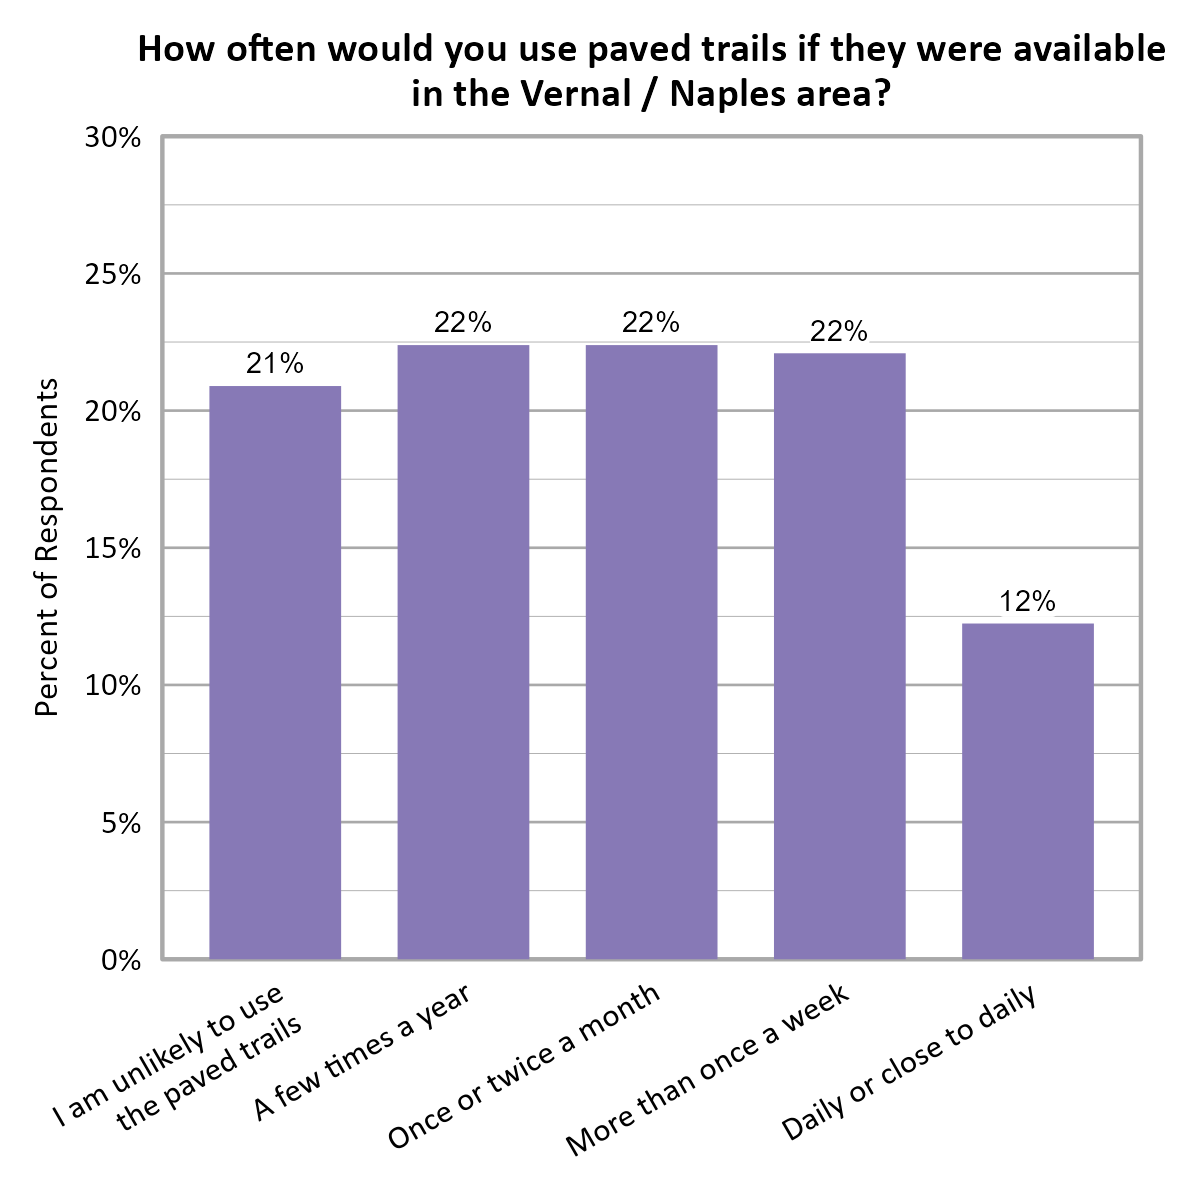
In addition, respondents were asked to indicate how often they would used a proposed paved trail system in the Vernal/Naples area. Residents were varied across the multiple options, from being unlikely to use the paved trails to using them more than once a week and a few would use them daily or close to daily.
Fast-Food Frequency
Respondents were also asked to indicate how frequently they eat out at a fast-food restaurant. The largest proportion of respondents indicated that they eat out sometimes, or 1-3 times per month (46%).

Open Comments
All open comments collected in the survey were shared with city leaders. General observations and themes are shared here.
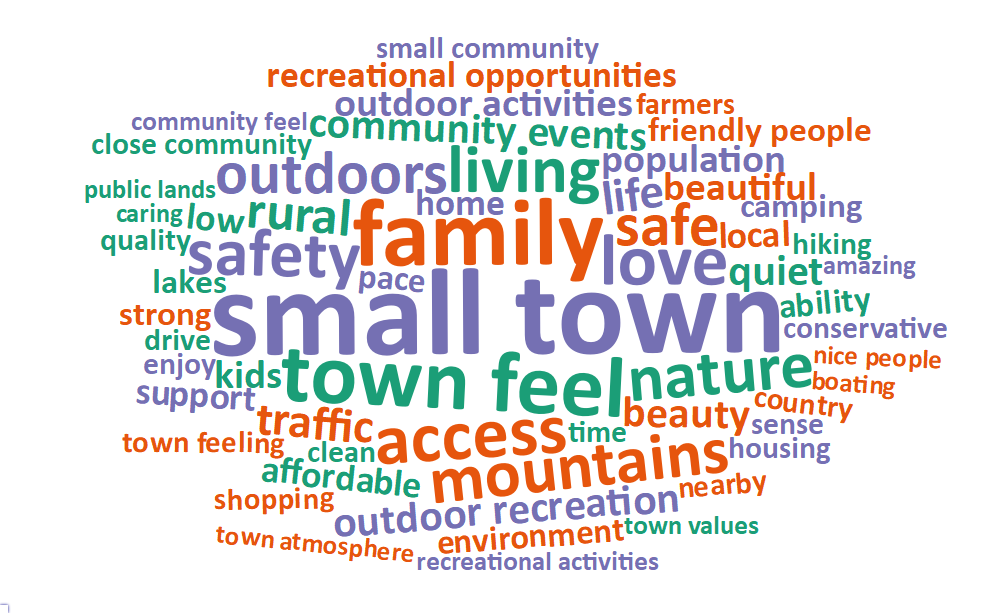
What Respondents Value Most in Vernal
Survey respondents were asked to comment on what they value most about Vernal. The most common words and phrases from all city comments are included in the word cloud below. It is possible that negative or unrelated words may appear since these words have been taken out of context, and they may not indicate the respondent’s intended meaning. The dominant values expressed were the beautiful nature and abundant recreational opportunities, the social connections and wonderful community, and the small-town feeling.
Local Environmental Quality in Vernal
The 48% of respondents who rated the Local Environmental Quality domain as 1, 2, or 3 (Poor, Fair, or Moderate) were further asked if there are specific aspects of local environmental quality that they feel are problematic. Concerns focused on the nearby oil rigs that were thought to be an eyesore and to impact air quality. Air quality was also a major concern, as well as problems with trash, particularly dust and litter.
Improving Wellbeing in Vernal
Survey respondents were asked if there is anything that could be done to improve wellbeing in Vernal. Comments expressed a desire to see better access to healthcare (particularly mental health care), lower cost of living, more affordable housing, more things to do and community events, more shopping and dining opportunities, more attention to issues related to drug use, and better options and infrastructure for biking and walking in town.
Additional Comments
Respondents were also asked if they had any additional comments on wellbeing in Vernal. Many comments explained that wellbeing is hard to address in Vernal because most people are just worried about getting a roof over their head first. Basic necessities were on many respondents’ minds. There were concerns about cost of living, homelessness, and access to healthcare as well as about safety, having activities for youth, and creating a more welcoming community.