Wellsville Wellbeing Survey Findings 2024
By Dr. Courtney Flint and Team
![]()
Contact Information
Dr. Courtney Flint
courtney.flint@usu.edu
435-797-8635
Summary
Wellsville is one of 51 cities participating in the Utah Wellbeing Survey Project in 2024. This project is designed to assess the wellbeing and local perspectives of city residents and to provide information to city leaders to inform general planning processes. Additional analysis is underway and this report may be updated over time.
We are grateful to all those who took the survey and to our city partners who helped to make this possible. We are grateful to a number of entities for funding: the Utah League of Cities and Towns, USU Extension, USU’s Institute for Land Water and Air, the Wasatch Front Regional Council, Utah Department of Transportation, the Utah Agricultural Experiment Station, and the cities of Alpine, Cedar Hills, Draper, Millcreek, Nephi, North Salt Lake, Ogden, Orem, Pleasant Grove, Providence, Springdale, Tremonton, West Bountiful, and West Valley City.
This report describes findings from the 2024 Wellsville survey and comparative information with other project cities. In April and May 2024, Wellsville City advertised the survey for residents largely through social media, a City newsletter, and mobile texts. All city residents age 18+ were encouraged to take the online Qualtrics survey.
How many people responded?
- 177 viable surveys were recorded in this 2024 survey effort.
- The adult population of Wellsville was estimated at 2,616, based on the American Community Survey by the U.S. Census. The 177 survey responses in 2024 represent 6.8% of the adult population and have a conservative margin of error of 7.11%.
Survey Respondent Characteristics
| Resident Statistics | |
|---|---|
| Full Time Residents of Wellsville | 97.7% |
| Part Time Residents of Wellsville | 2.3% |
| Length of Residency — Range | 1-75 years |
| Length of Residency — Average | 21.9 years |
| Length of Residency — Median | 17 years |
| Length of Residency 5 Years or less | 20.0% |
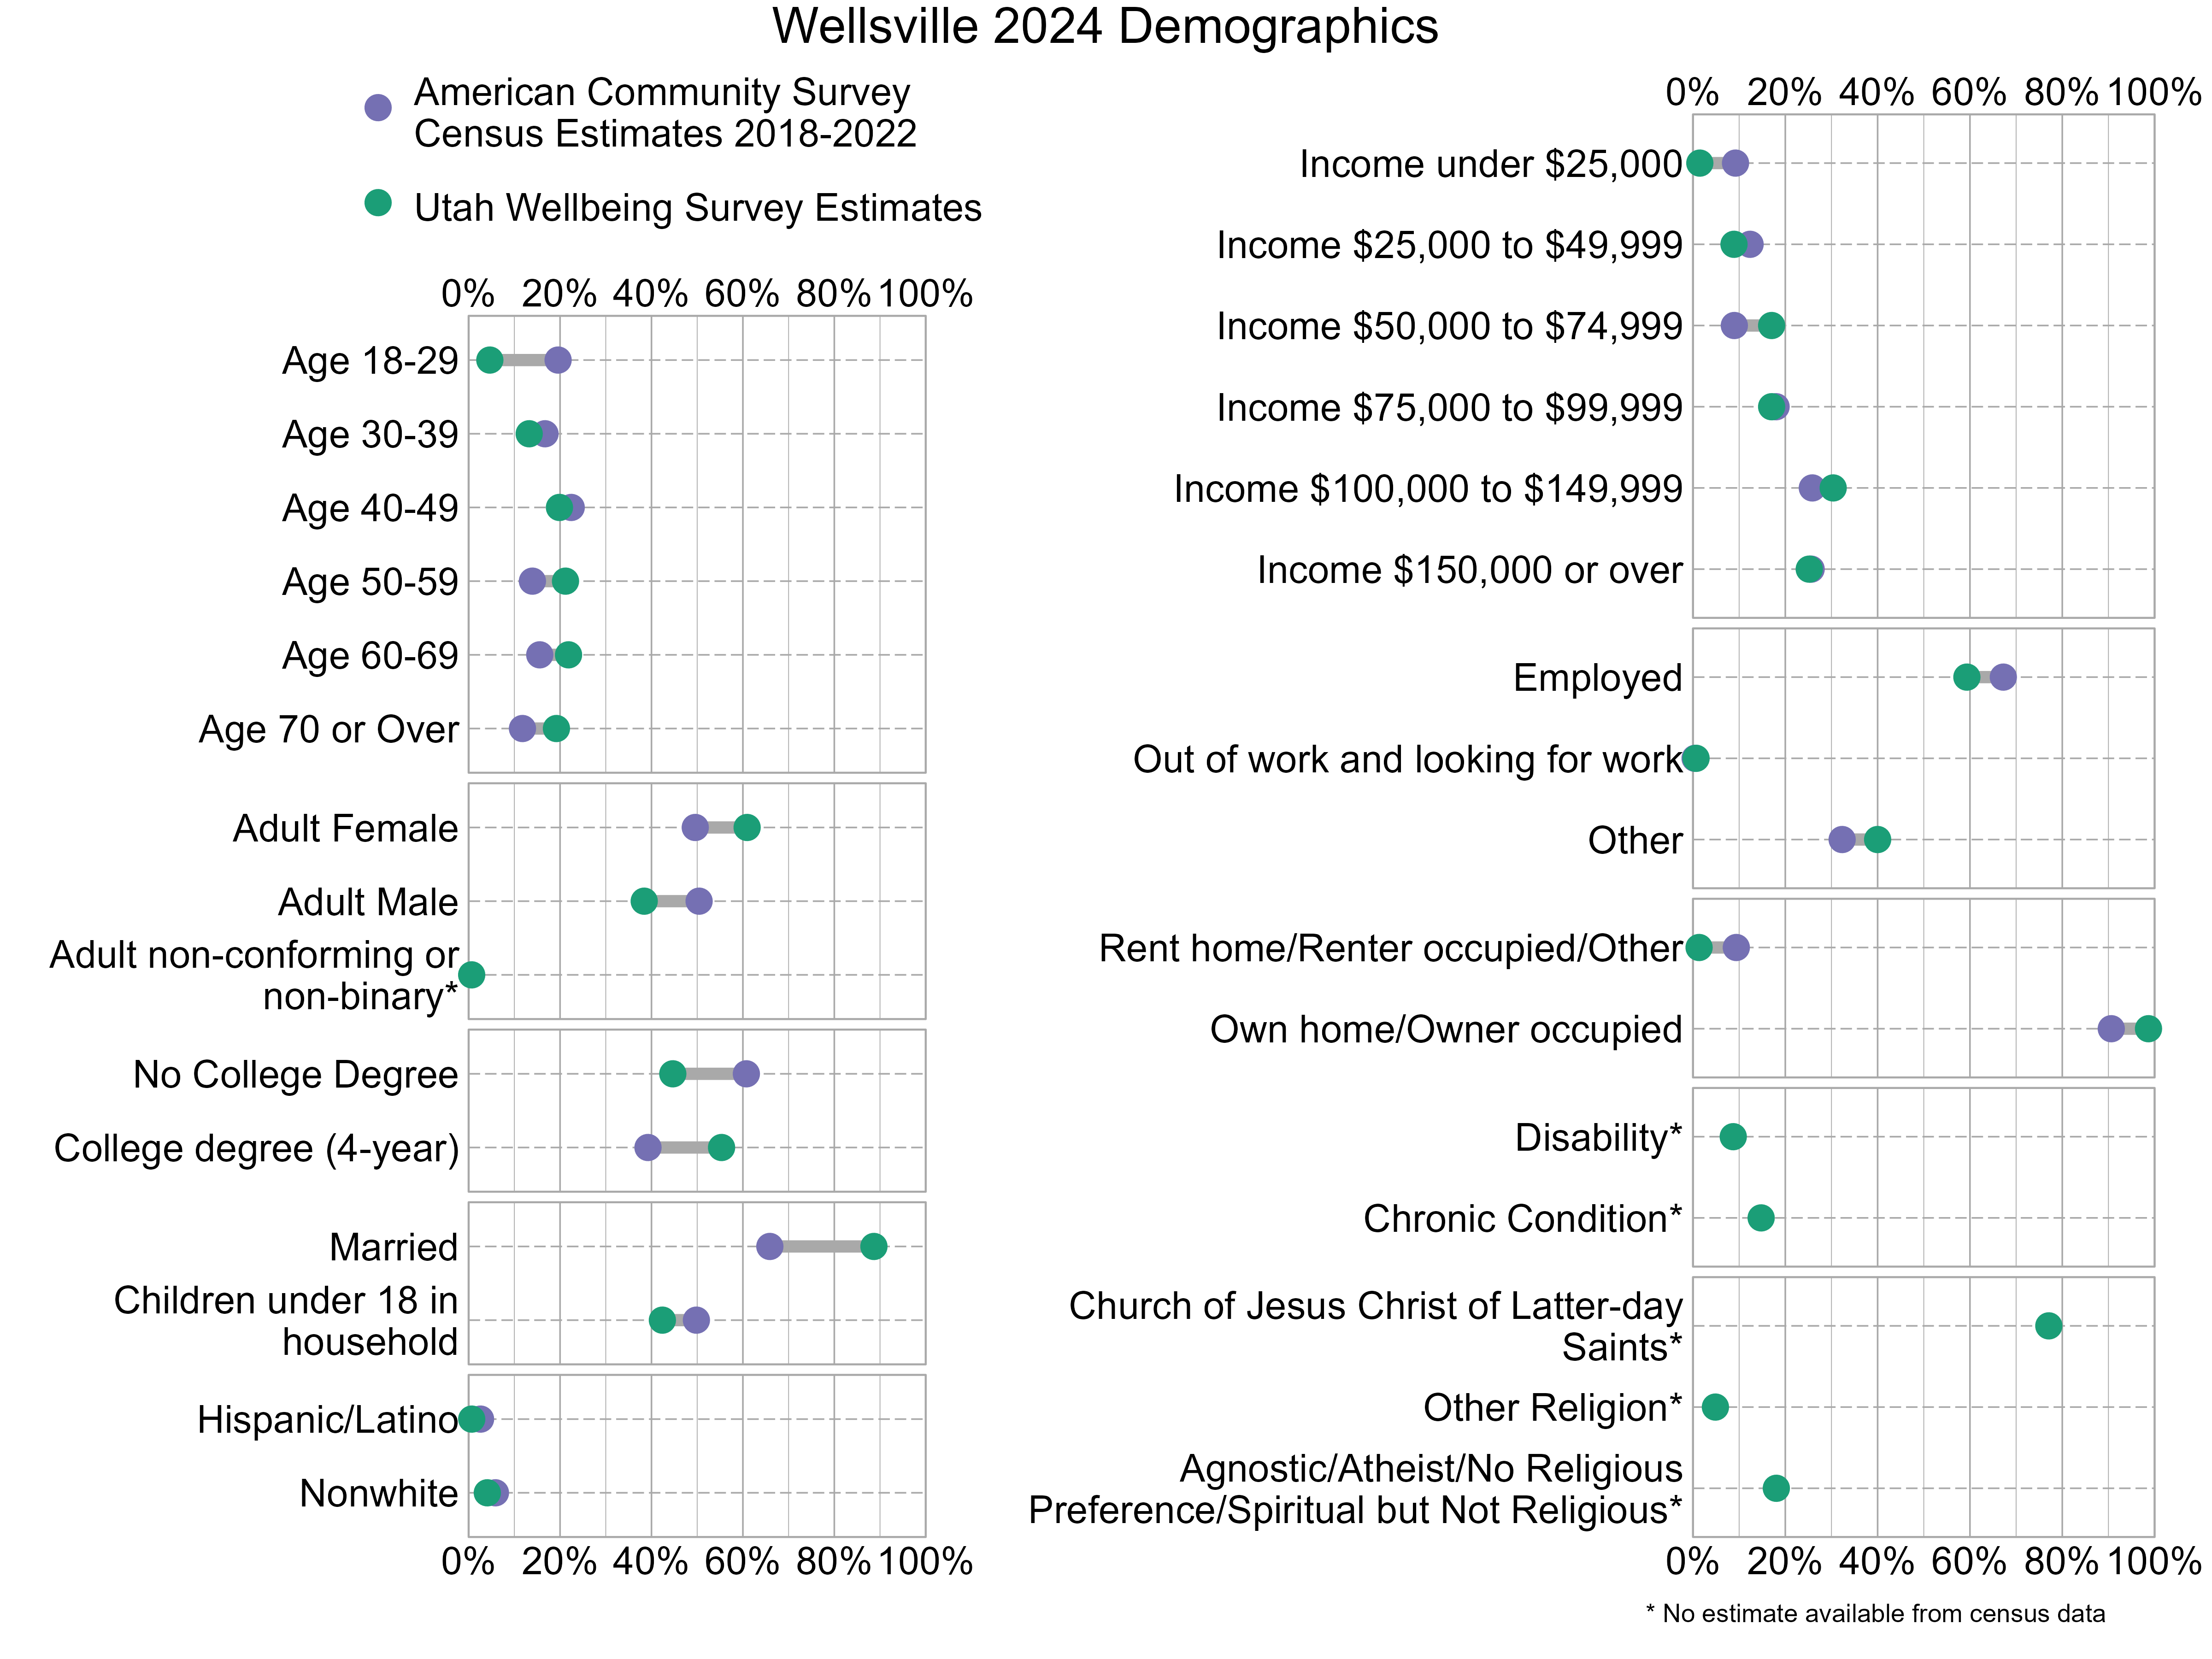
Demographic characteristics of the survey respondents were compared below with U.S. Census information from the 2018-2022 American Community Survey. In the graph below, gray bars indicate differences between the American Community Survey estimates and the Utah Wellbeing Project surveys. The wider the gray bars, the larger the differences. Also note that estimates for religious affiliation, adult non-conforming or non-binary gender, disability, and chronic conditions are unavailable from the census data. There can also be a variable margin of error in the American Community Survey estimates, and caution should be used when comparing estimates. Not all respondents provided demographic information. As the graph shows, 2024 survey respondents were not fully representative of Wellsville. People who have at least a 4-year college degree and are married were overrepresented while those who do not have a college degree were underrepresented.
Overall Personal Wellbeing and Overall Wellbeing in Wellsville
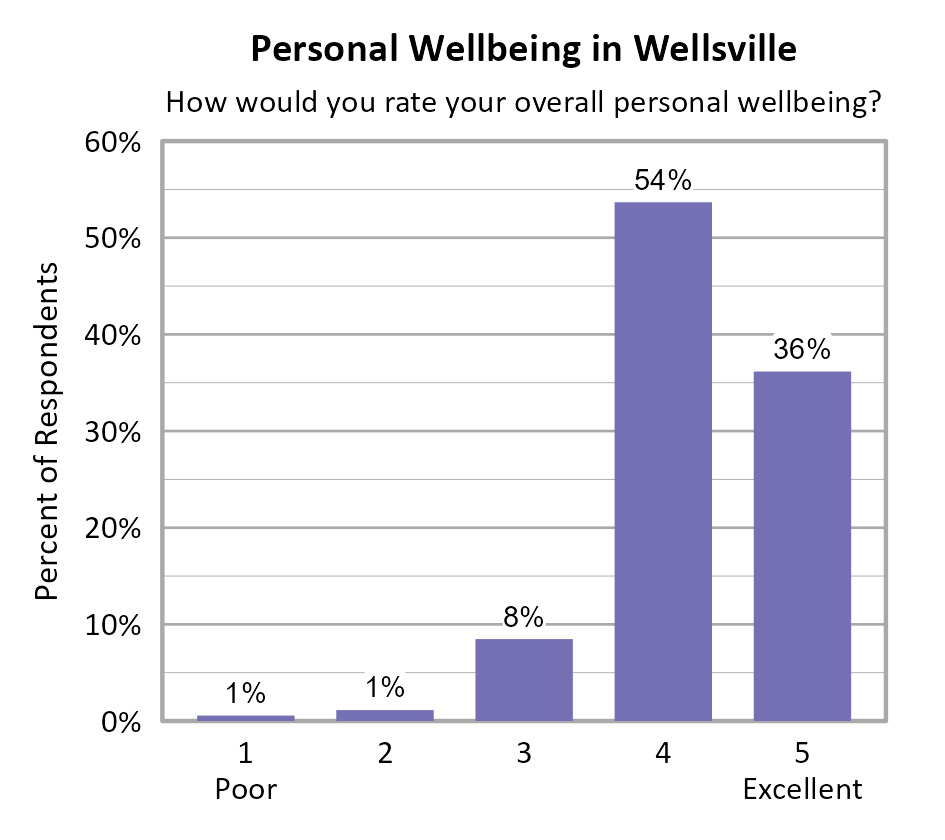
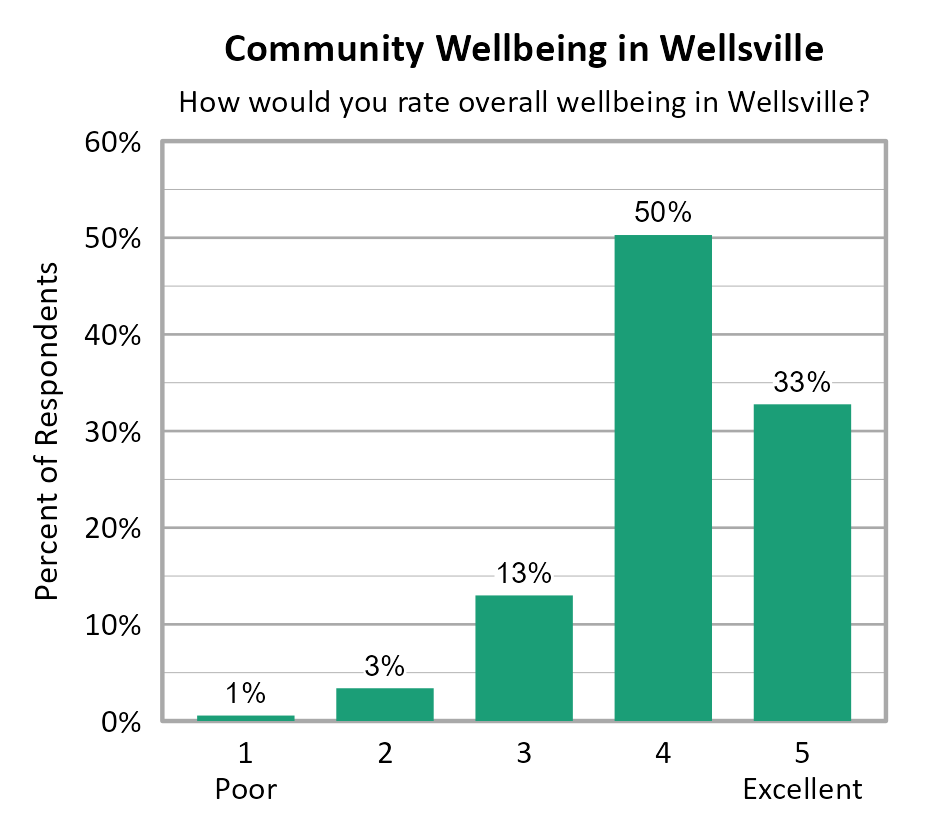
Survey participants were asked about their overall personal wellbeing and overall community wellbeing in Wellsville. These wellbeing indicators were both measured on a 5-point scale from poor (1) to excellent (5). The average personal wellbeing score in Wellsville was 4.24 with 90% of respondents indicating their wellbeing at a 4 or 5 on the 5-point scale. The average score for community wellbeing in Wellsville was 4.11 with 83% of respondents indicating community wellbeing at a 4 or 5 on the 5-point scale.
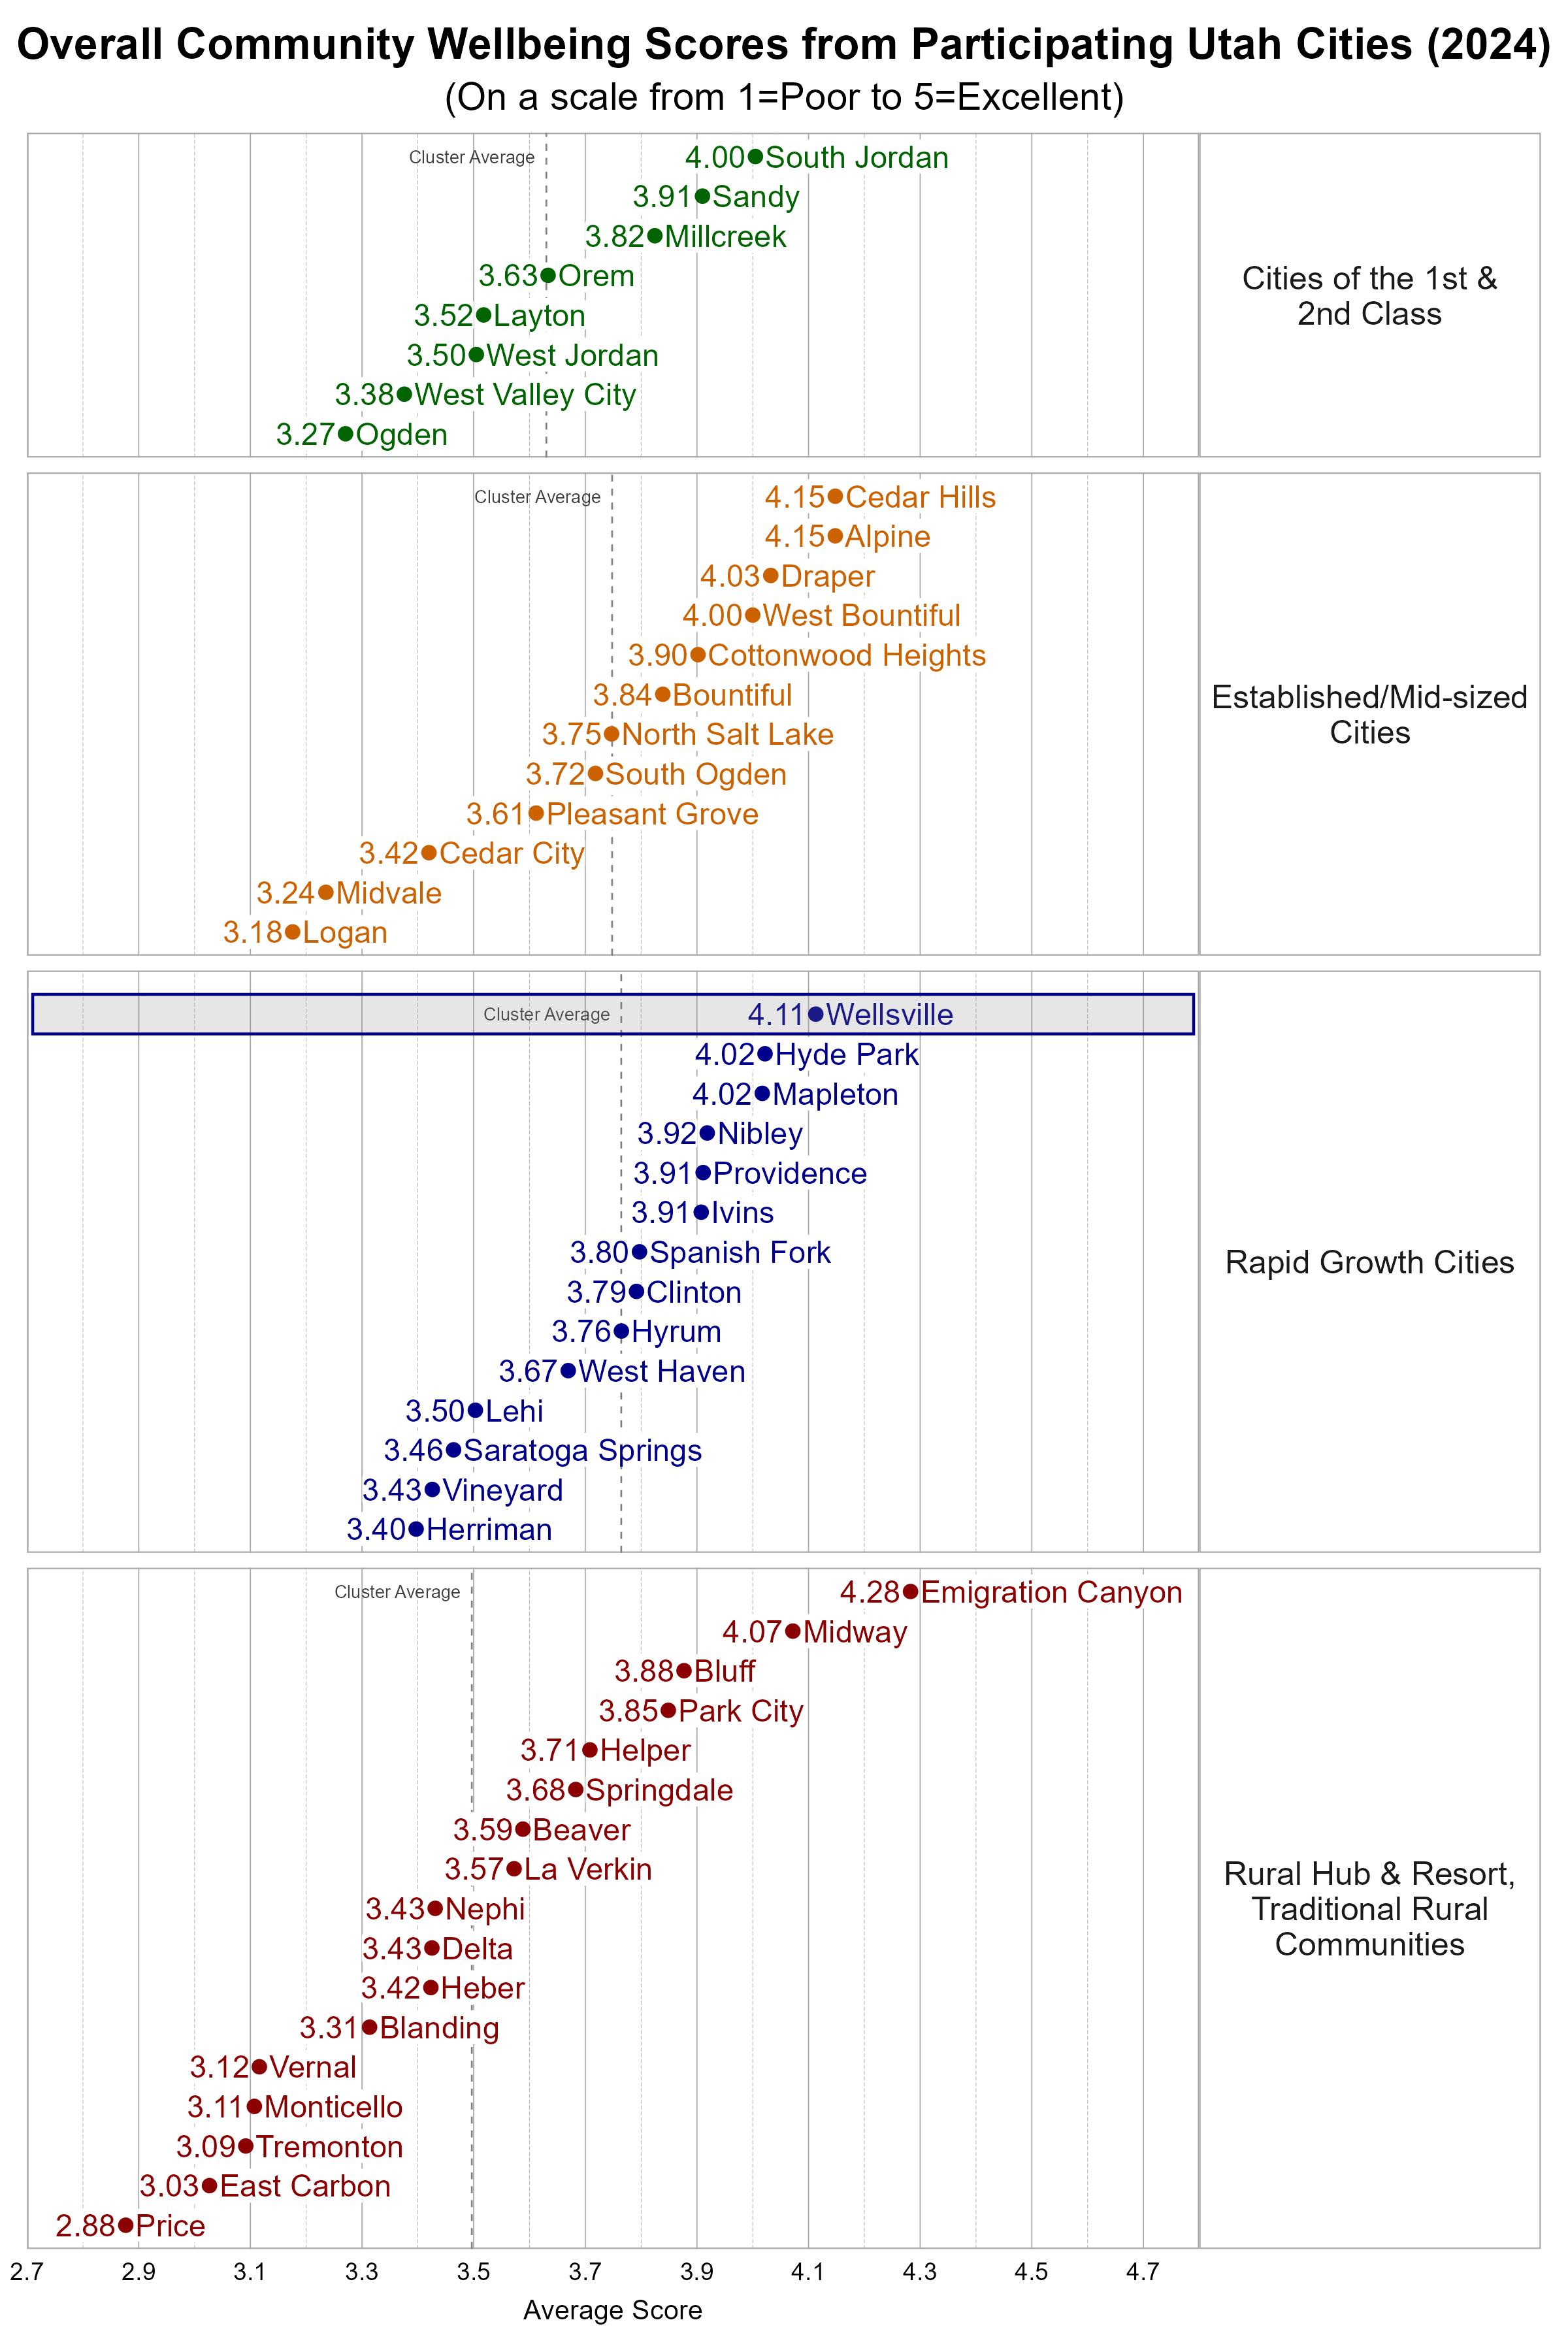
Comparing Wellbeing Across Utah Cities
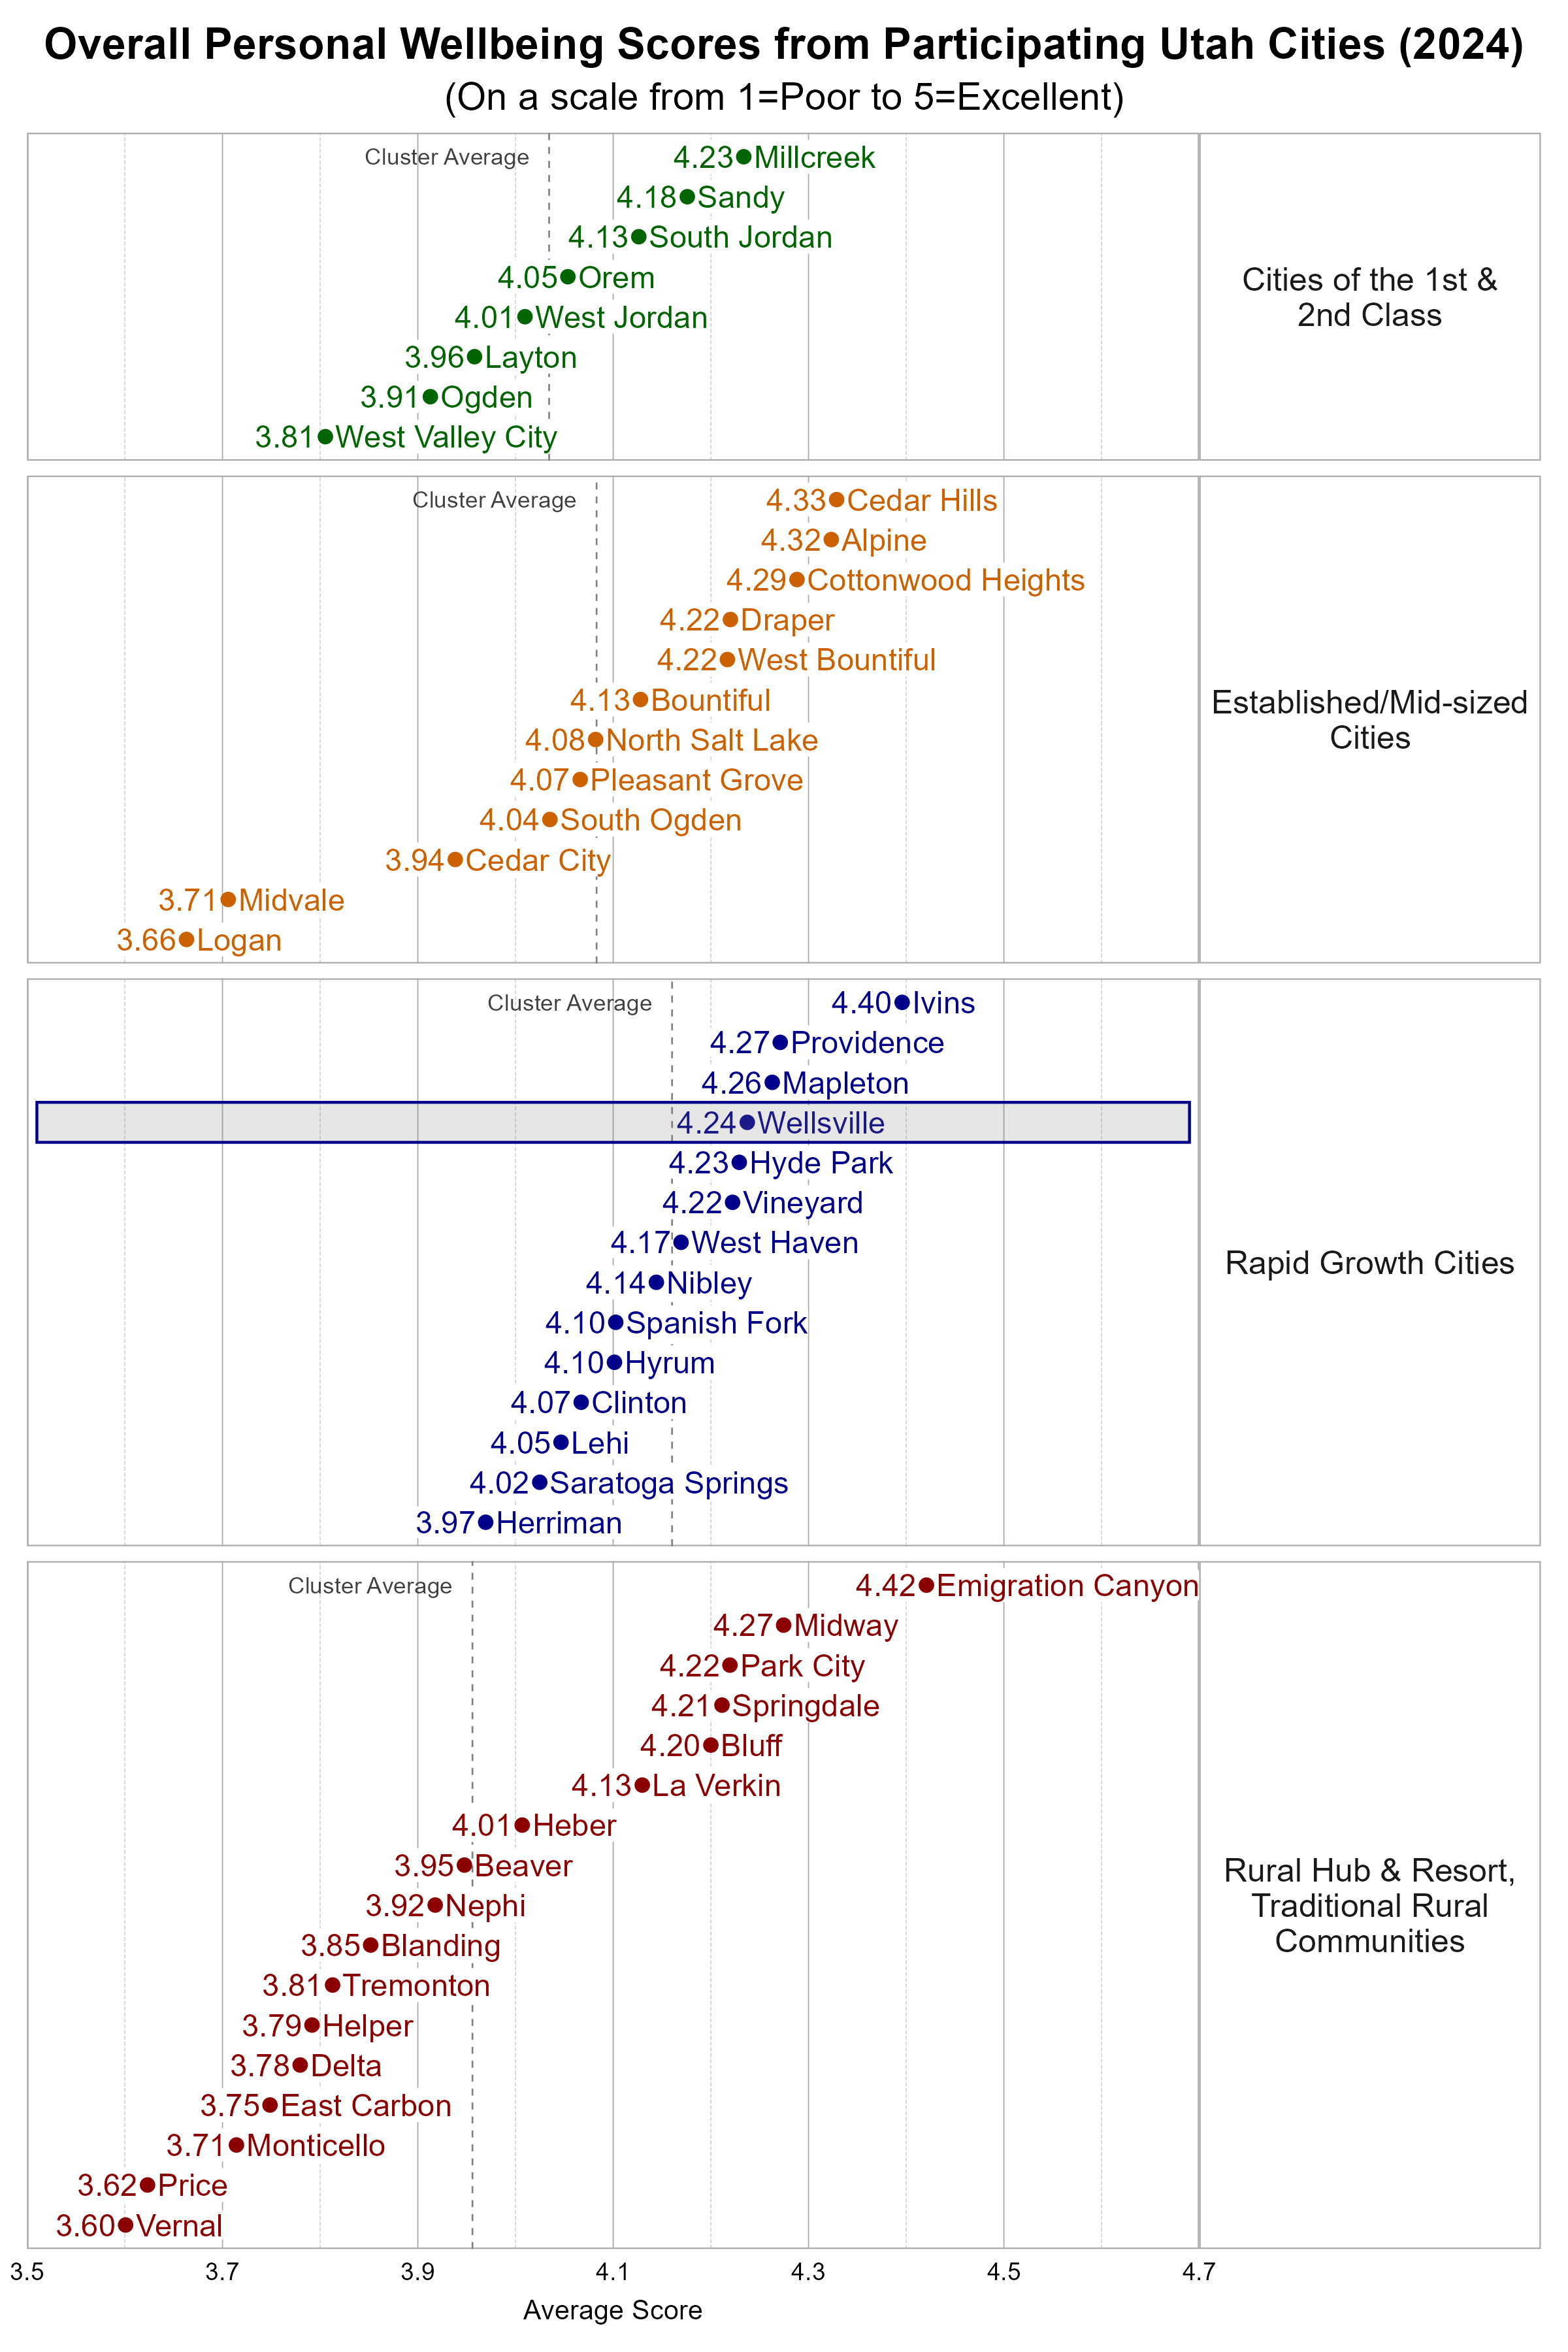
The Utah League of Cities and Towns clusters cities and towns into five different categories based on size and growth rates. We utilize these clusters in our analysis. Wellsville is classified as a Rapid Growth City. Some cities may fit within more than one cluster.
Within the Rapid Growth city cluster, Wellsville was above the average overall personal wellbeing score and well above the average overall community wellbeing score.
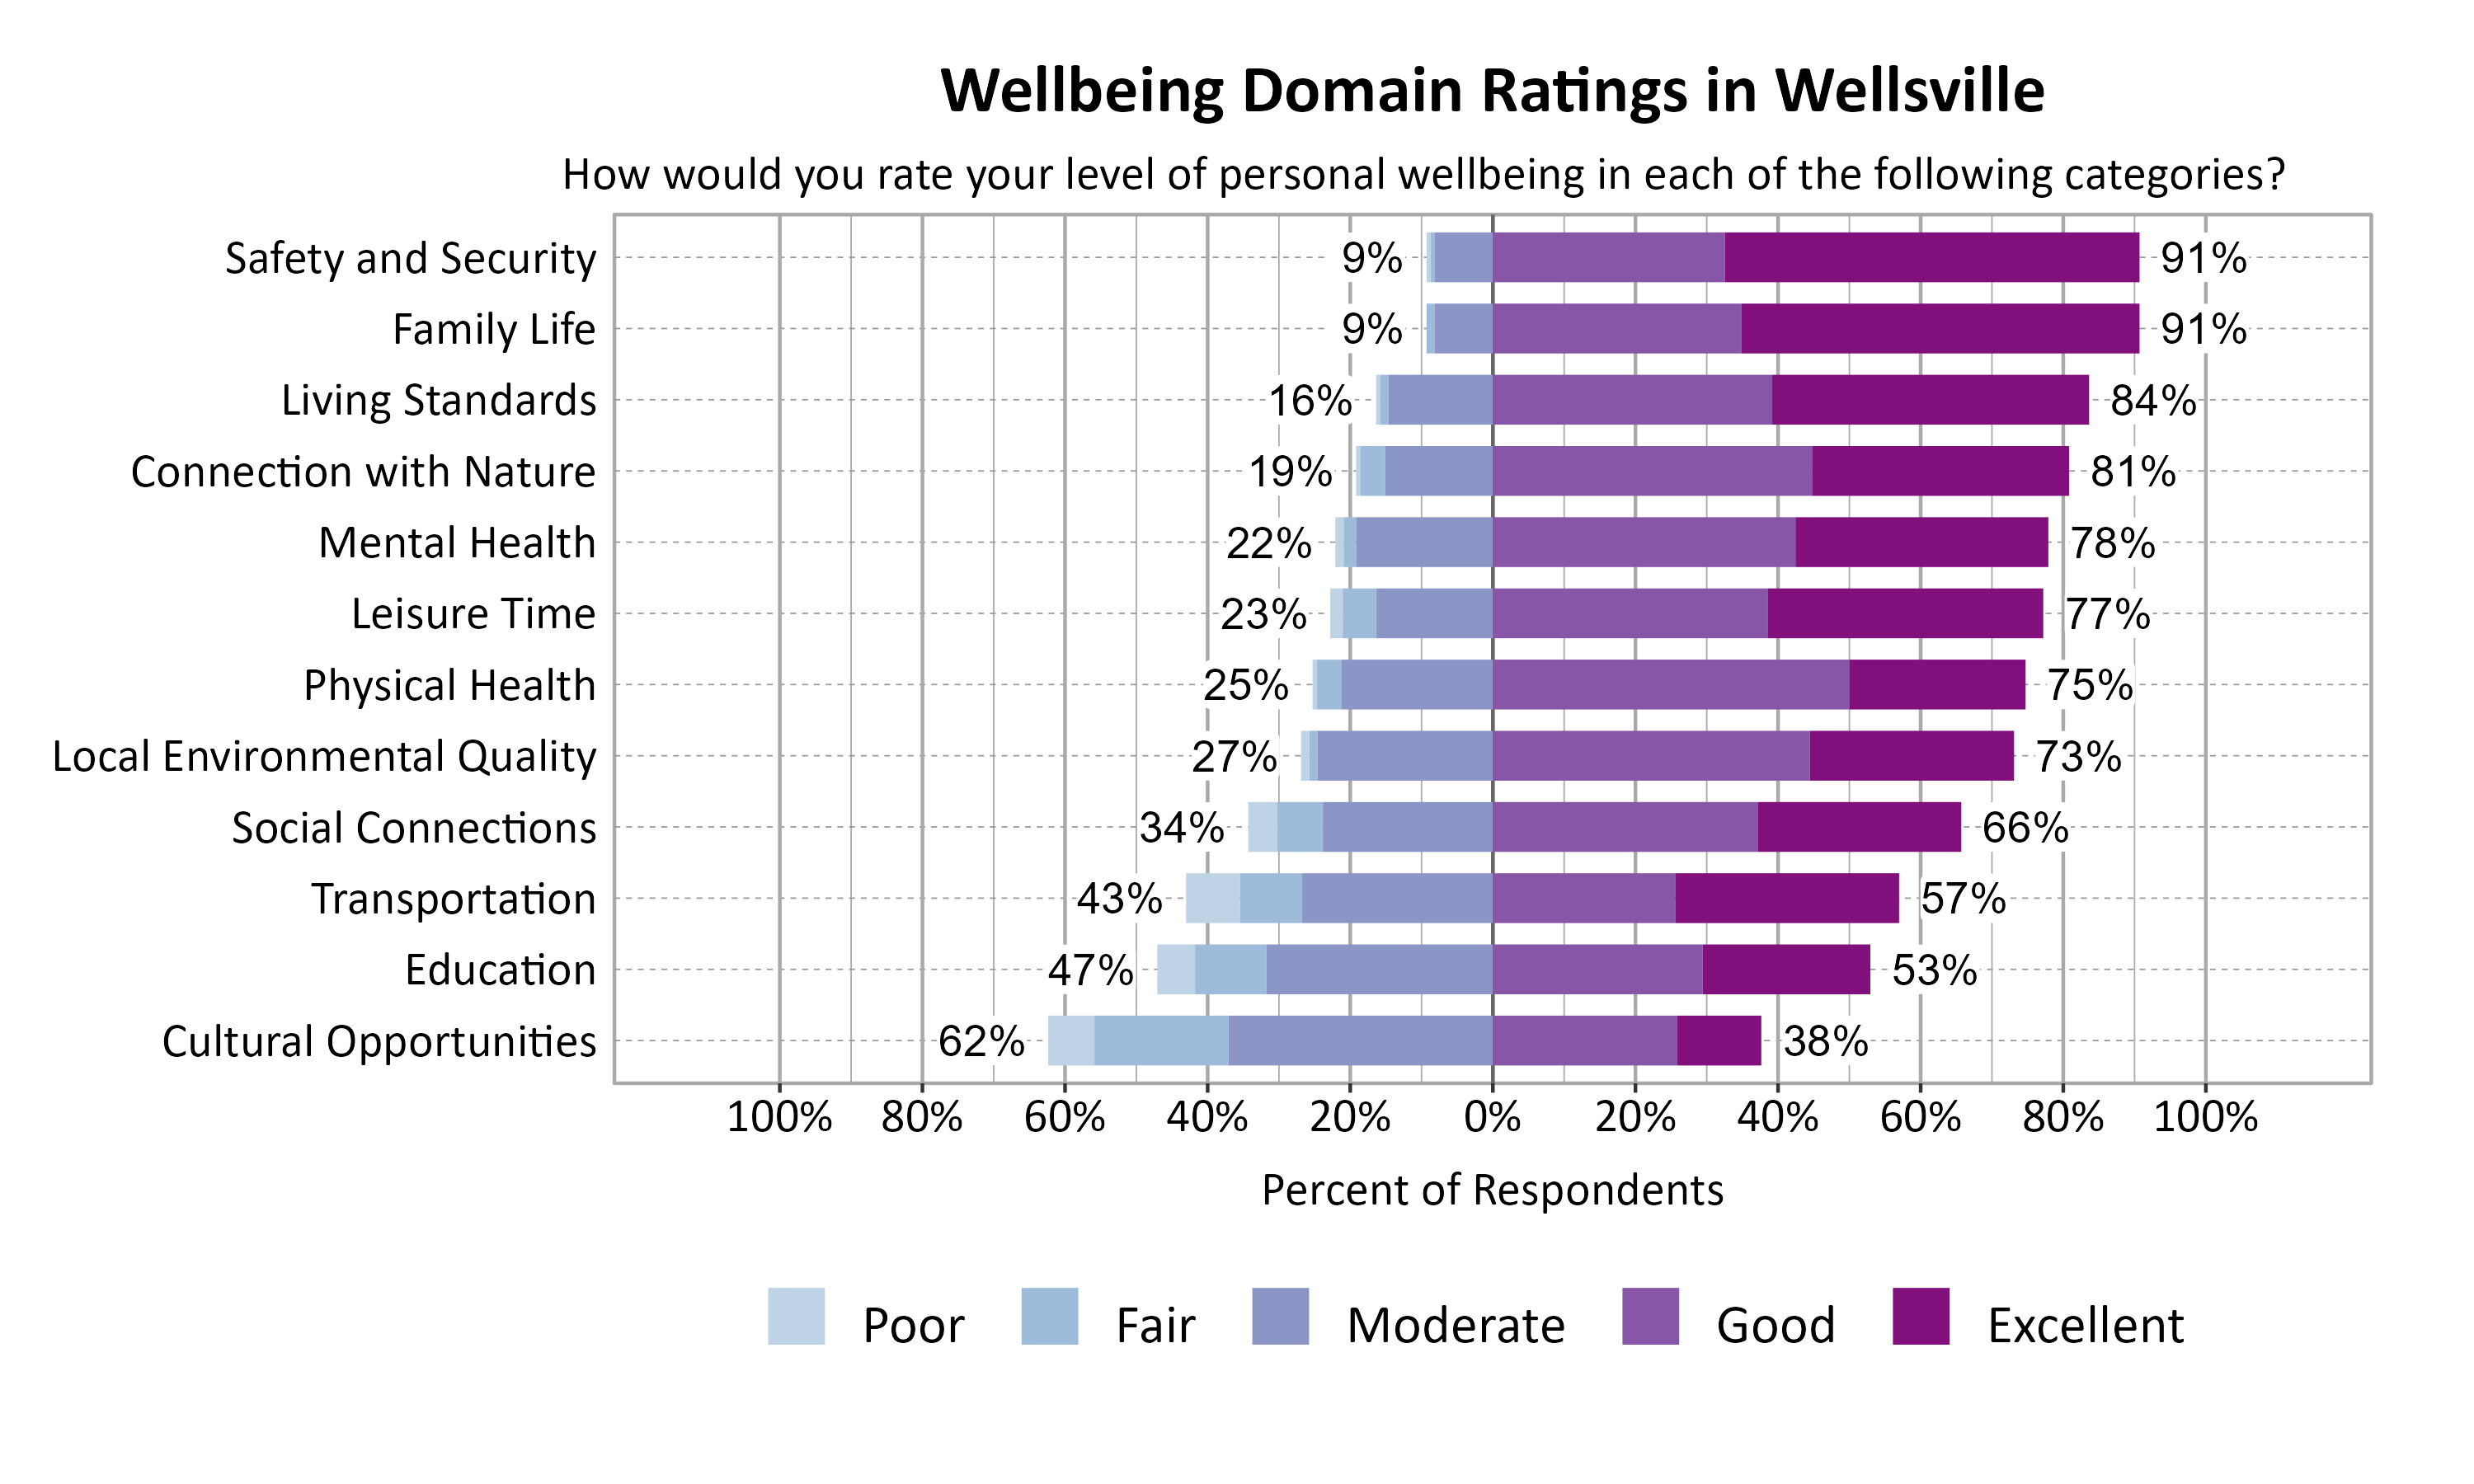
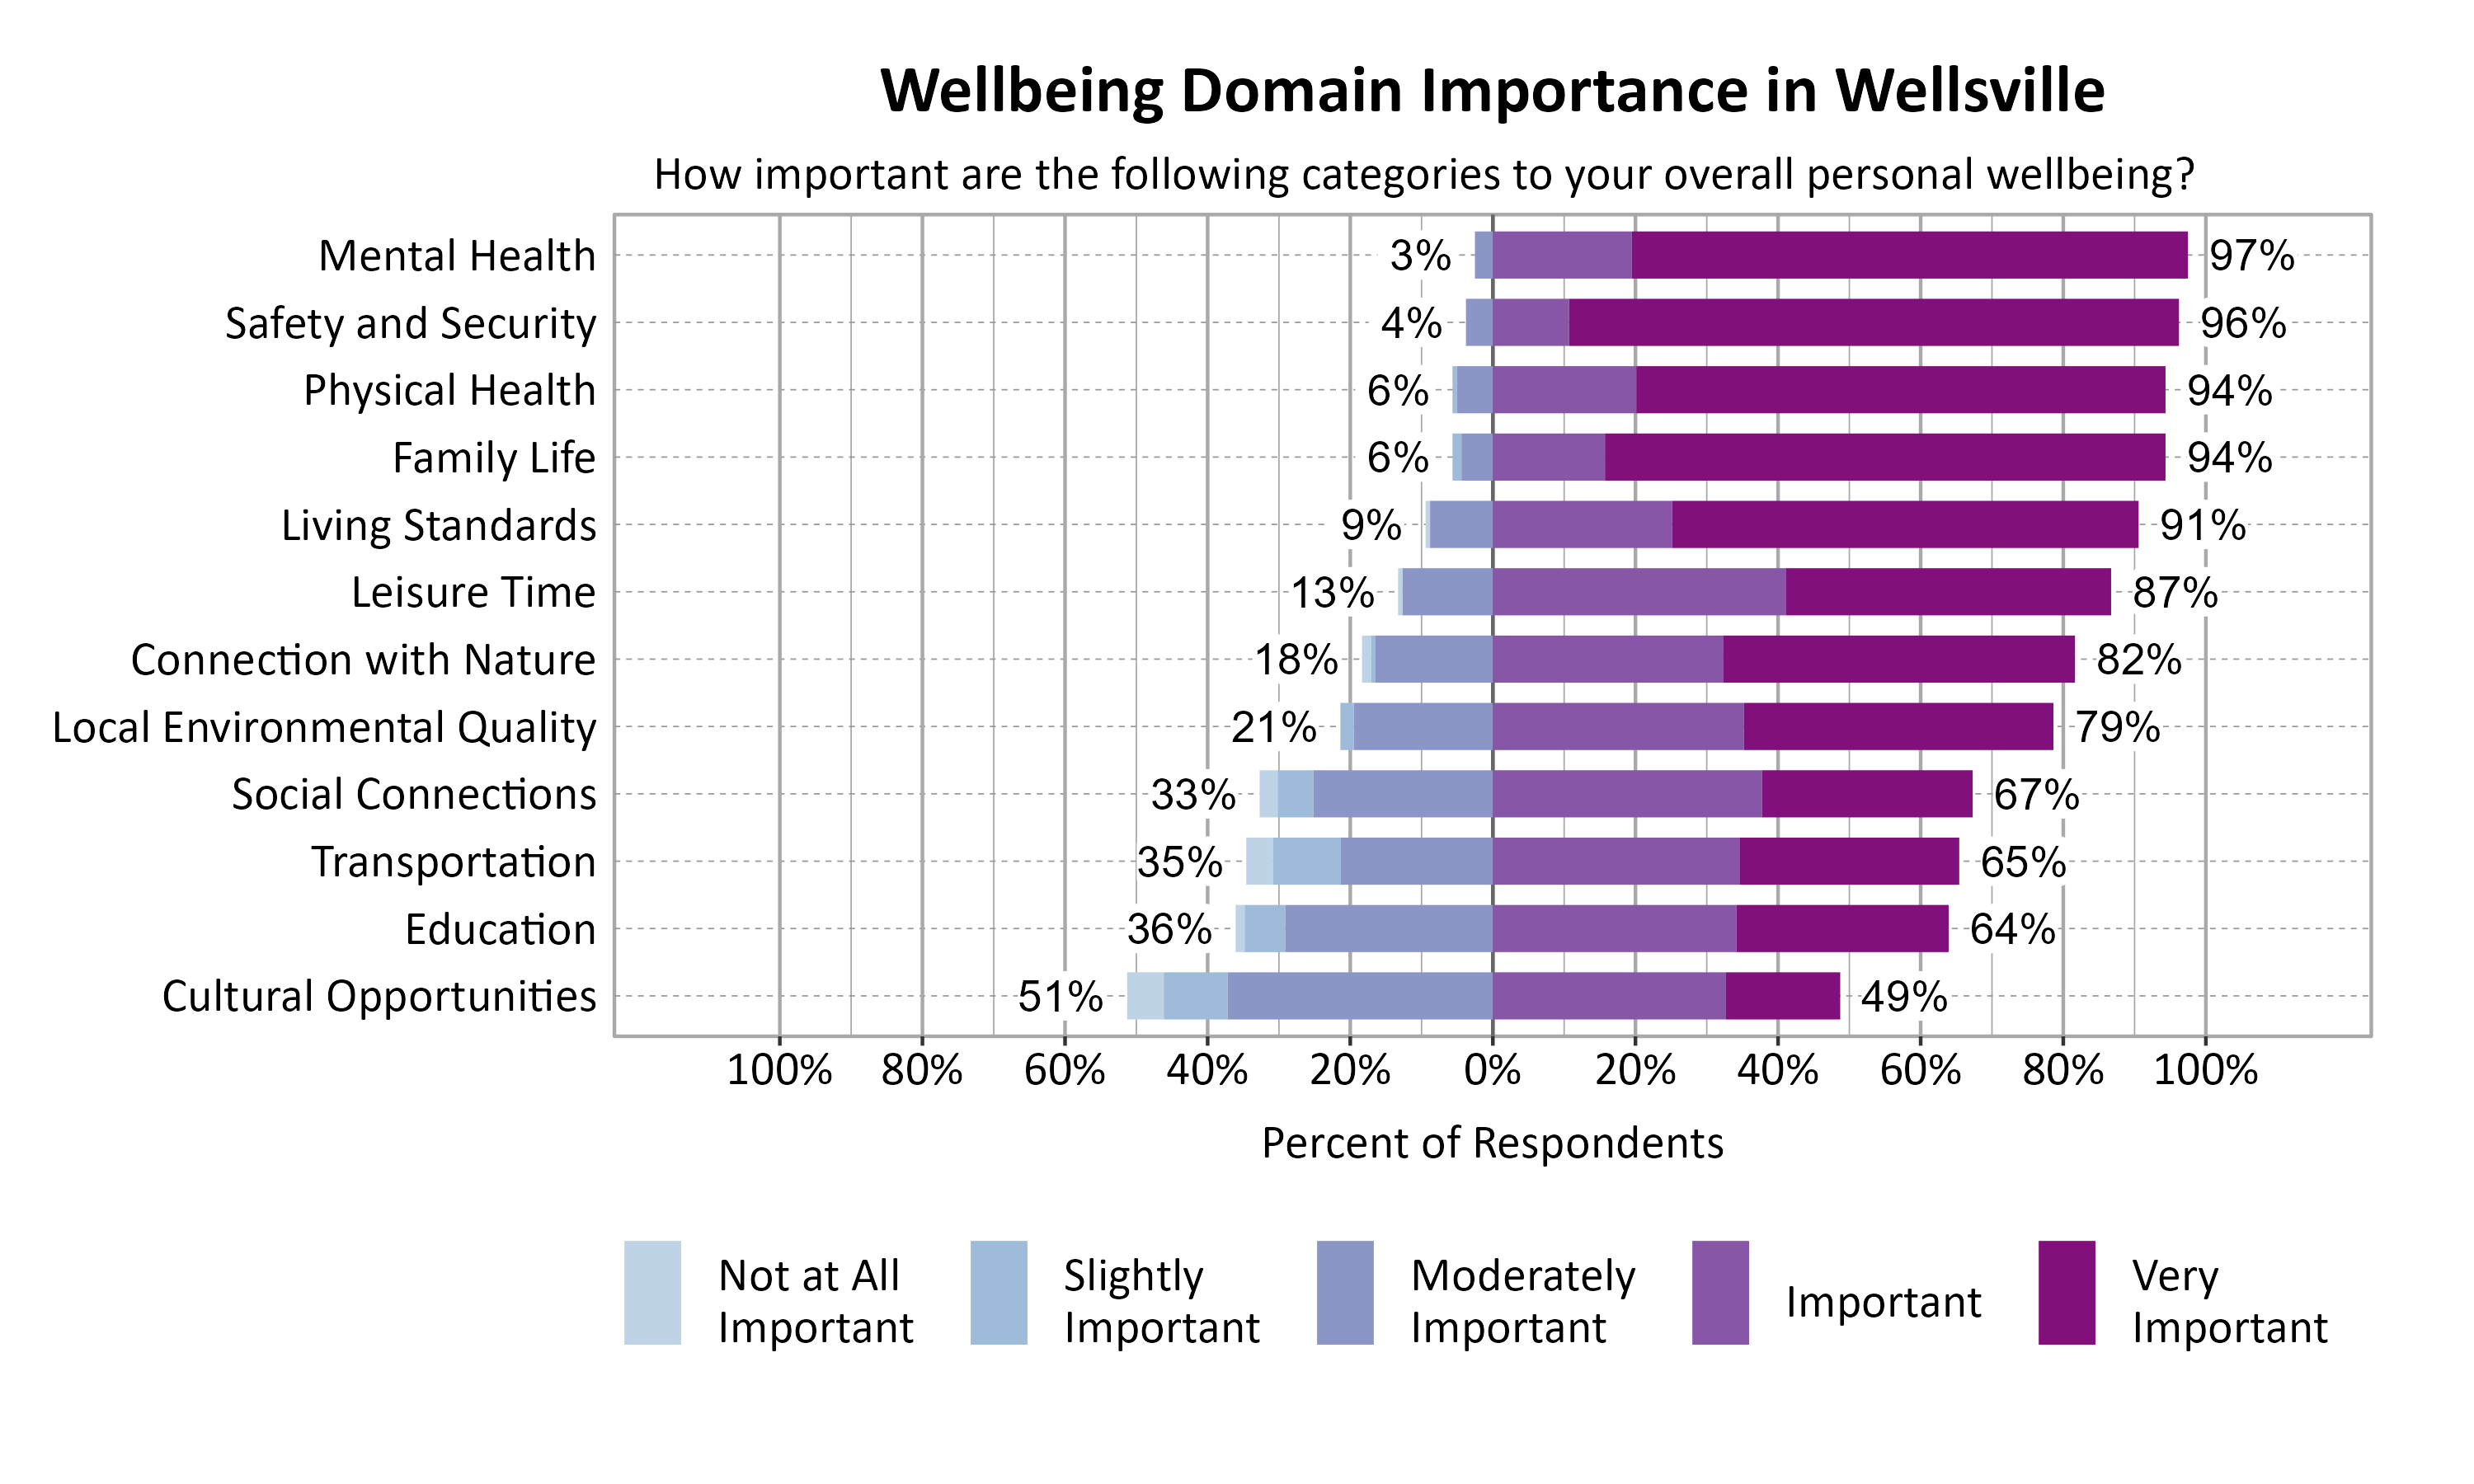
Wellbeing Domains in Wellsville
According to national and international entities that track wellbeing, there are a number of common dimensions or domains of wellbeing. Survey respondents rated twelve domains on a 5-point scale from poor to excellent. They were also asked to indicate the importance of each domain to their overall personal wellbeing on a 5-point scale from not at all important to very important. The highest rated wellbeing domains for respondents in Wellsville were Safety and Security (91%), Family Life (91%), and Living Standards (84%). The most important wellbeing domains were Mental Health (97%), Safety and Security (96%), Family Life (94%), and Physical Health (94%).
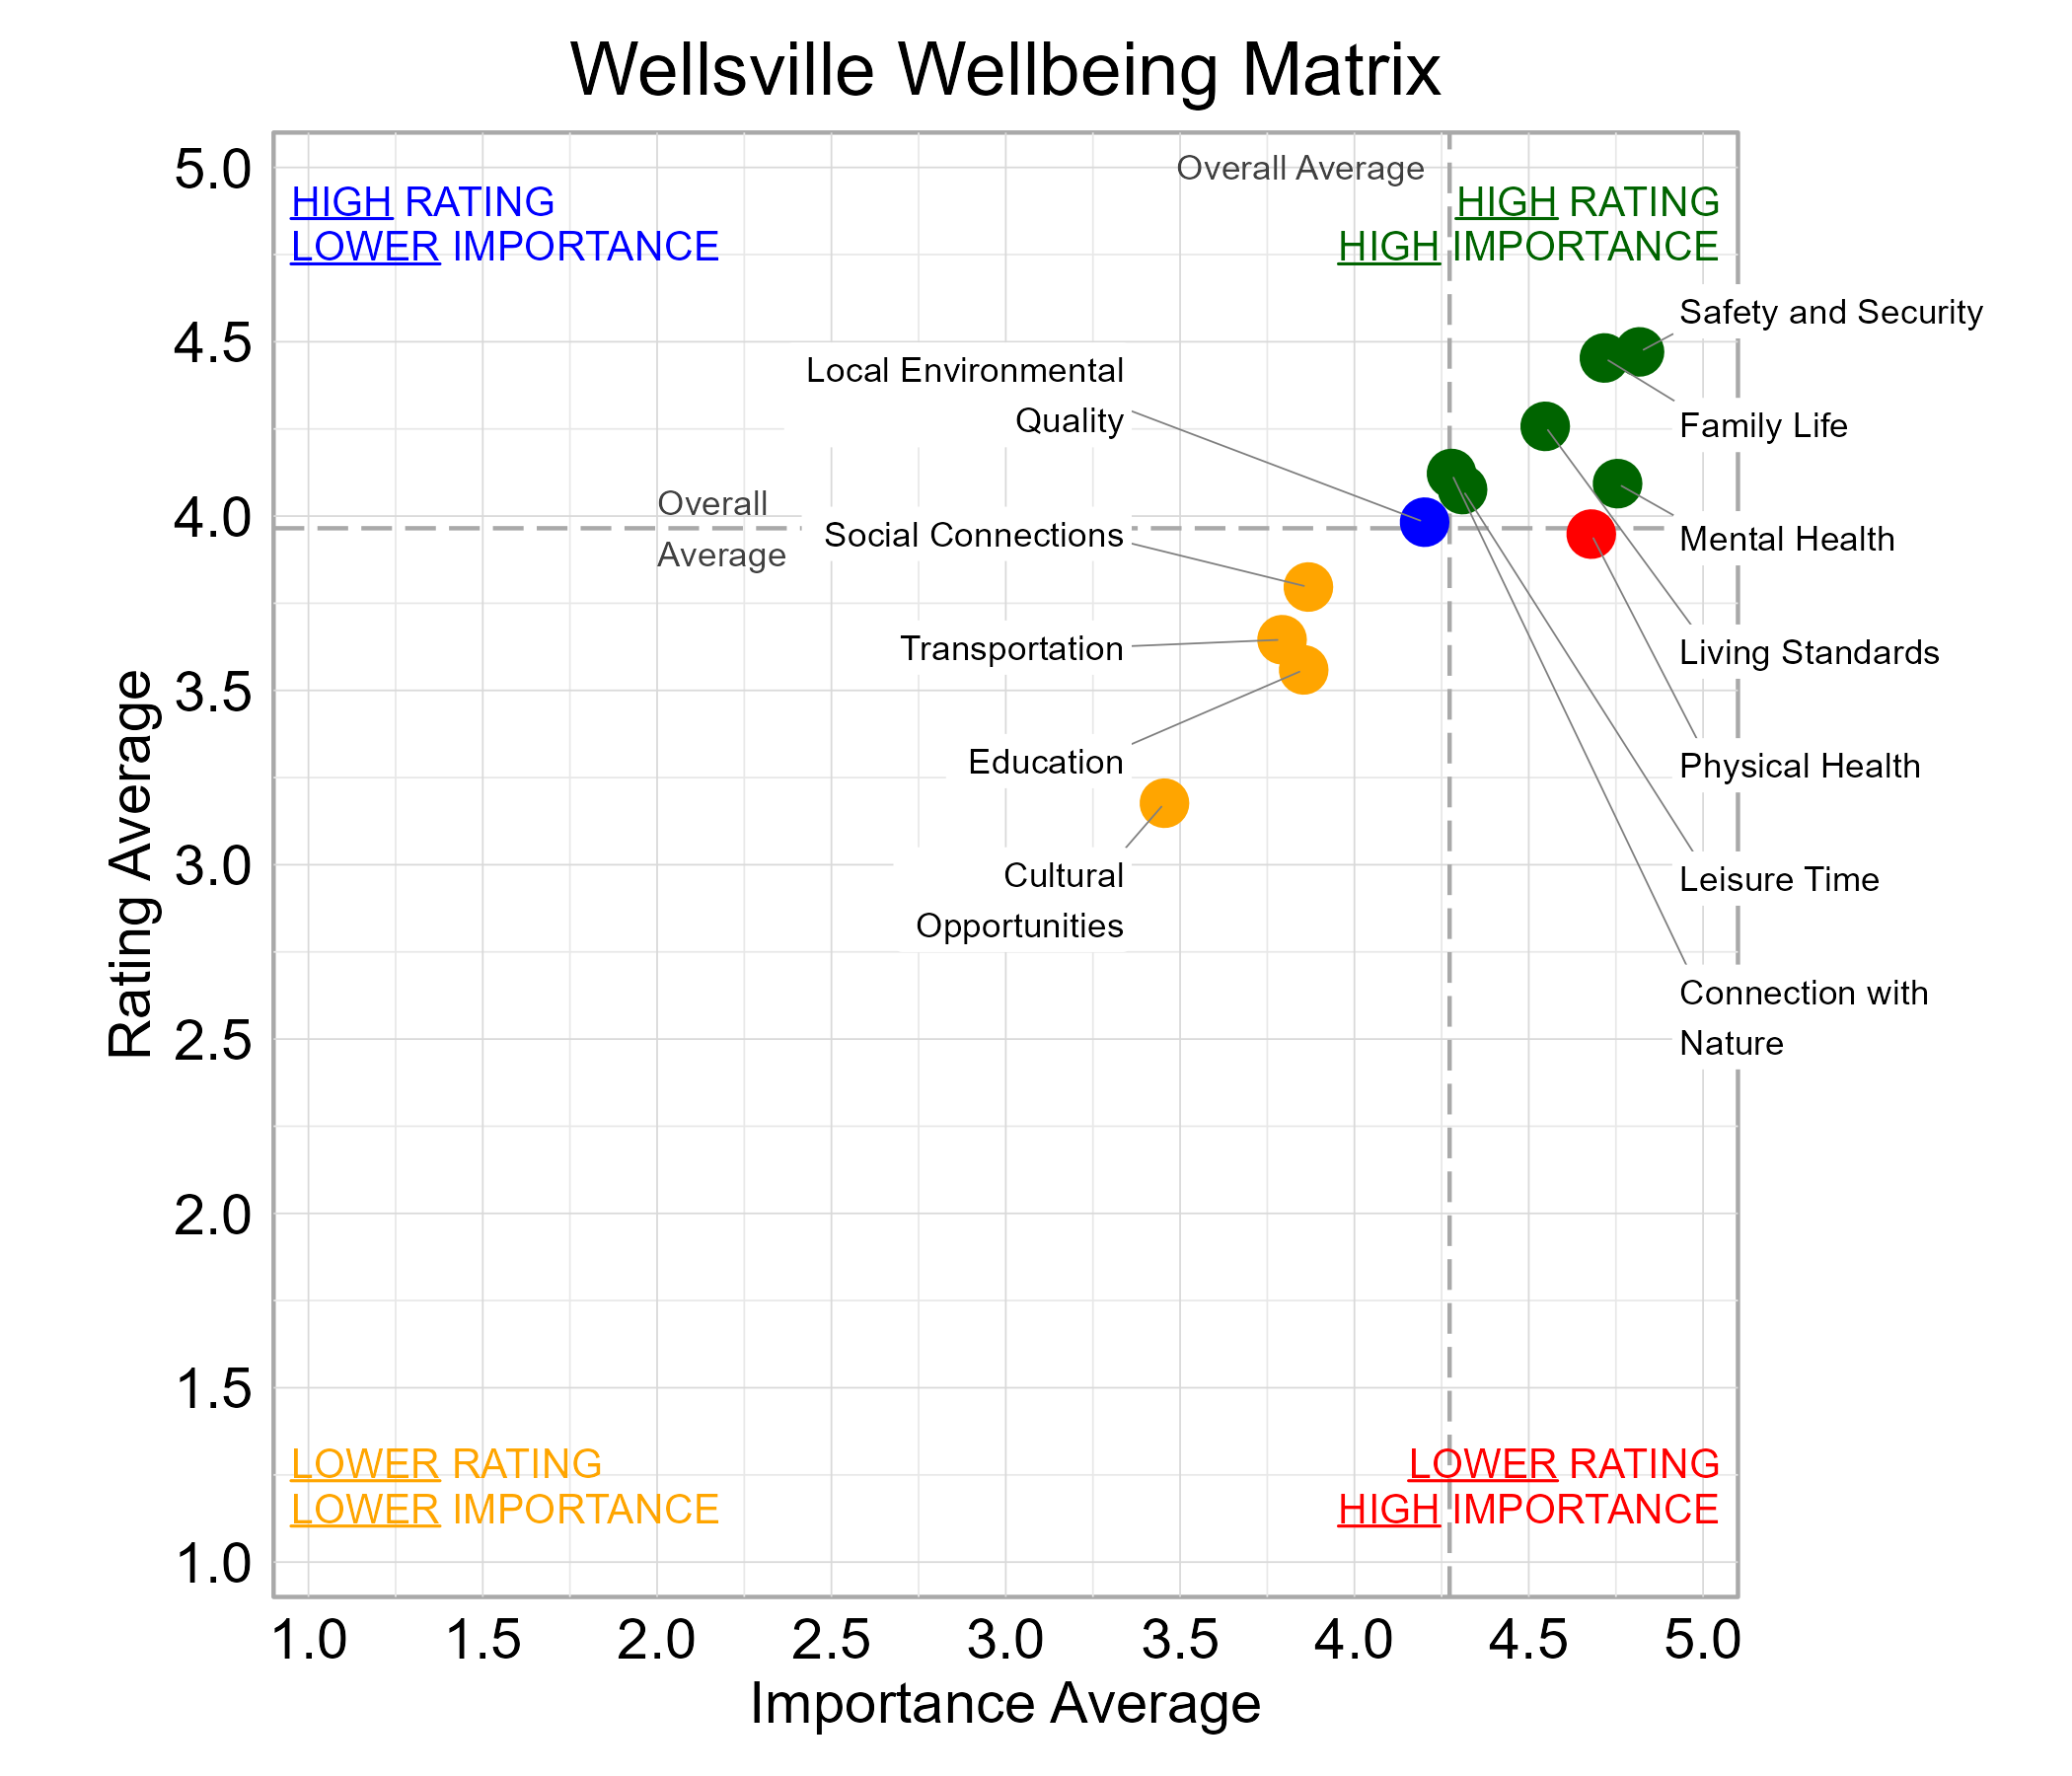
Wellbeing Matrix for Wellsville
The graph below illustrates the relationship between the average rating and the average importance of wellbeing domains for survey respondents from Wellsville. Connection with Nature, Family Life, Leisure Time, Living Standards, Mental Health, and Safety and Security were highly important and rated above average among the domains. Physical Health fell in the “red zone” of higher importance and lower ratings.
Community Connection in Wellsville
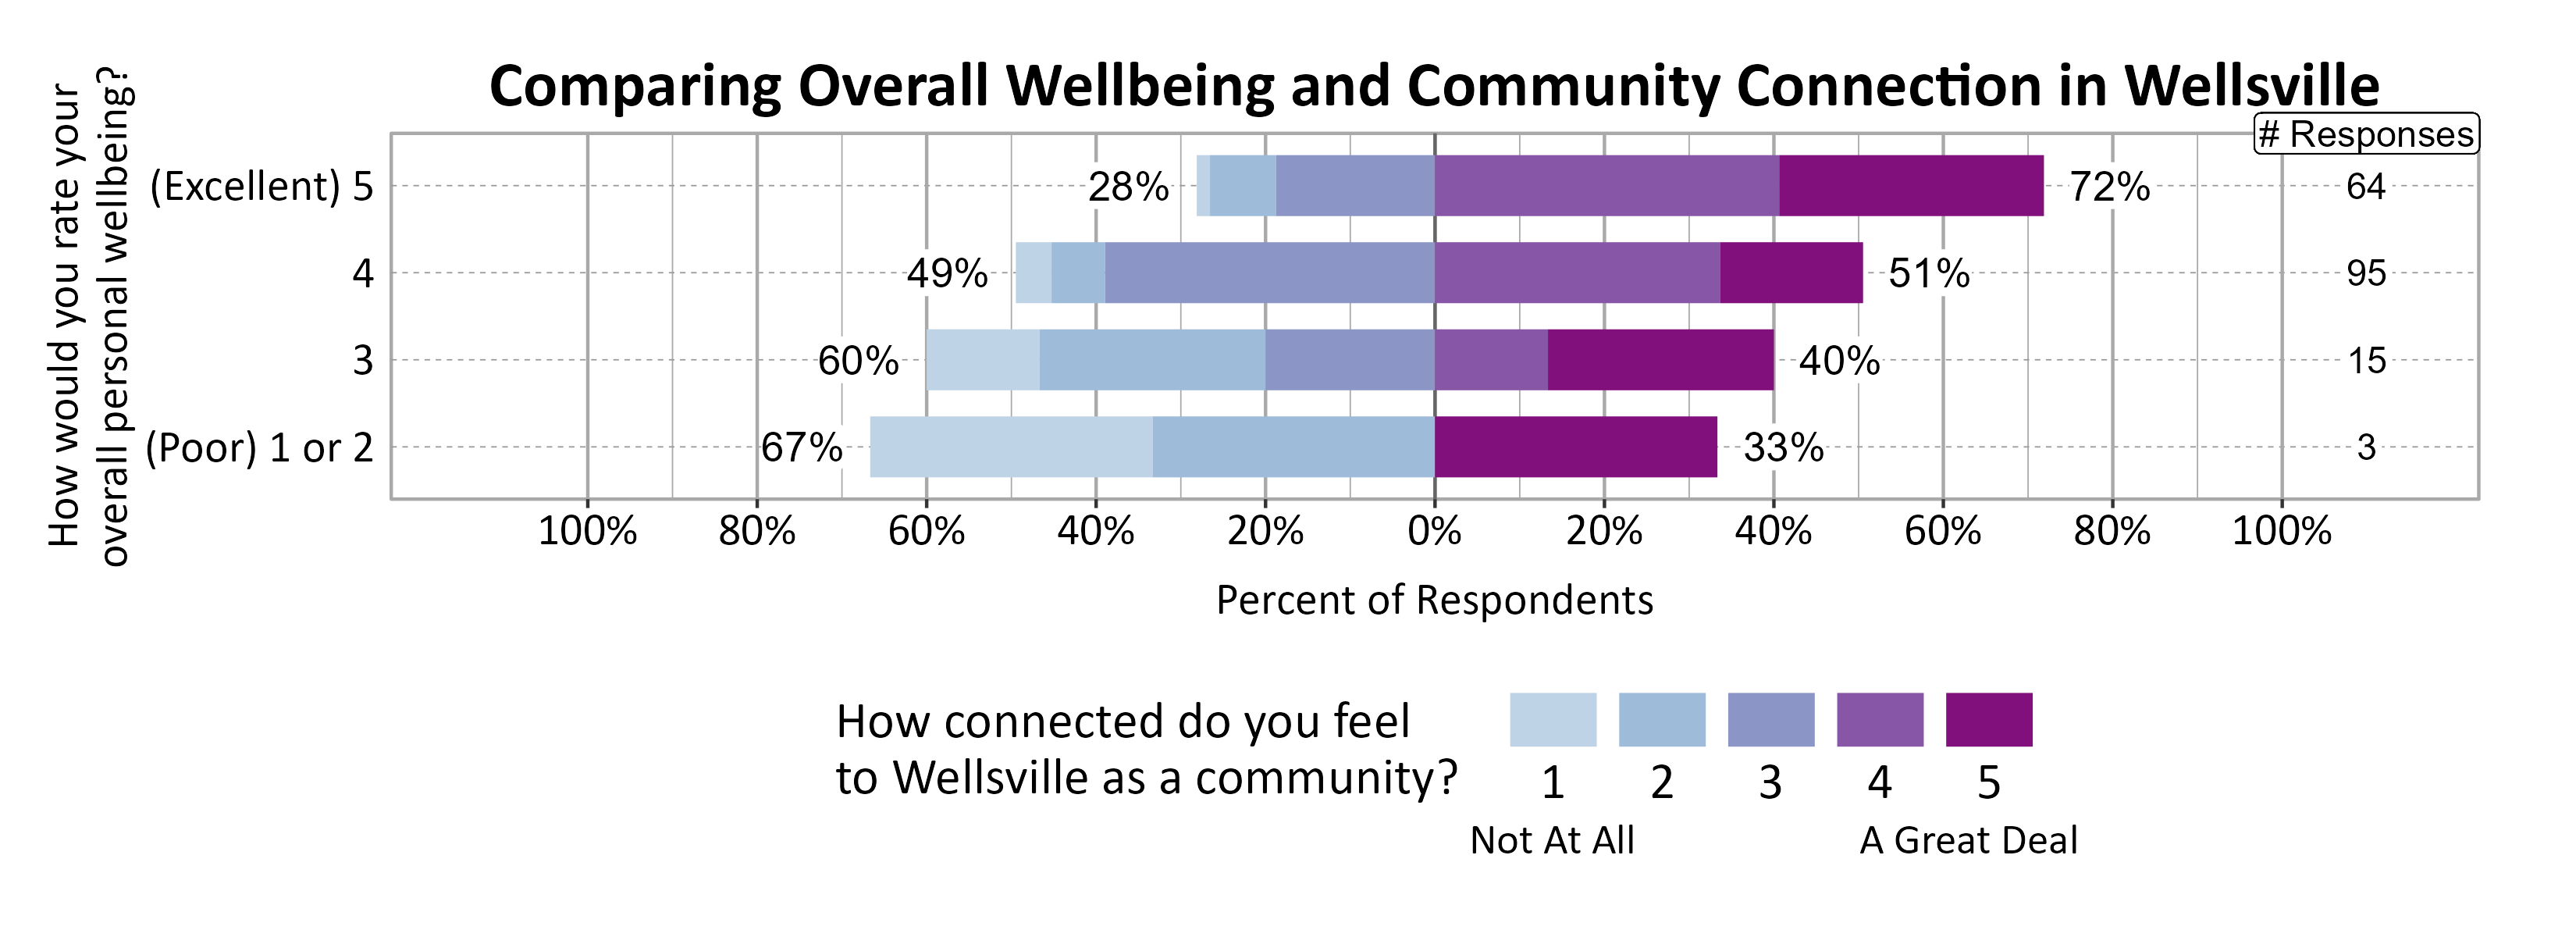
Survey participants were asked about how connected they feel to Wellsville on a 5-point scale from not at all (1) to a great deal (5), and the average score of all respondents was 3.62.
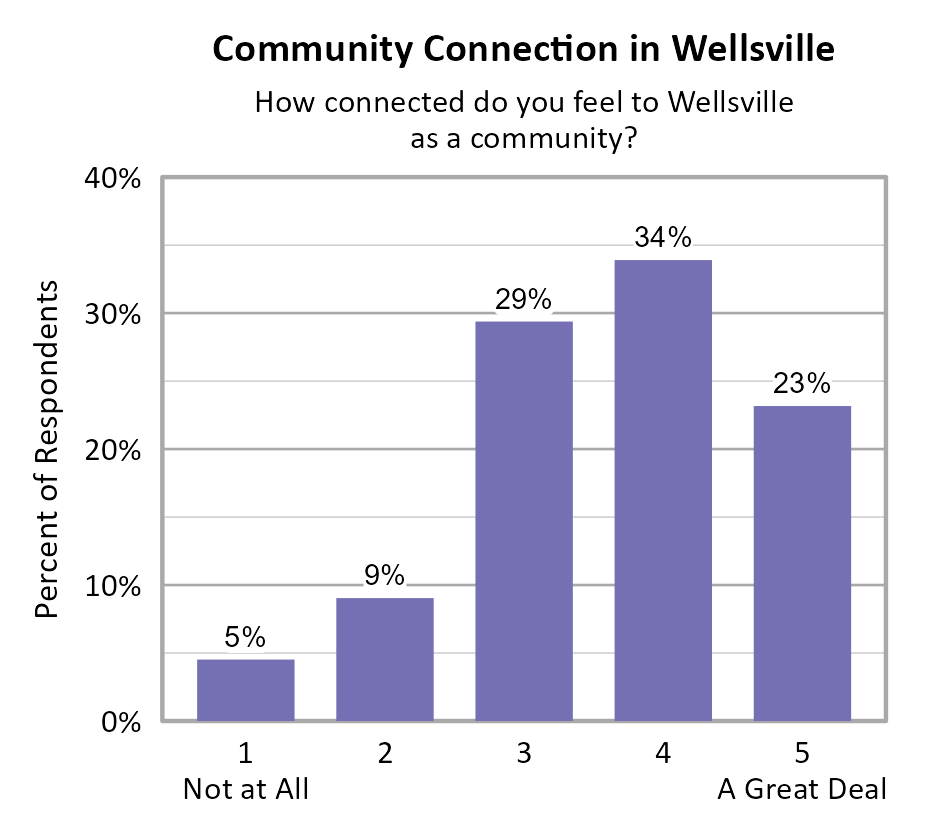
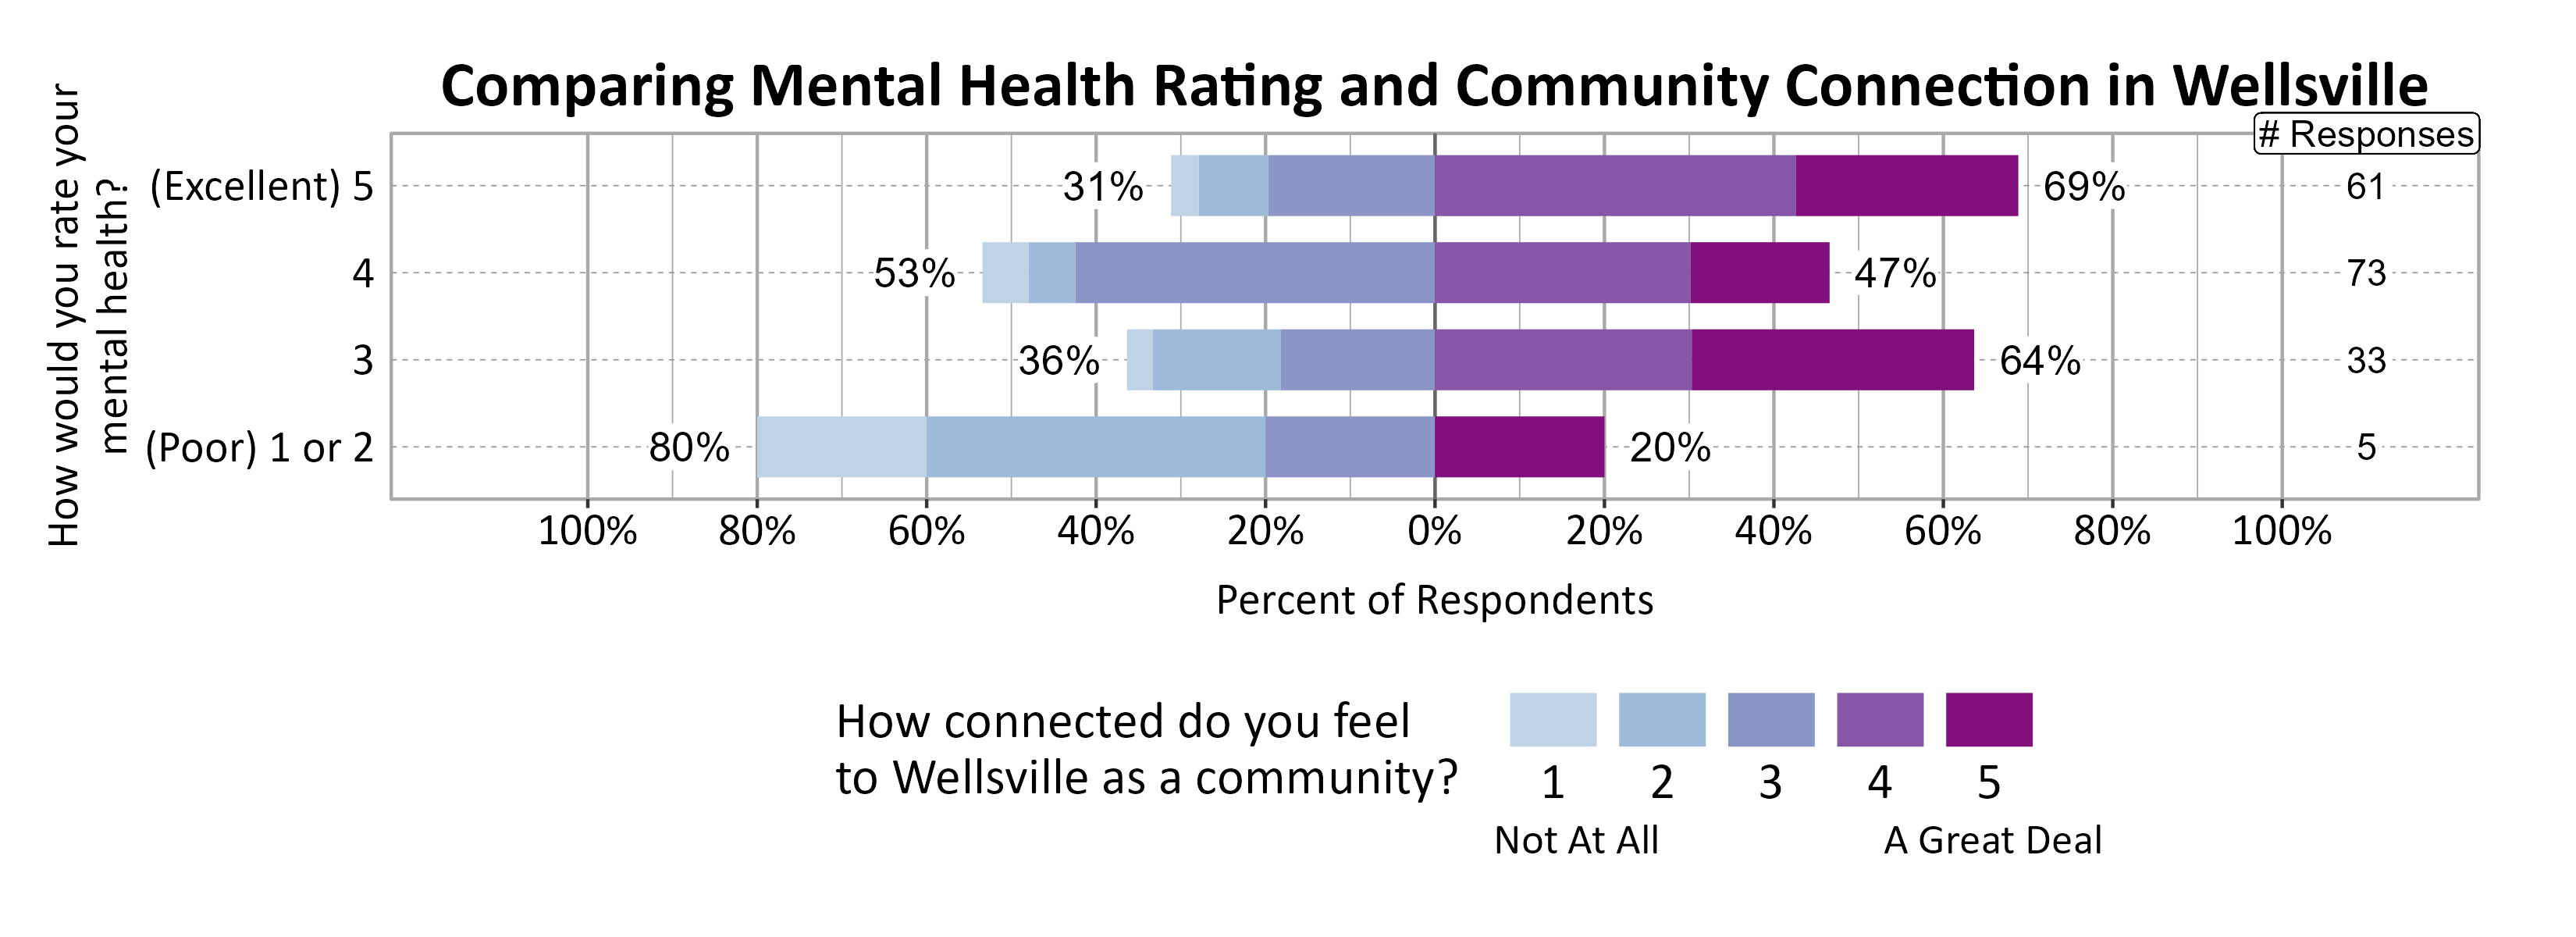
A positive relationship was found between individuals’ community connection and overall personal wellbeing, but no clear relationship was found between community connection and mental health.
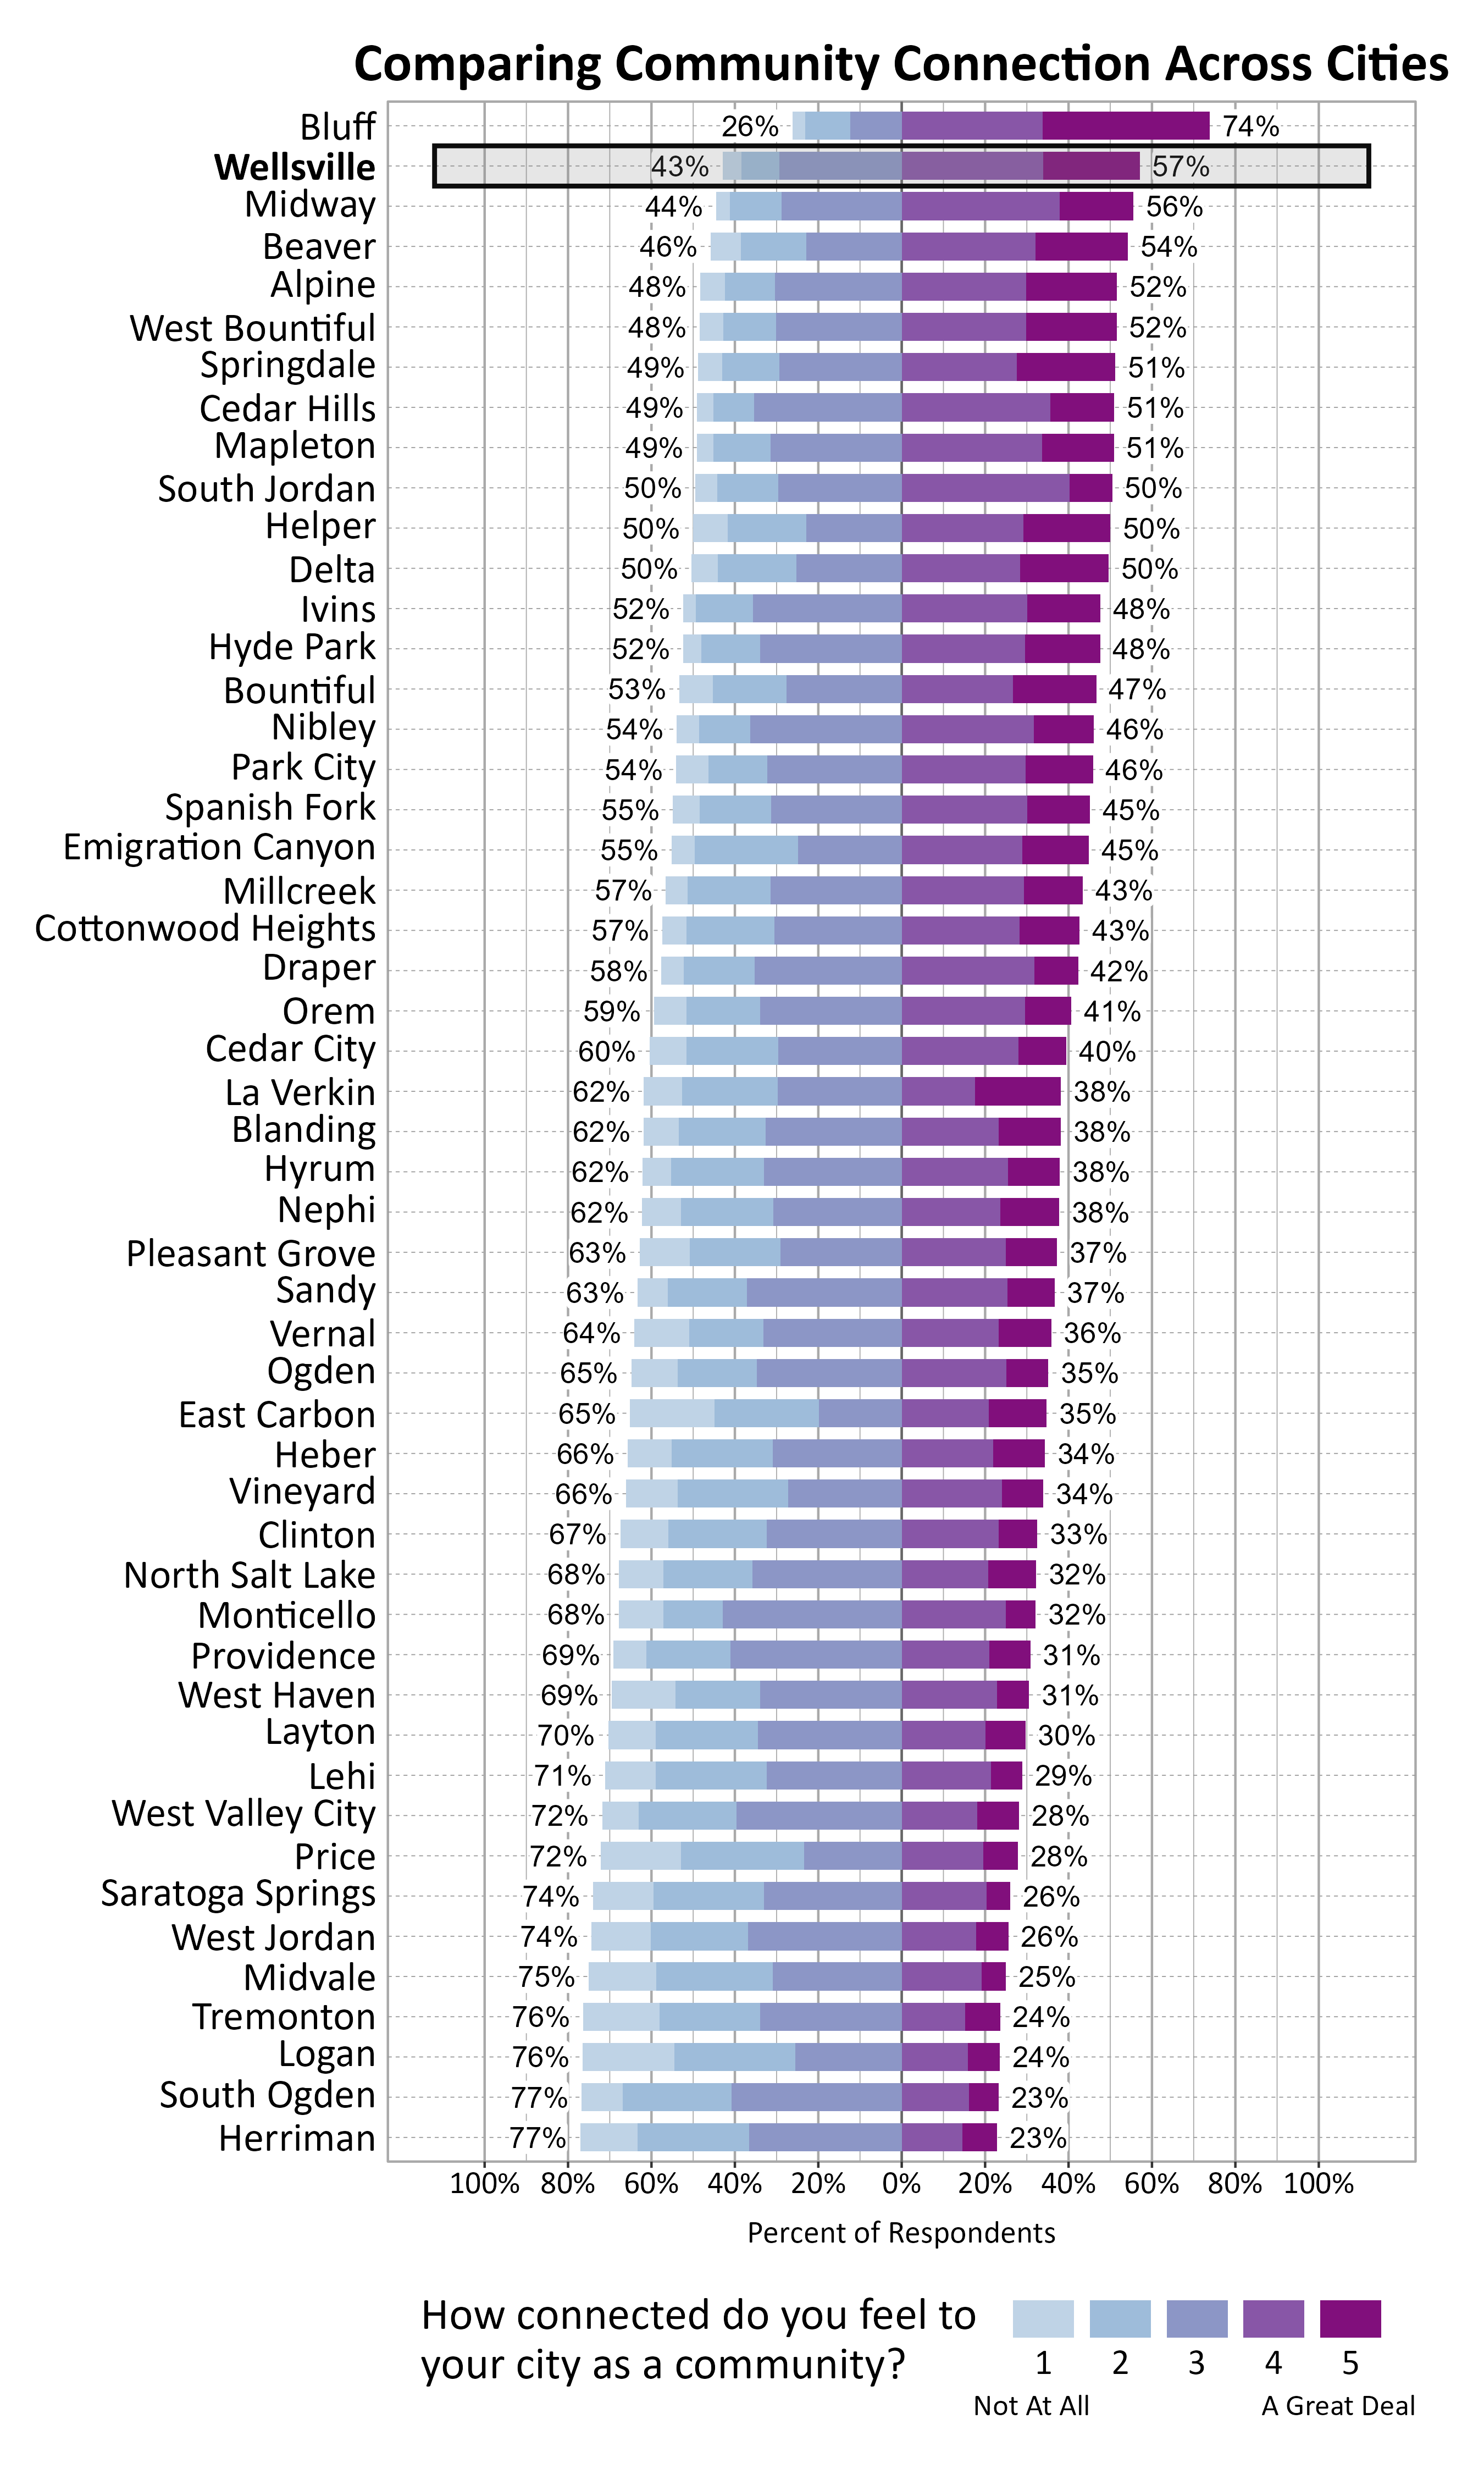
The graph below shows how Wellbeing Project cities and towns compare on feelings of community connection based on the percentage of respondents who answered 4 or a 5 on a 5-point scale from “not at all” to “a great deal” connected to their city or town. Wellsville ranked 2 out of the 51 cities that participated.
Participation in Recreation and Nature-Related Activities
Respondents were asked to indicate whether or not they participated in various activities in the last 12 months. The most popular activities were gardening at home (91%), walking or biking in your neighborhood or city (90%), and community events (88%).
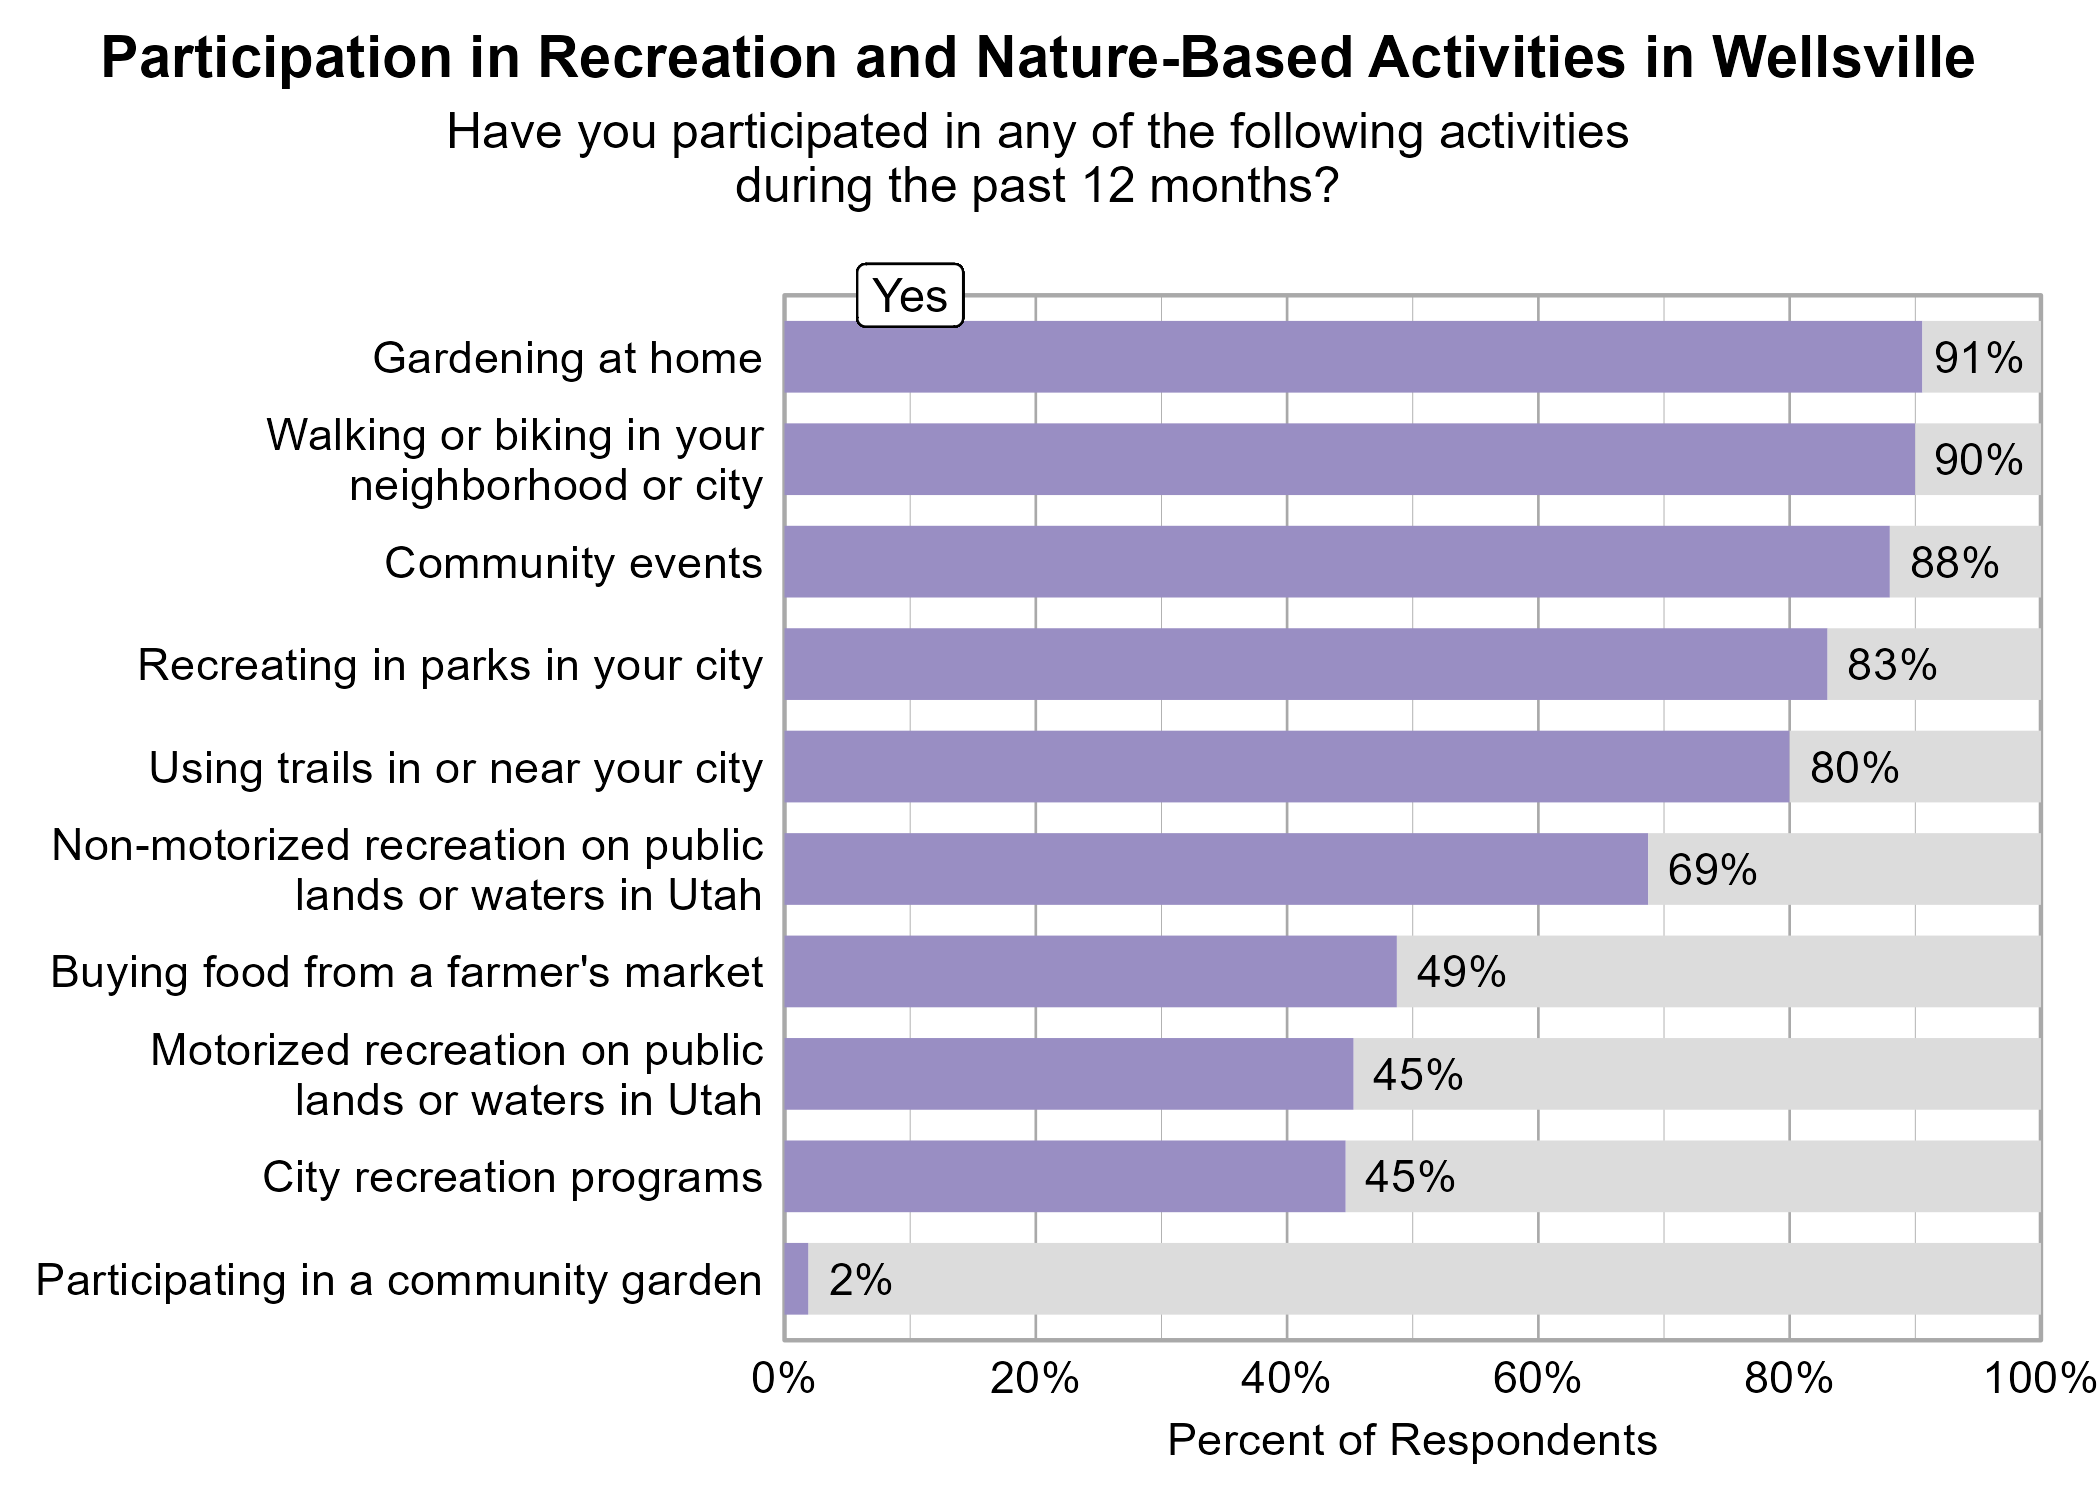
Non-motorized recreation on public lands or waters in Utah and using trails in or near your city were significantly related to higher ratings of personal wellbeing.
Non-motorized recreation on public lands or waters in Utah was significantly related to higher ratings of community wellbeing and community connection.
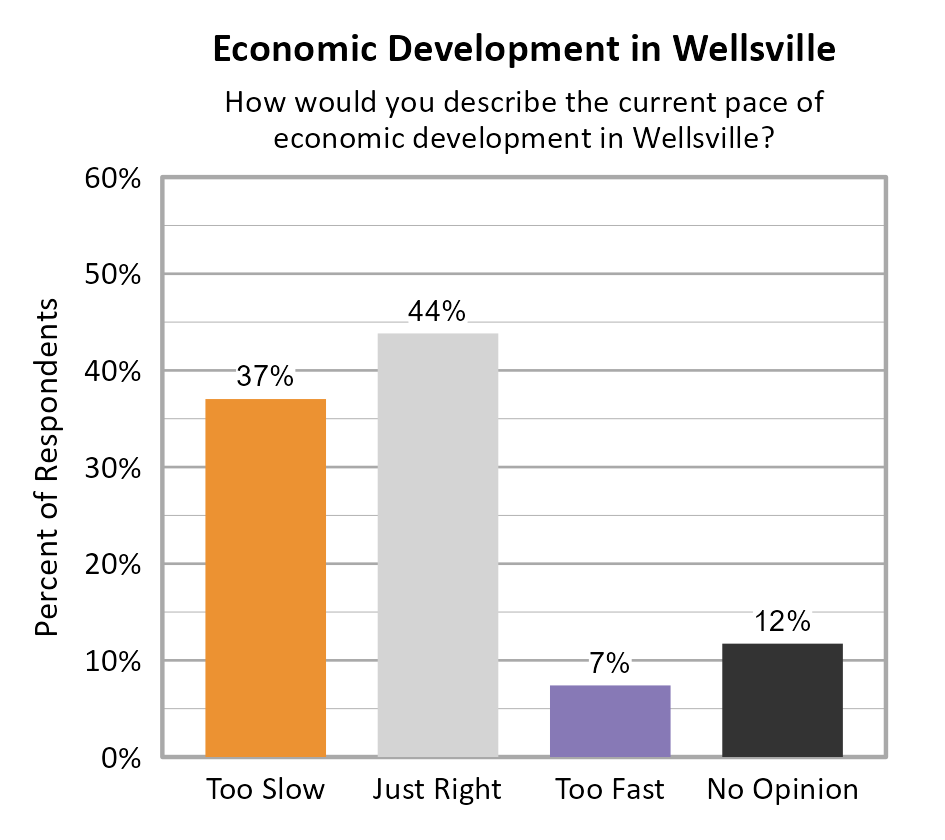
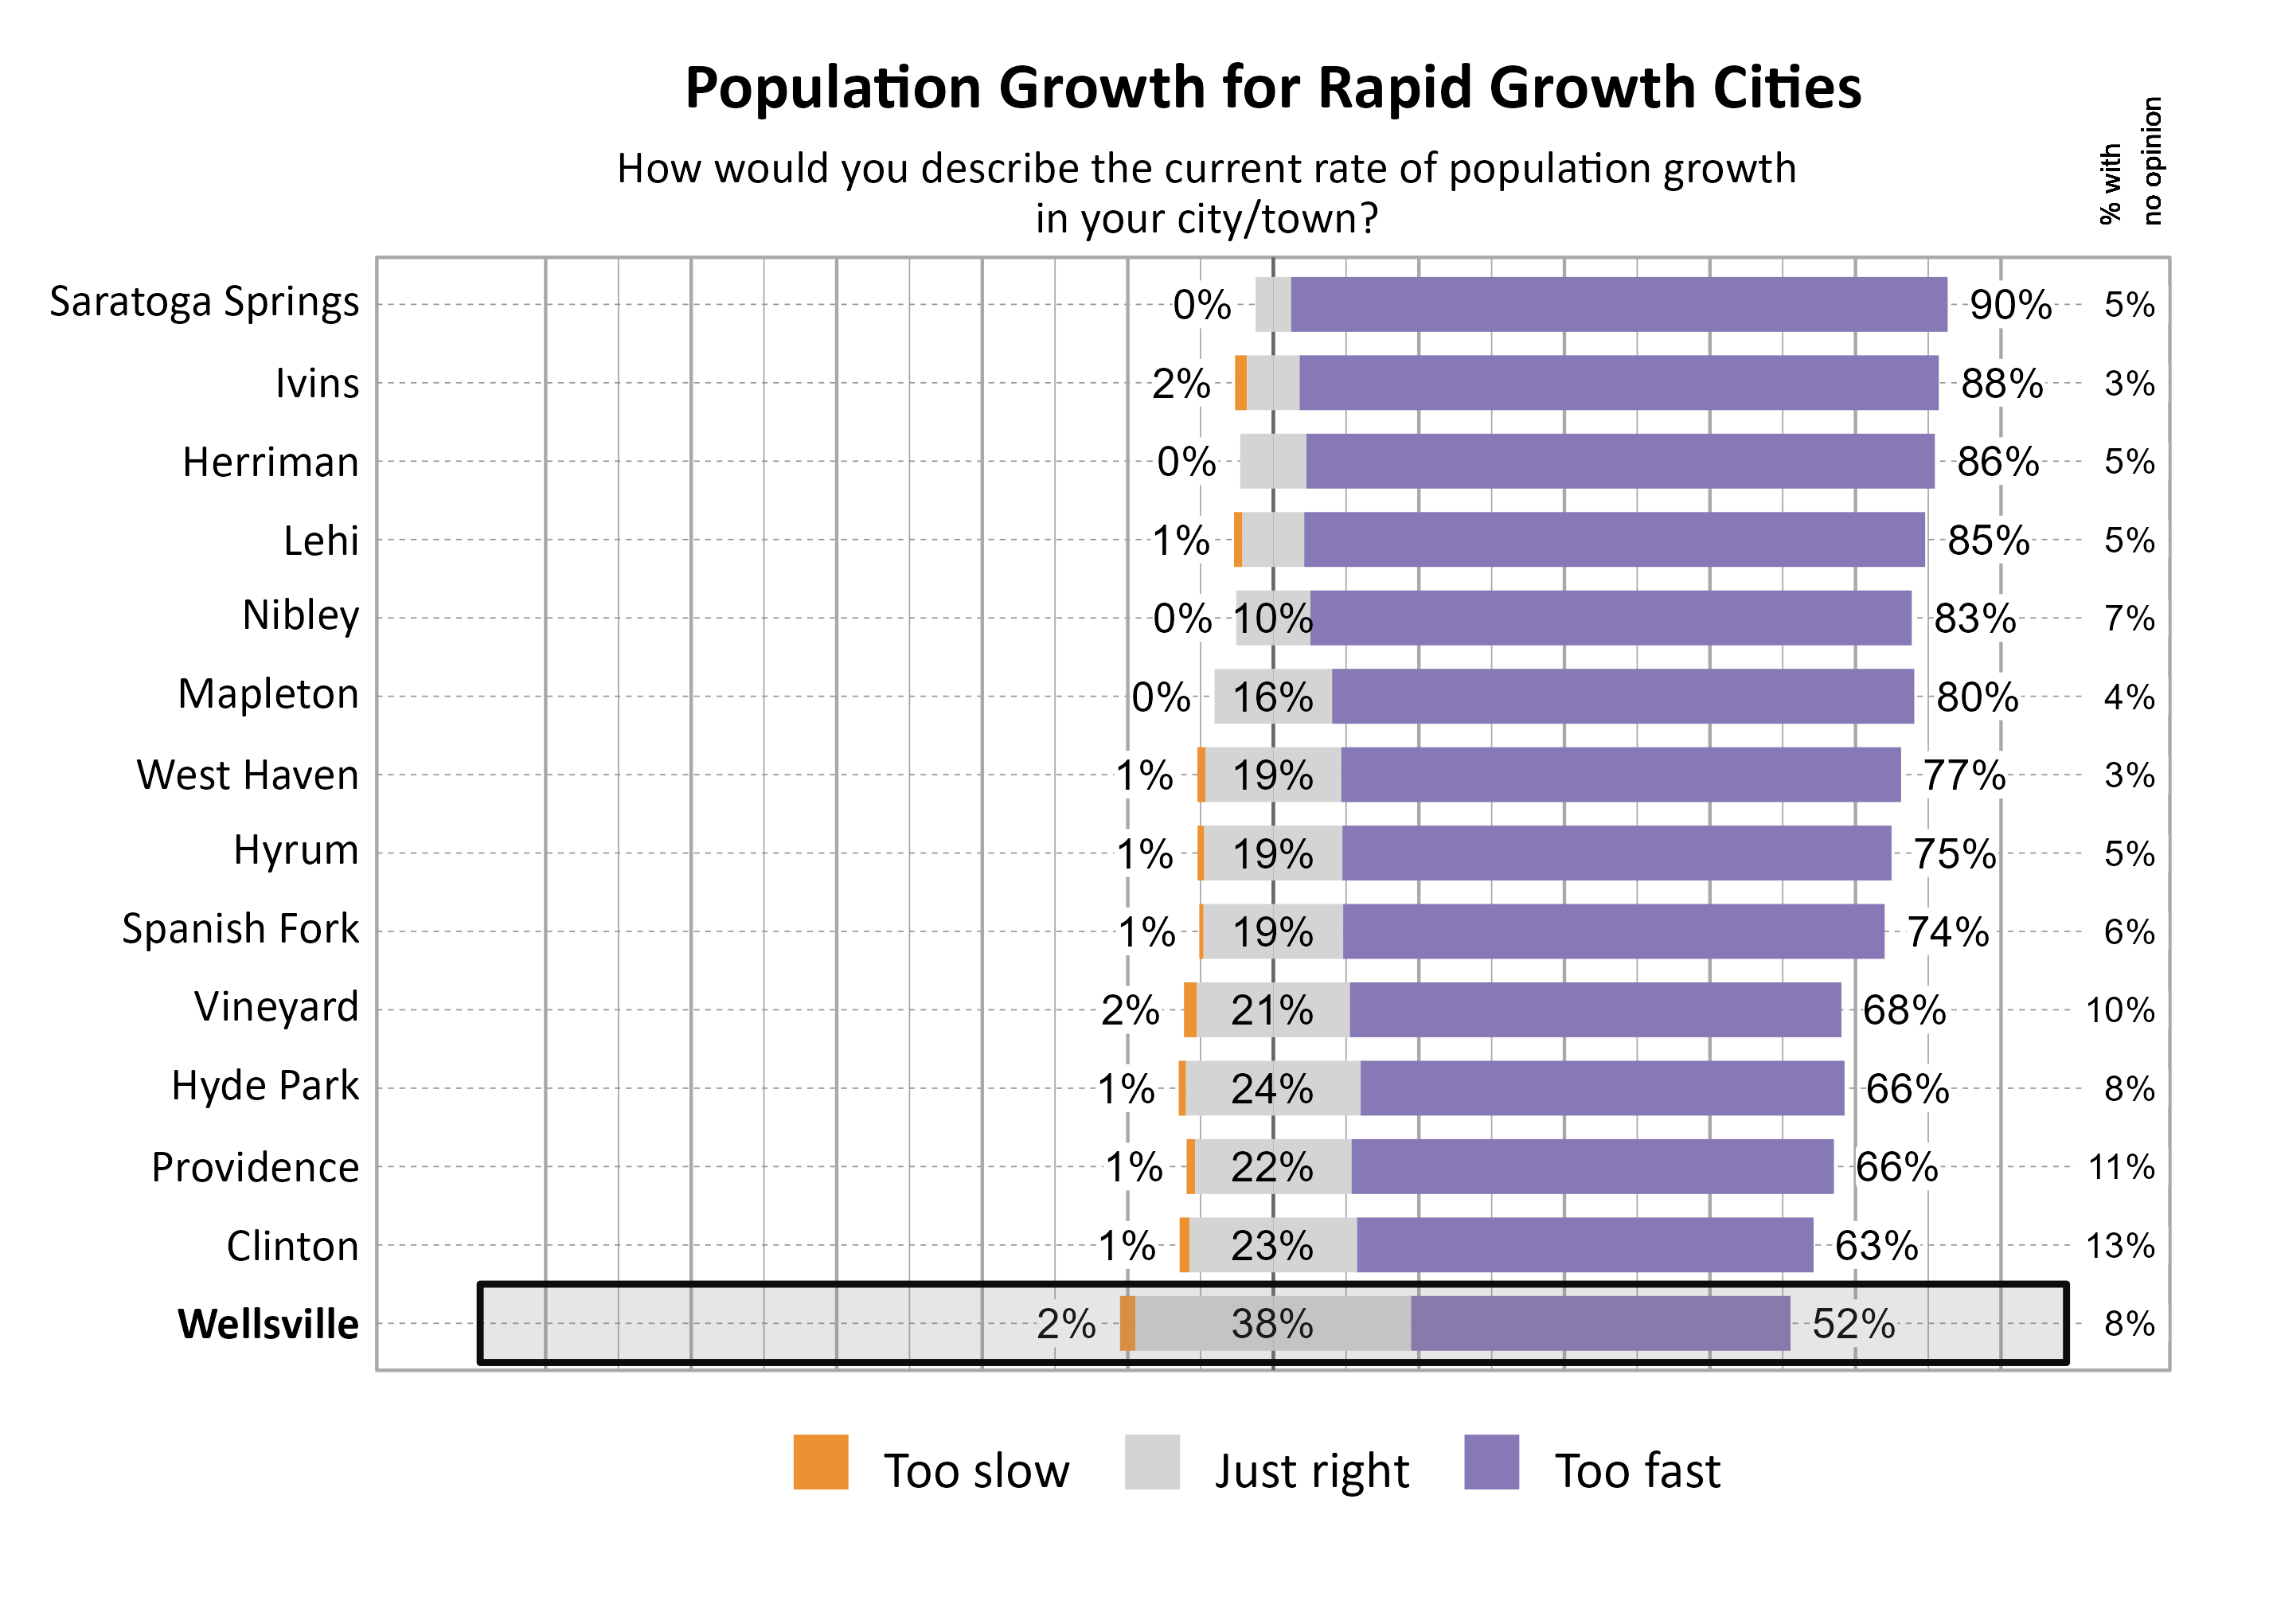
Perspectives on Population Growth and Economic Development
The majority of respondents in Wellsville indicated that they felt the population growth was too fast (52%). For the pace of economic development, respondents were split between opinions that it was just right (44%) and too slow (37%).
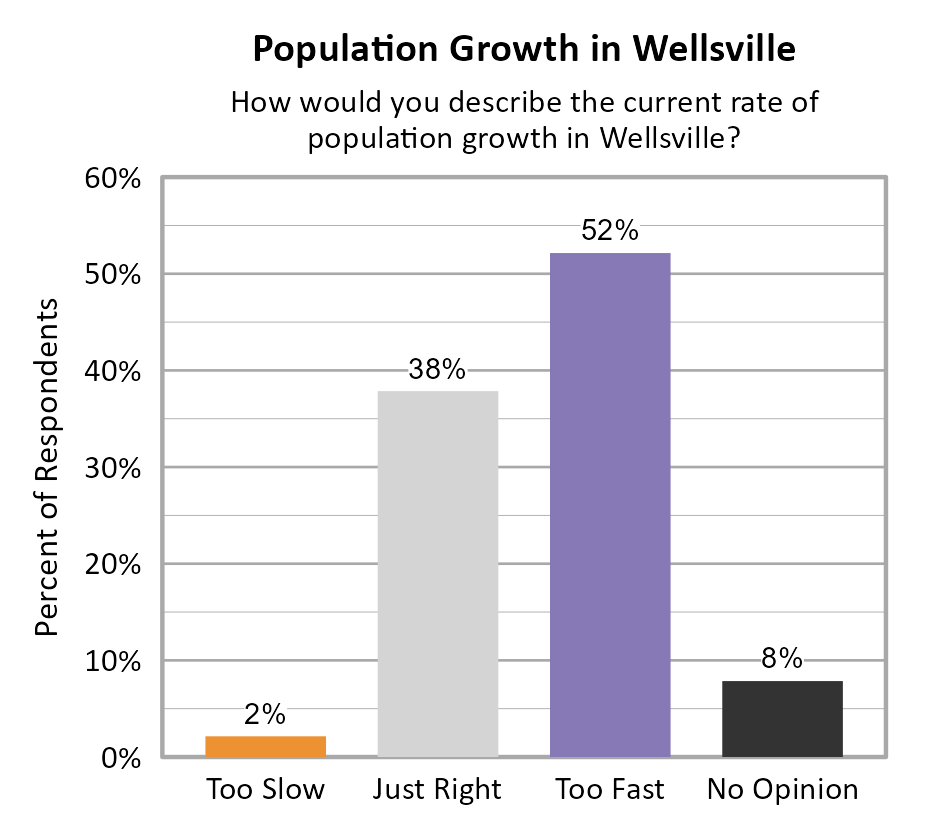
The graphs below show perceptions of population growth and economic development for Wellsville compared to other participating cities and towns in the Rapid Growth Cities cluster.
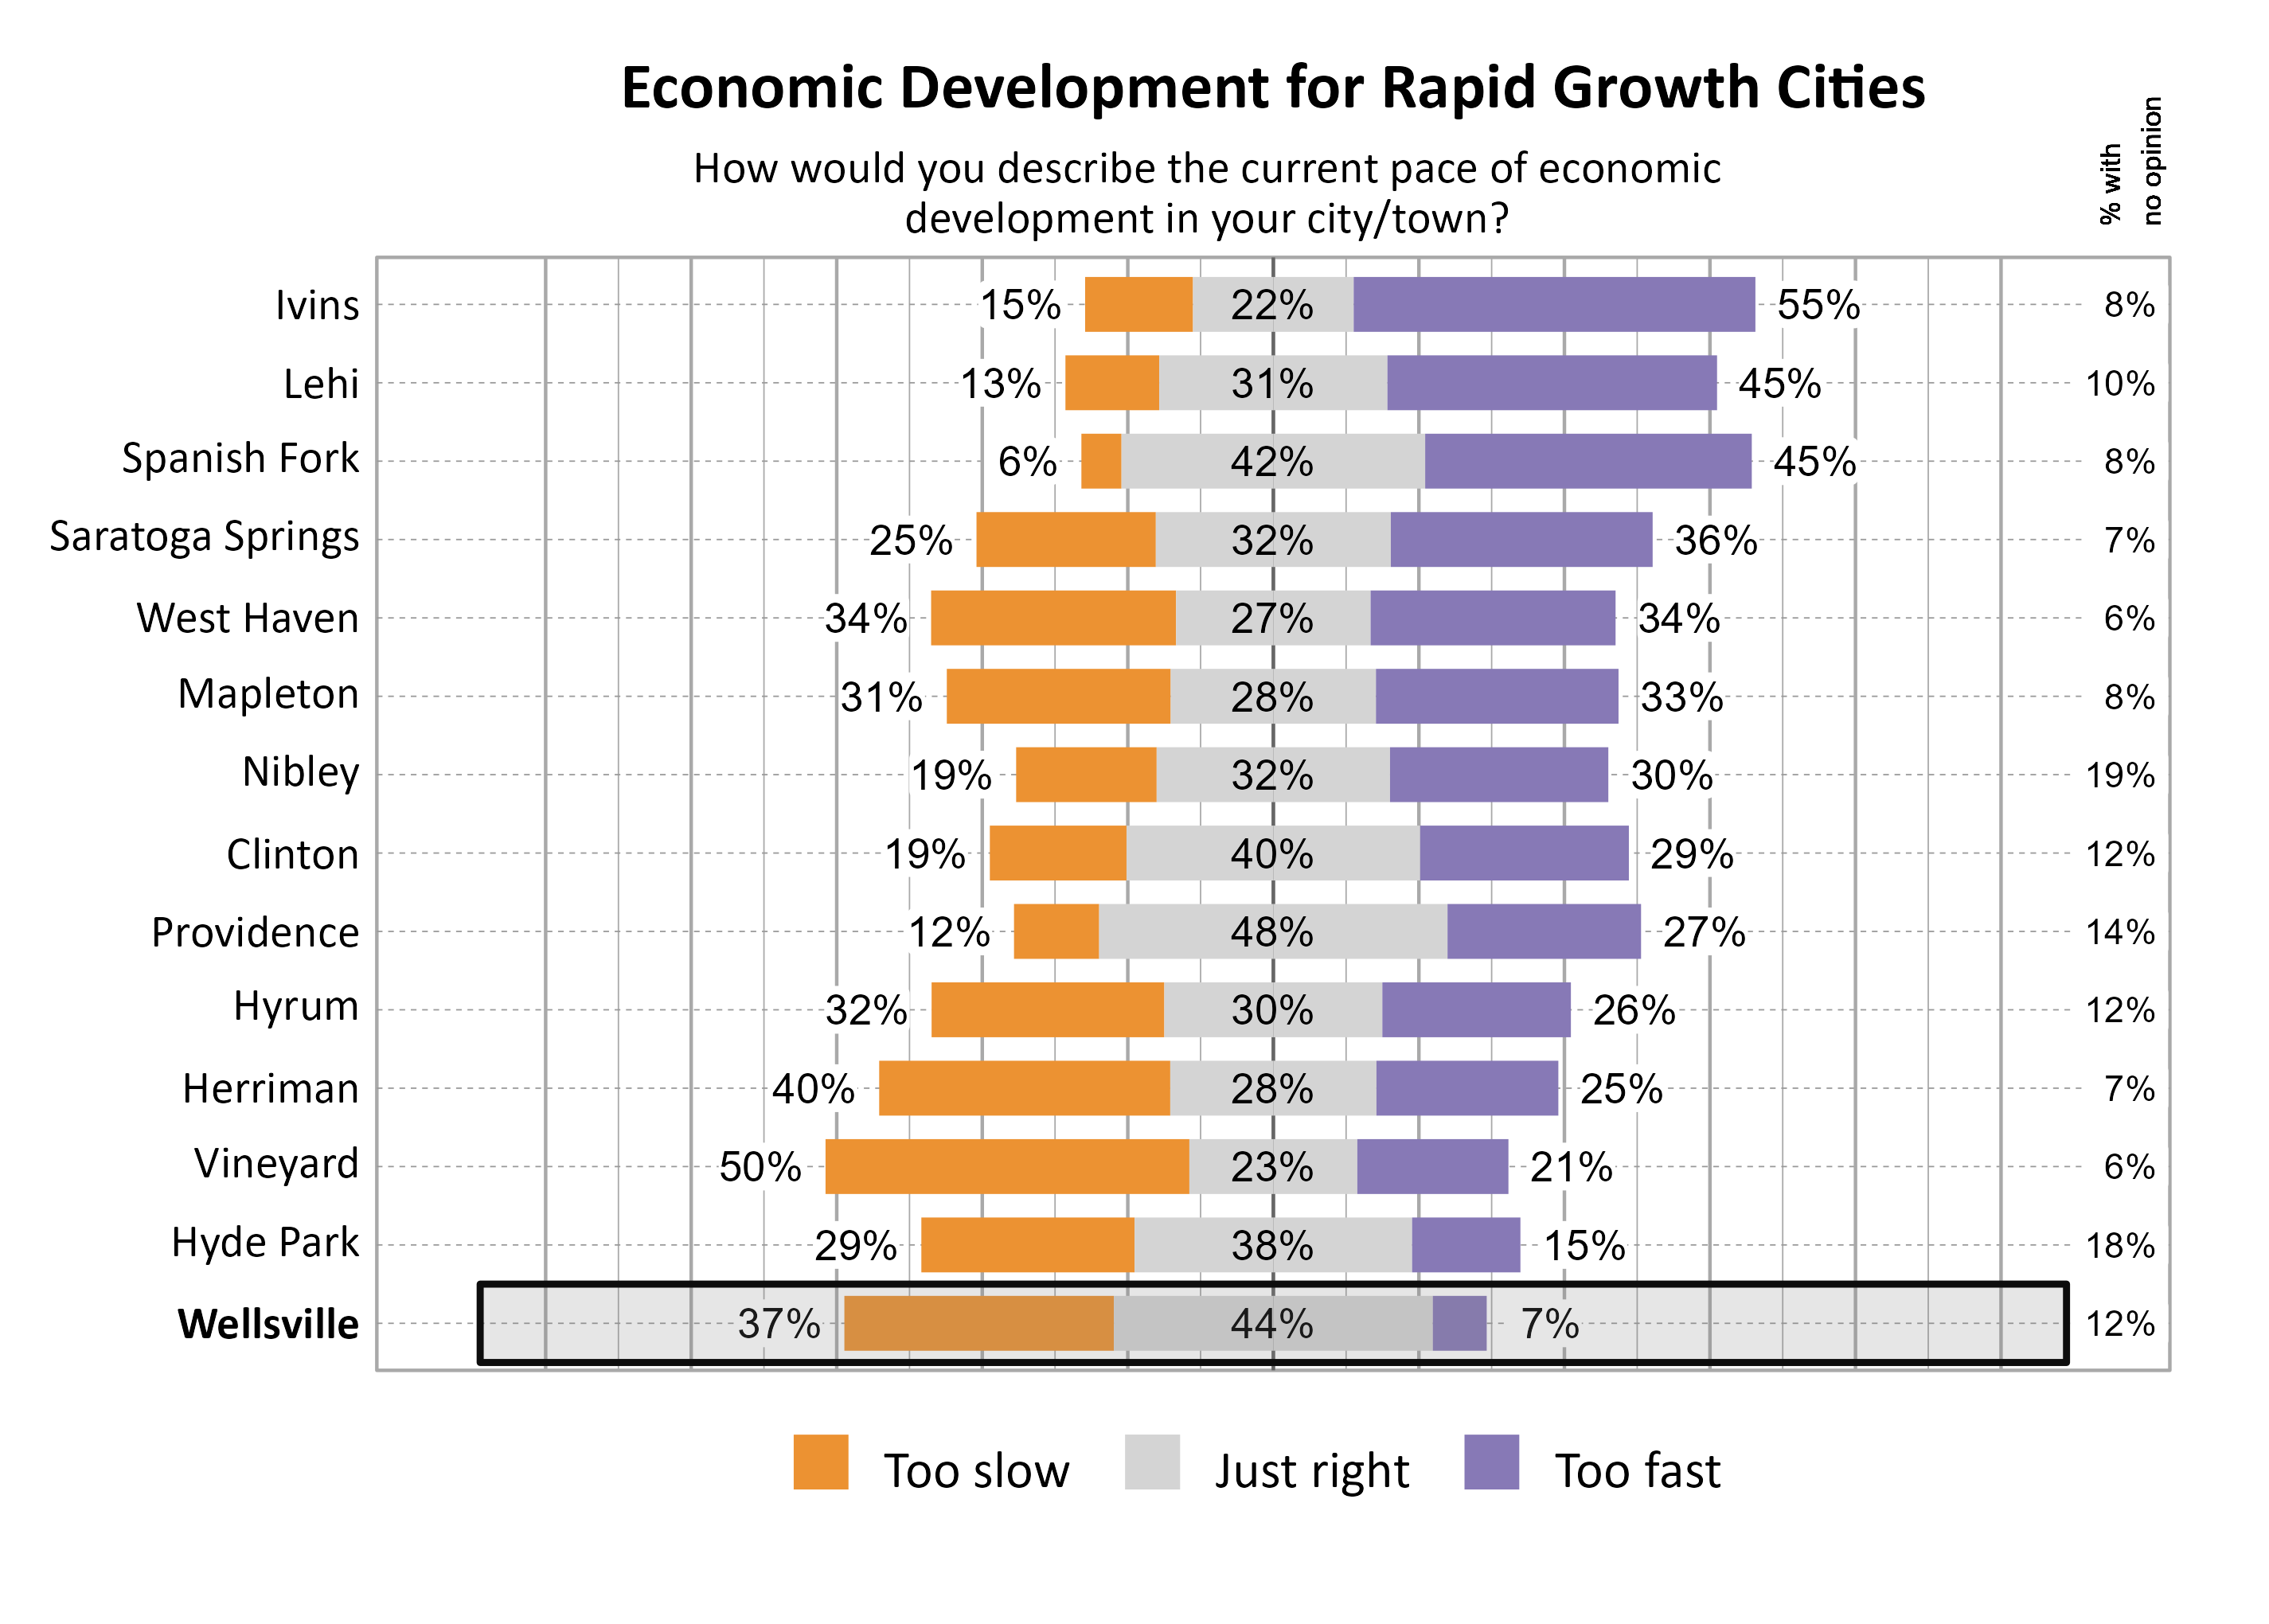
The graph below illustrates how many respondents perceived the pace of economic development as too slow, just right, too fast, or had no opinion, with additional breakdowns for the number of respondents who provided comments.
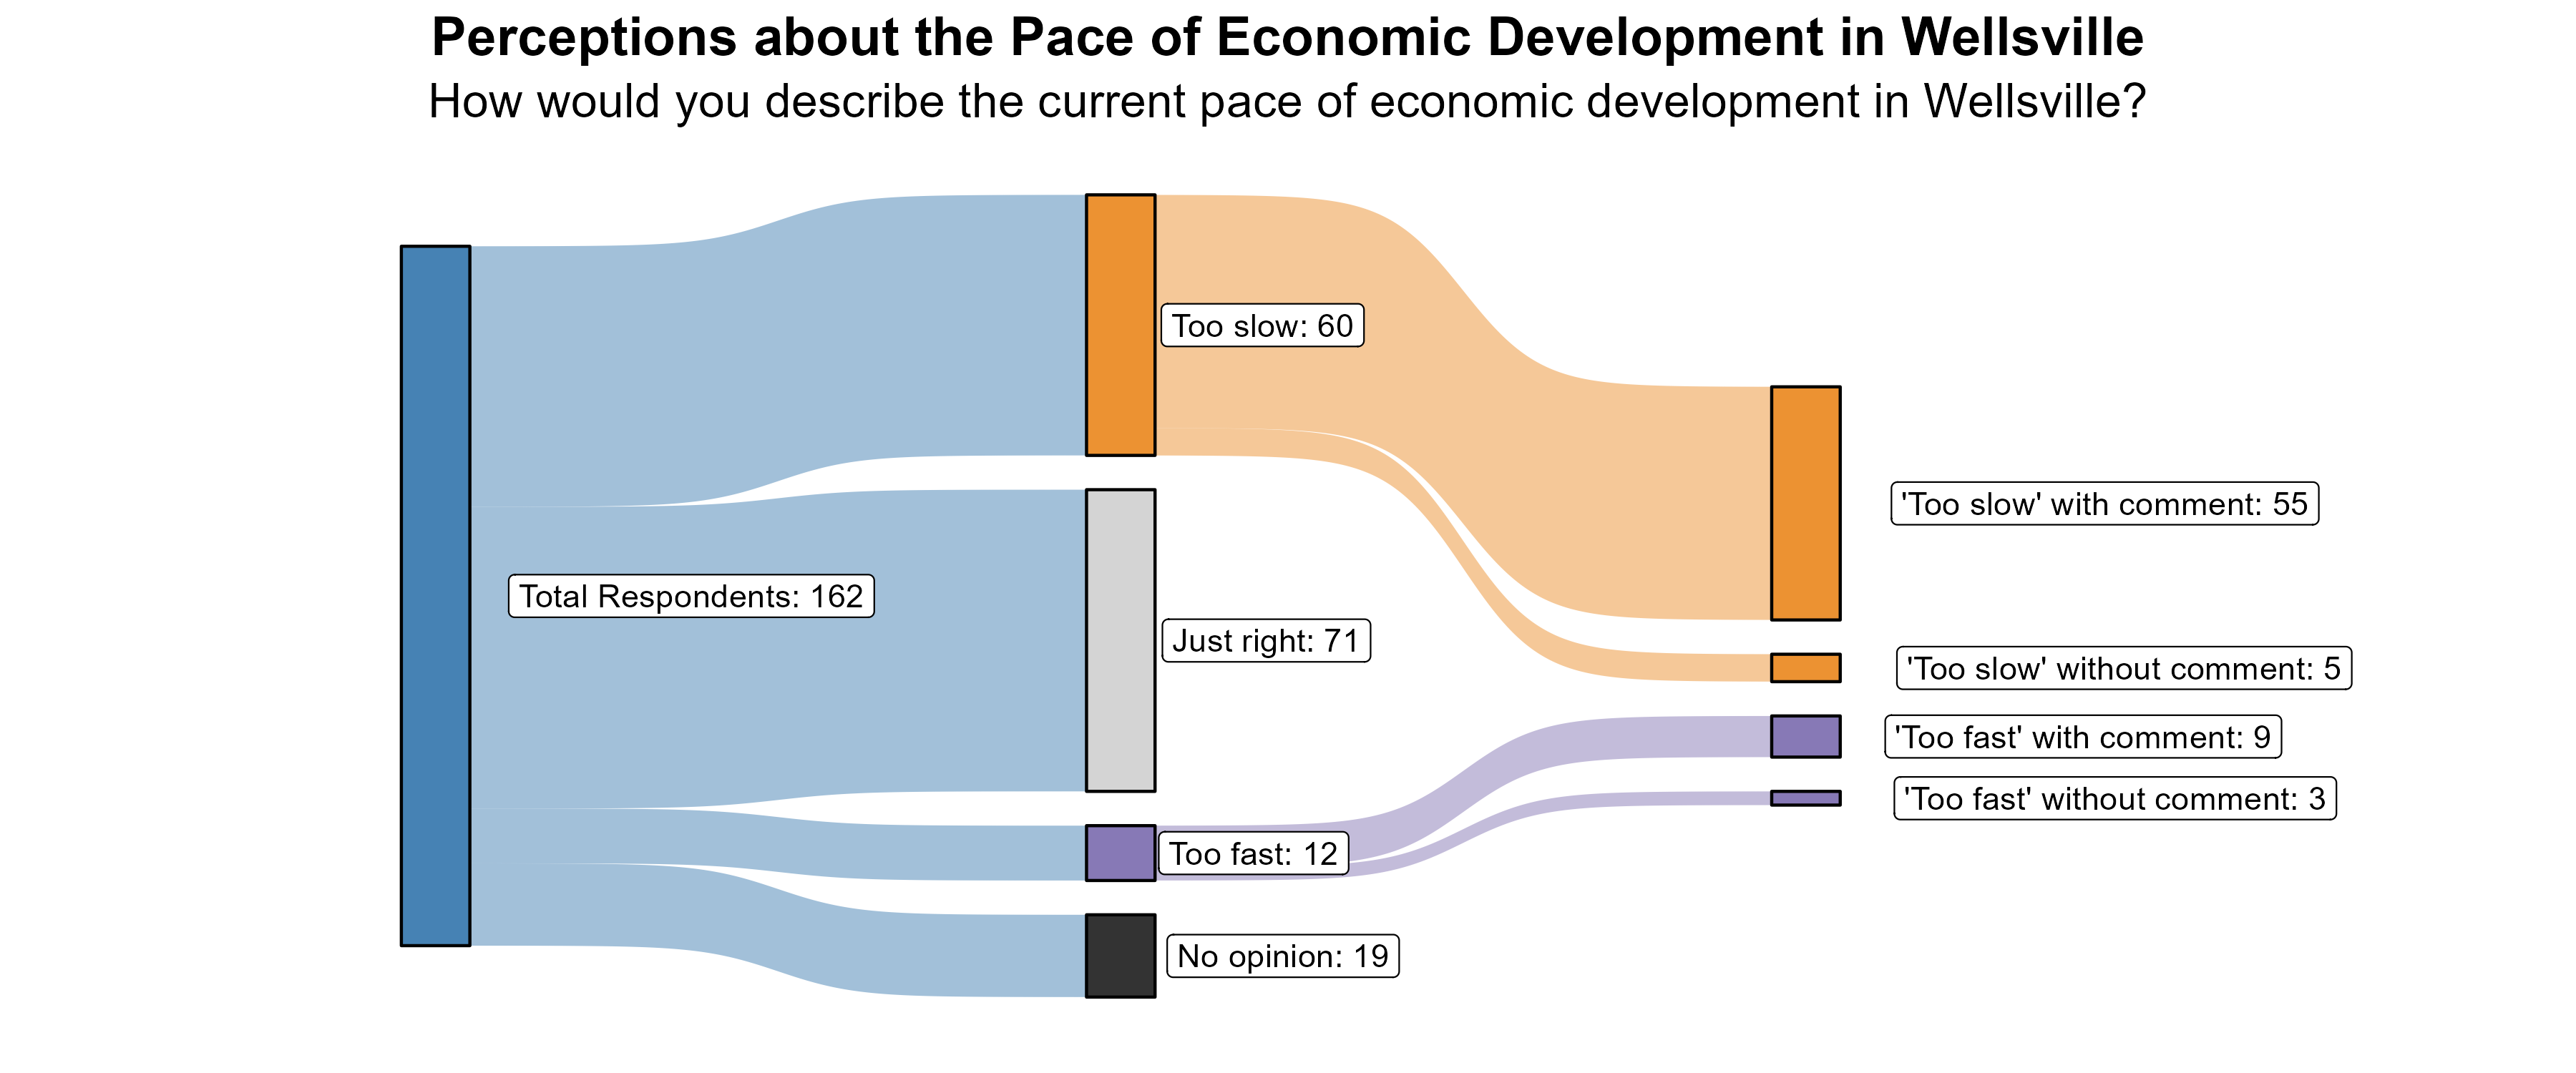
The 37% of respondents who rated the pace of economic growth as “too slow” were further asked what aspects of the local economy they would like to see more of in Wellsville. Comments largely emphasized the need for more stores and businesses in Wellsville. People asked for grocery, shopping, restaurants, services like hair salons, things to do, a hardware store, a Target, etc. People also mentioned the desire for other amenities and services such as a recreation center, library, and doctor’s offices. Some respondents mentioned the drive to Logan for everything was becoming tiring.
Additionally, the 7% of respondents who rated the pace of economic growth as “too fast” were further asked what aspects of the local economy they feel are growing too quickly in Wellsville. Most comments were a reference to housing being developed too fast. Other worries in conjunction with housing related to water and other resources, open space, and parking. There were additional comments about growth being too fast in general, and concern about taxes.
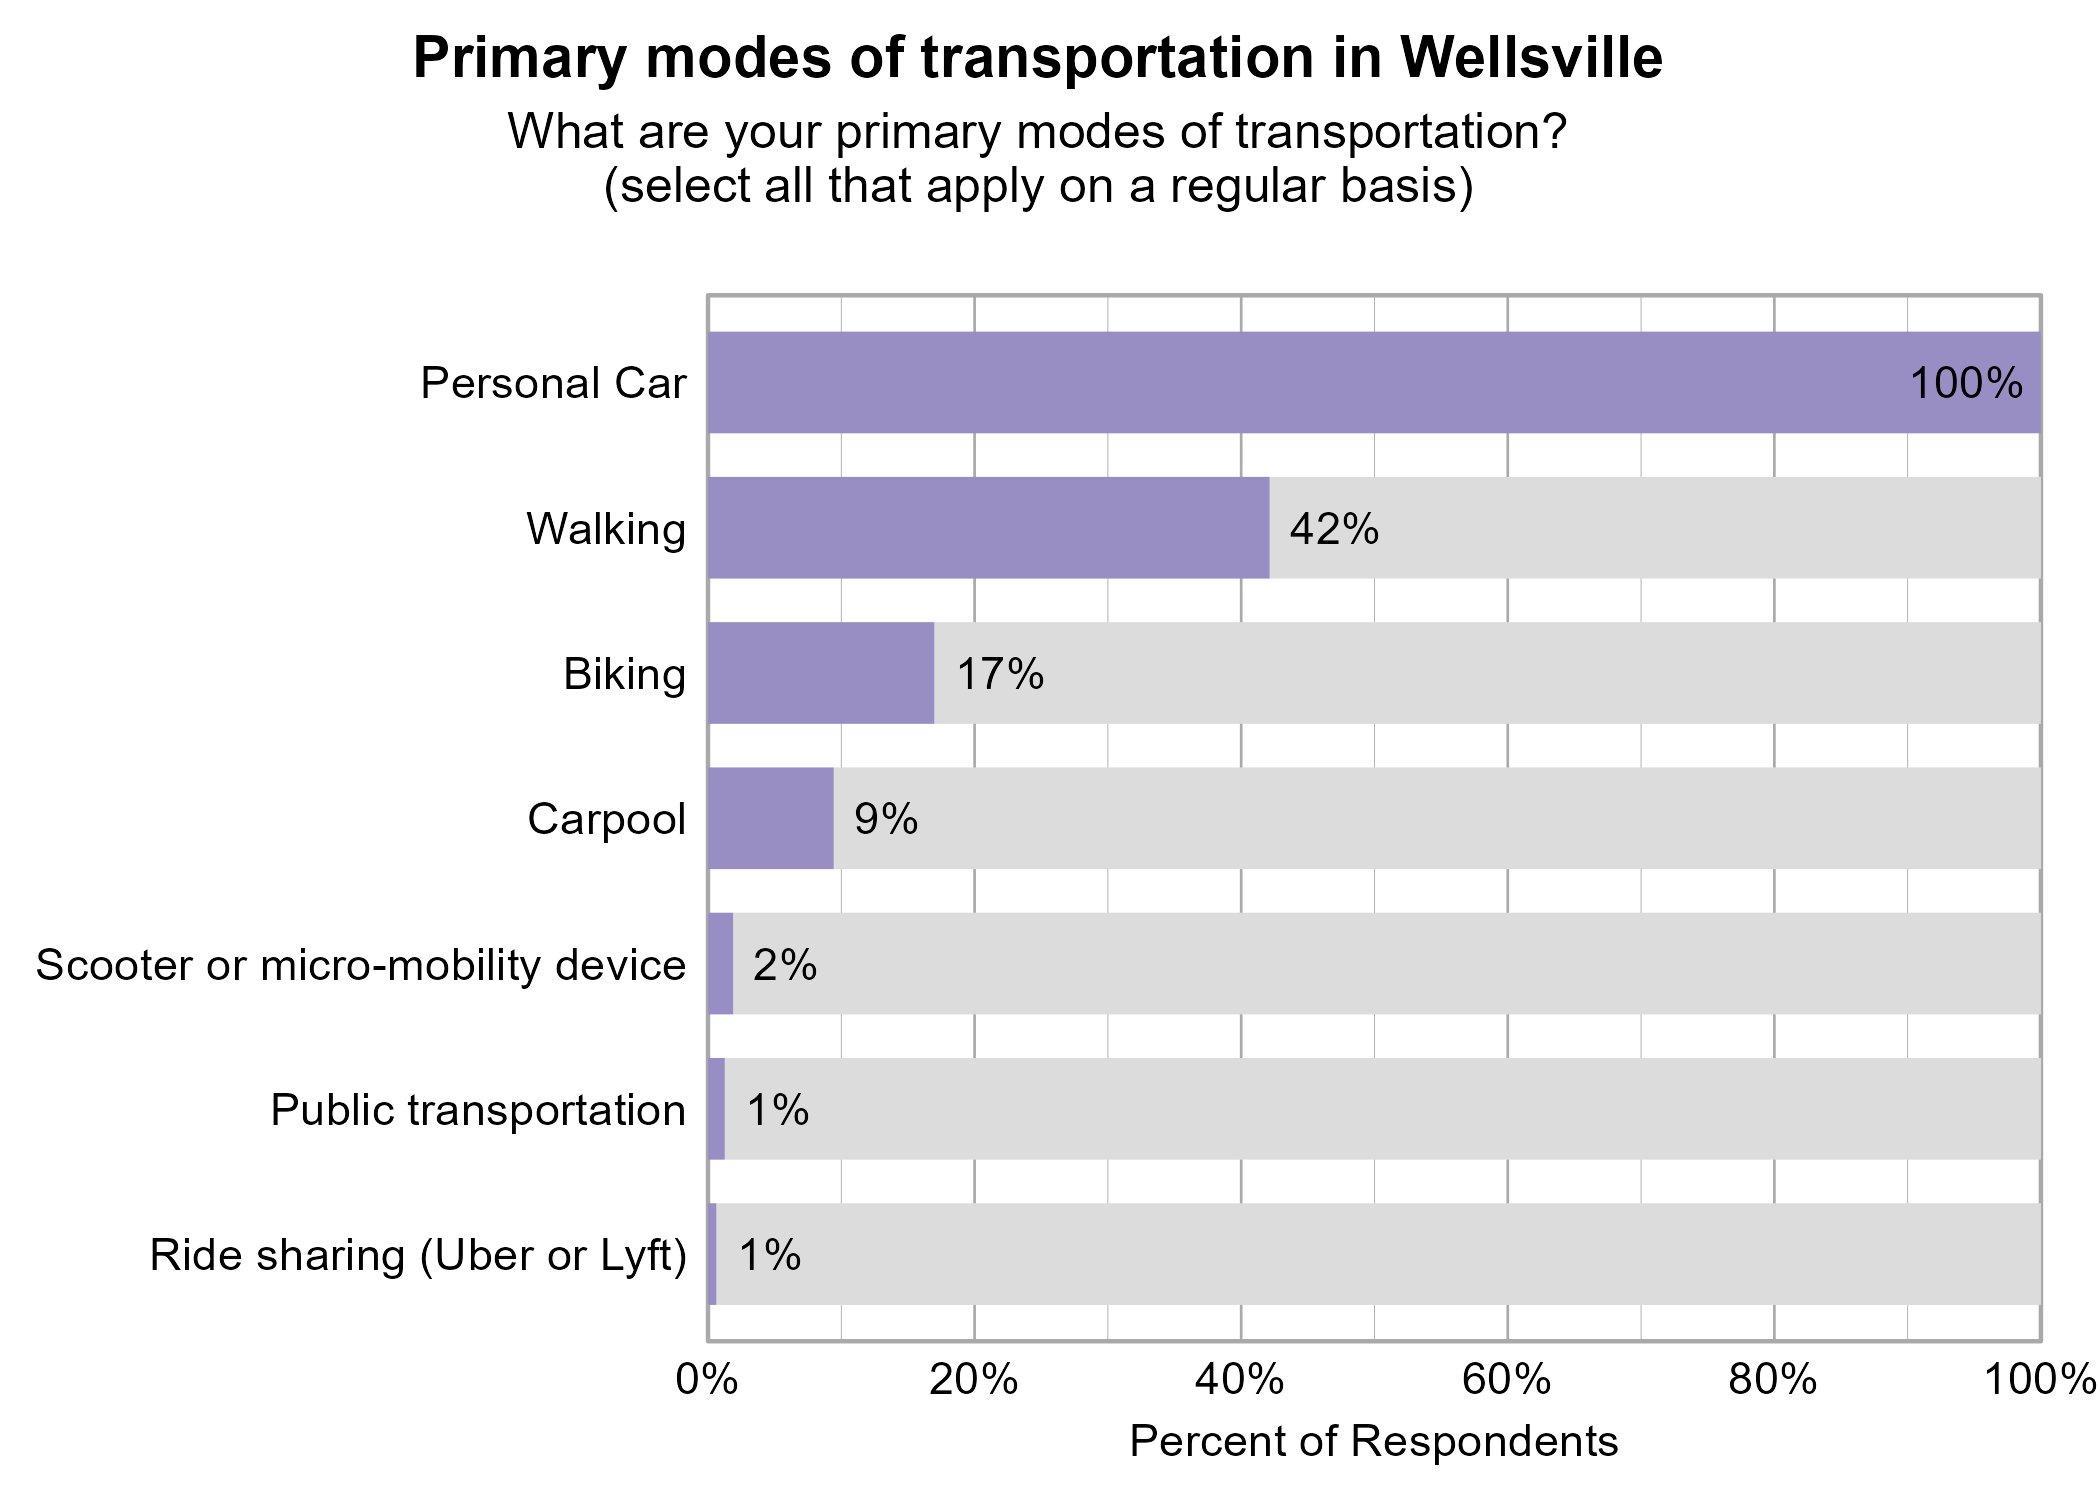
Transportation in Wellsville
Respondents were asked to indicate all of their primary modes of transportation on a regular basis in Wellsville. The most popular modes of transportation were personal car (100%) and walking (42%).
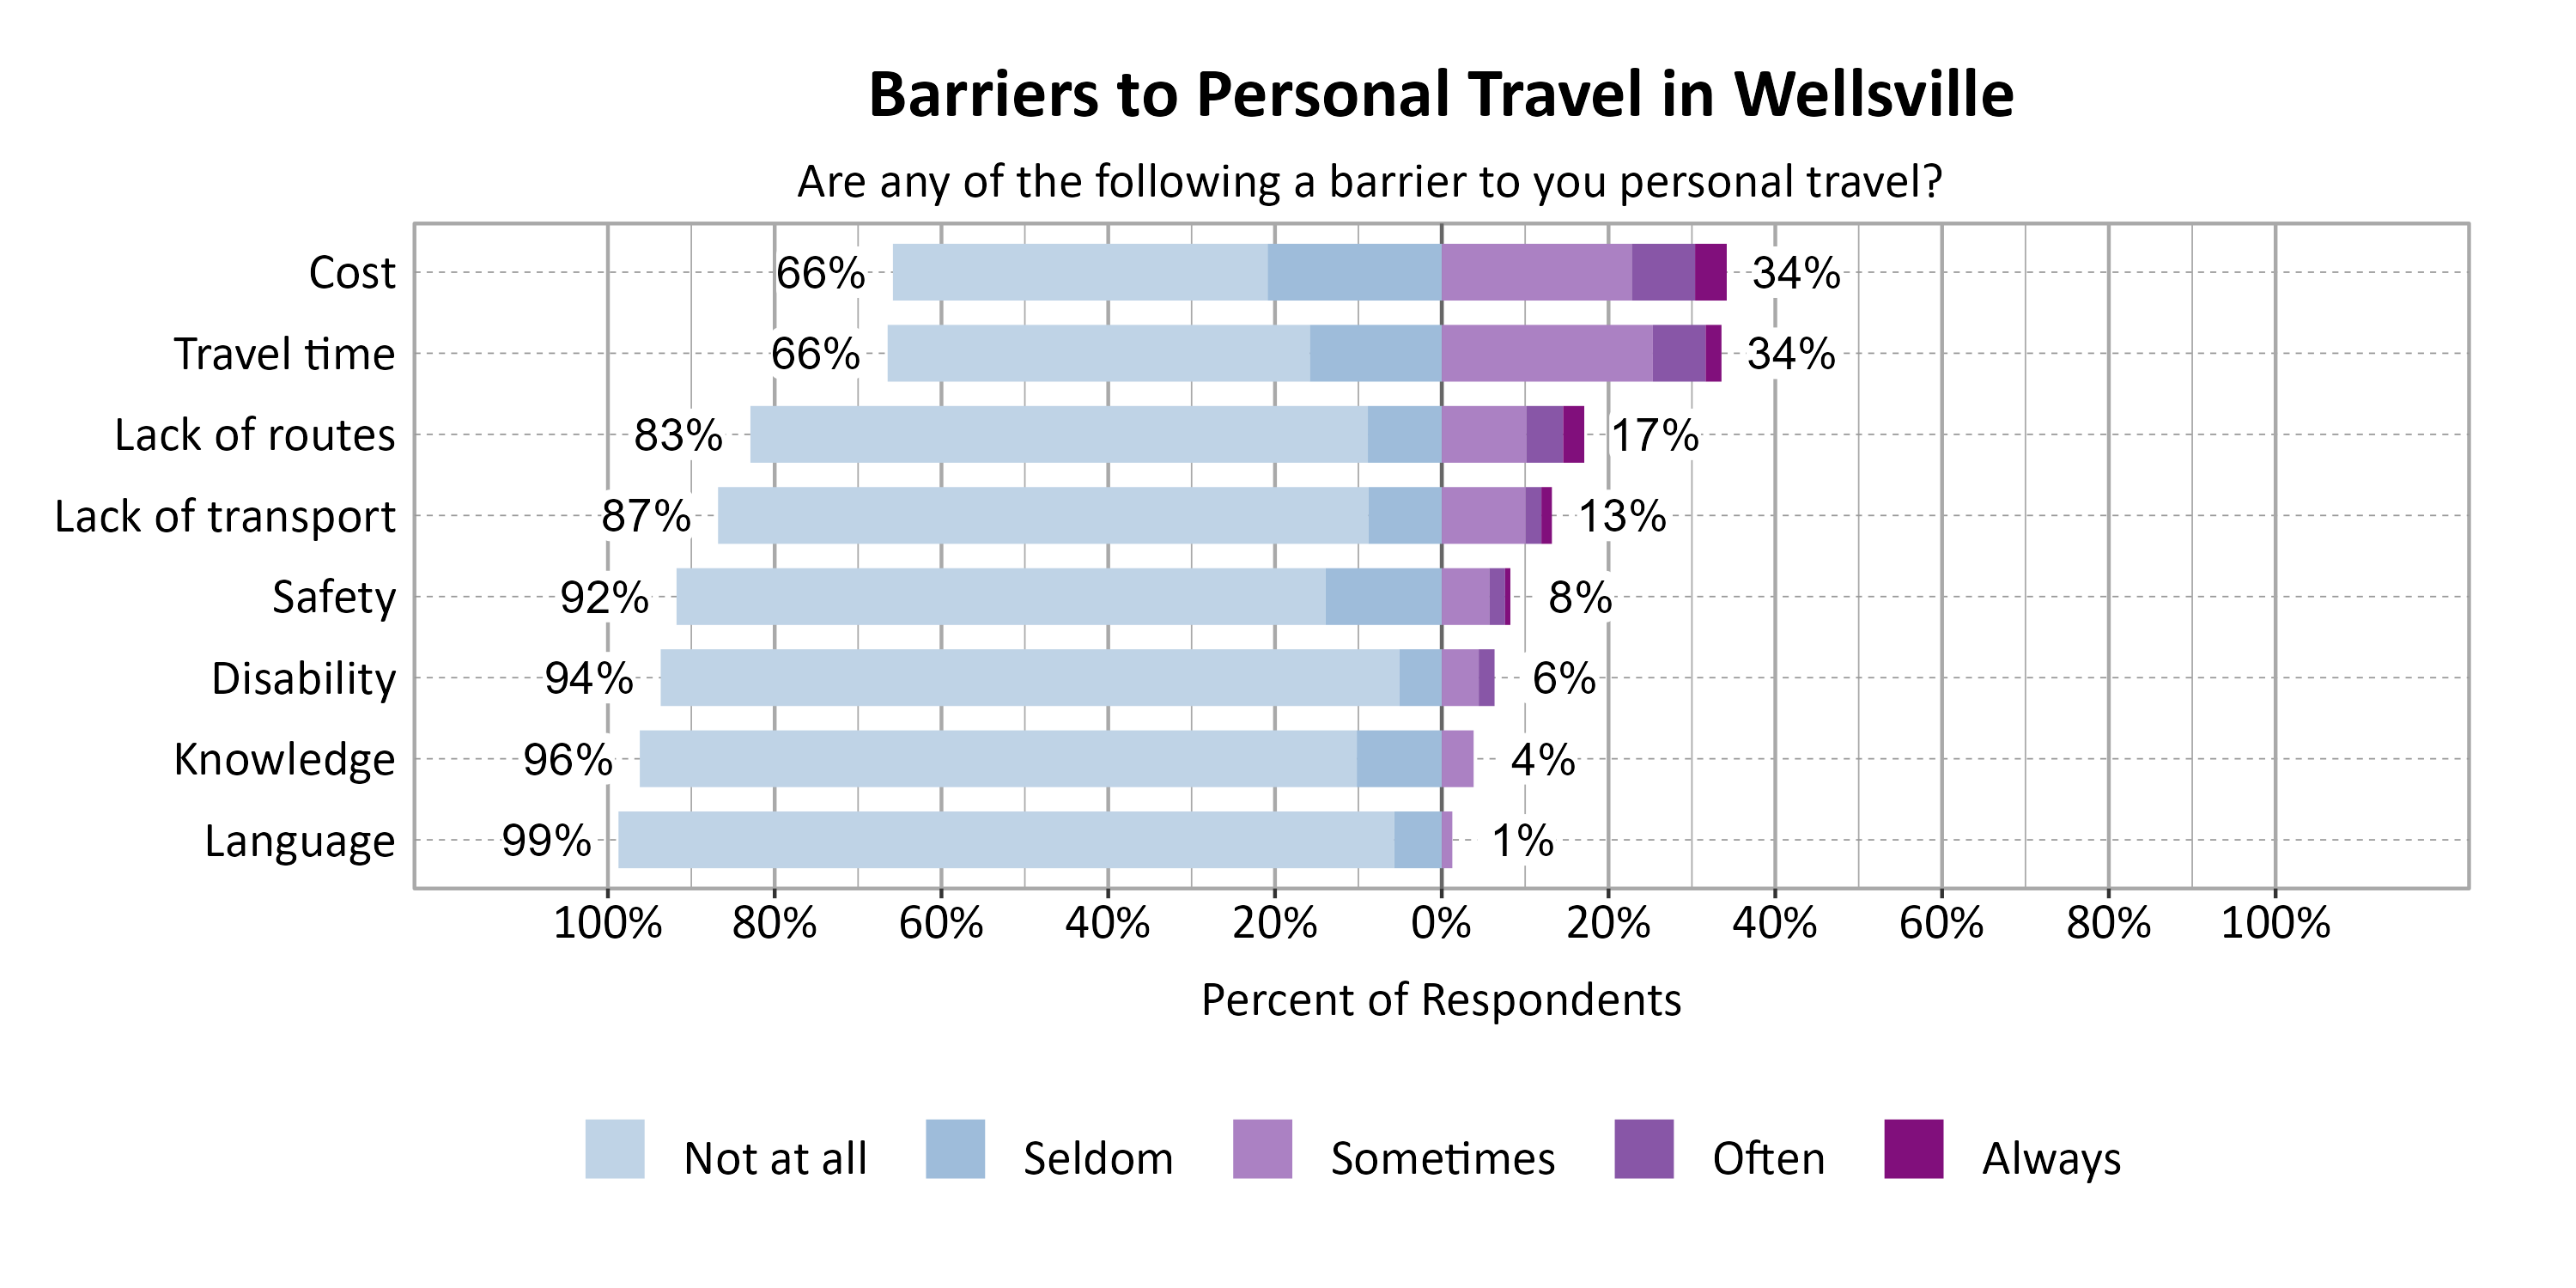
Respondents were asked to indicate the most common barriers to transportation in Wellsville. The most problematic barriers were Cost (34%) and Travel time (34%).
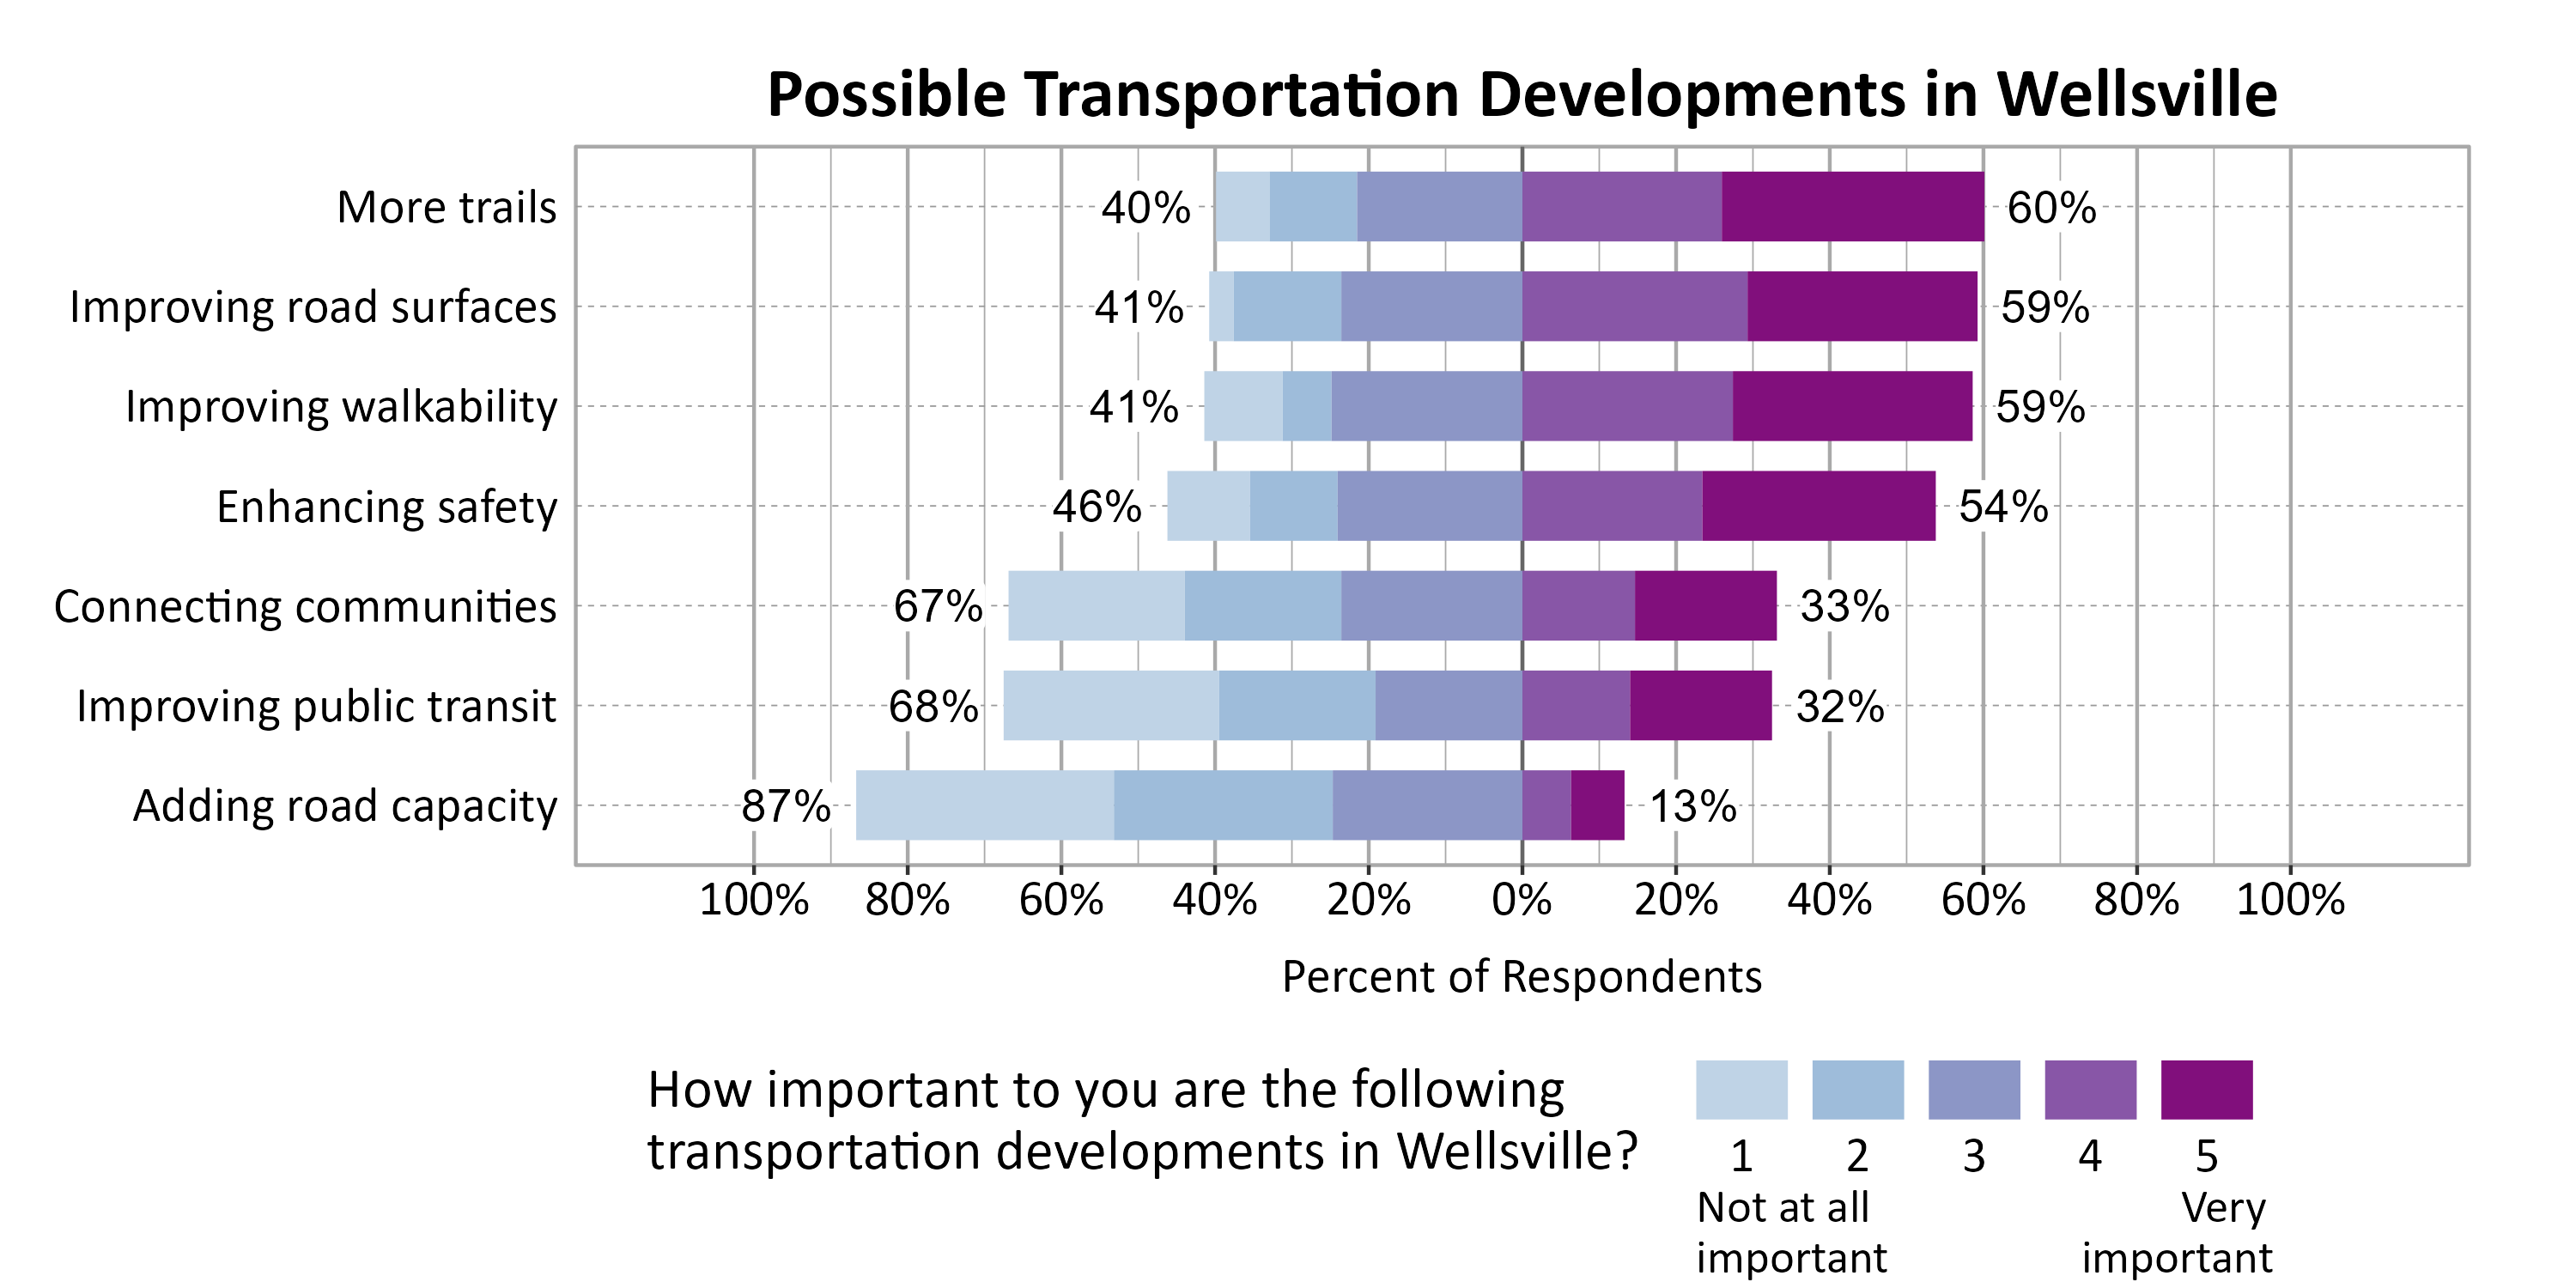
Respondents were asked to indicate the importance of a set of possible transportation developments in Wellsville. The most important development to respondents were More trails (60%), Improving road surfaces (59%), and Improving walkability (59%).
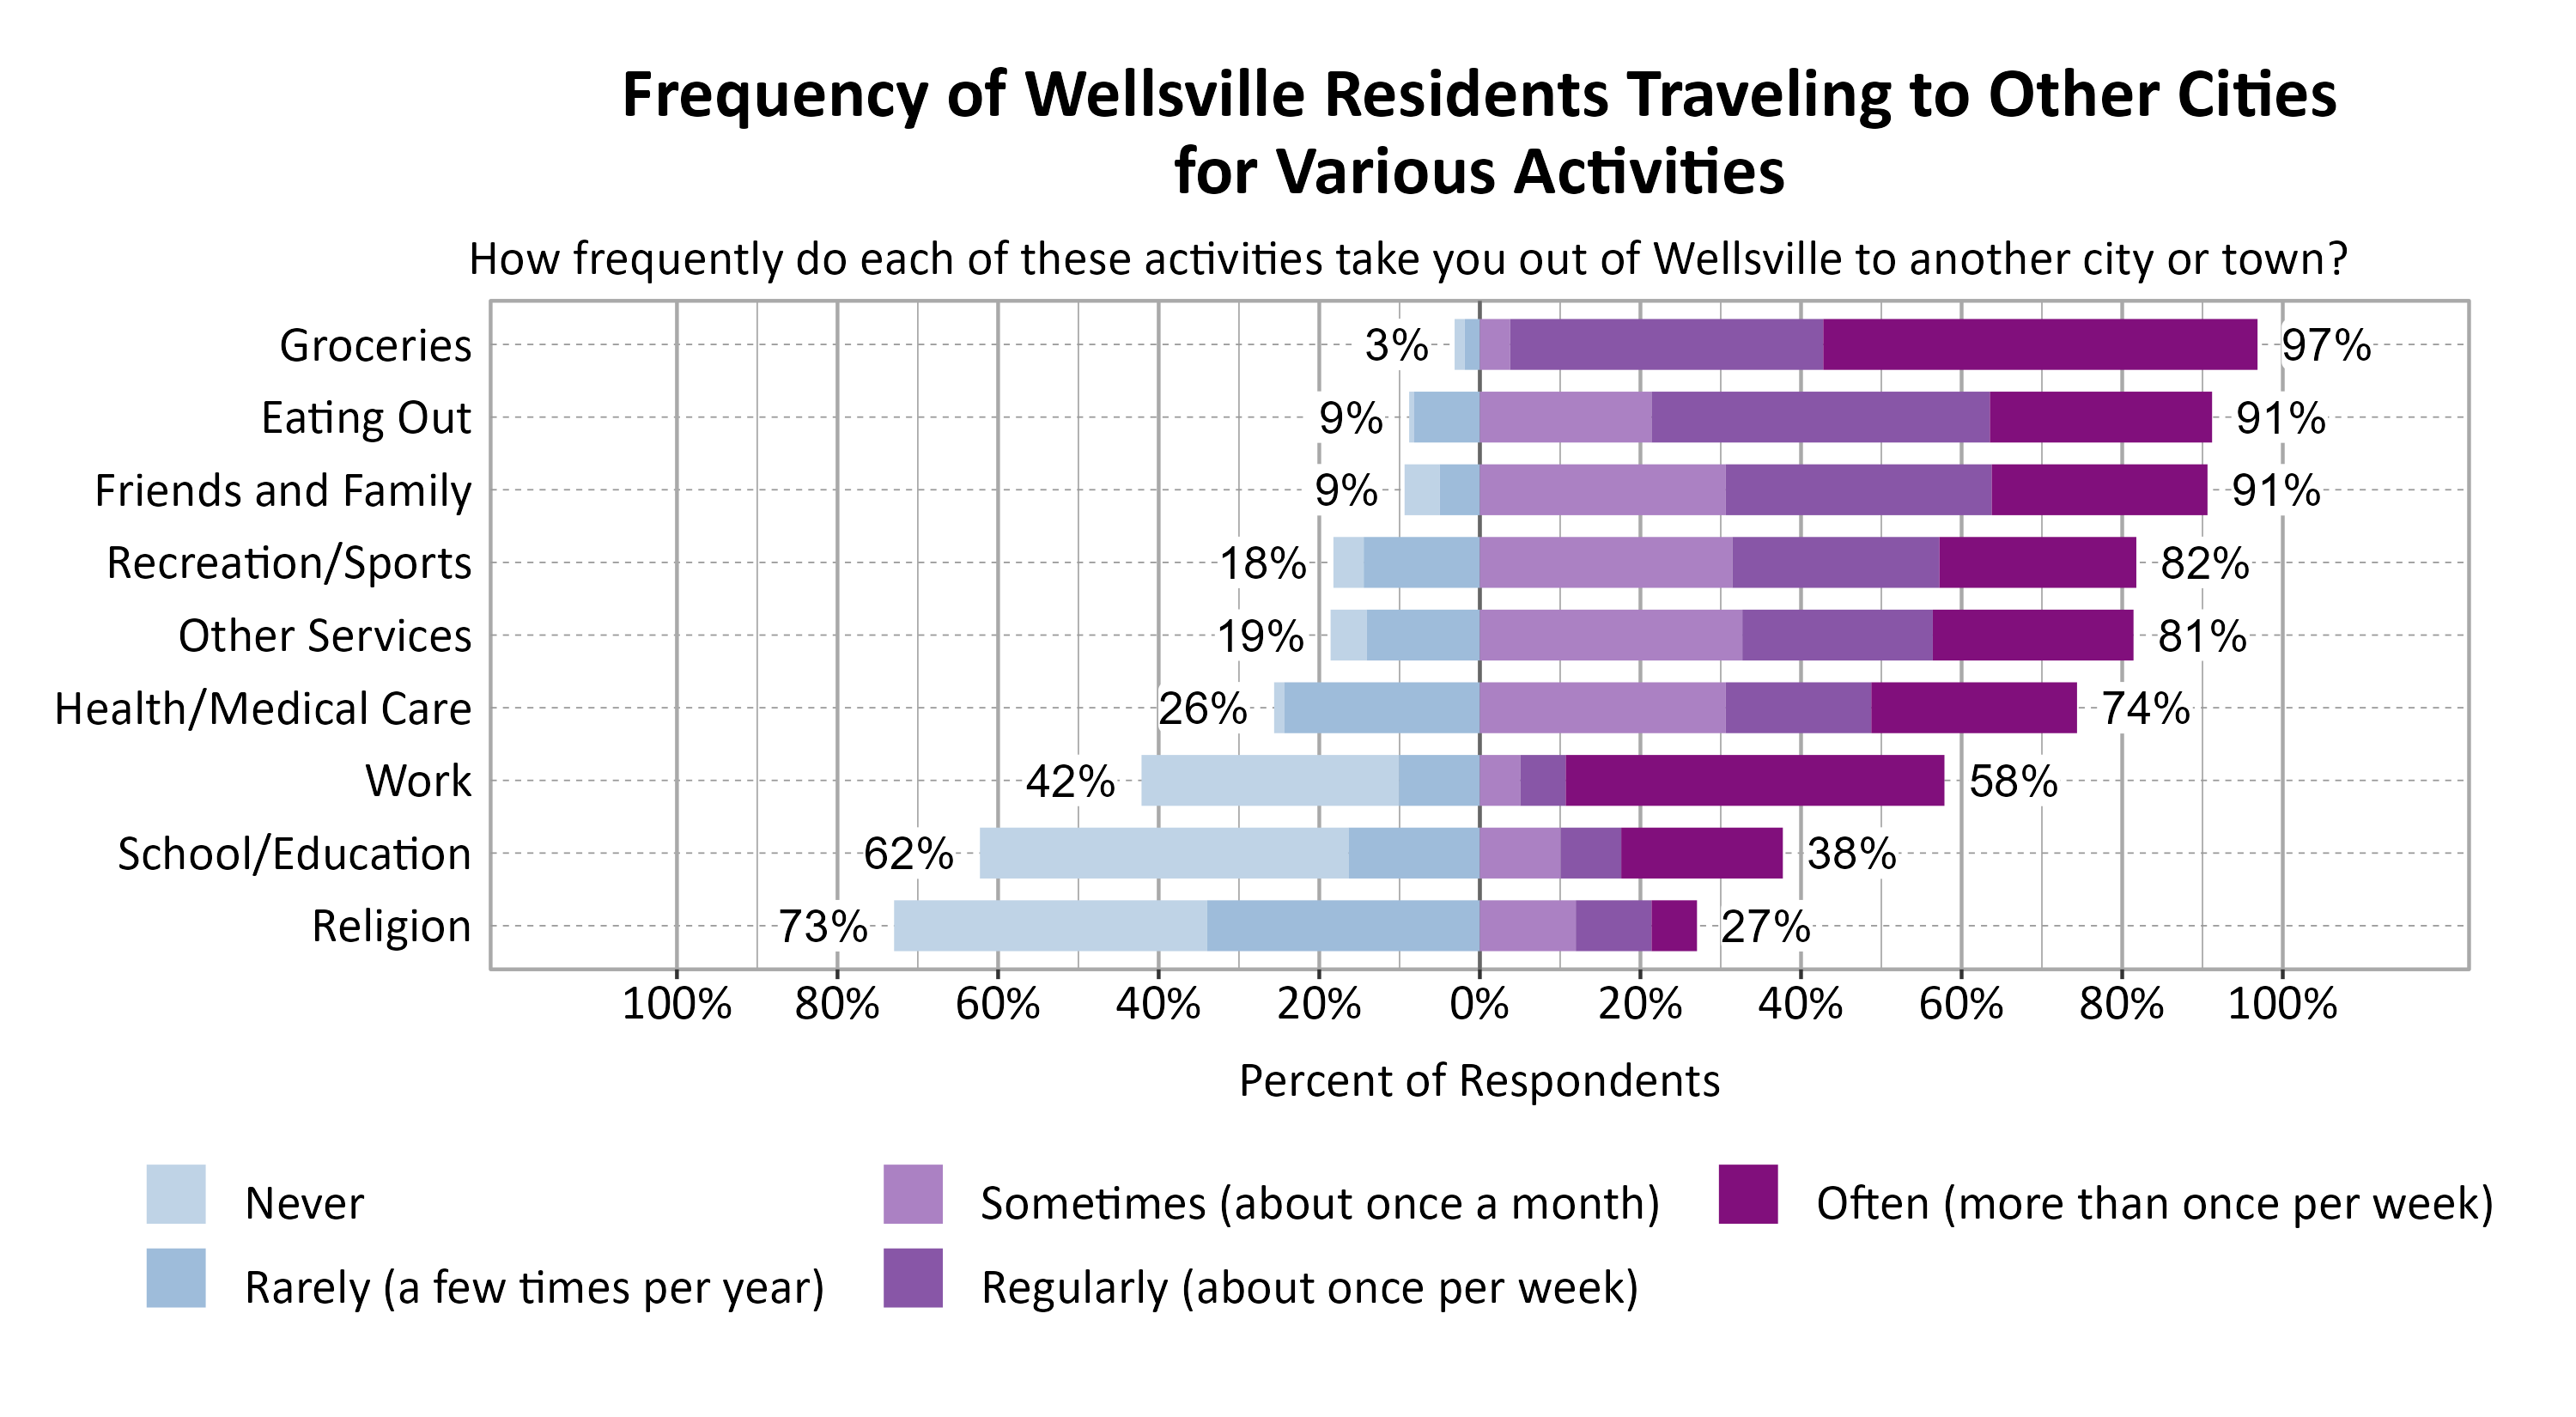
Respondents were asked to indicate how frequently various activities take them out of Wellsville to another city or town. The most commonly indicated reasons for traveling to another city or town at least sometimes or once a month were Groceries (97%), Eating Out (91%), and Friends and Family (91%).
Concerns in Wellsville
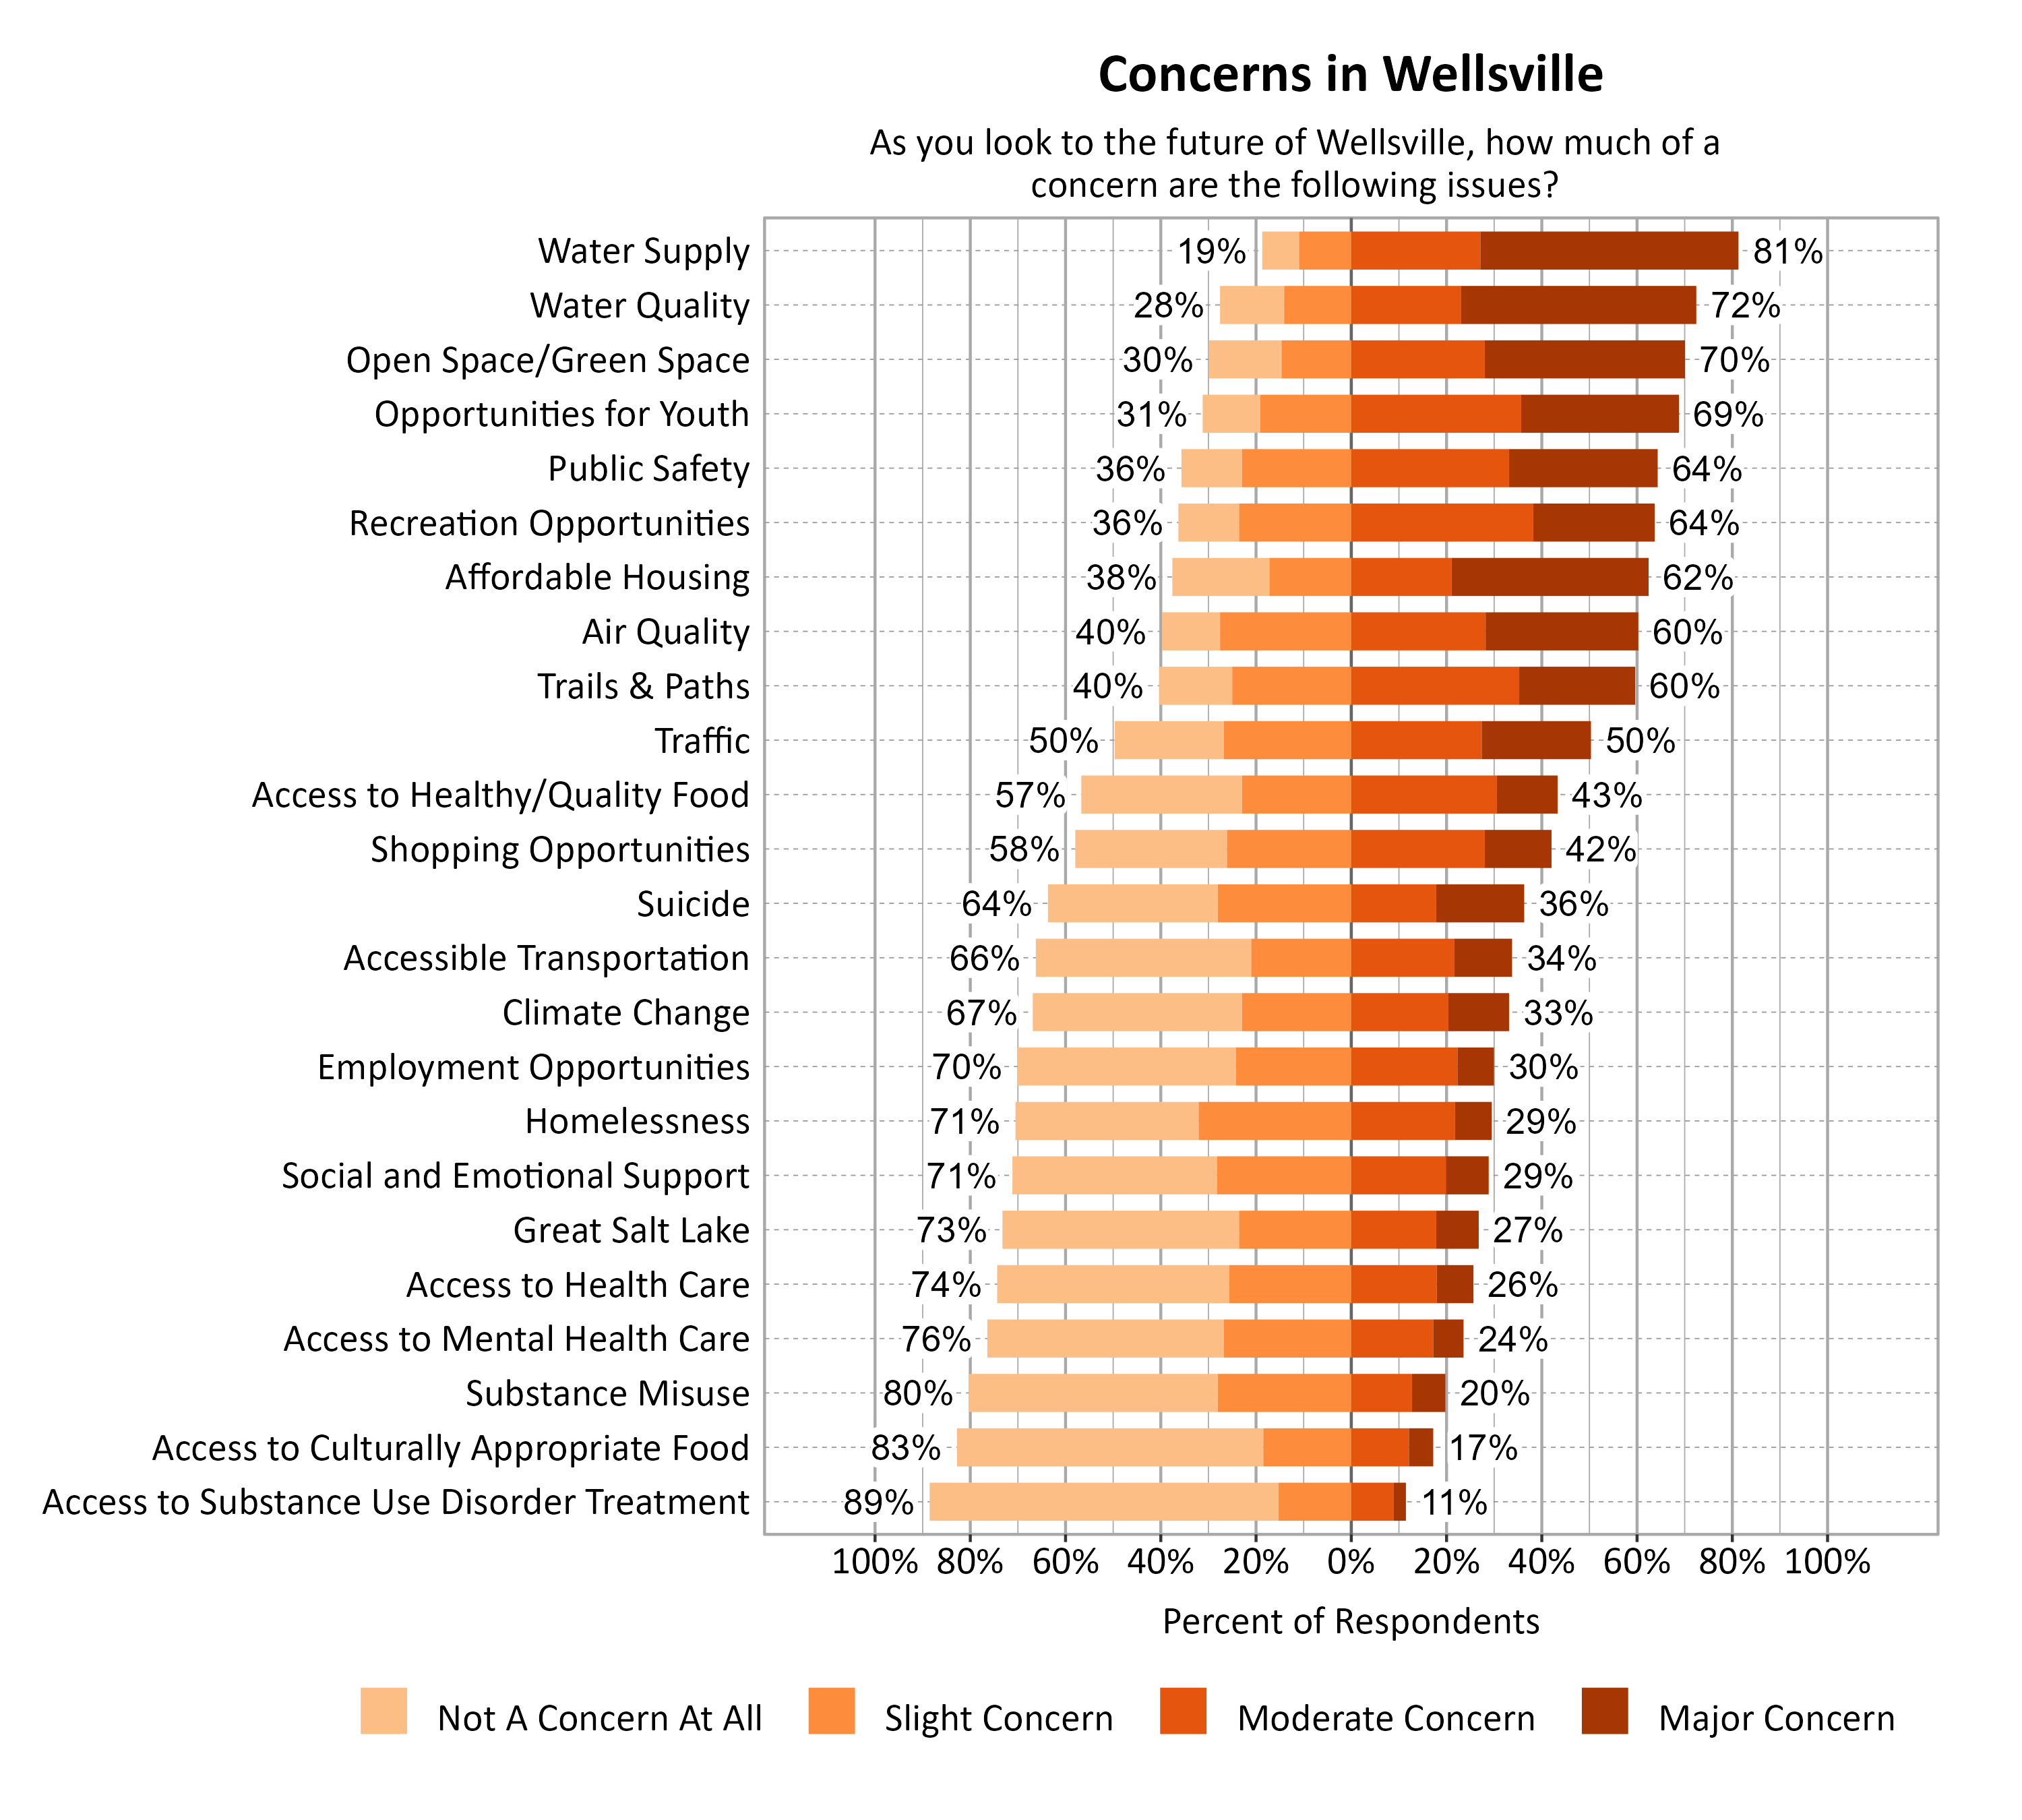
Survey respondents indicated the degree to which a number of possible local issues were a concern as they look to the future of Wellsville. Water Supply (81%), Water Quality (72%), Open Space/Green Space (70%), and Opportunities for Youth (69%) were the top concerns.
Additional Questions for Wellsville
City Services and Program Hours in Wellsville
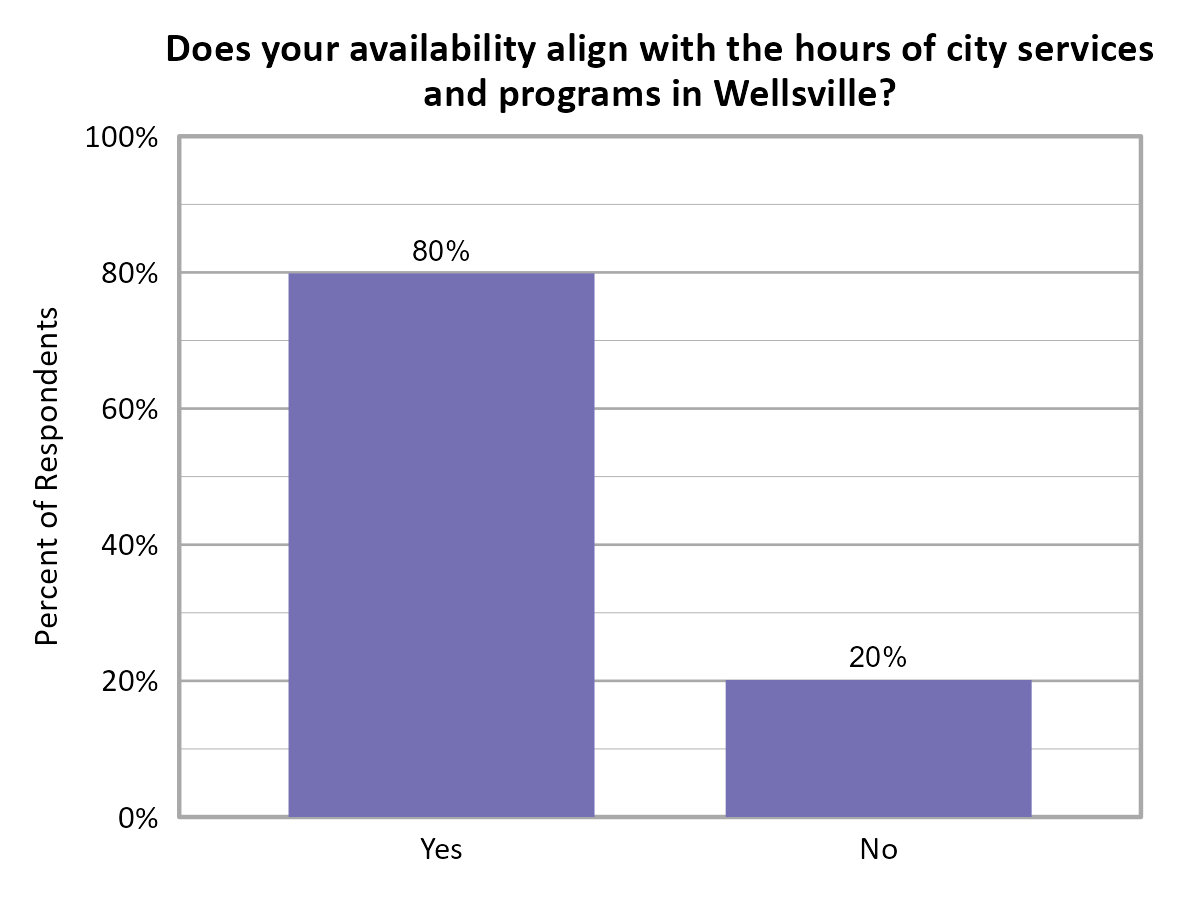
Respondents were asked to indicate if their availability aligns with the hours of city services and programs in Wellsville. The majority of respondents indicated Yes (80%).
Respondents were also asked if any changes in the hours of city services and programs that would be helpful to them or their household. There were a mix of comments on hours of city services and programs. Some comments suggest that adding hours and availability on Fridays would help to serve residents who work during weekdays. There were additional comments about the need for better snow and debris clean up on roads, green waste service, diverse community opportunities, and public transportation. Some expressed satisfaction with current hours and services.
Amenities in Wellsville
When asked how important a set of amenities were to household wellbeing, the most important were Trail Development (90%), Pavilions and Playgrounds (89%), and Nature Parks (84%).
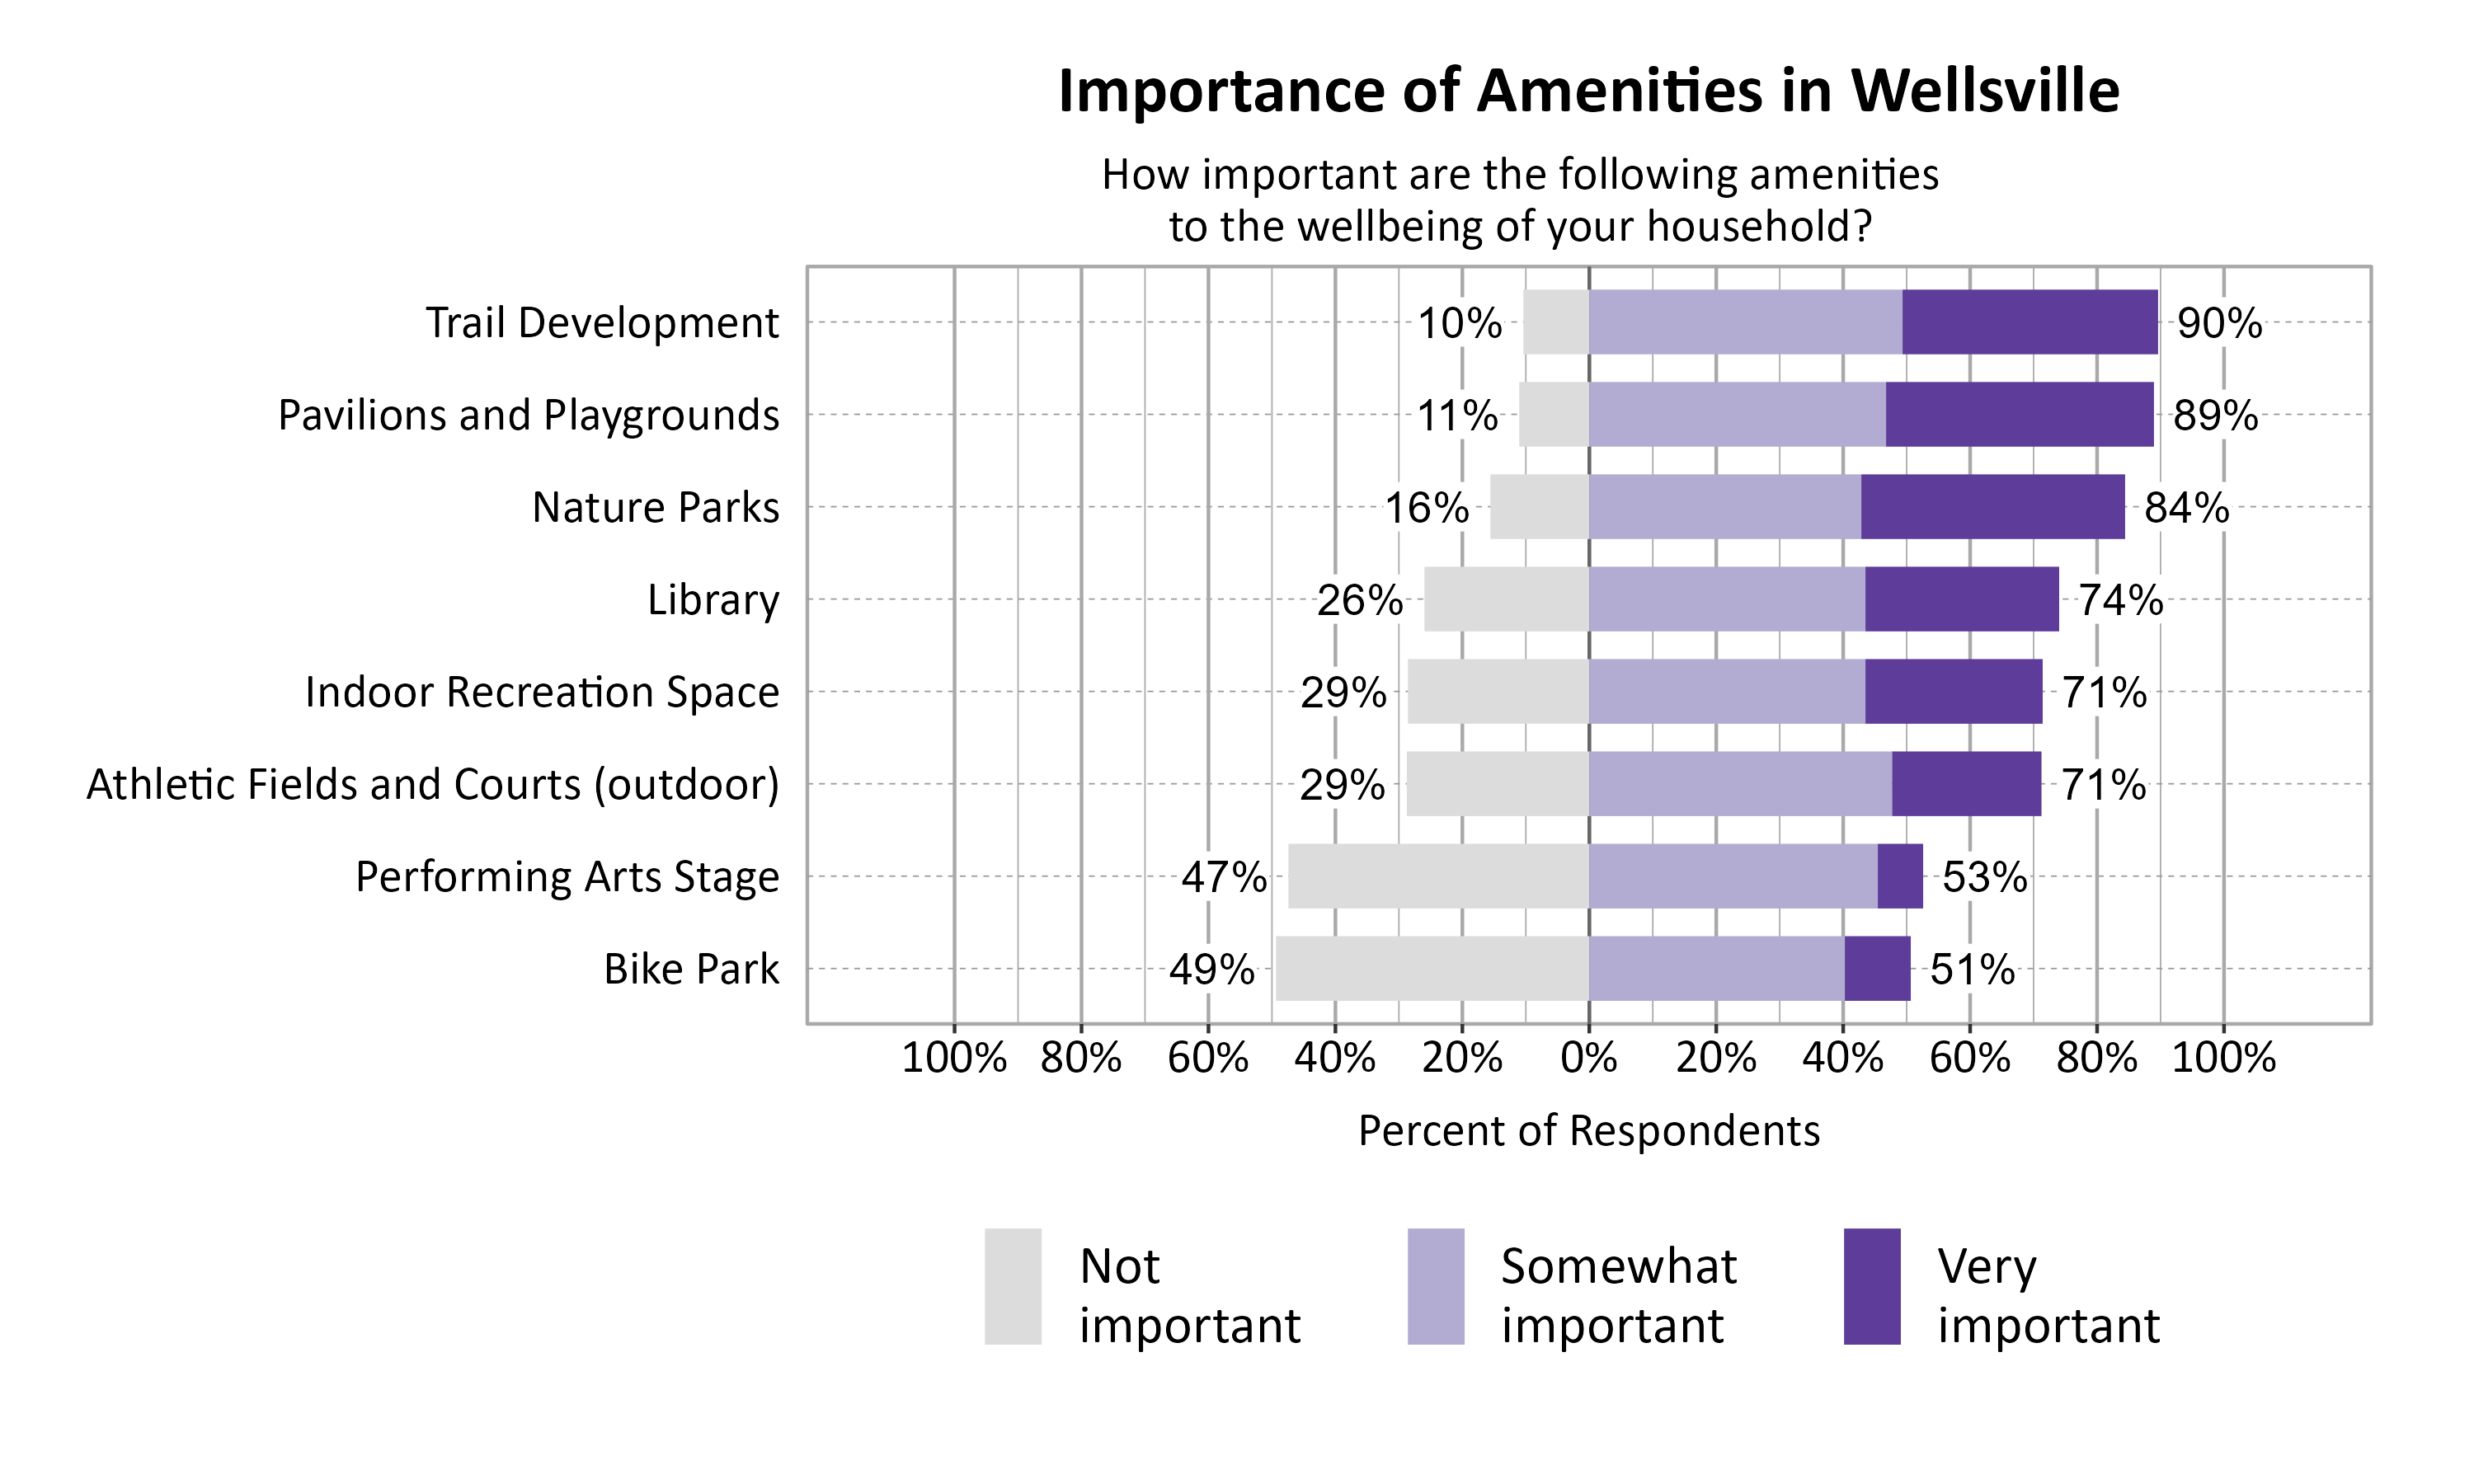
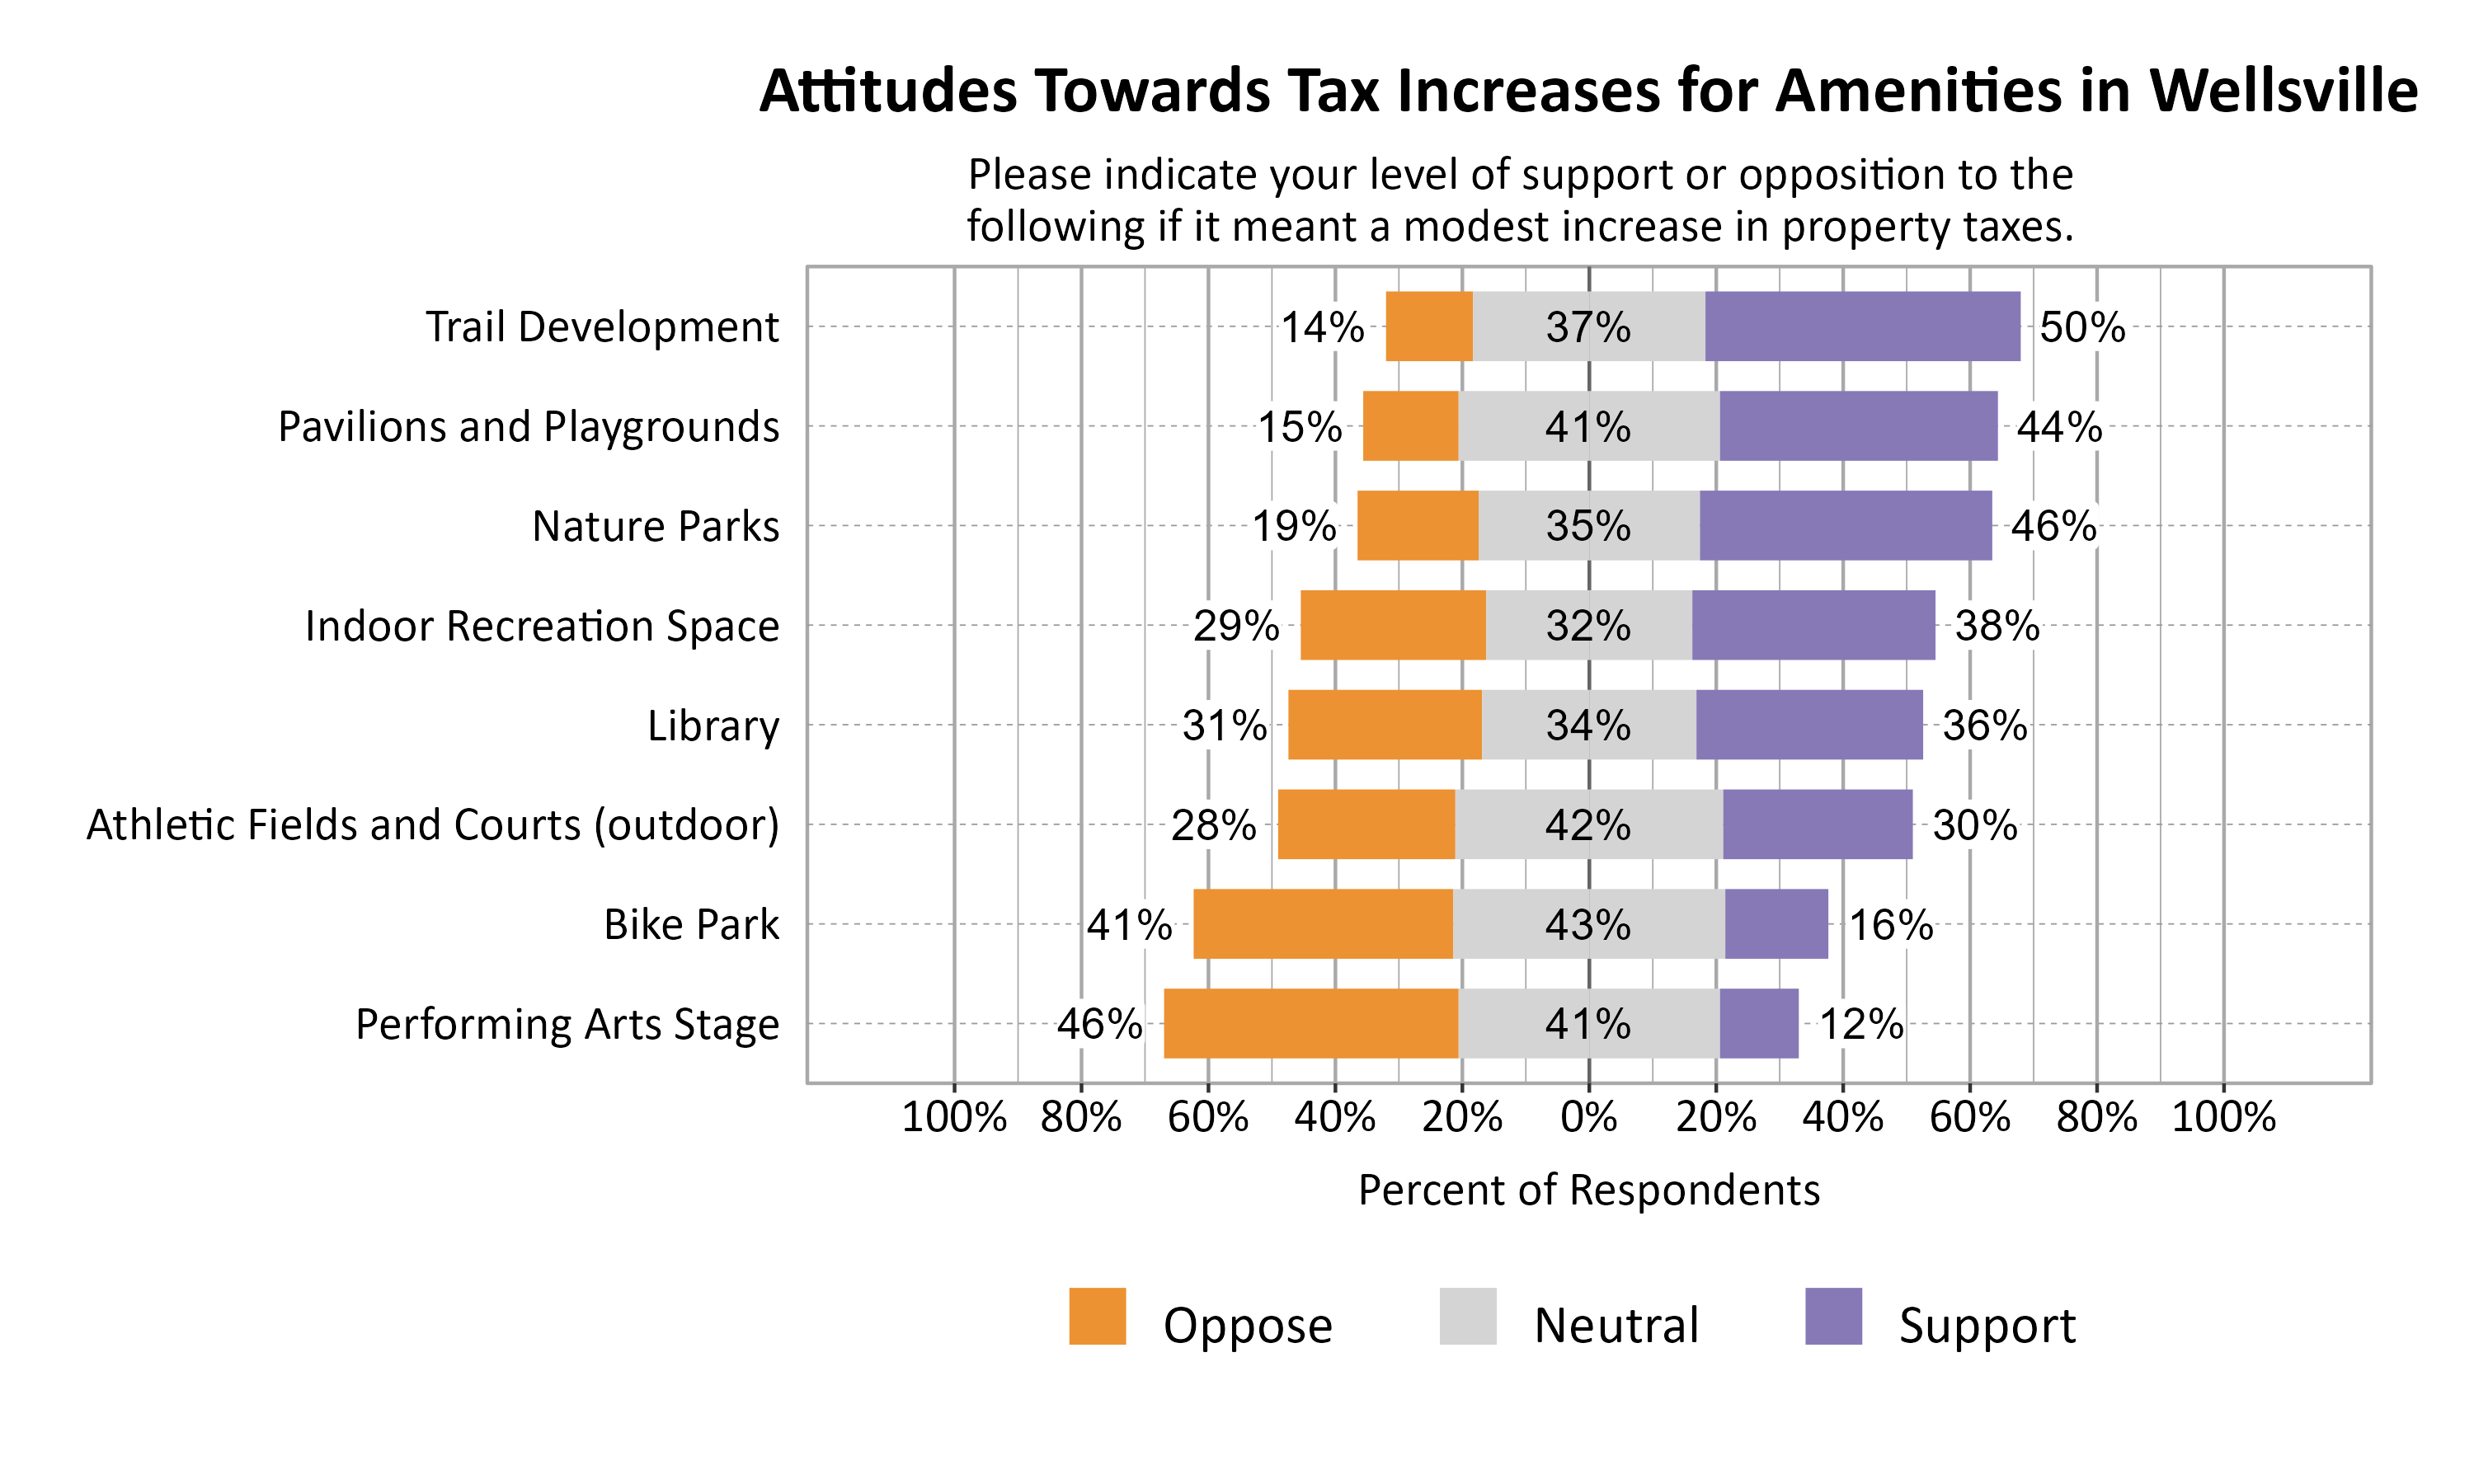
When asked about support or opposition to the above amenities if it meant a modest increase in property taxes, support was highest for Trail Development (50%), Pavilions and Playgrounds (44%), and Nature Parks (46%).
Respondents were also asked if they had any additional comments about Wellsville amenities or services. Comments focused on recreation emphasized needed attention to tennis courts, bike paths and trails, sidewalk safety, and a few other amenities such as indoor recreation space and the bathroom at the Wellsville dam park. Transportation was another theme of comments with particular focus on road and sidewalk maintenance. Other comments were a mix of positive comments along with concerns about taxes, affordability, loose dogs, and wanting green waste dumpsters back.
Open Comments
All open comments collected in the survey were shared with city leaders. General observations and themes are shared here.
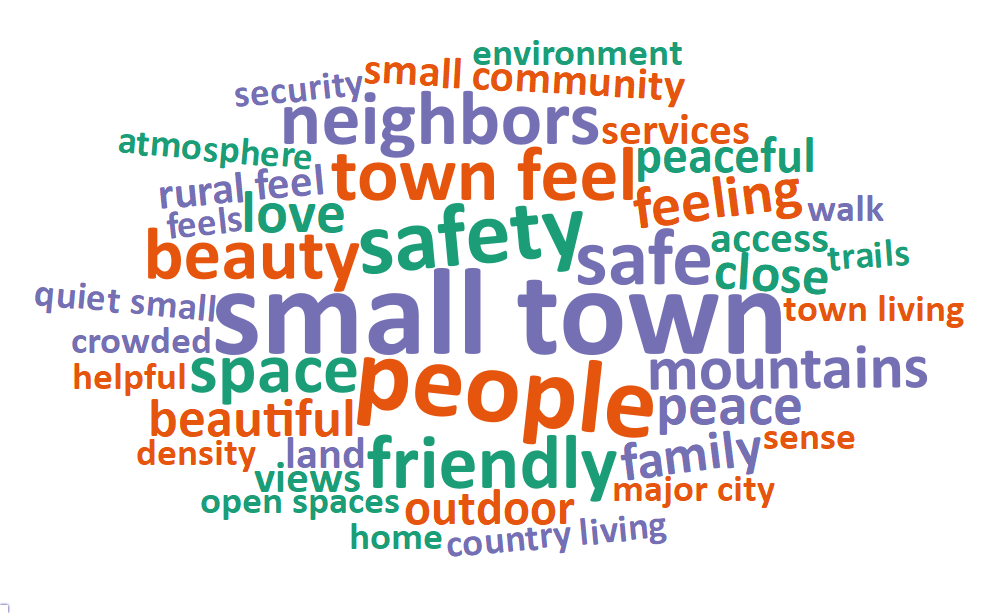
What Respondents Value Most in Wellsville
Survey respondents were asked to comment on what they value most about Wellsville. The most common words and phrases from all city comments are included in the word cloud below. It is possible that negative or unrelated words may appear since these words have been taken out of context, and they may not indicate the respondent’s intended meaning. Wellsville respondents expressed their value of the small-town atmosphere, sense of community, and the rural/country feel of Wellsville.
Local Environmental Quality in Wellsville
The 27% of respondents who rated the Local Environmental Quality domain as 1, 2, or 3 (Poor, Fair, or Moderate) were further asked if there are specific aspects of local environmental quality that they feel are problematic. Air quality and inversions were a common concern. Trash on sidewalks and upkeep of trails and streets were noted as well. Some additional comments emphasized the need for trails, better recycling systems, and water quality issues.
Improving Wellbeing in Wellsville
Survey respondents were asked if there is anything that could be done to improve wellbeing in Wellsville. There was a strong demand for improved transportation infrastructure, including better road maintenance, increased public transit options, and the development of safe, accessible walking and biking paths. Wellsville respondents commented on concerns over rapid housing expansions and advocate for slow/controlled growth to ensure the community’s charm and infrastructure aren’t overwhelmed.
Additional Comments
Respondents were also asked if they had any additional comments on wellbeing in Wellsville. Wellsville respondents largely indicated that they love where they live as well as the small-town atmosphere. There were many comments expressing their desire to keep their community small.