West Valley City Wellbeing Survey Findings 2024
By Dr. Courtney Flint and Team
![]()
Contact Information
Dr. Courtney Flint
courtney.flint@usu.edu
435-797-8635
Summary
West Valley City is one of 51 cities participating in the Utah Wellbeing Survey Project in 2024. This project is designed to assess the wellbeing and local perspectives of city residents and to provide information to city leaders to inform general planning processes. Additional analysis is underway and this report may be updated over time.
We are grateful to all those who took the survey and to our city partners who helped to make this possible. We are grateful to a number of entities for funding: the Utah League of Cities and Towns, USU Extension, USU’s Institute for Land Water and Air, the Wasatch Front Regional Council, Utah Department of Transportation, the Utah Agricultural Experiment Station, and the cities of Alpine, Cedar Hills, Draper, Millcreek, Nephi, North Salt Lake, Ogden, Orem, Pleasant Grove, Providence, Springdale, Tremonton, West Bountiful, and West Valley City.
This report describes findings from the 2024 West Valley City survey and comparative information with other project cities. In April and May 2024, West Valley City advertised the survey for residents largely through posters, social media, and utility bills. All city residents age 18+ were encouraged to take the online Qualtrics survey.
How many people responded?
- 149 viable surveys were recorded in this 2024 survey effort.
- The adult population of West Valley City was estimated at 95,544, based on the American Community Survey by the U.S. Census. The 149 survey responses in 2024 represent 0.2% of the adult population and have a conservative margin of error of 8.02%.
Survey Respondent Characteristics
| Resident Statistics | |
|---|---|
| Full Time Residents of West Valley City | 97.3% |
| Part Time Residents of West Valley City | 2.7% |
| Length of Residency — Range | 0.3-69 years |
| Length of Residency — Average | 20.8 years |
| Length of Residency — Median | 19.5 years |
| Length of Residency 5 Years or less | 16.2% |
| ZIP Code | Percent |
|---|---|
| 84118 | 2.0% |
| 84119 | 20.8% |
| 84120 | 43.0% |
| 84128 | 30.2% |
| Other | 4.0% |
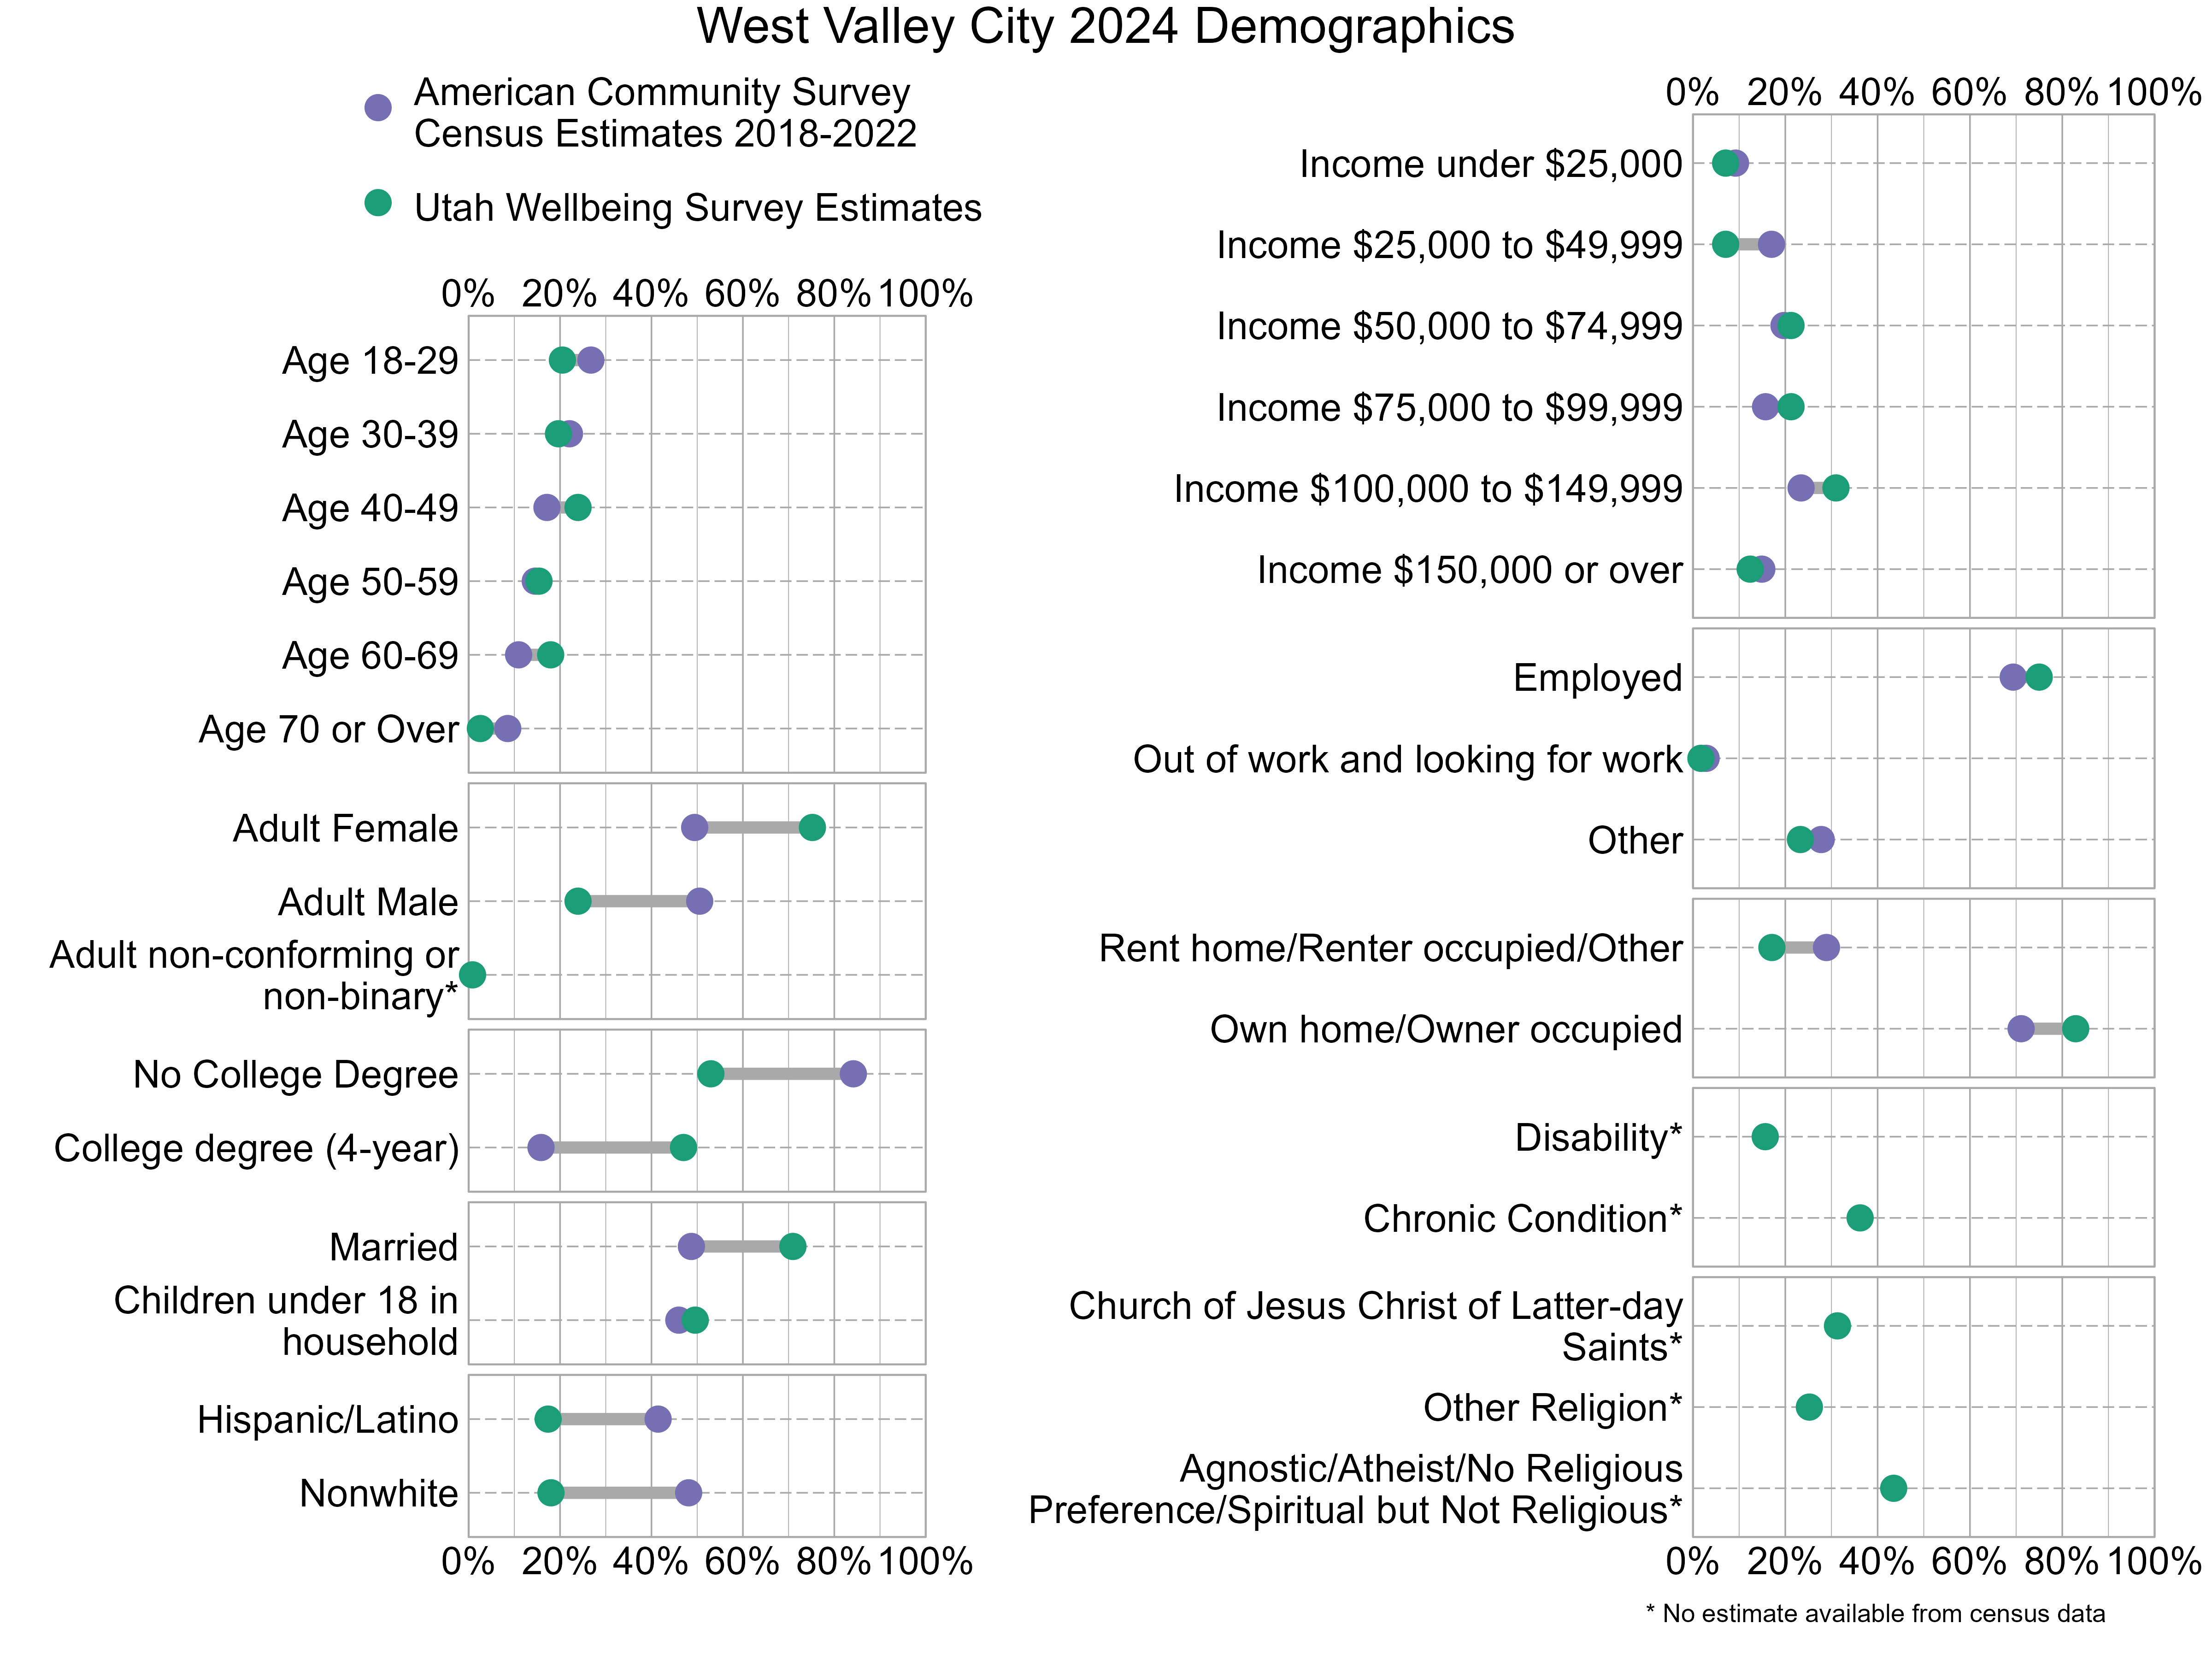
Demographic characteristics of the survey respondents were compared below with U.S. Census information from the 2018-2022 American Community Survey. In the graph below, gray bars indicate differences between the American Community Survey estimates and the Utah Wellbeing Project surveys. The wider the gray bars, the larger the differences. Also note that estimates for religious affiliation, adult non-conforming or non-binary gender, disability, and chronic conditions are unavailable from the census data. There can also be a variable margin of error in the American Community Survey estimates, and caution should be used when comparing estimates. Not all respondents provided demographic information. As the graph shows, 2024 survey respondents were not fully representative of West Valley City. People who are adult females, have at least a 4-year college degree, and are married were overrepresented while those who are adult males, do not have a college degree, are Hispanic or Latino, and are nonwhite were underrepresented.
Overall Personal Wellbeing and Overall Wellbeing in West Valley City
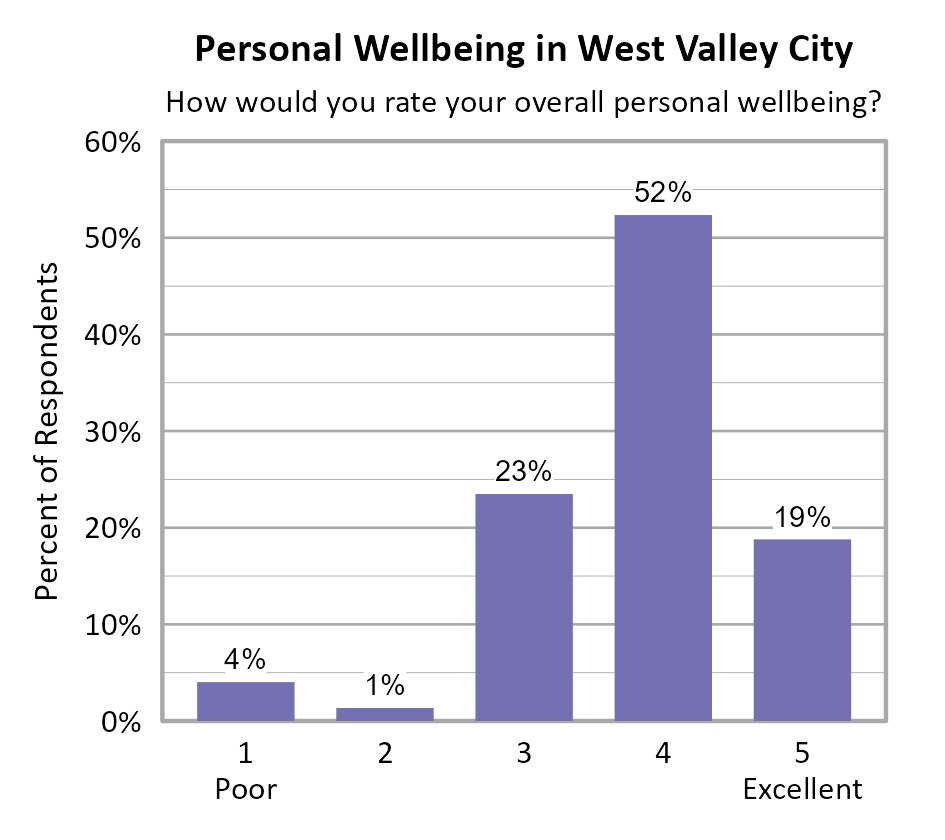
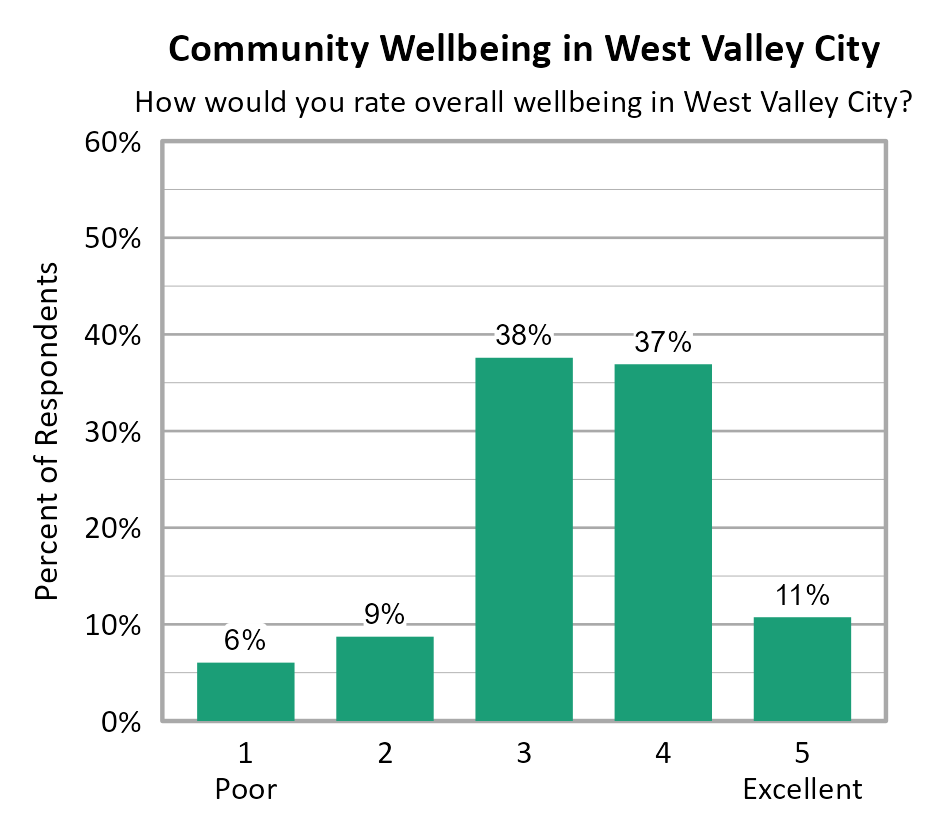
Survey participants were asked about their overall personal wellbeing and overall community wellbeing in West Valley City. These wellbeing indicators were both measured on a 5-point scale from poor (1) to excellent (5). The average personal wellbeing score in West Valley City was 3.81 with 71% of respondents indicating their wellbeing at a 4 or 5 on the 5-point scale. The average score for community wellbeing in West Valley City was 3.38 with 48% of respondents indicating community wellbeing at a 4 or 5 on the 5-point scale. While ZIP code 84128 had slightly higher overall personal and community wellbeing scores than ZIP codes 84119 and 84120, these differences were not statistically significant.
Comparing Wellbeing Across Utah Cities
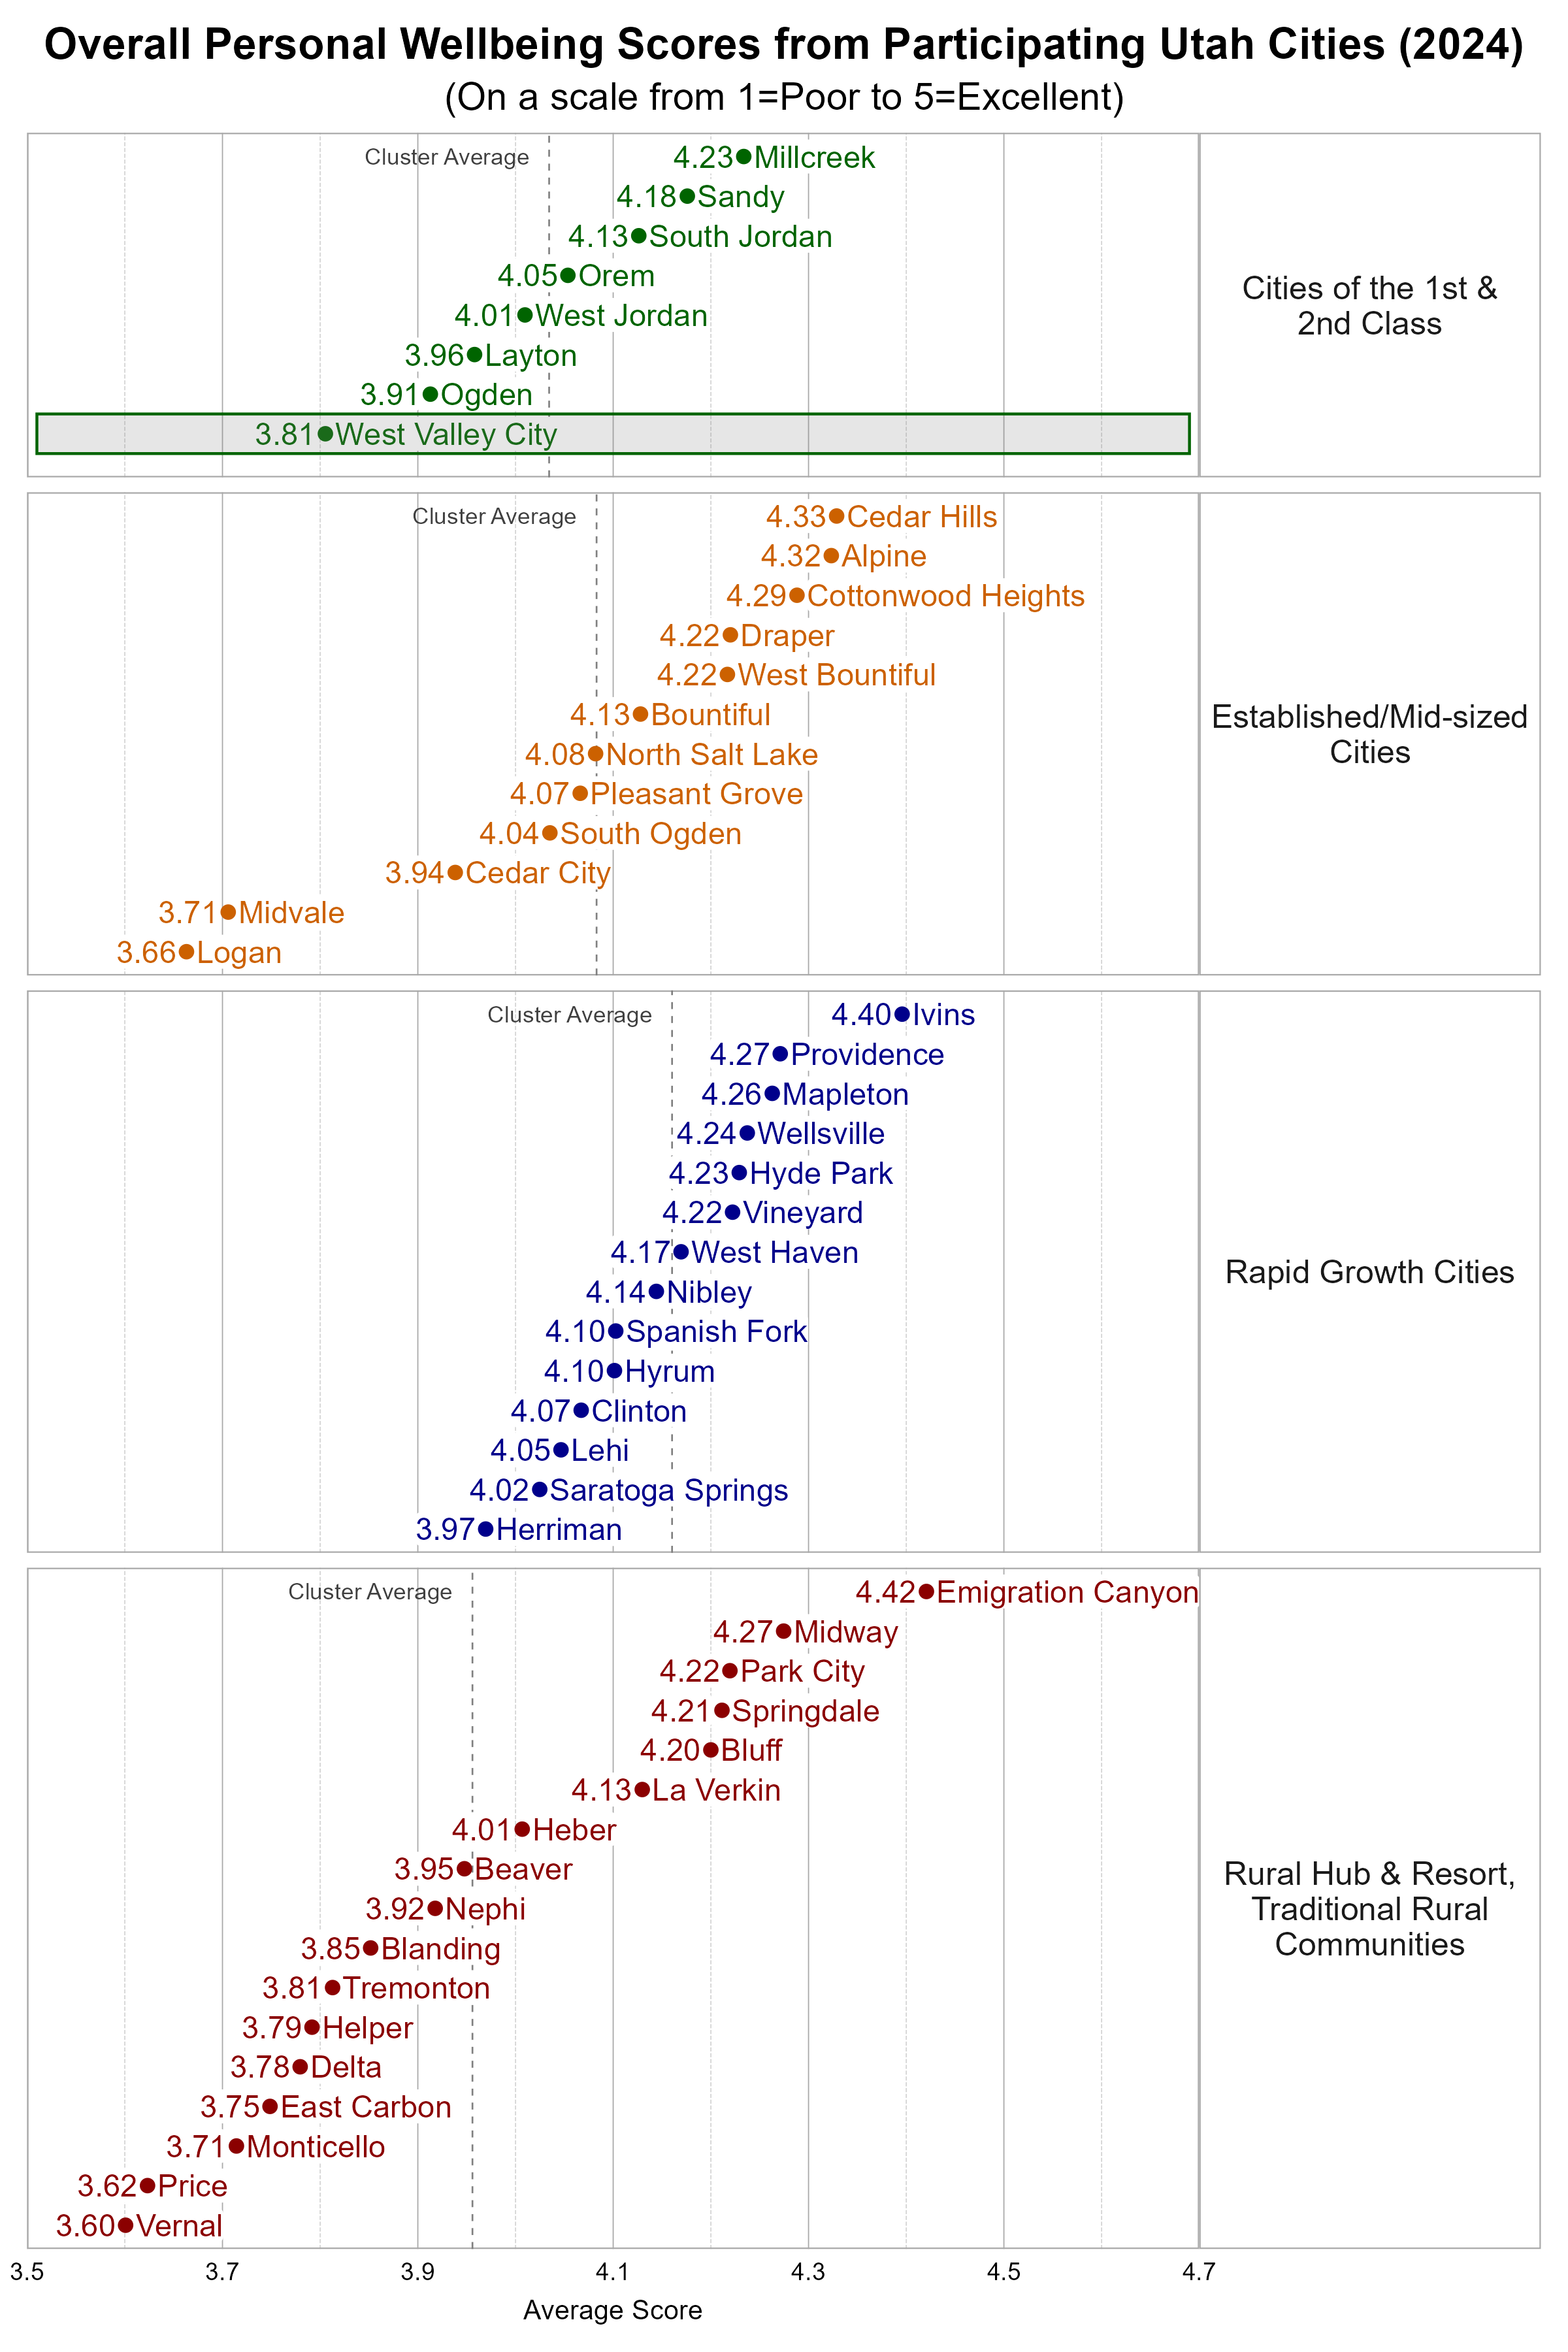
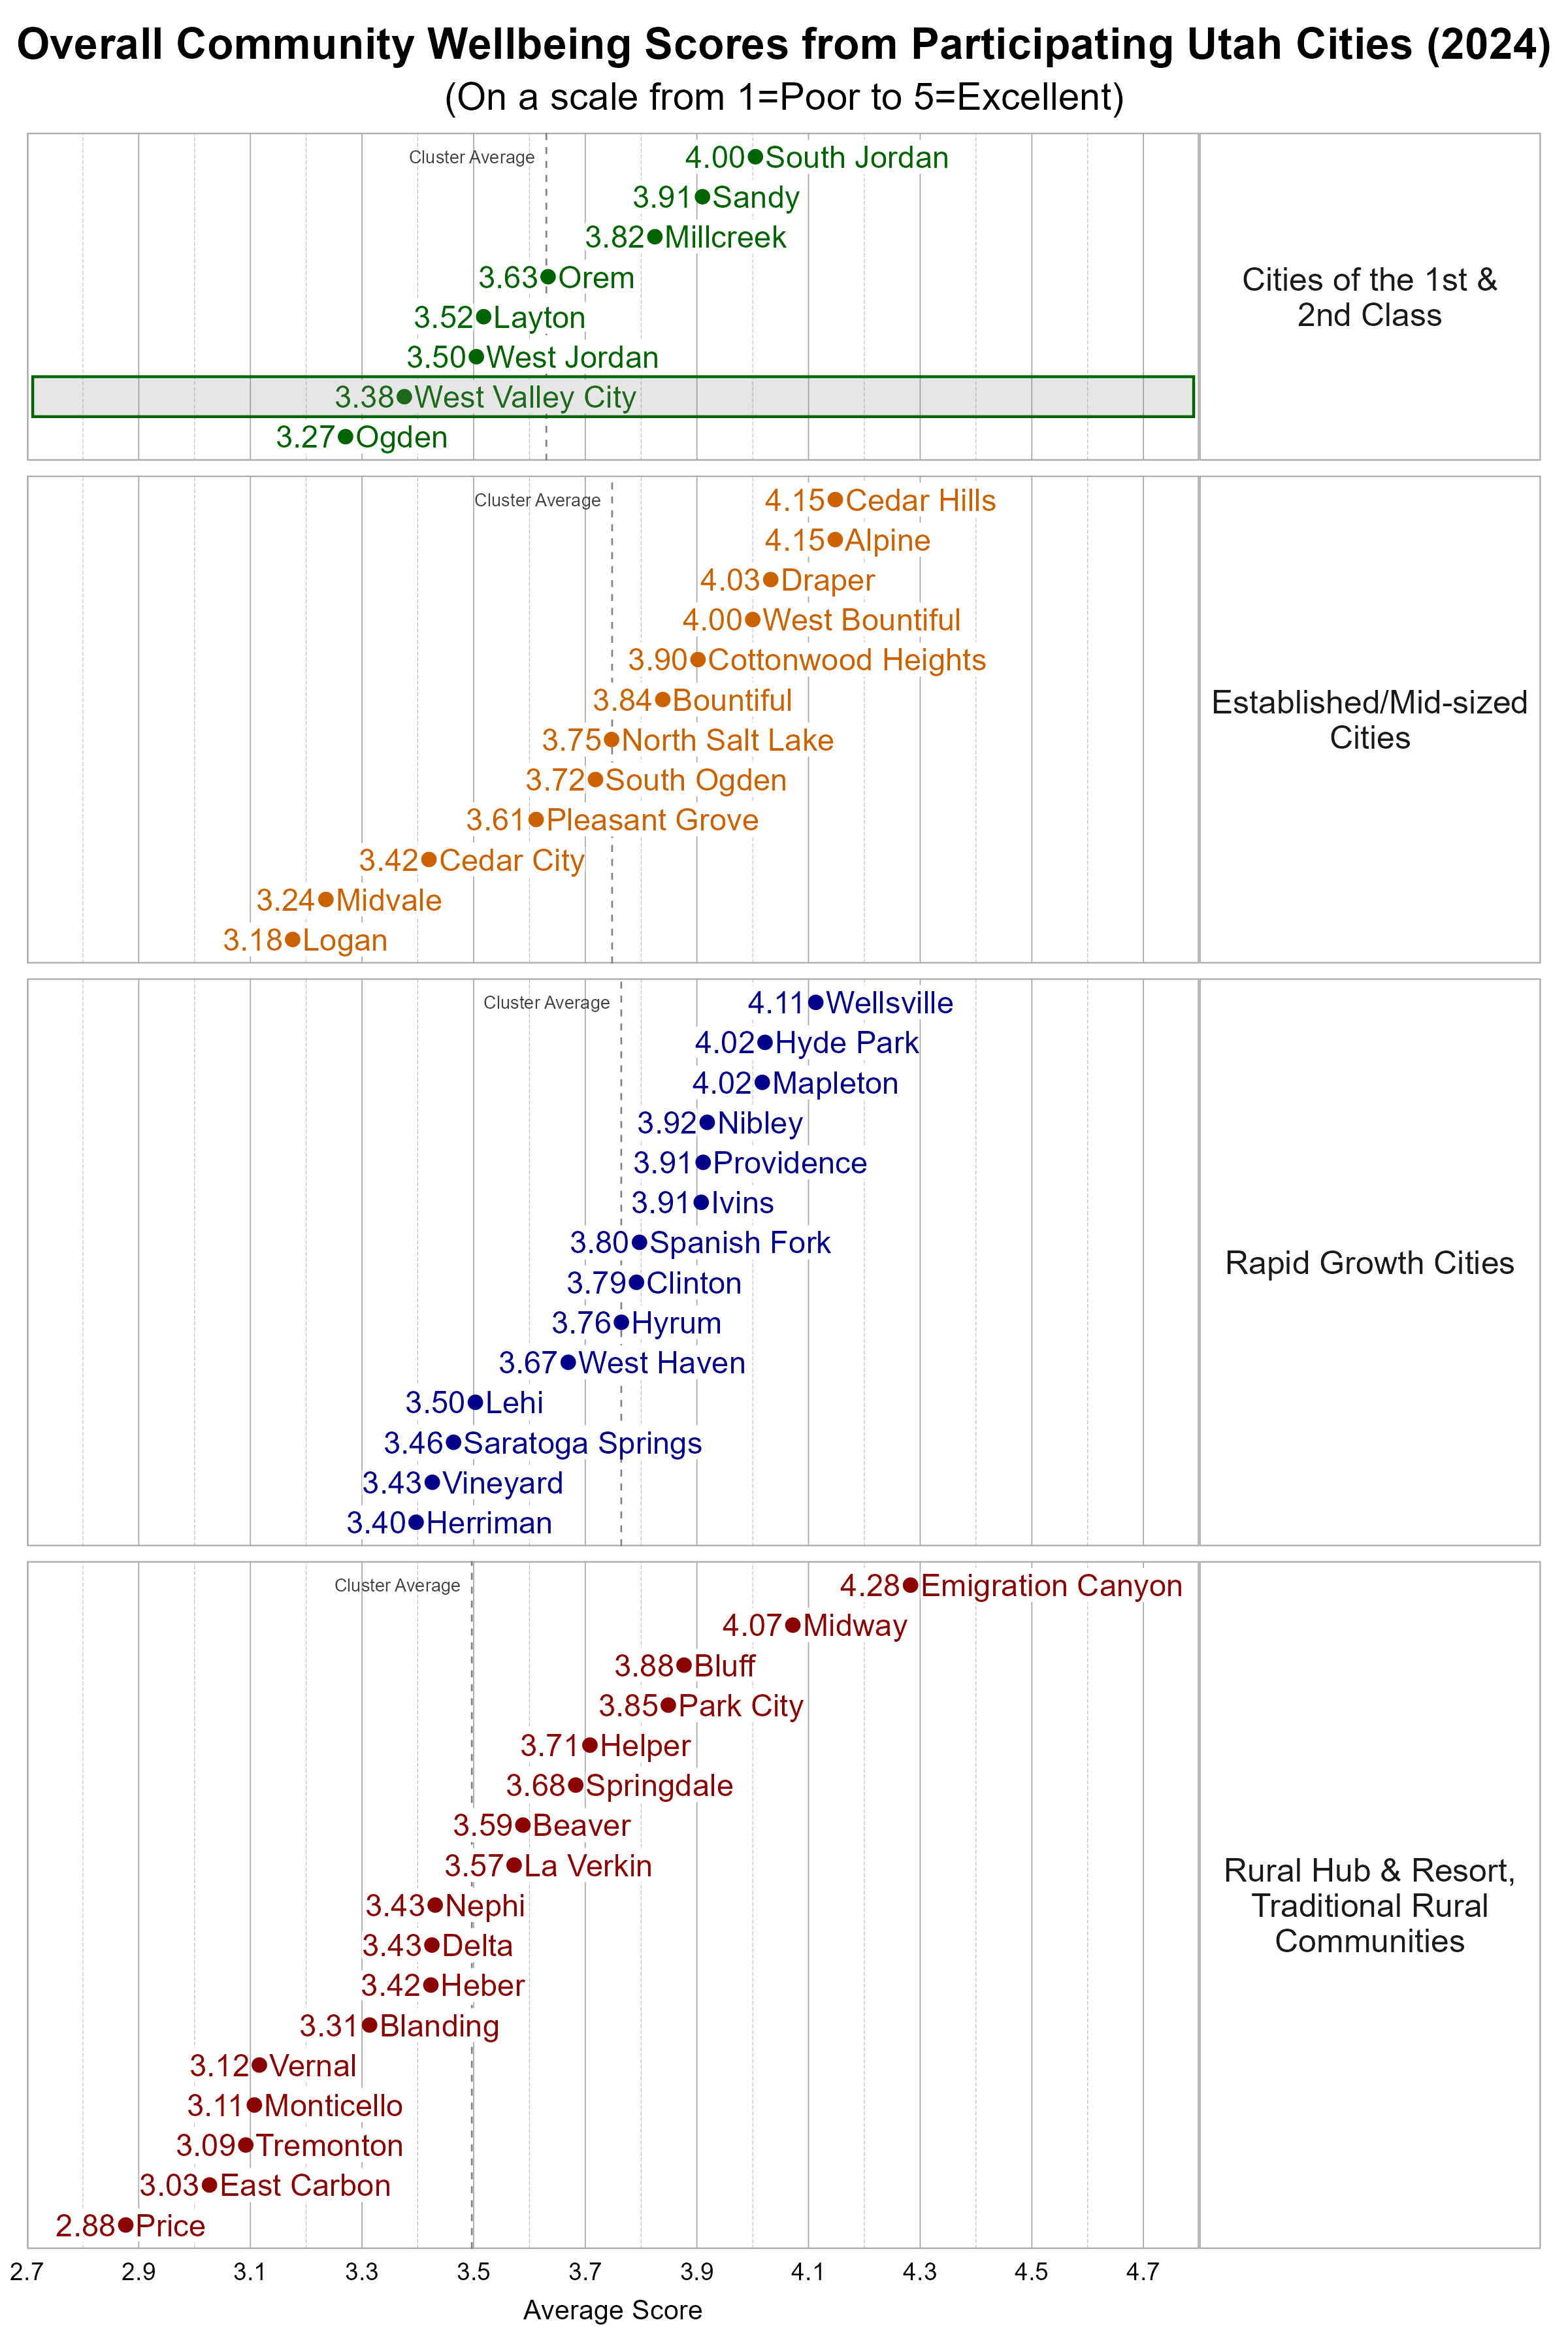
The Utah League of Cities and Towns clusters cities and towns into five different categories based on size and growth rates. We utilize these clusters in our analysis. West Valley City is classified as a City of the 1st and 2nd Class. Some cities may fit within more than one cluster.
Within the more Urban city cluster, West Valley City was below the average overall personal wellbeing score and below the average overall community wellbeing score.
Wellbeing Domains in West Valley City
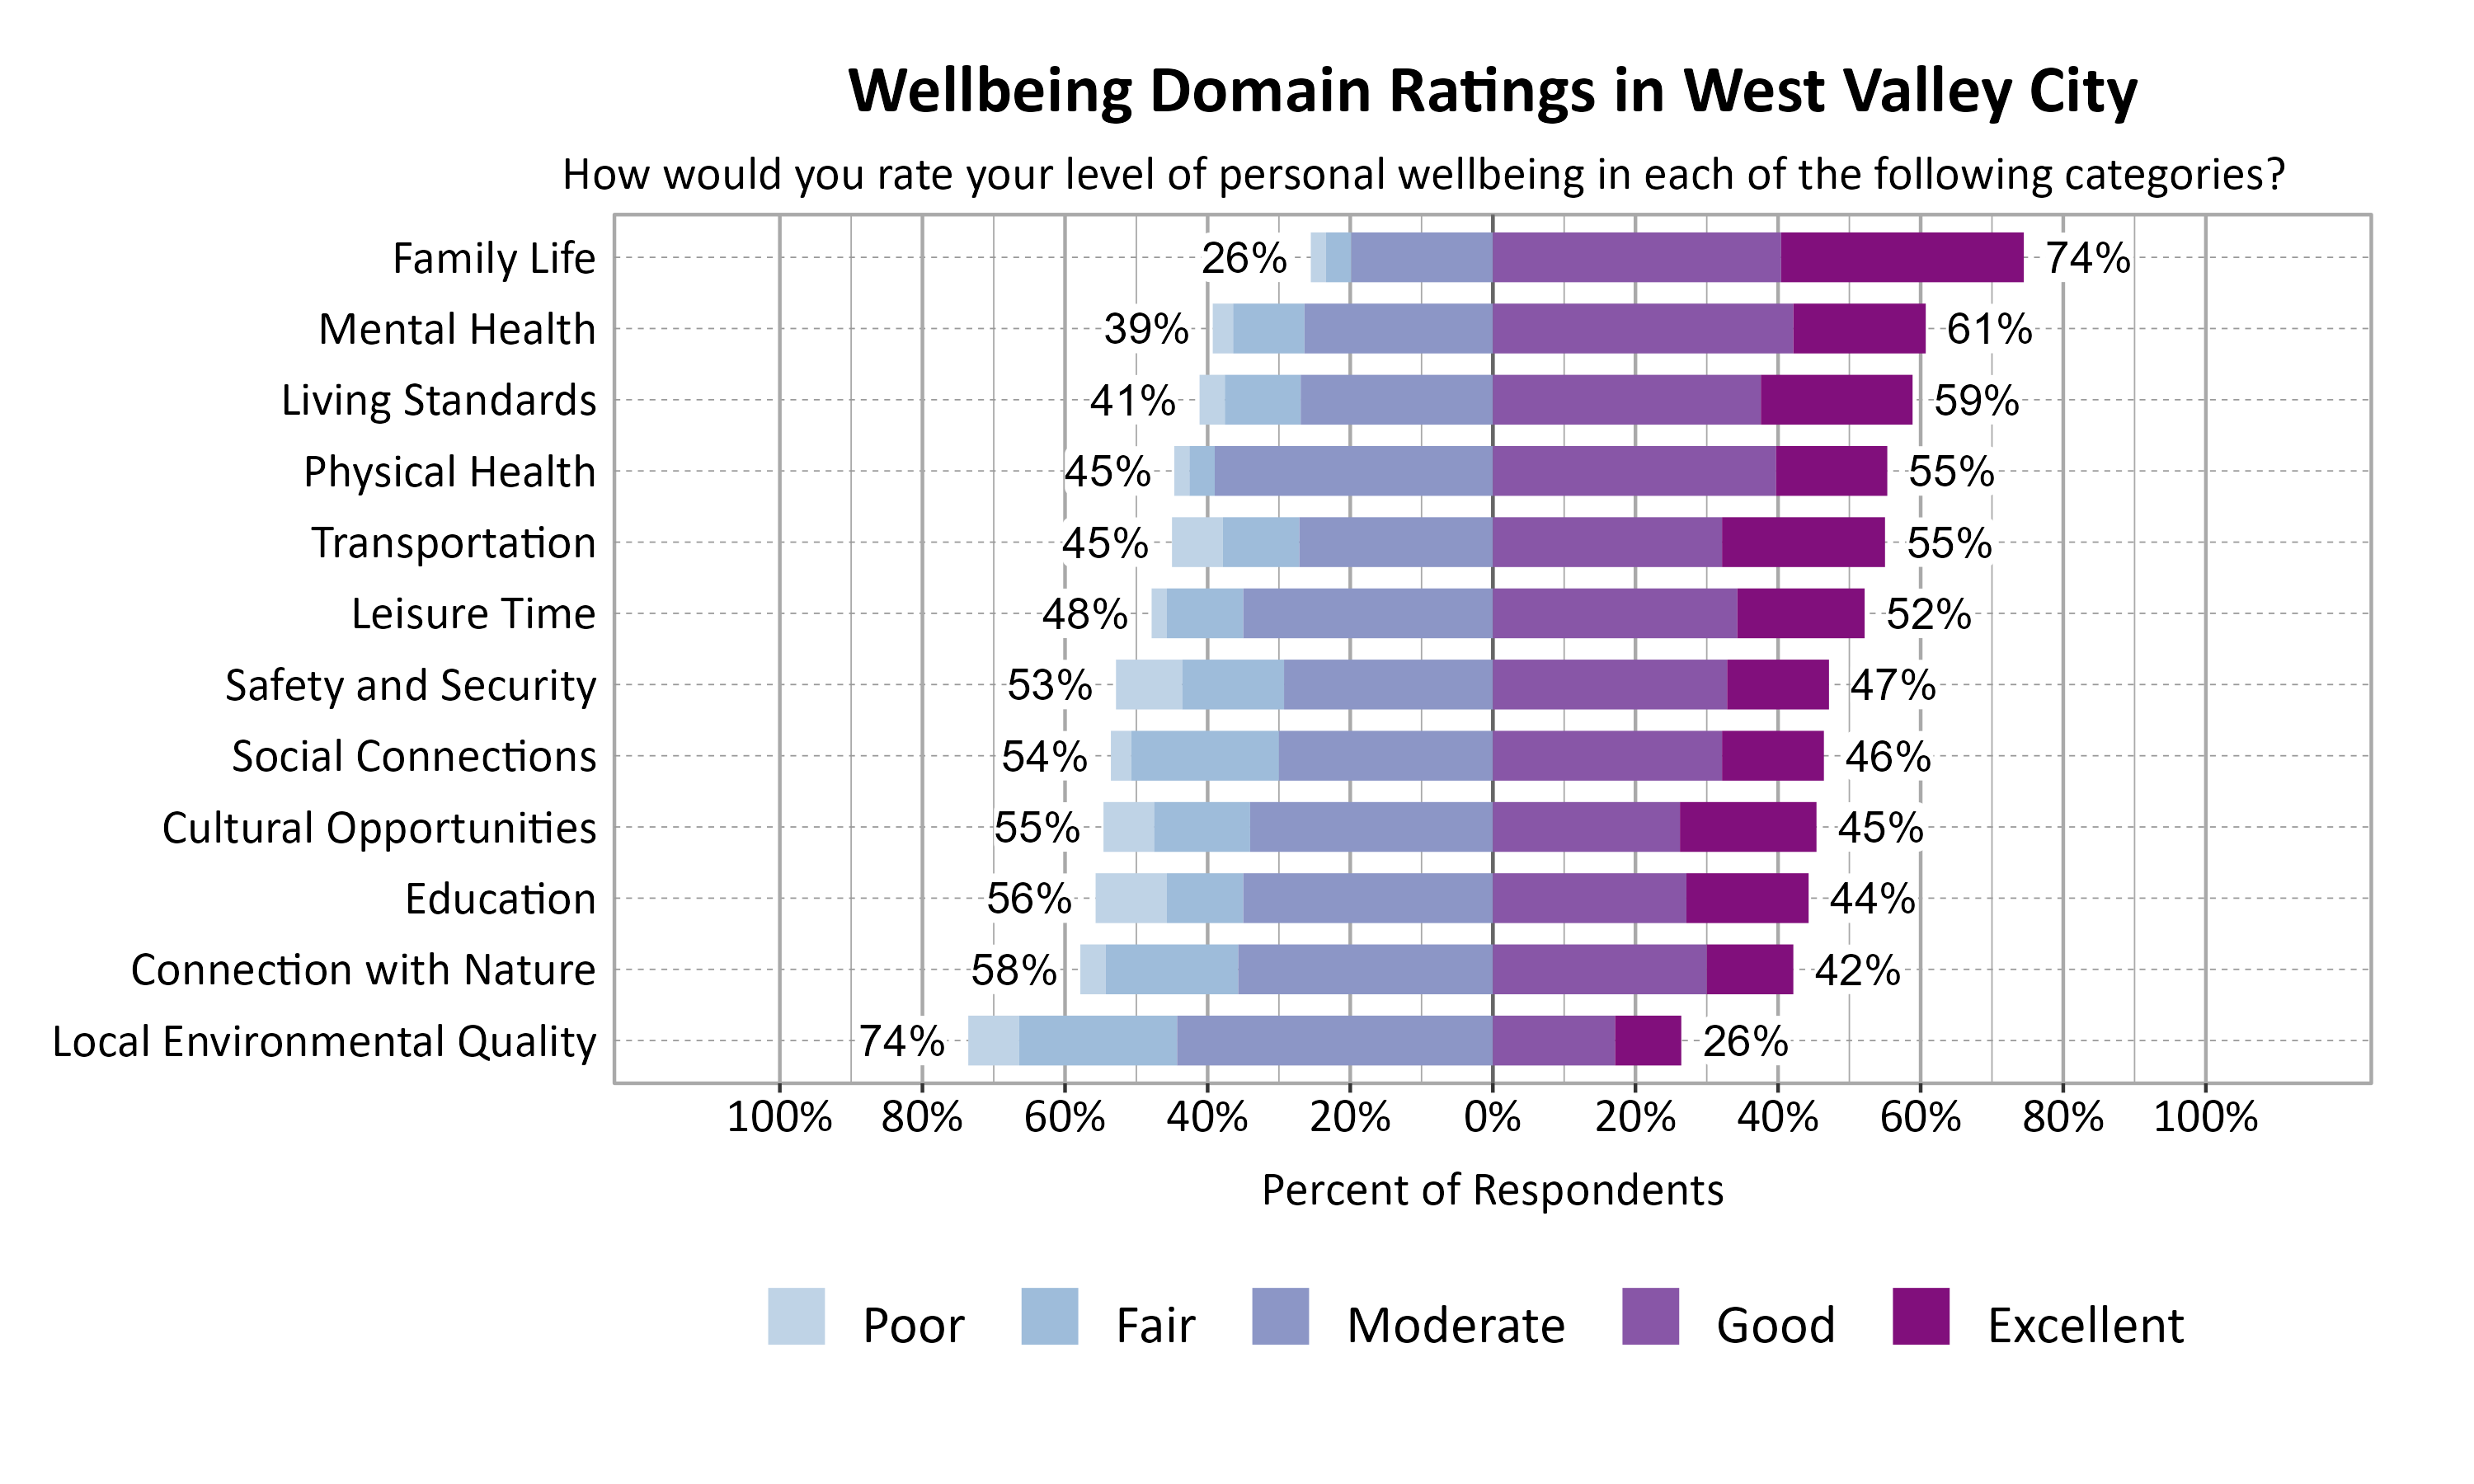
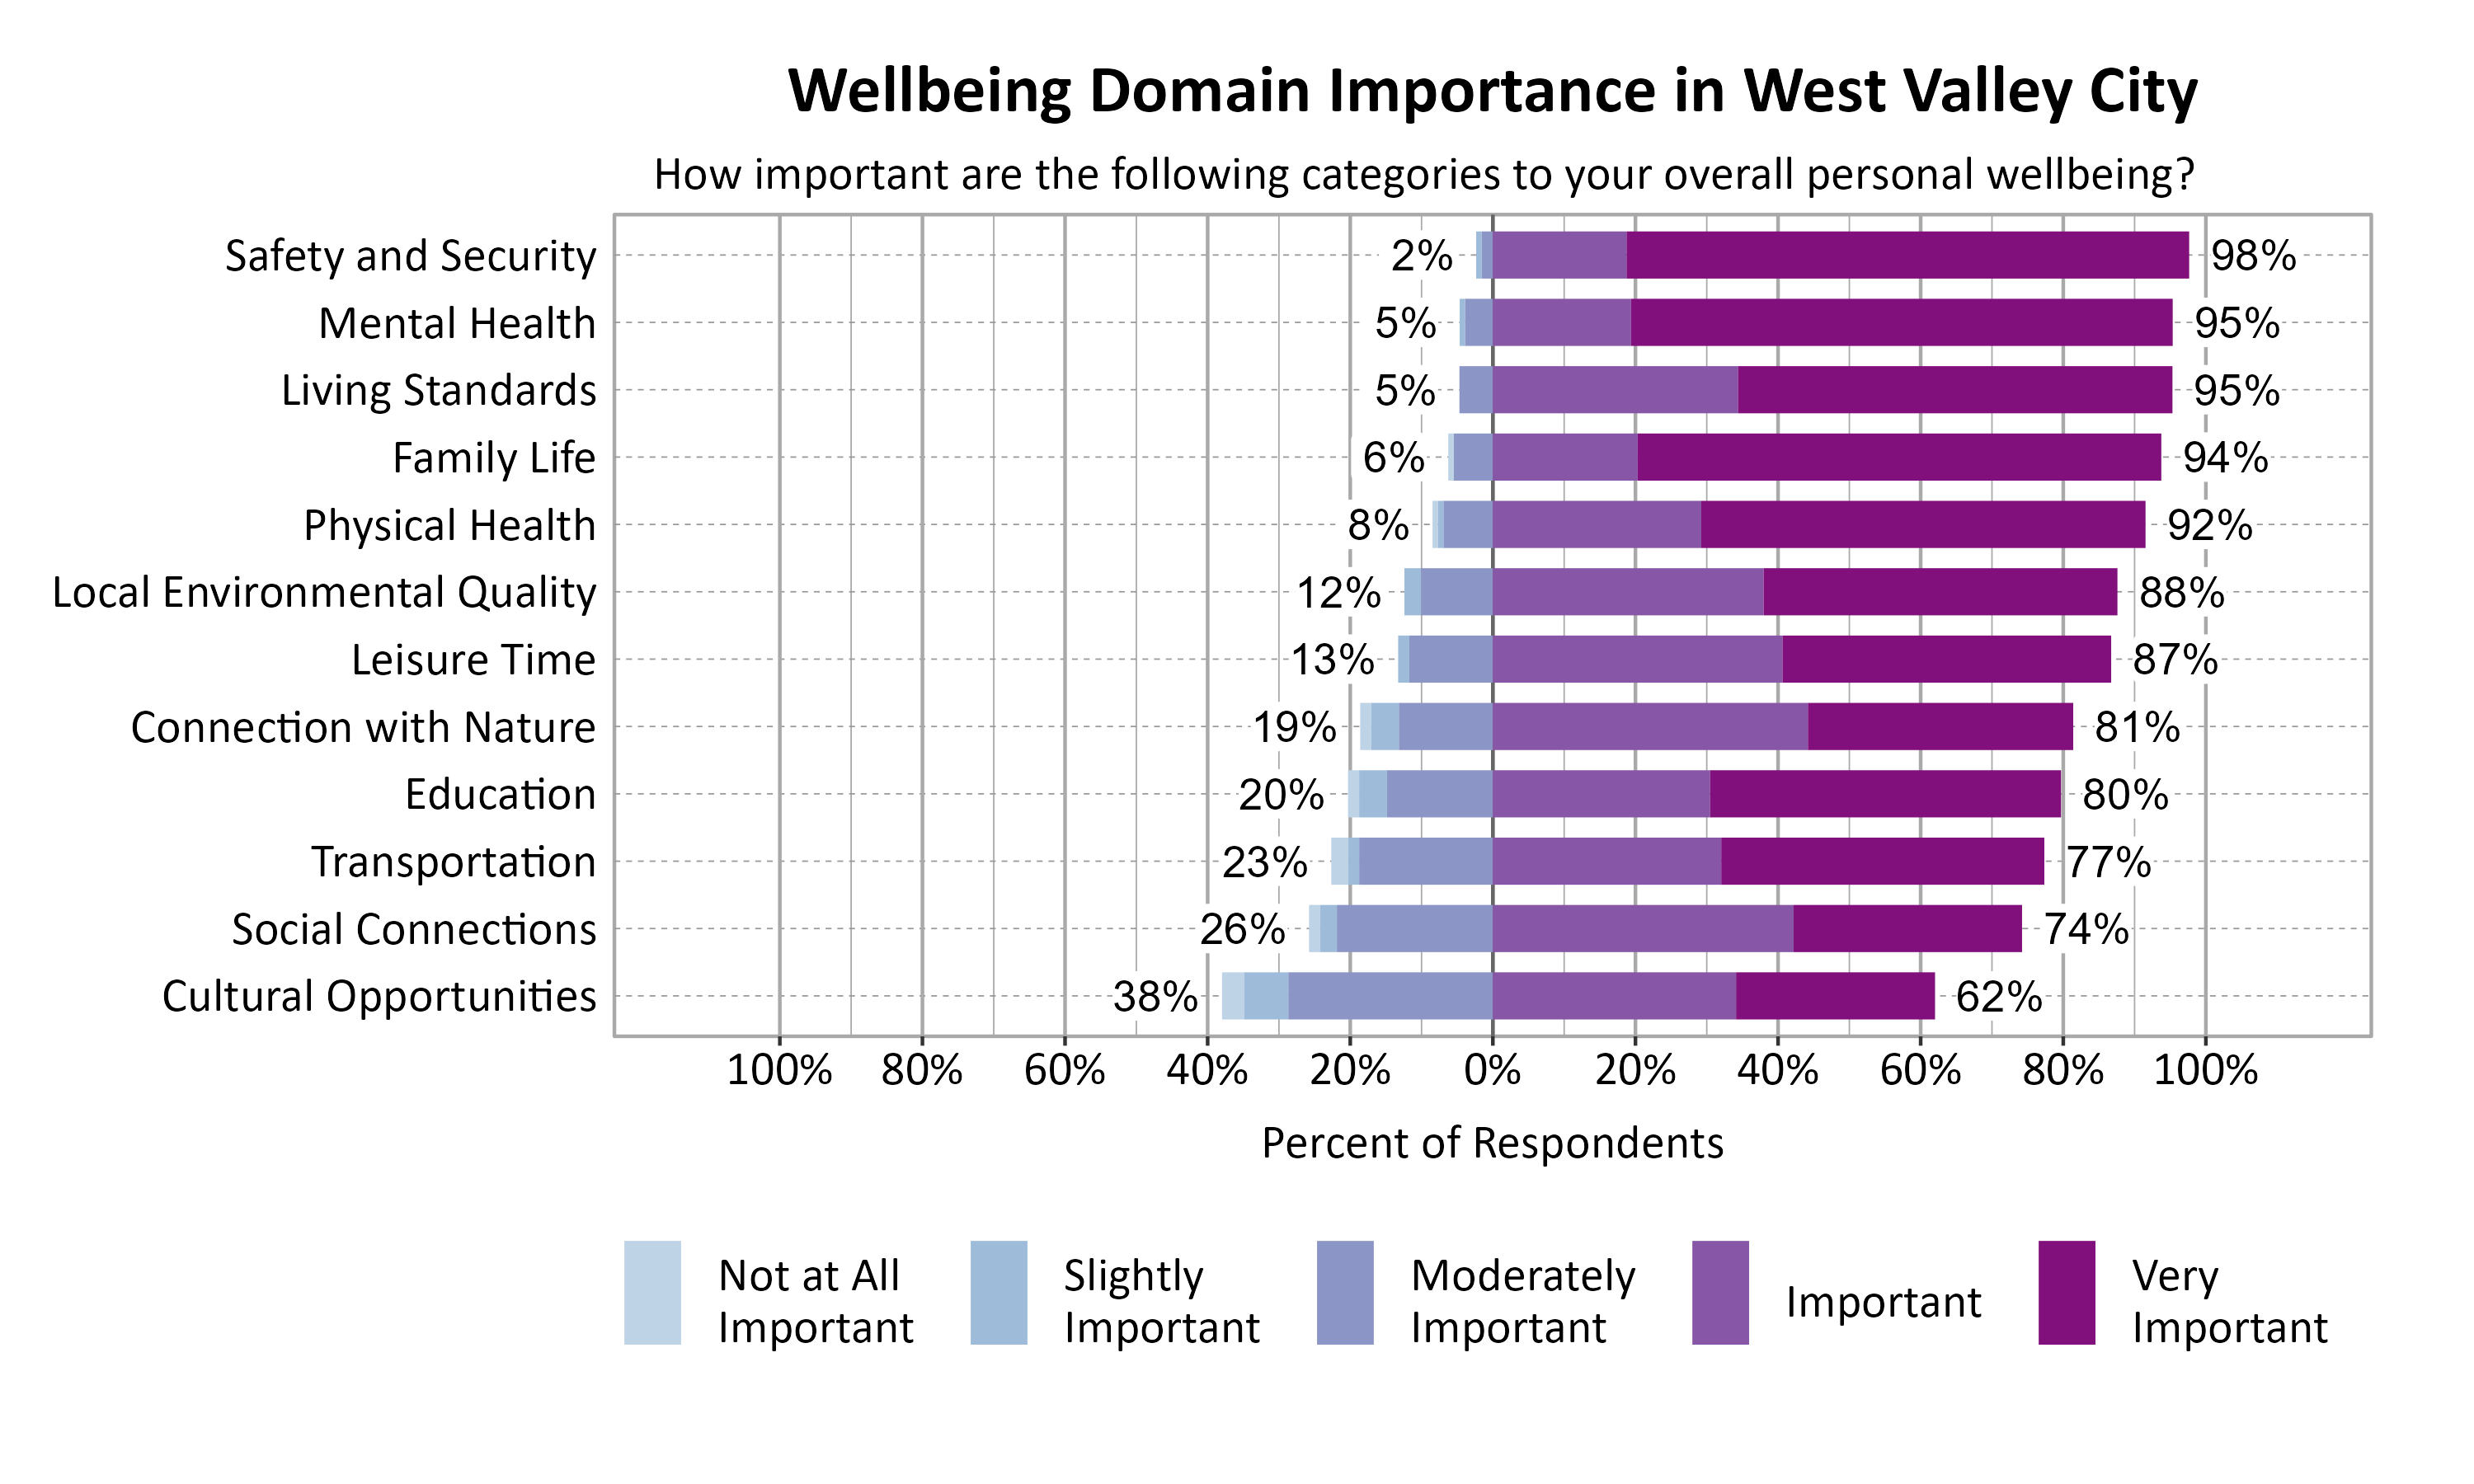
According to national and international entities that track wellbeing, there are a number of common dimensions or domains of wellbeing. Survey respondents rated twelve domains on a 5-point scale from poor to excellent. They were also asked to indicate the importance of each domain to their overall personal wellbeing on a 5-point scale from not at all important to very important. The highest rated wellbeing domains for respondents in West Valley City were Family Life (74%), Mental Health (61%), and Living Standards (59%). The most important wellbeing domains were Safety and Security (98%), Mental Health (95%), Living Standards (95%), and Family Life (94%).
Wellbeing Matrix for West Valley City
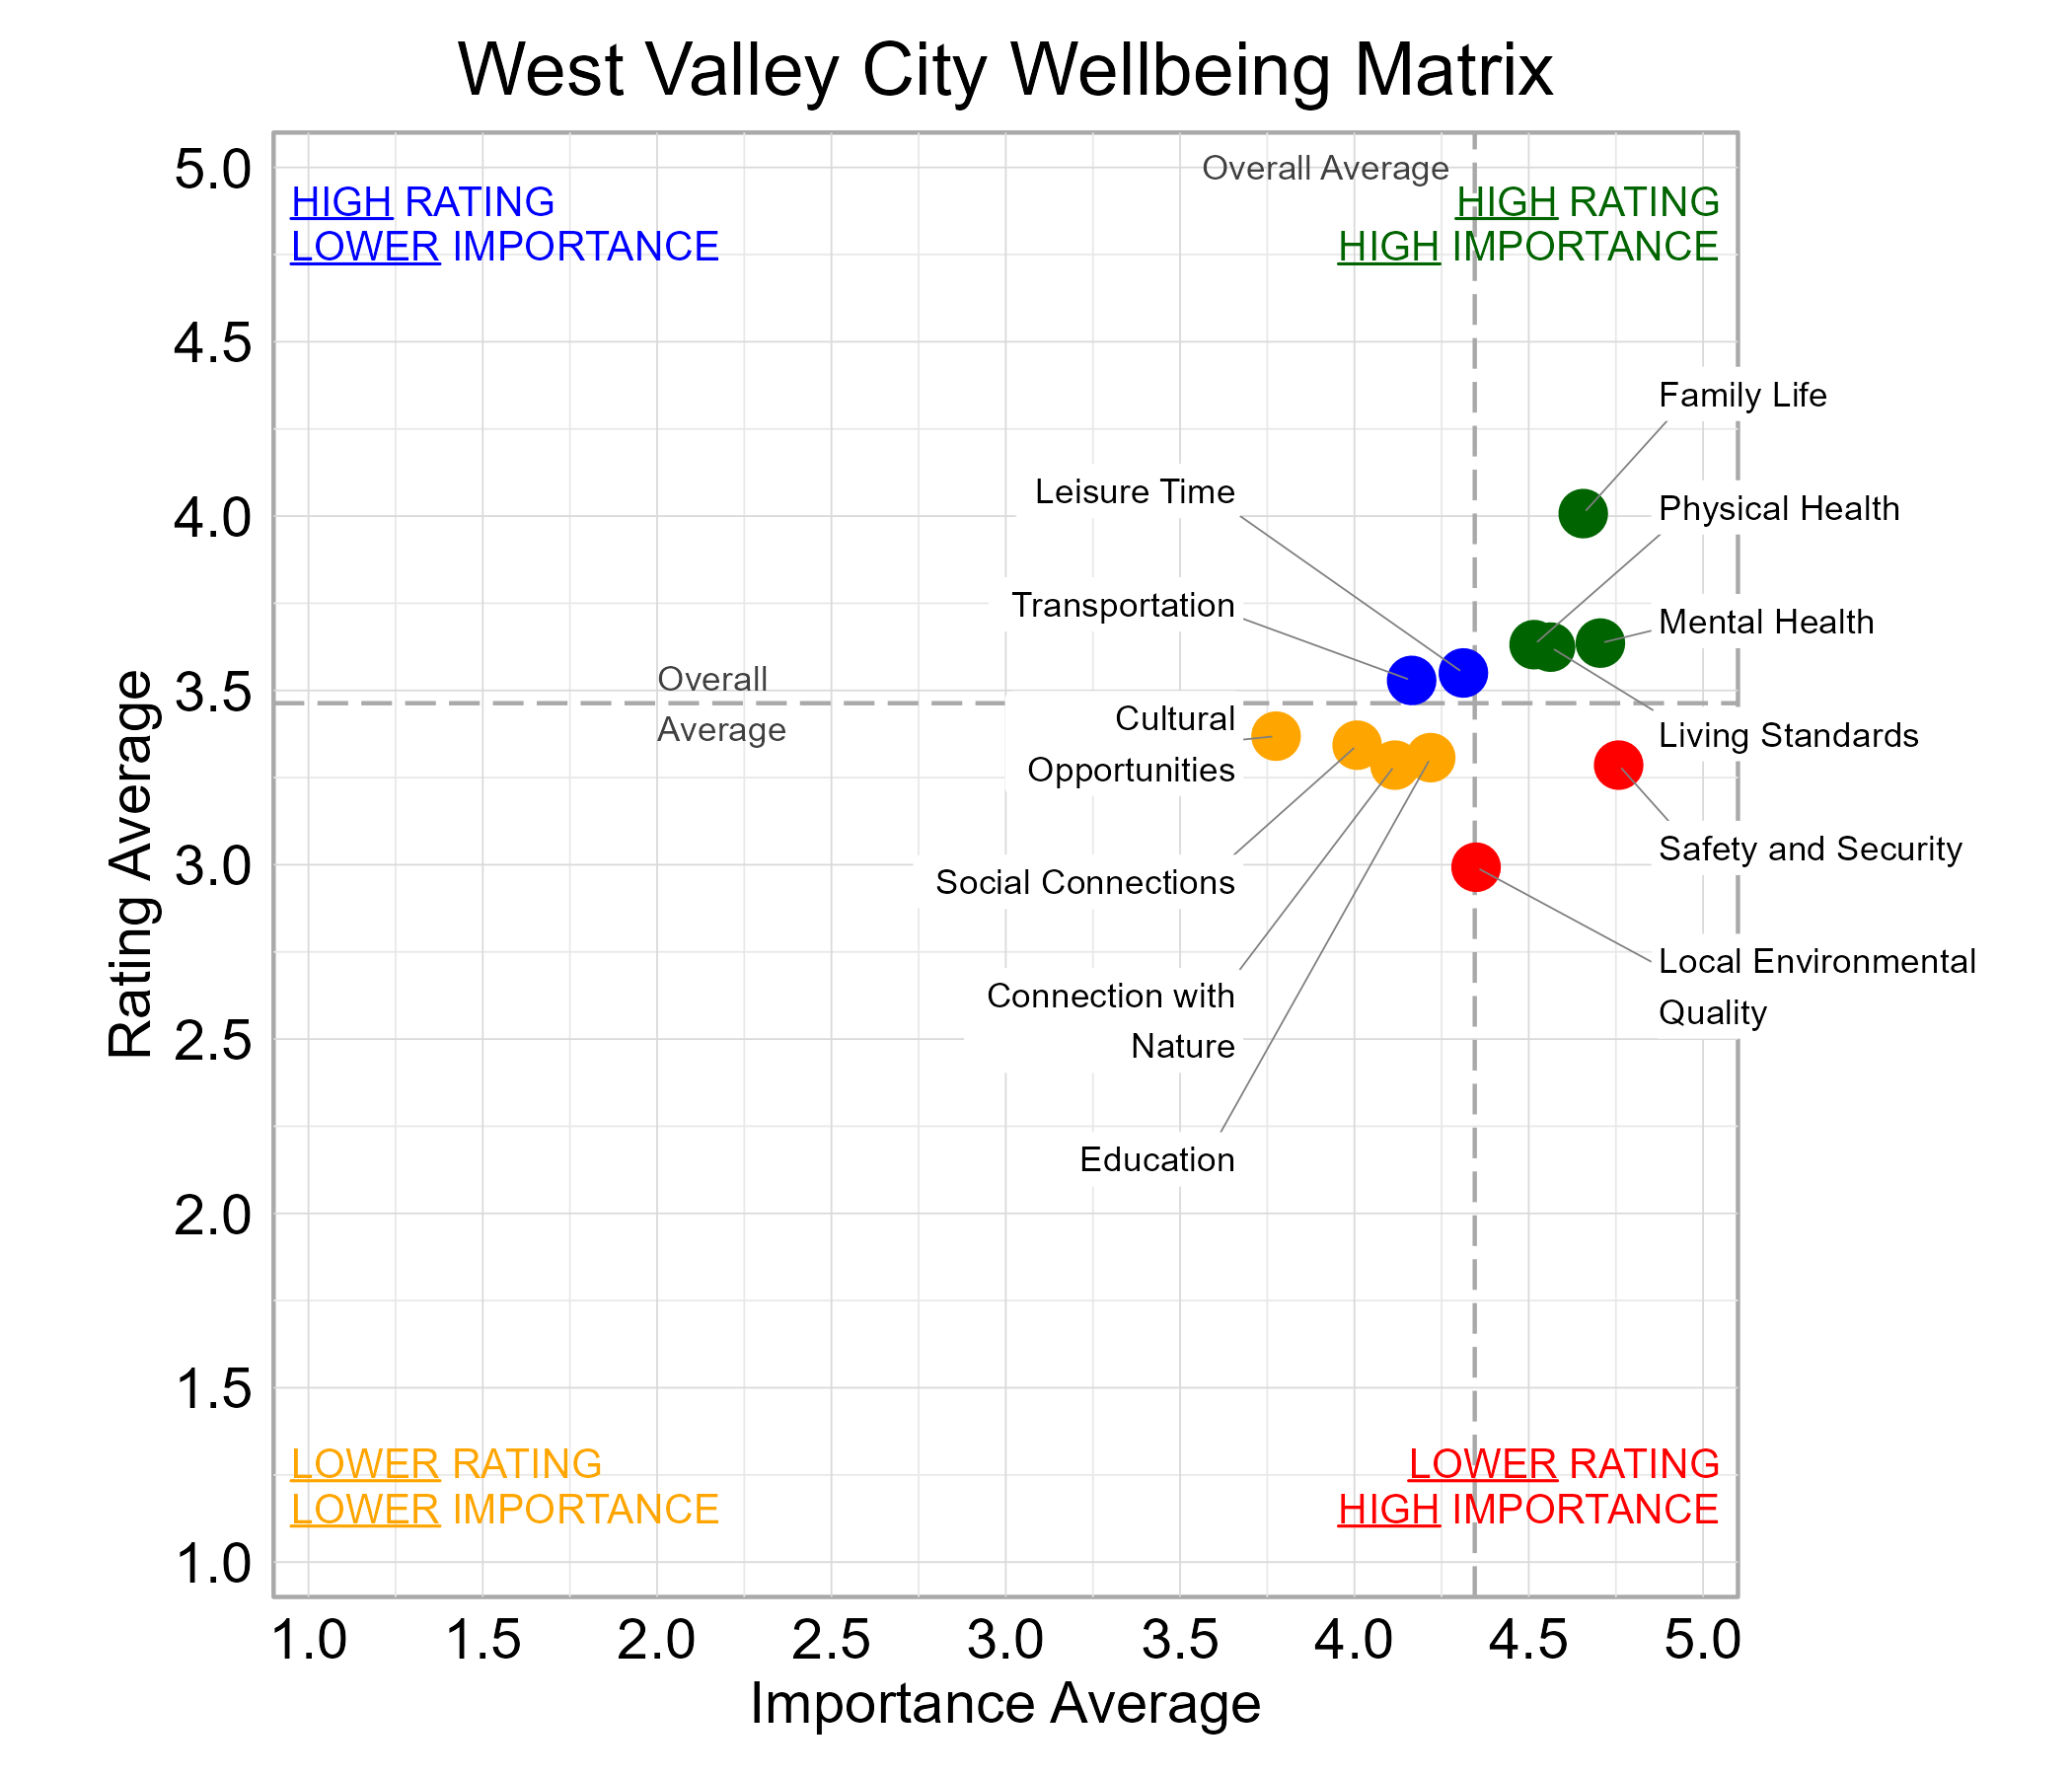
The graph below illustrates the relationship between the average rating and the average importance of wellbeing domains for survey respondents from West Valley City. Family Life, Living Standards, Mental Health, and Physical Health were highly important and rated above average among the domains. Local Environmental Quality and Safety and Security fell in the “red zone” of higher importance and lower ratings.
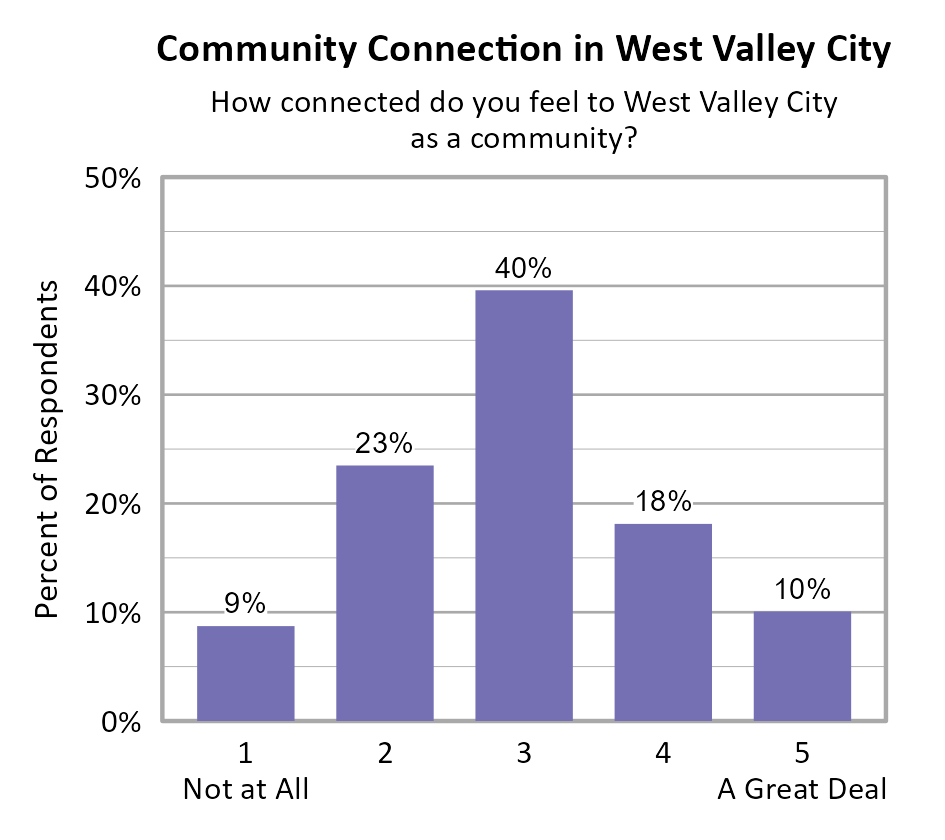
Community Connection in West Valley City
Survey participants were asked about how connected they feel to West Valley City on a 5-point scale from not at all (1) to a great deal (5), and the average score of all respondents was 2.97. While ZIP code 84119 had slightly lower community connection scores than ZIP codes 84128 and 84120, these differences were not statistically significant.
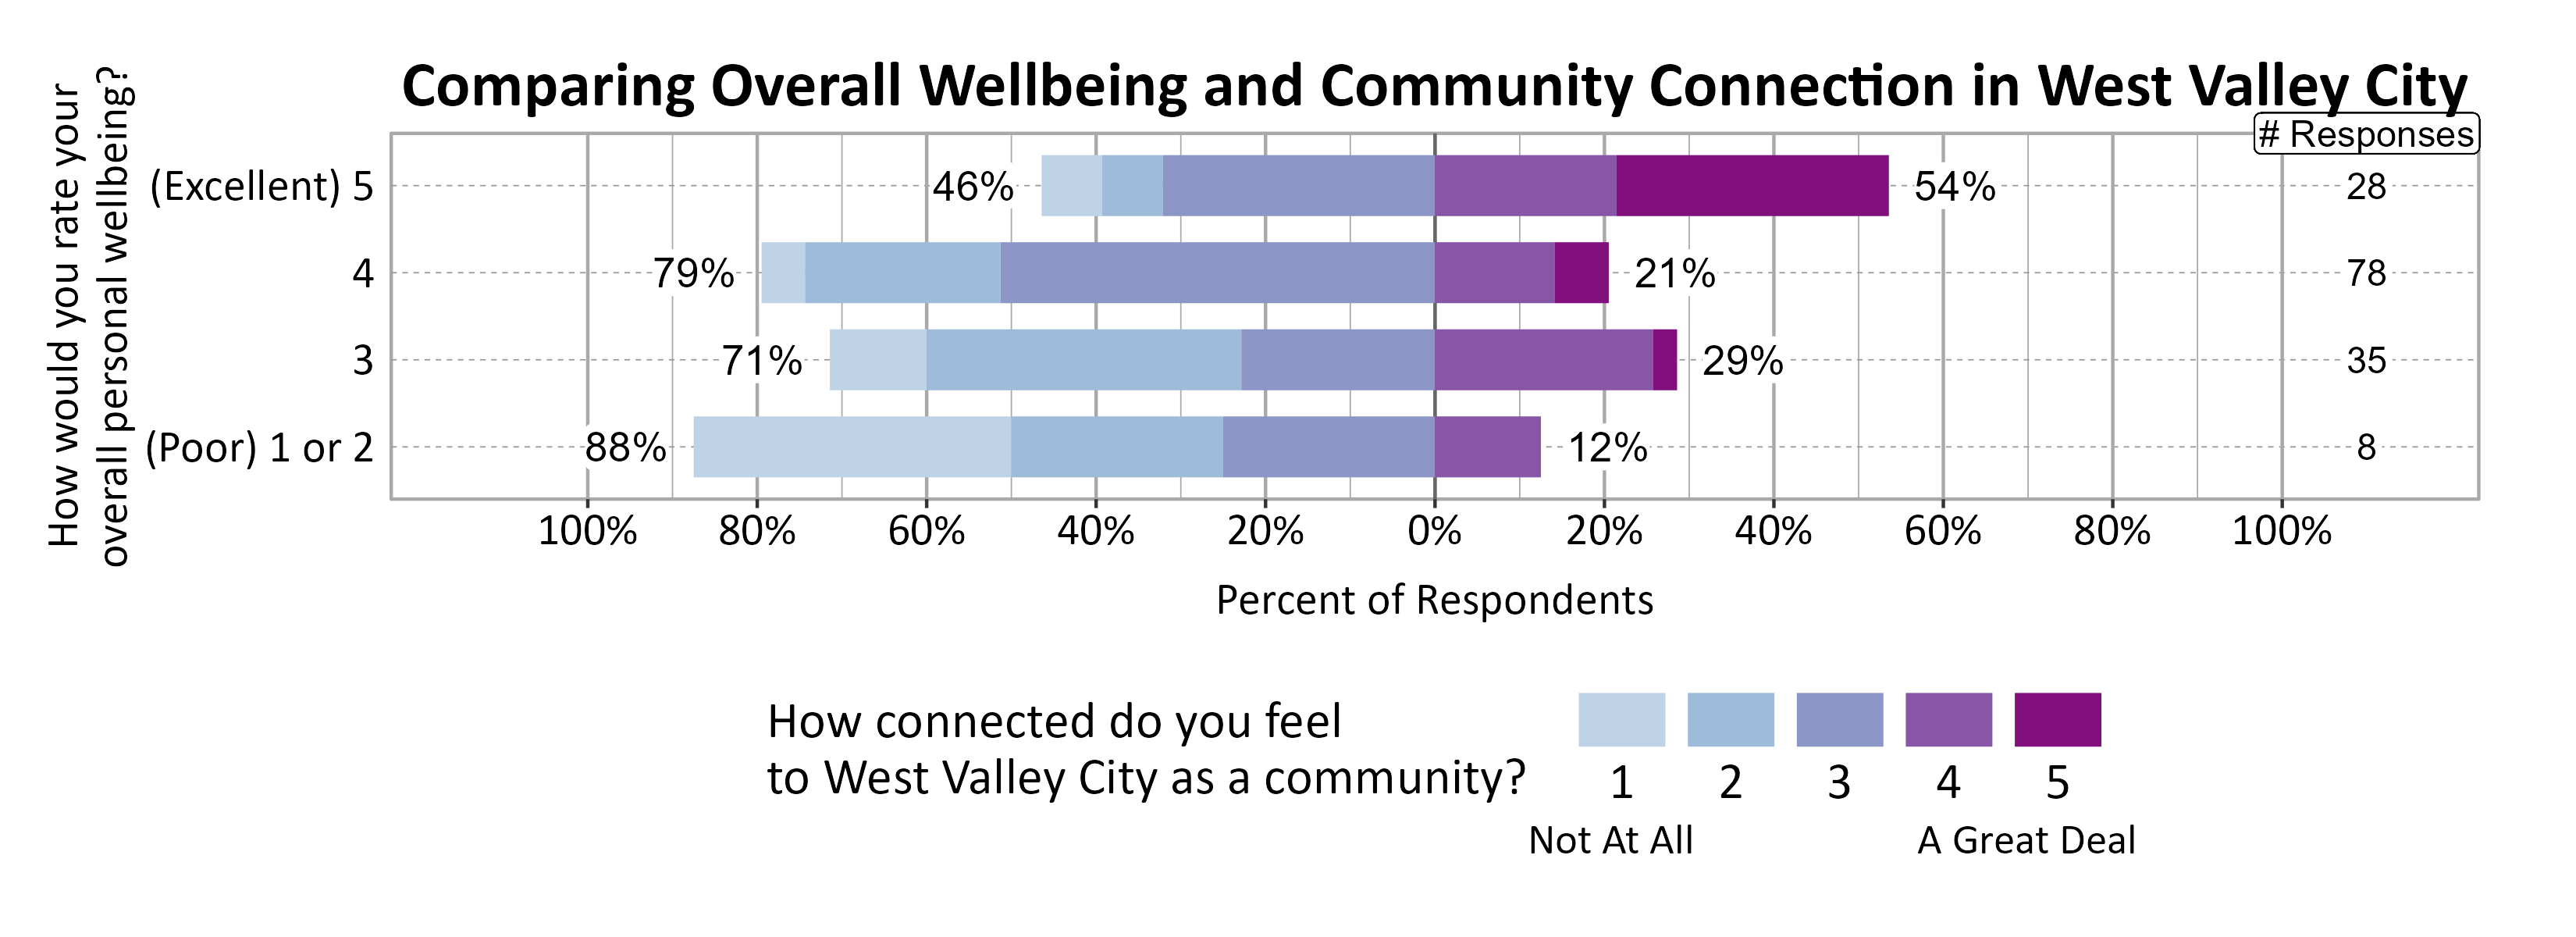
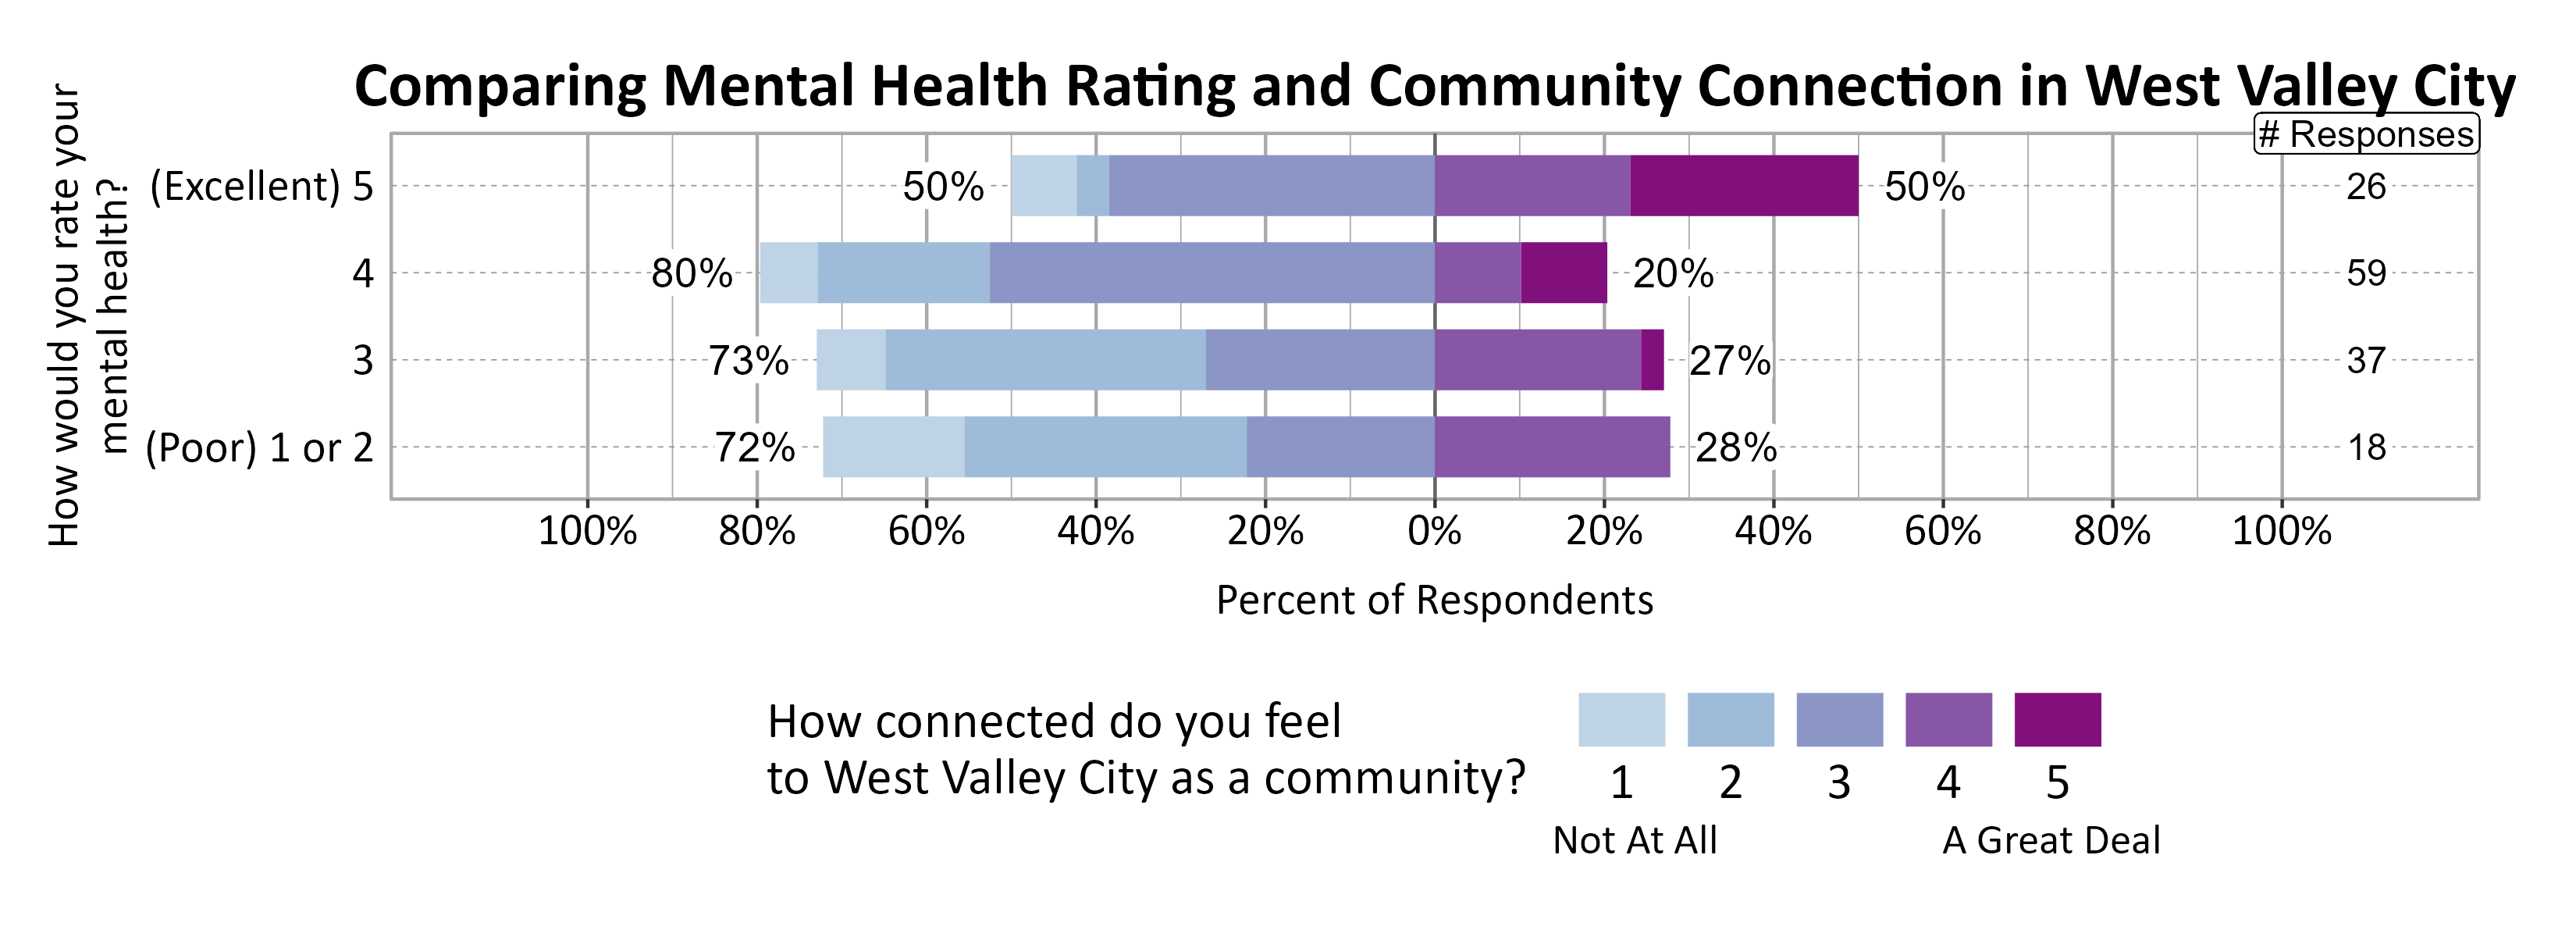
No clear relationship was found between individuals’ community connection and overall personal wellbeing or mental health.
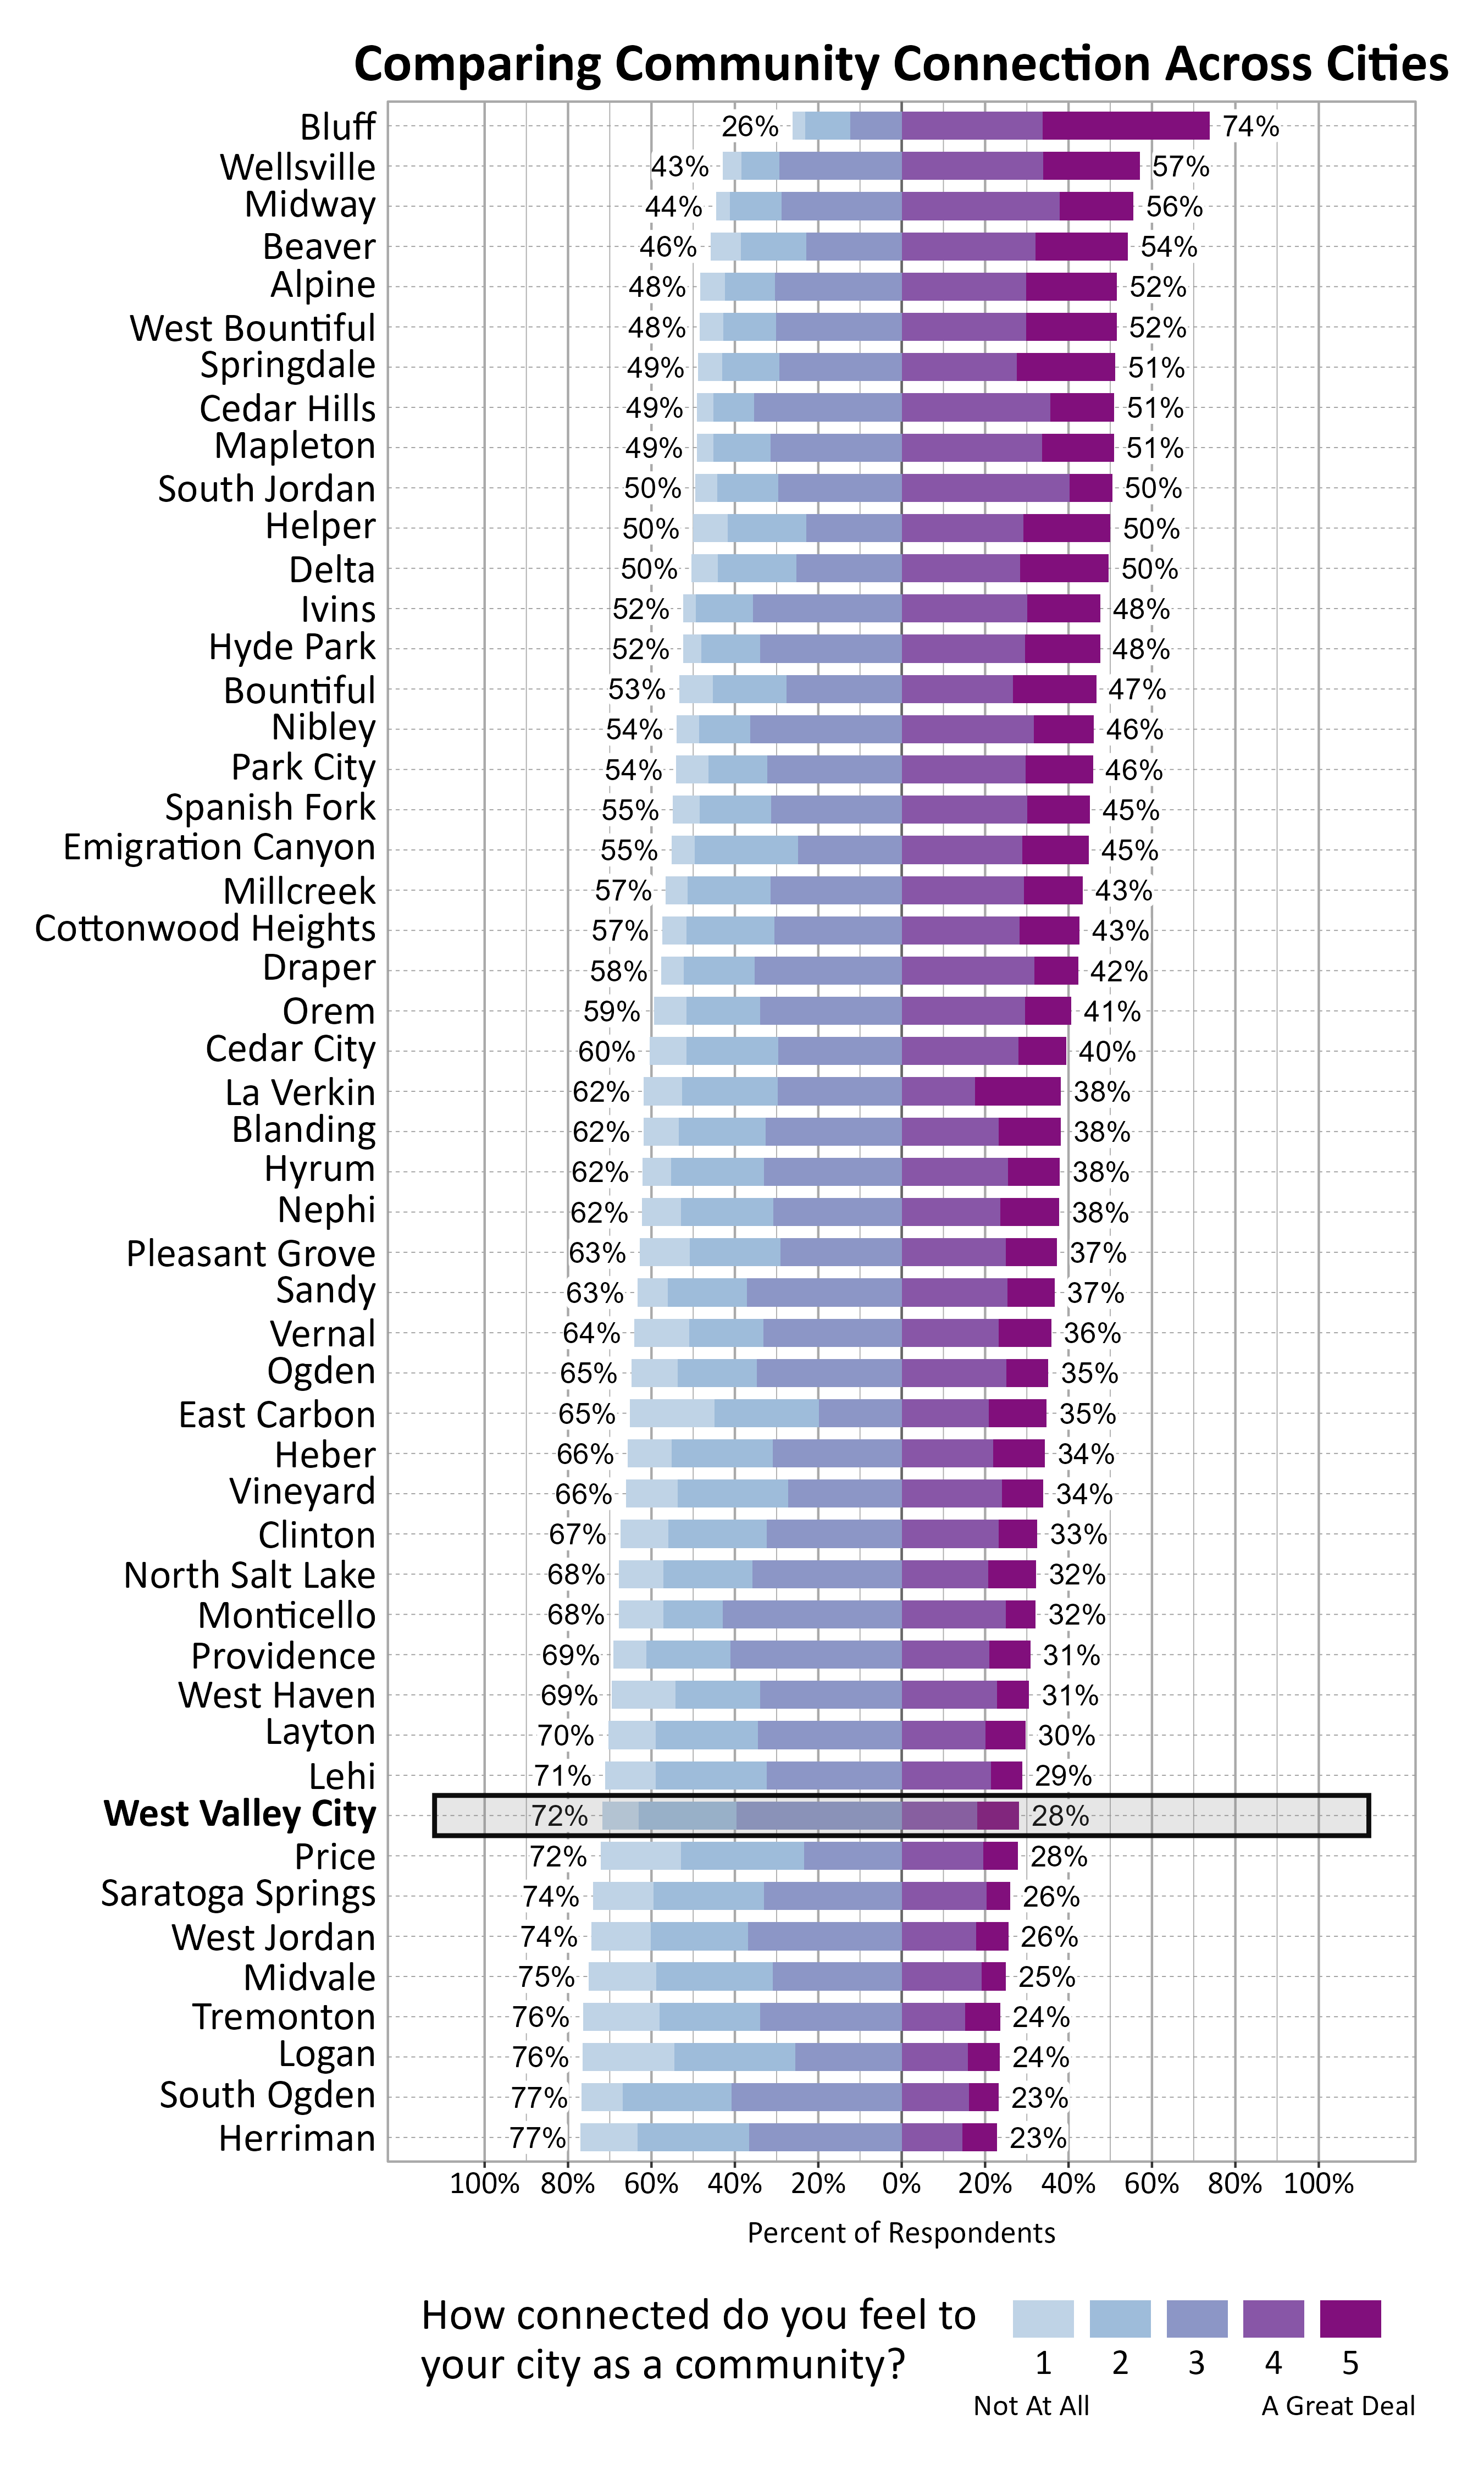
The graph below shows how Wellbeing Project cities and towns compare on feelings of community connection based on the percentage of respondents who answered 4 or a 5 on a 5-point scale from “not at all” to “a great deal” connected to their city or town. West Valley City ranked 43 out of the 51 cities that participated.
Participation in Recreation and Nature-Related Activities
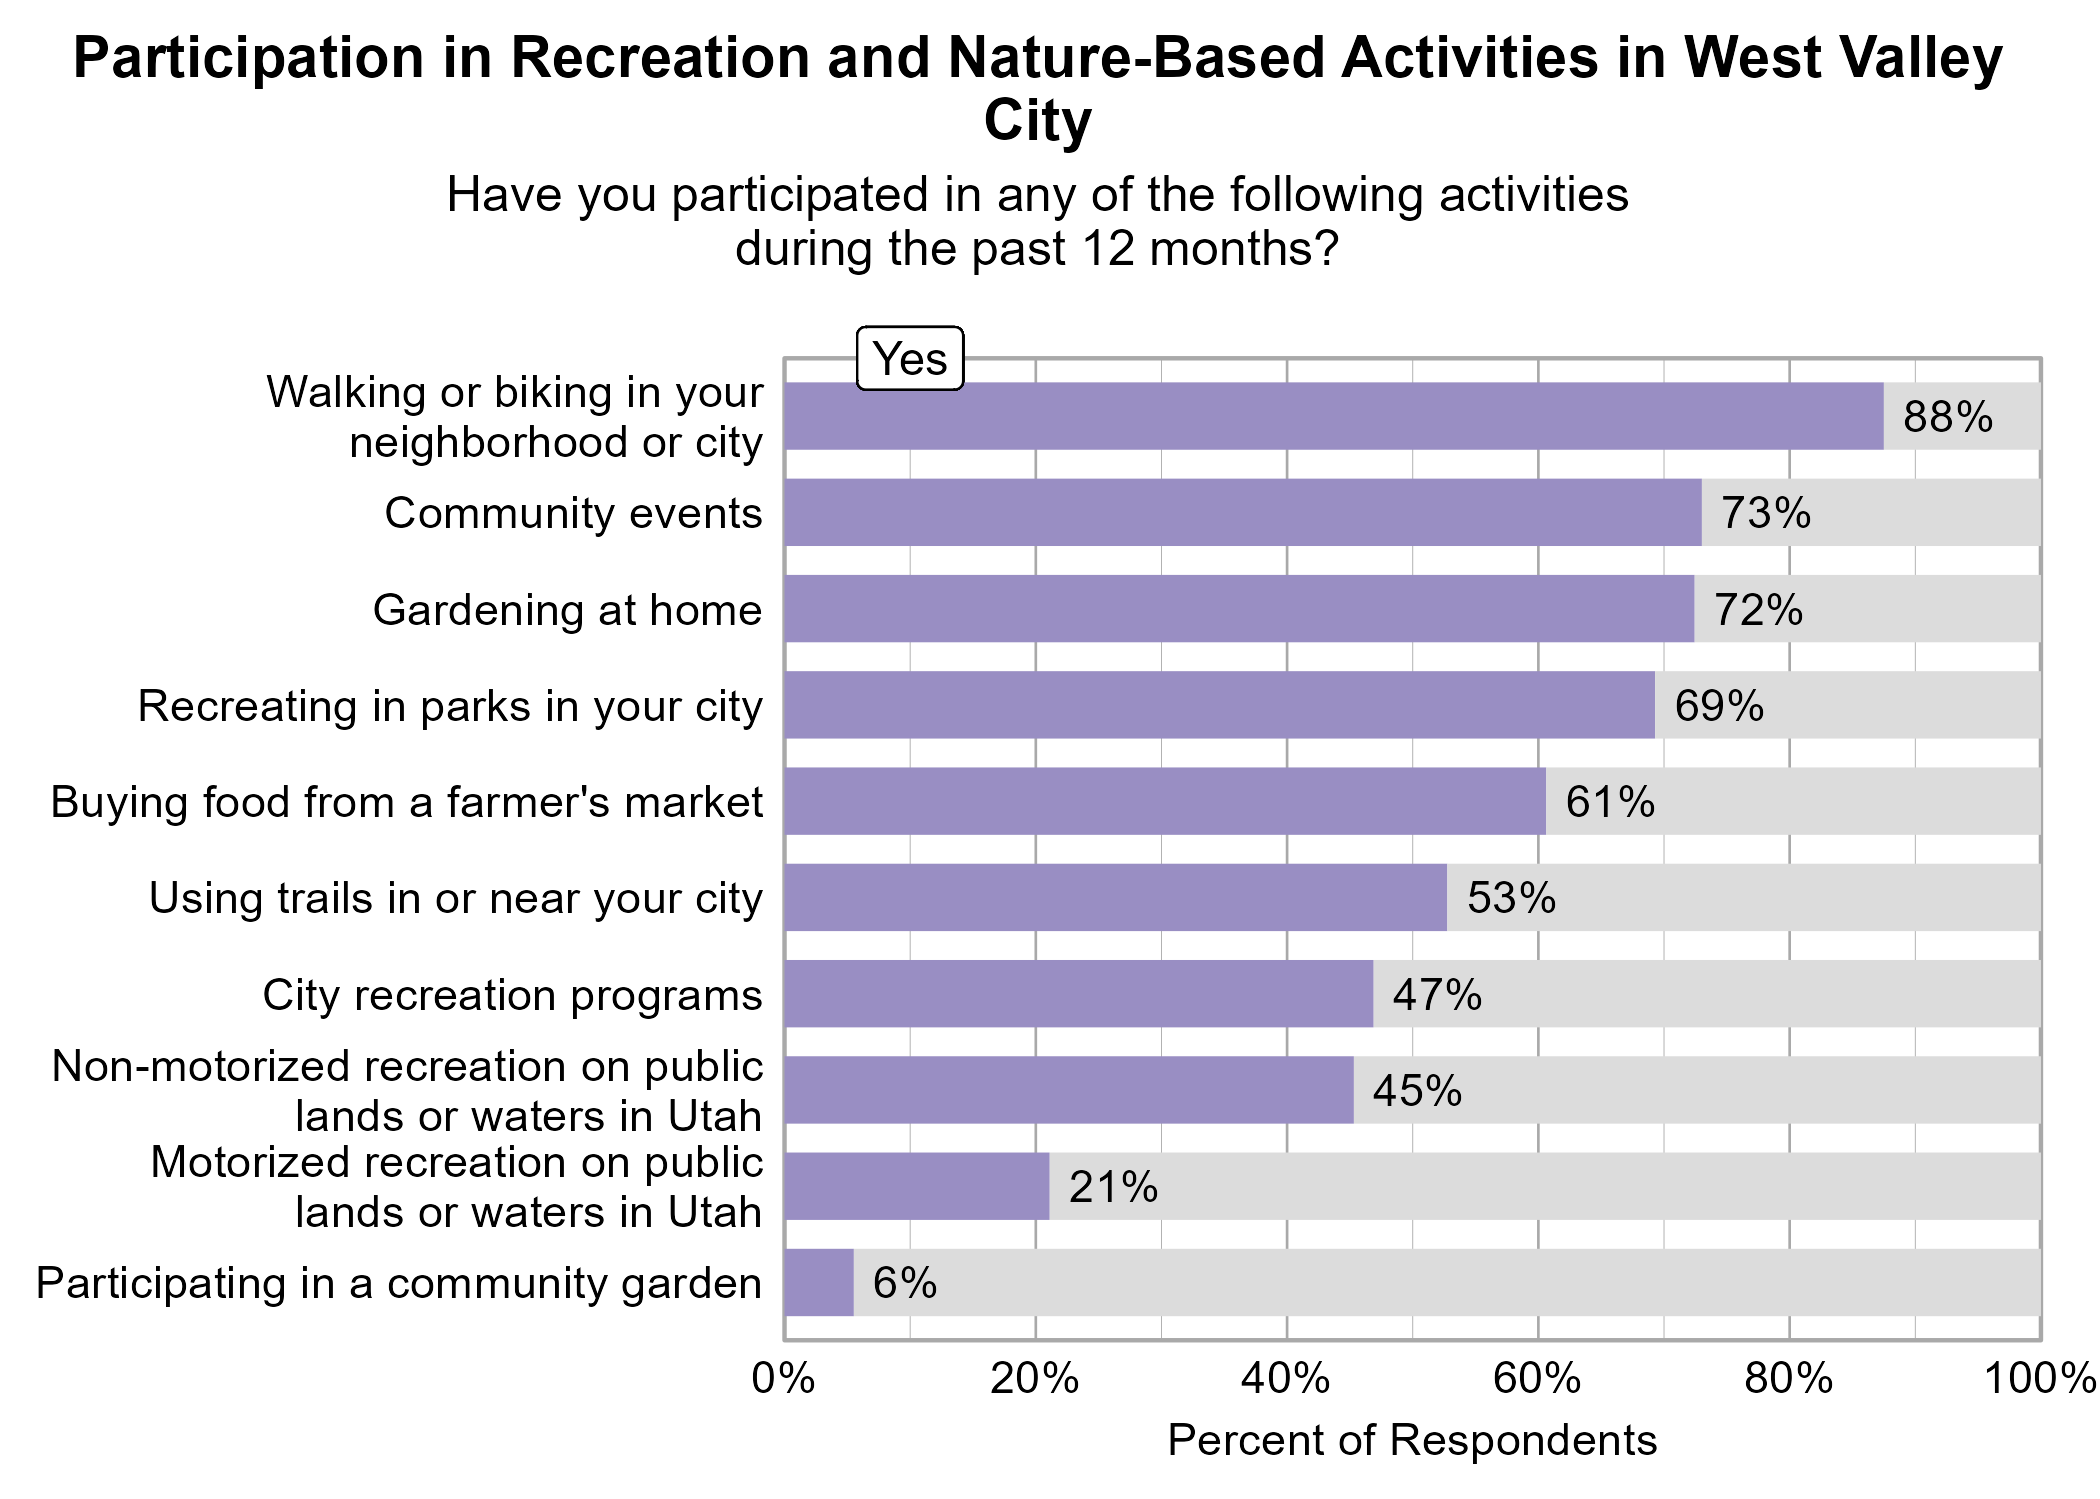
Respondents were asked to indicate whether or not they participated in various activities in the last 12 months. The most popular activities were walking or biking in your neighborhood or city (88%), community events (73%), and gardening at home (72%).
Participating in city recreation programs, non-motorized recreation on public lands or waters in Utah, and recreating in parks in your city were significantly related to higher ratings of personal wellbeing.
Non-motorized recreation on public lands or waters in Utah and recreating in parks in your city were significantly related to higher ratings of community wellbeing.
Participating in city recreation programs, participating in community events, and recreating in parks in your city were significantly related to higher ratings of community connection.
Perspectives on Population Growth and Economic Development
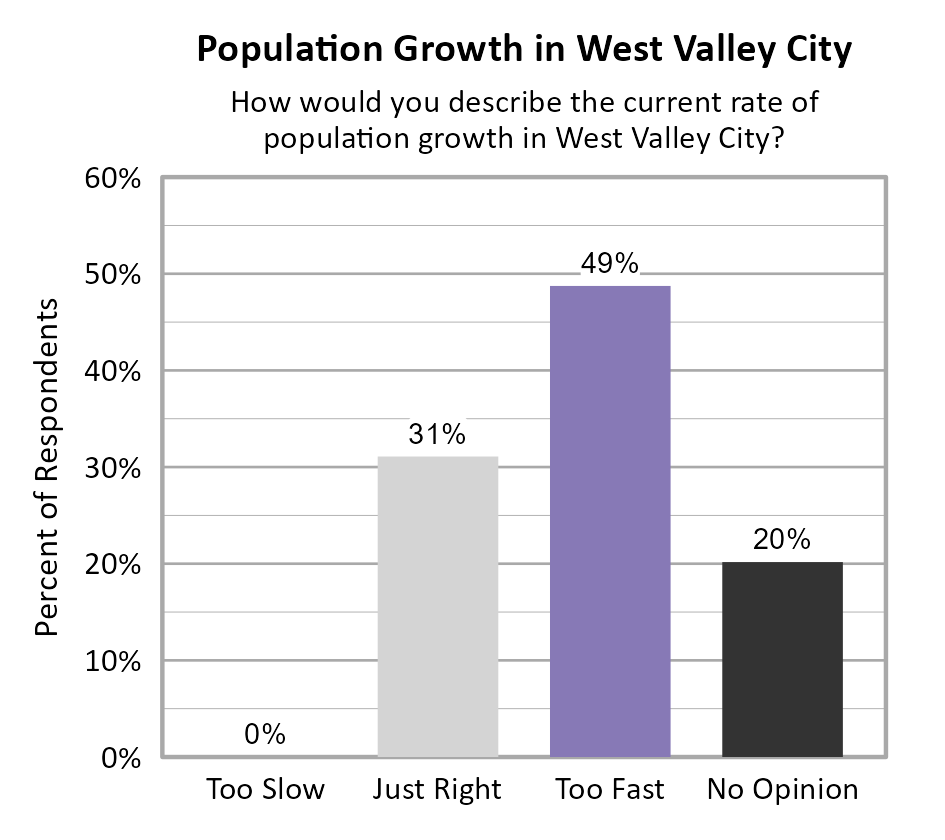
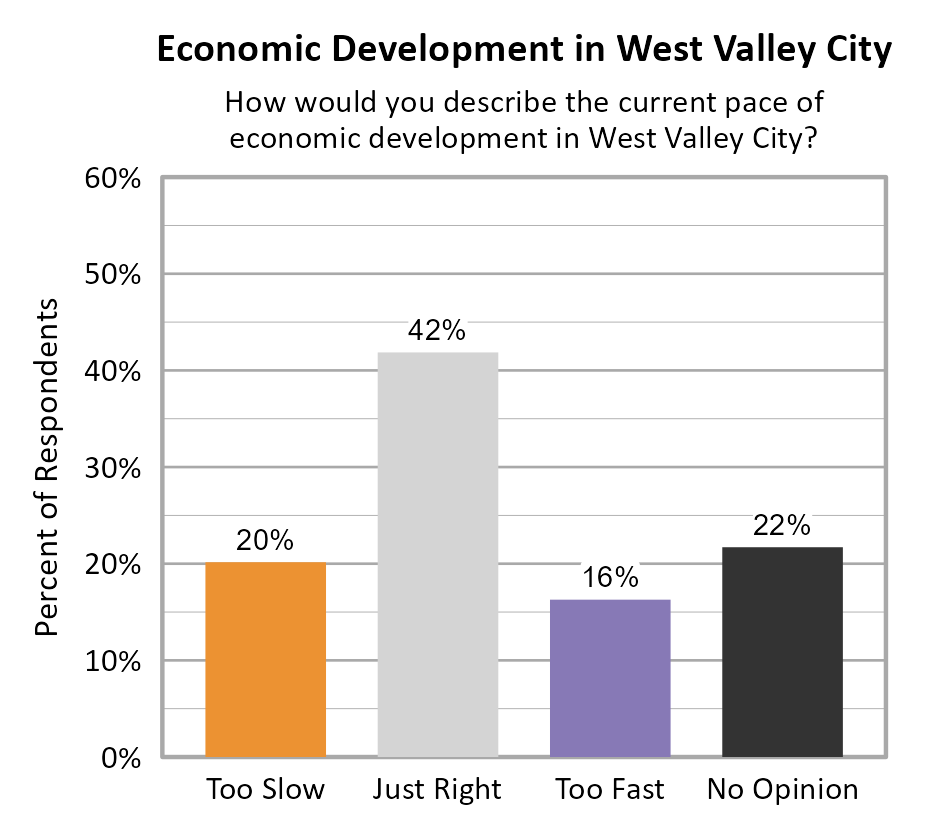
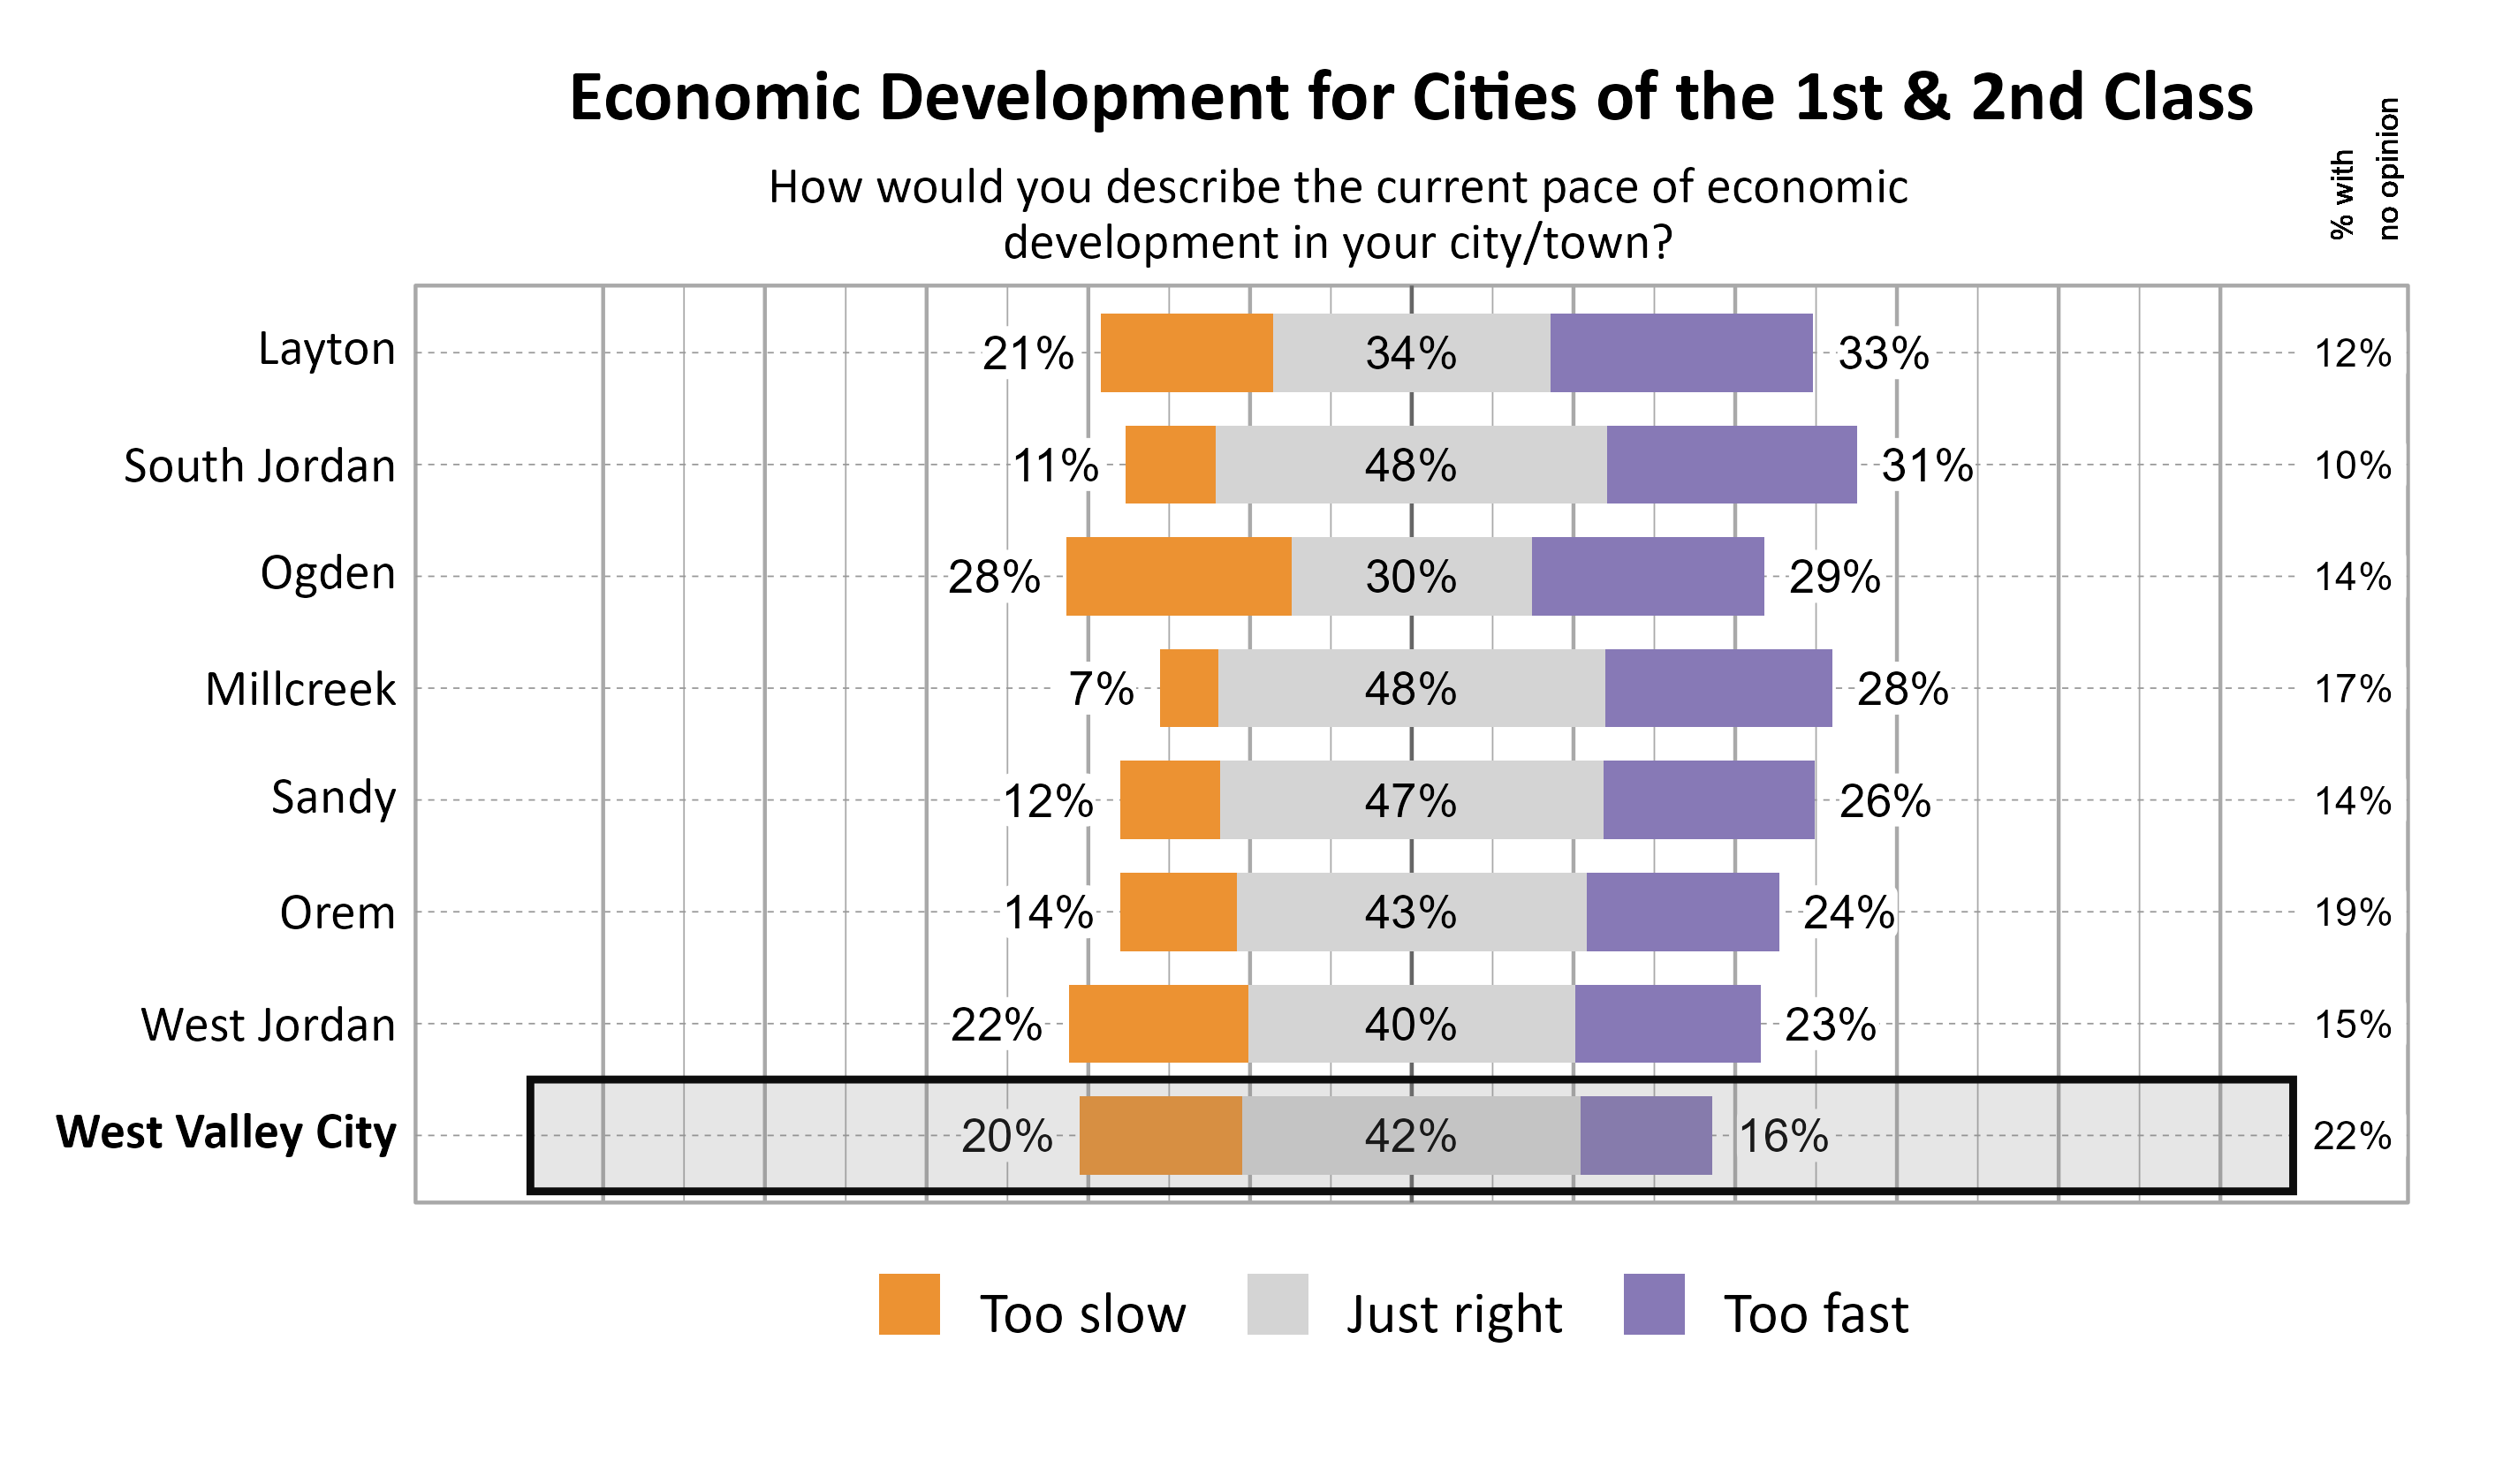
The largest proportion of respondents in West Valley City indicated that they felt the population growth was too fast (49%). For the pace of economic development, the largest proportion of respondents indicated that it was just right (42%).
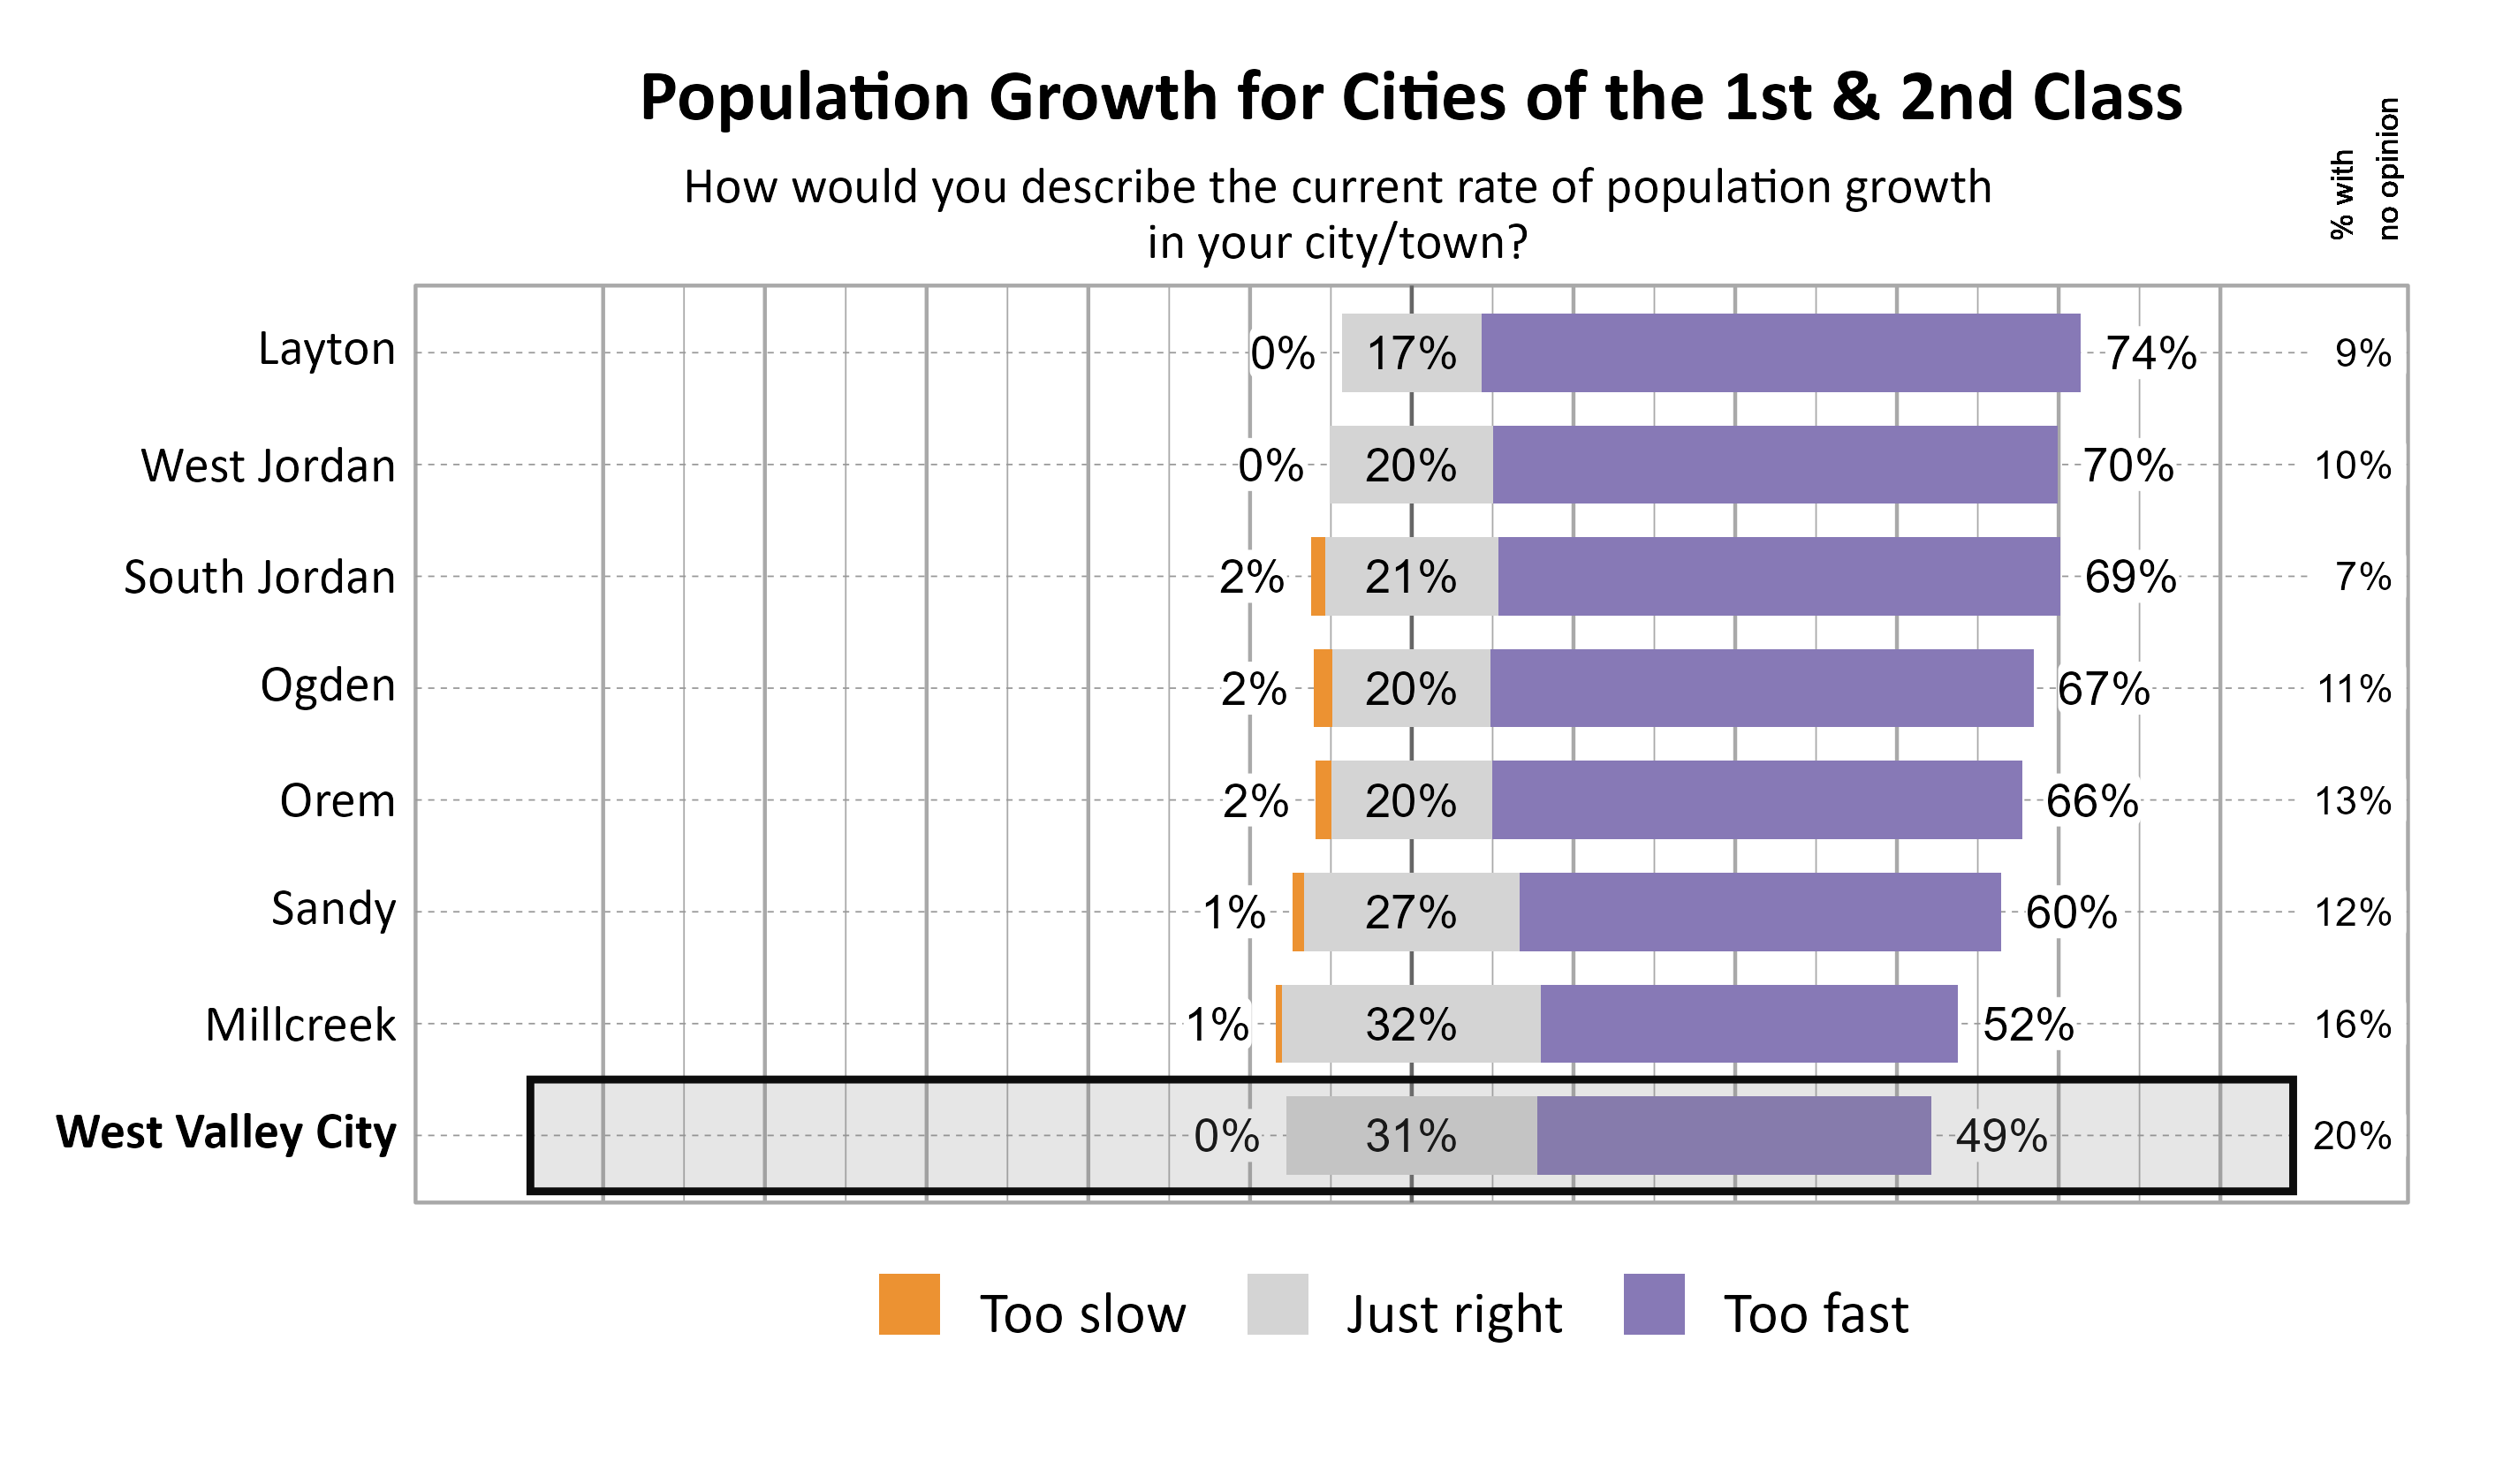
The graphs below show perceptions of population growth and economic development for West Valley City compared to other participating cities and towns in the Cities of the 1st & 2nd Class cluster.
The graph below illustrates how many respondents perceived the pace of economic development as too slow, just right, too fast, or had no opinion, with additional breakdowns for the number of respondents who provided comments.
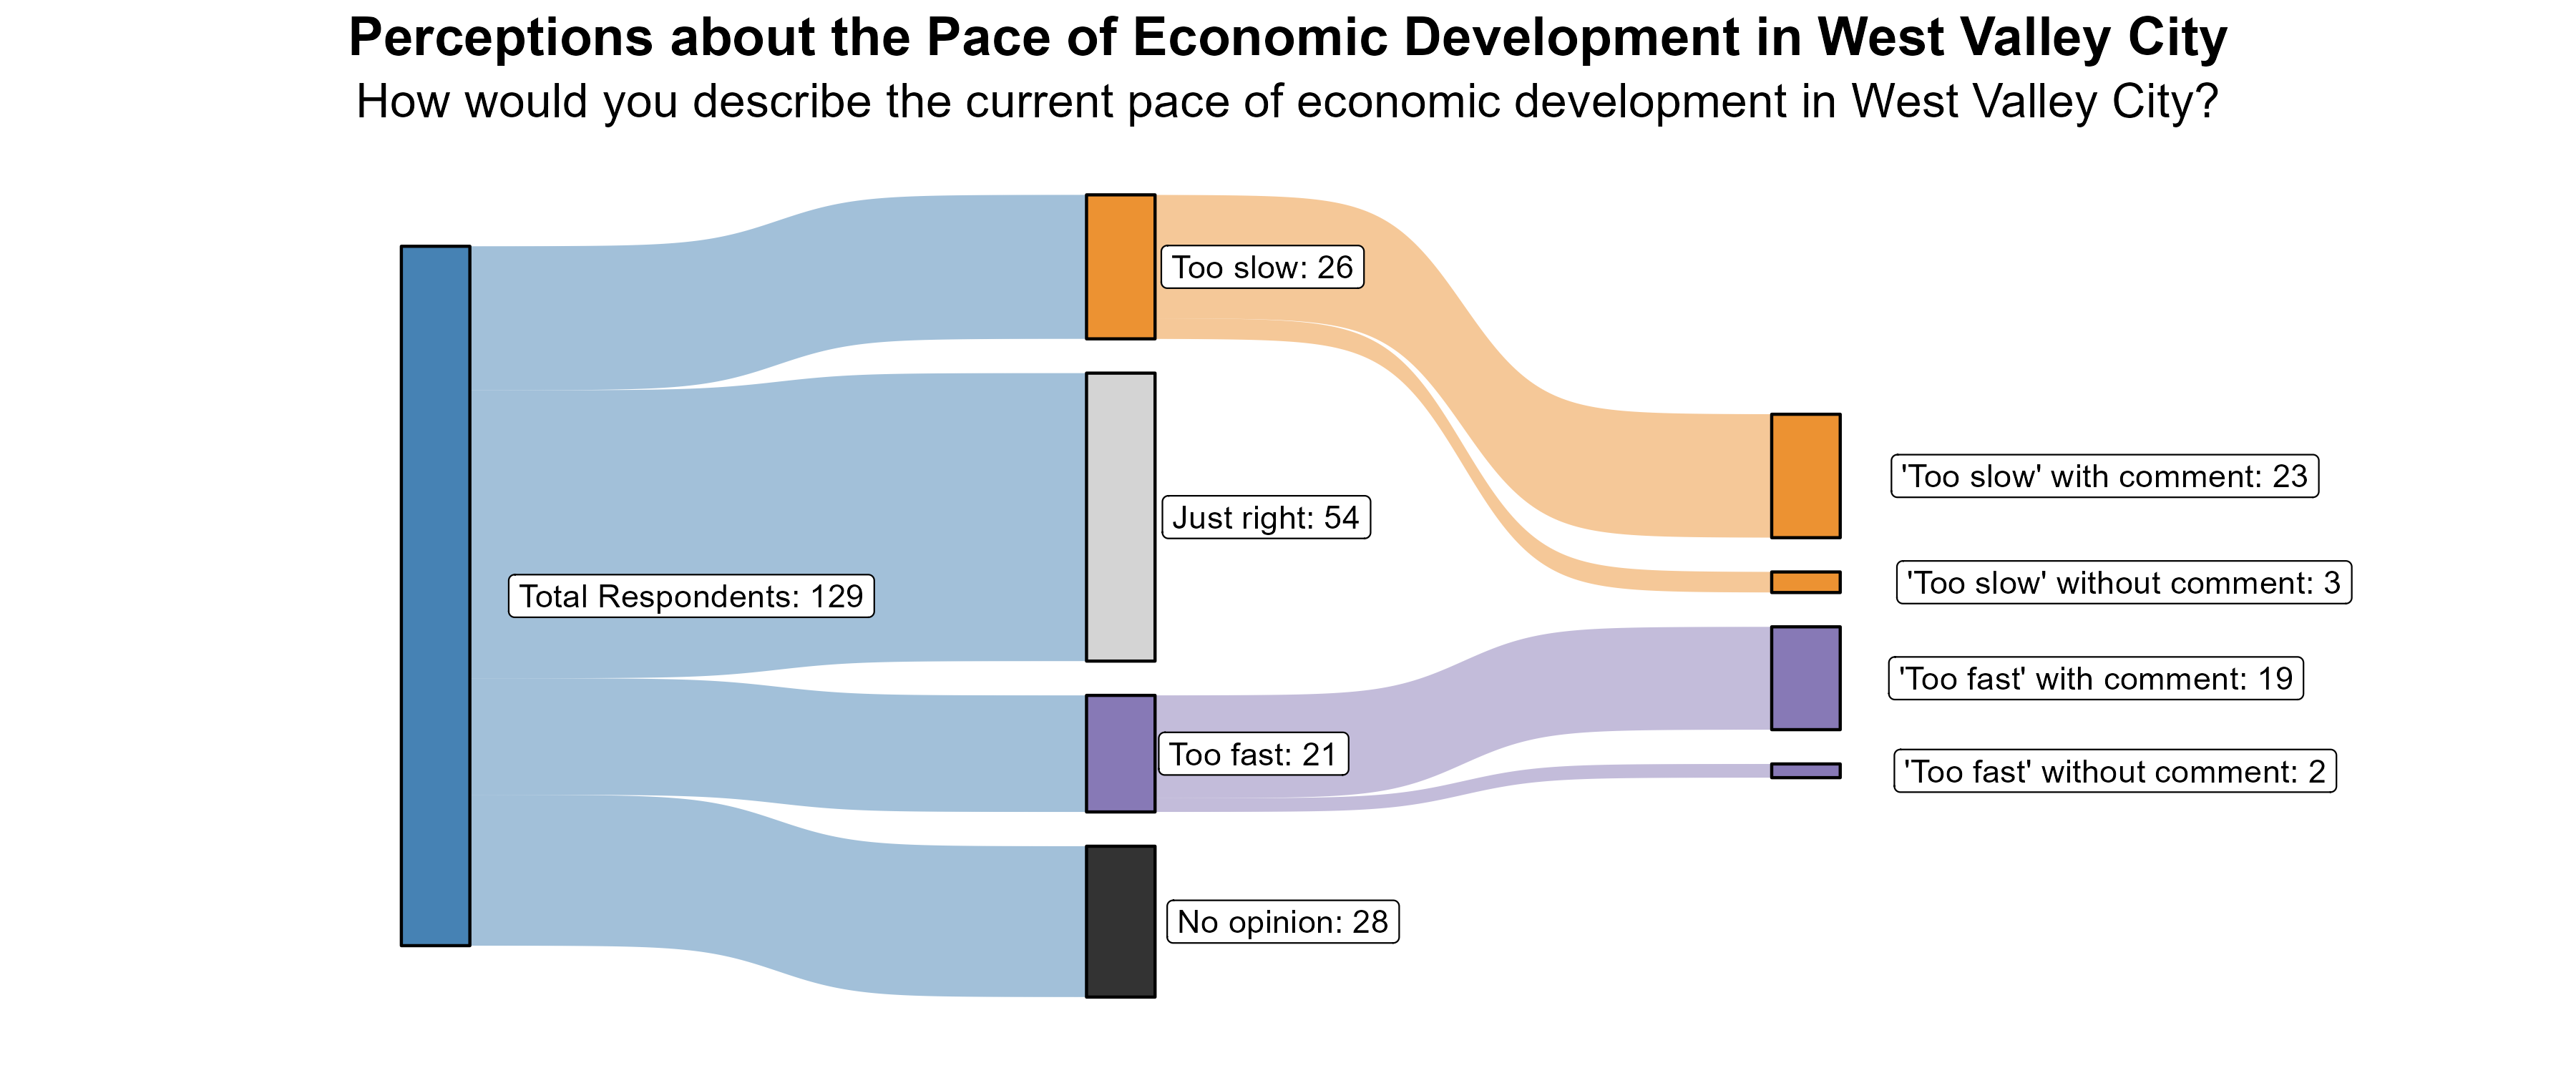
The 20% of respondents who rated the pace of economic growth as “too slow” were further asked what aspects of the local economy they would like to see more of in West Valley City. Comments largely emphasized the need for jobs and opportunities in diverse industries. The need for more retail and business options was also mentioned. There were a few concerns about crime and safety and the need to maintain or revitalize existing developments.
Additionally, the 16% of respondents who rated the pace of economic growth as “too fast” were further asked what aspects of the local economy they feel are growing too quickly in West Valley City. Comments focused on general rapid development and housing, while also mentioning empty lots, affordability issues, and the need for infrastructure to handle the growth.
Transportation in West Valley City
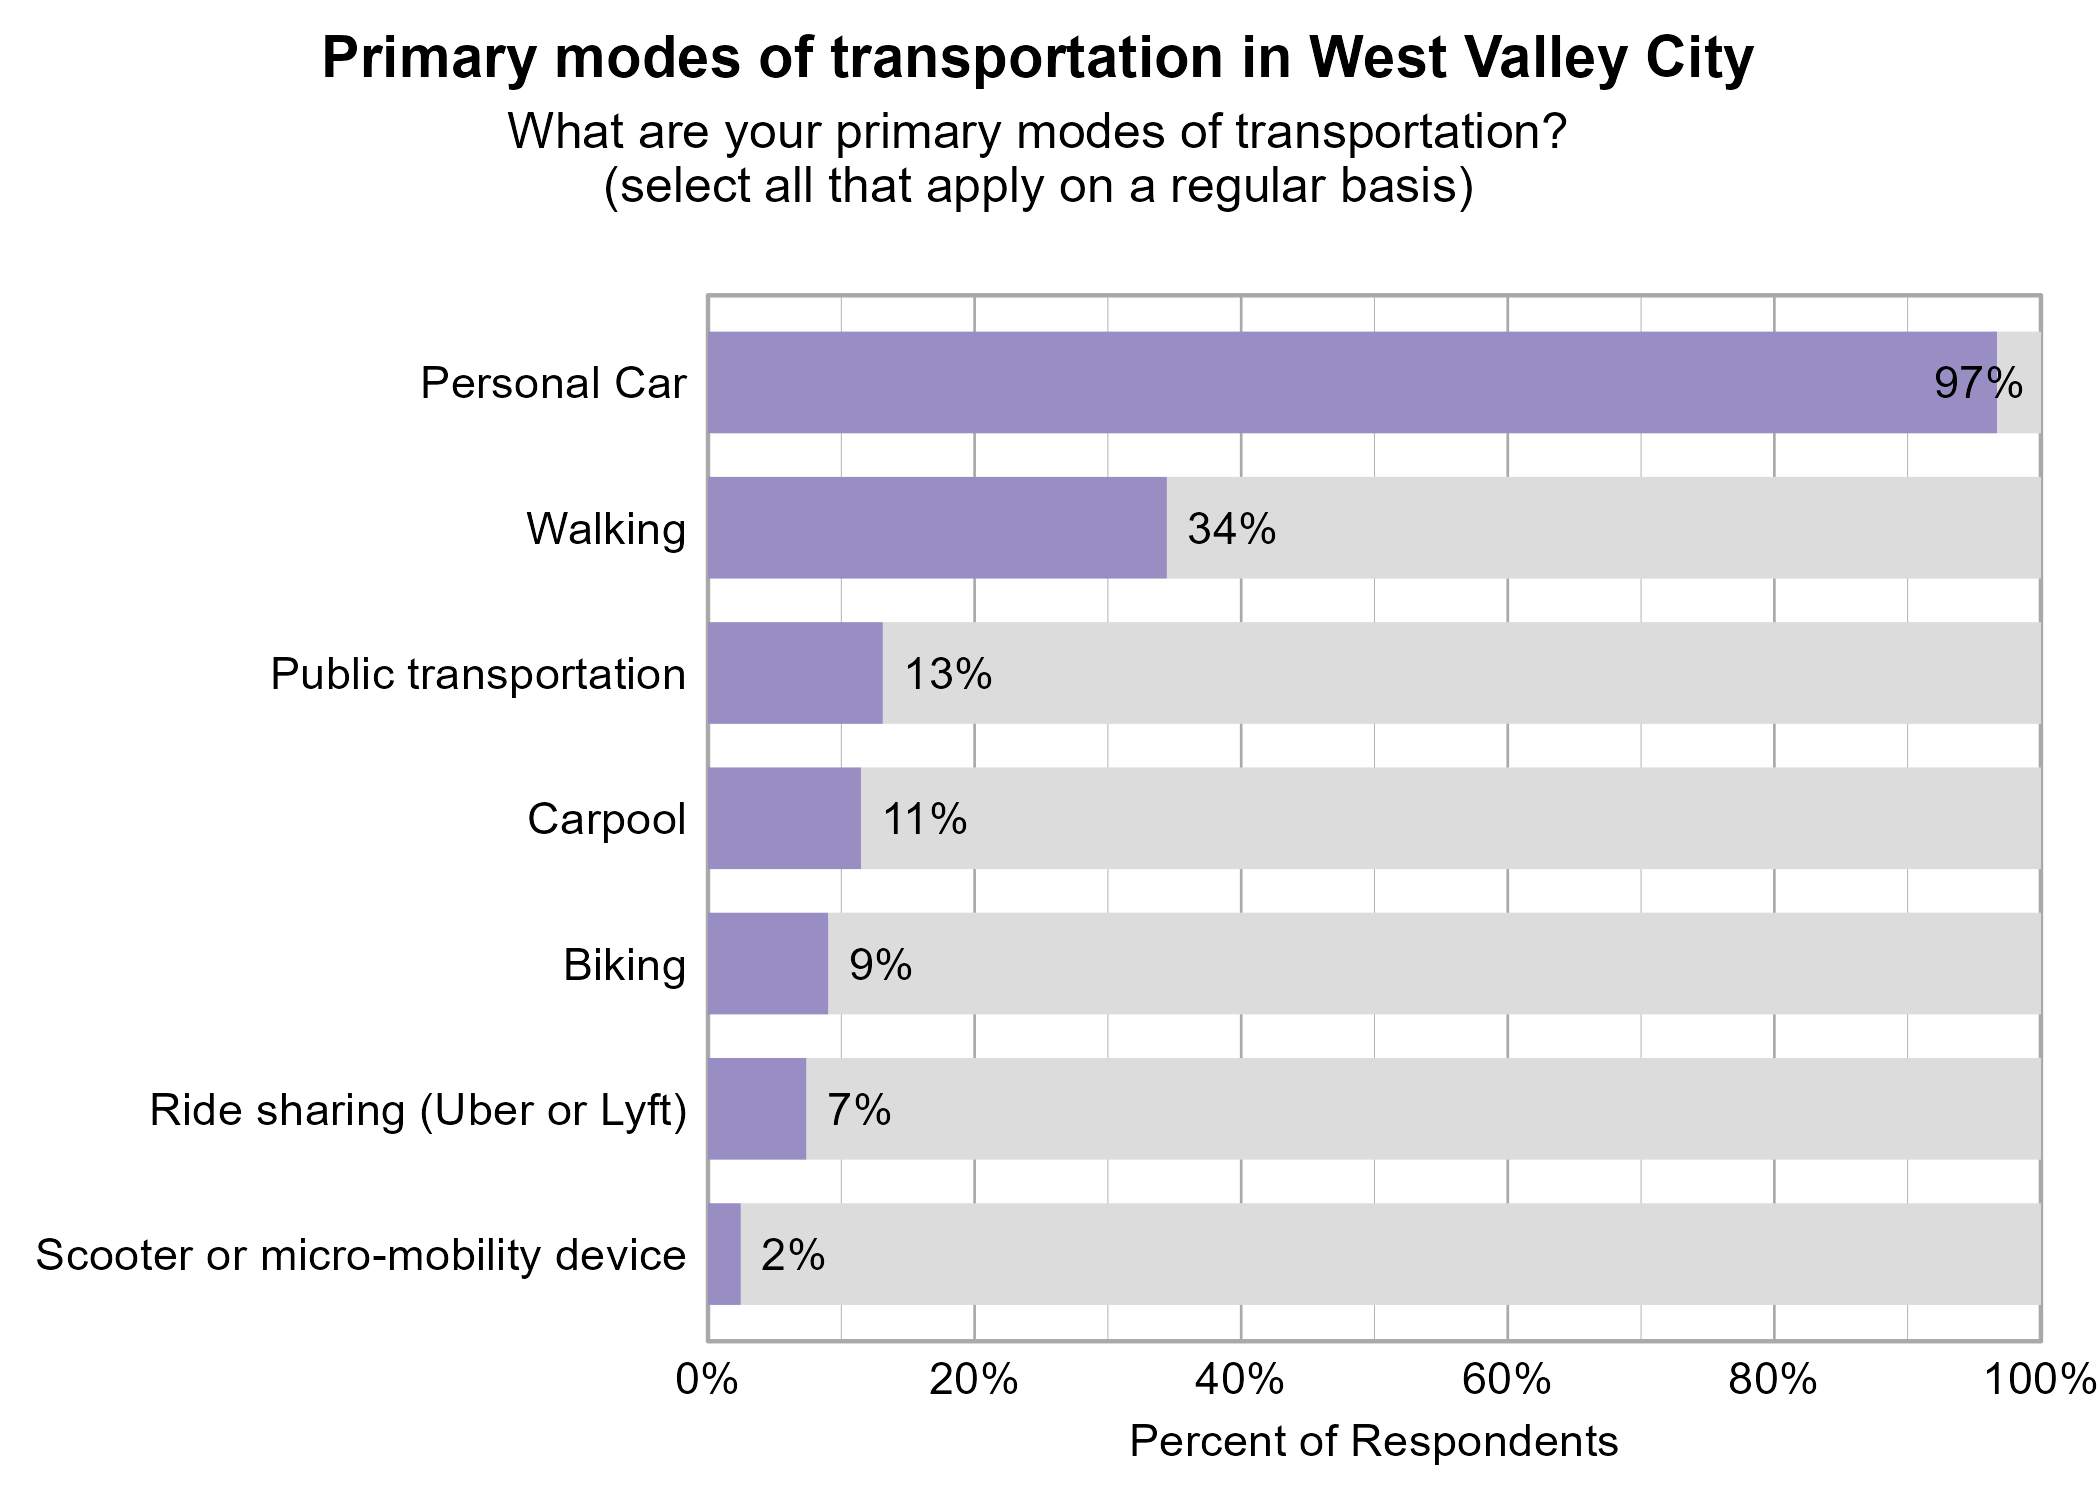
Respondents were asked to indicate all of their primary modes of transportation on a regular basis in West Valley City. The most popular modes of transportation were personal car (97%) and walking (34%).
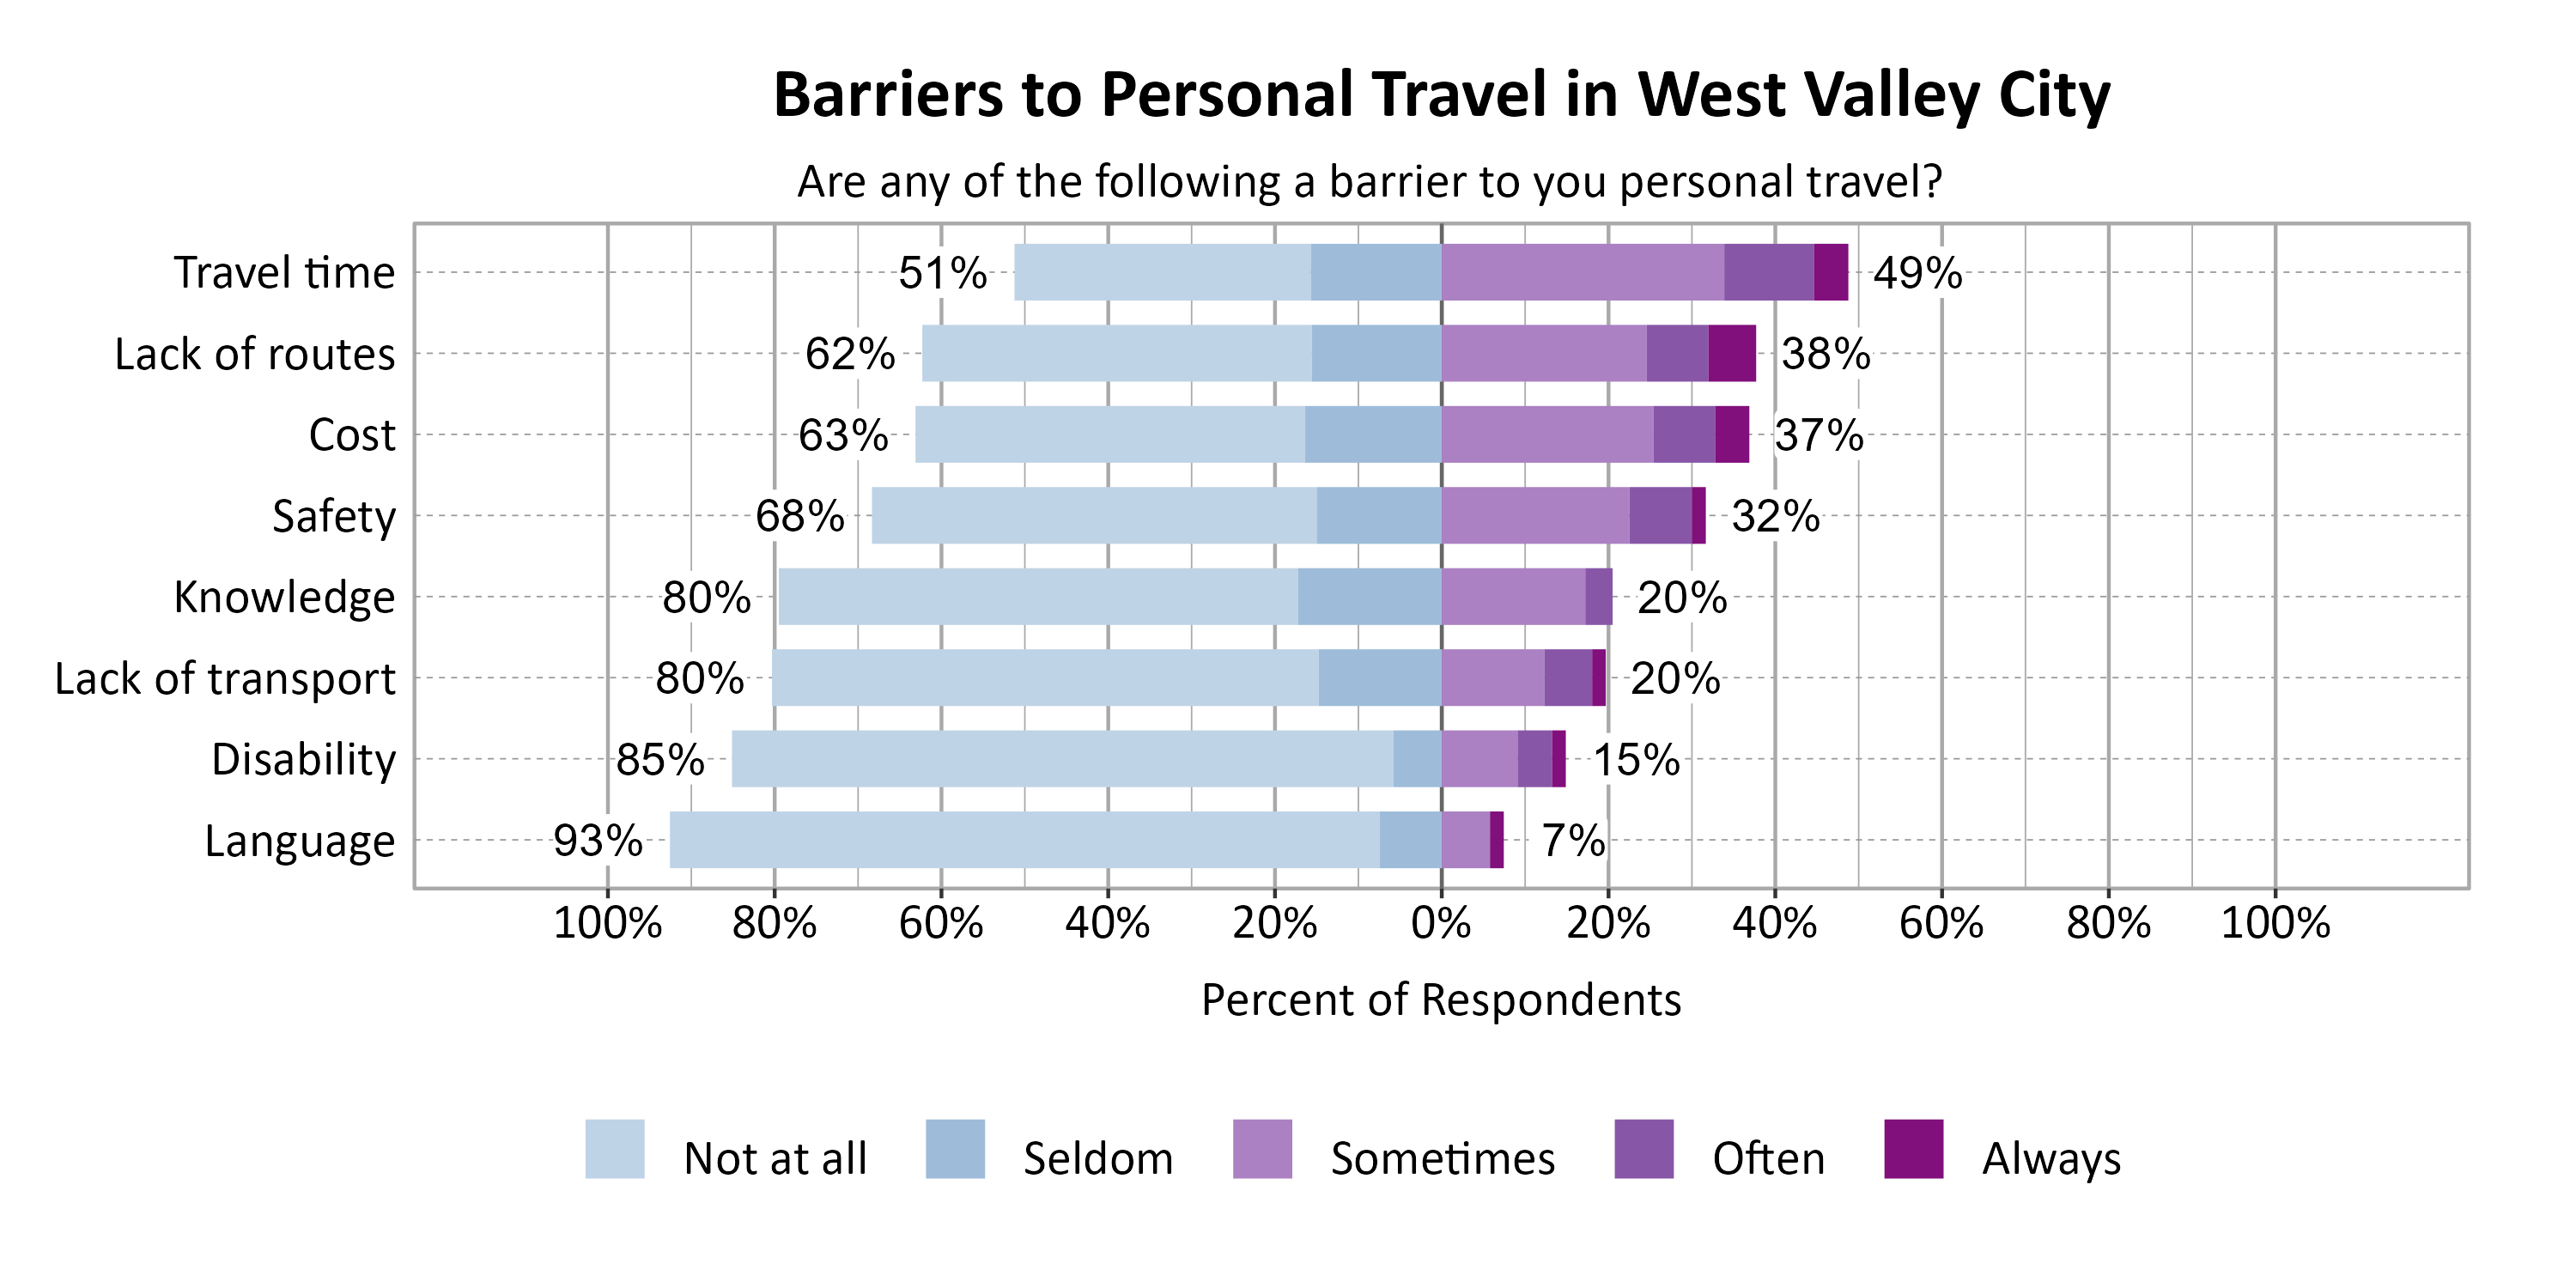
Respondents were asked to indicate the most common barriers to transportation in West Valley City. The most problematic barriers were Travel time (49%), Lack of routes (38%), and Cost (37%).
Respondents were asked to indicate the importance of a set of possible transportation developments in West Valley City. The most important development to respondents were Improving road surfaces (85%), Enhancing safety (80%), and Improving walkability (76%).

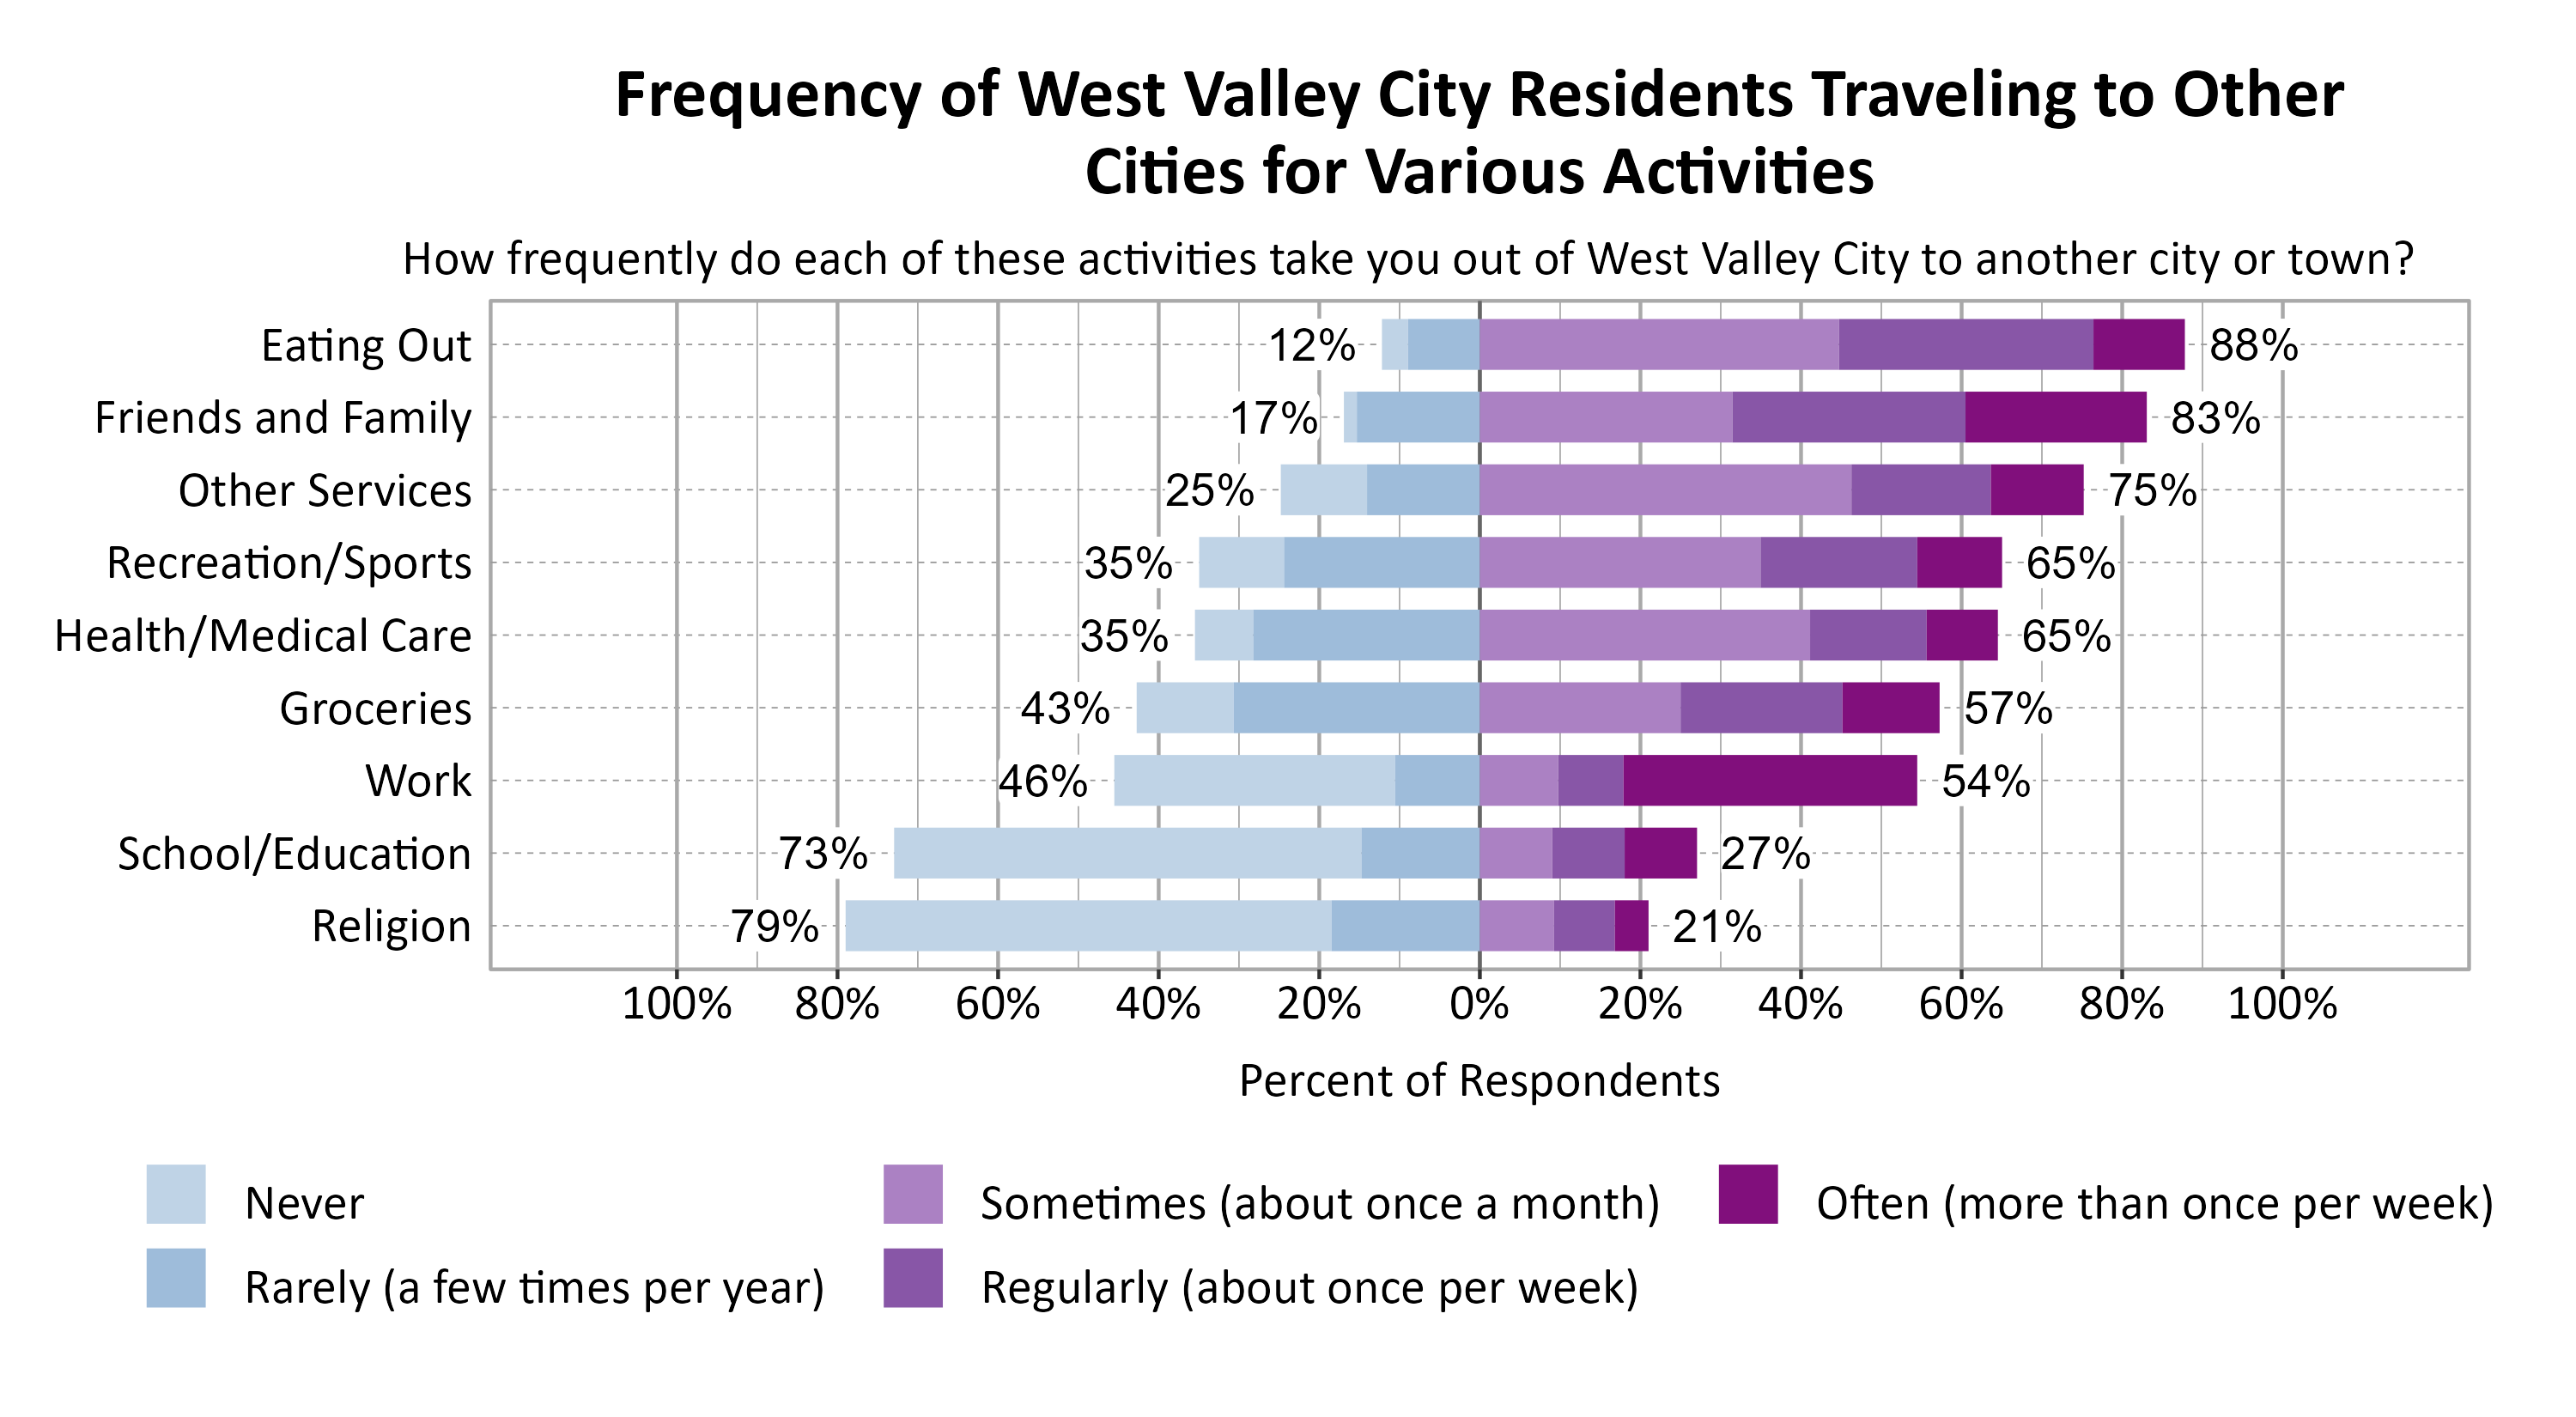
Respondents were asked to indicate how frequently various activities take them out of West Valley City to another city or town. The most commonly indicated reasons for traveling to another city or town at least sometimes or once a month were Eating Out (88%), Friends and Family (83%), and Other Services (75%).
Concerns in West Valley City
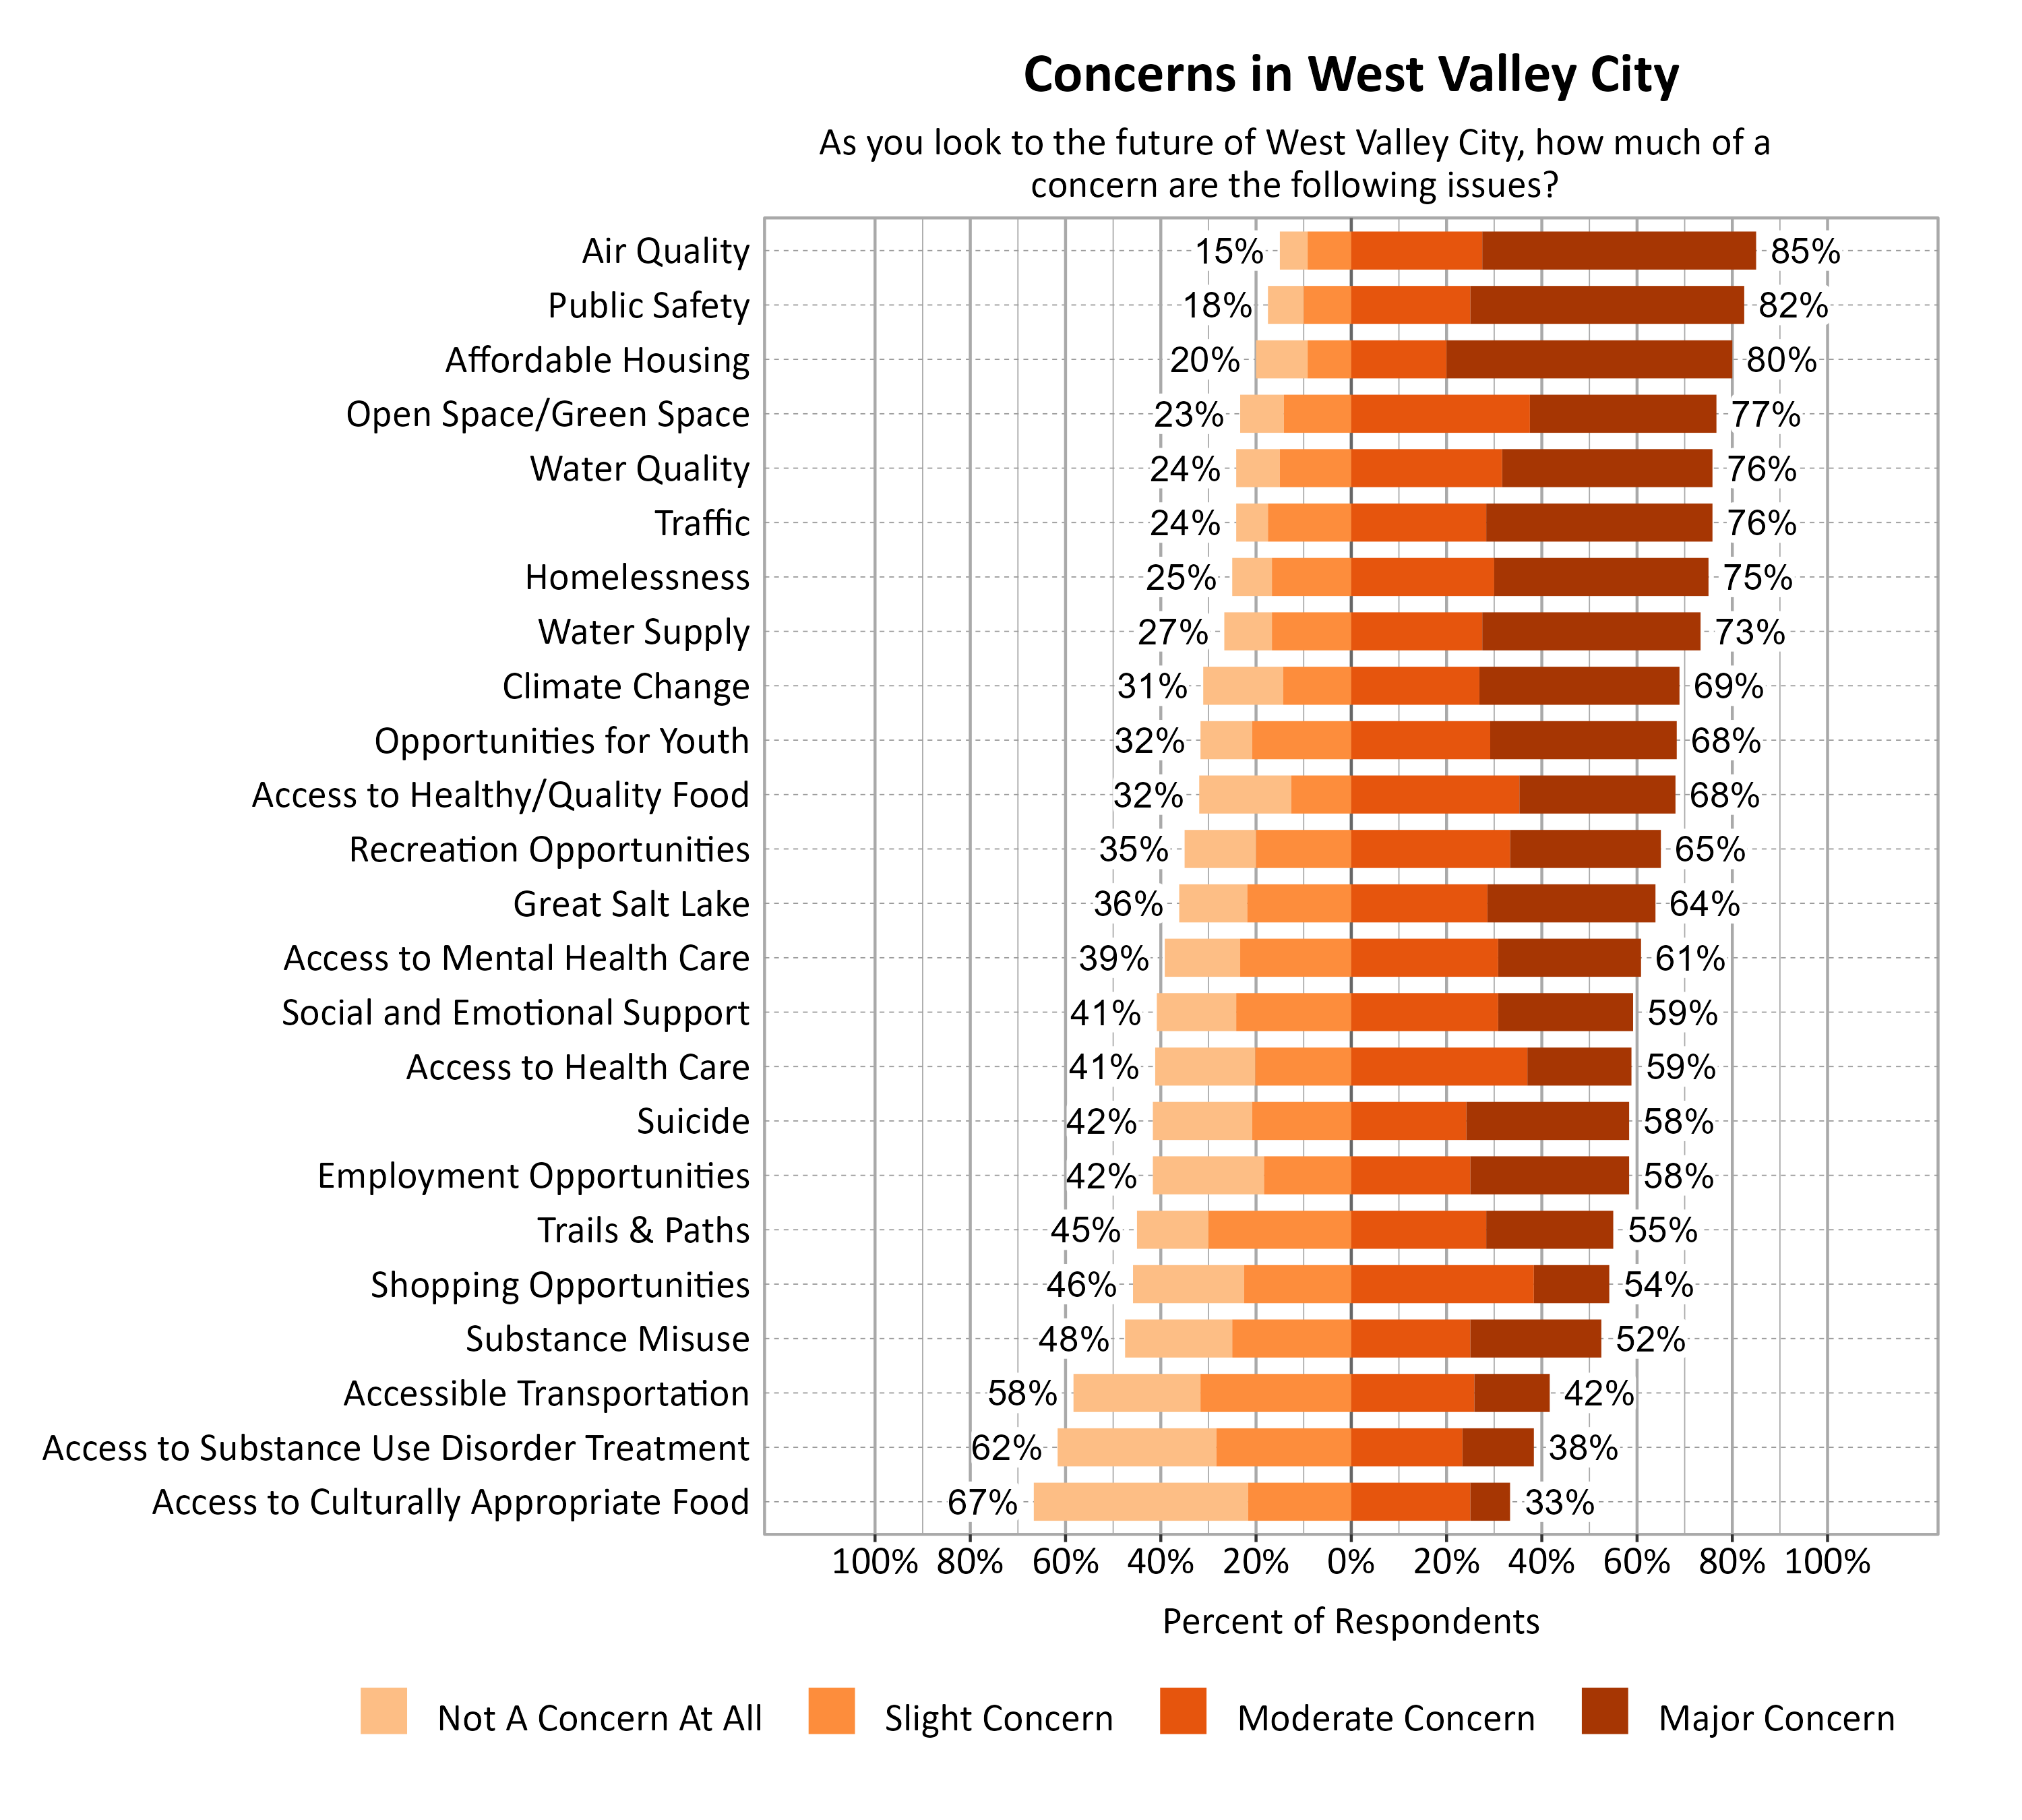
Survey respondents indicated the degree to which a number of possible local issues were a concern as they look to the future of West Valley City. Air Quality (85%), Public Safety (82%), and Affordable Housing (80%) were the top concerns.
Additional Questions for West Valley City
Outdoor Trails in West Valley City
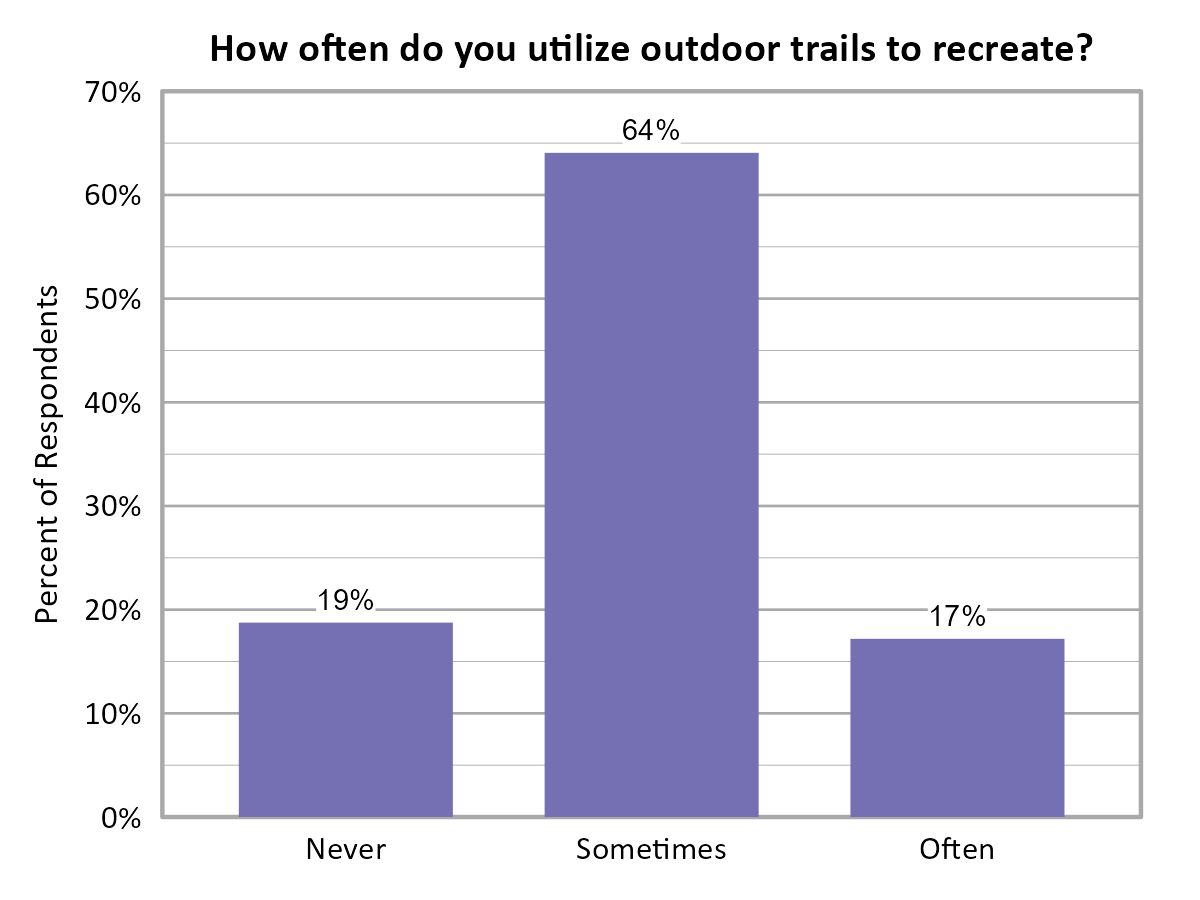
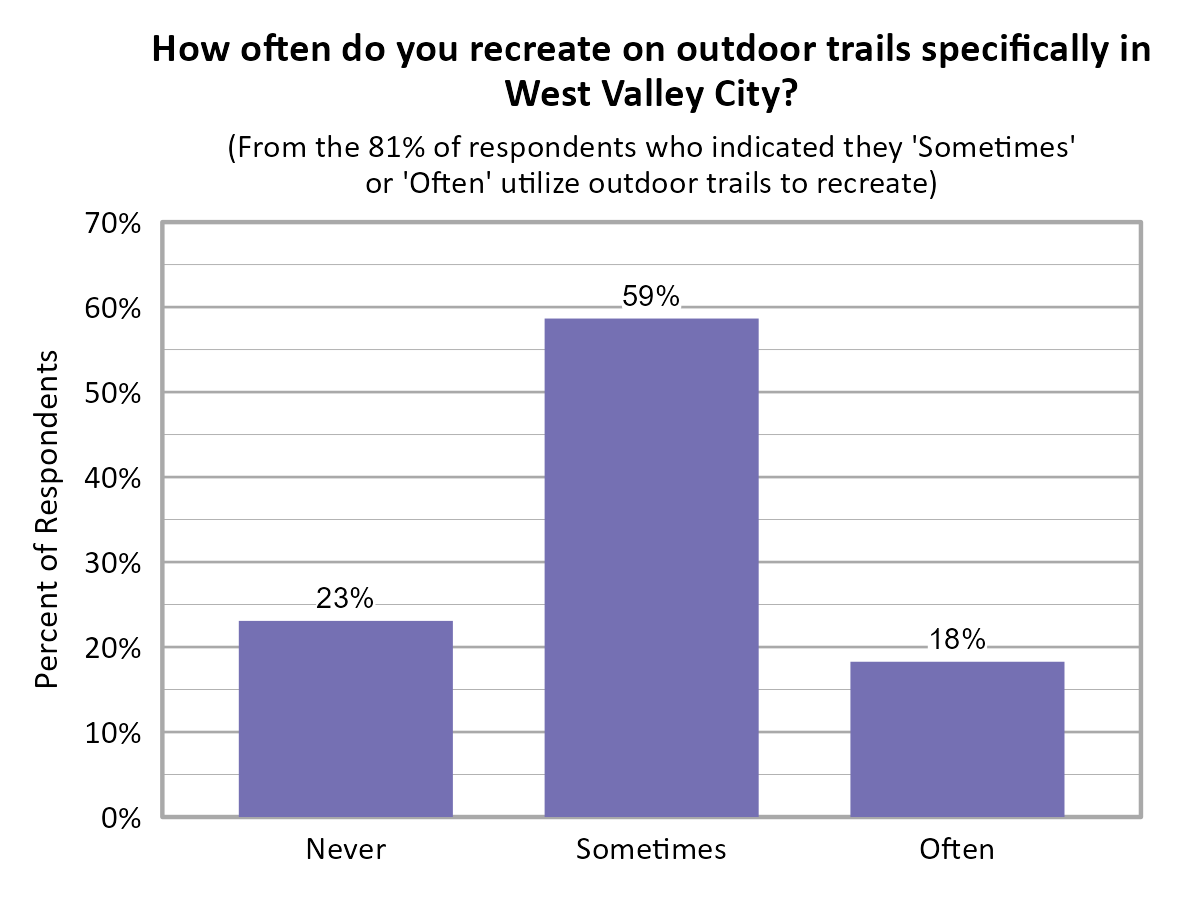
Respondents were asked how often they utilize outdoor trails to recreate, and the majority of respondents answered Sometimes. Respondents were also asked how often they recreate on outdoor trails specifically in West Valley City. For those that indicated they ‘Sometimes’ or ‘Often’ utilize outdoor trails to recreate, the majority of respondents then indicated they ‘Sometimes’ recreate on outdoor trails specifically in West Valley City.
Access to Resources in West Valley City
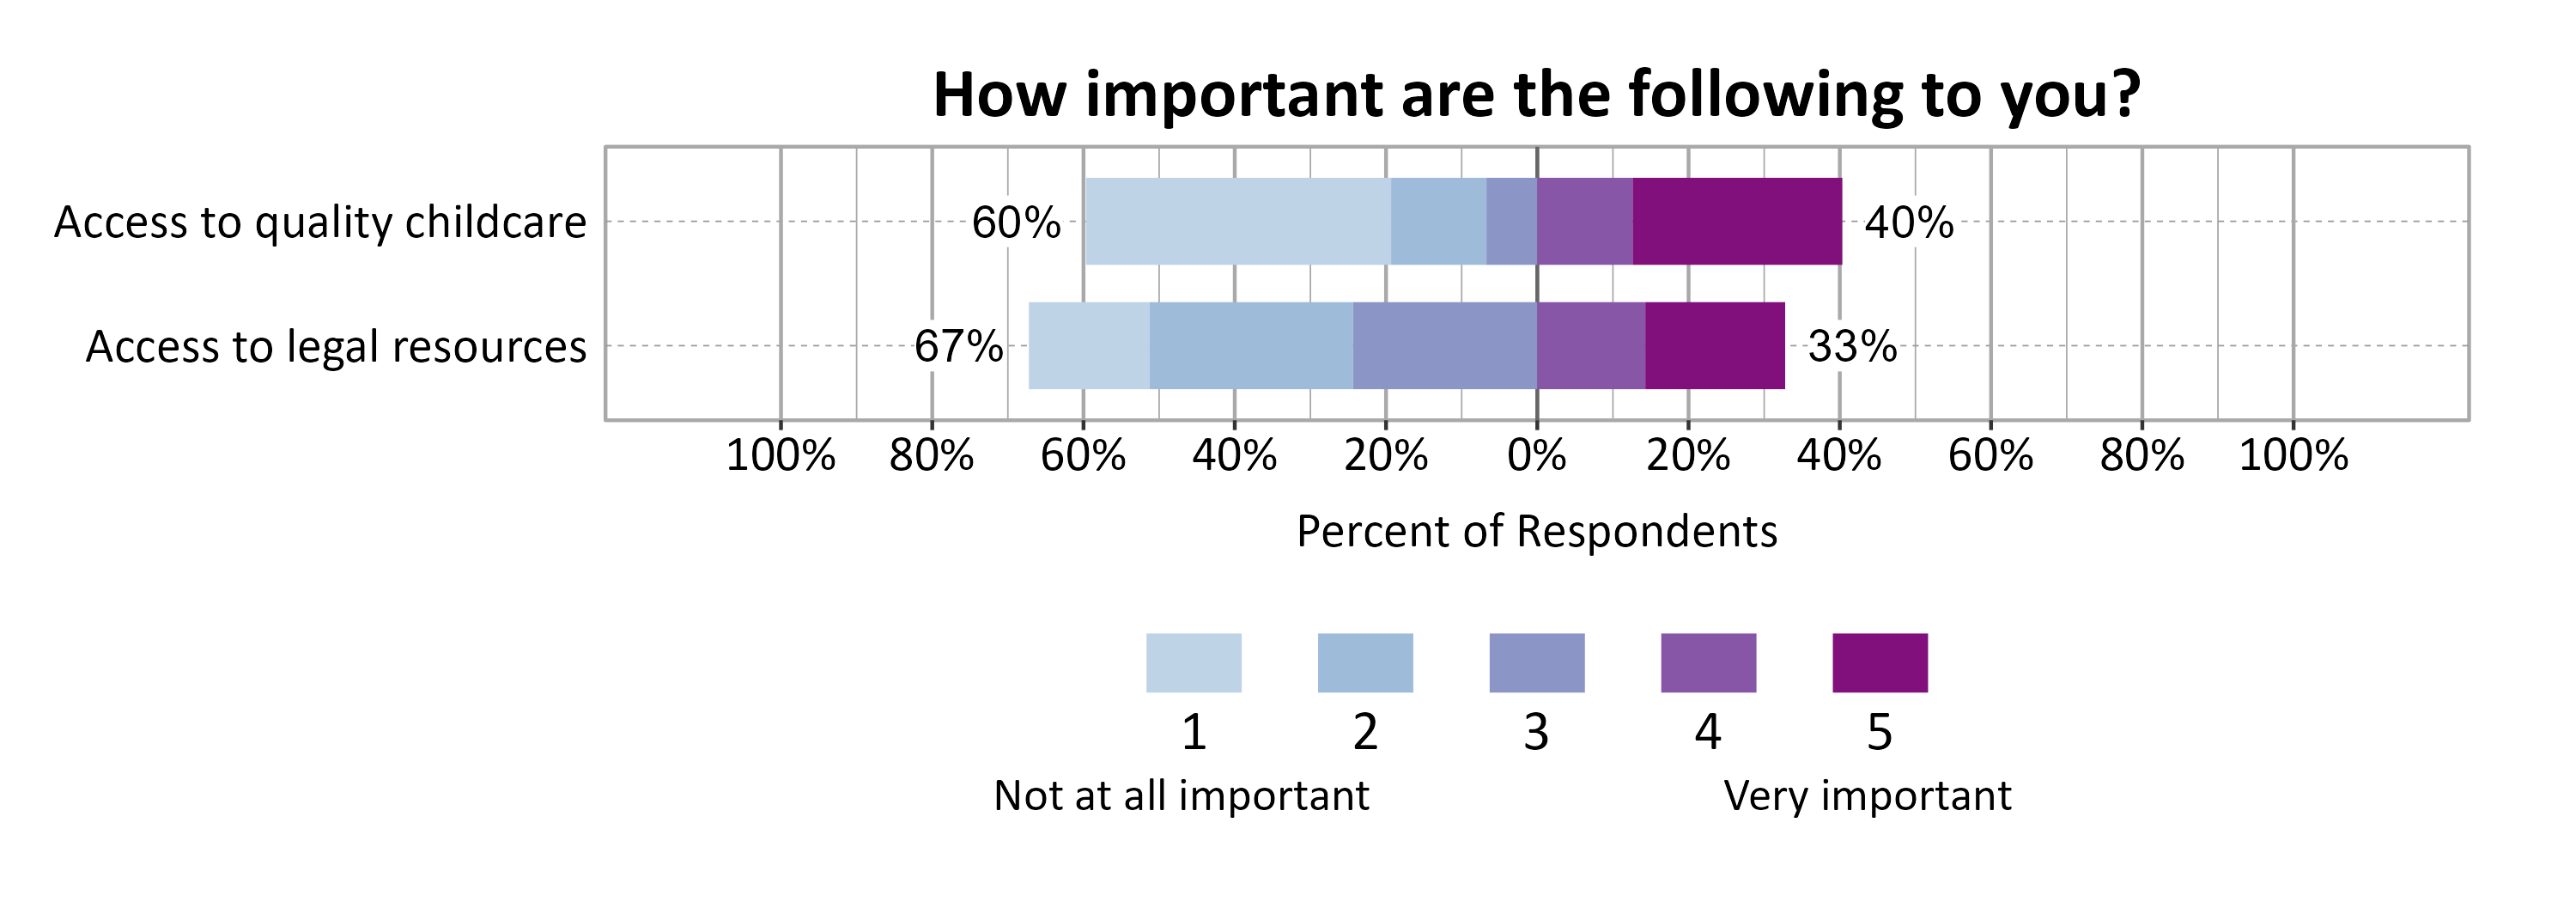
Respondents were also asked to indicate how important access to quality childcare and legal resources are to them on a scale of 1 (Not at all important) to 5 (Very important) and the results are shown in the graph below.
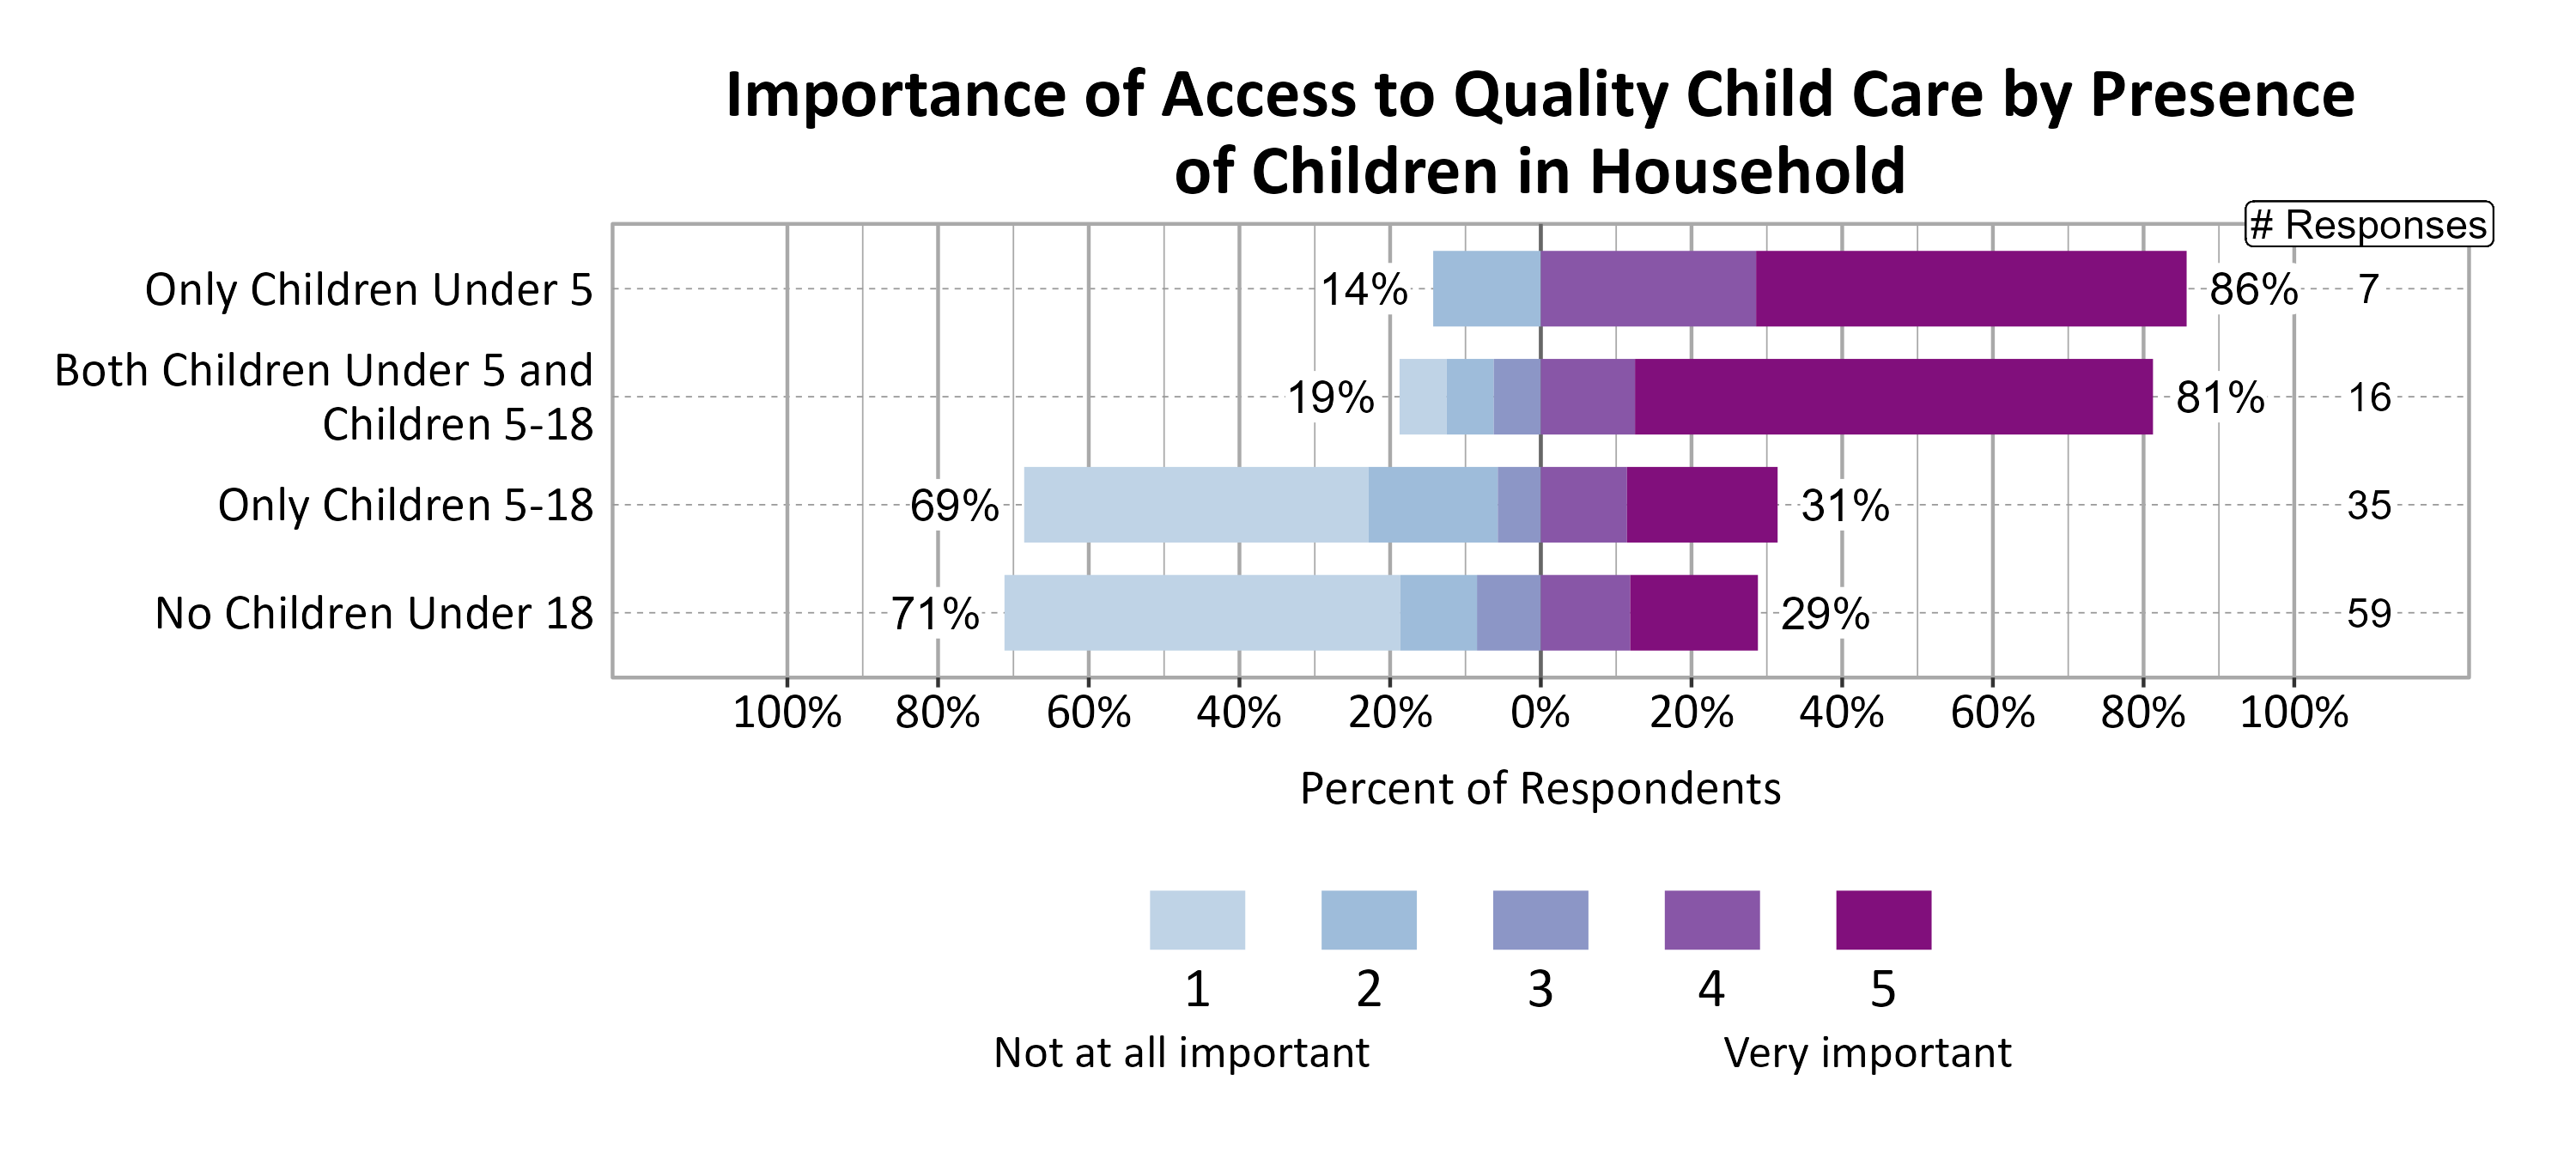
We looked further to see if importance of access to quality child care varied depending on whether people had children in the household. A considerable difference was observed.
Open Comments
All open comments collected in the survey were shared with city leaders. General observations and themes are shared here.
What Respondents Value Most in West Valley City
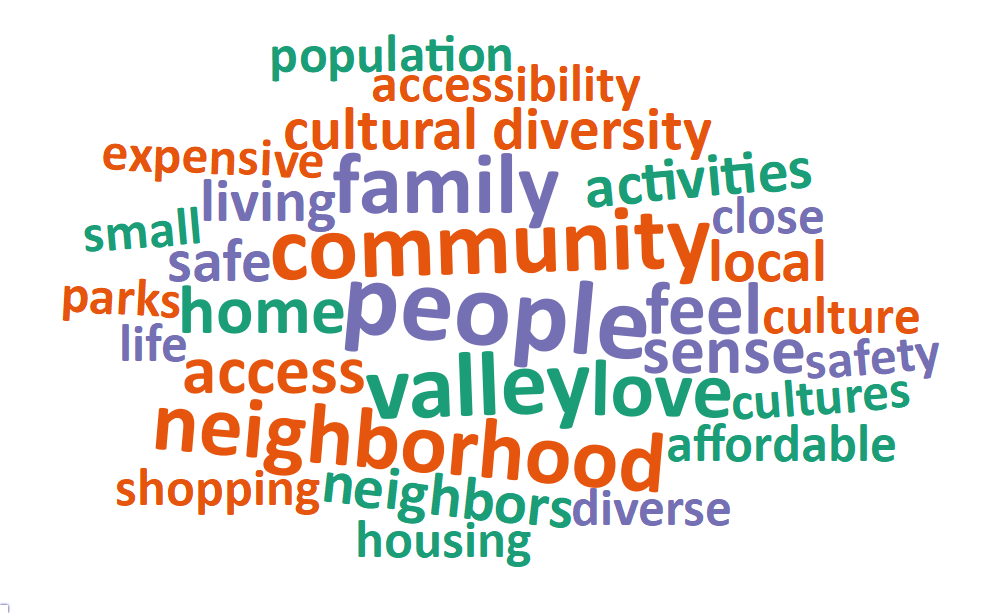
Survey respondents were asked to comment on what they value most about West Valley City. The most common words and phrases from all city comments are included in the word cloud below. It is possible that negative or unrelated words may appear since these words have been taken out of context, and they may not indicate the respondent’s intended meaning. Respondents from West Valley City indicated great value for the community’s cultural diversity. The city’s central location, providing easy access to work, shopping, and recreational activities, was also highly valued by respondents as well.
Local Environmental Quality in West Valley City
The 74% of respondents who rated the Local Environmental Quality domain as 1, 2, or 3 (Poor, Fair, or Moderate) were further asked if there are specific aspects of local environmental quality that they feel are problematic. Overall local environmental quality was described as dirty, unkept, and unsafe. Respondents expressed concern about the cleanliness of green spaces, sidewalks, buildings, etc. Air quality was a major concern with inversions, air pollution from vehicles, and power plants as main points.
Improving Wellbeing in West Valley City
Survey respondents were asked if there is anything that could be done to improve wellbeing in West Valley City. Respondents indicated strong concerns about transportation, emphasizing the need for better road conditions, improved traffic control, and enhanced public transit options. Specific issues included dangerous intersections, poor road maintenance, and inadequate bus services, which were indicated as contributing to congestion and safety concerns. There was a call for more sidewalks, bike paths, and walkable areas.
Additional Comments
Respondents were also asked if they had any additional comments on wellbeing in West Valley City. Respondents generally expressed pride in their community, noting it as a great place to live. However, there were strong concerns about safety, with specific mentions of gang activity and crime affecting the sense of security, particularly for women and children. Many respondents called for more green spaces, parks, and better maintenance of public areas, especially in less developed parts of the city. Infrastructure issues such as poor road conditions and the need for more street lighting and cleanliness were frequently mentioned. There was a desire expressed for more inclusive development that benefits all community members, including better support for the elderly and disabled.