West Bountiful Wellbeing Survey Findings 2024
By Dr. Courtney Flint and Team
![]()
Contact Information
Dr. Courtney Flint
courtney.flint@usu.edu
435-797-8635
Summary
West Bountiful is one of 51 cities participating in the Utah Wellbeing Survey Project in 2024. This project is designed to assess the wellbeing and local perspectives of city residents and to provide information to city leaders to inform general planning processes. Additional analysis is underway and this report may be updated over time.
We are grateful to all those who took the survey and to our city partners who helped to make this possible. We are grateful to a number of entities for funding: the Utah League of Cities and Towns, USU Extension, USU’s Institute for Land Water and Air, the Wasatch Front Regional Council, Utah Department of Transportation, the Utah Agricultural Experiment Station, and the cities of Alpine, Cedar Hills, Draper, Millcreek, Nephi, North Salt Lake, Ogden, Orem, Pleasant Grove, Providence, Springdale, Tremonton, West Bountiful, and West Valley City.
This report describes findings from the 2024 West Bountiful survey and comparative information with other project cities. From late February to mid-April 2024, West Bountiful City advertised the survey for residents largely through social media, flyers, quarterly newsletters, and the city marquee. All city residents age 18+ were encouraged to take the online Qualtrics survey.
How many people responded?
- 295 viable surveys were recorded in this 2024 survey effort.
- The adult population of West Bountiful was estimated at 4,290, based on the American Community Survey by the U.S. Census. The 295 survey responses in 2024 represent 6.9% of the adult population and have a conservative margin of error of 5.51%.
Survey Respondent Characteristics
| Resident Statistics | |
|---|---|
| Full Time Residents of West Bountiful | 98.0% |
| Part Time Residents of West Bountiful | 2.0% |
| Length of Residency — Range | 0.5-72 years |
| Length of Residency — Average | 20.5 years |
| Length of Residency — Median | 18 years |
| Length of Residency 5 Years or less | 14.3% |
| ZIP Code | Percent |
|---|---|
| 84010 | 1.4% |
| 84087 | 98.6% |
| City Area | Percent |
|---|---|
| East of 800 W, North of Pages Lane | 27.5% |
| East of 800 W, South of Pages Lane | 32.0% |
| West of 800 W | 40.5% |
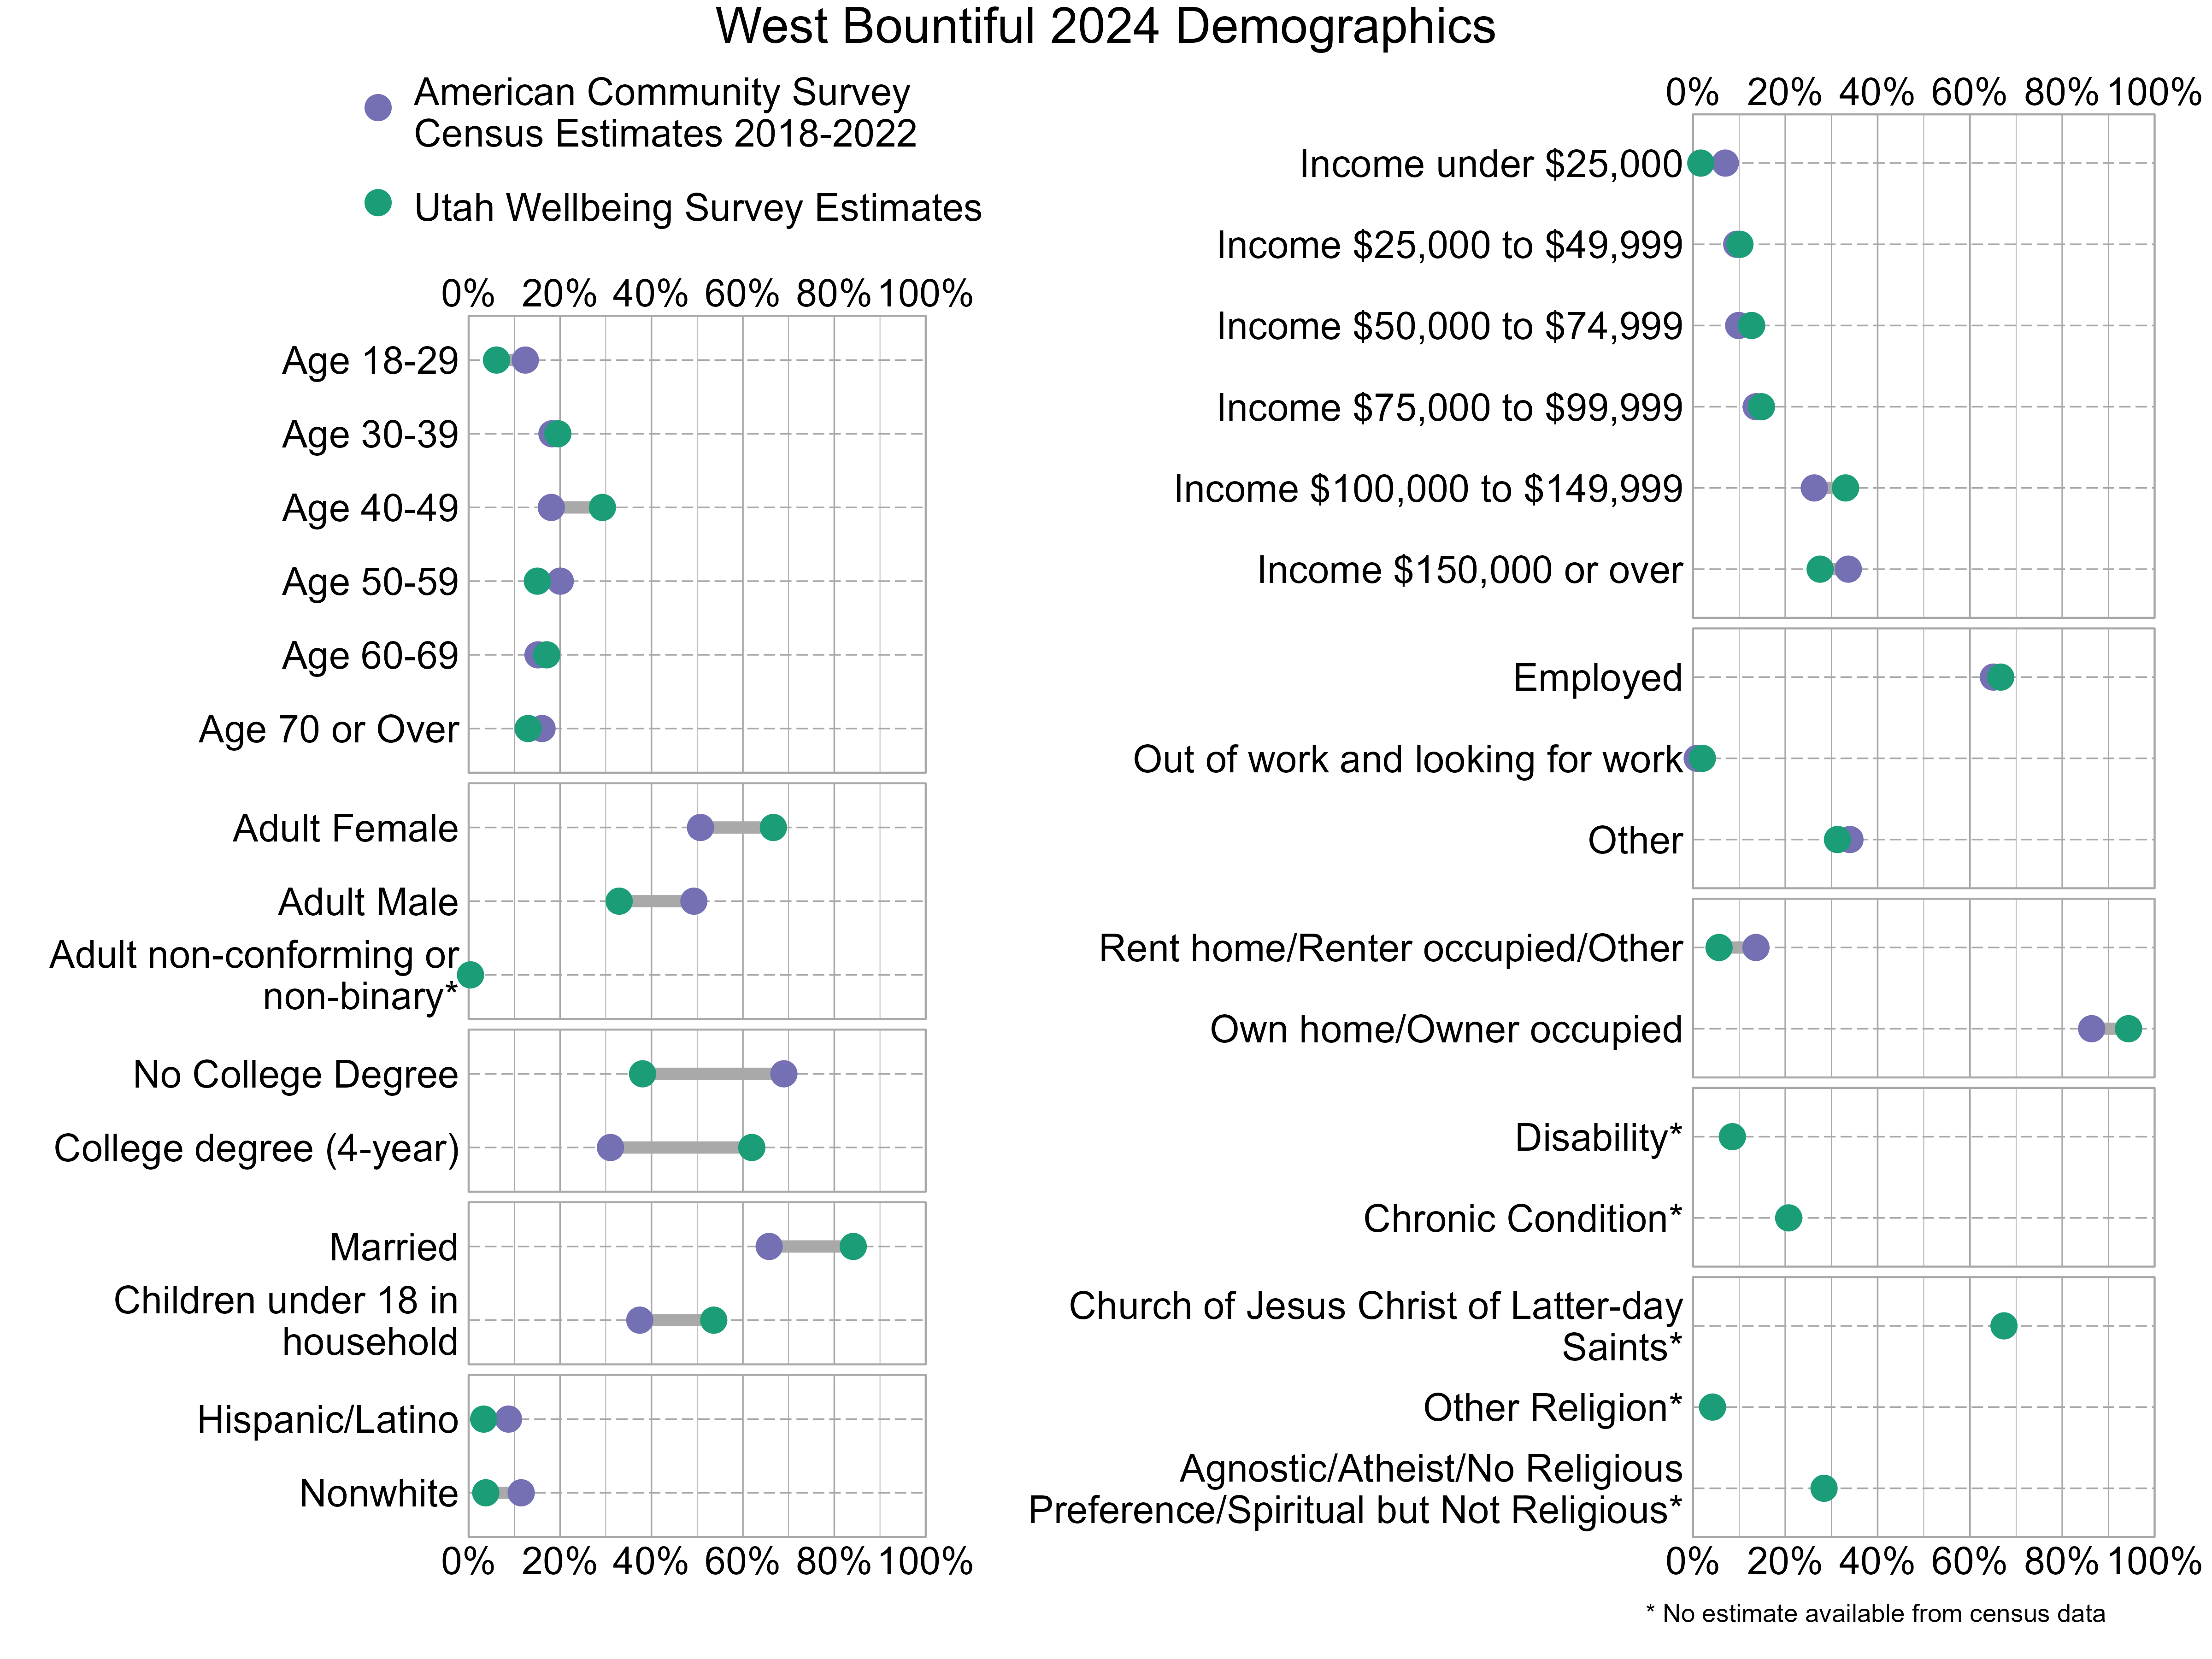
Demographic characteristics of the survey respondents were compared below with U.S. Census information from the 2018-2022 American Community Survey. In the graph below, gray bars indicate differences between the American Community Survey estimates and the Utah Wellbeing Project surveys. The wider the gray bars, the larger the differences. Also note that estimates for religious affiliation, adult non-conforming or non-binary gender, disability, and chronic conditions are unavailable from the census data. There can also be a variable margin of error in the American Community Survey estimates, and caution should be used when comparing estimates. Not all respondents provided demographic information. As the graph shows, 2024 survey respondents were not fully representative of West Bountiful. People who are adult females, have at least a 4-year college degree, are married, and have children under 18 in their household were overrepresented while those who are adult males and do not have a college degree were underrepresented.
Overall Personal Wellbeing and Overall Wellbeing in West Bountiful
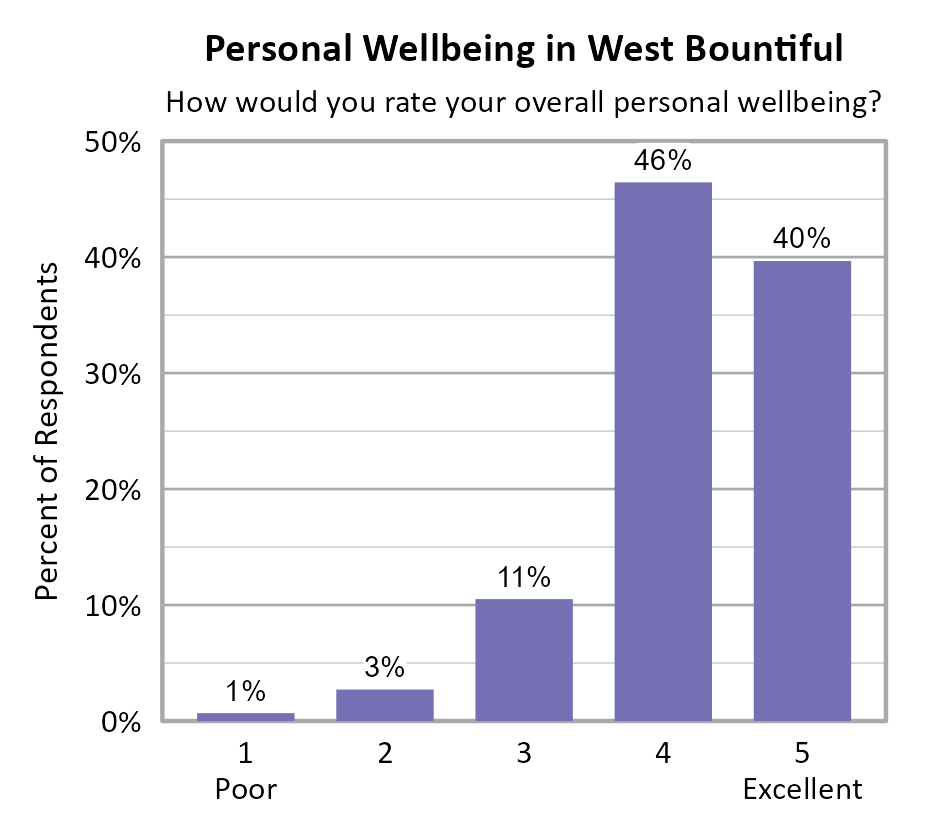
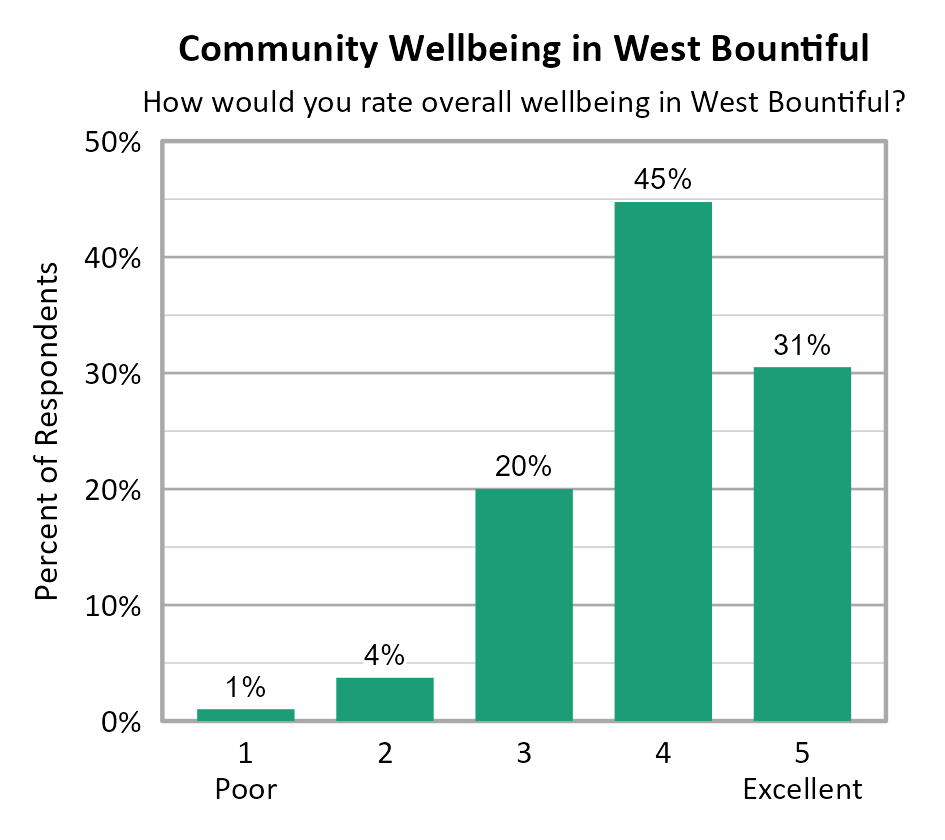
Survey participants were asked about their overall personal wellbeing and overall community wellbeing in West Bountiful. These wellbeing indicators were both measured on a 5-point scale from poor (1) to excellent (5). The average personal wellbeing score in West Bountiful was 4.22 with 86% of respondents indicating their wellbeing at a 4 or 5 on the 5-point scale. The average score for community wellbeing in West Bountiful was 4.00 with 75% of respondents indicating community wellbeing at a 4 or 5 on the 5-point scale. No statistically significant differences were found across areas of West Bountiful for overall personal and community wellbeing scores.
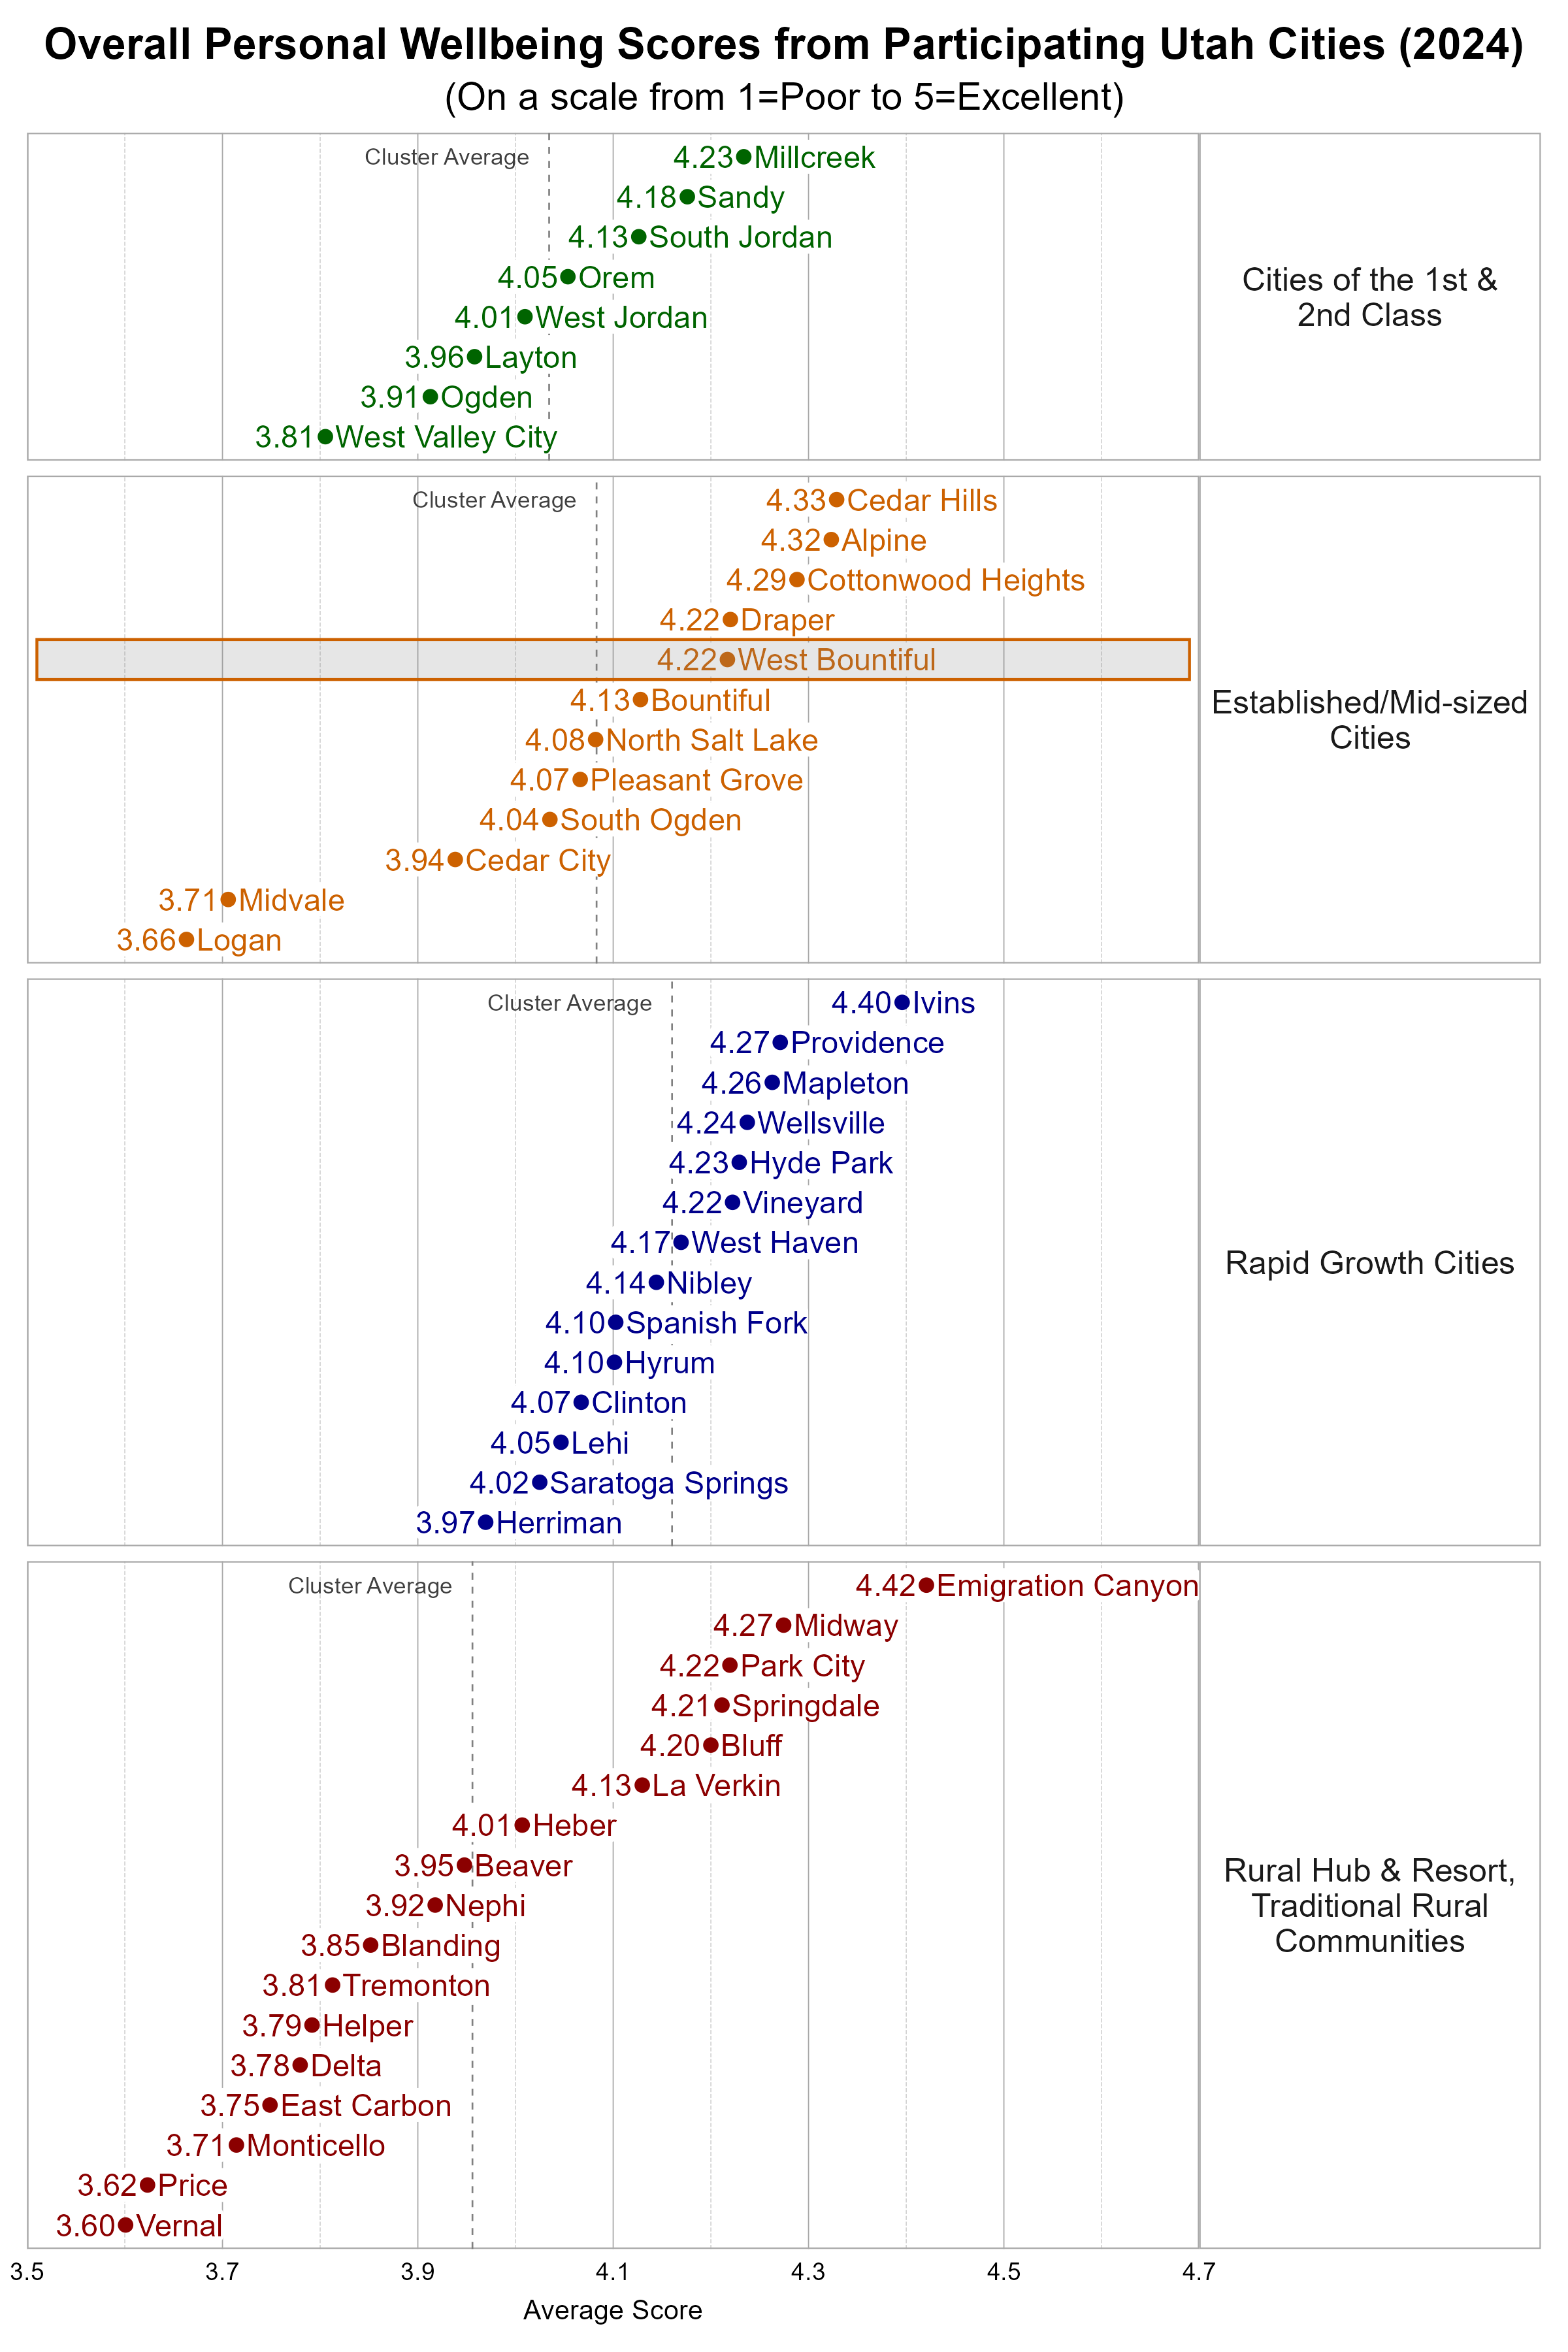
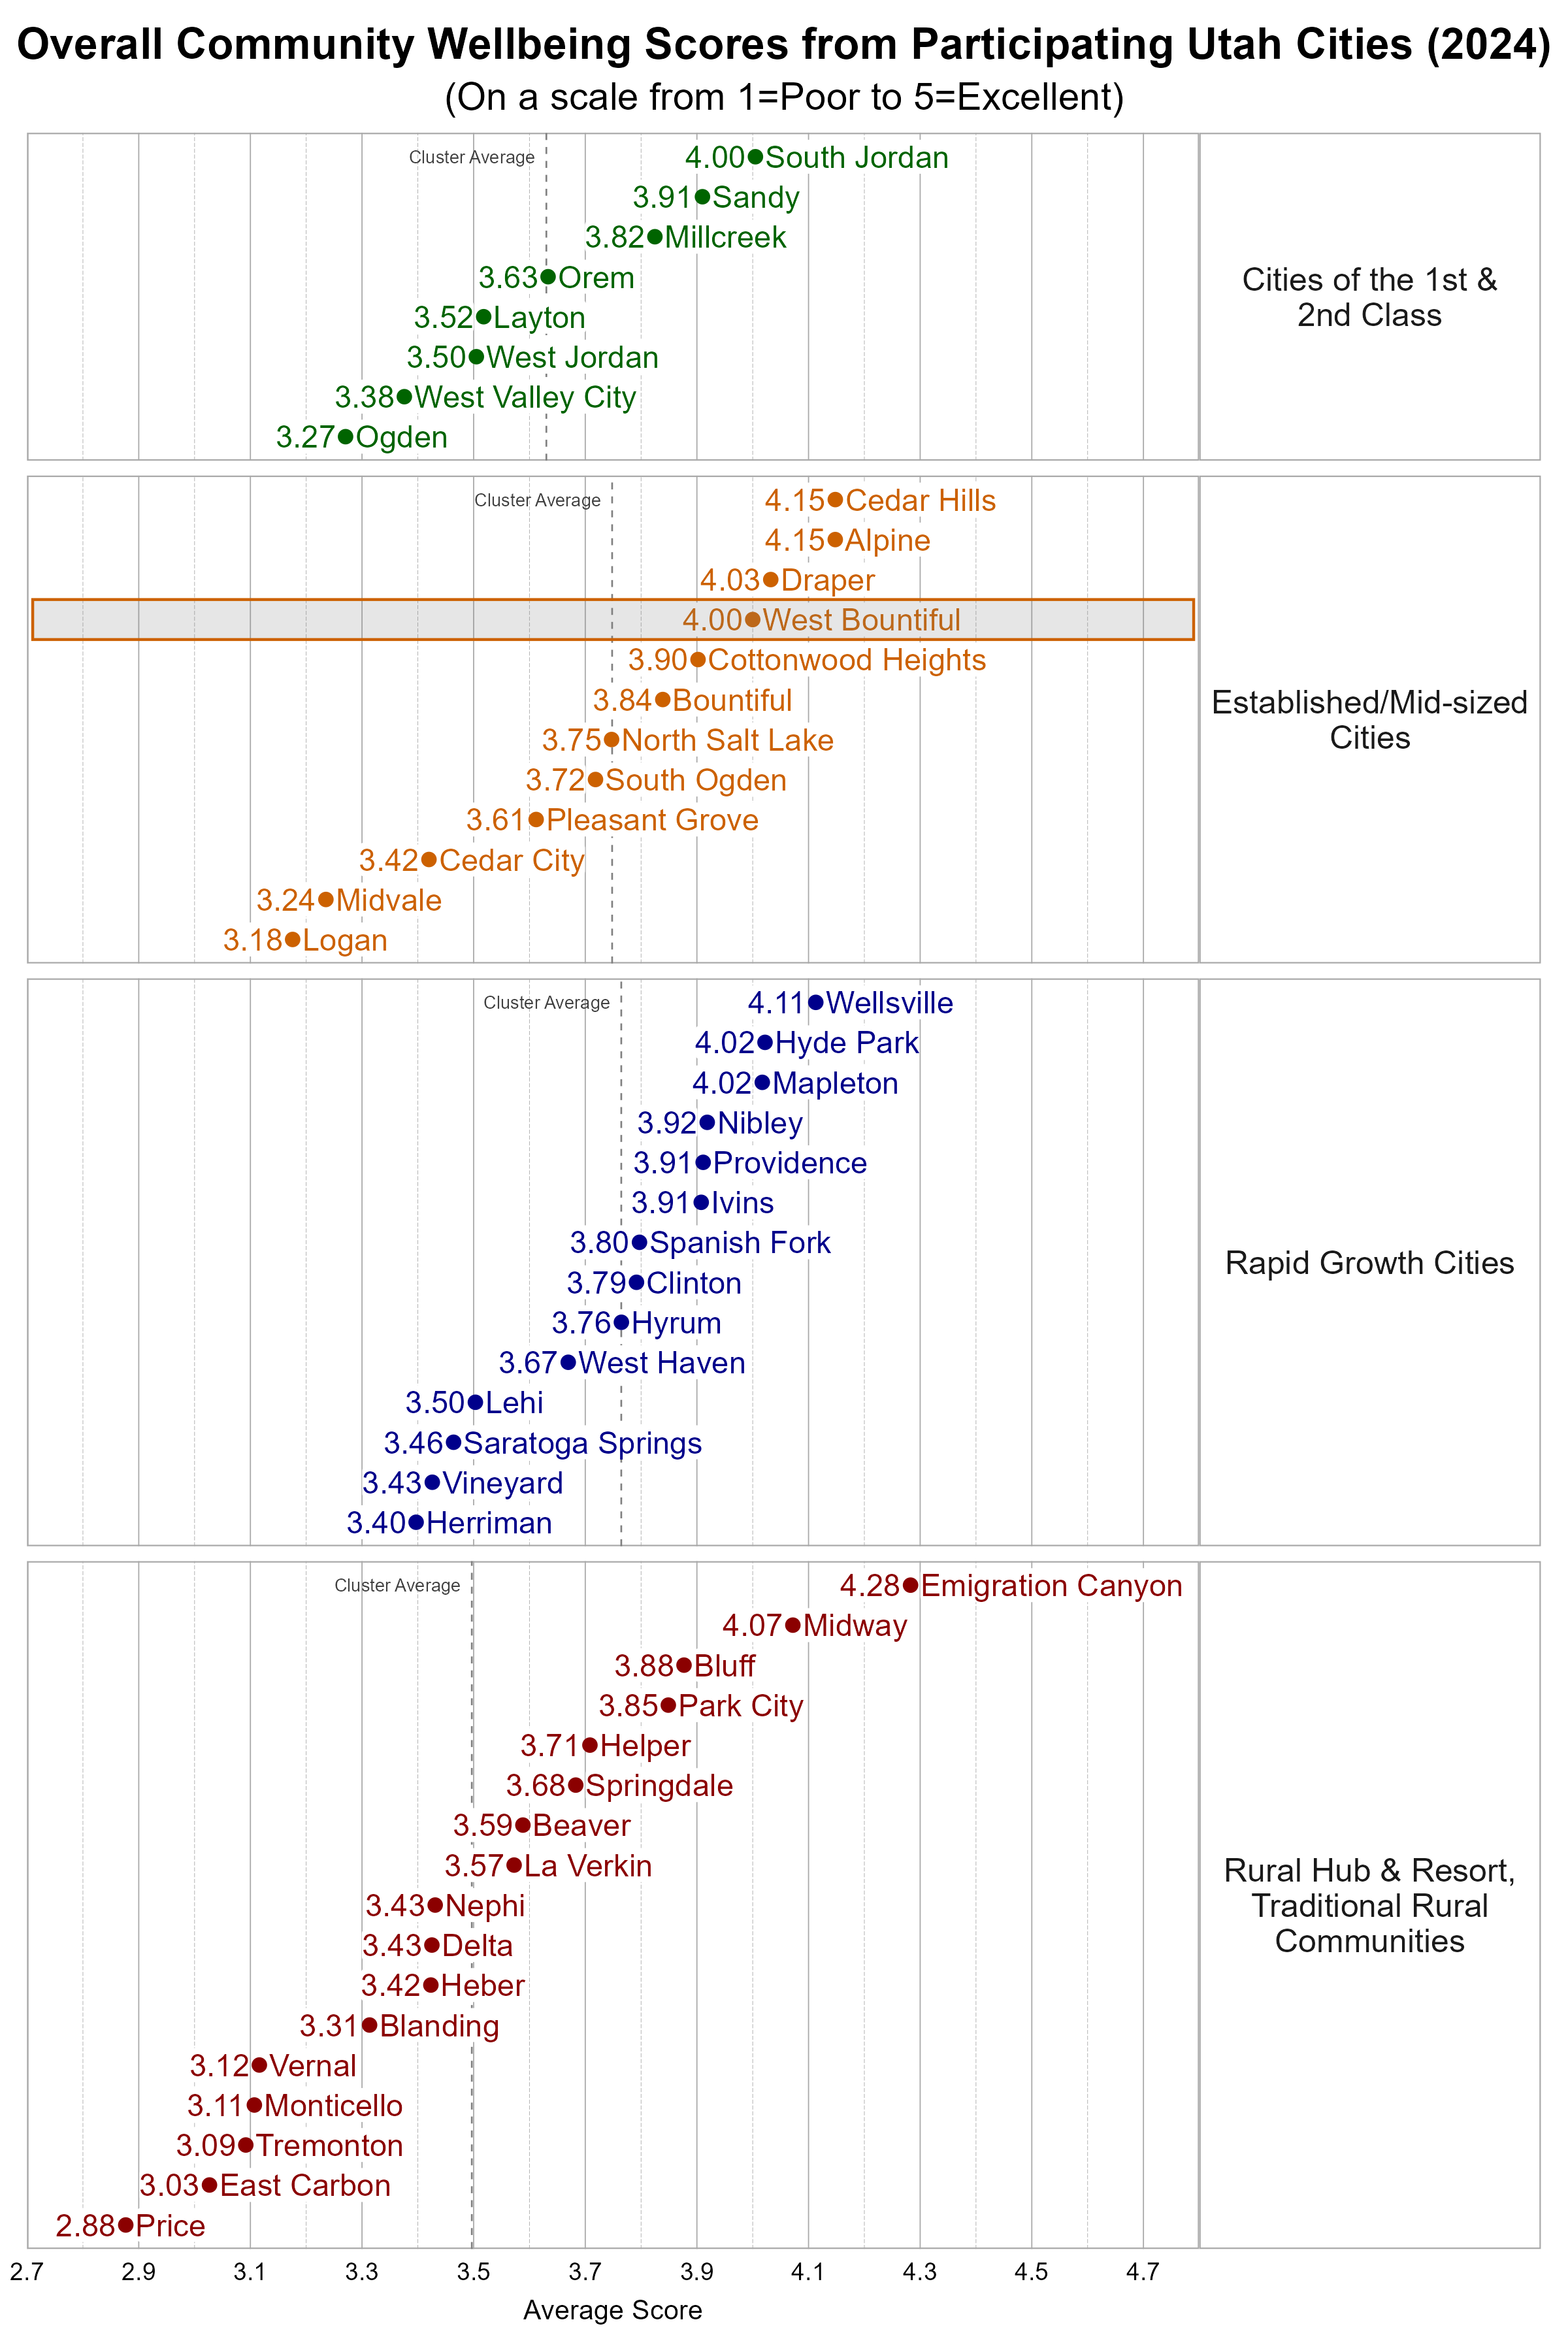
Comparing Wellbeing Across Utah Cities
The Utah League of Cities and Towns clusters cities and towns into five different categories based on size and growth rates. We utilize these clusters in our analysis. West Bountiful is classified as an Established/Mid-sized City. Some cities may fit within more than one cluster.
Within the more Urban city cluster, West Bountiful was above the average overall personal wellbeing score and above the average overall community wellbeing score.
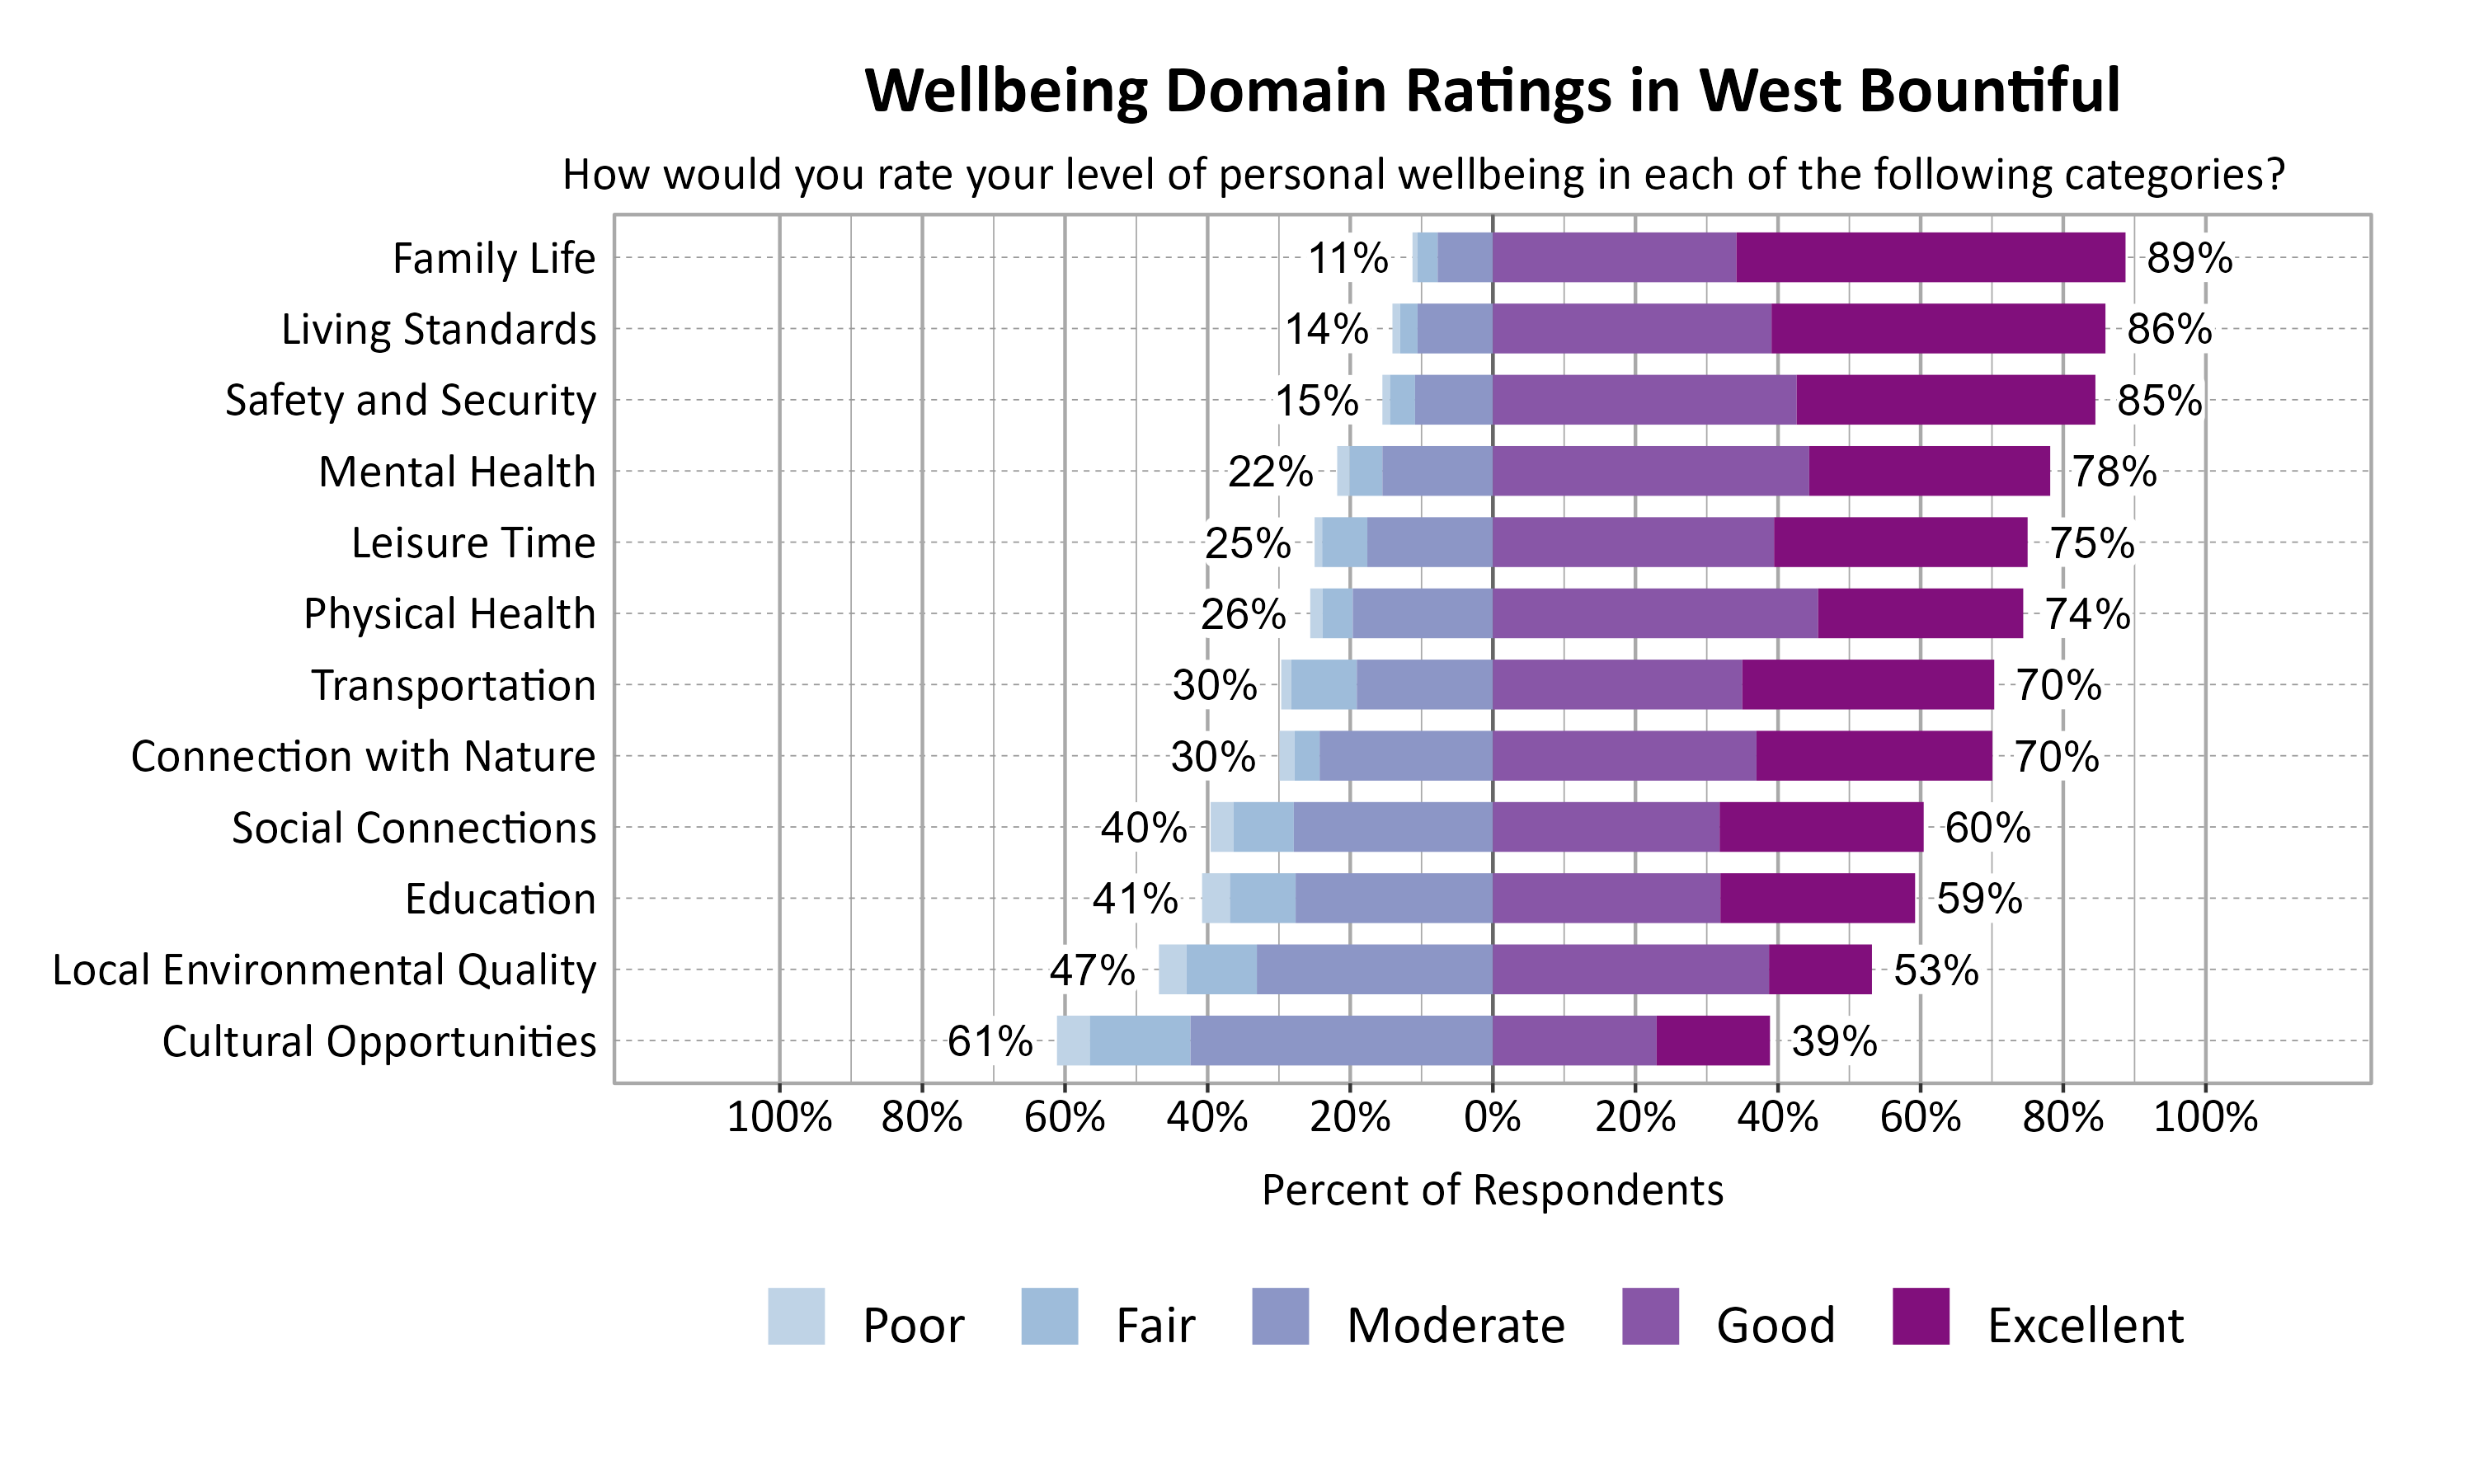
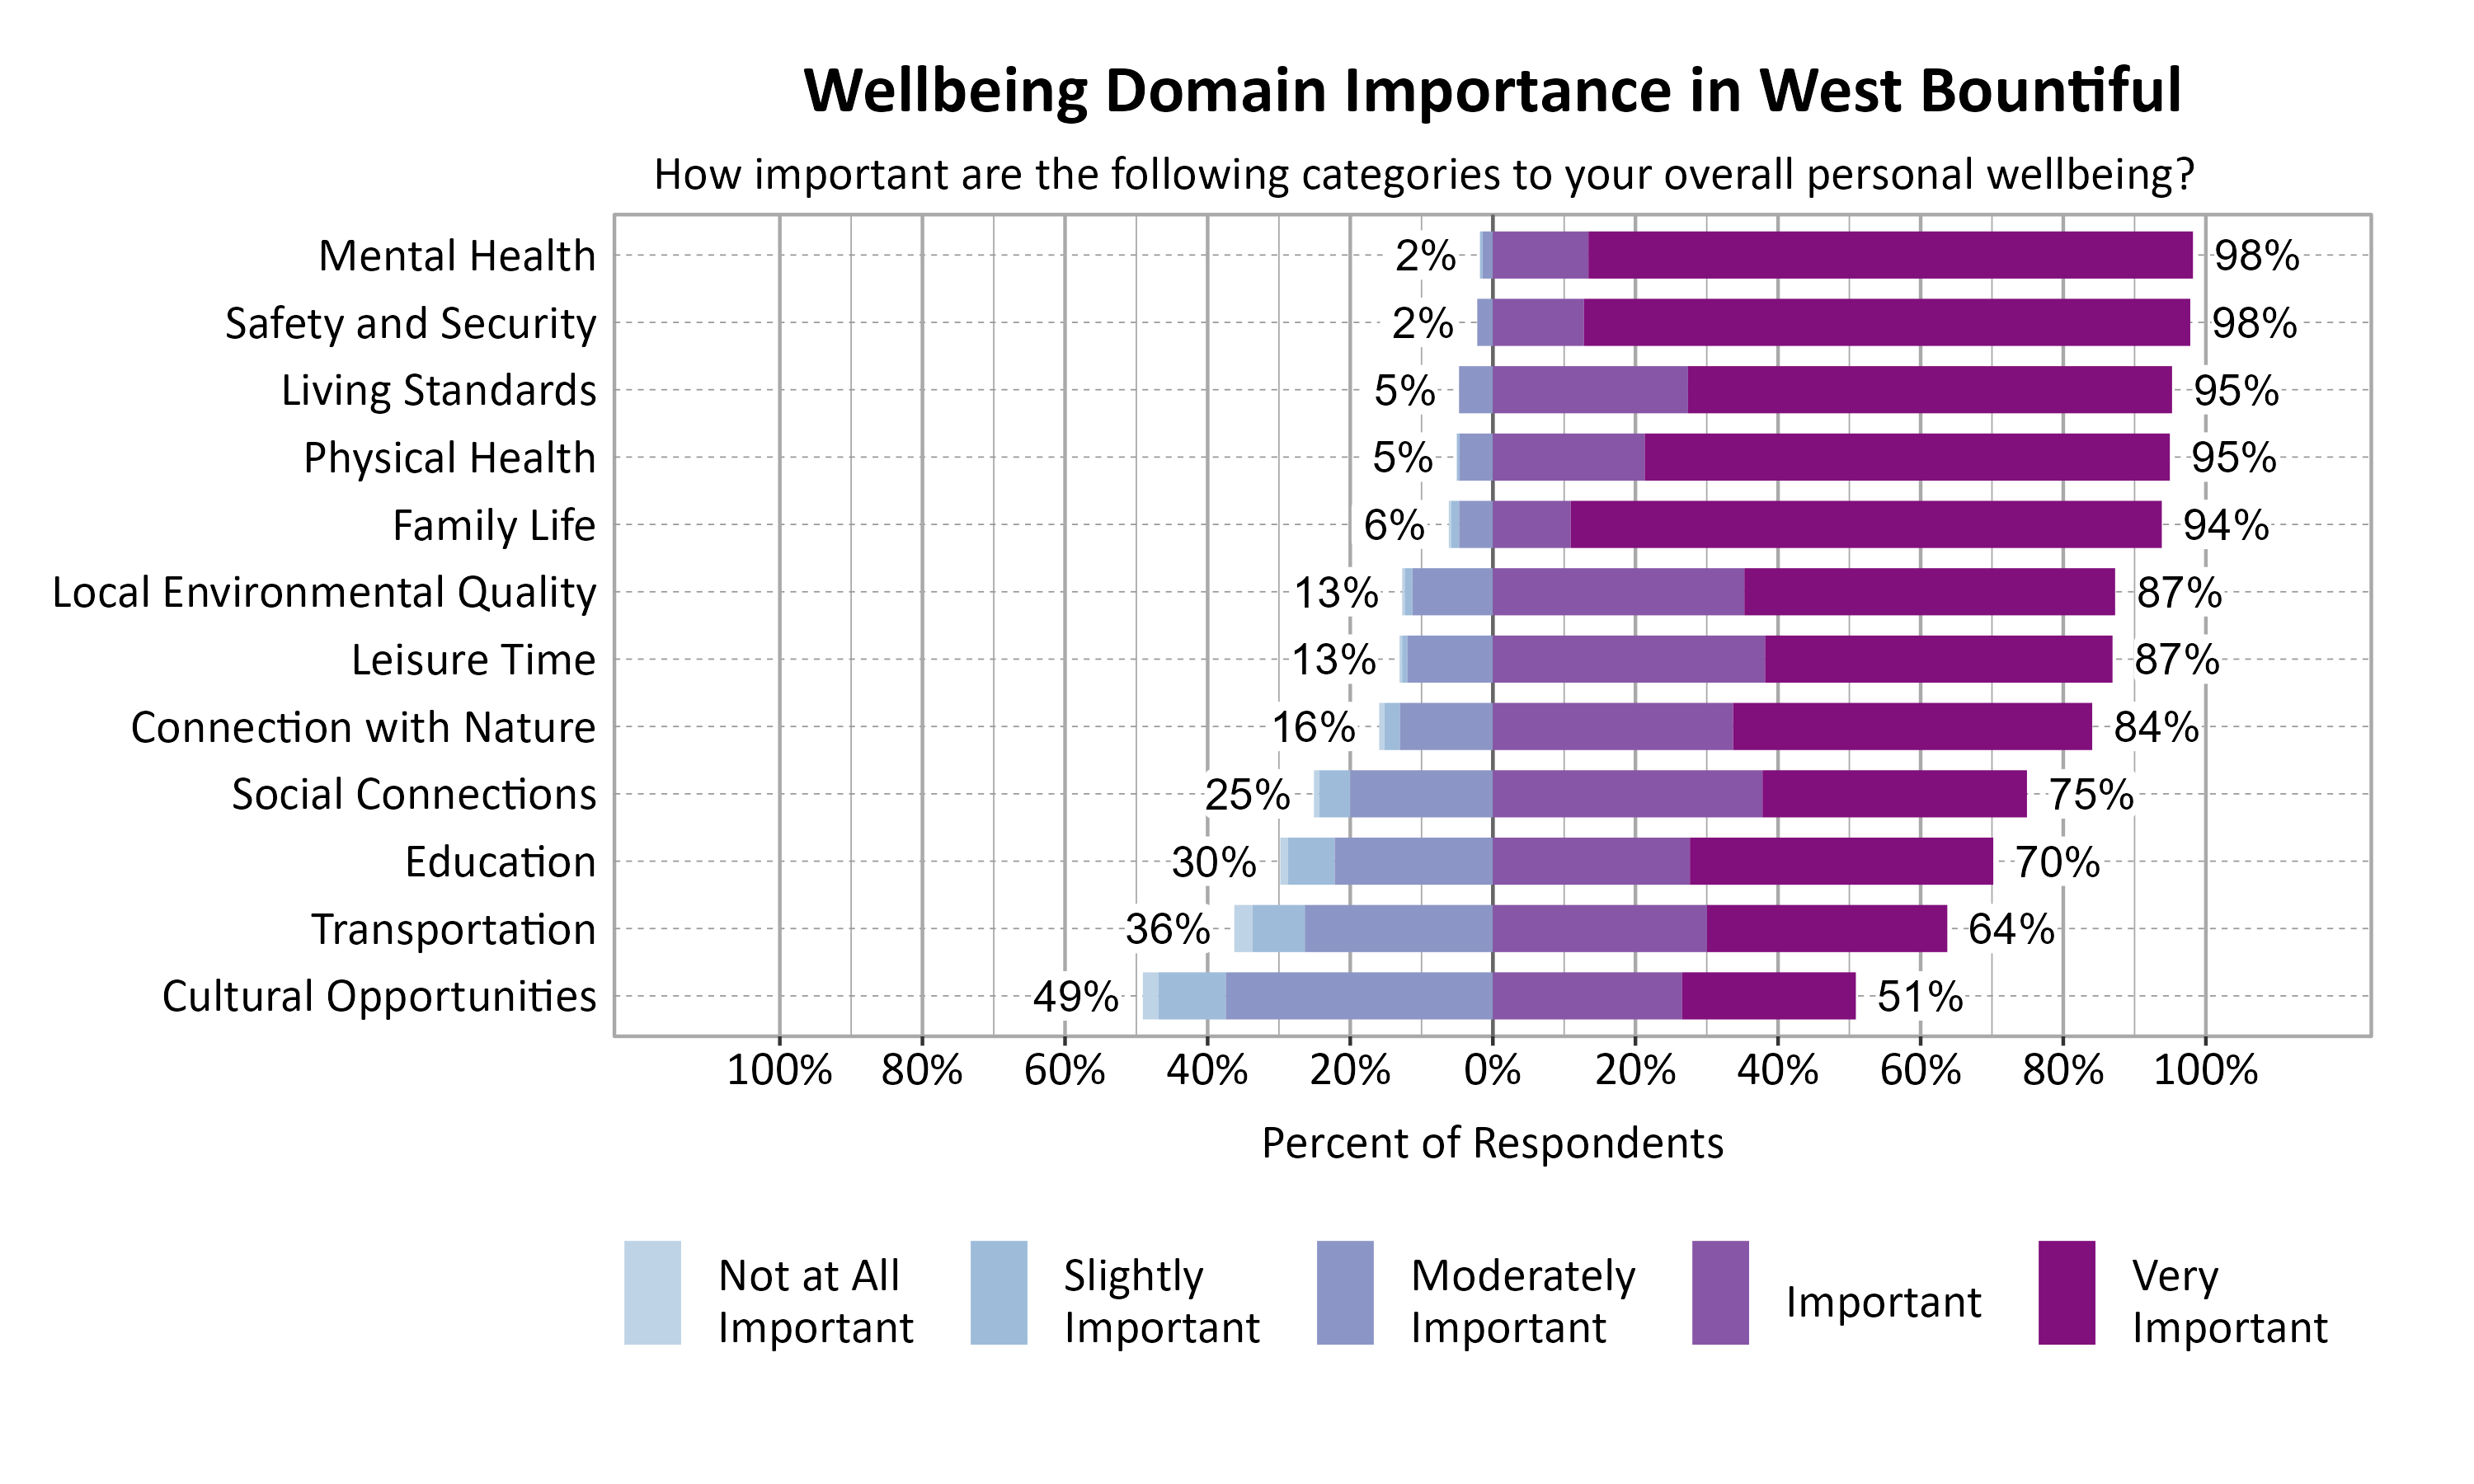
Wellbeing Domains in West Bountiful
According to national and international entities that track wellbeing, there are a number of common dimensions or domains of wellbeing. Survey respondents rated twelve domains on a 5-point scale from poor to excellent. They were also asked to indicate the importance of each domain to their overall personal wellbeing on a 5-point scale from not at all important to very important. The highest rated wellbeing domains for respondents in West Bountiful were Family Life (89%), Living Standards (86%), and Safety and Security (85%). The most important wellbeing domains were Mental Health (98%), Safety and Security (98%), Living Standards (95%), Physical Health (95%), and Family Life (94%).
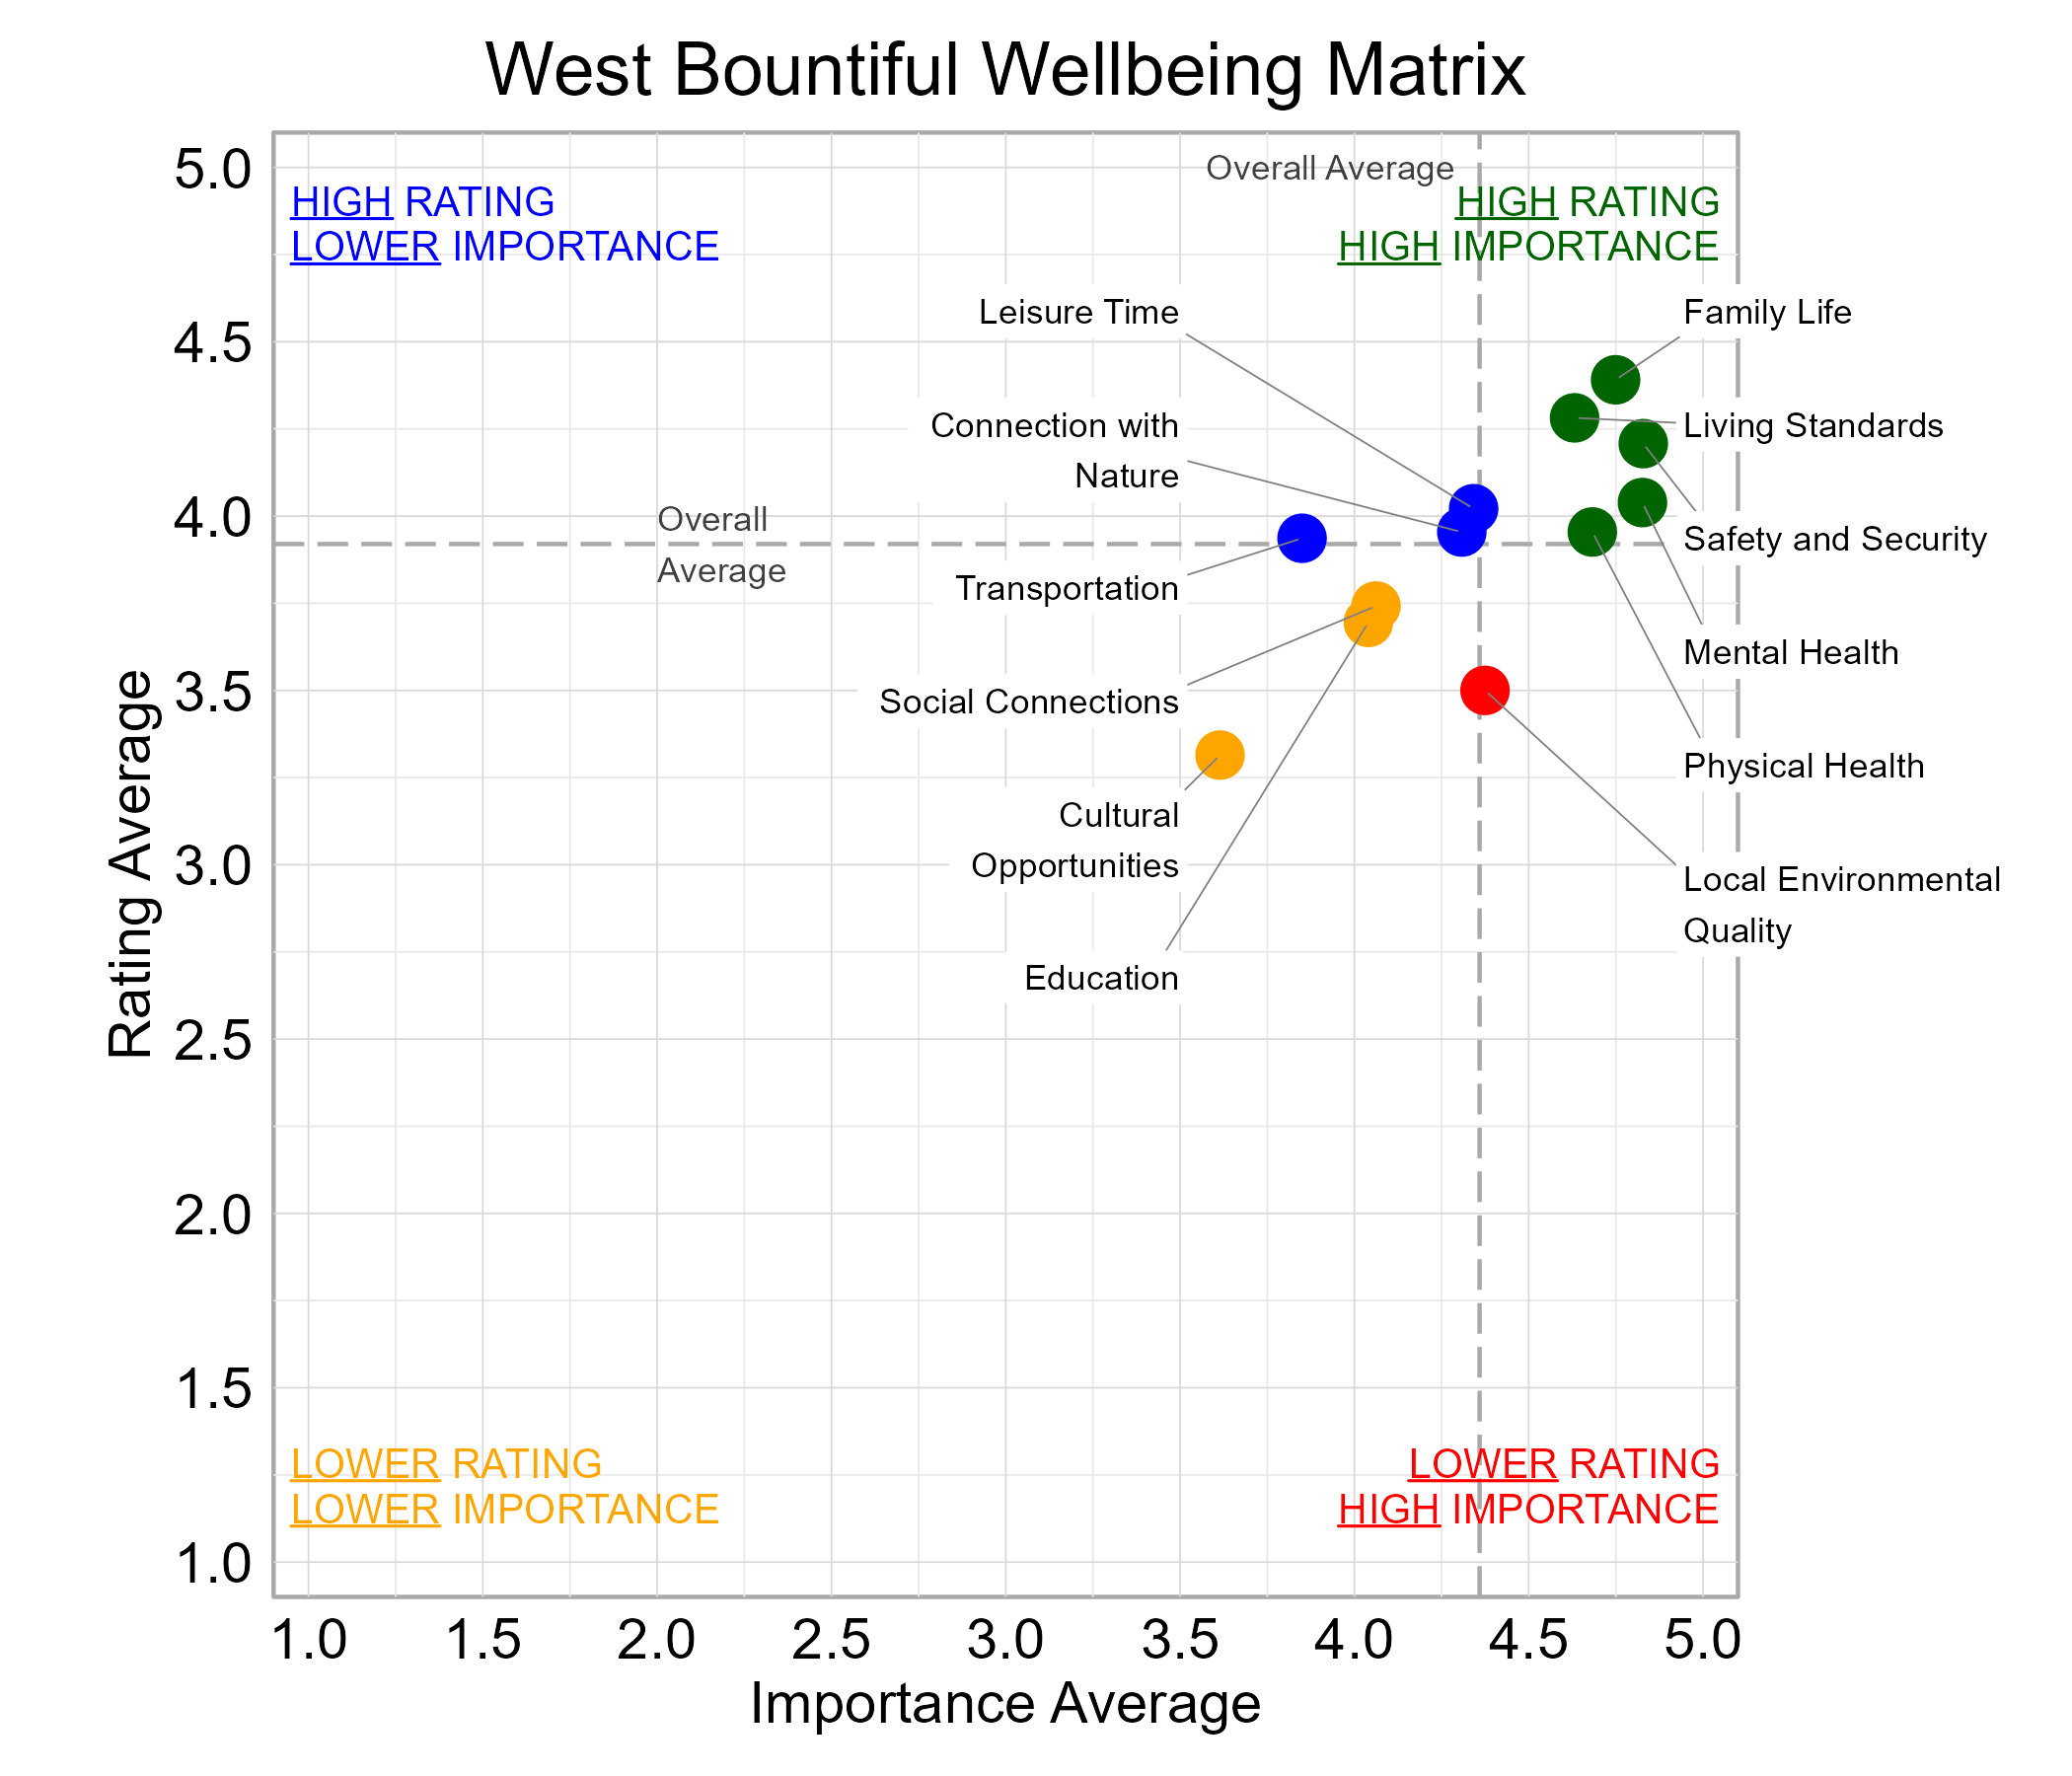
Wellbeing Matrix for West Bountiful
The graph below illustrates the relationship between the average rating and the average importance of wellbeing domains for survey respondents from West Bountiful. Family Life, Living Standards, Mental Health, Physical Health, and Safety and Security were highly important and rated above average among the domains. Local Environmental Quality fell in the “red zone” of higher importance and lower ratings.
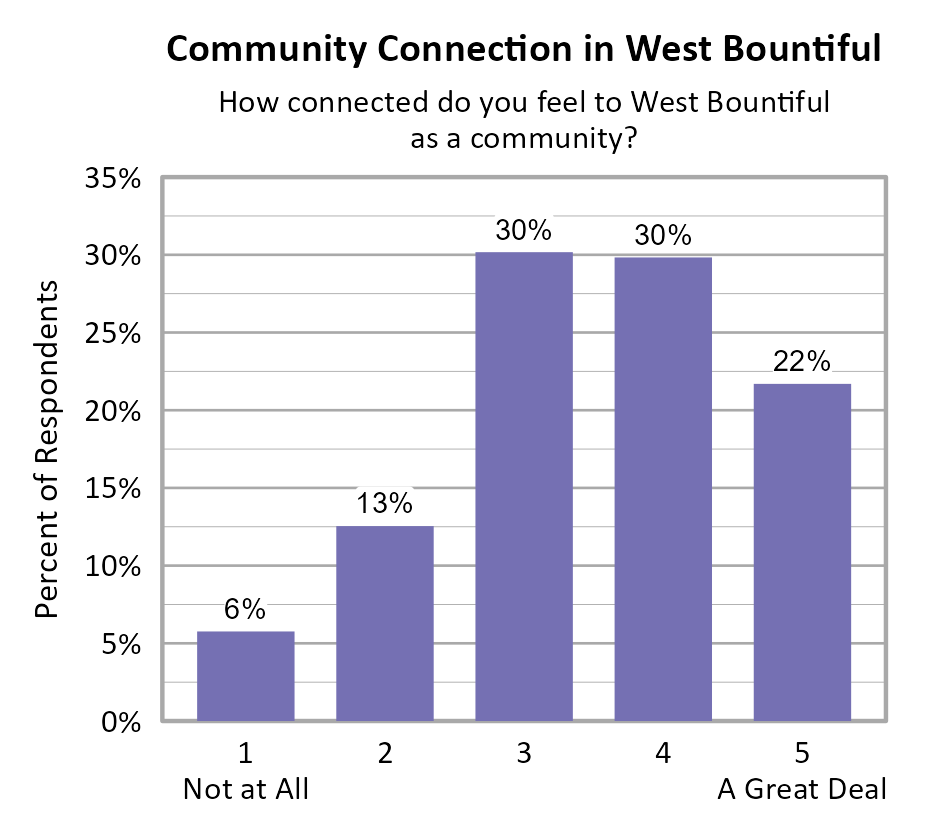
Community Connection in West Bountiful
Survey participants were asked about how connected they feel to West Bountiful on a 5-point scale from not at all (1) to a great deal (5), and the average score of all respondents was 3.49. No statistically significant difference was found across areas of West Bountiful for community connection scores.
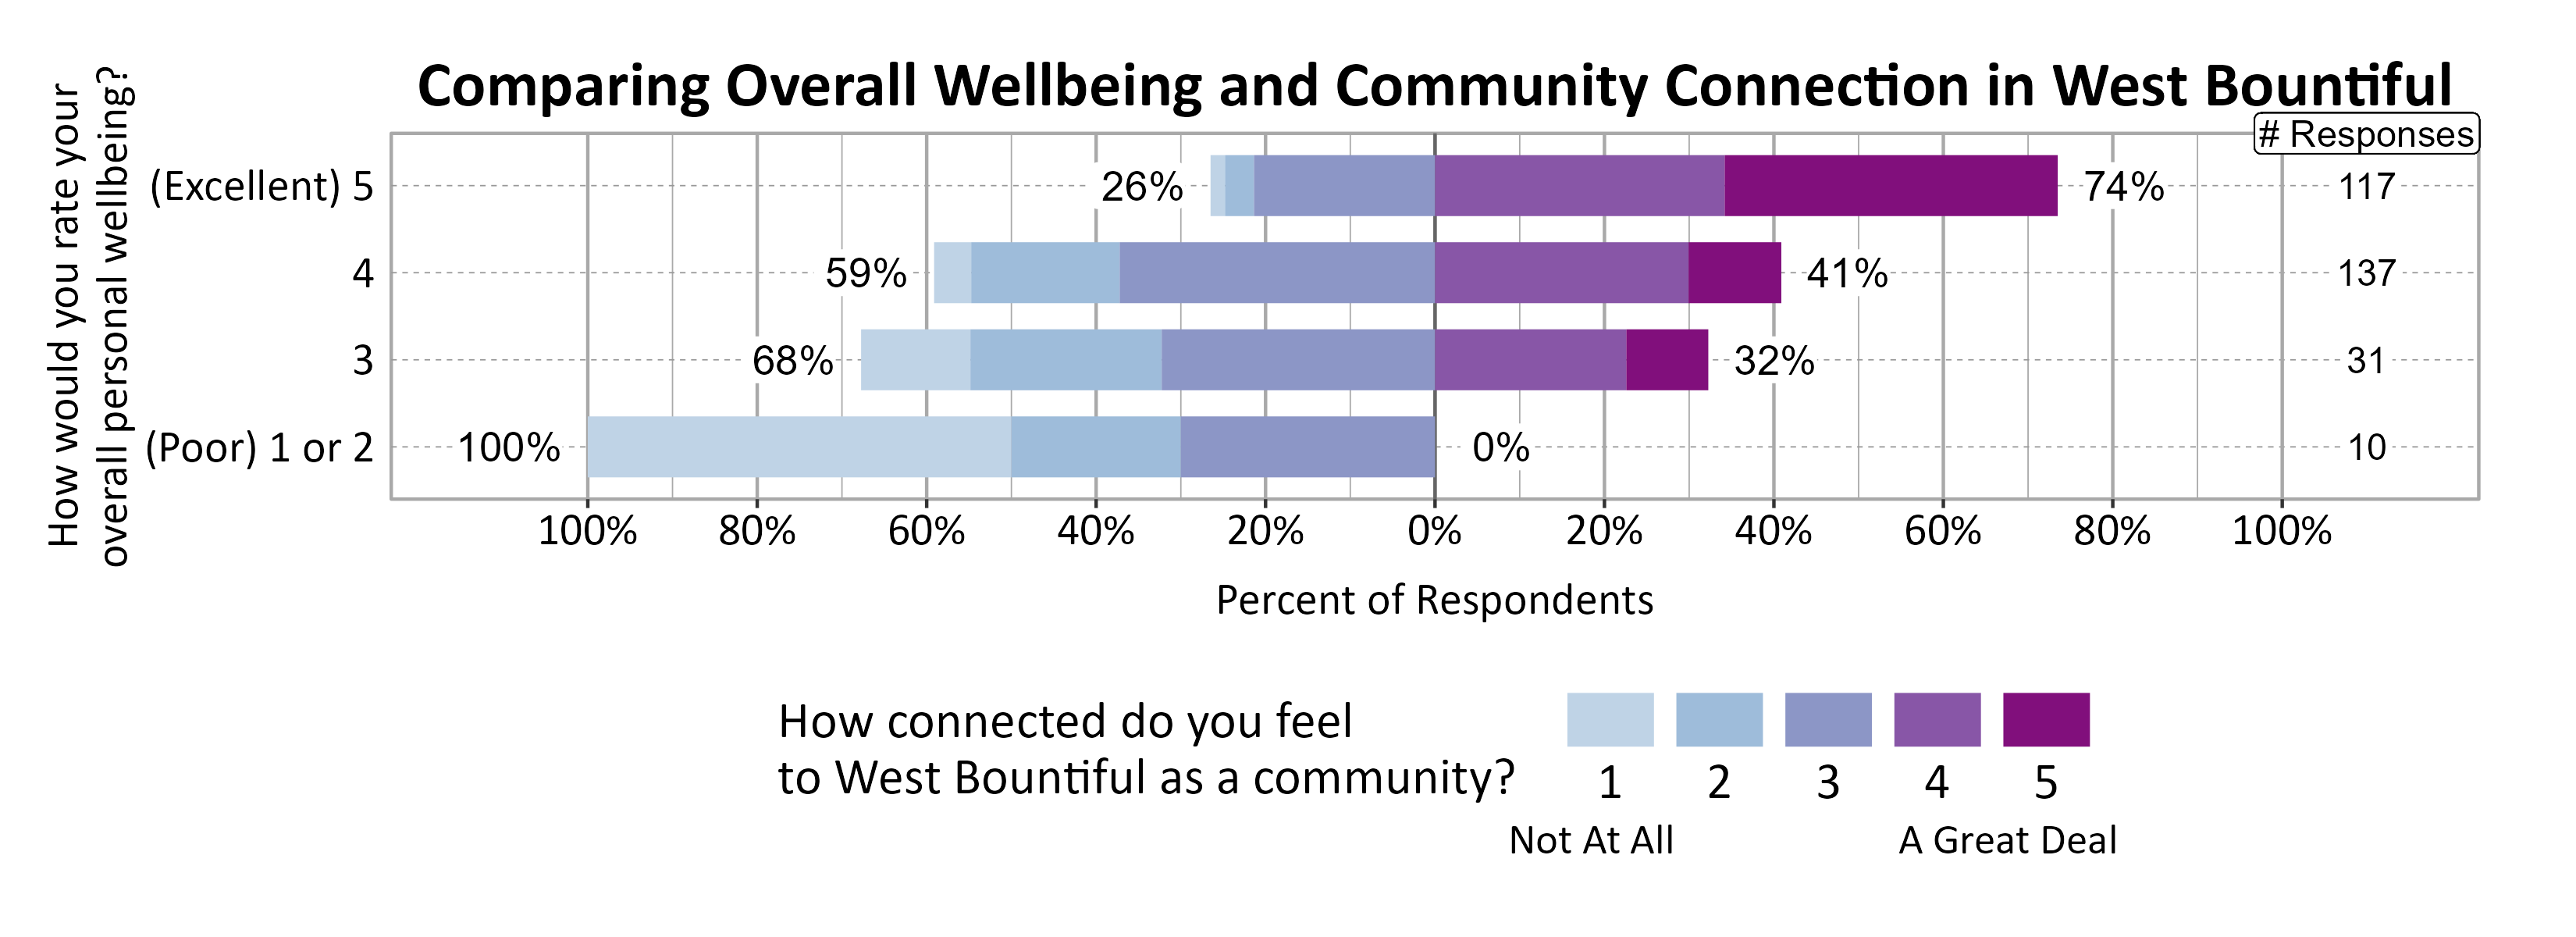
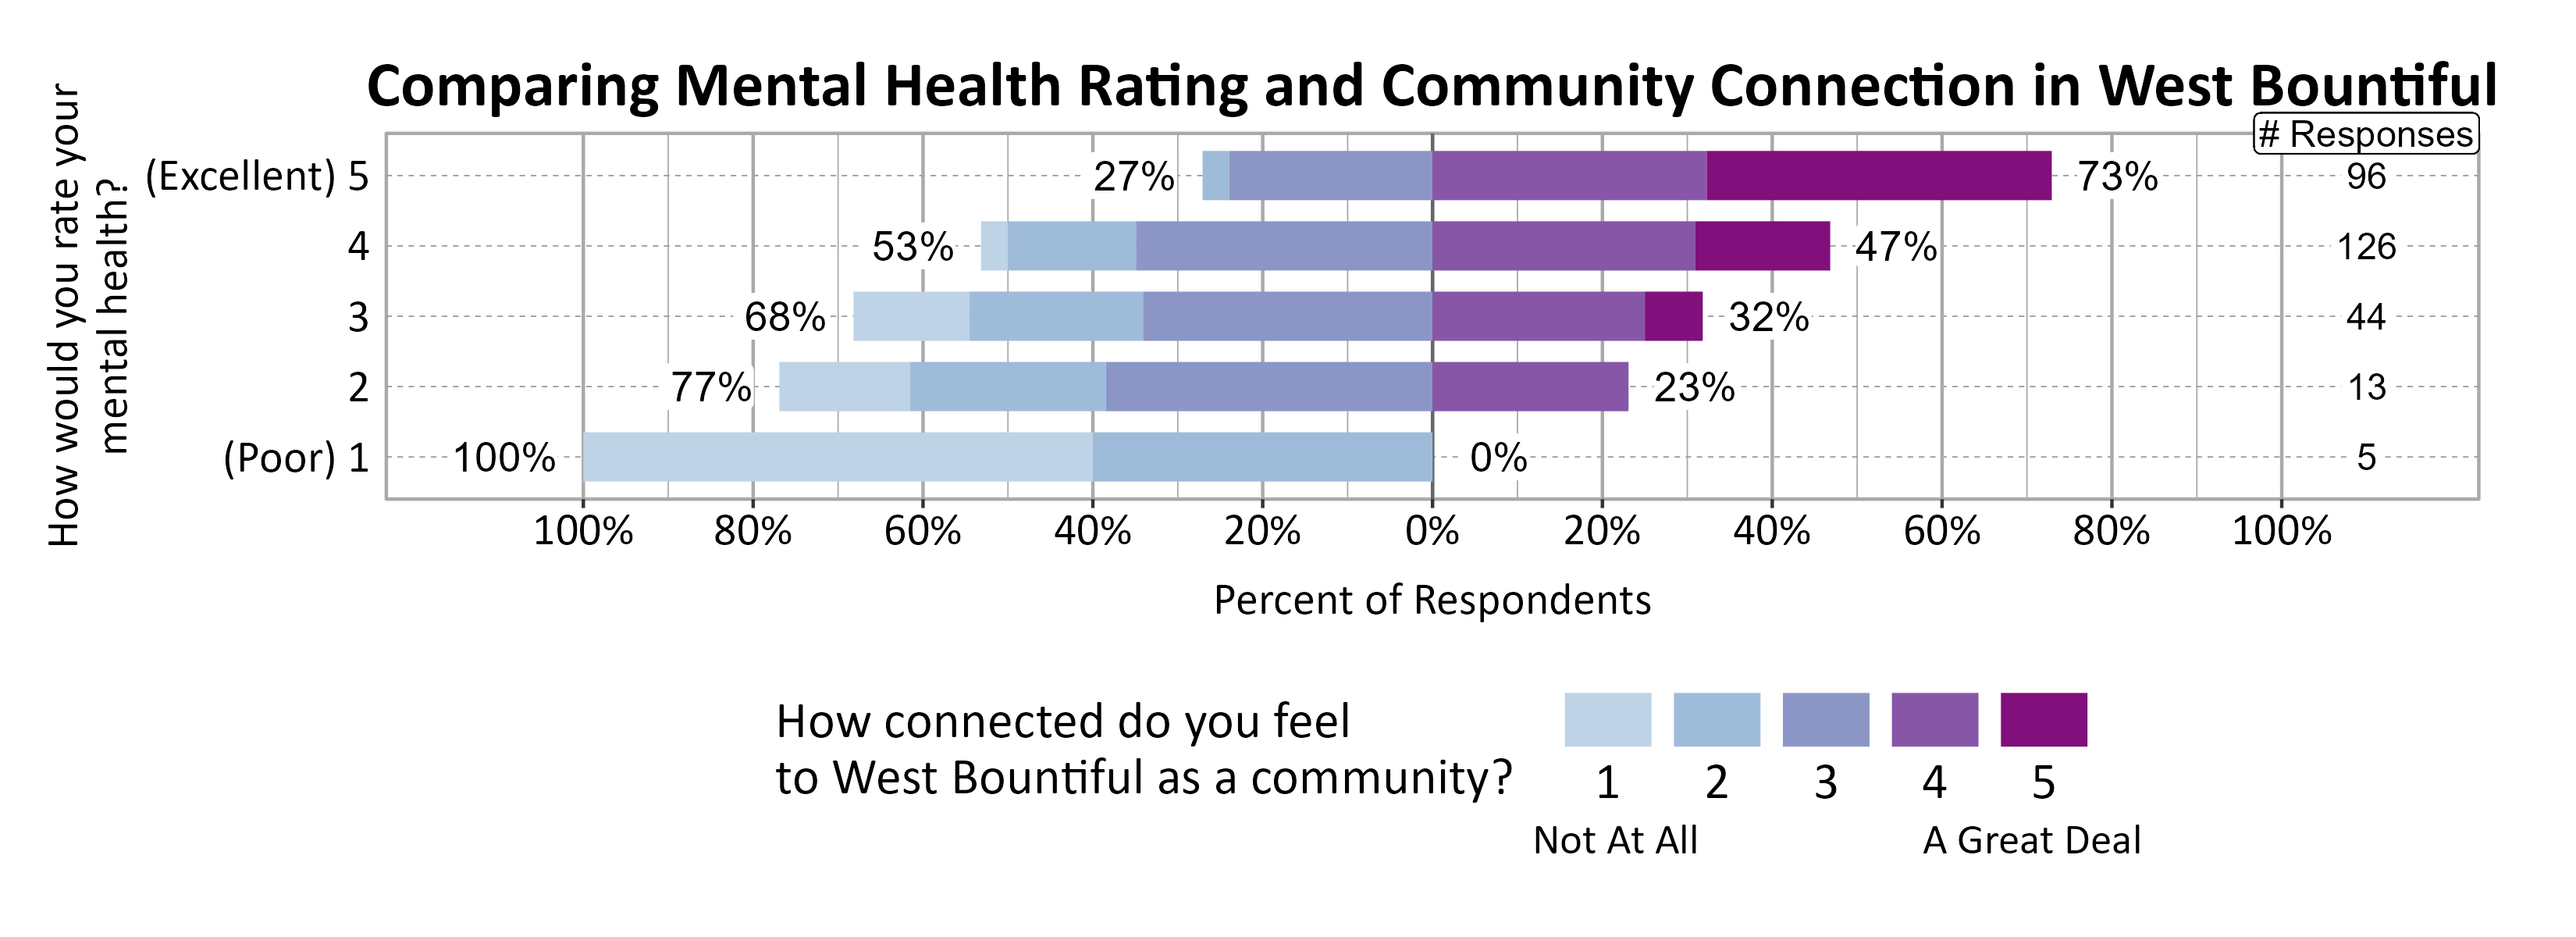
A positive relationship was found between individuals’ community connection and overall personal wellbeing as well as mental health.
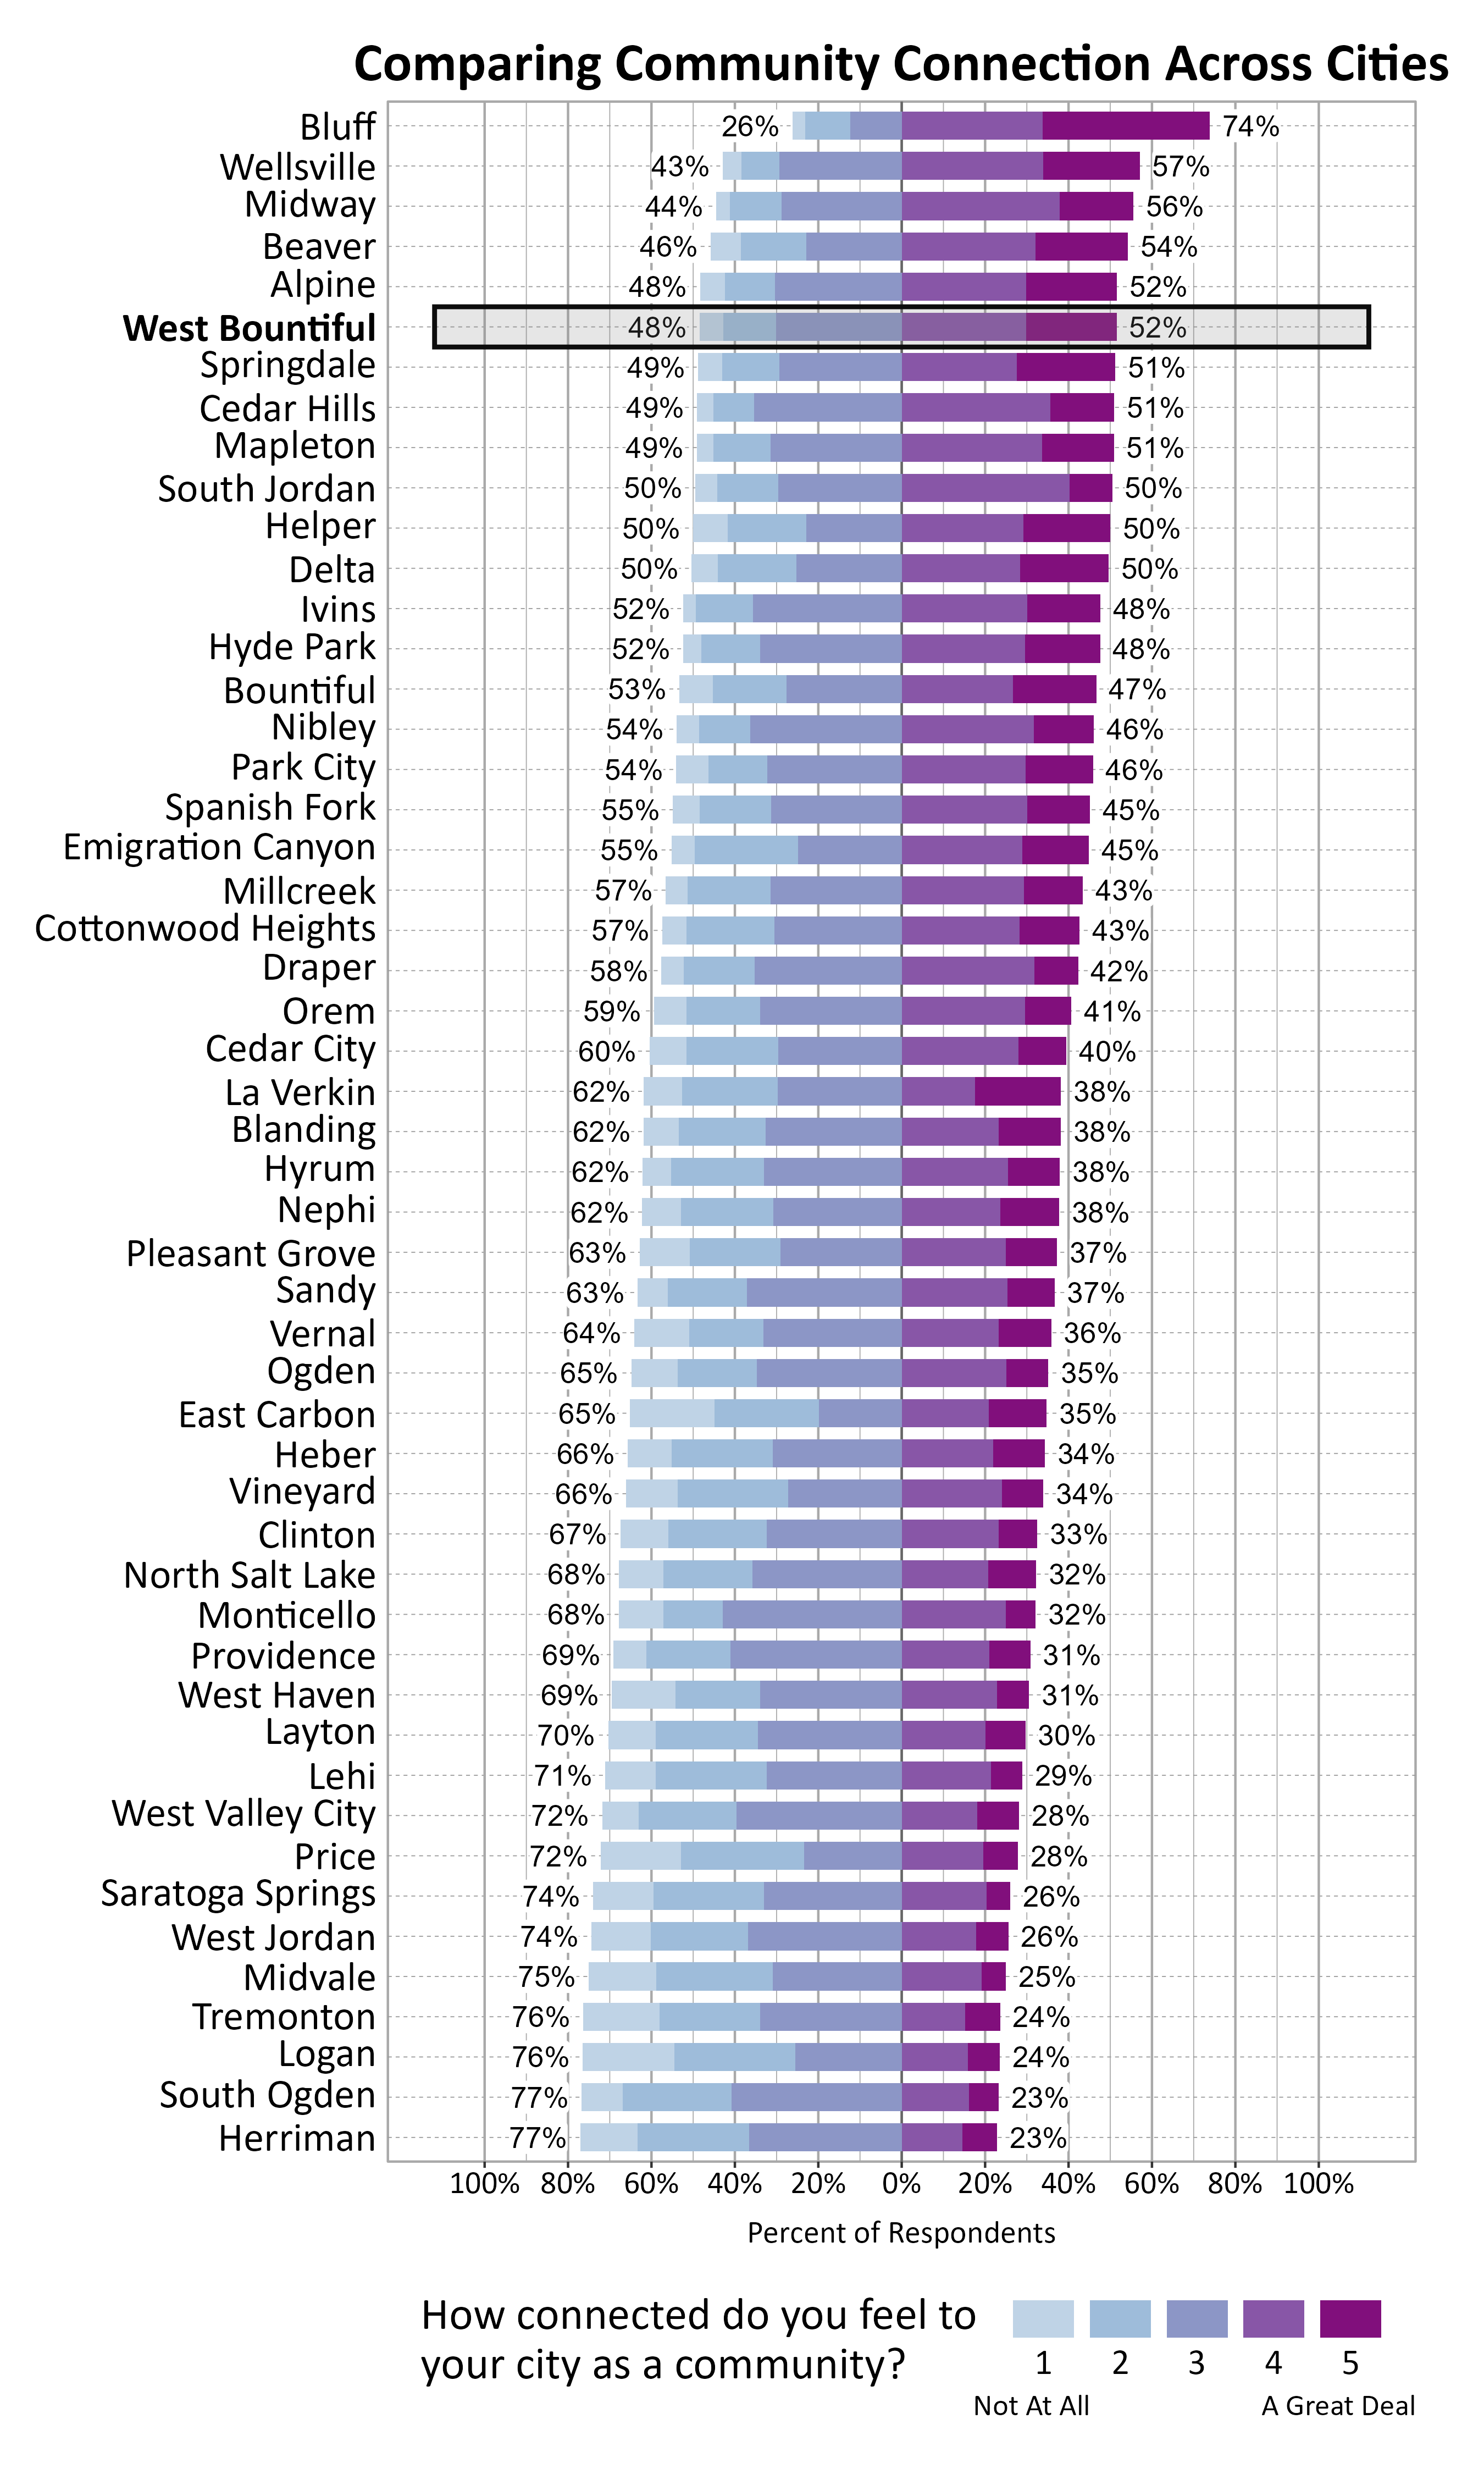
The graph below shows how Wellbeing Project cities and towns compare on feelings of community connection based on the percentage of respondents who answered 4 or a 5 on a 5-point scale from “not at all” to “a great deal” connected to their city or town. West Bountiful ranked 6 out of the 51 cities that participated.
Participation in Recreation and Nature-Related Activities
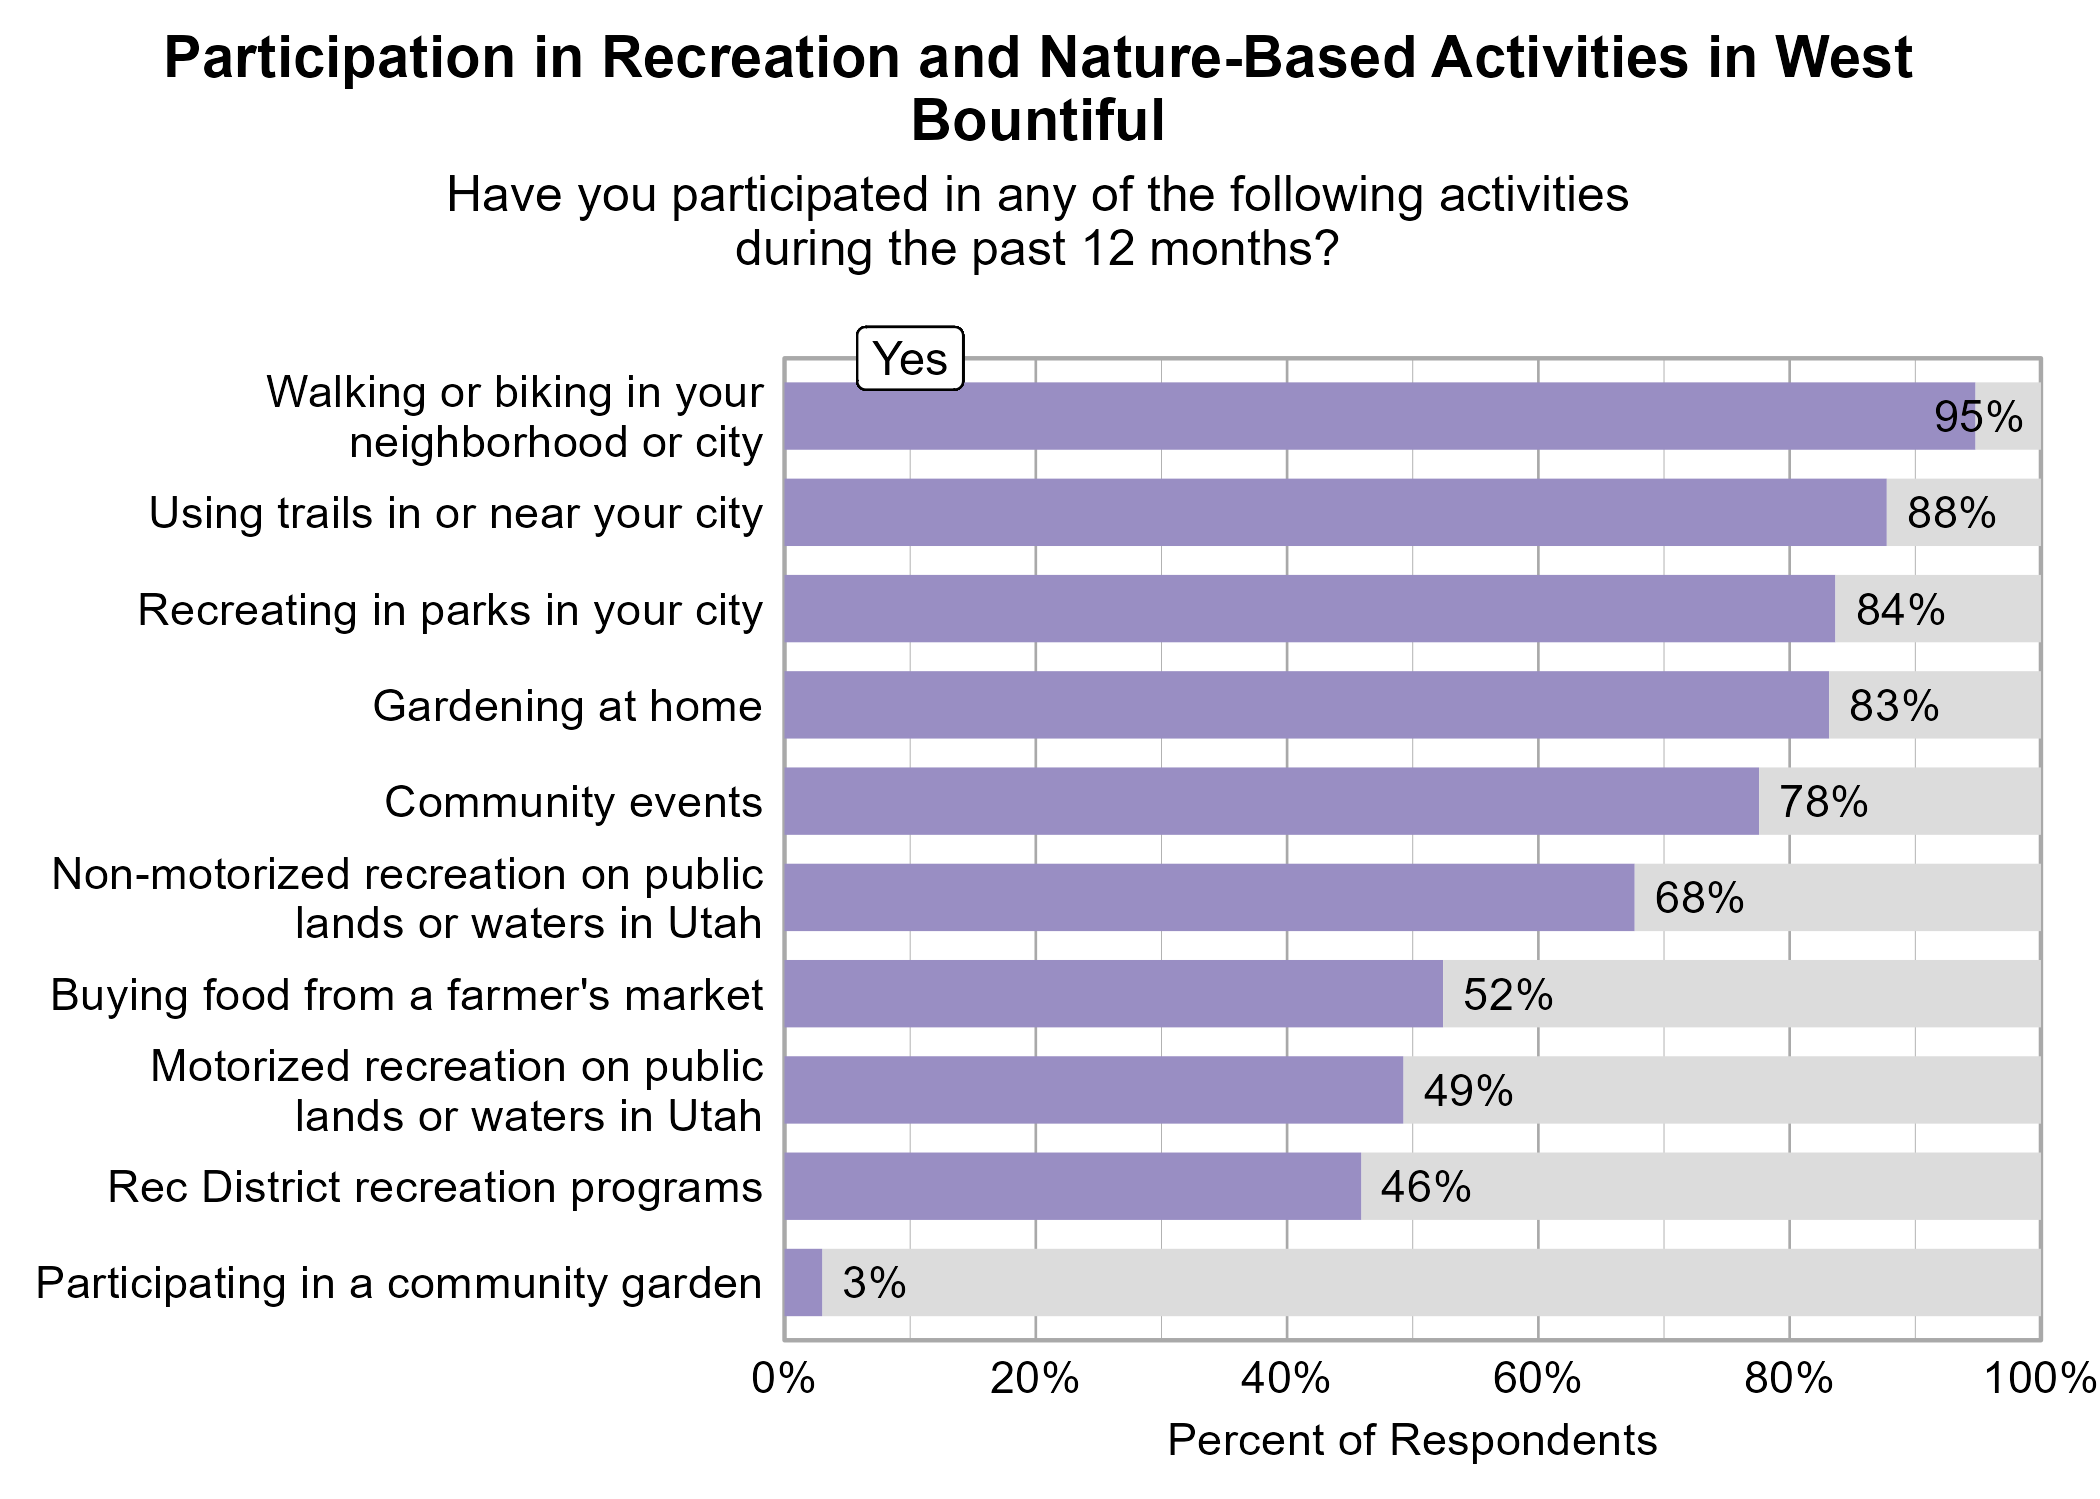
Respondents were asked to indicate whether or not they participated in various activities in the last 12 months. The most popular activities were walking or biking in your neighborhood or city (95%), using trails in or near your city (88%), recreating in parks in your city (84%), and gardening at home (83%).
Participating in Rec District recreation programs, participating in community events, gardening at home, and using trails in or near your city were significantly related to higher ratings of personal wellbeing.
Participating in Rec District recreation programs, participating in community events, and recreating in parks in your city were significantly related to higher ratings of community wellbeing.
Participating in Rec District recreation programs, participating in community events, gardening at home, recreating in parks in your city, and using trails in or near your city were significantly related to higher ratings of community connection.
Perspectives on Population Growth and Economic Development
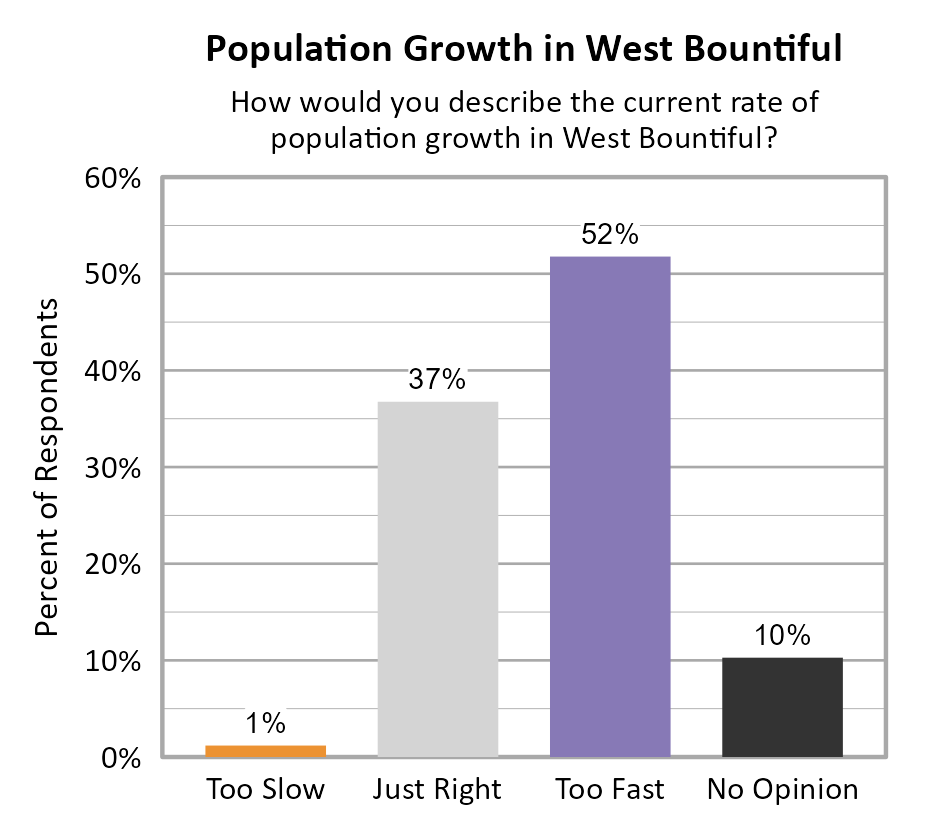
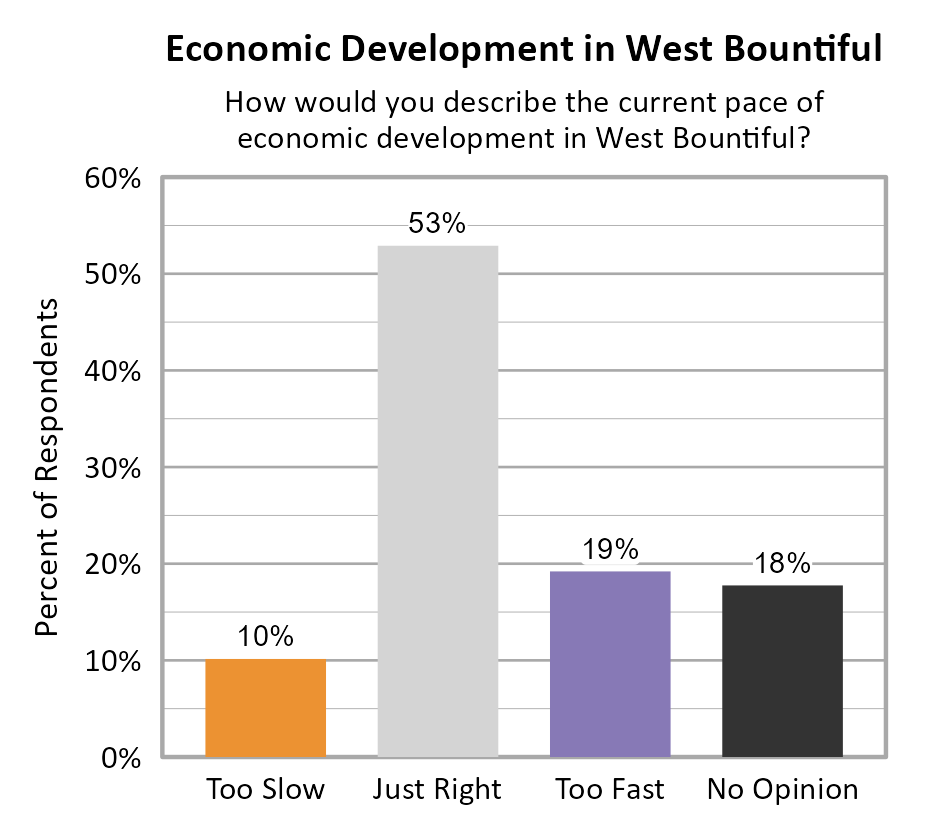
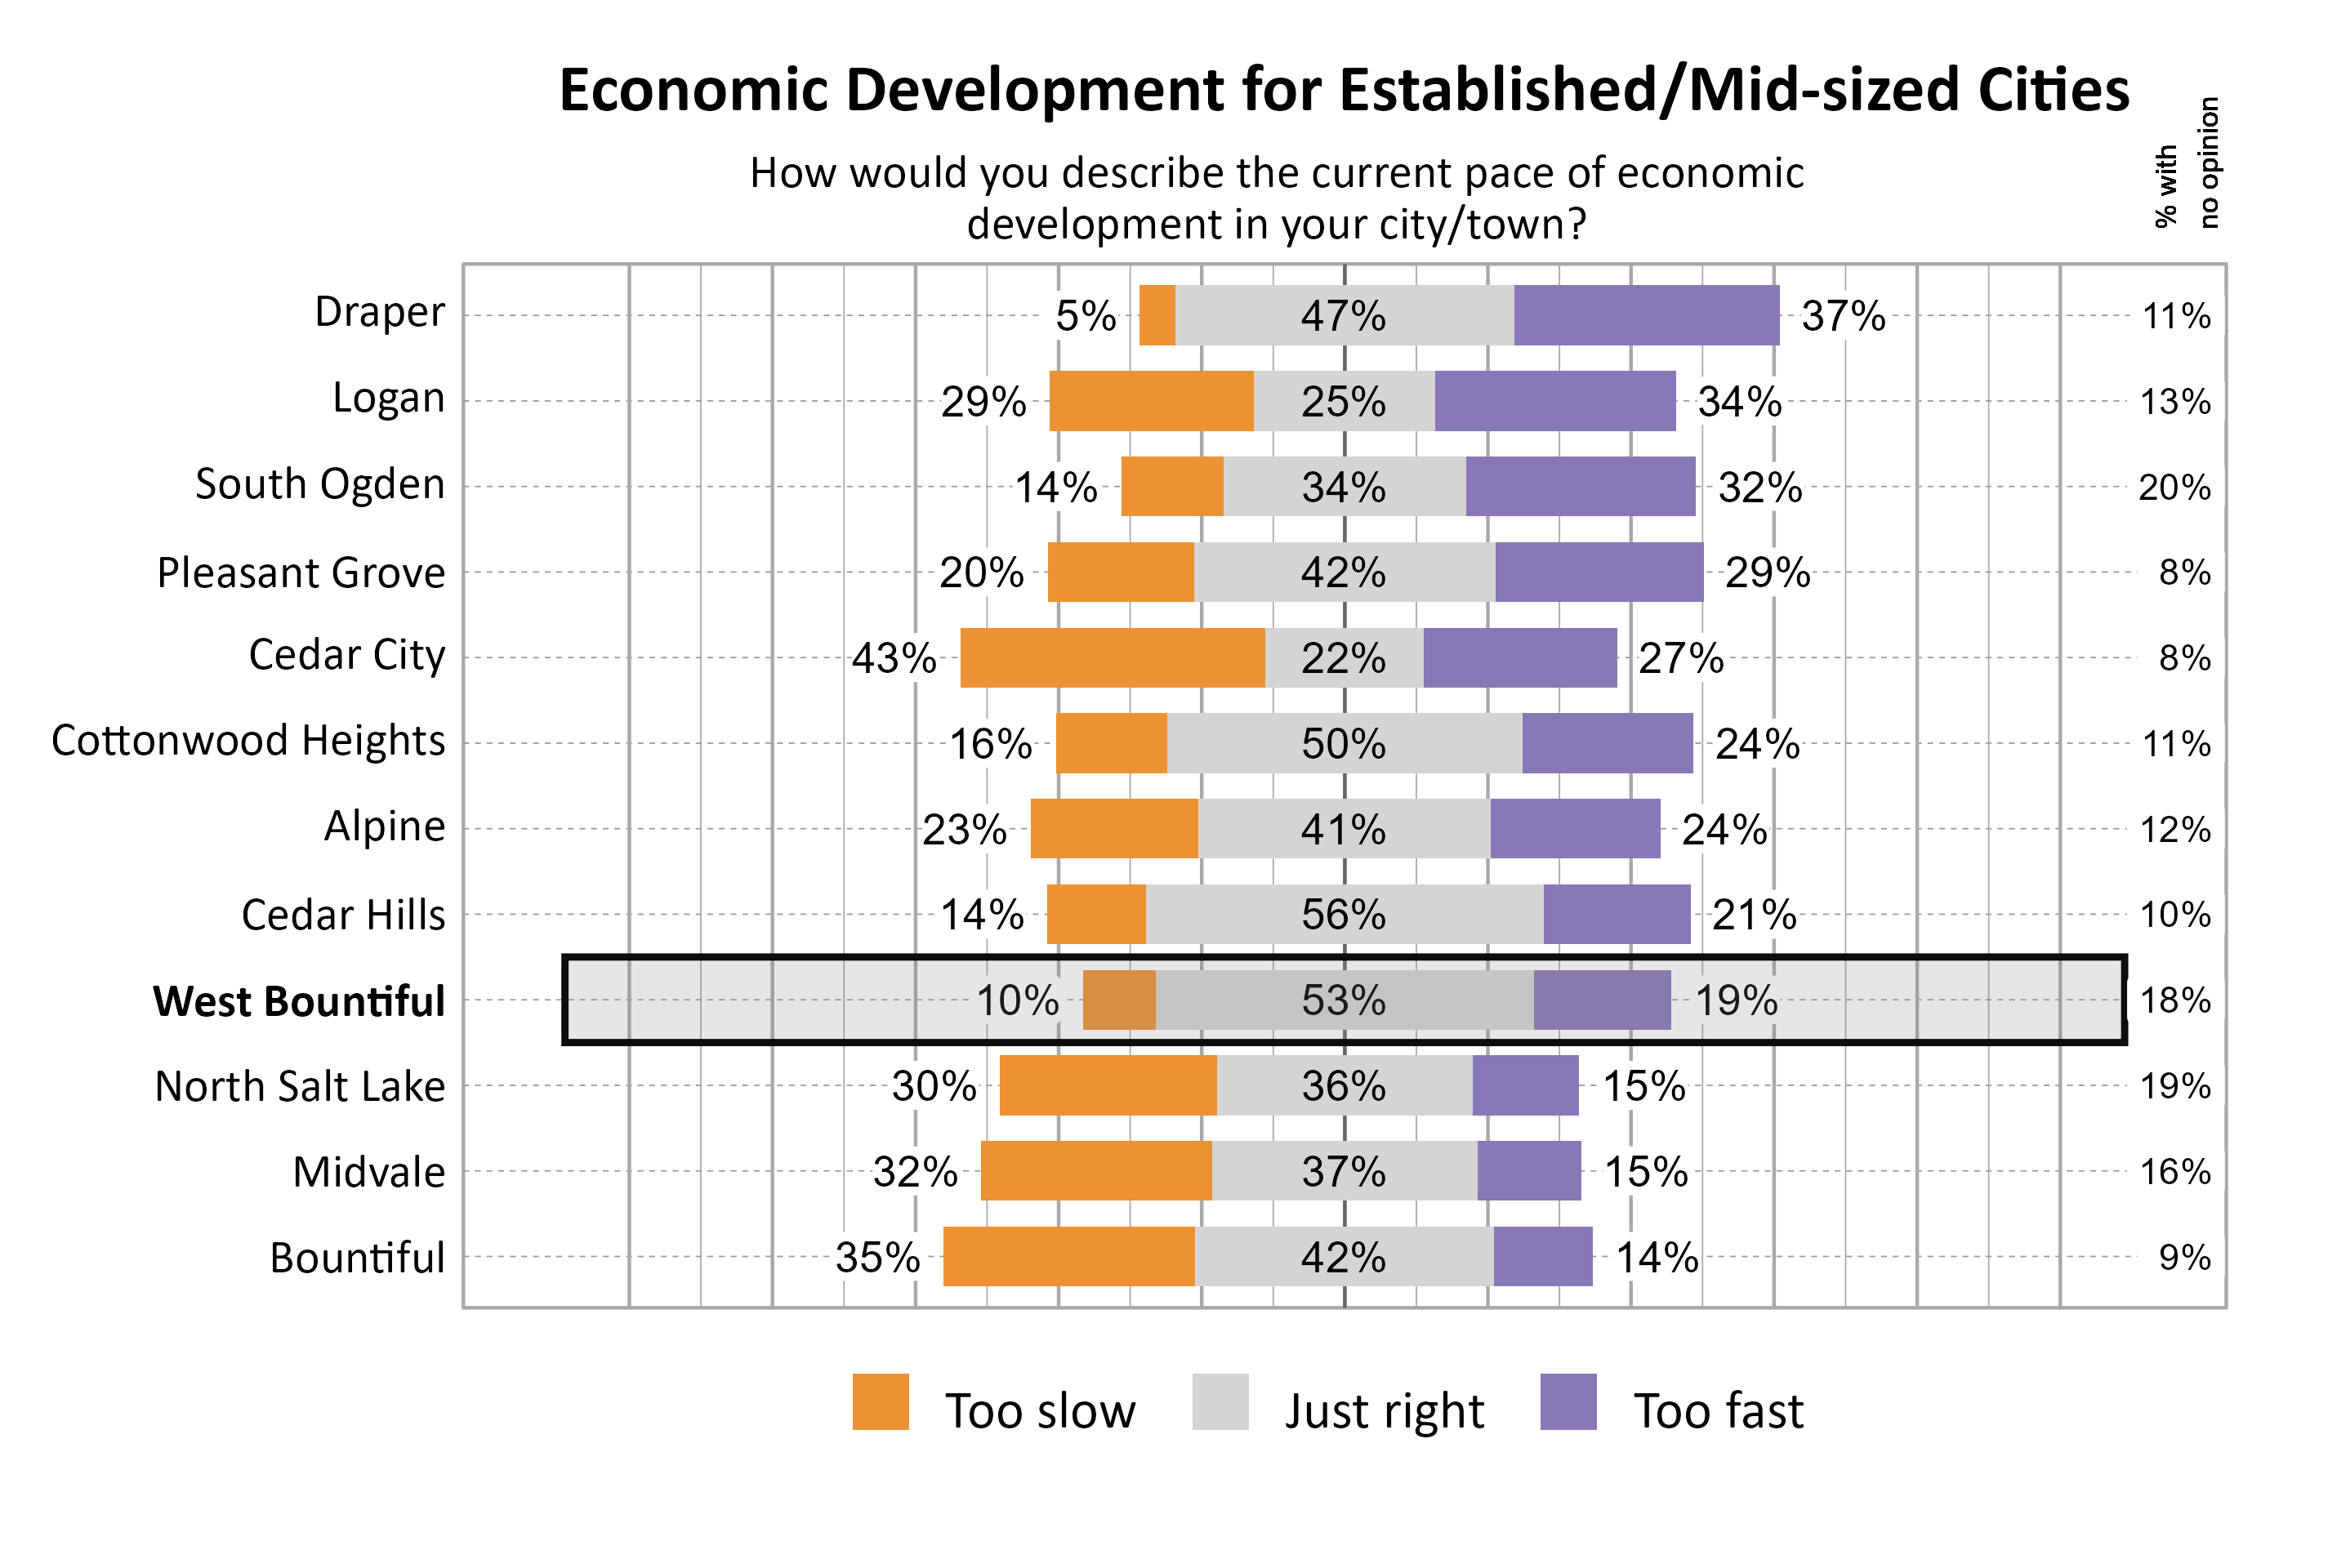
The majority of respondents in West Bountiful indicated that they felt the population growth was too fast (52%). For the pace of economic development, the majority of respondents indicated that it was just right (53%).
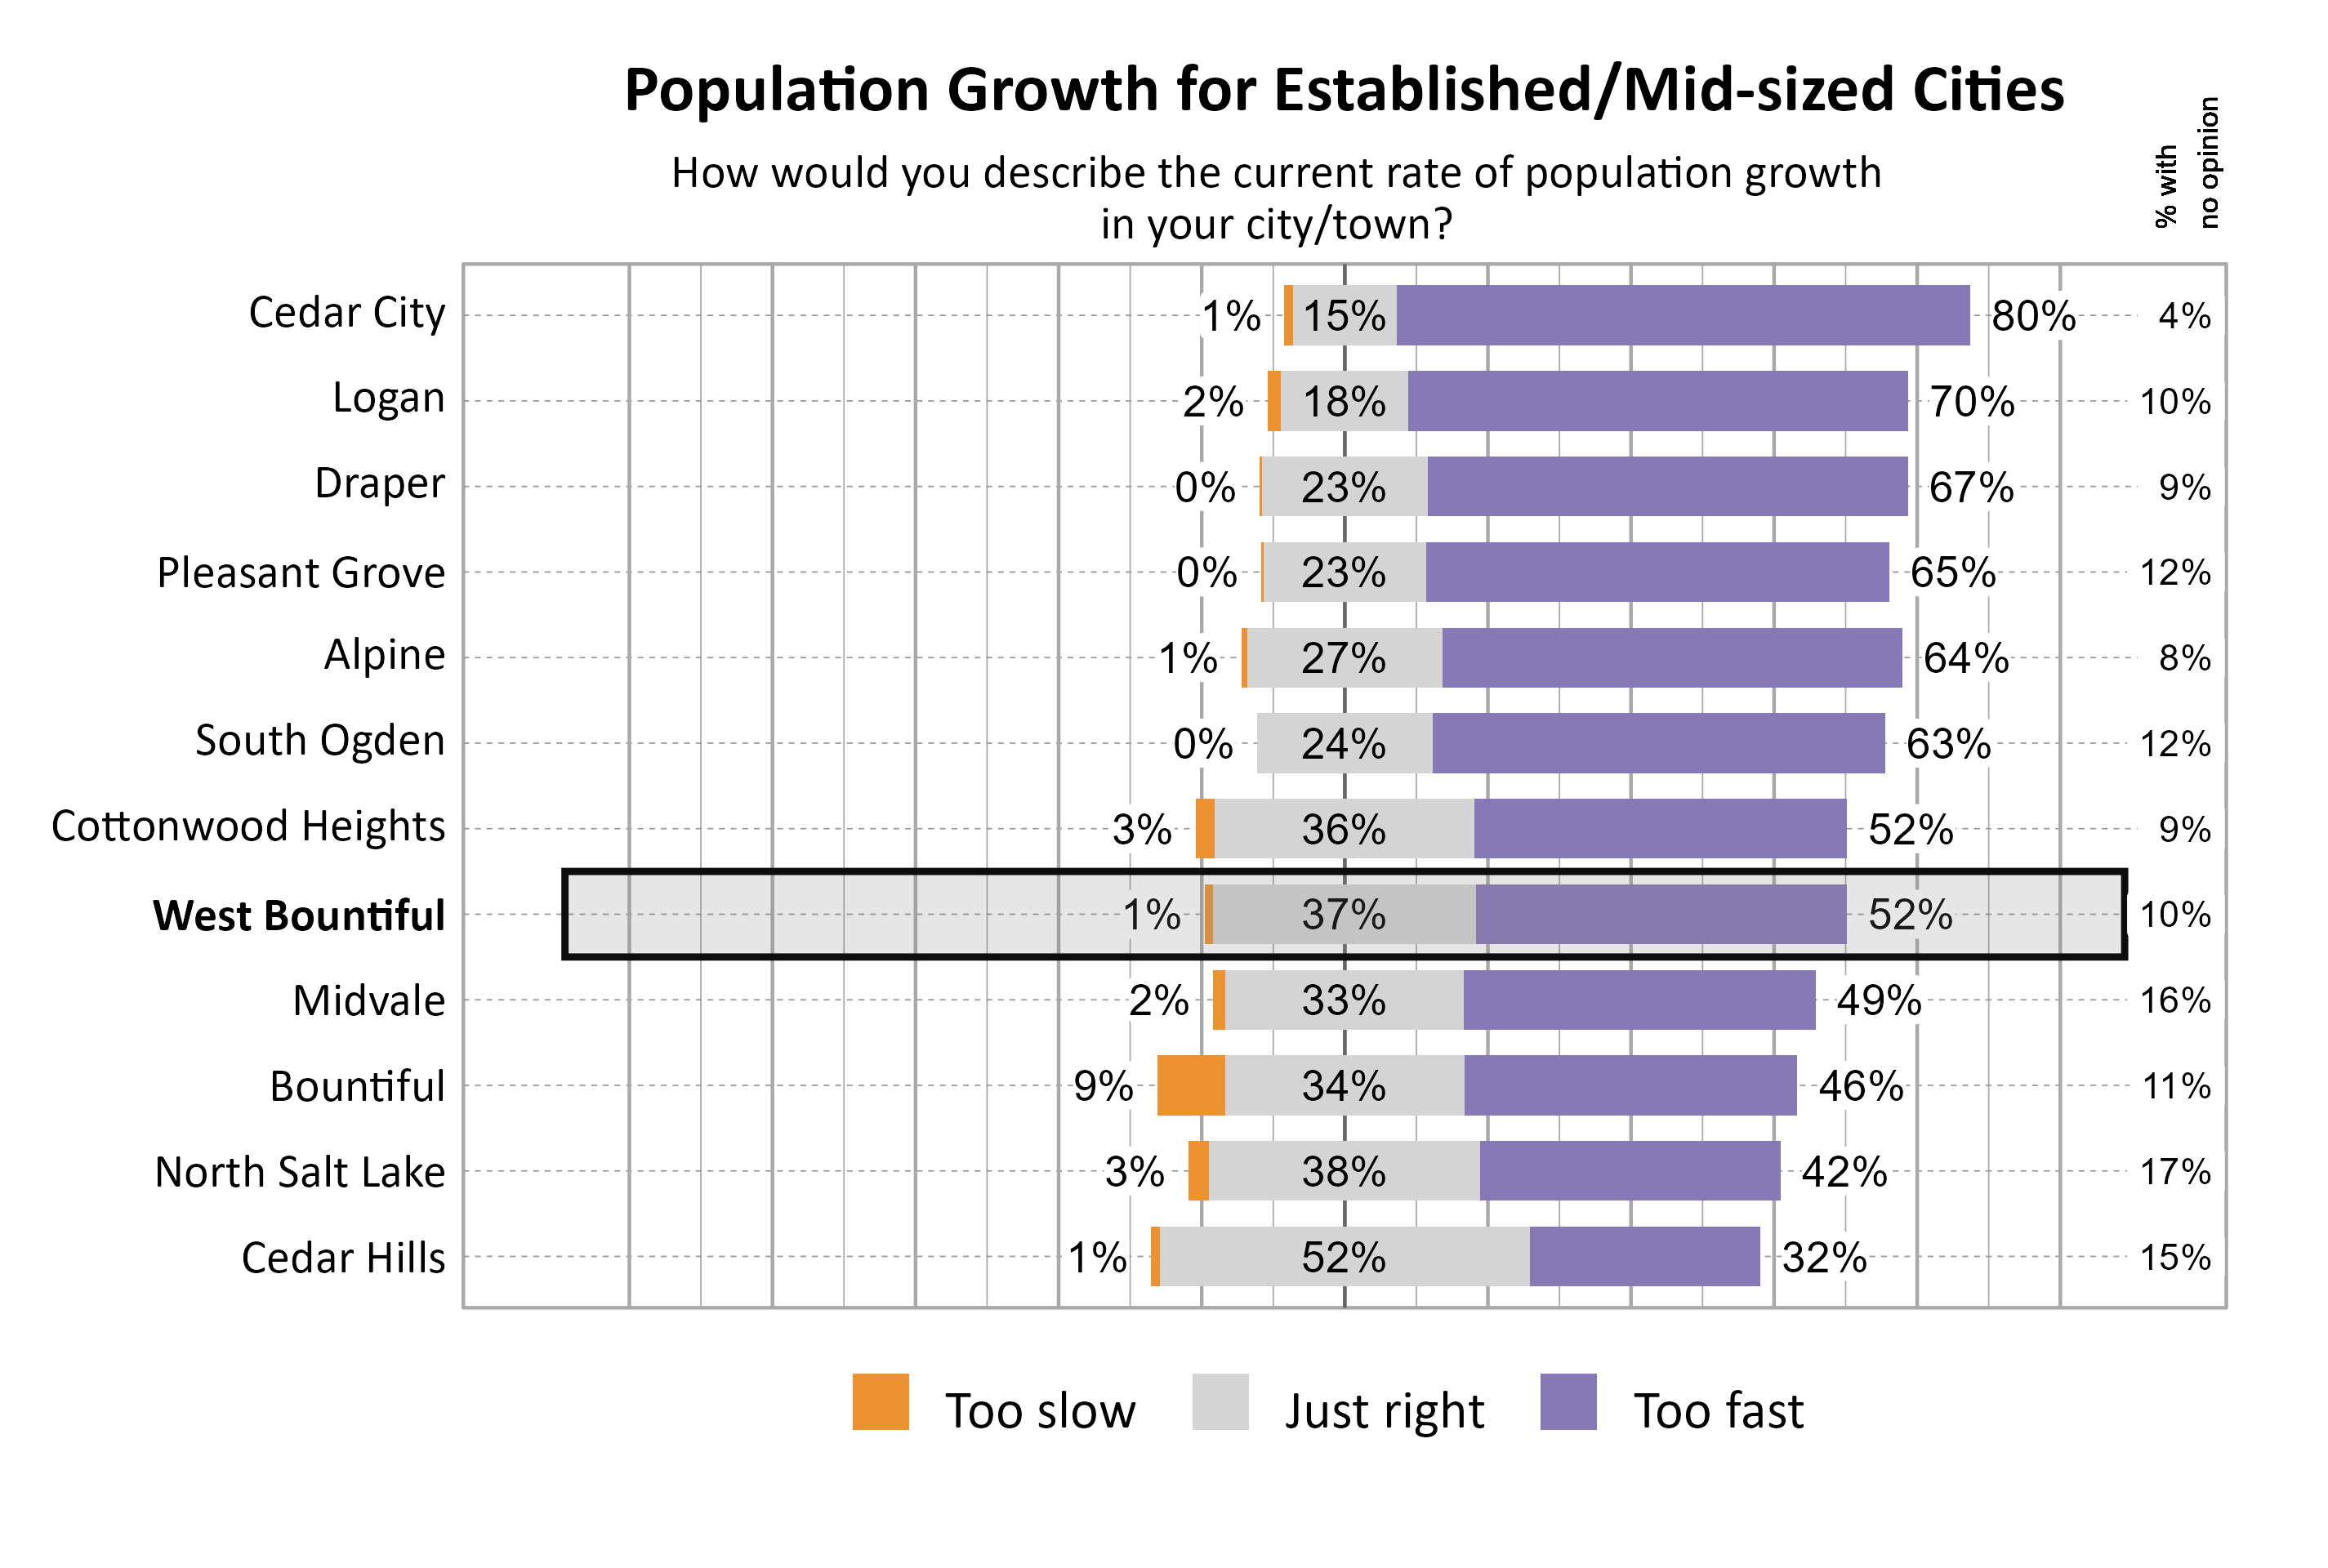
The graphs below show perceptions of population growth and economic development for West Bountiful compared to other participating cities and towns in the Established/Mid-sized Cities cluster.
The graph below illustrates how many respondents perceived the pace of economic development as too slow, just right, too fast, or had no opinion, with additional breakdowns for the number of respondents who provided comments.
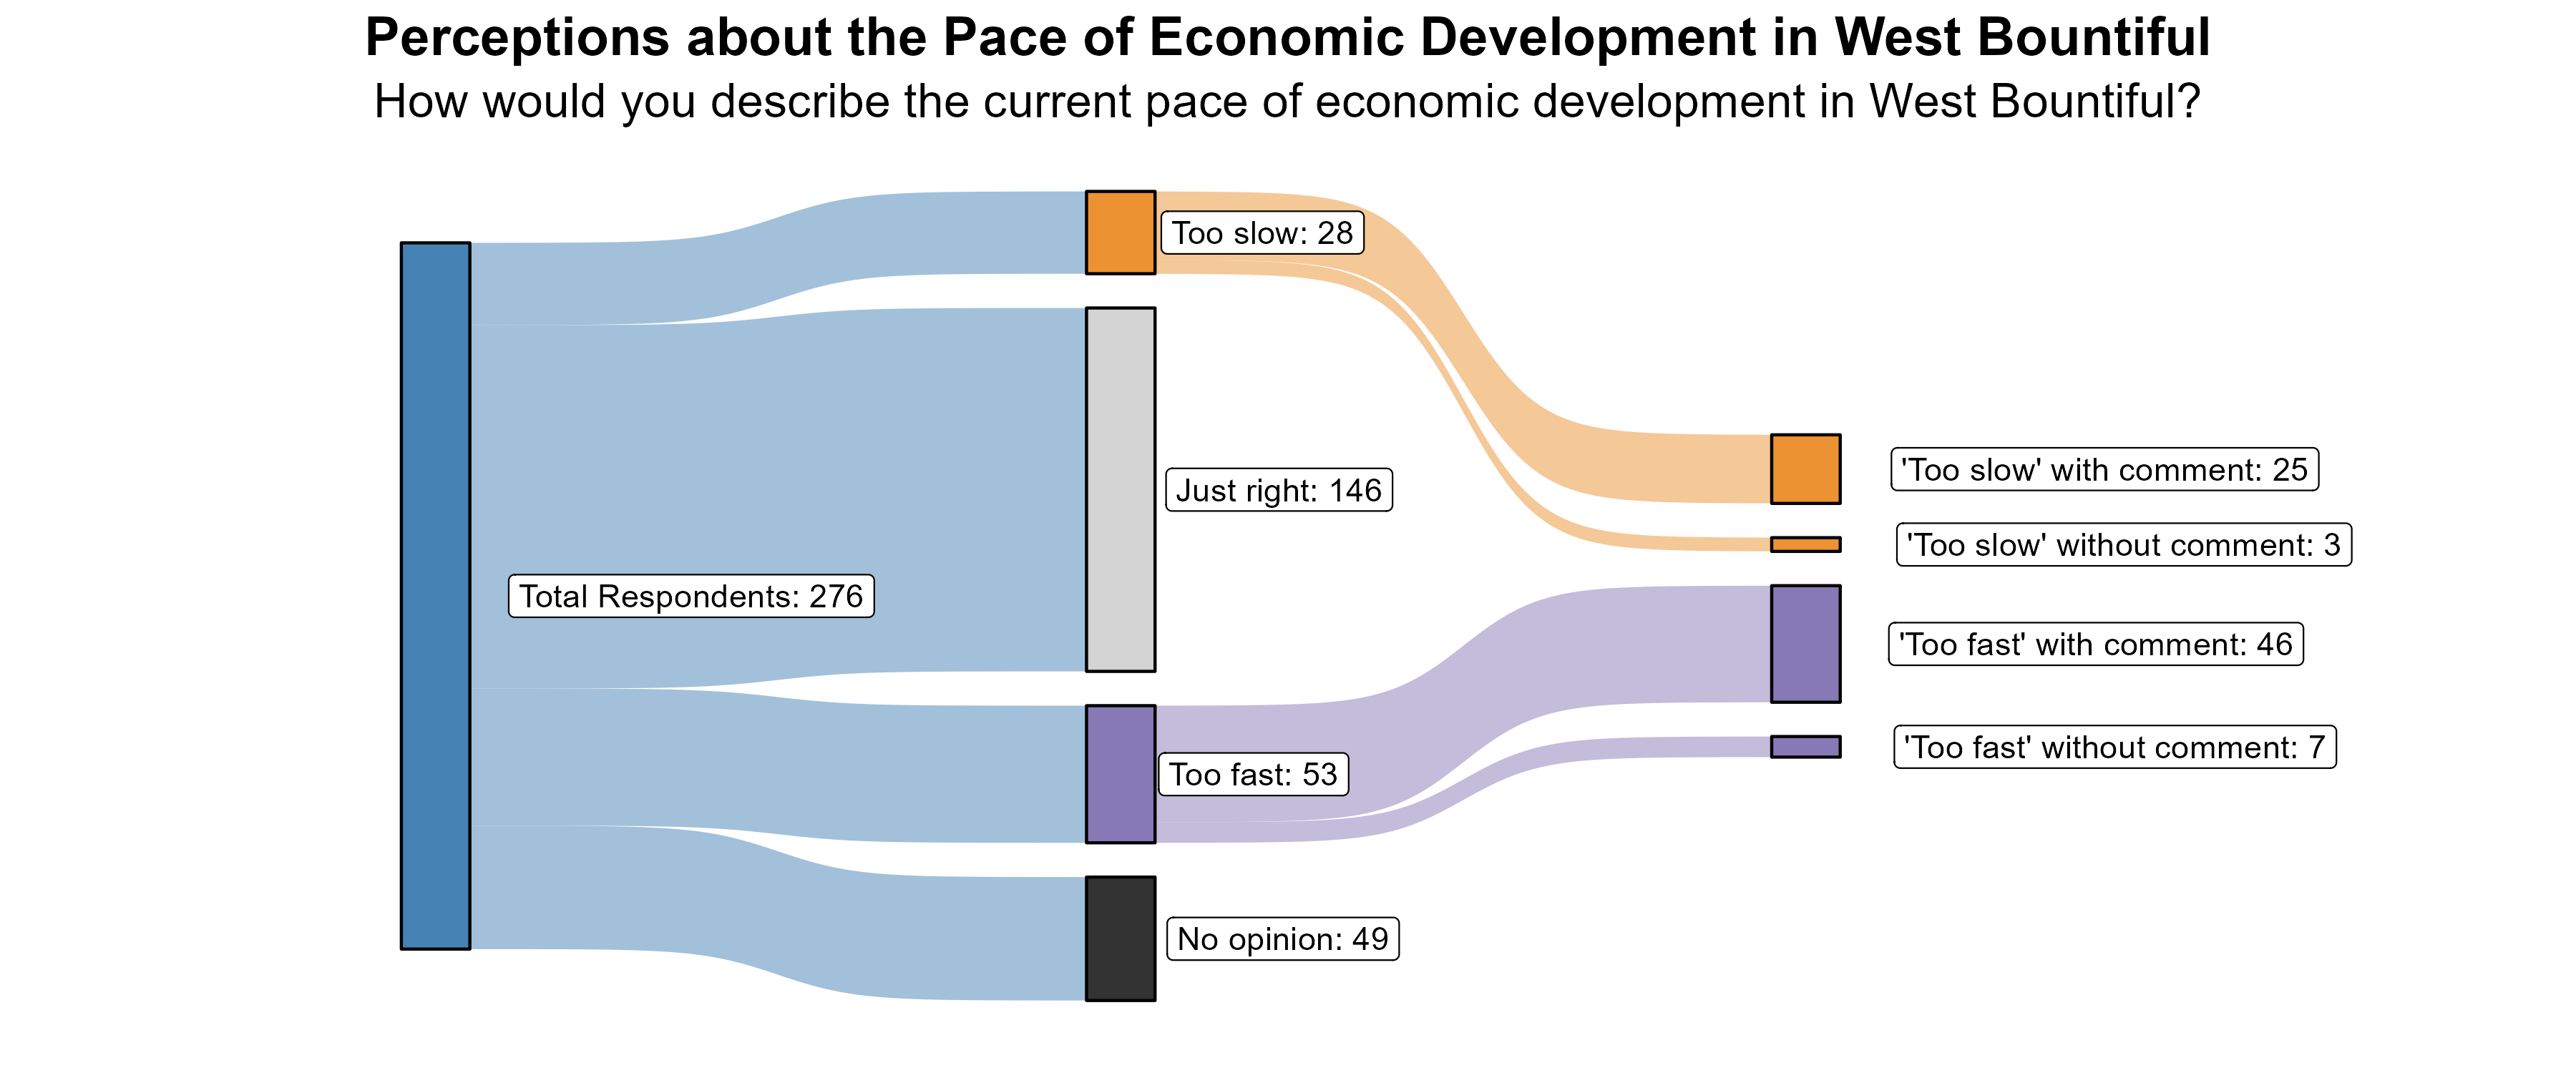
The 10% of respondents who rated the pace of economic growth as “too slow” were further asked what aspects of the local economy they would like to see more of in West Bountiful. Respondents had mixed responses regarding what they would like to see more of. Some desired more retail and business opportunities and support for in-home local business. There were expressed desires for more planning for affordable housing and more local opportunities for children and seniors.
Additionally, the 19% of respondents who rated the pace of economic growth as “too fast” were further asked what aspects of the local economy they feel are growing too quickly in West Bountiful. Comments focused largely on rapid housing development and the growing population. There was a general lament about the change in the town’s character and the loss of green space and open space. Some also commented on problems with traffic.
Transportation in West Bountiful
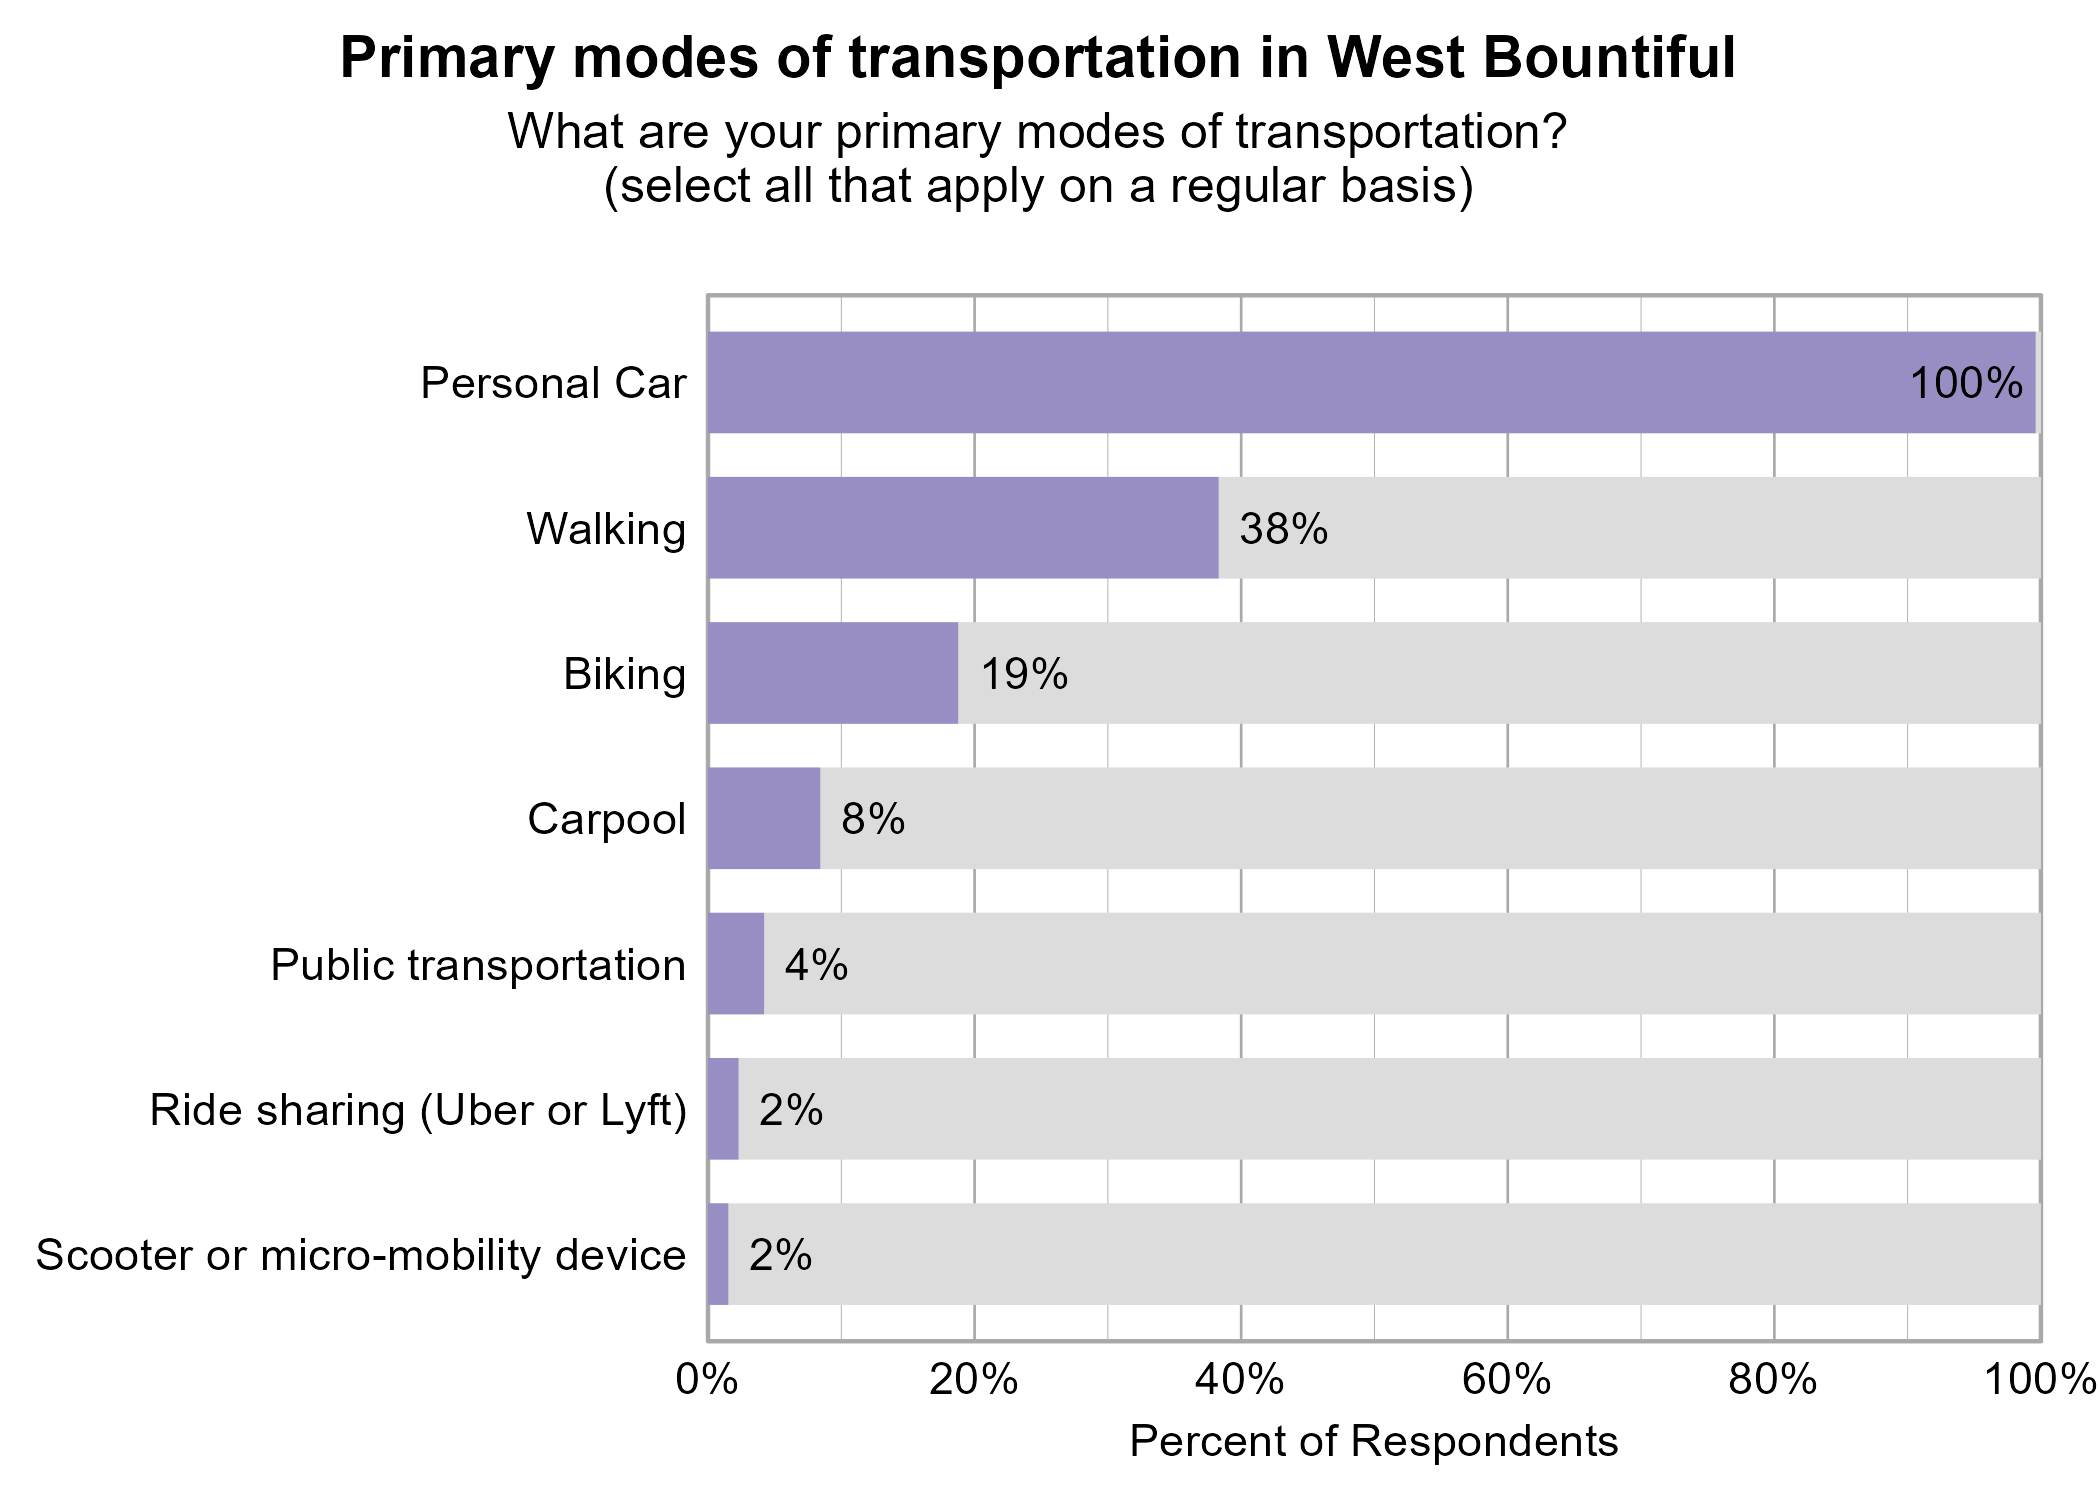
Respondents were asked to indicate all of their primary modes of transportation on a regular basis in West Bountiful. The most popular modes of transportation were personal car (100%) and walking (38%).
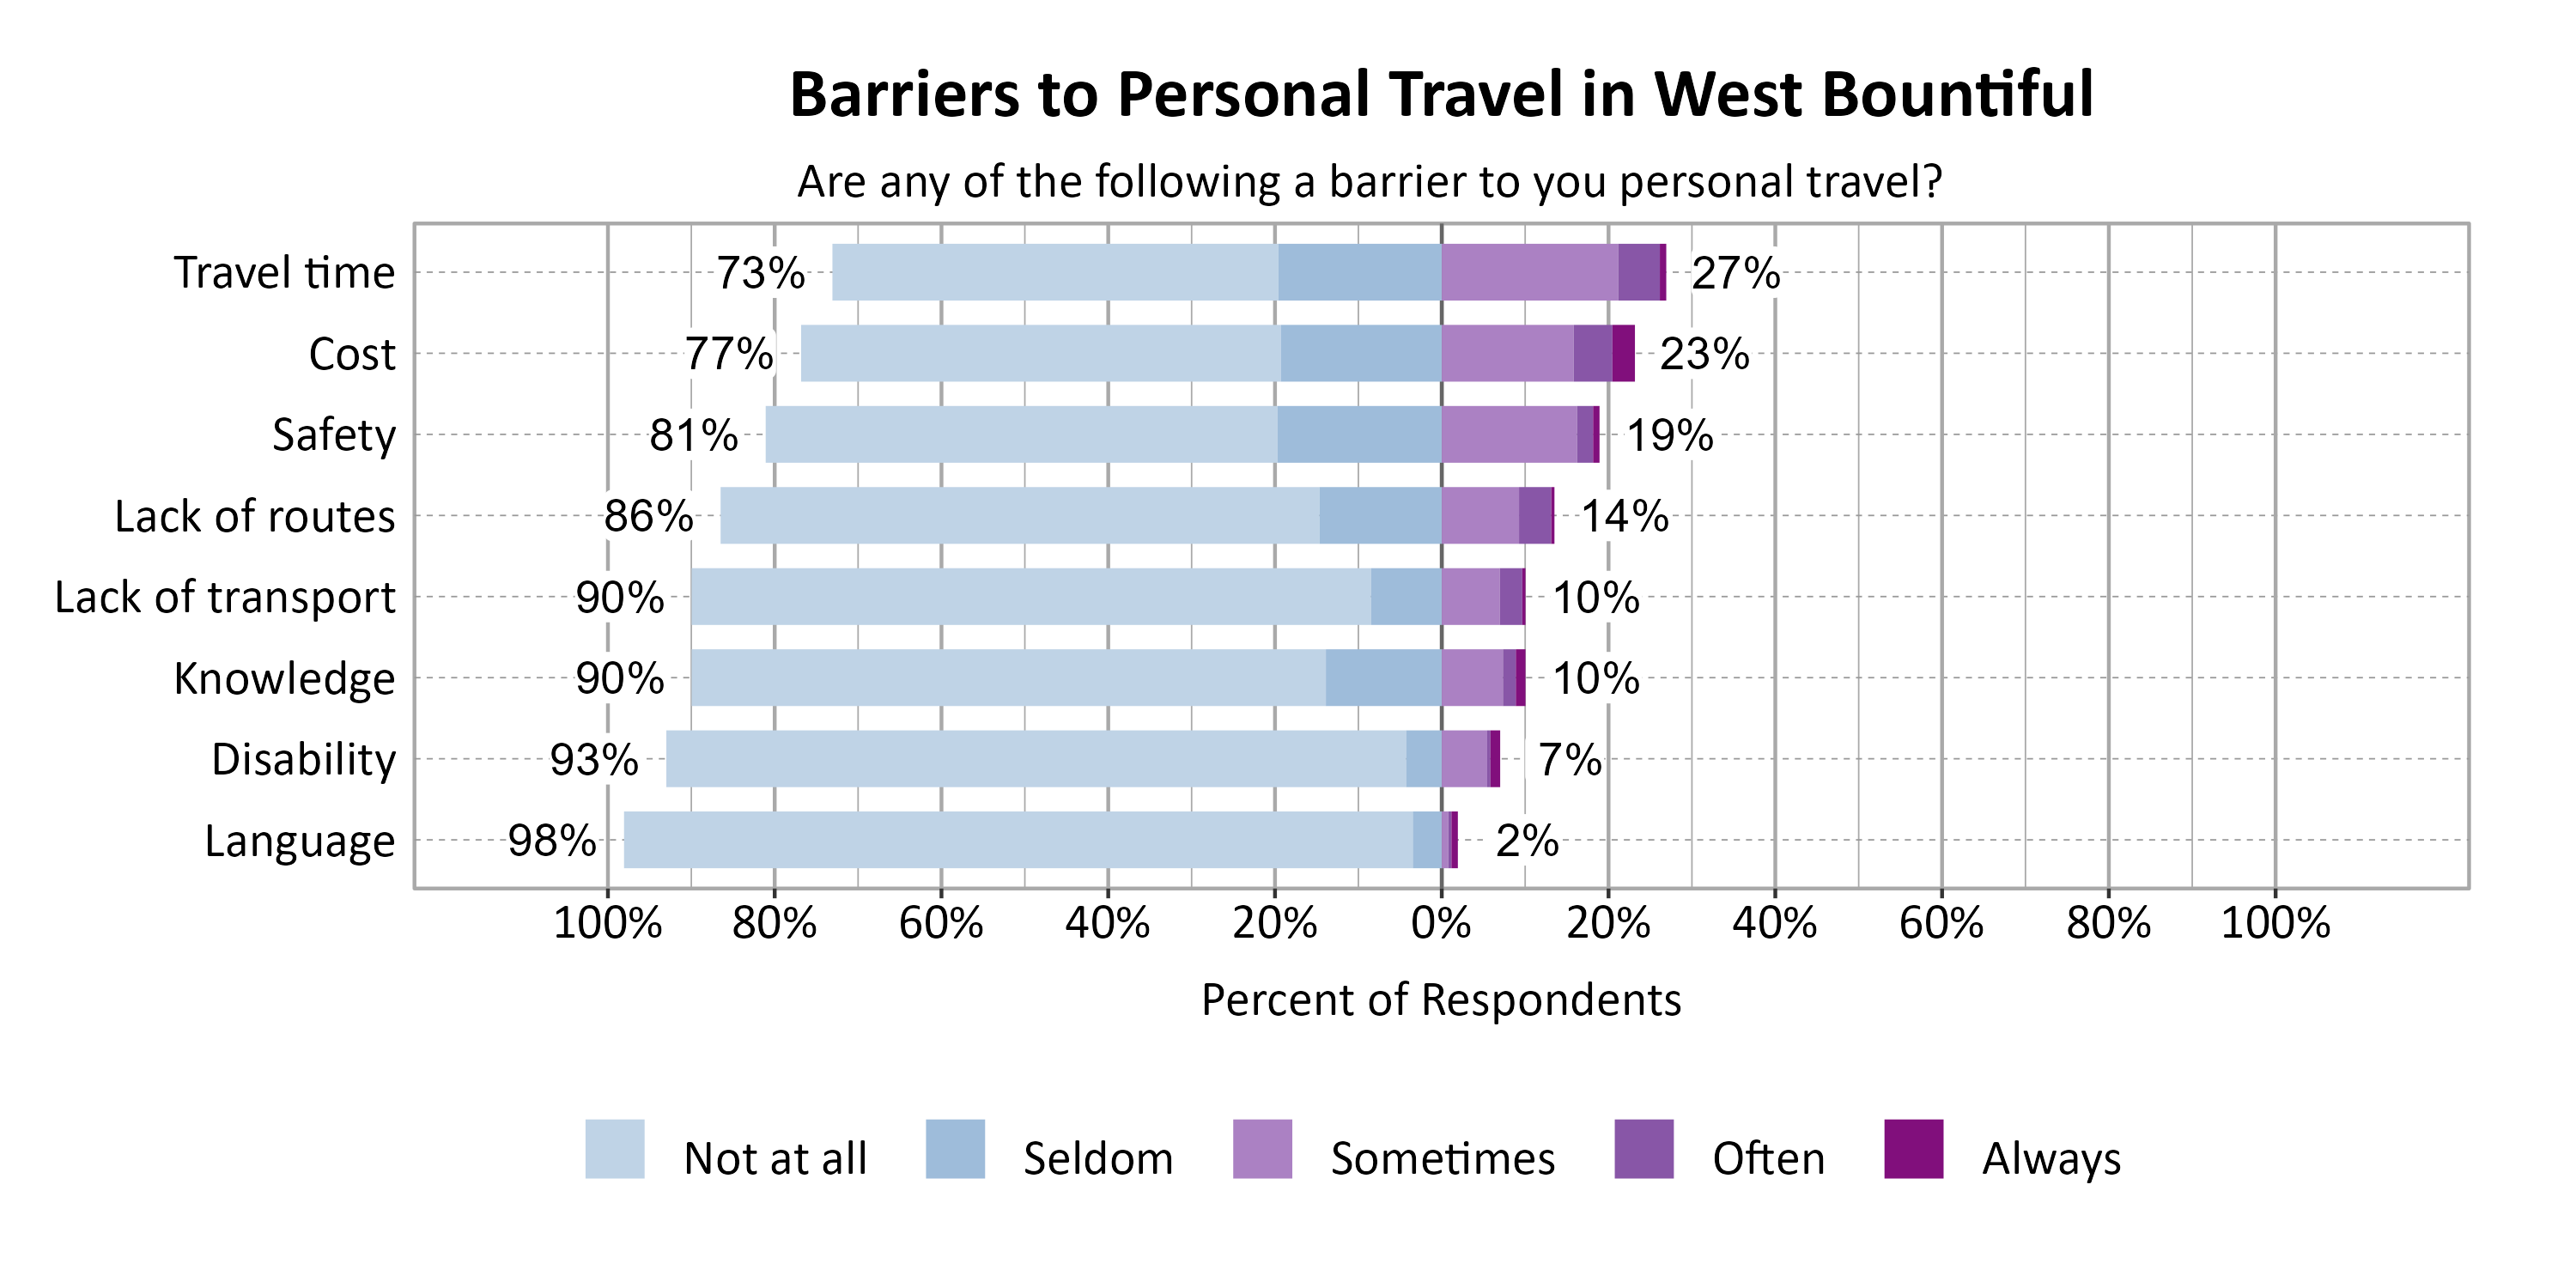
Respondents were asked to indicate the most common barriers to transportation in West Bountiful. The most problematic barriers were Travel time (27%) and Cost (23%).
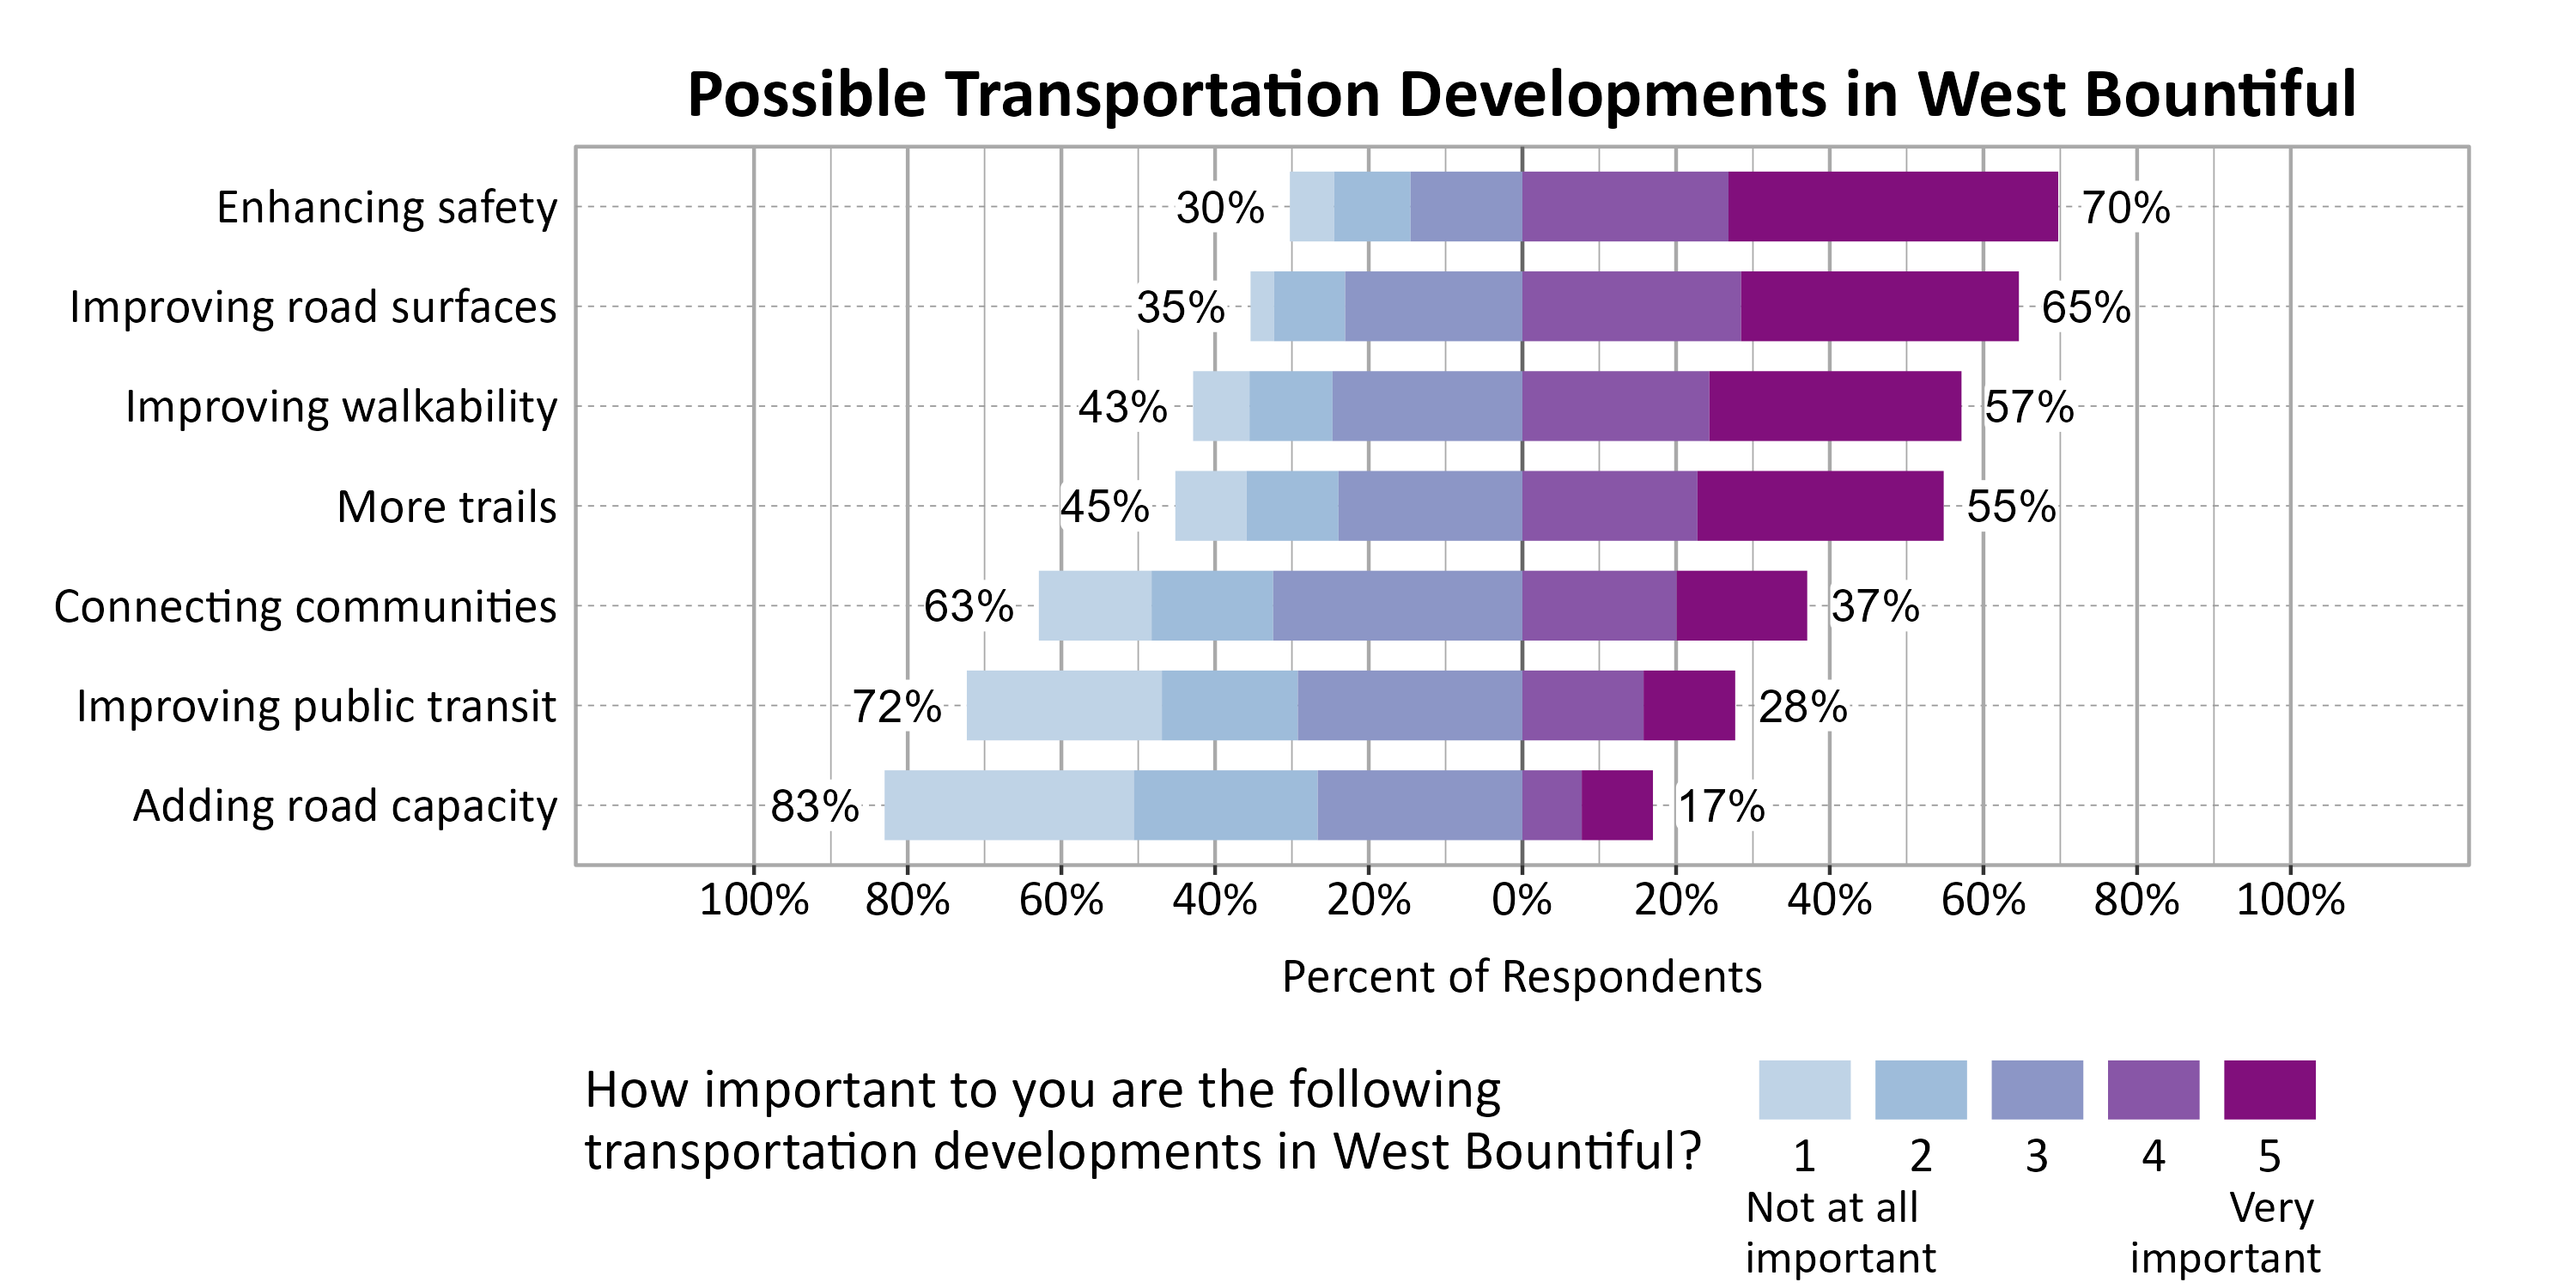
Respondents were asked to indicate the importance of a set of possible transportation developments in West Bountiful. The most important development to respondents were Enhancing safety (70%), Improving road surfaces (65%), and Improving walkability (57%).
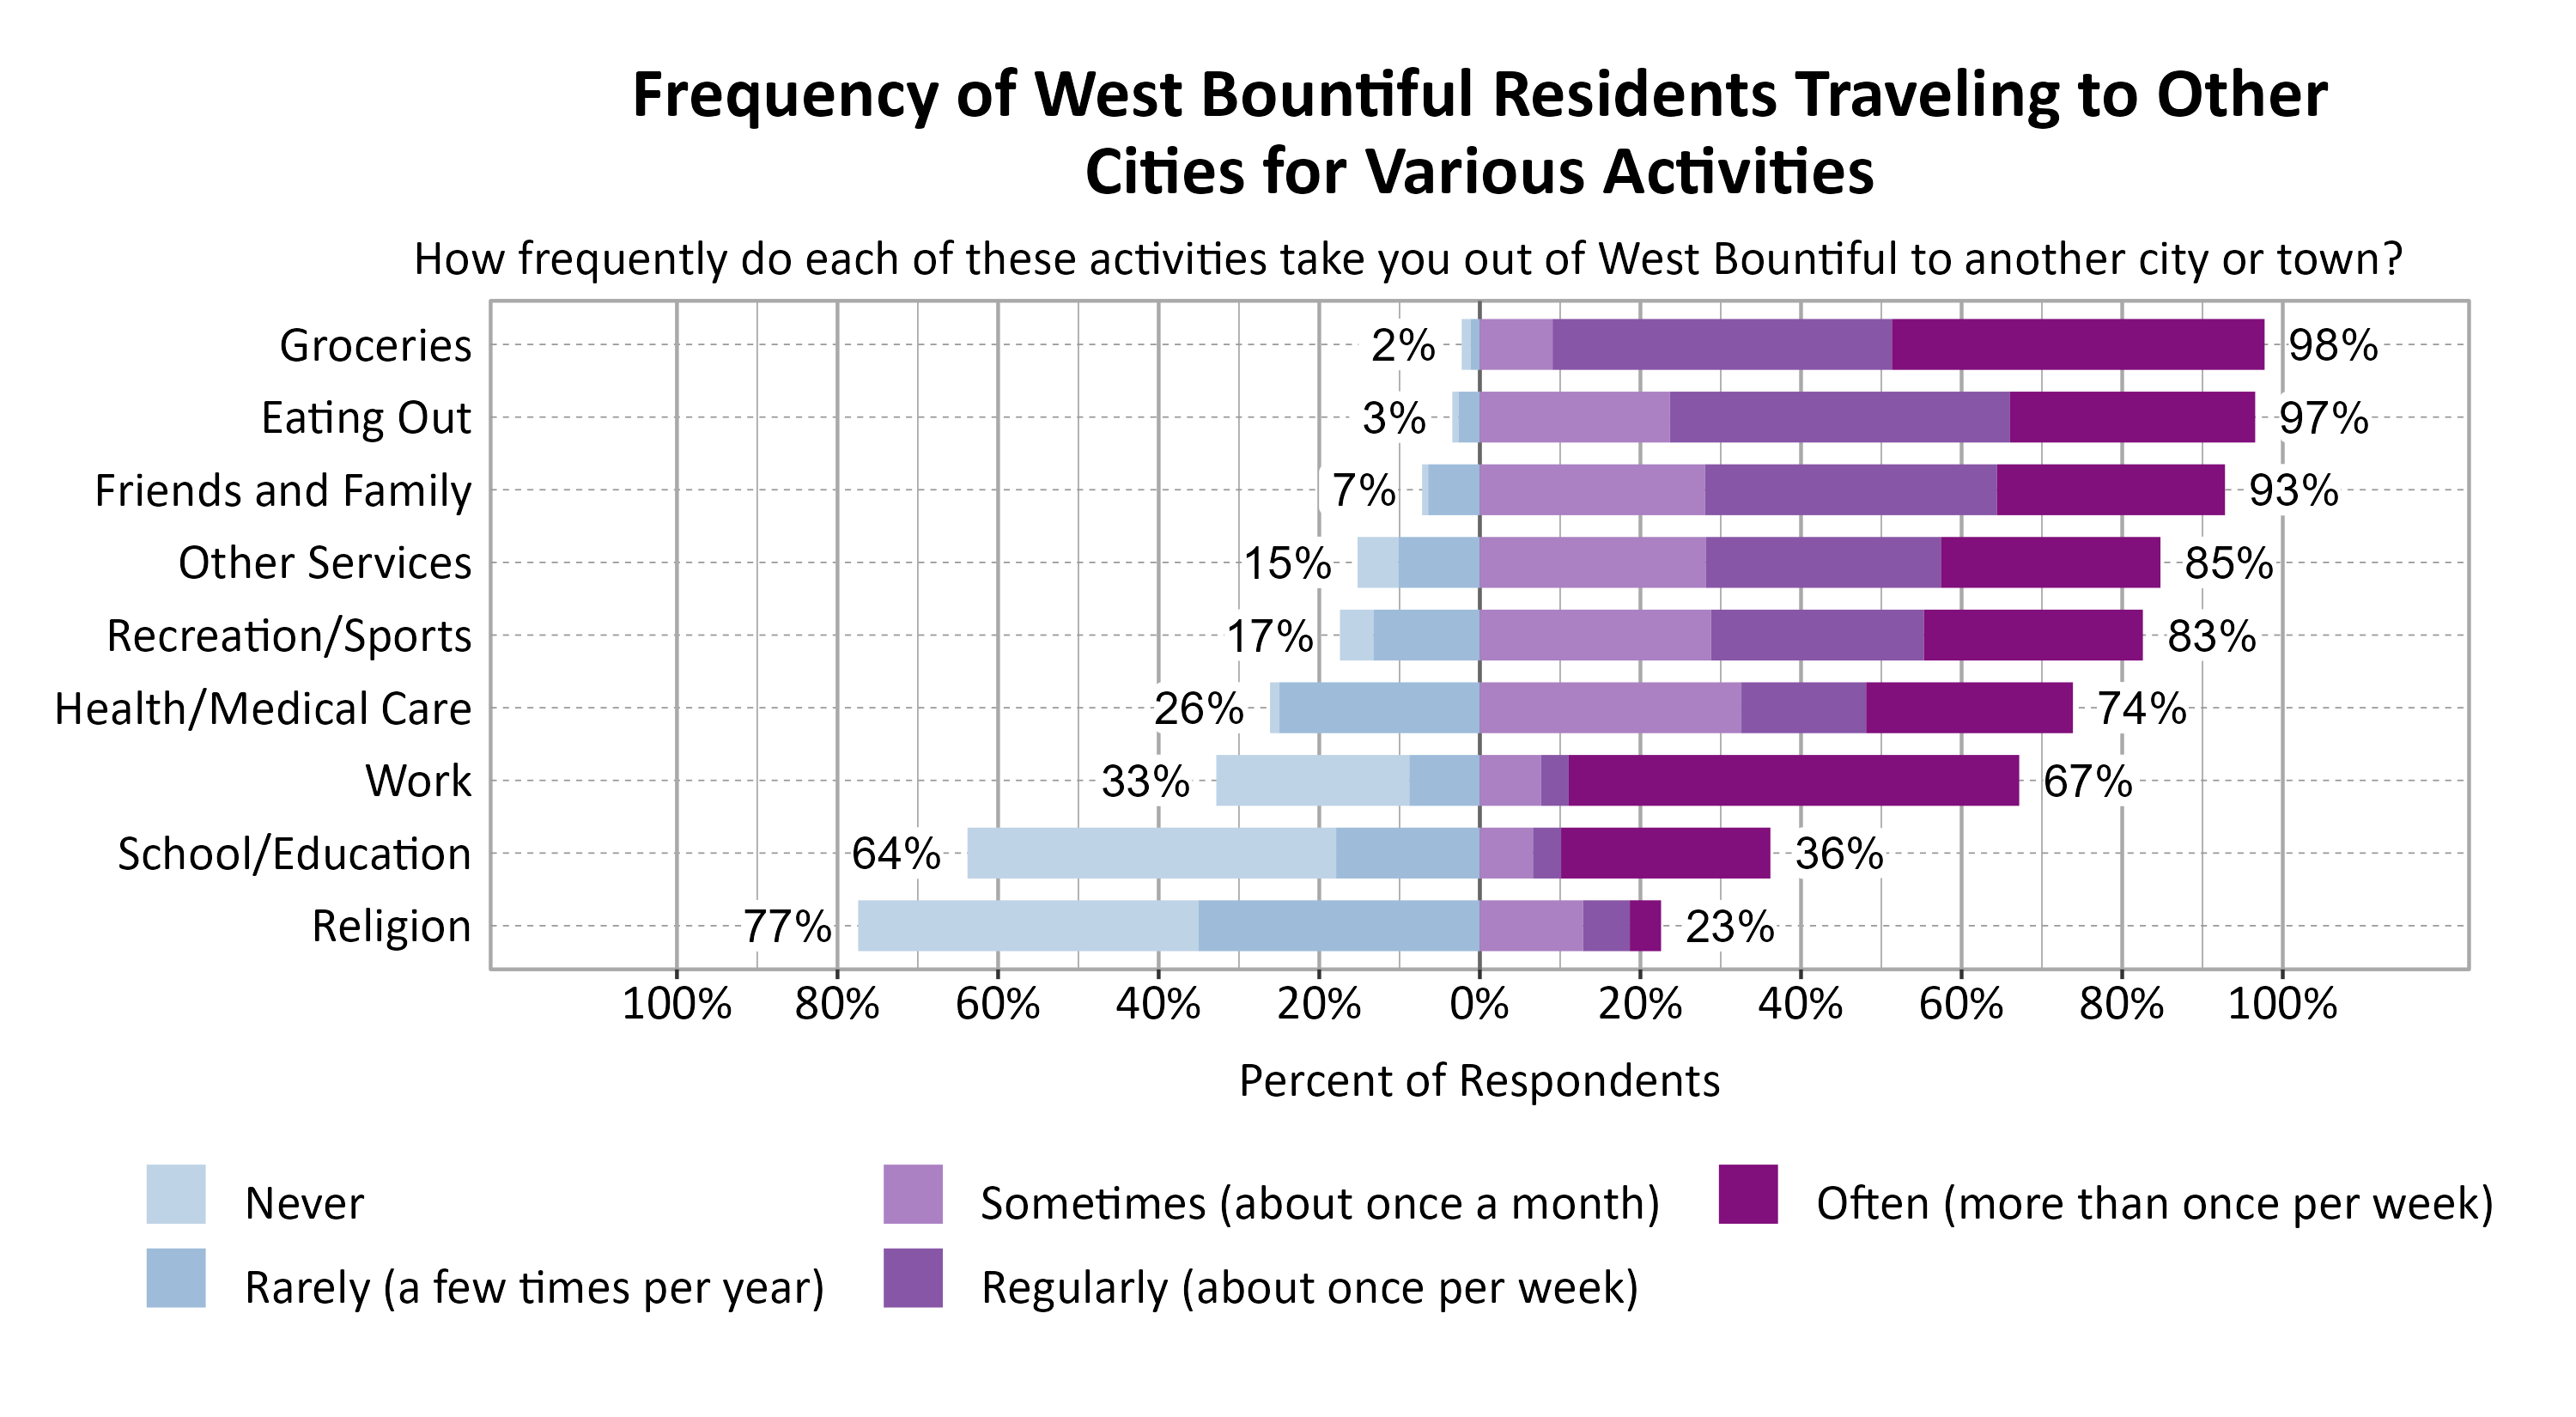
Respondents were asked to indicate how frequently various activities take them out of West Bountiful to another city or town. The most commonly indicated reasons for traveling to another city or town at least sometimes or once a month were Groceries (98%), Eating Out (97%), and Friends and Family (93%).
Concerns in West Bountiful
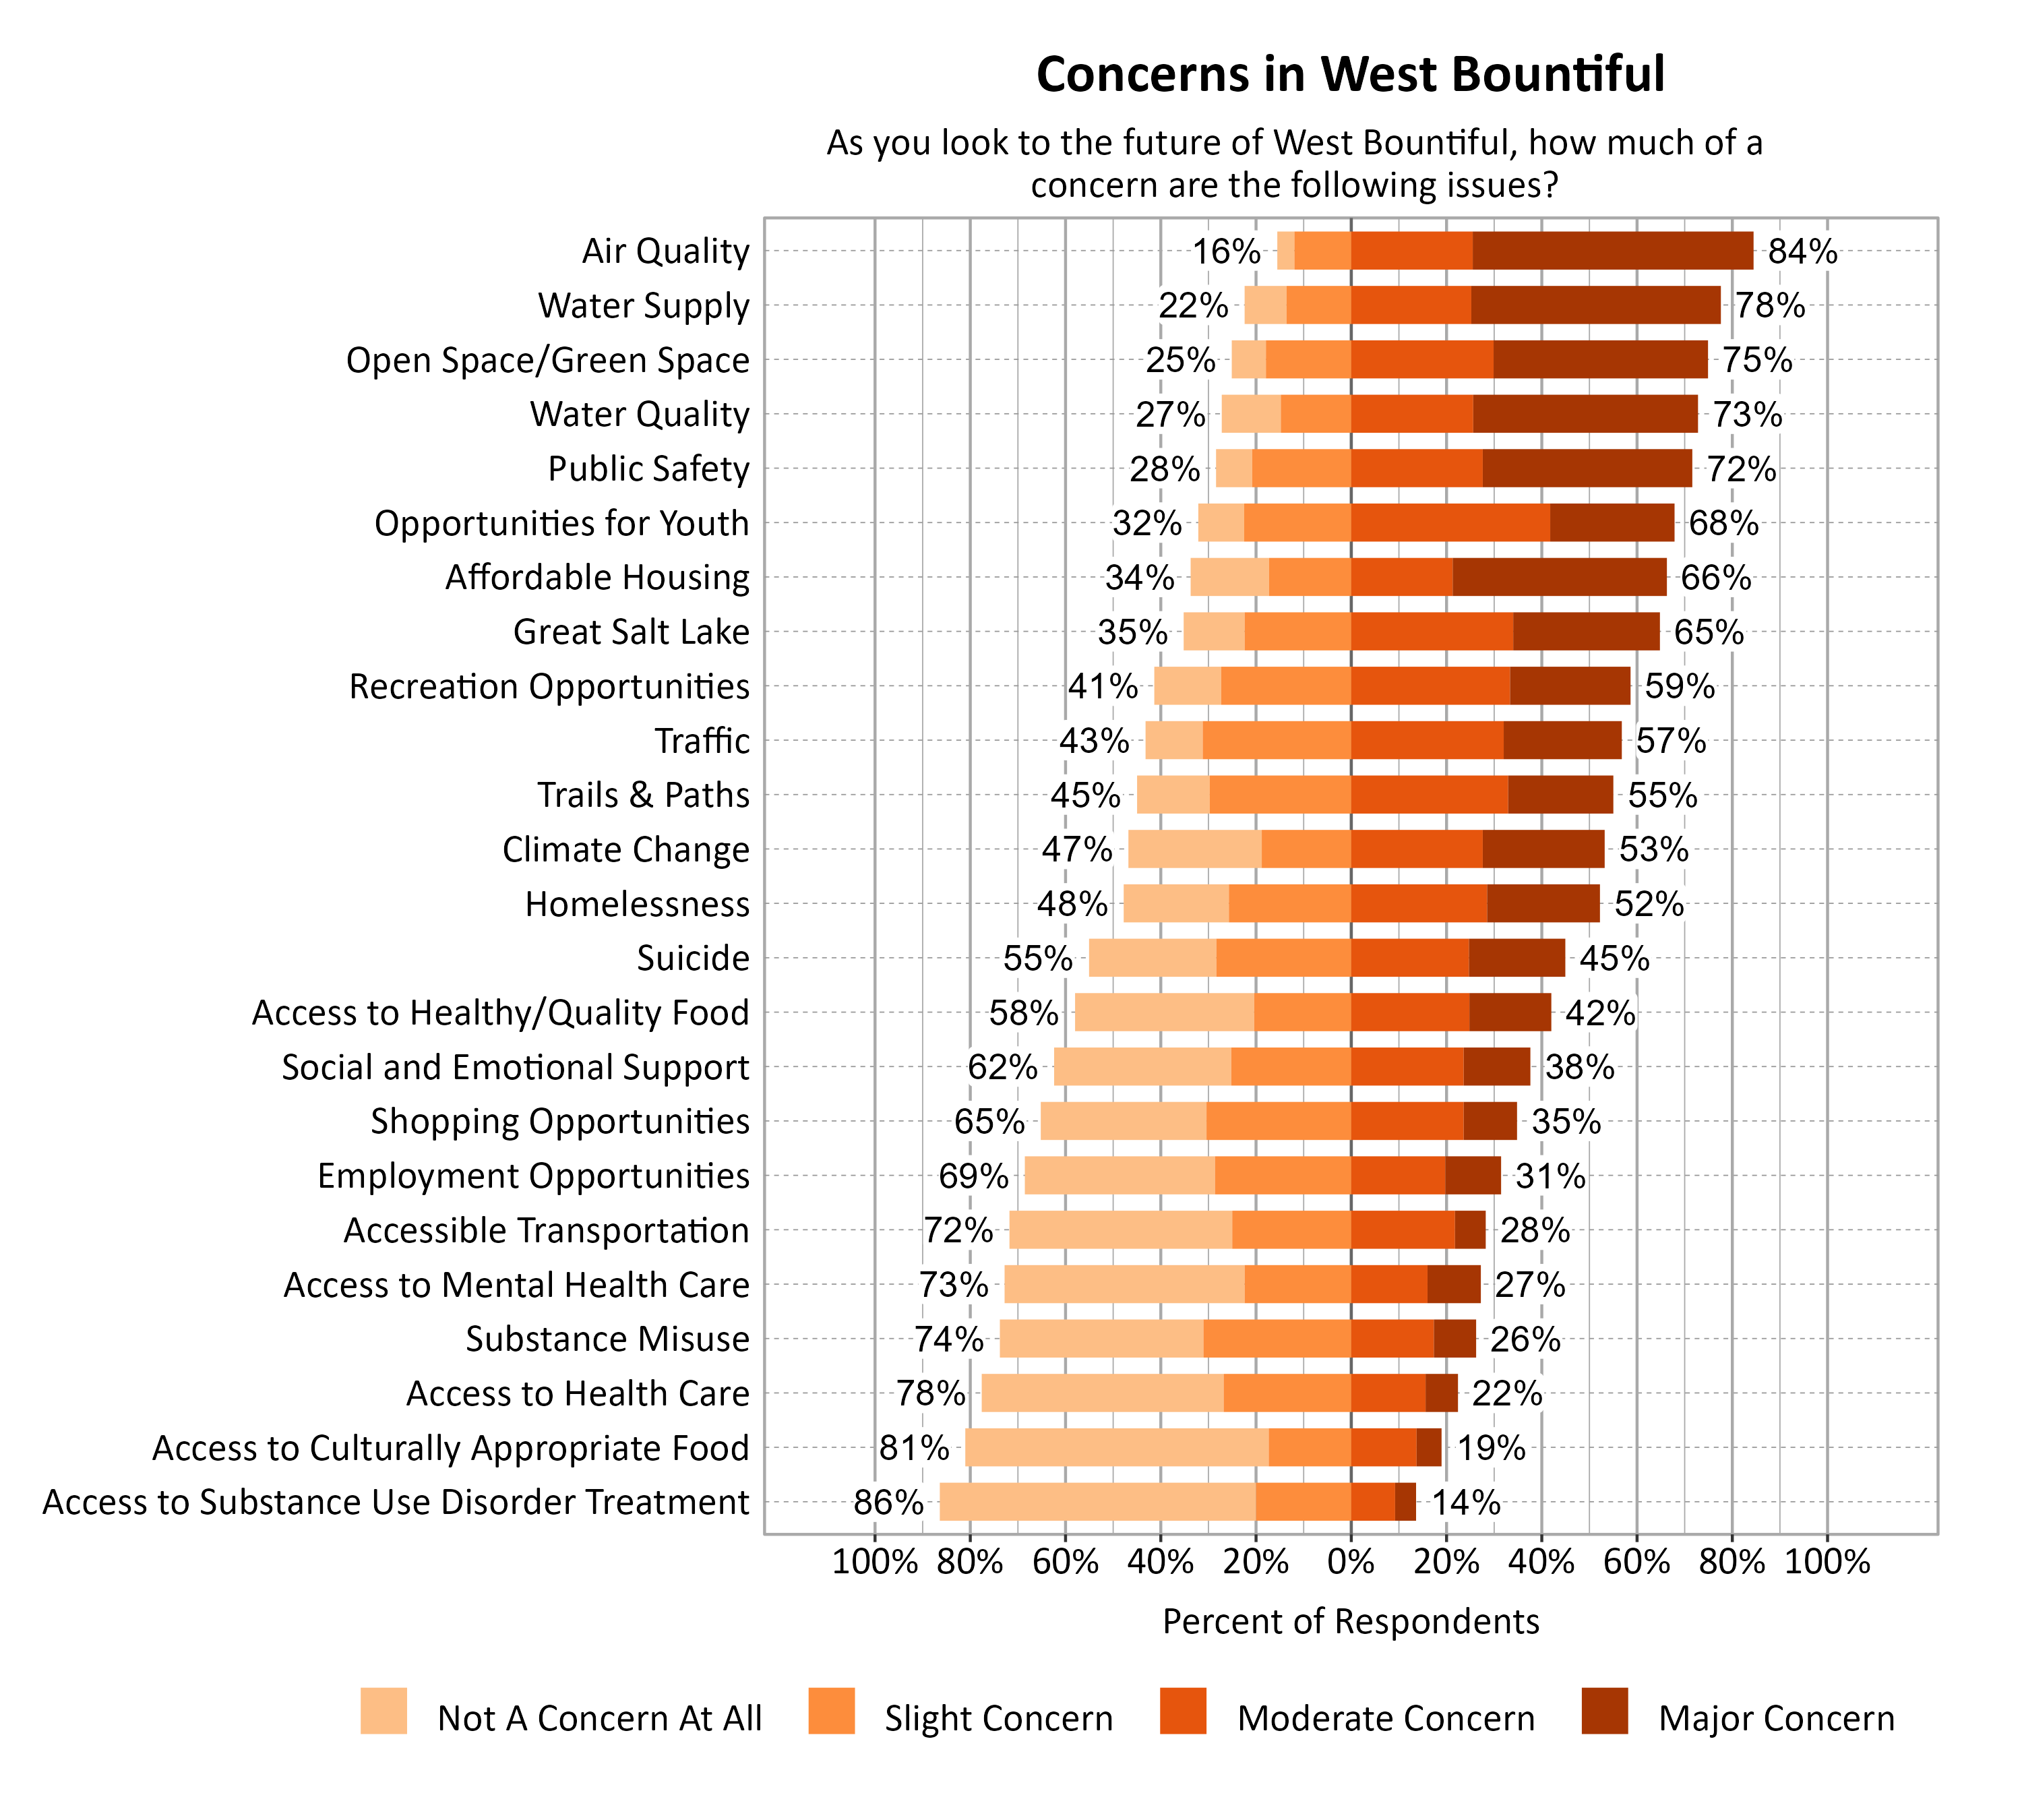
Survey respondents indicated the degree to which a number of possible local issues were a concern as they look to the future of West Bountiful. Air Quality (84%), Water Supply (78%), and Open Space/Green Space (75%) were the top concerns.
Additional Questions for West Bountiful
Accessory Dwelling Units in West Bountiful
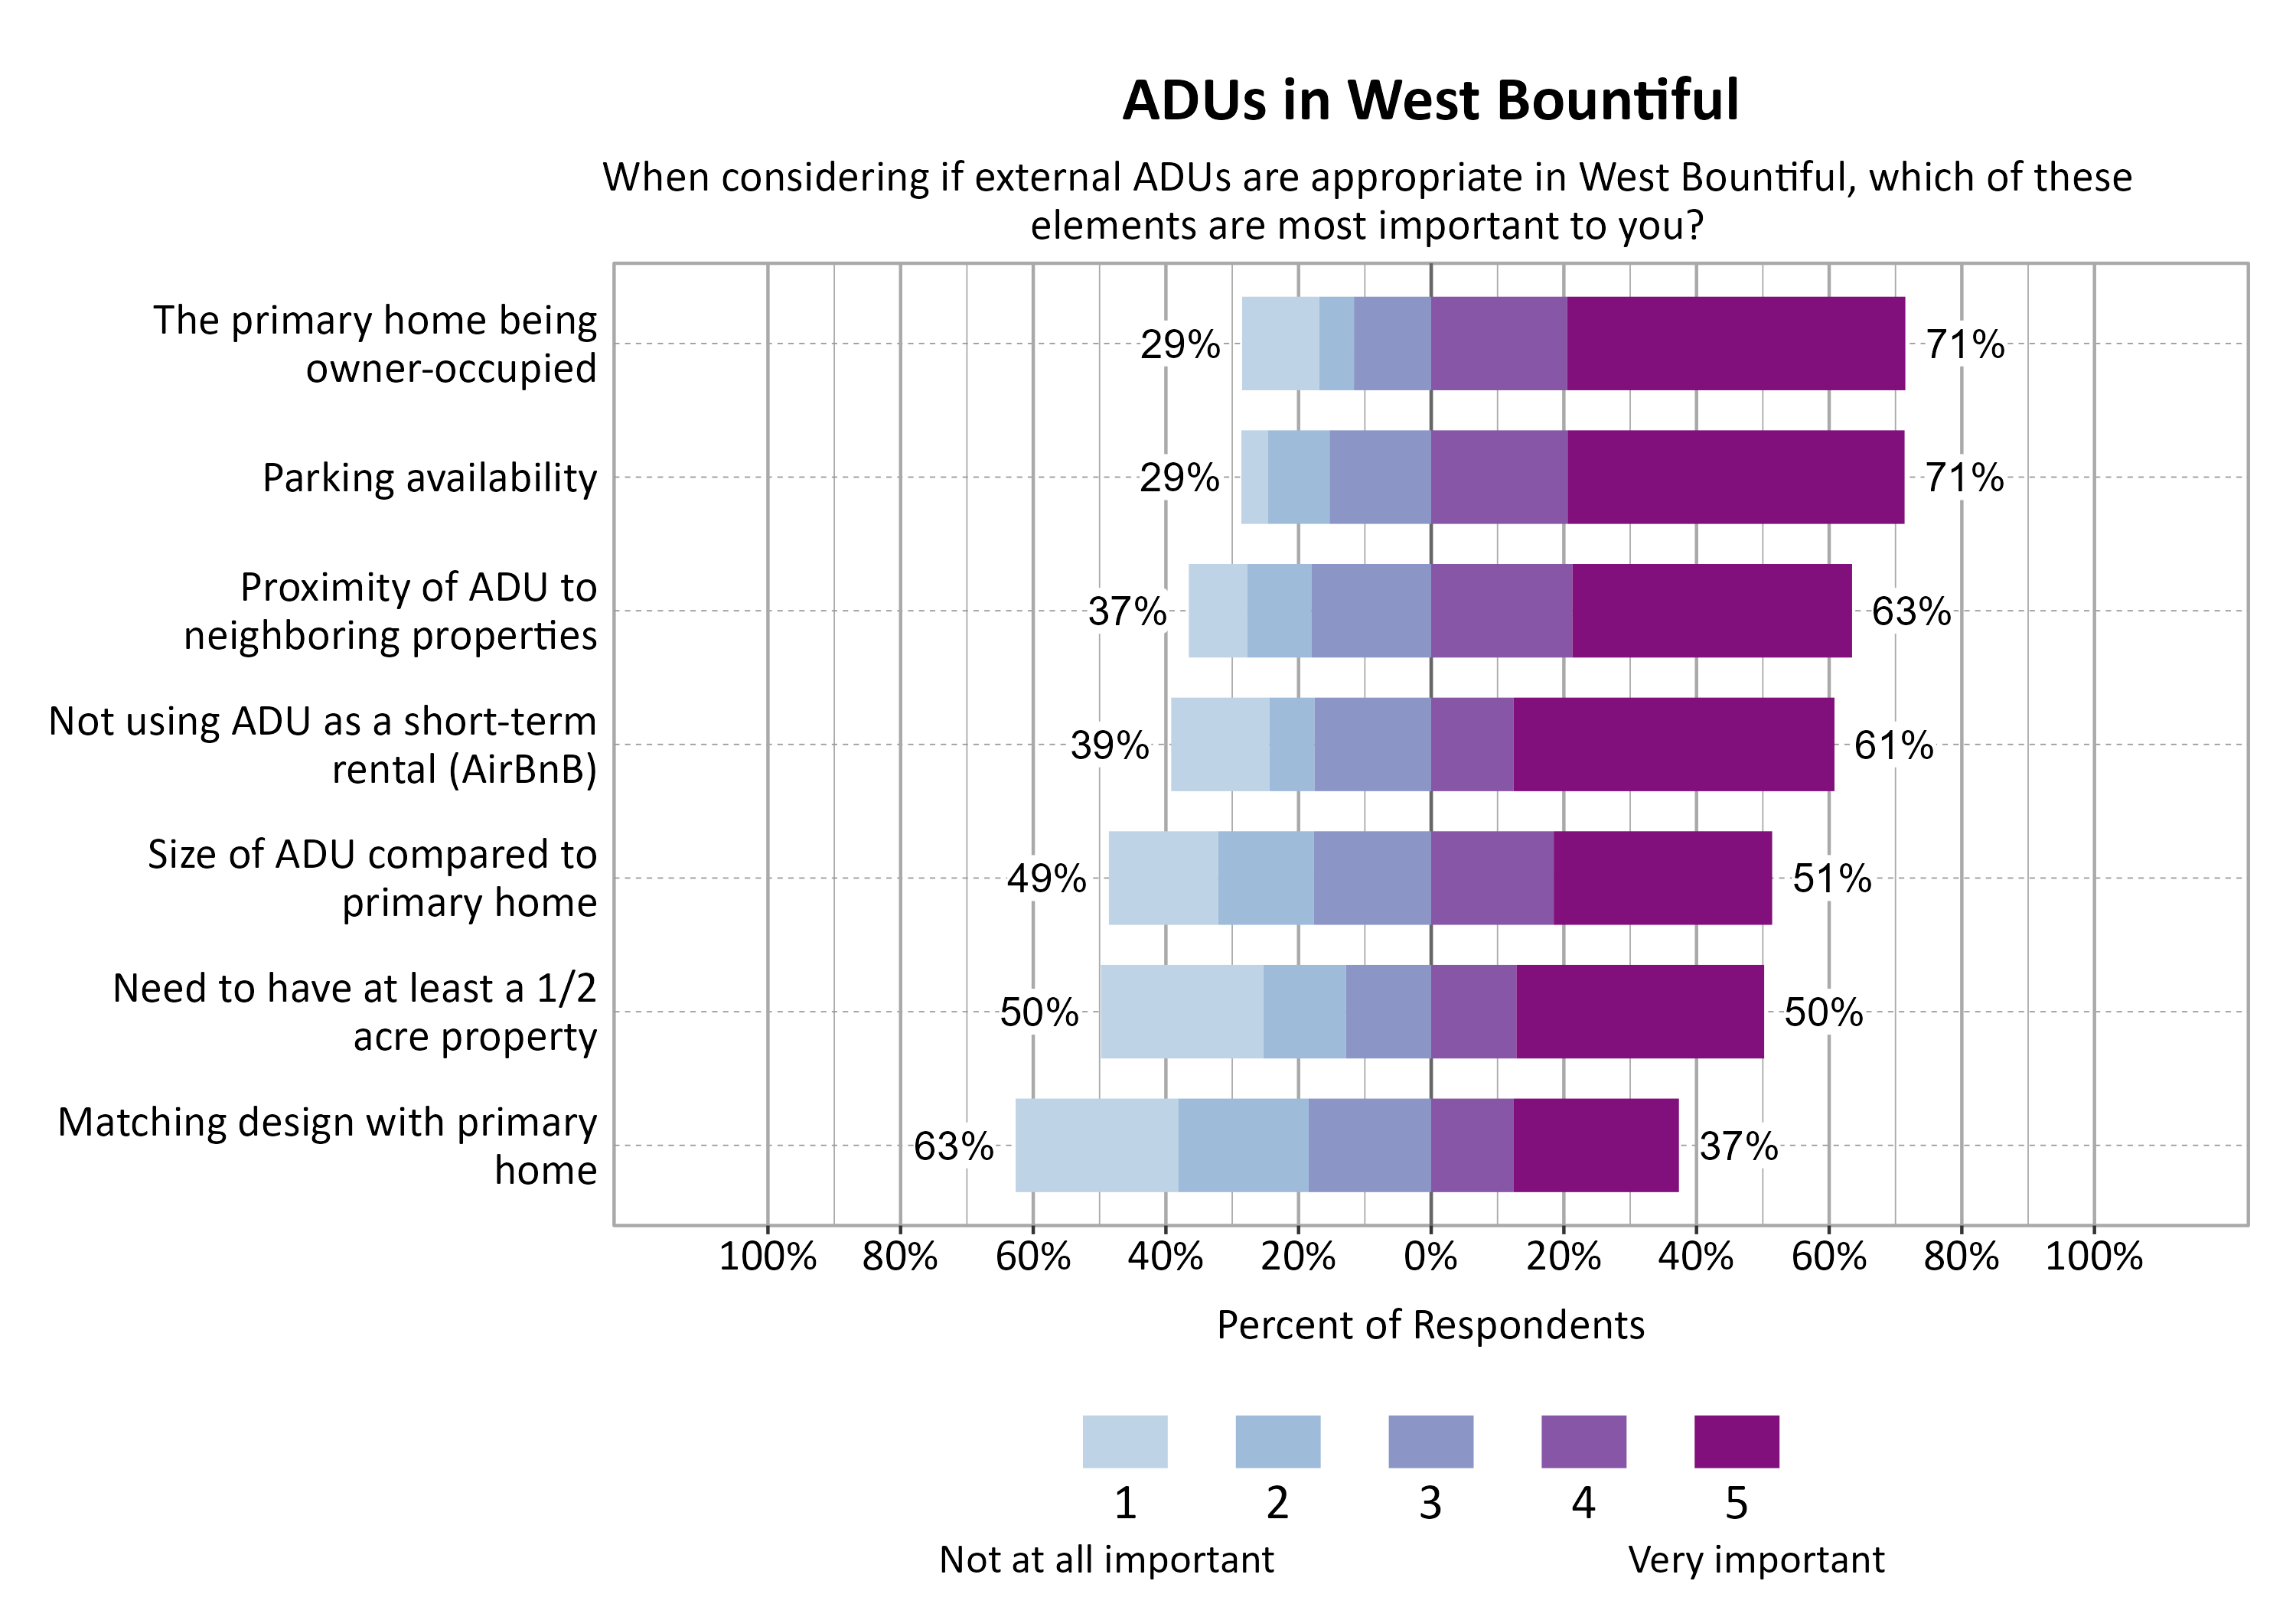
Residents were asked the following question regarding Accessory Dwelling Units in West Bountiful, “An external Accessory Dwelling Unit (ADU) is a non-attached secondary housing unit on a single-family residential lot. When considering if external ADUs are appropriate in West Bountiful, which of these elements are most important to you?” The most popular answers were The primary home being owner-occupied (71%) and Parking availability (71%).
Open Comments
All open comments collected in the survey were shared with city leaders. General observations and themes are shared here.
What Respondents Value Most in West Bountiful
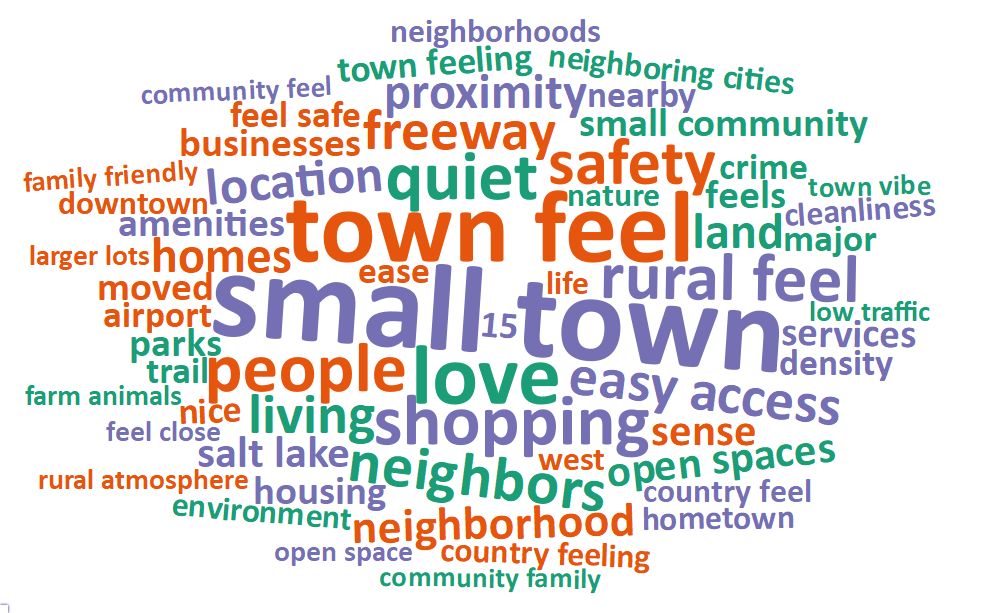
Survey respondents were asked to comment on what they value most about West Bountiful. The most common words and phrases from all city comments are included in the word cloud below. It is possible that negative or unrelated words may appear since these words have been taken out of context, and they may not indicate the respondent’s intended meaning. The majority of comments on values highlighted the small-town character and rural feel of West Bountiful. Respondents indicated they value the sense of community, friendly neighbors, and the balance between rural living and proximity to urban amenities. The location was valued for its convenience, providing easy access to city services and recreational opportunities while maintaining a quieter, less crowded atmosphere.
Local Environmental Quality in West Bountiful
The 47% of respondents who rated the Local Environmental Quality domain as 1, 2, or 3 (Poor, Fair, or Moderate) were further asked if there are specific aspects of local environmental quality that they feel are problematic. Air quality was a major concern, due to the nearby refineries, dust from the Great Salt Lake, I-15, and air traffic. The refineries were said to be an eyesore and some expressed concerned about long-term health effects of living close to the refineries. Noise pollution was mentioned due to the refinery’s alarms, air traffic, and I-15. Water scarcity was also noted frequently.
Improving Wellbeing in West Bountiful
Survey respondents were asked if there is anything that could be done to improve wellbeing in West Bountiful. Many comments expressed the need for improvements to roads, sidewalks, and traffic control. There were significant concerns about traffic safety, especially around schools, as well as calls for better maintenance of roads and public spaces. Improving air quality and reducing noise pollution, particularly from planes and traffic, were also prominent issues. Many comments also mentioned a need for stricter enforcement of existing city ordinances, particularly regarding the upkeep of properties, parking regulations, and limiting the number of residents per household. Some respondents also expressed that they would like city leaders to be more responsive to residents’ concerns and to foster a greater sense of community. Many comments also expressed a need for improvements in air and water quality, installation of noise barriers, mosquito/bug control, and preservation of agricultural land/green space.
Additional Comments
Respondents were also asked if they had any additional comments on wellbeing in West Bountiful. Many West Bountiful respondents expressed appreciation for the quality of life the city offers and that they love living there. Efforts of the local police in maintaining order and safety were appreciated, although concerns were mentioned about increasing traffic, speeding, and overdevelopment. There was a widespread desire to preserve the town’s small-town feel, natural open spaces, and historical character, with many opposing the construction of large apartment complexes and detached accessory dwelling units (ADUs). Some respondents advocated for more flexible regulations on ADUs and home-based businesses, while others were concerned about maintaining the aesthetics and functionality of neighborhoods. Concerns about local governance were significant, with many saying that city officials are sometimes unresponsive or too focused on enforcing strict codes and regulations. There was a call for better communication, transparency, and more responsive leadership that prioritizes community needs.