West Jordan Wellbeing Survey Findings 2024
By Dr. Courtney Flint and Team
![]()
Contact Information
Dr. Courtney Flint
courtney.flint@usu.edu
435-797-8635
Summary
West Jordan is one of 51 cities participating in the Utah Wellbeing Survey Project in 2024. This project is designed to assess the wellbeing and local perspectives of city residents and to provide information to city leaders to inform general planning processes. Additional analysis is underway and this report may be updated over time.
We are grateful to all those who took the survey and to our city partners who helped to make this possible. We are grateful to a number of entities for funding: the Utah League of Cities and Towns, USU Extension, USU’s Institute for Land Water and Air, the Wasatch Front Regional Council, Utah Department of Transportation, the Utah Agricultural Experiment Station, and the cities of Alpine, Cedar Hills, Draper, Millcreek, Nephi, North Salt Lake, Ogden, Orem, Pleasant Grove, Providence, Springdale, Tremonton, West Bountiful, and West Valley City.
This report describes findings from the 2024 West Jordan survey and comparative information with other project cities. From late March to mid-May 2024, West Jordan City advertised the survey for residents largely through electronic newsletters and social media. All city residents age 18+ were encouraged to take the online Qualtrics survey.
How many people responded?
- 309 viable surveys were recorded in this 2024 survey effort.
- The West Jordan 2022 survey had 672 responses.
- The adult population of West Jordan was estimated at 83,036, based on the American Community Survey by the U.S. Census. The 309 survey responses in 2024 represent 0.4% of the adult population and have a conservative margin of error of 5.56%.
Survey Respondent Characteristics
| Resident Statistics | |
|---|---|
| Full Time Residents of West Jordan | 98.7% |
| Part Time Residents of West Jordan | 1.3% |
| Length of Residency — Range | 0.1-66 years |
| Length of Residency — Average | 17.8 years |
| Length of Residency — Median | 15 years |
| Length of Residency 5 Years or less | 20.5% |
| ZIP Code | Percent |
|---|---|
| 84081 | 41.1% |
| 84084 | 20.1% |
| 84088 | 37.5% |
| 84123 | 1.0% |
| Other | 0.3% |
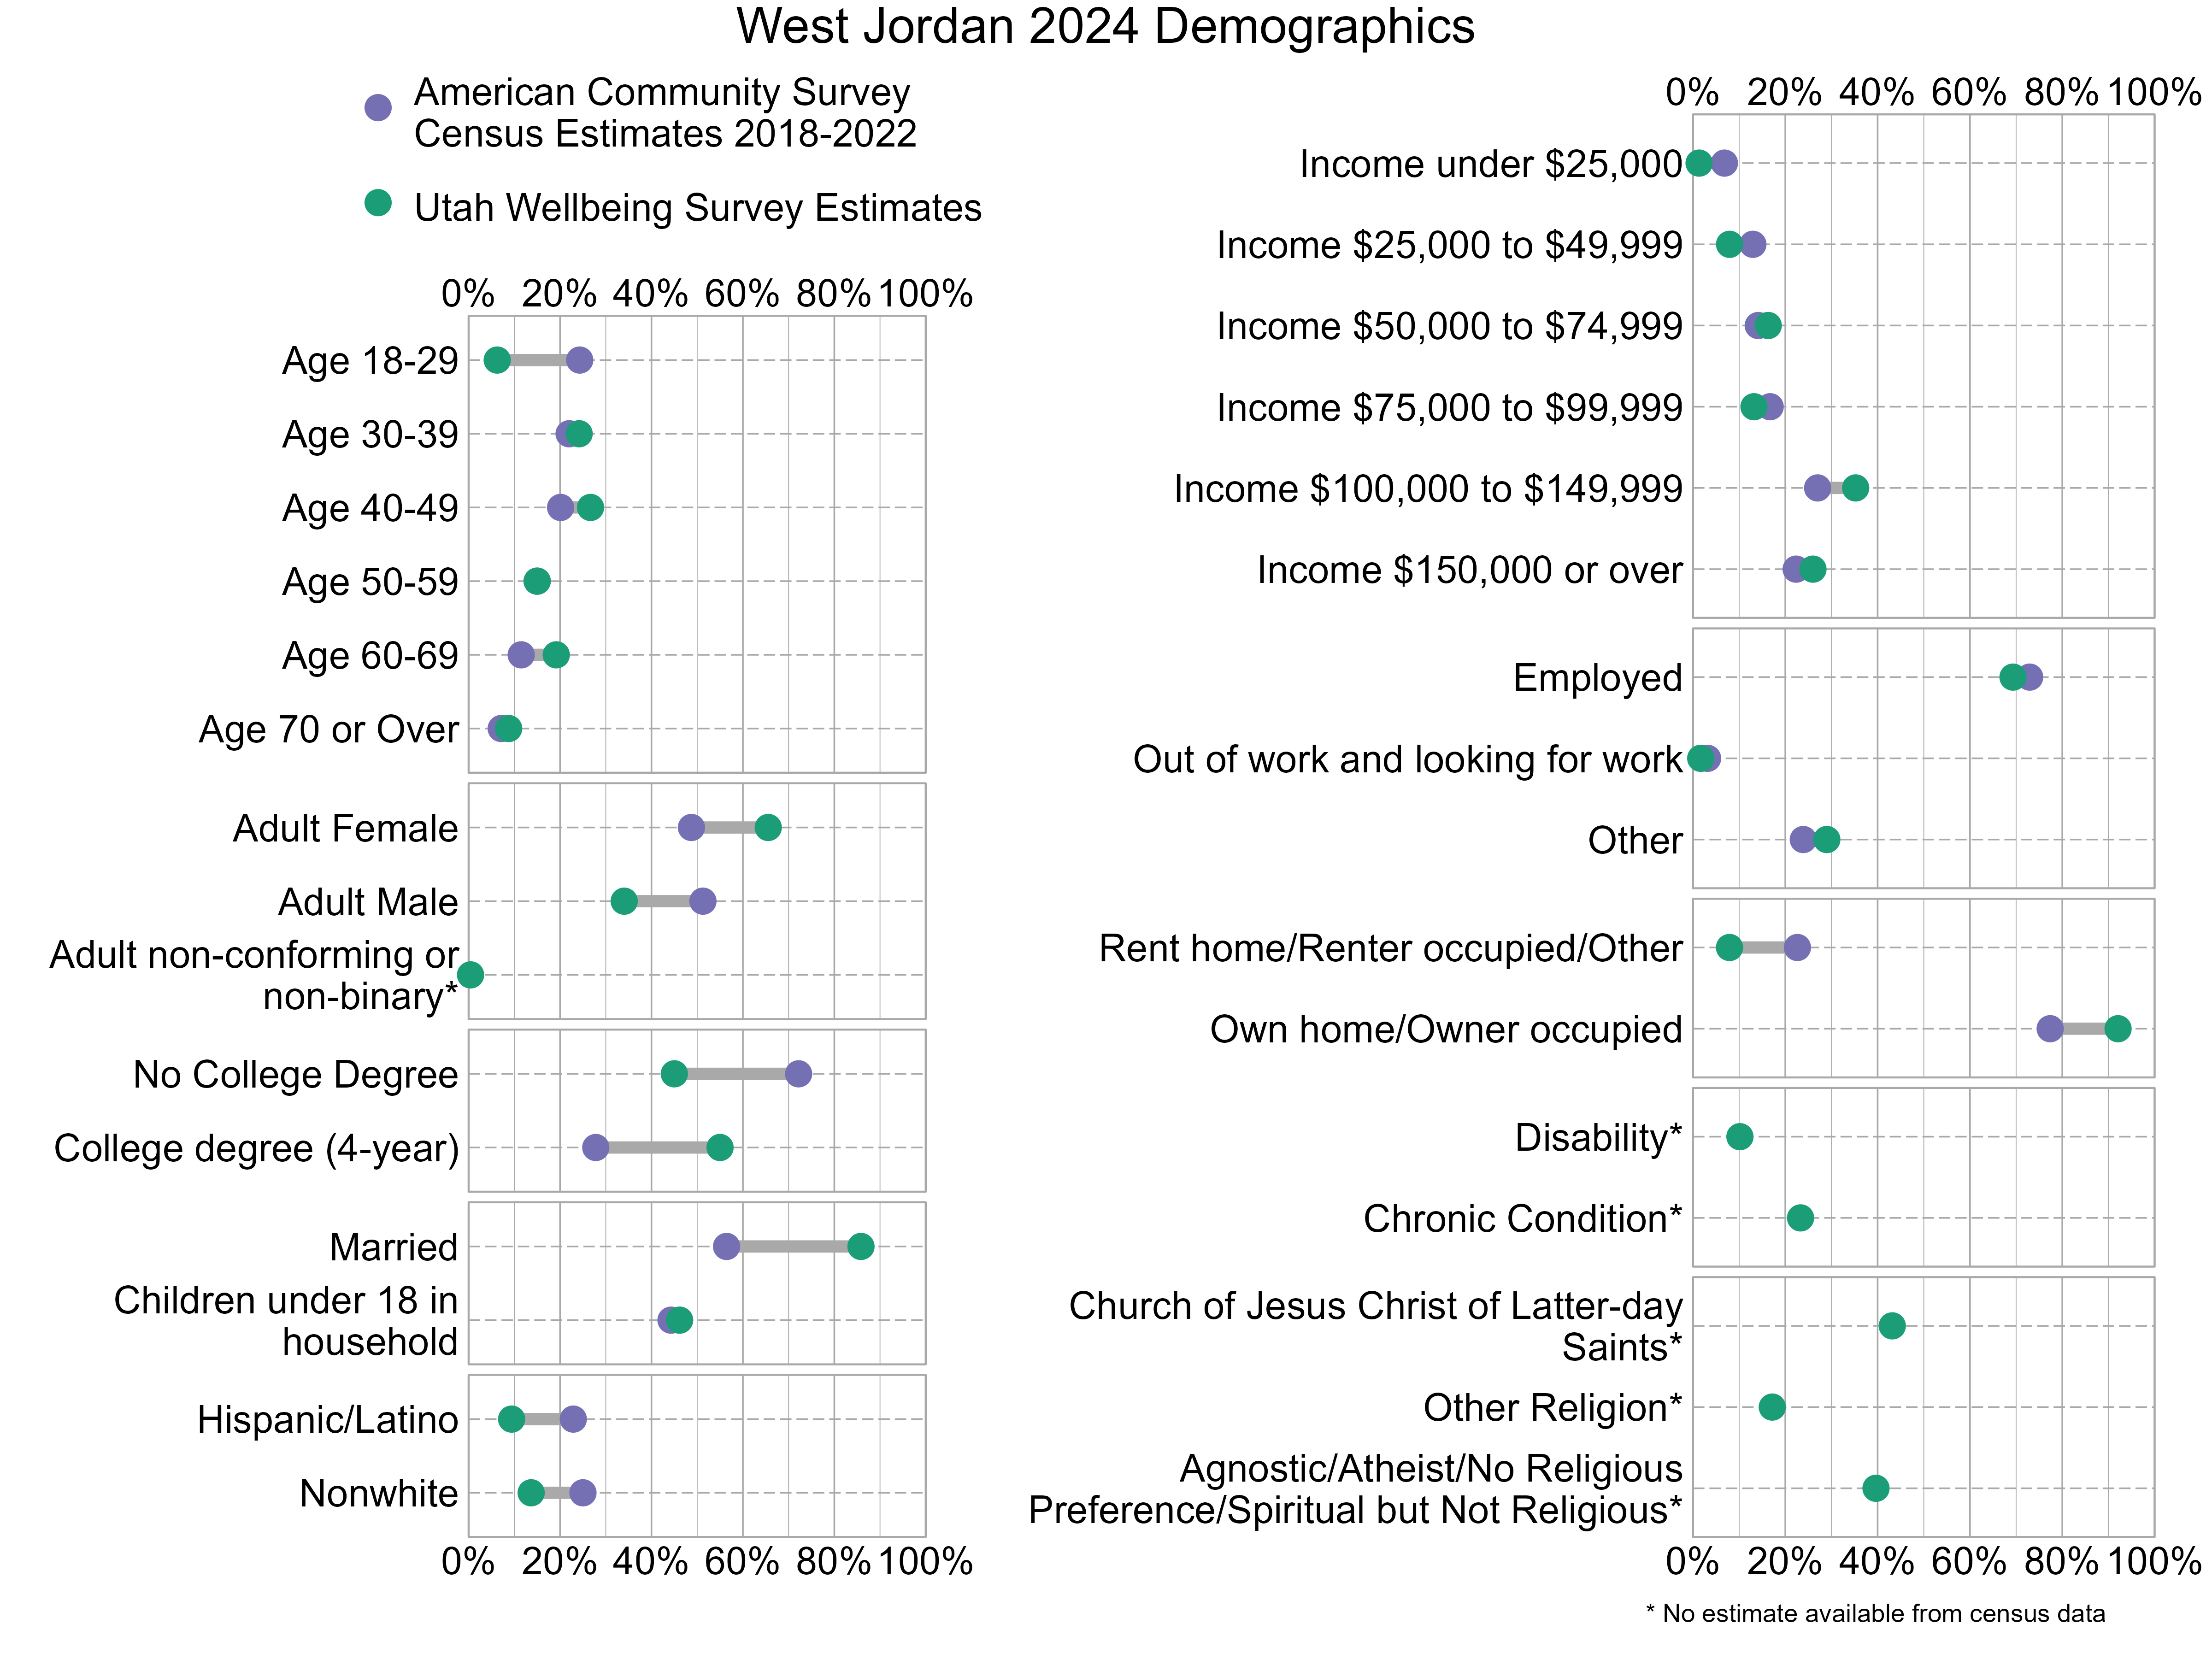
Demographic characteristics of the survey respondents were compared below with U.S. Census information from the 2018-2022 American Community Survey. In the graph below, gray bars indicate differences between the American Community Survey estimates and the Utah Wellbeing Project surveys. The wider the gray bars, the larger the differences. Also note that estimates for religious affiliation, adult non-conforming or non-binary gender, disability, and chronic conditions are unavailable from the census data. There can also be a variable margin of error in the American Community Survey estimates, and caution should be used when comparing estimates. Not all respondents provided demographic information. As the graph shows, 2024 survey respondents were not fully representative of West Jordan. People who are adult females, have at least a 4-year college degree, and are married were overrepresented while those who are age 18-29, are adult males, and do not have a college degree were underrepresented.
Overall Personal Wellbeing and Overall Wellbeing in West Jordan
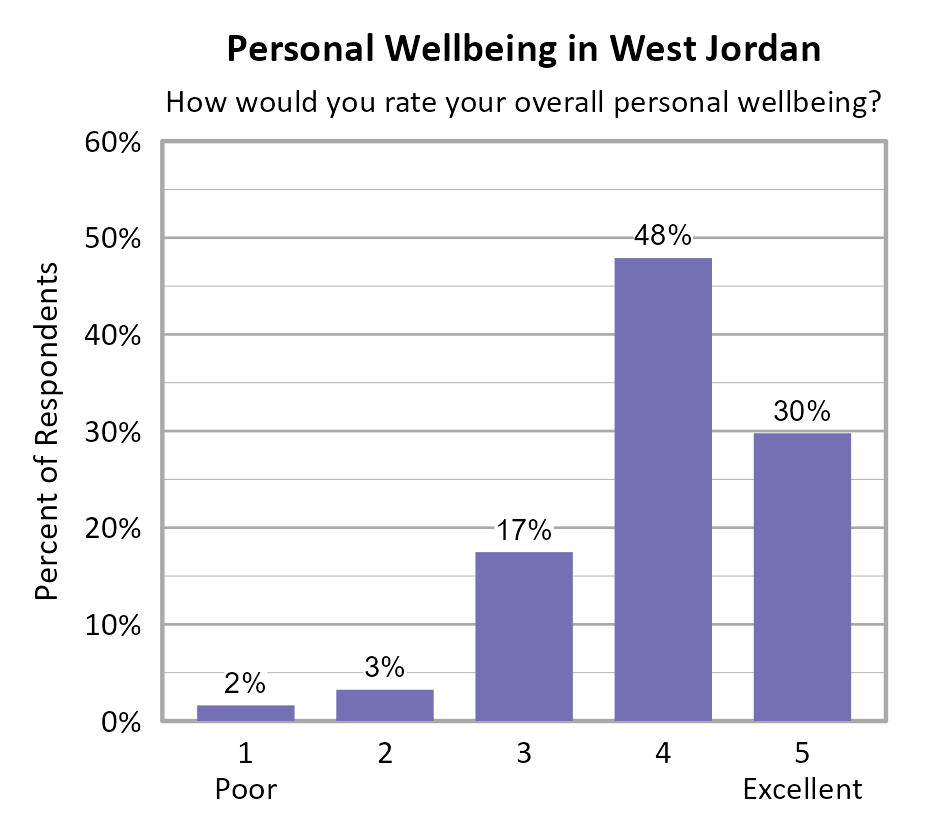
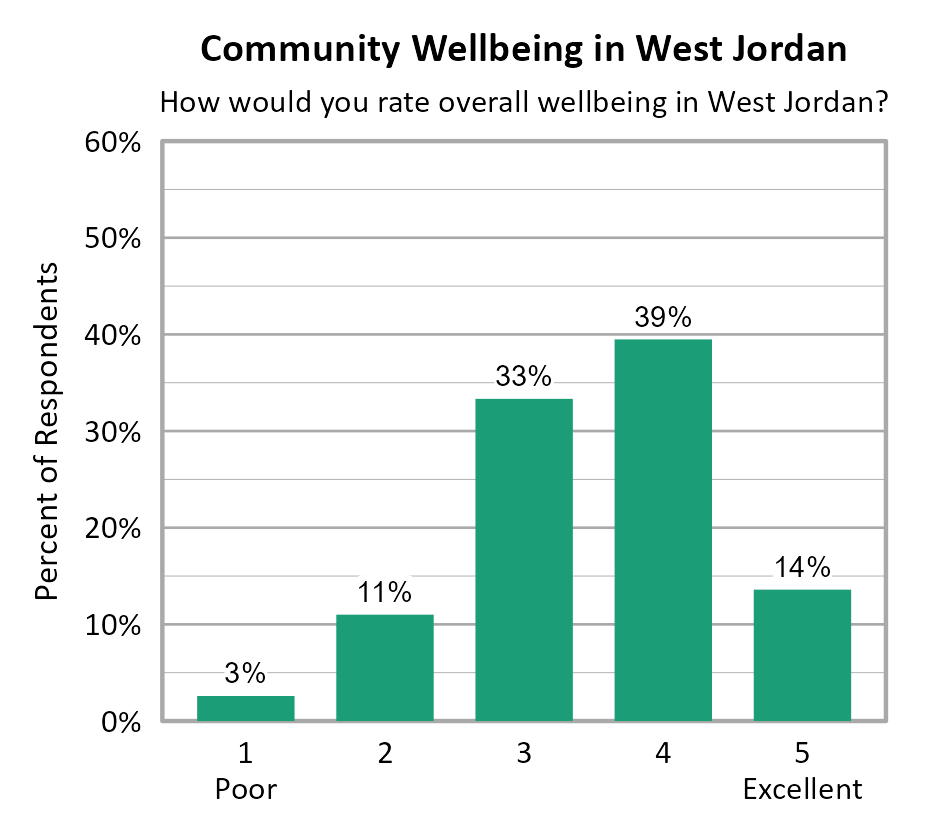
Survey participants were asked about their overall personal wellbeing and overall community wellbeing in West Jordan. These wellbeing indicators were both measured on a 5-point scale from poor (1) to excellent (5). The average personal wellbeing score in West Jordan was 4.01 with 78% of respondents indicating their wellbeing at a 4 or 5 on the 5-point scale. The average score for community wellbeing in West Jordan was 3.50 with 53% of respondents indicating community wellbeing at a 4 or 5 on the 5-point scale. While ZIP codes 84123 and 84084 had higher overall personal and community wellbeing scores than ZIP codes 84081 and 84088, these differences were not statistically significant.
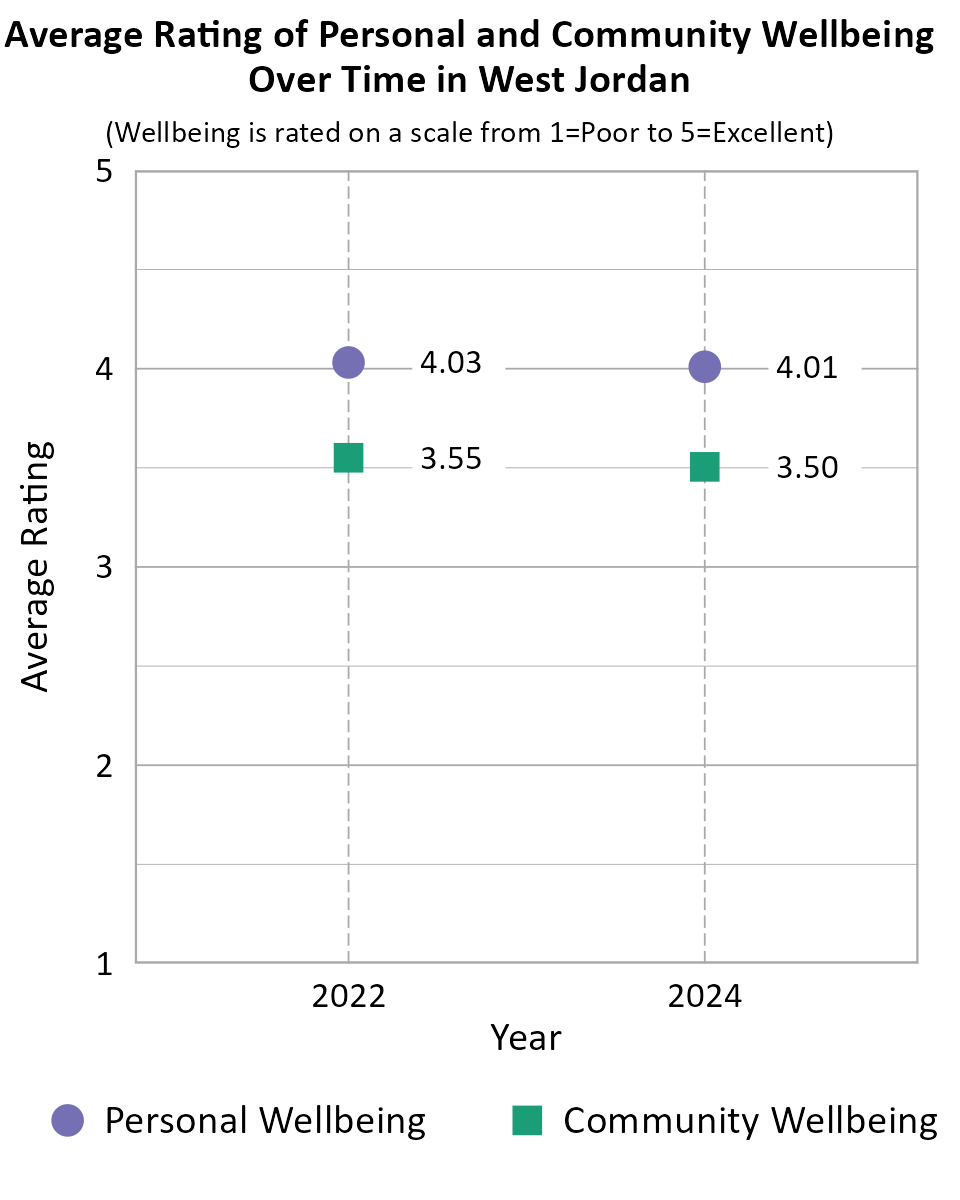
When comparing survey data from West Jordan over the years as shown in the information below, we can see that both the average personal wellbeing score and the average community wellbeing score remained nearly the same between 2022 and 2024. Note that the number of respondents differed between years, there is no tracking of individuals from one year to the next, and the low end of the scale was "Poor" in 2024 but "Very Poor" in prior years which may account for differences in scores over time.
Comparing Wellbeing Across Utah Cities
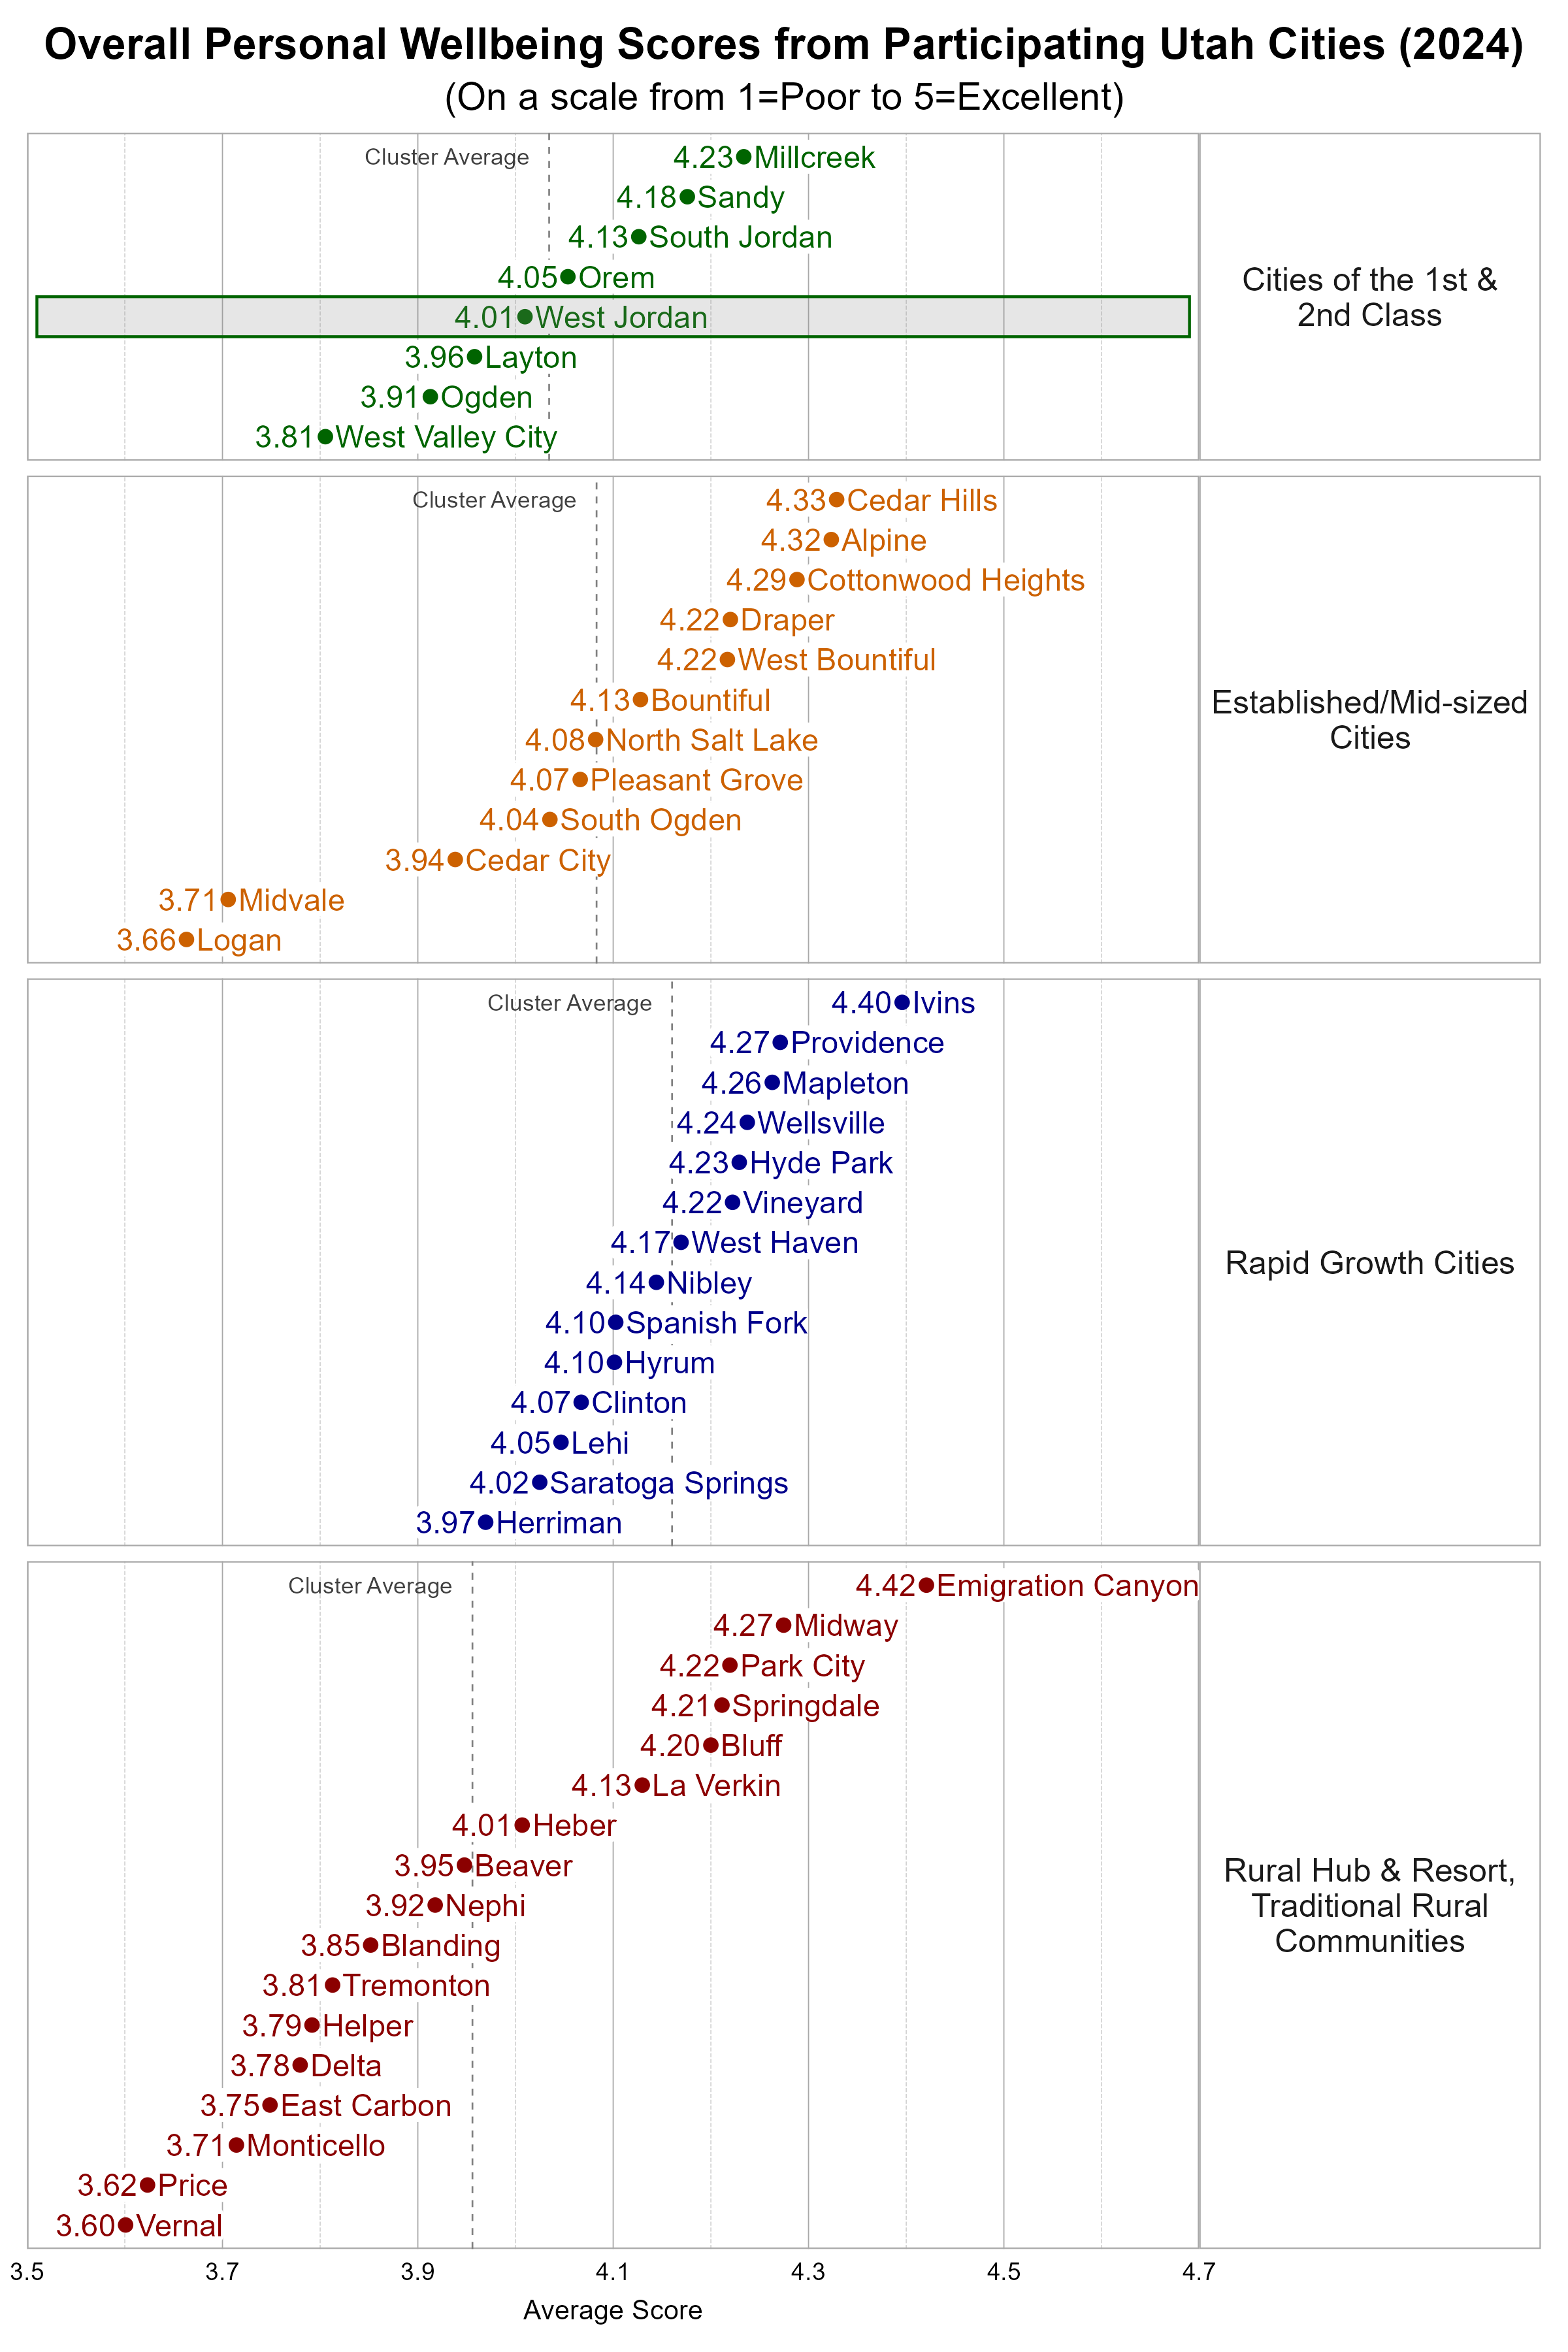
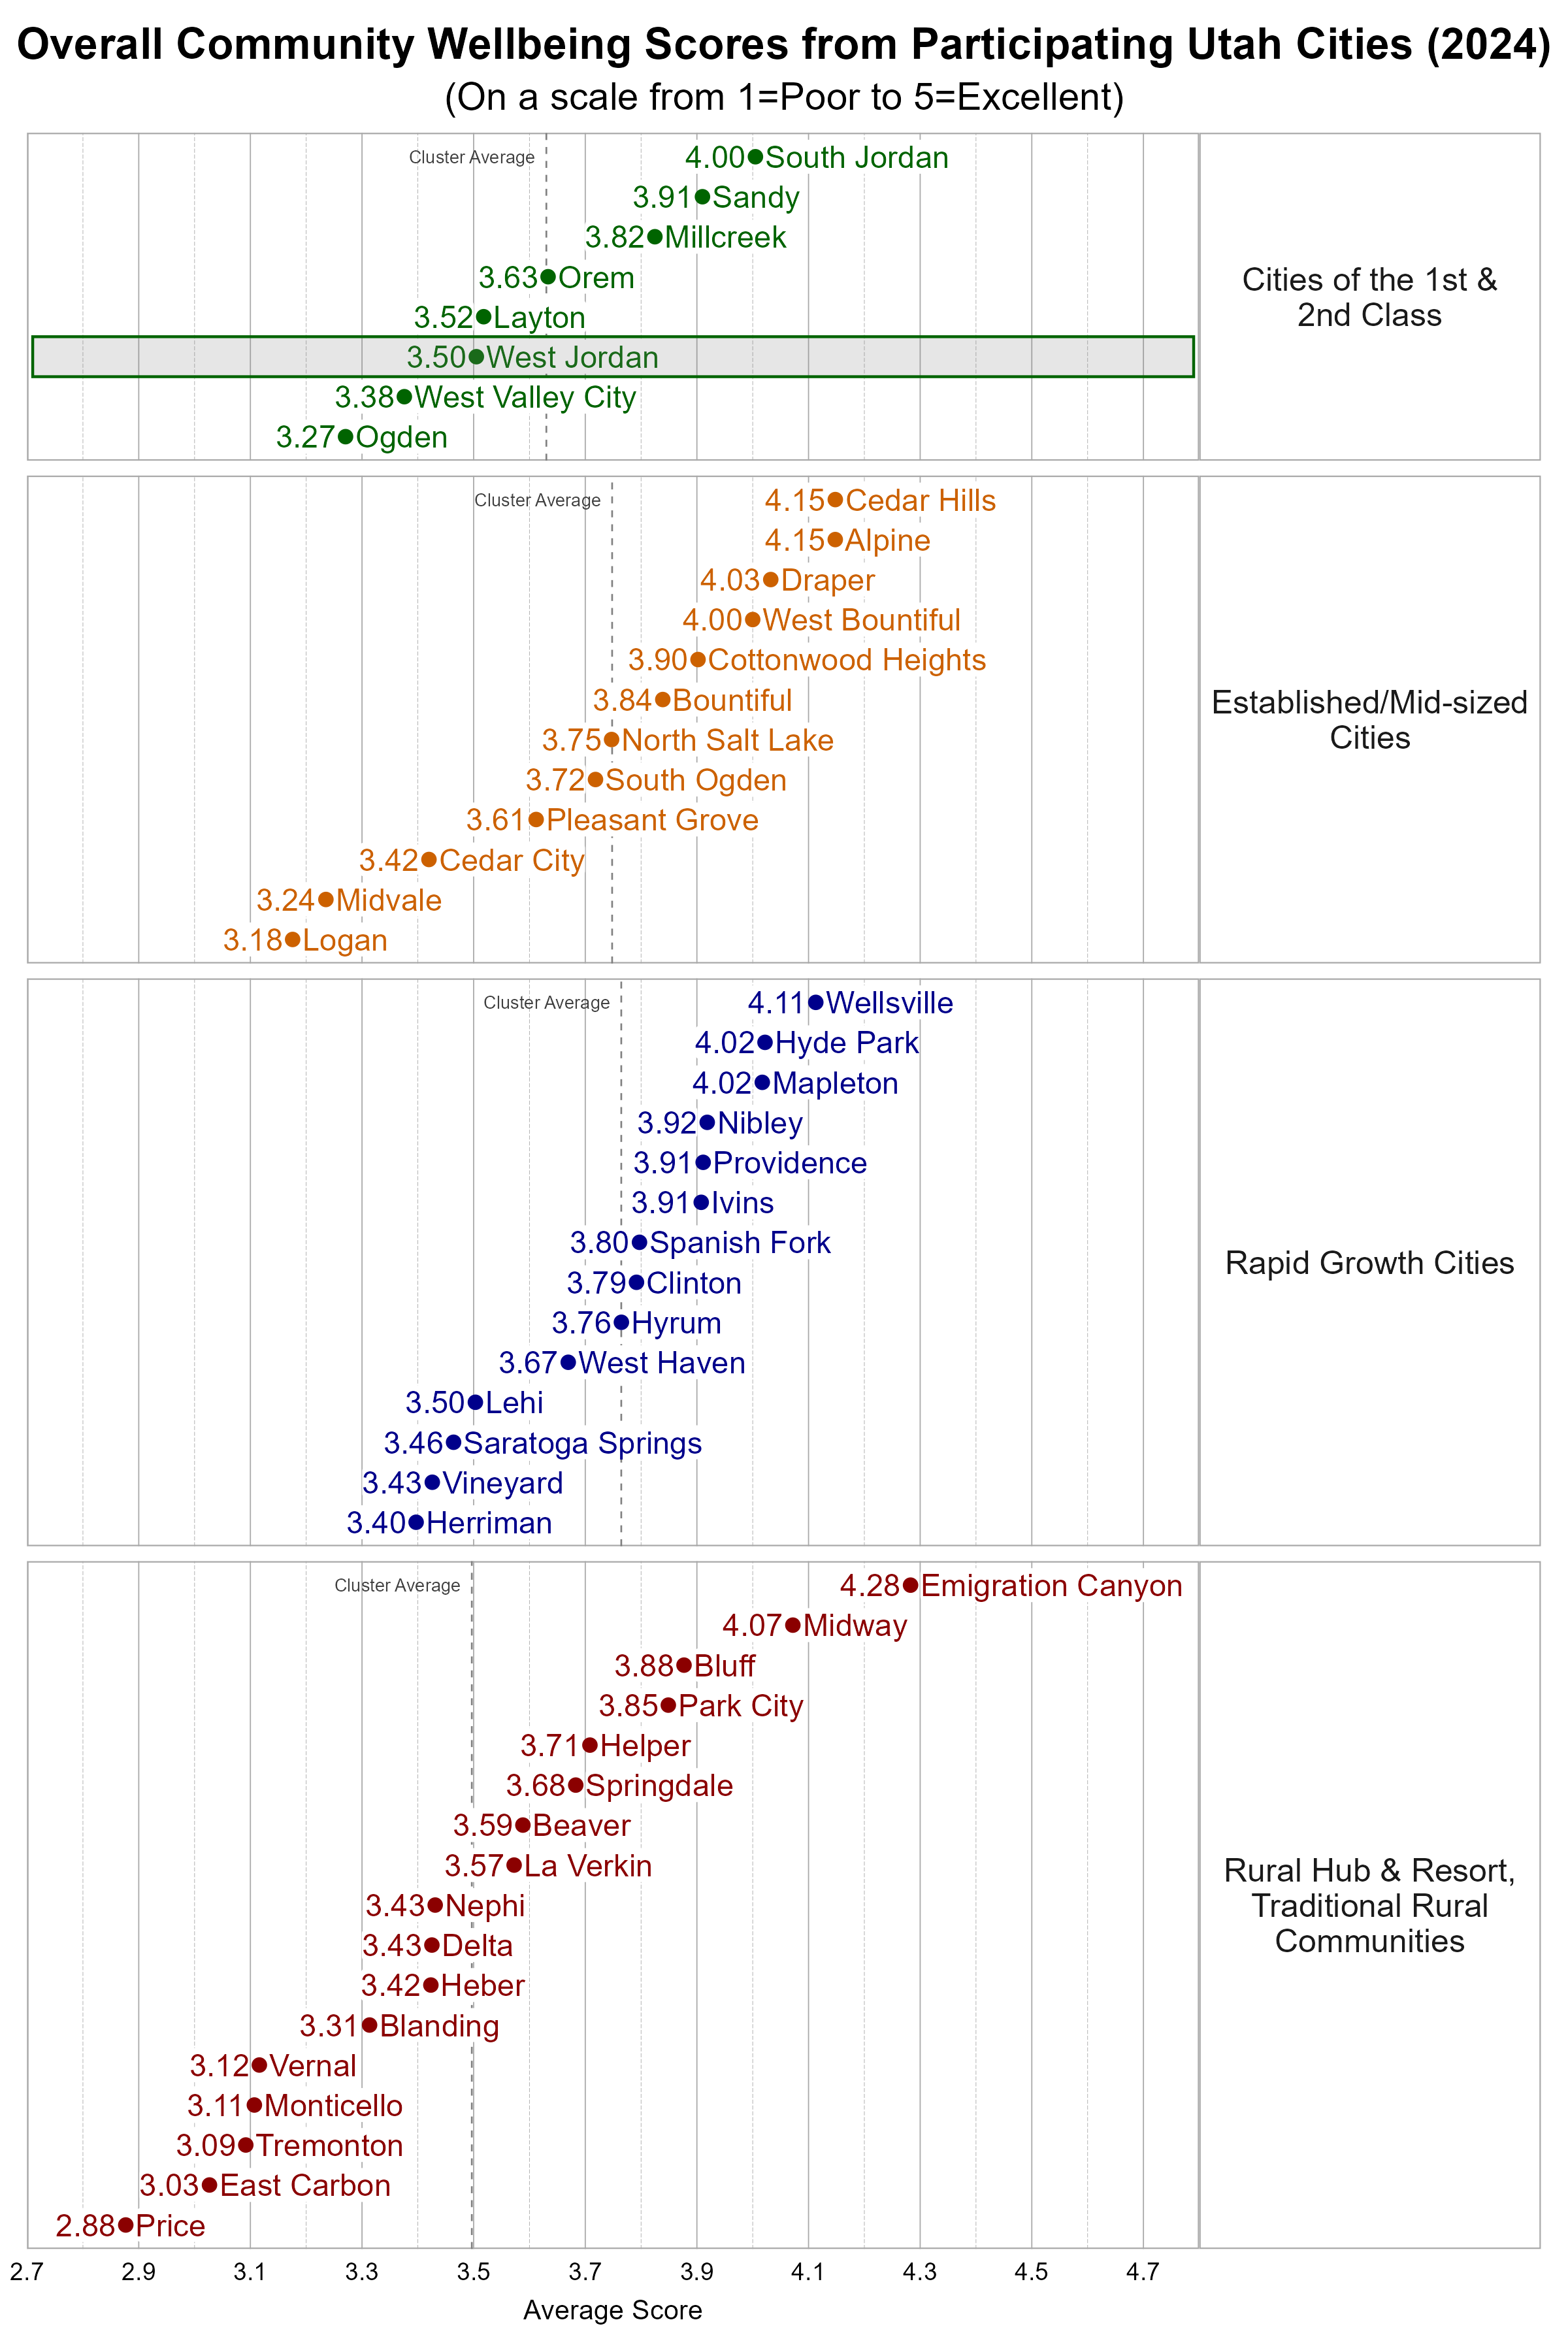
The Utah League of Cities and Towns clusters cities and towns into five different categories based on size and growth rates. We utilize these clusters in our analysis. West Jordan is classified as a City of the 1st and 2nd Class. Some cities may fit within more than one cluster.
Within the more Urban city cluster, West Jordan was slightly below the average overall personal wellbeing score and below the average overall community wellbeing score.
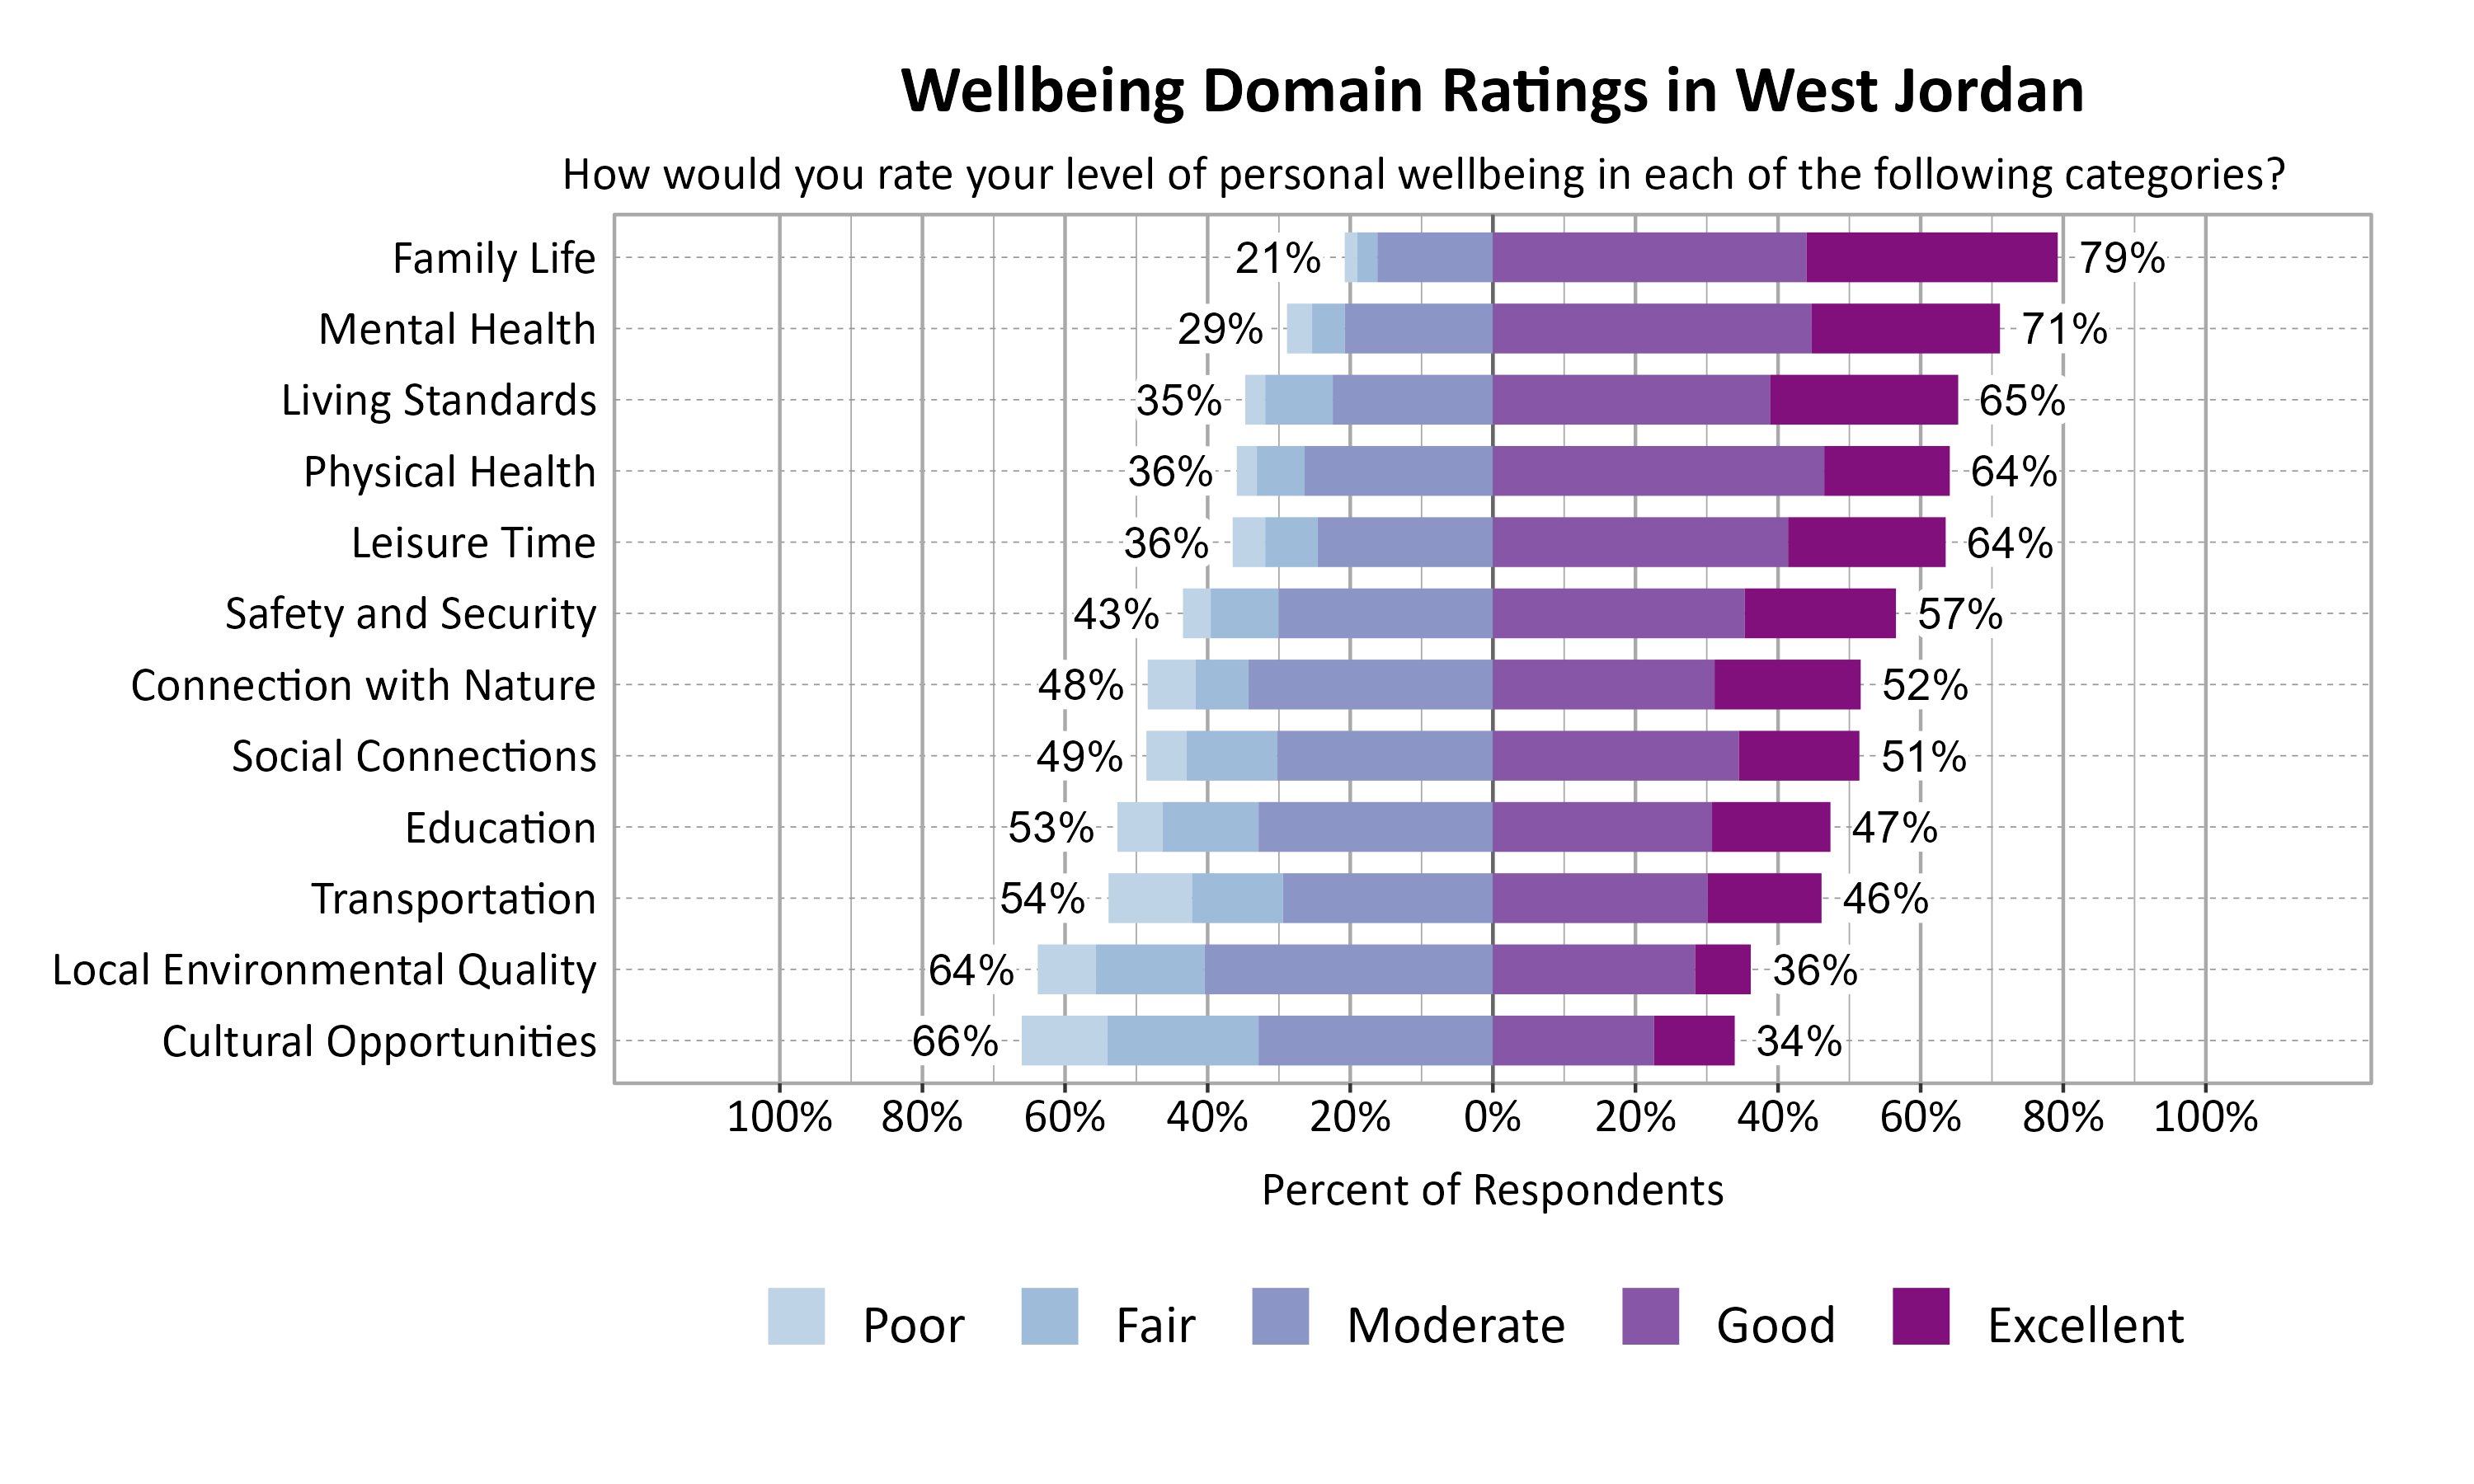
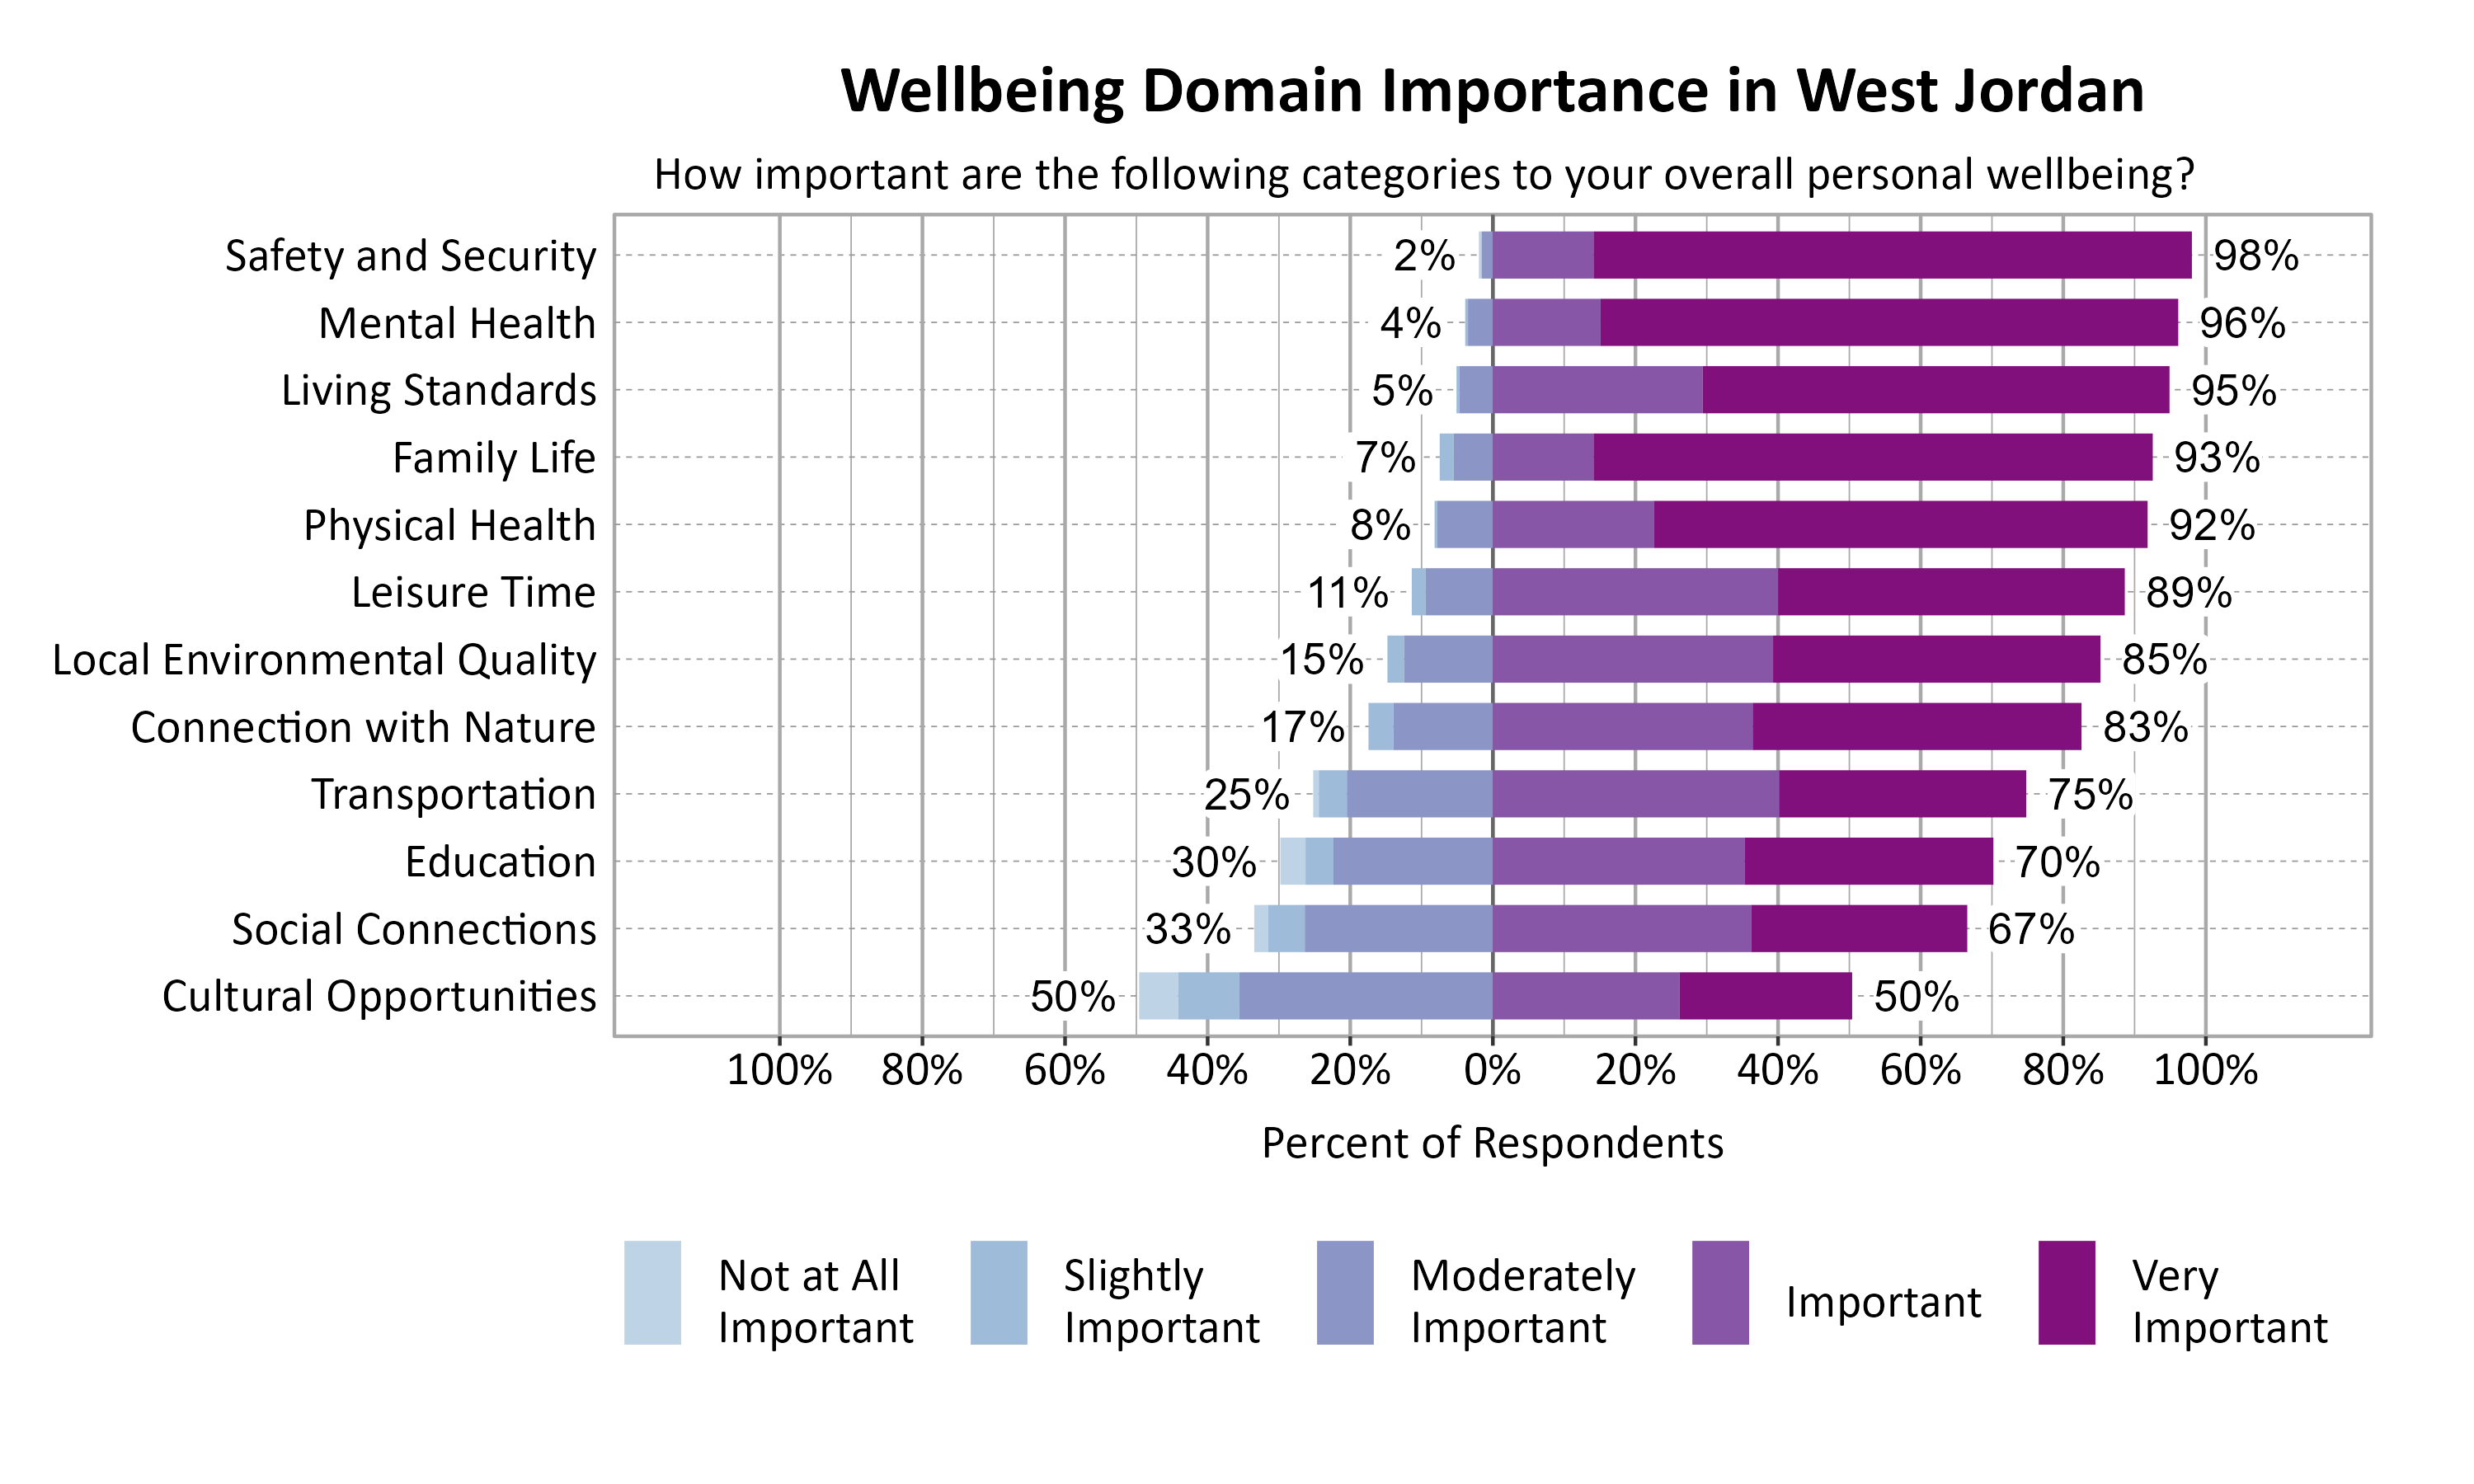
Wellbeing Domains in West Jordan
According to national and international entities that track wellbeing, there are a number of common dimensions or domains of wellbeing. Survey respondents rated twelve domains on a 5-point scale from poor to excellent. They were also asked to indicate the importance of each domain to their overall personal wellbeing on a 5-point scale from not at all important to very important. The highest rated wellbeing domains for respondents in West Jordan were Family Life (79%), Mental Health (71%), Living Standards (65%), Physical Health (64%), and Leisure Time (64%). The most important wellbeing domains were Safety and Security (98%), Mental Health (96%), and Living Standards (95%).
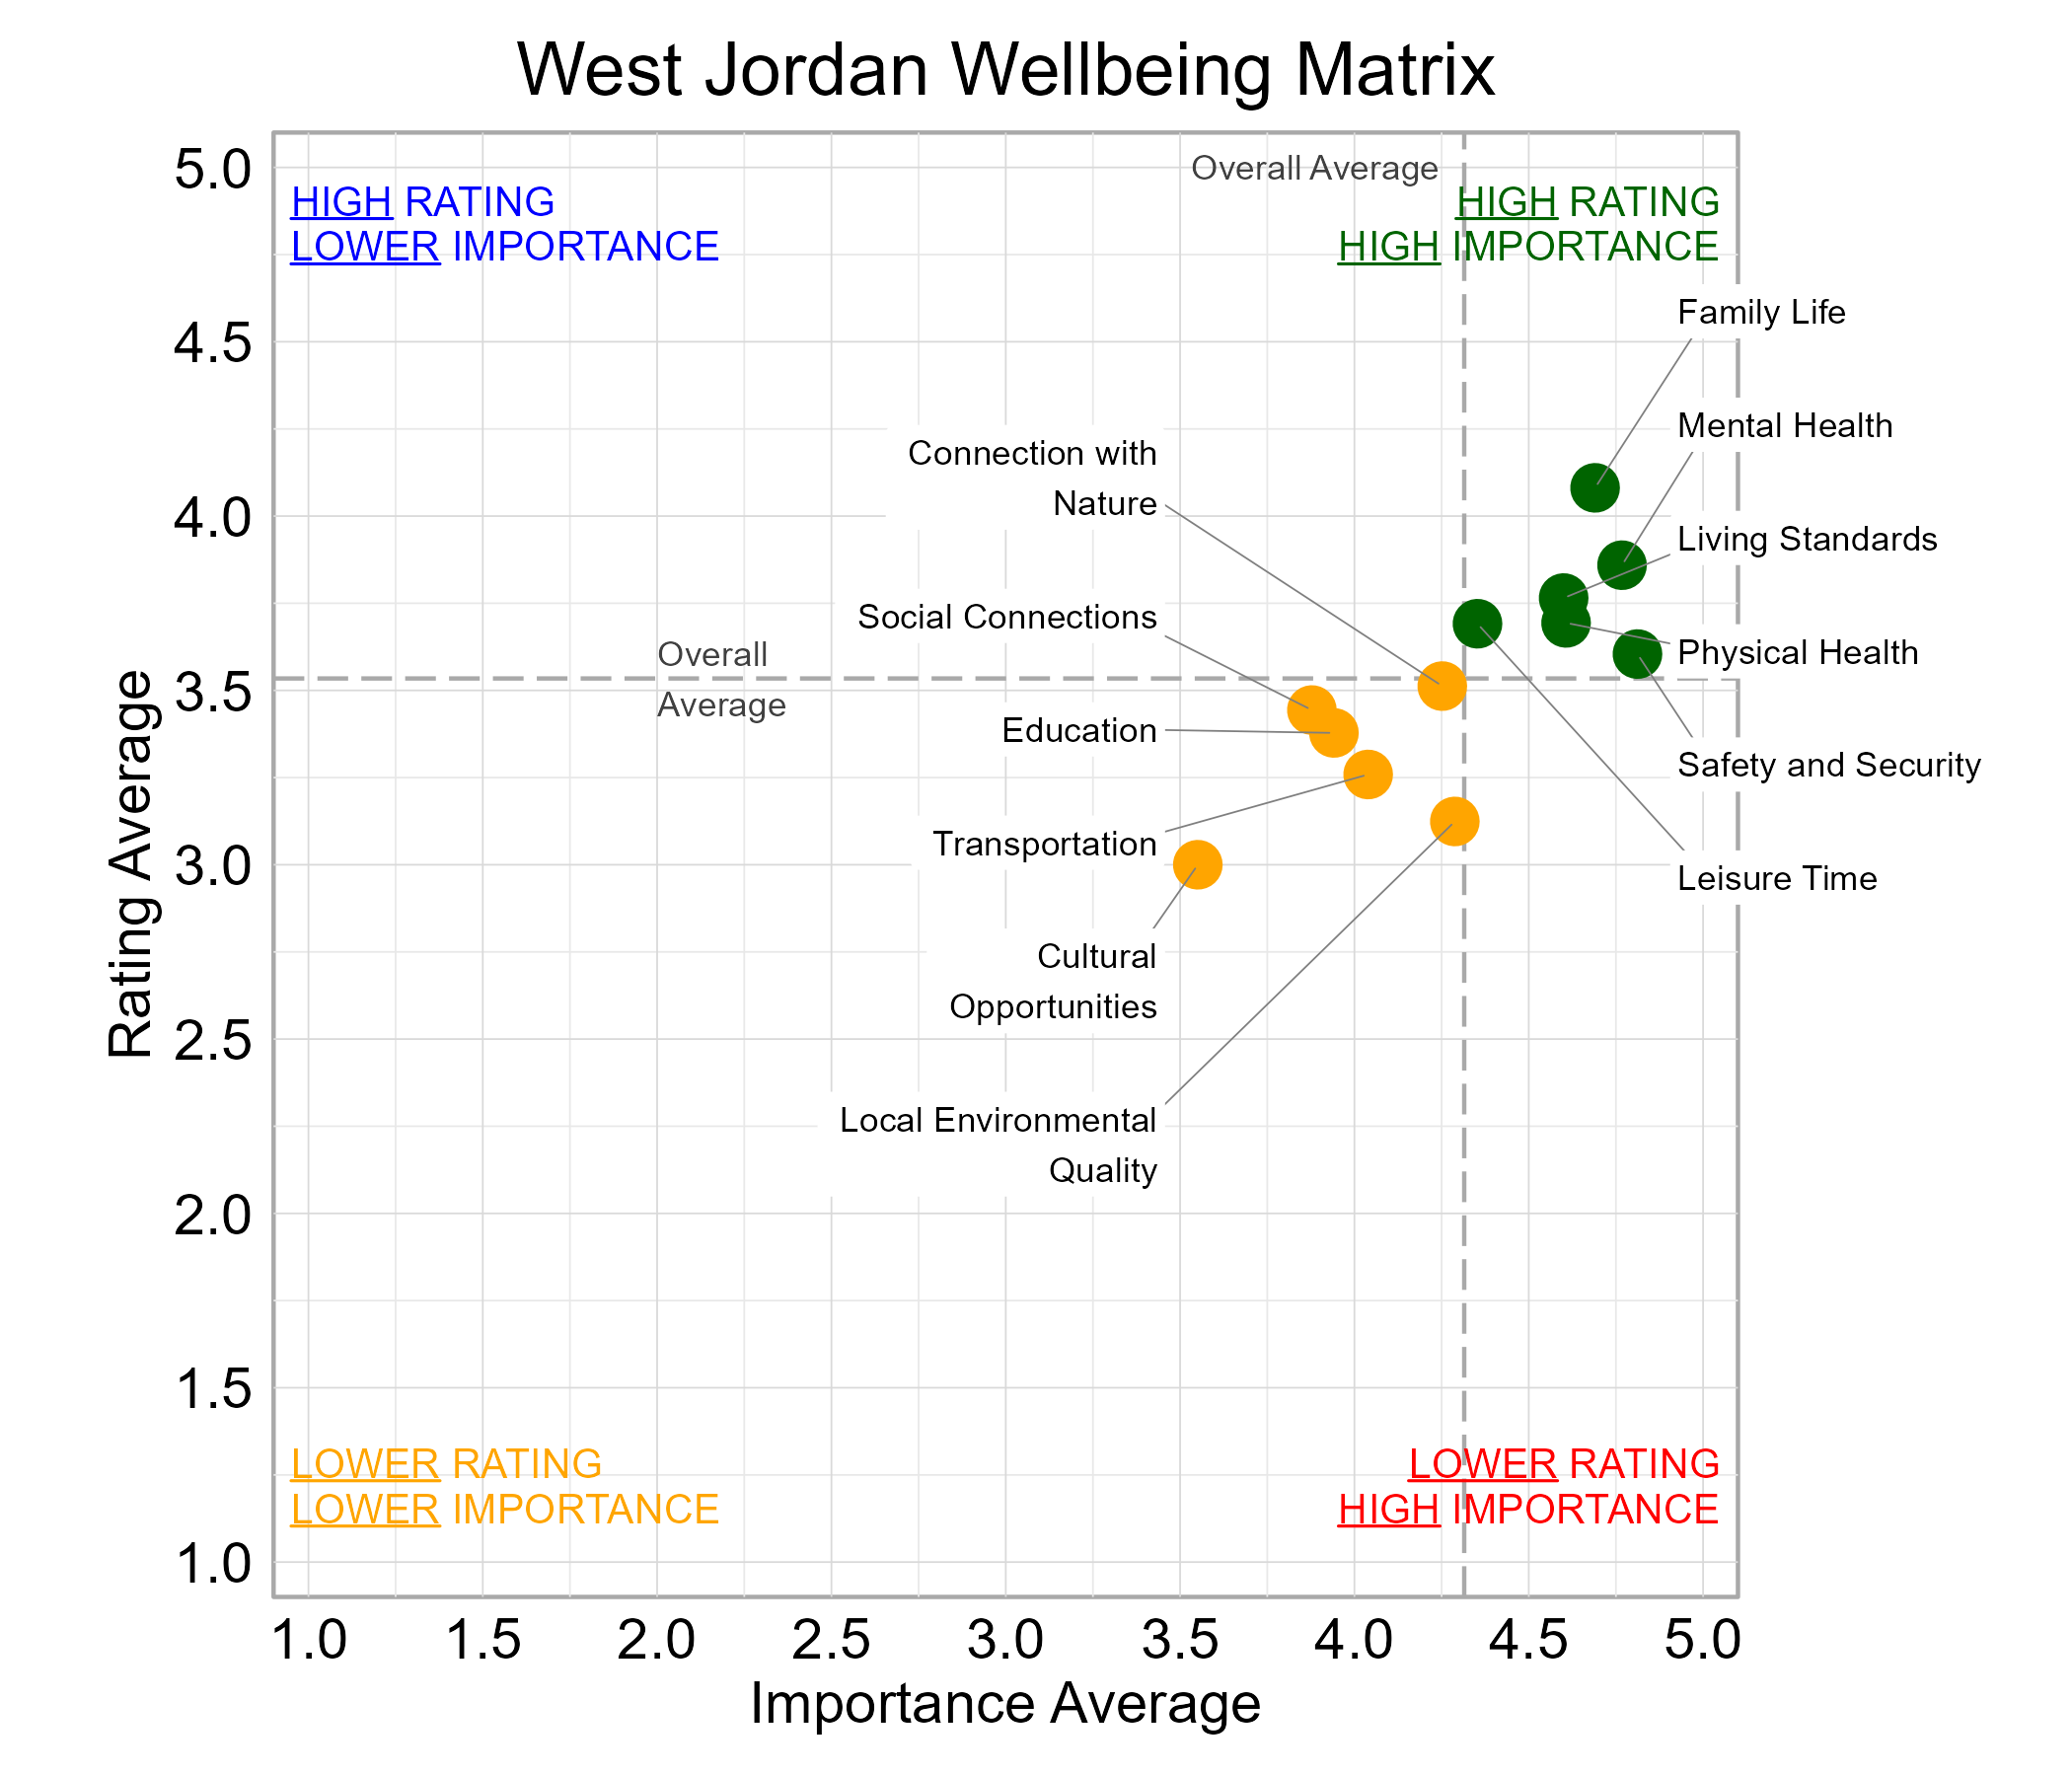
Wellbeing Matrix for West Jordan
The graph below illustrates the relationship between the average rating and the average importance of wellbeing domains for survey respondents from West Jordan. Family Life, Leisure Time, Living Standards, Mental Health, Physical Health, and Safety and Security were highly important and rated above average among the domains. No Domains fell in the “red zone” of higher importance and lower ratings, though Local Environmental Quality approaches this zone.
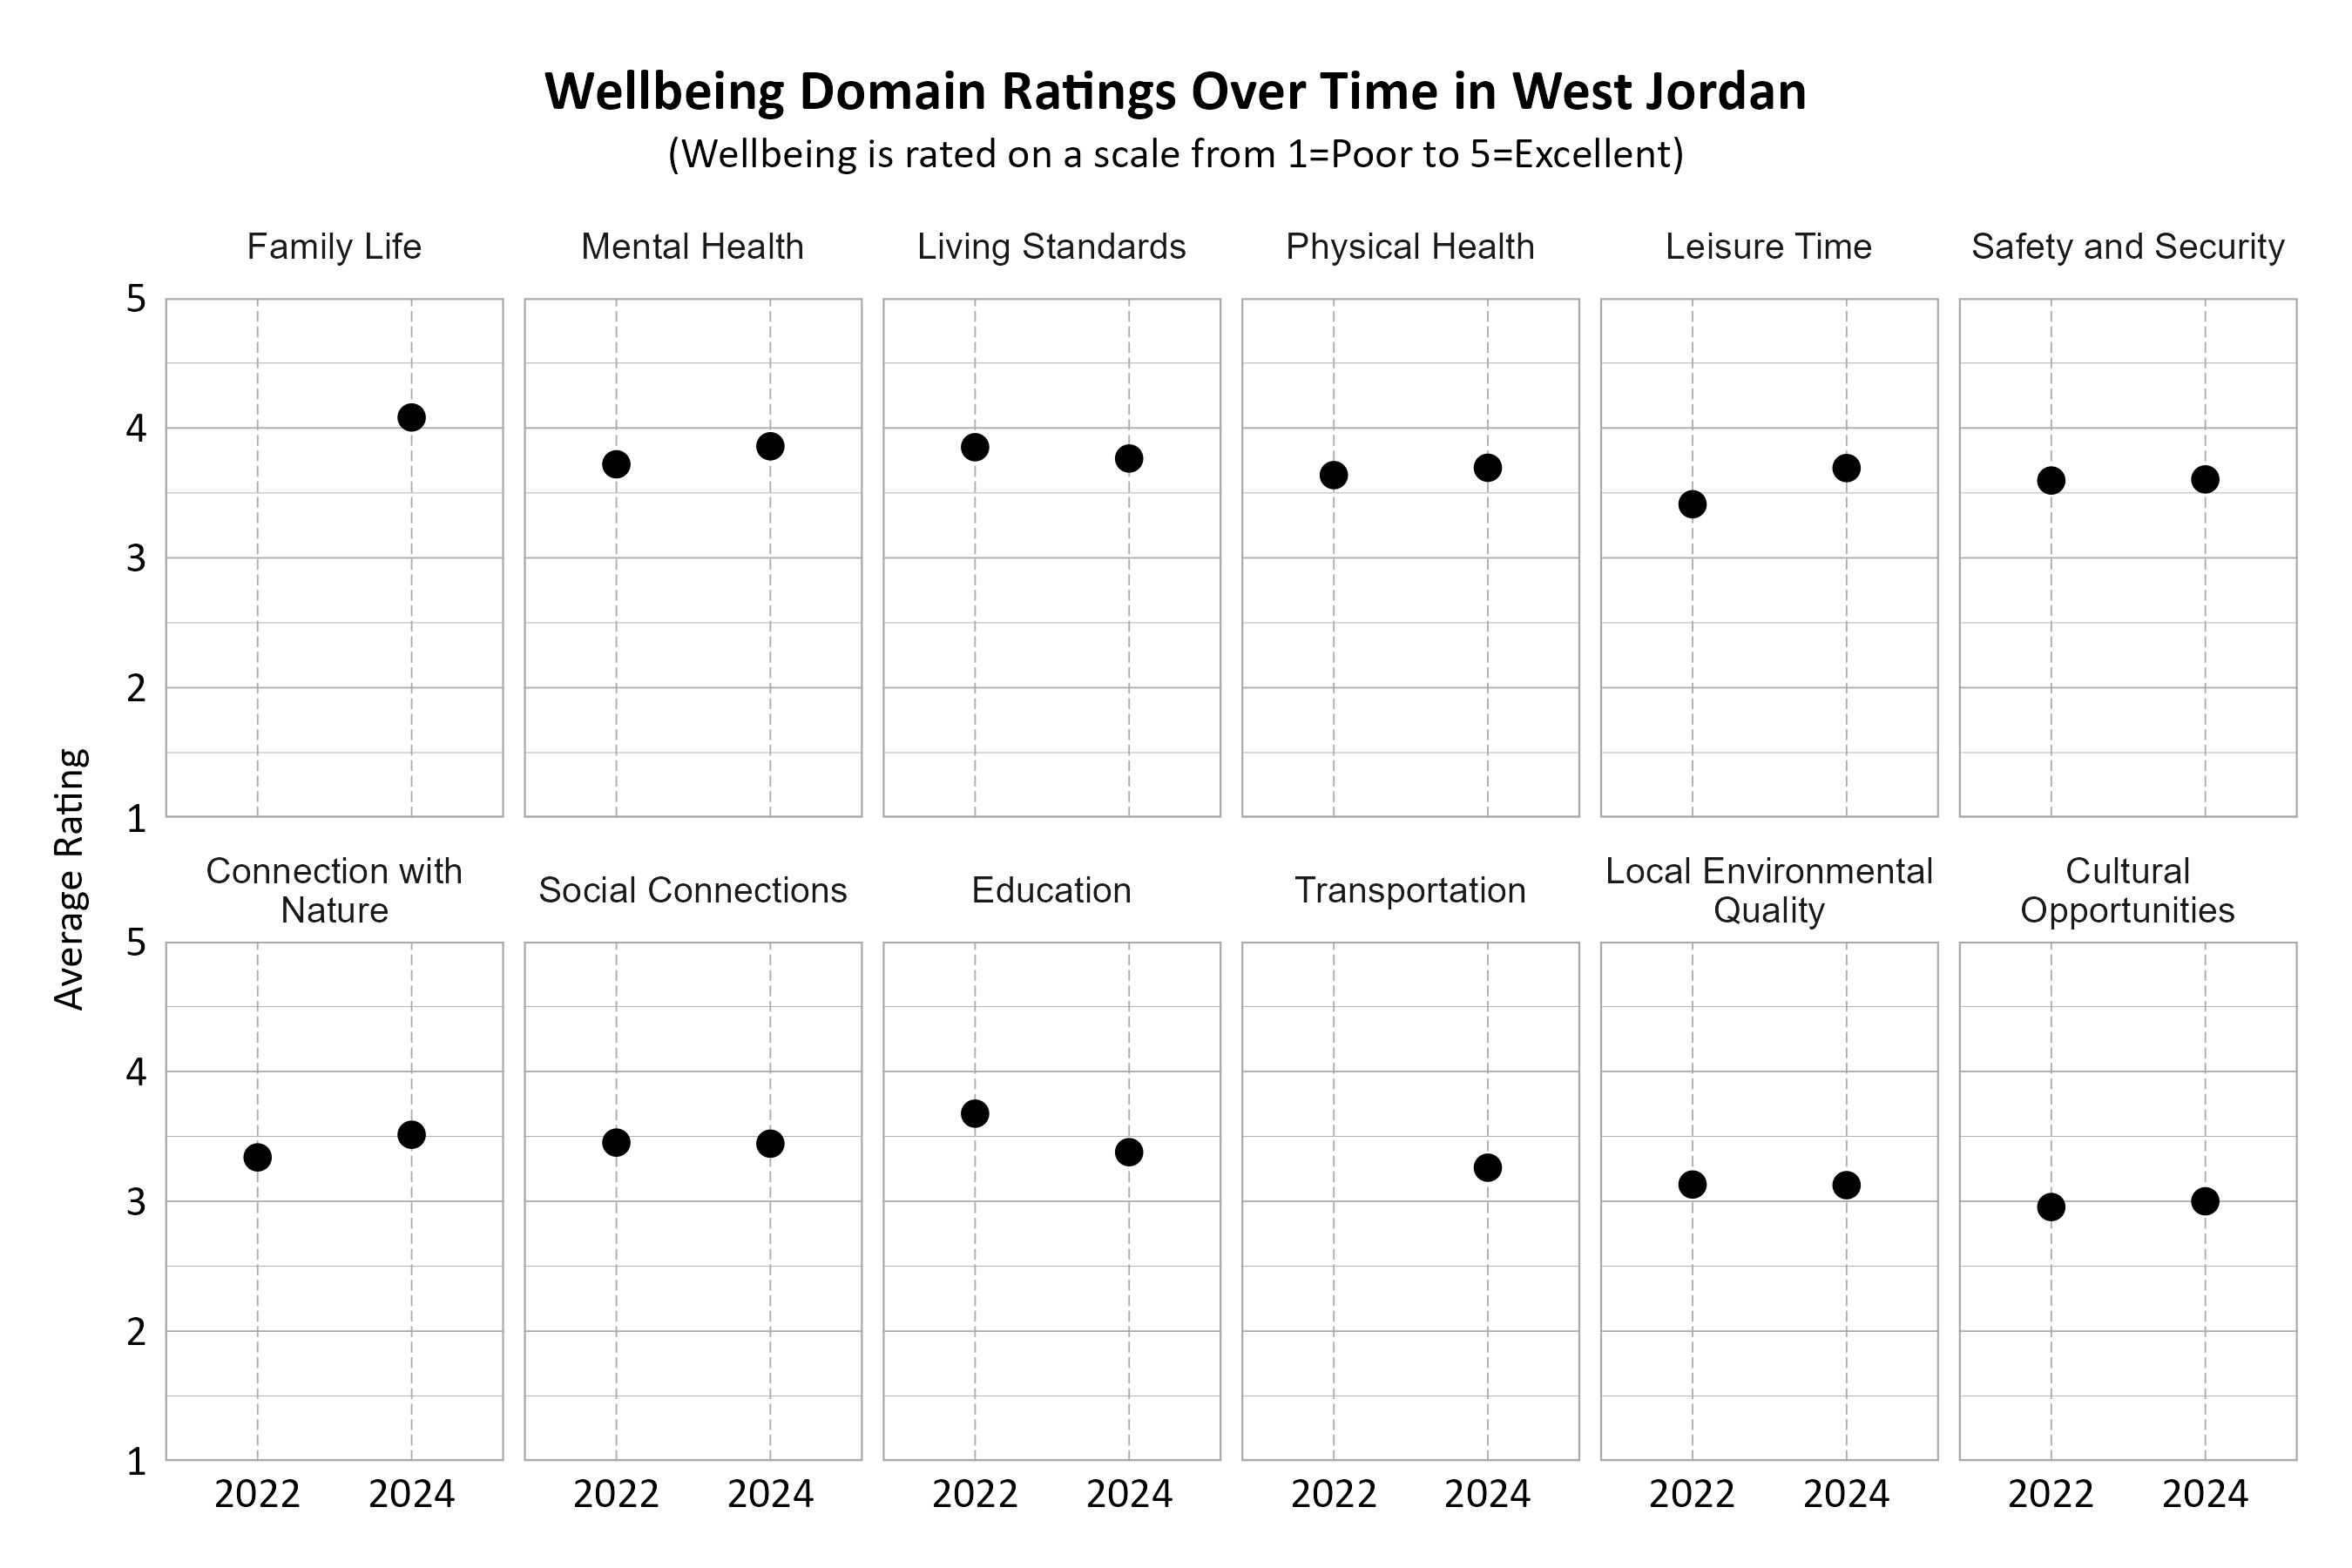
Wellbeing Domains Over Time in West Jordan
The graphs below show how the domains were rated over the years by West Jordan residents. The number of respondents changed over time. Note that the two domains Family Life and Transportation were new categories in the 2024 survey and were not measured in previous years. From 2022 to 2024, Leisure Time increased the most, and Education decreased the most.
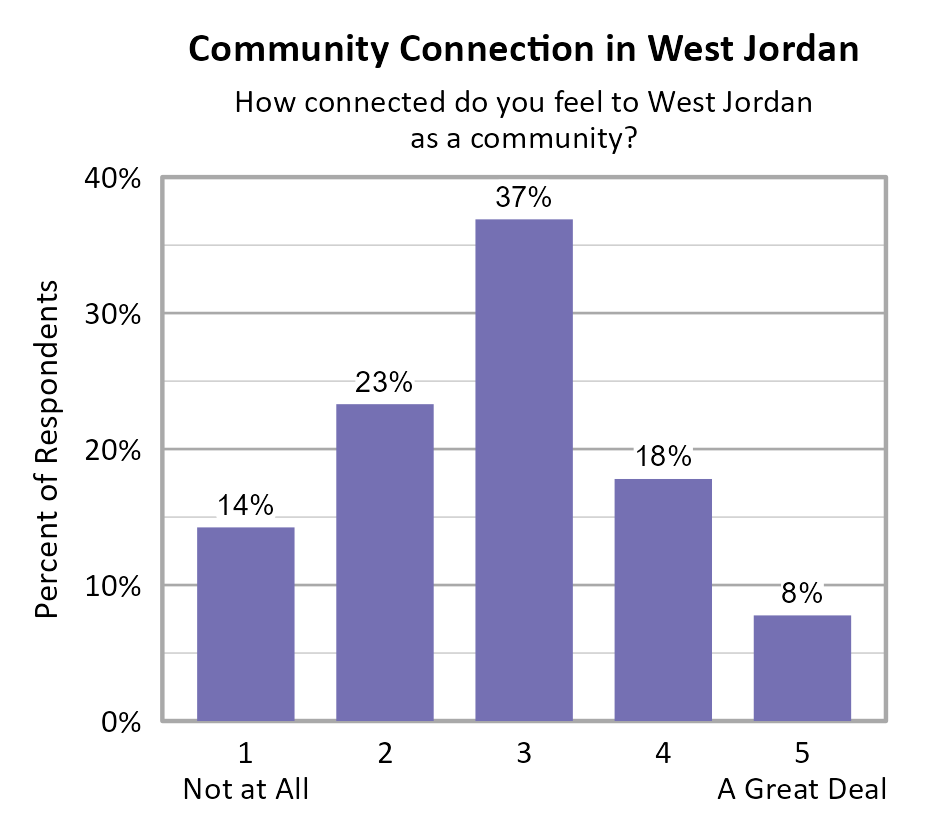
Community Connection in West Jordan
Survey participants were asked about how connected they feel to West Jordan on a 5-point scale from not at all (1) to a great deal (5), and the average score of all respondents was 2.82. While ZIP codes 84123 and 84084 had slightly higher community connection scores than ZIP codes 84081 and 84088, these differences were not statistically significant.
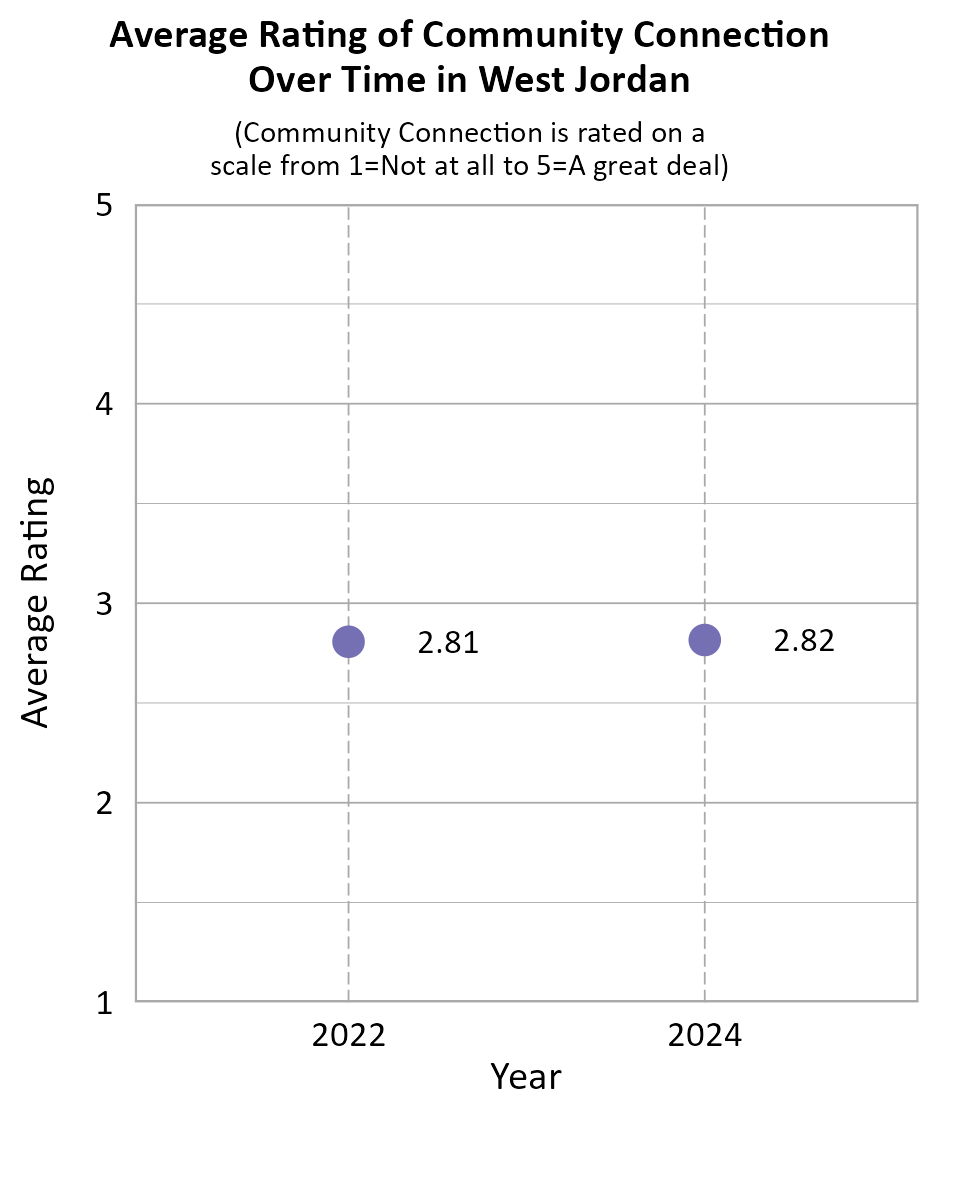
When comparing survey data from West Jordan over the years as shown in the information below, we can see that the average community connection score remained nearly the same between 2022 and 2024.
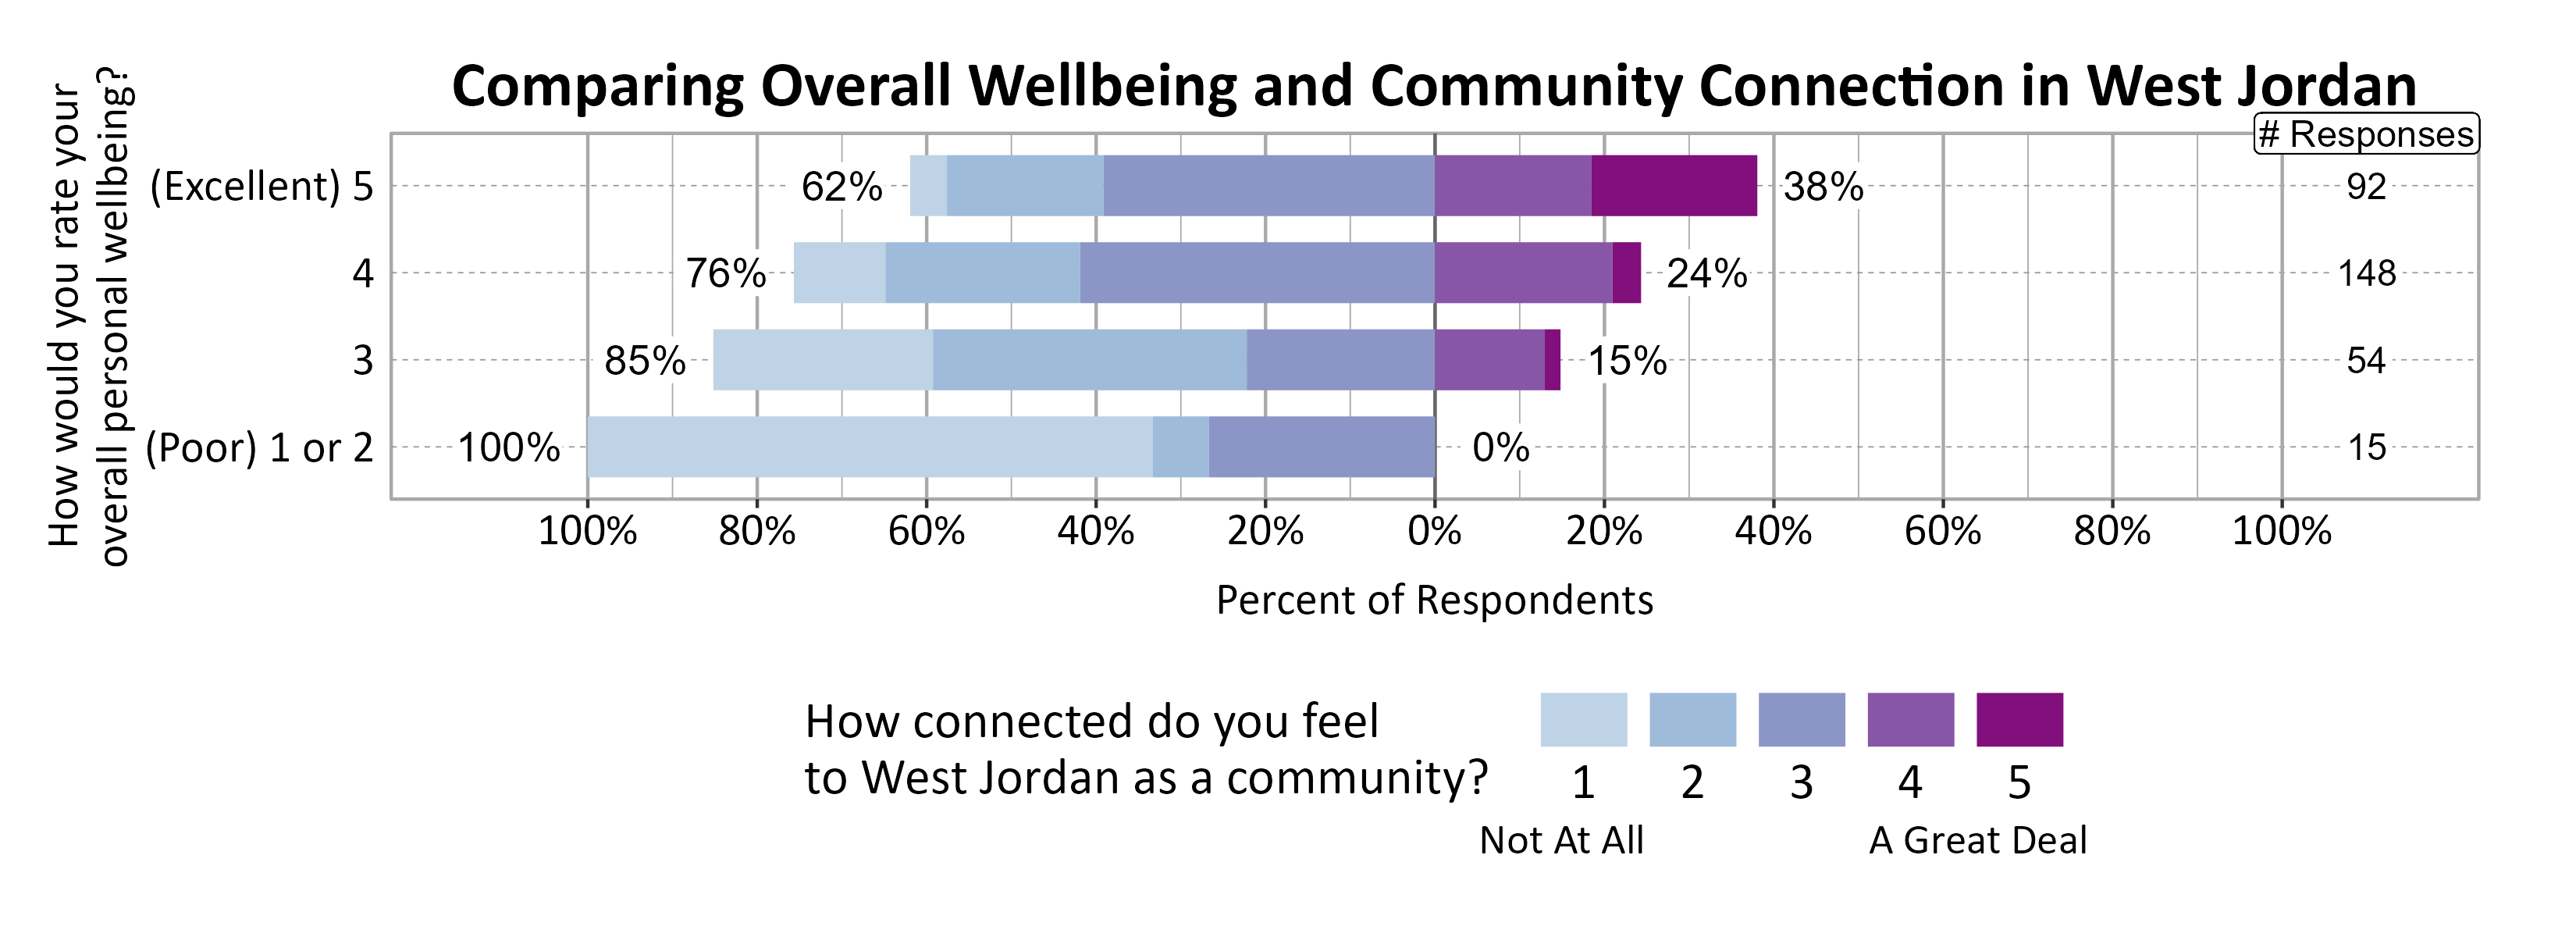
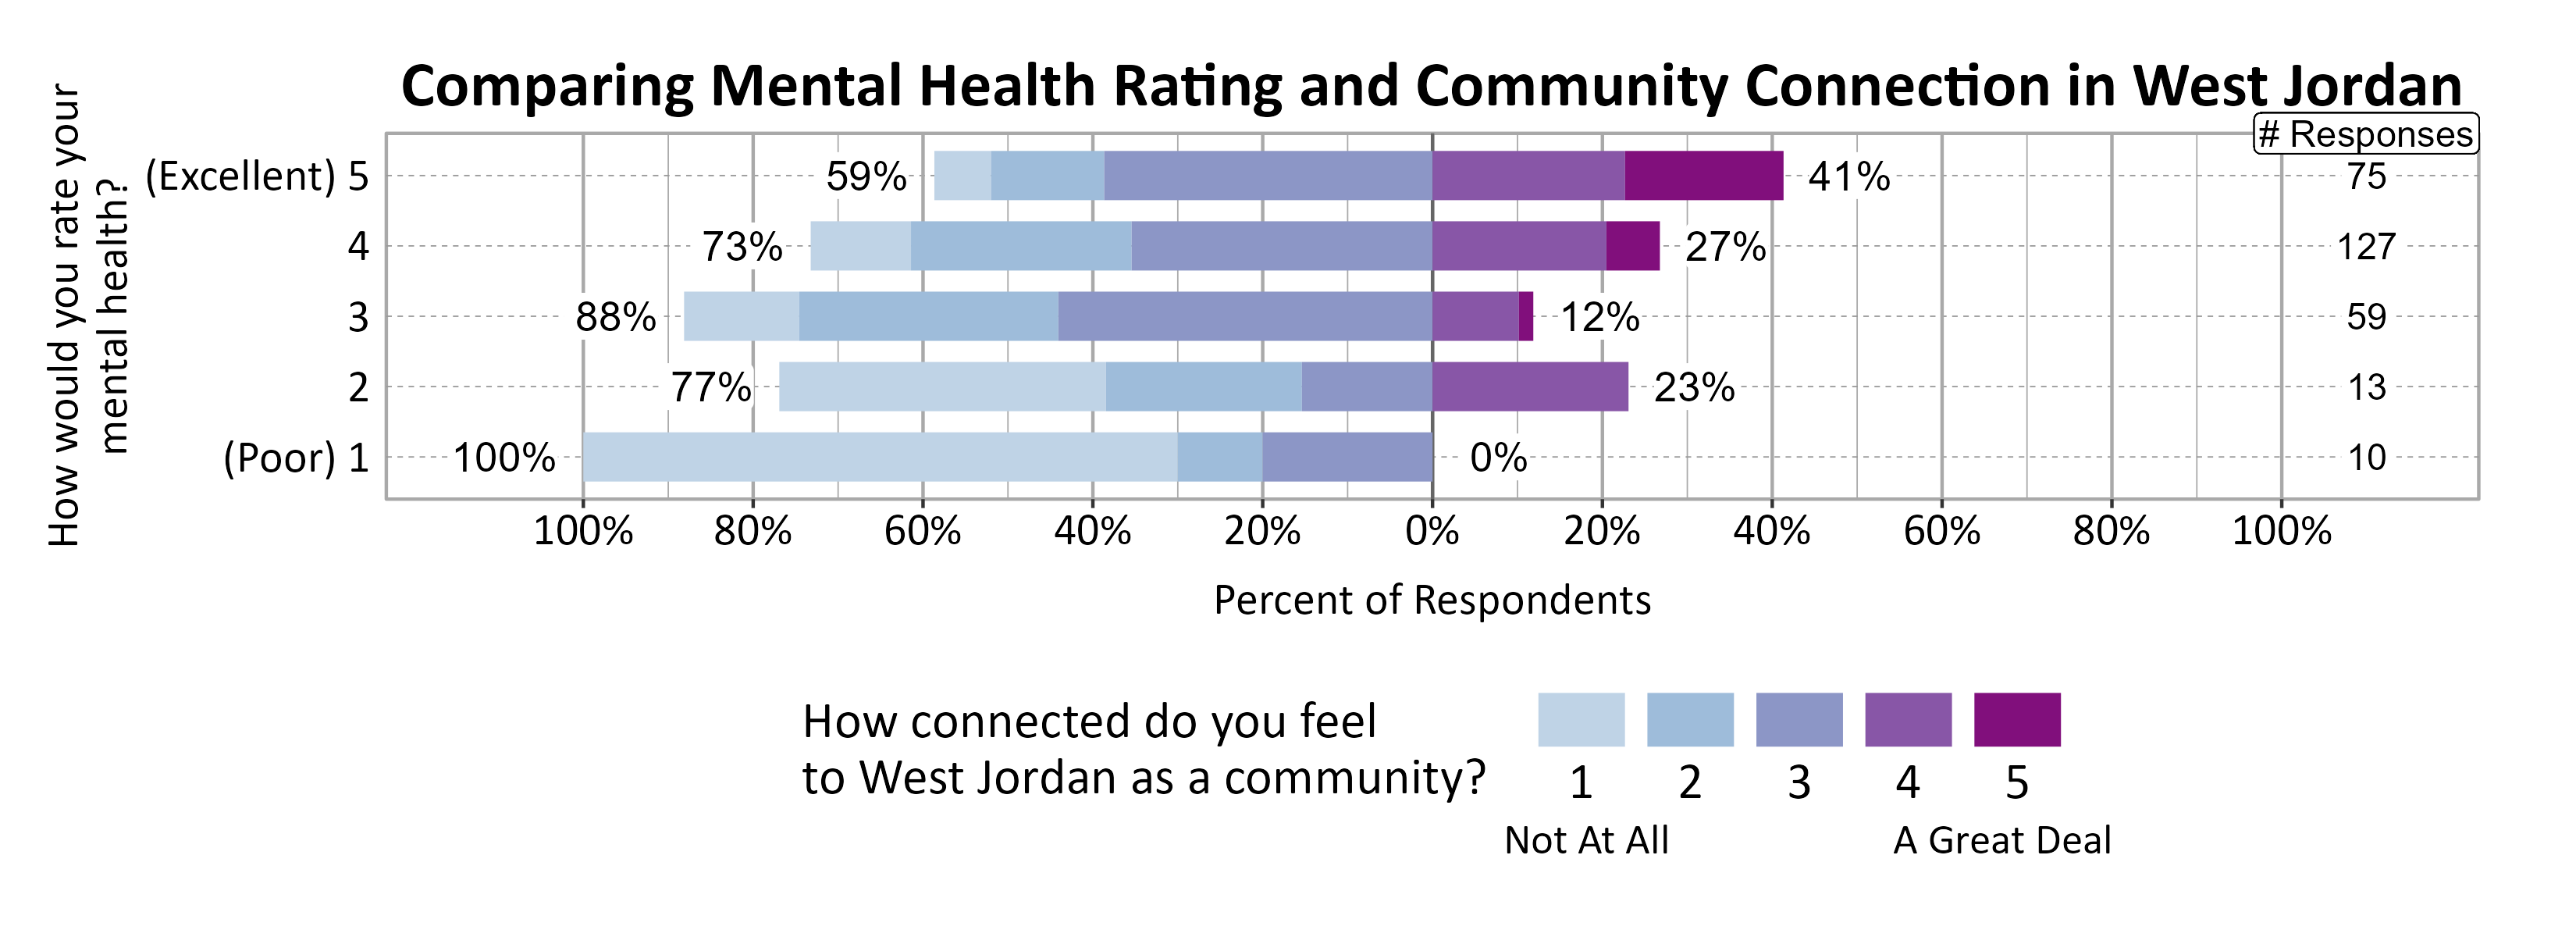
A positive relationship was found between individuals’ community connection and overall personal wellbeing, and to some extent between community connection and mental health.
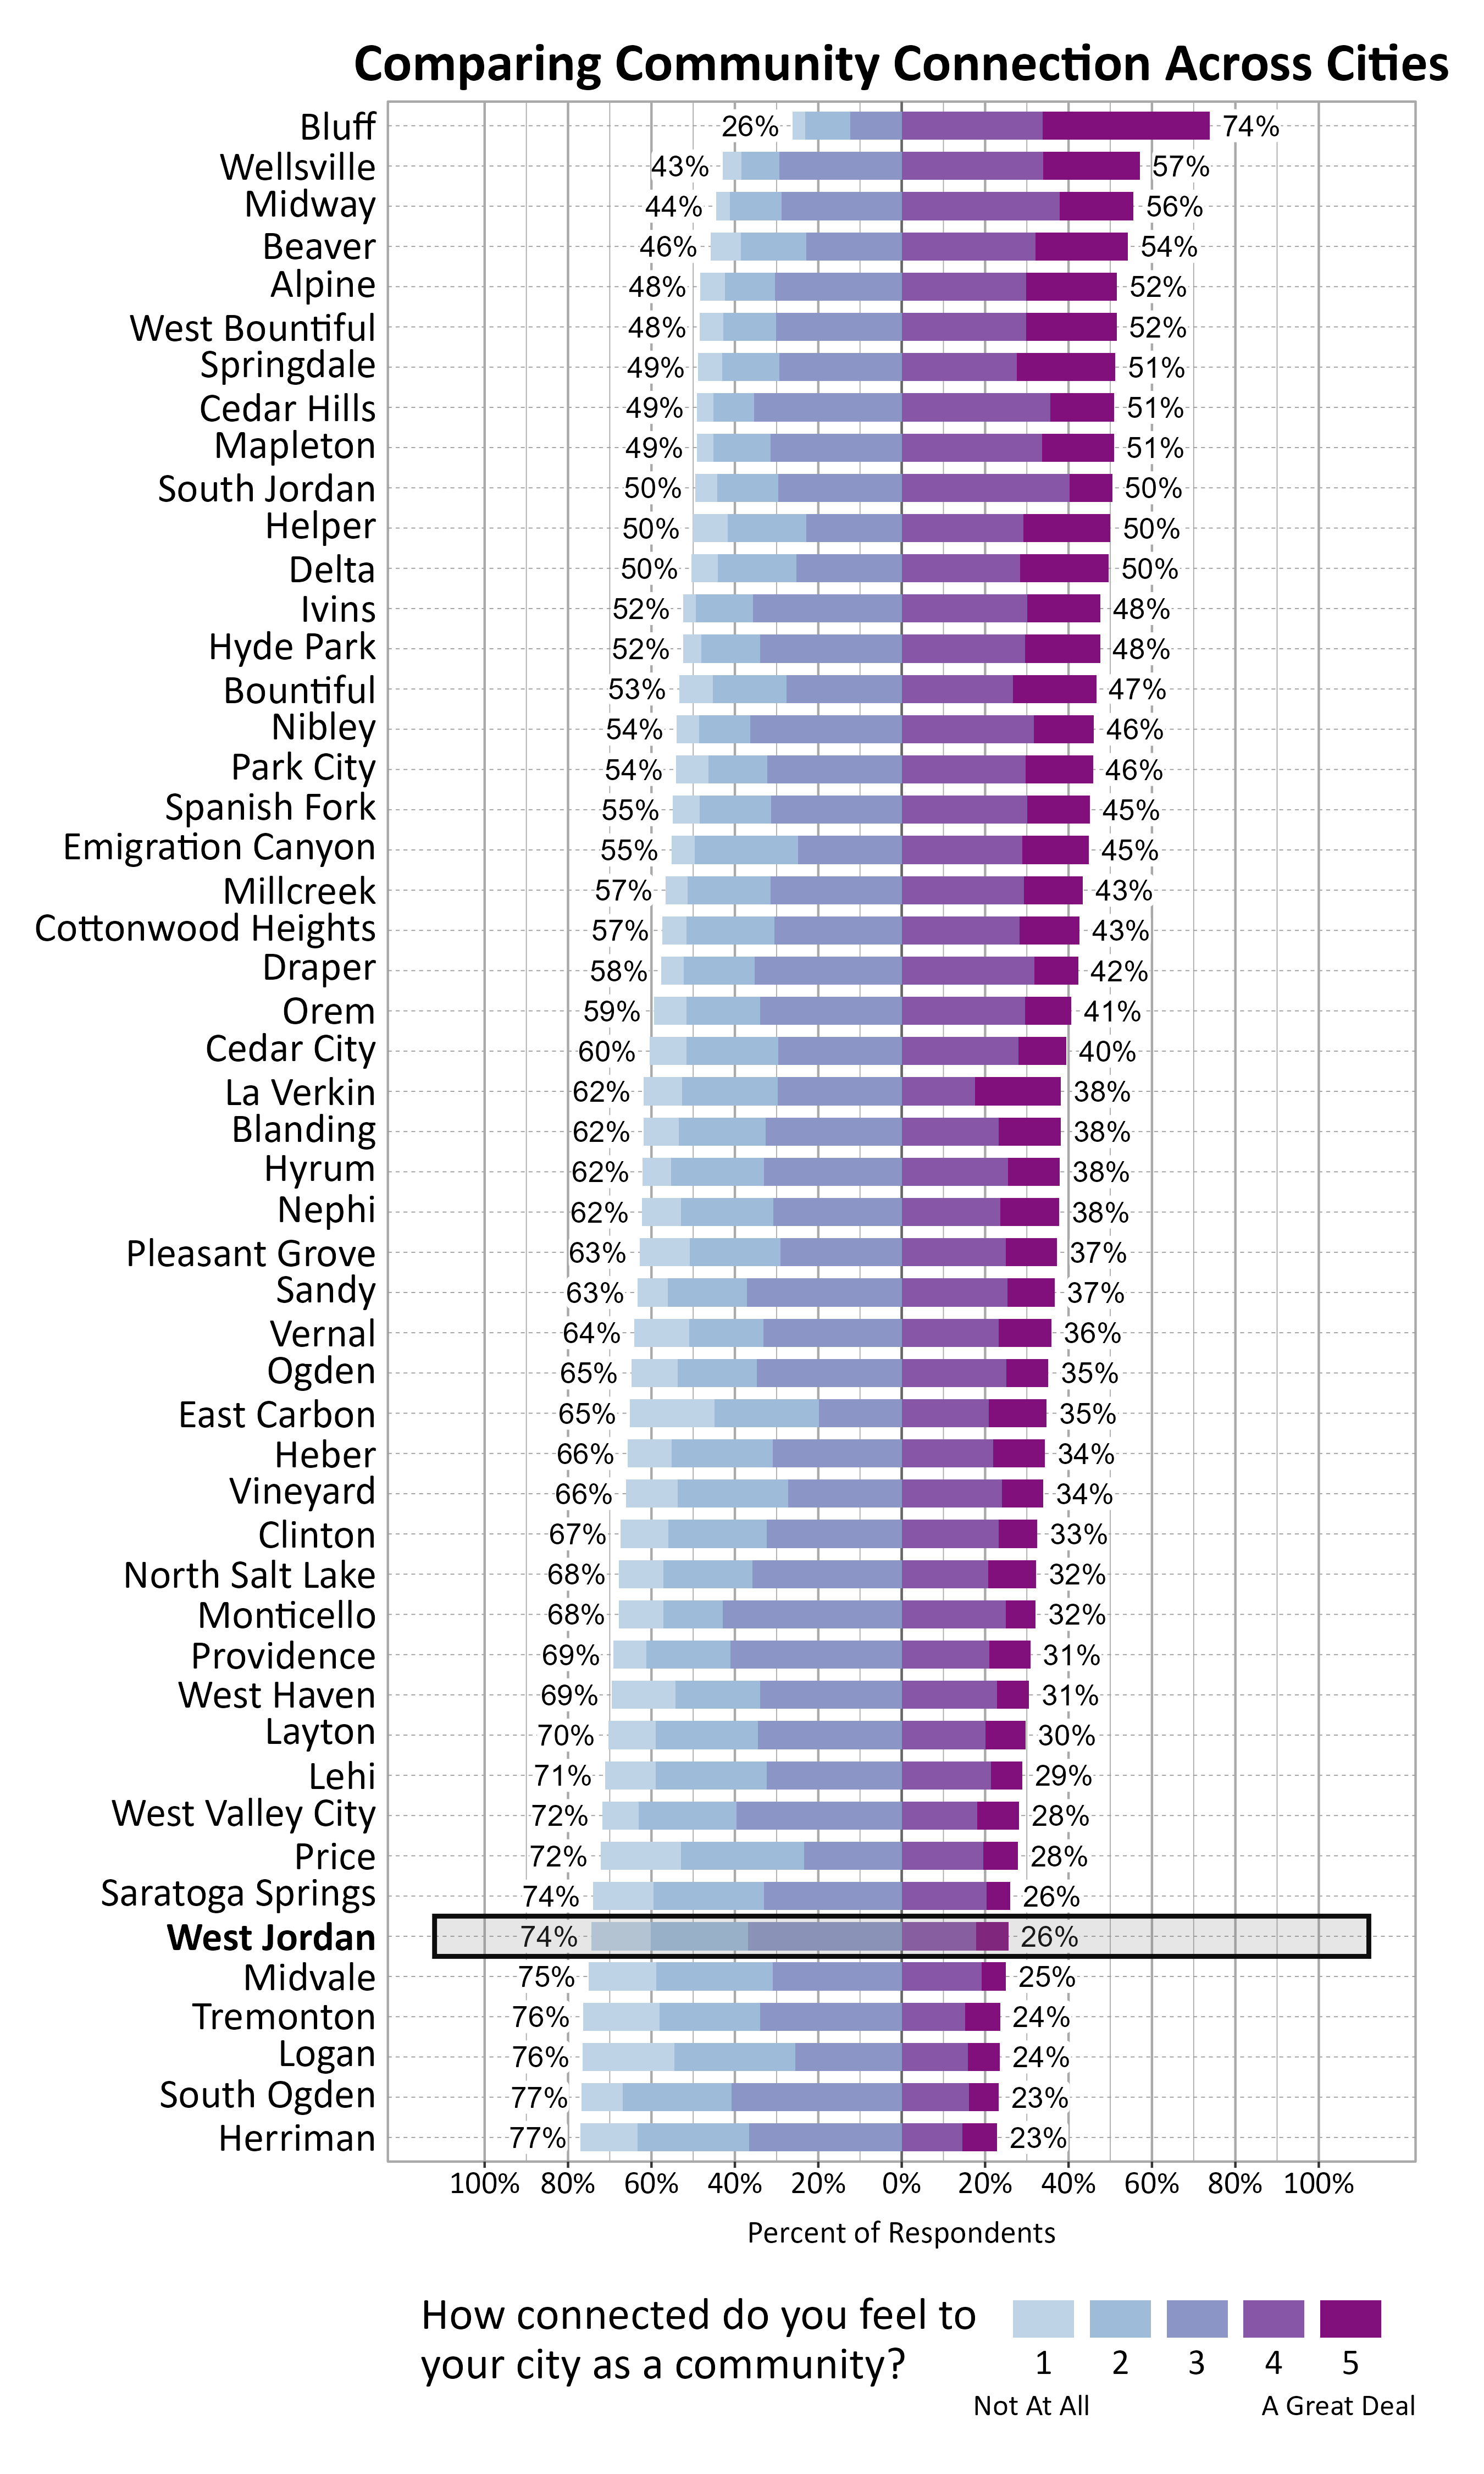
The graph below shows how Wellbeing Project cities and towns compare on feelings of community connection based on the percentage of respondents who answered 4 or a 5 on a 5-point scale from “not at all” to “a great deal” connected to their city or town. West Jordan ranked 46 out of the 51 cities that participated.
Participation in Recreation and Nature-Related Activities
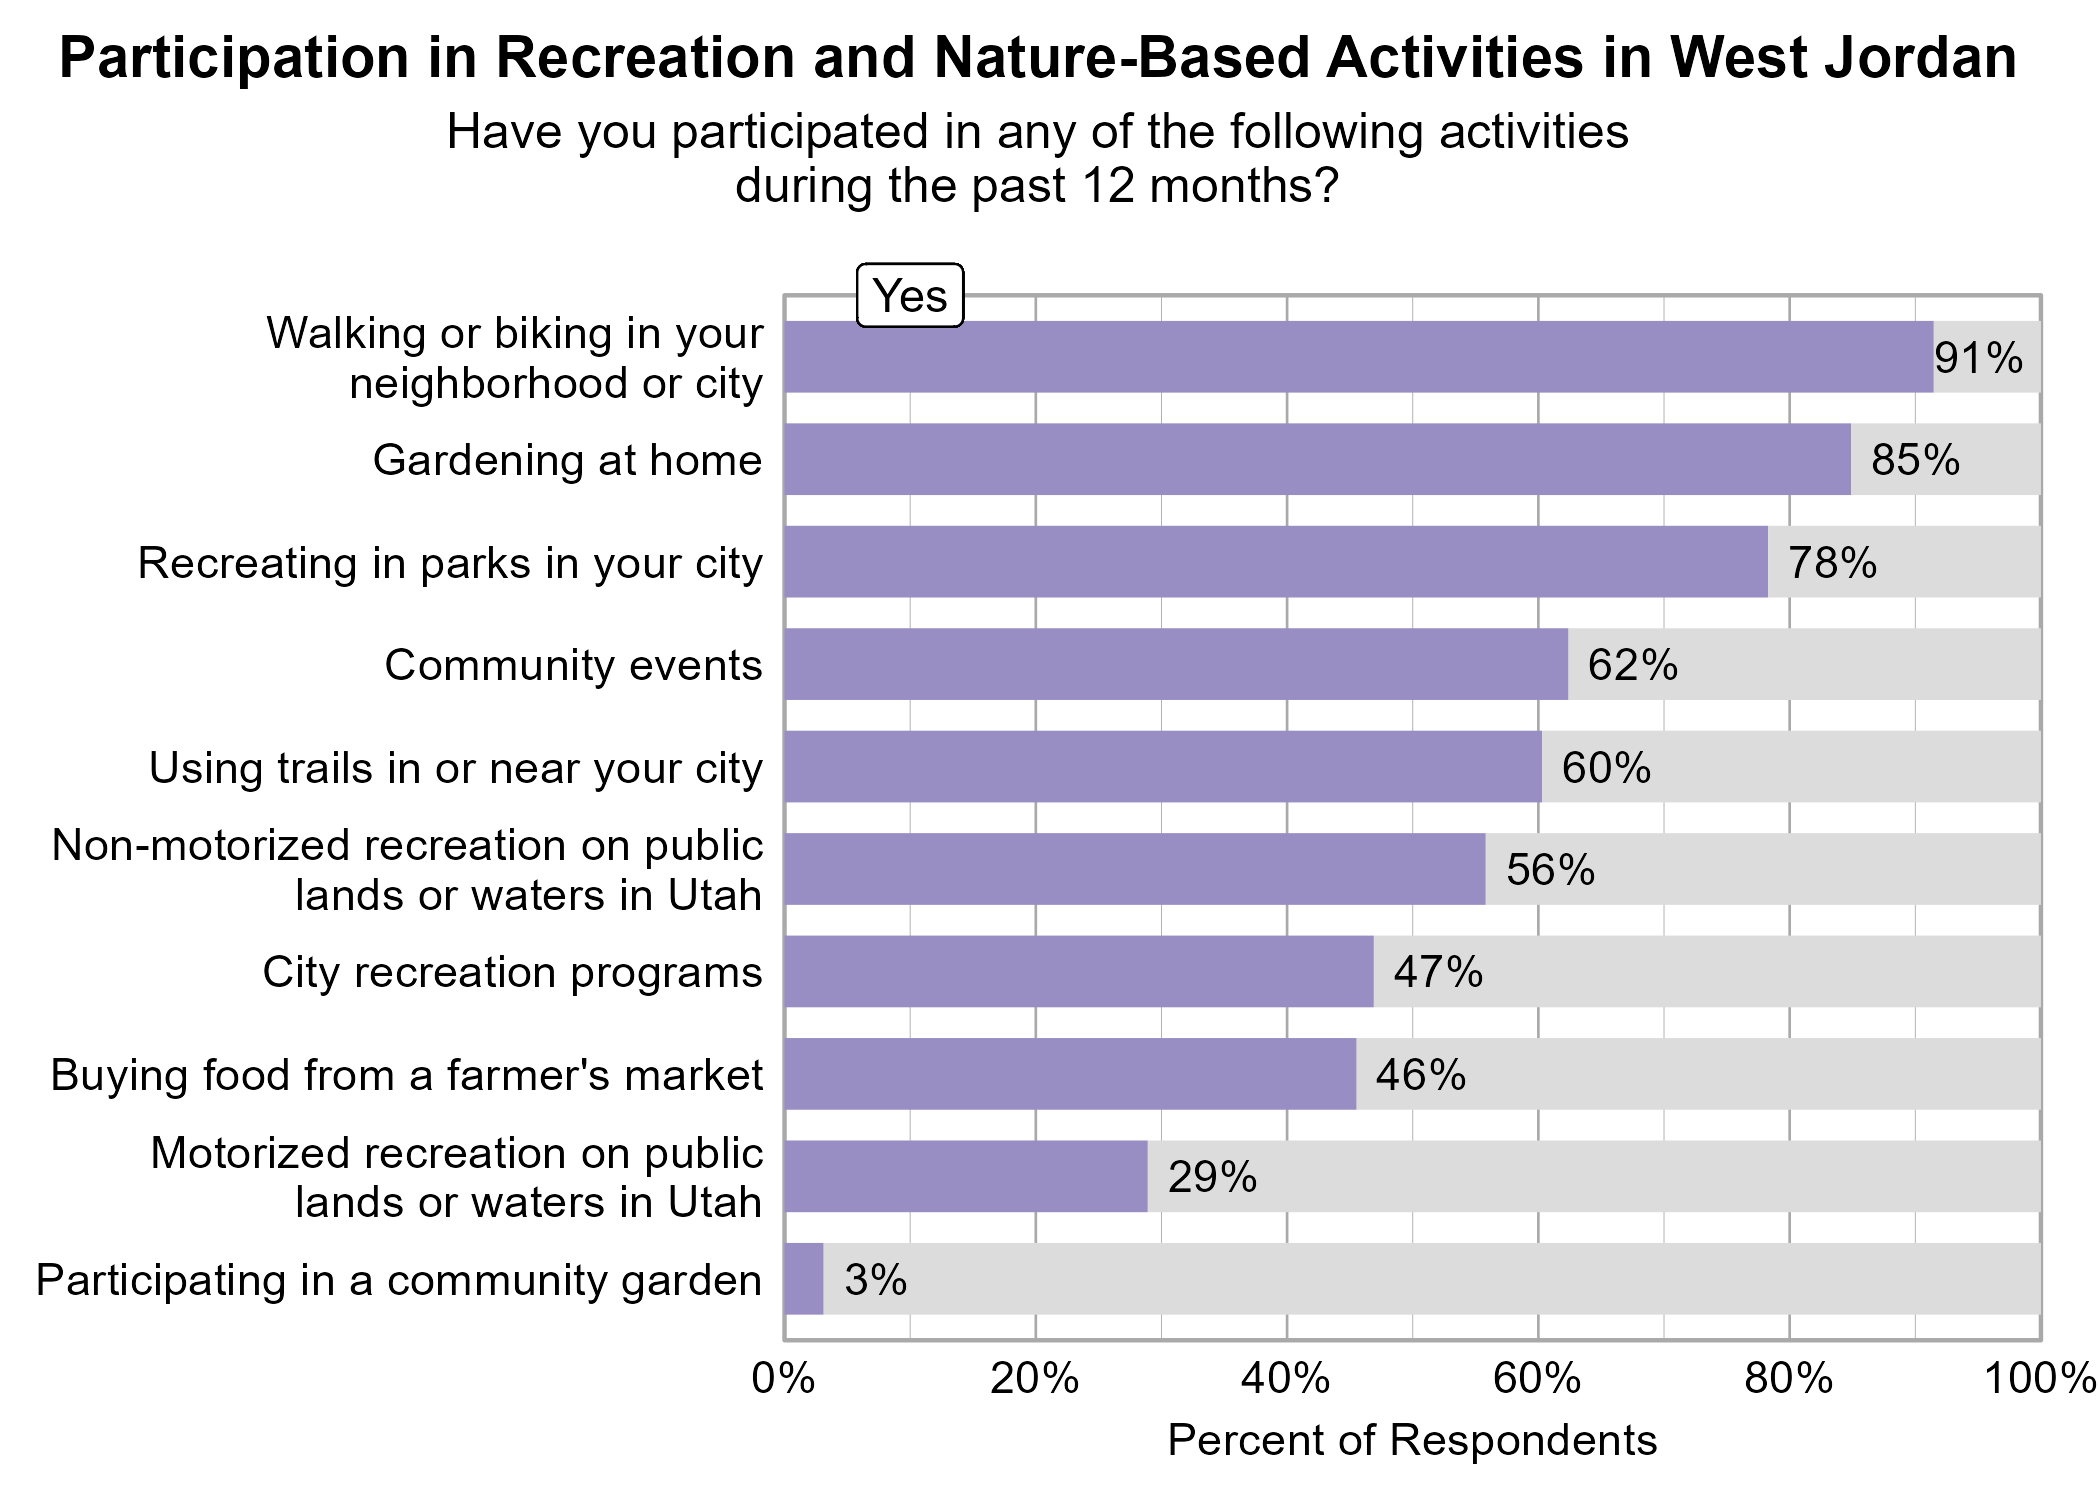
Respondents were asked to indicate whether or not they participated in various activities in the last 12 months. The most popular activities were walking or biking in your neighborhood or city (91%), gardening at home (85%), and recreating in parks in your city (78%).
Participating in city recreation programs and participating in community events were significantly related to higher ratings of personal wellbeing.
Participating in community events and recreating in parks in your city were significantly related to higher ratings of community wellbeing.
Participating in city recreation programs, participating in community events, and recreating in parks in your city were significantly related to higher ratings of community connection.
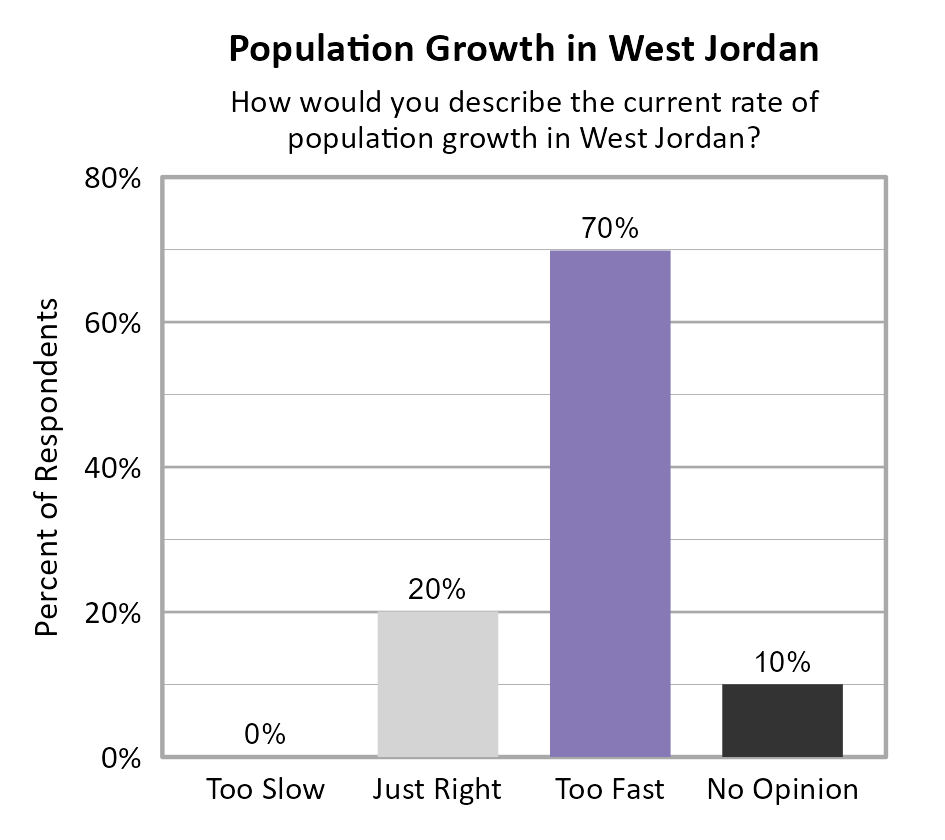
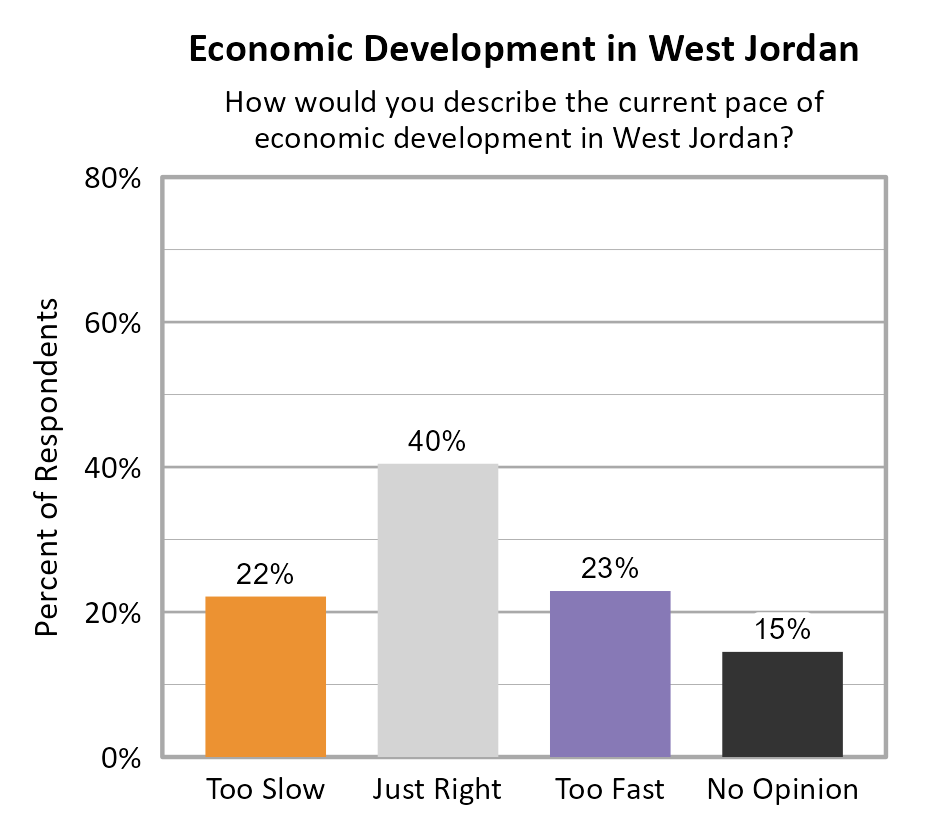
Perspectives on Population Growth and Economic Development
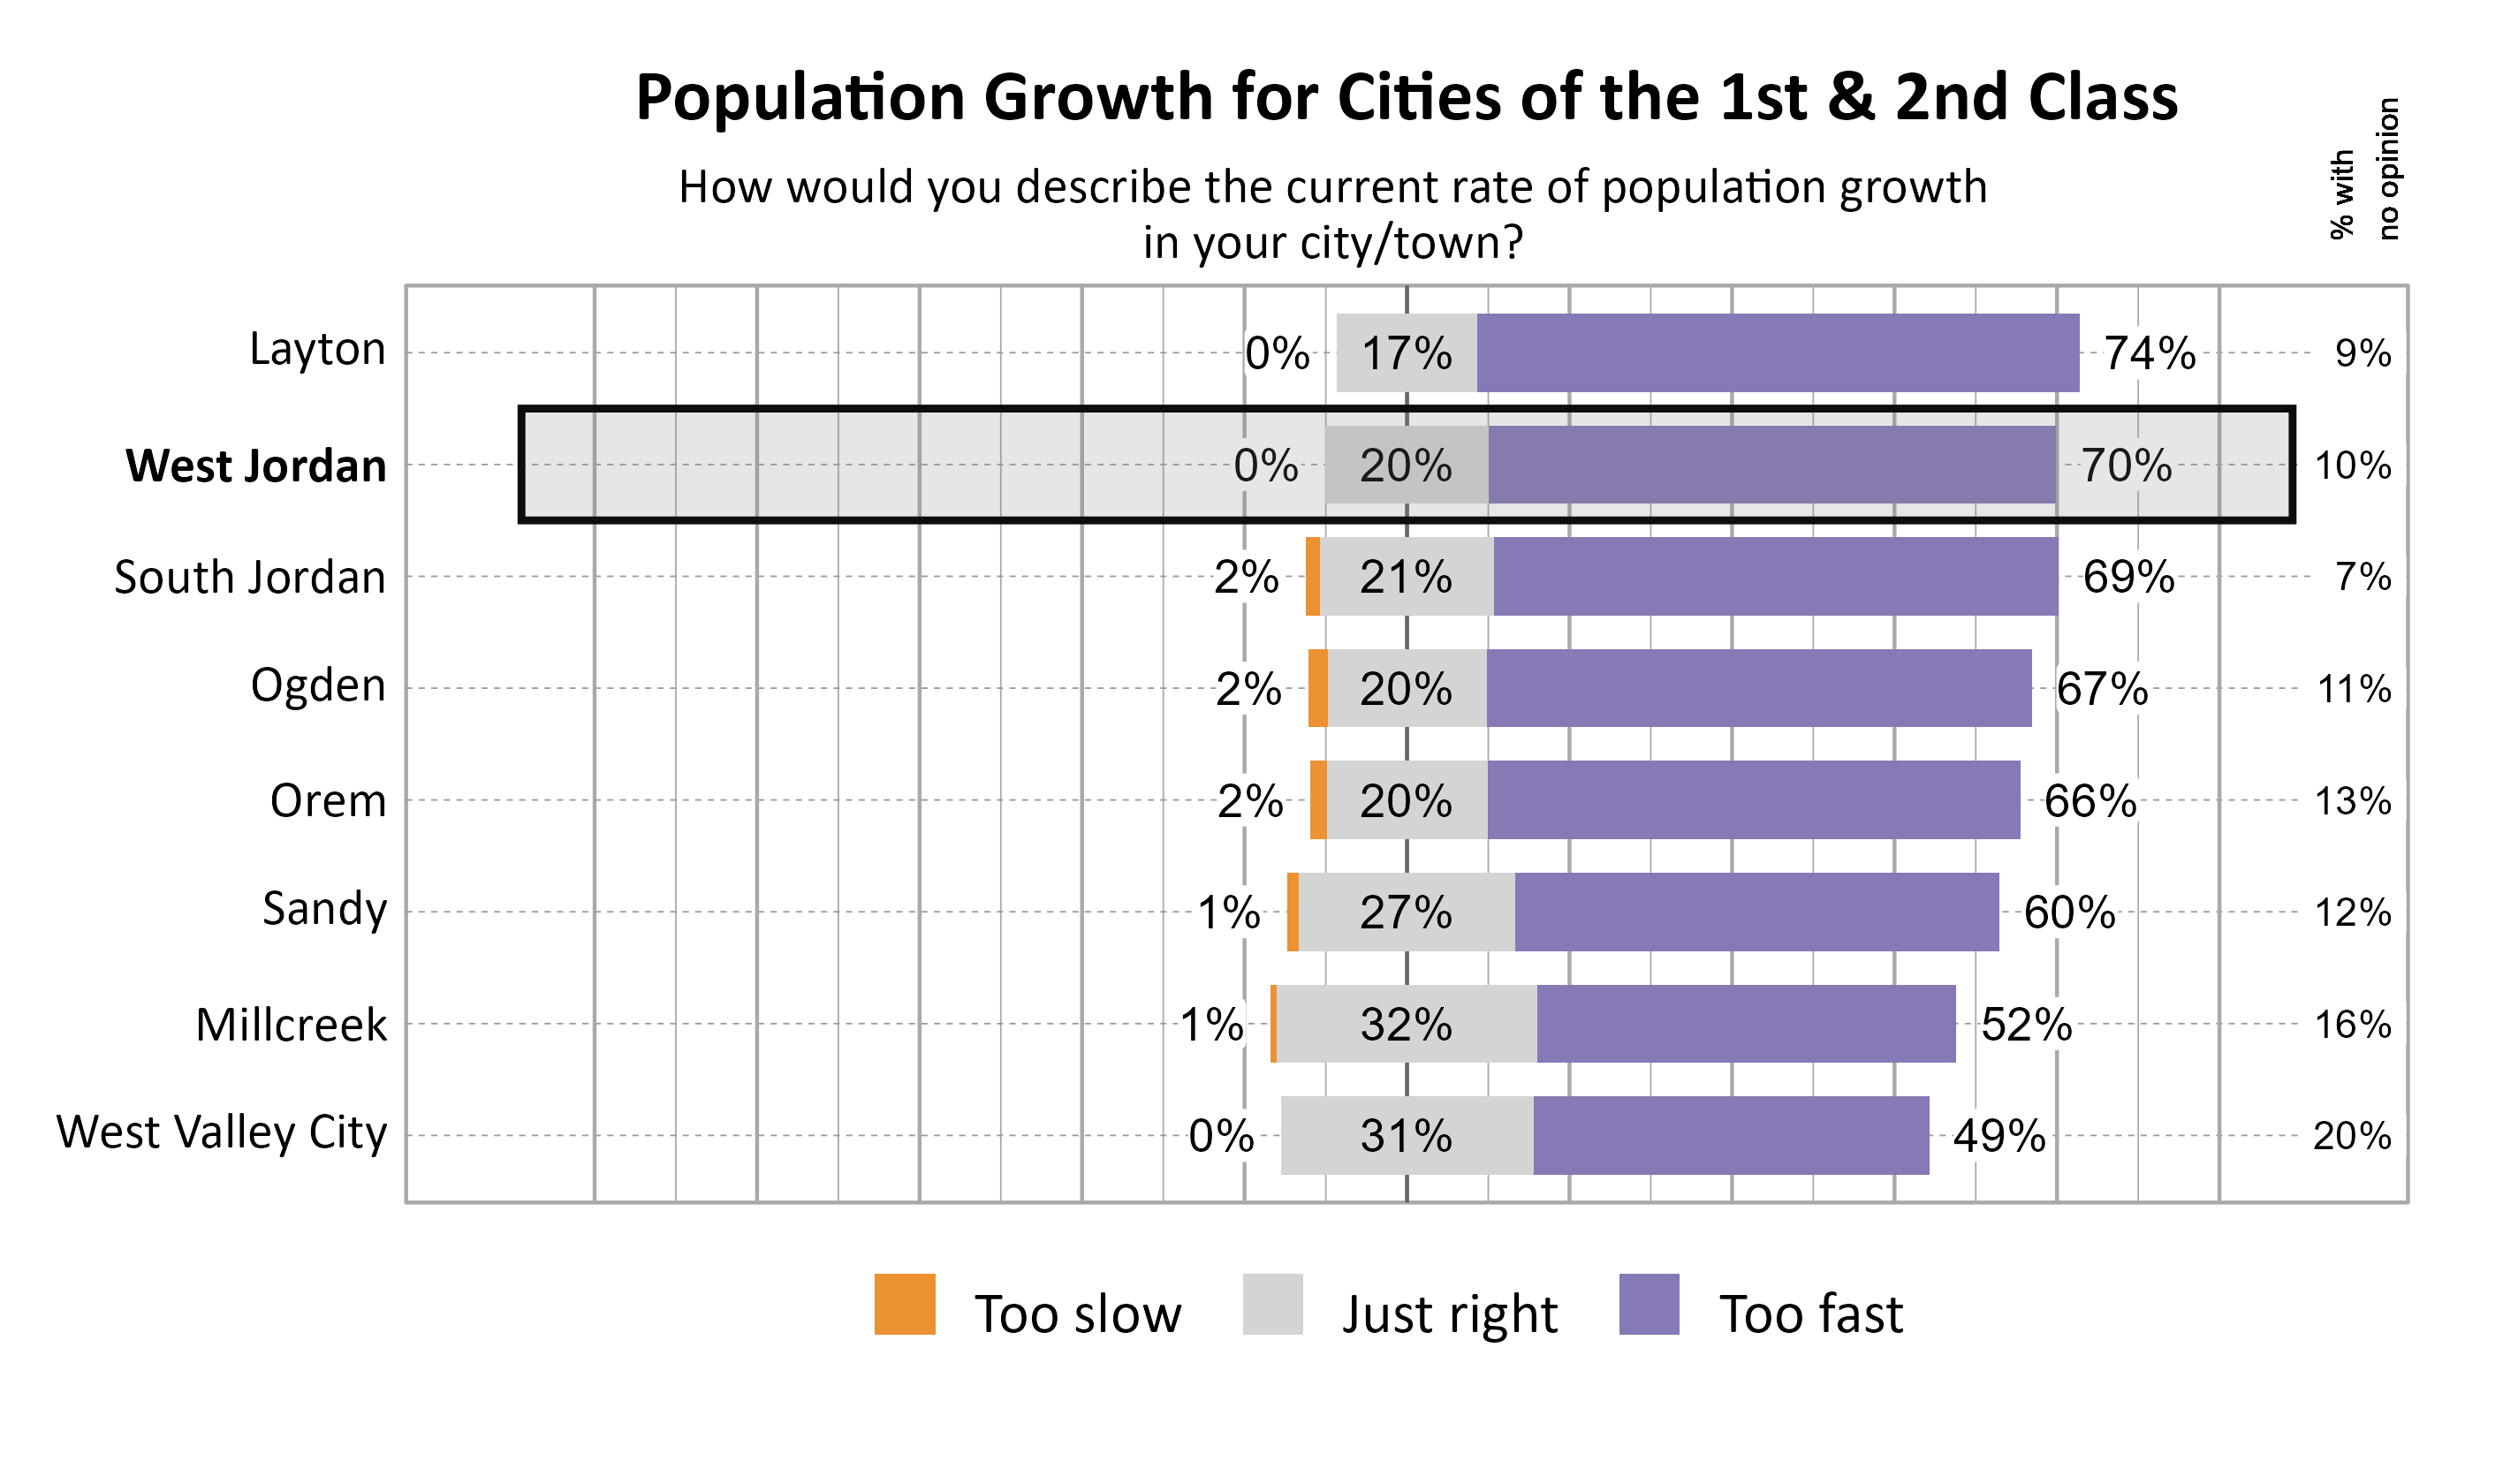
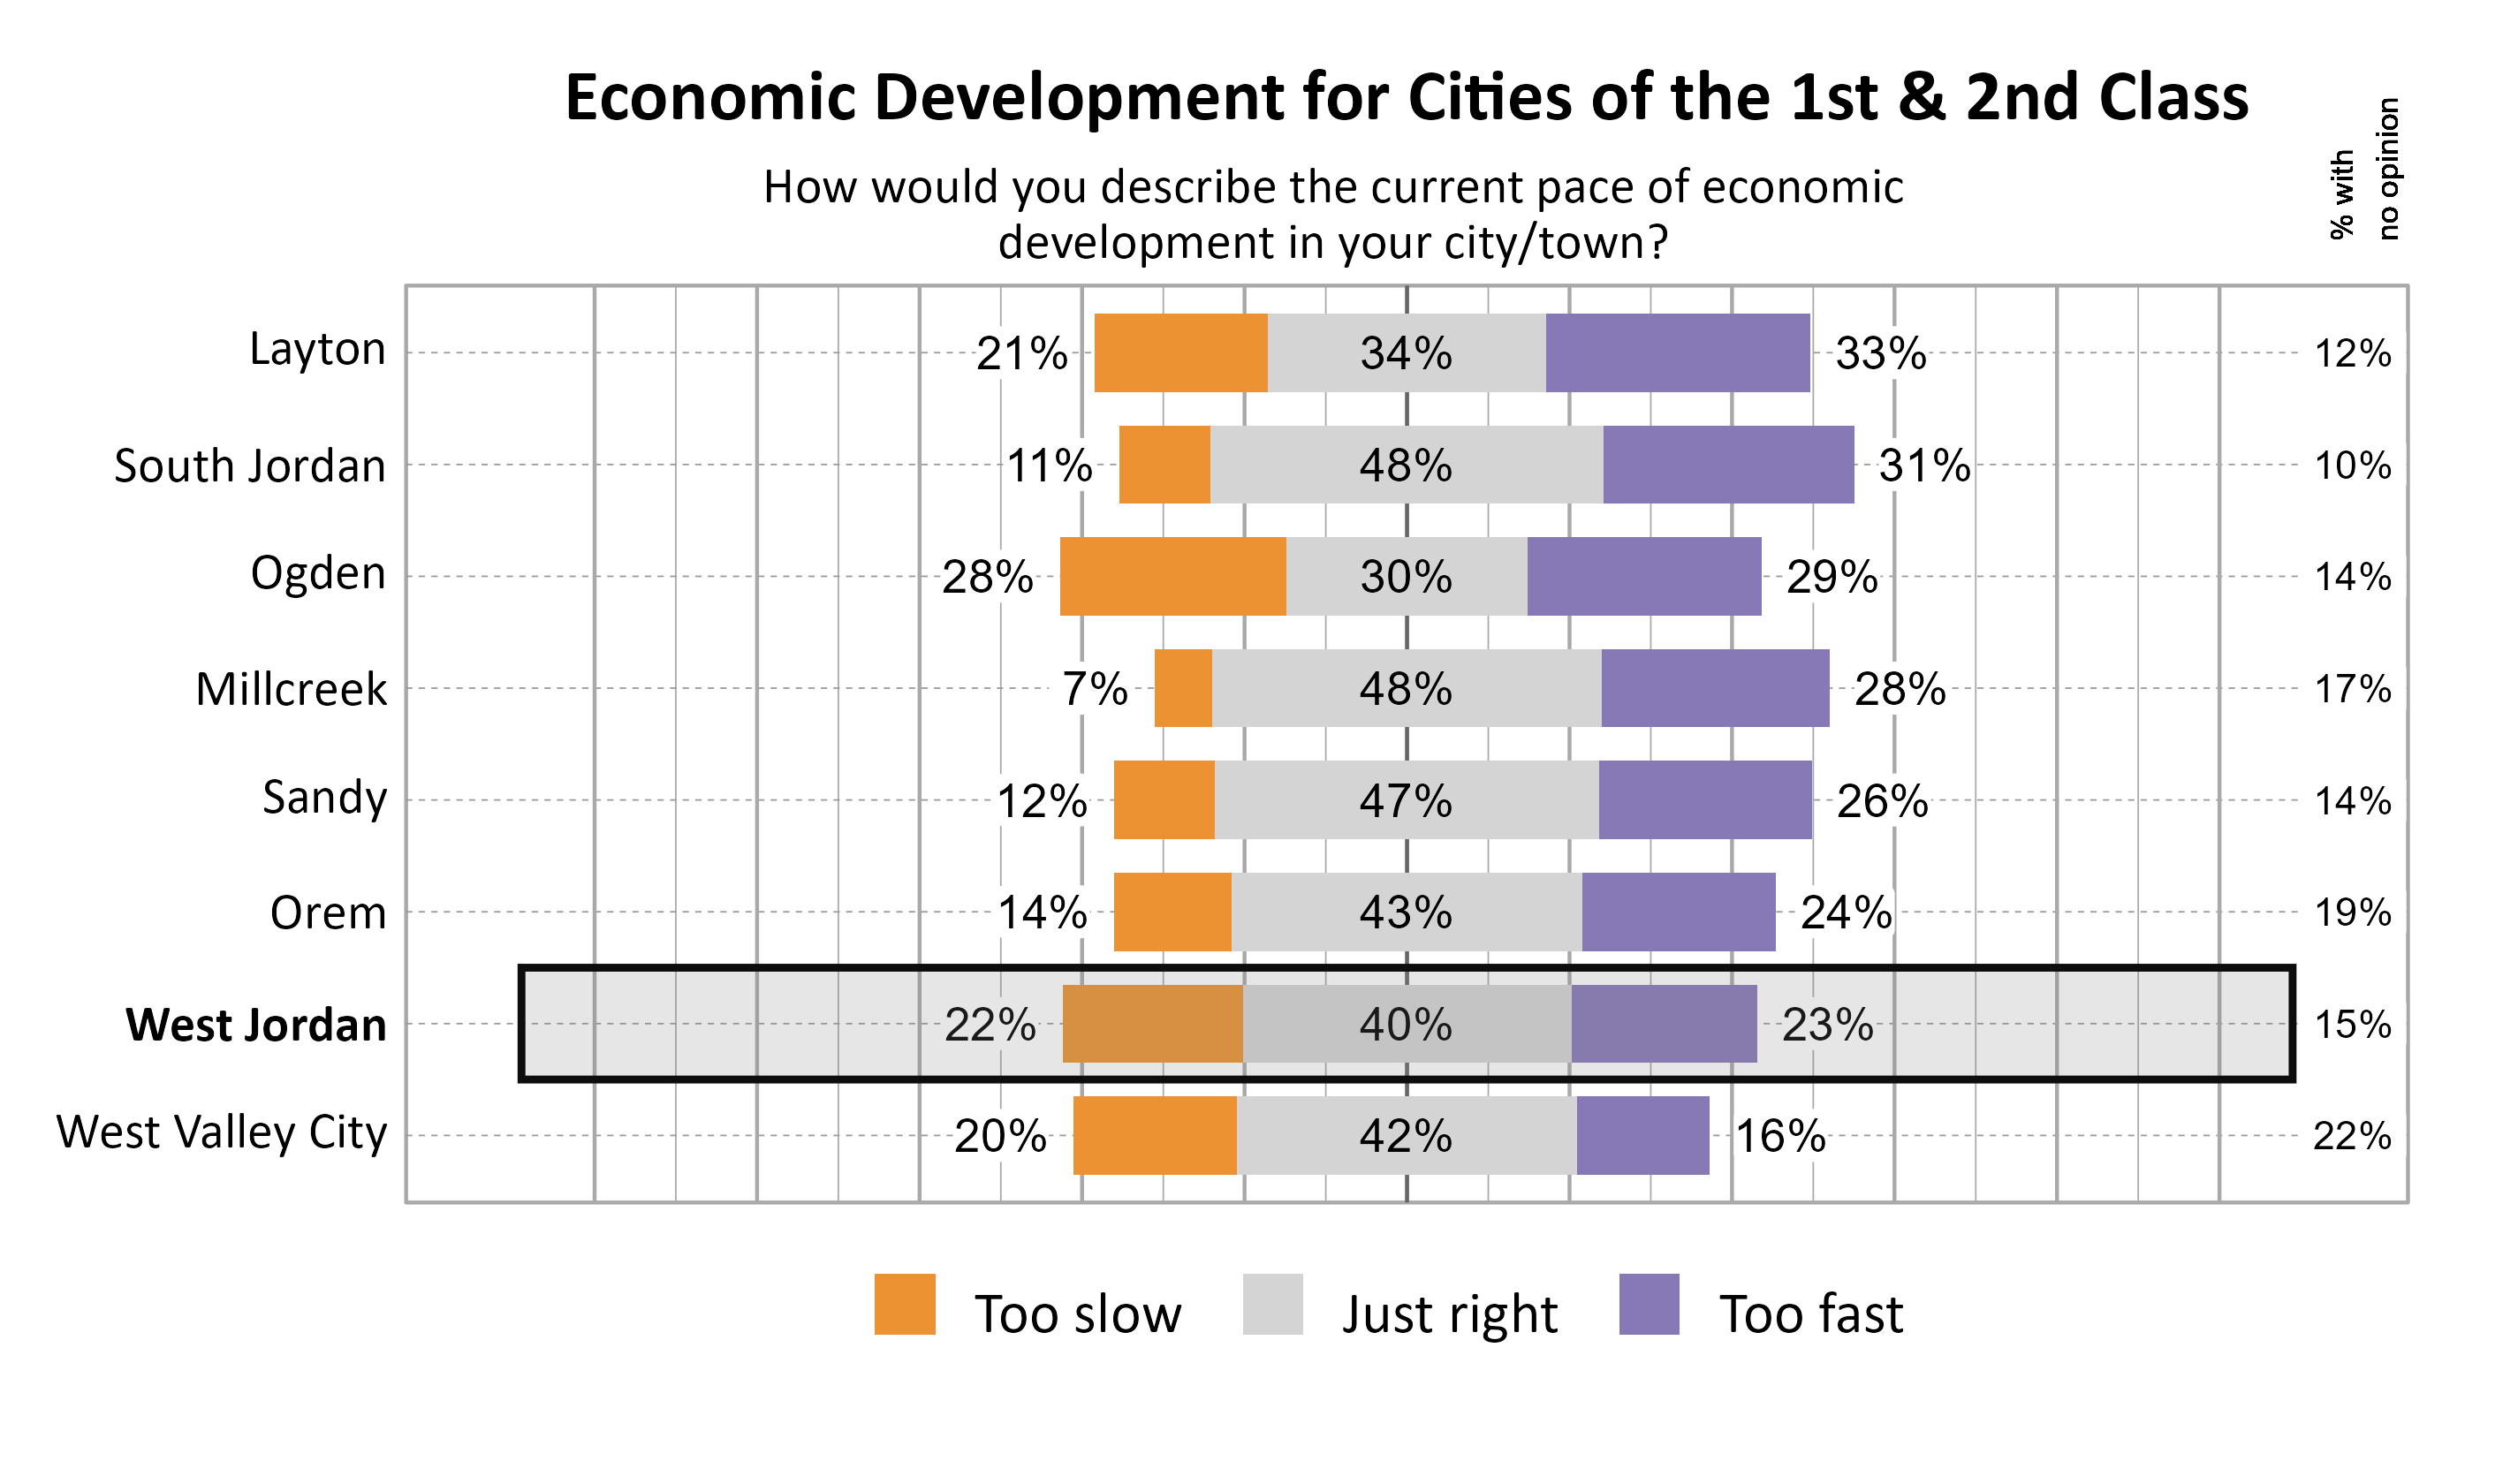
The majority of respondents in West Jordan indicated that they felt the population growth was too fast (70%). For the pace of economic development, the largest proportion of respondents indicated that it was just right (40%).
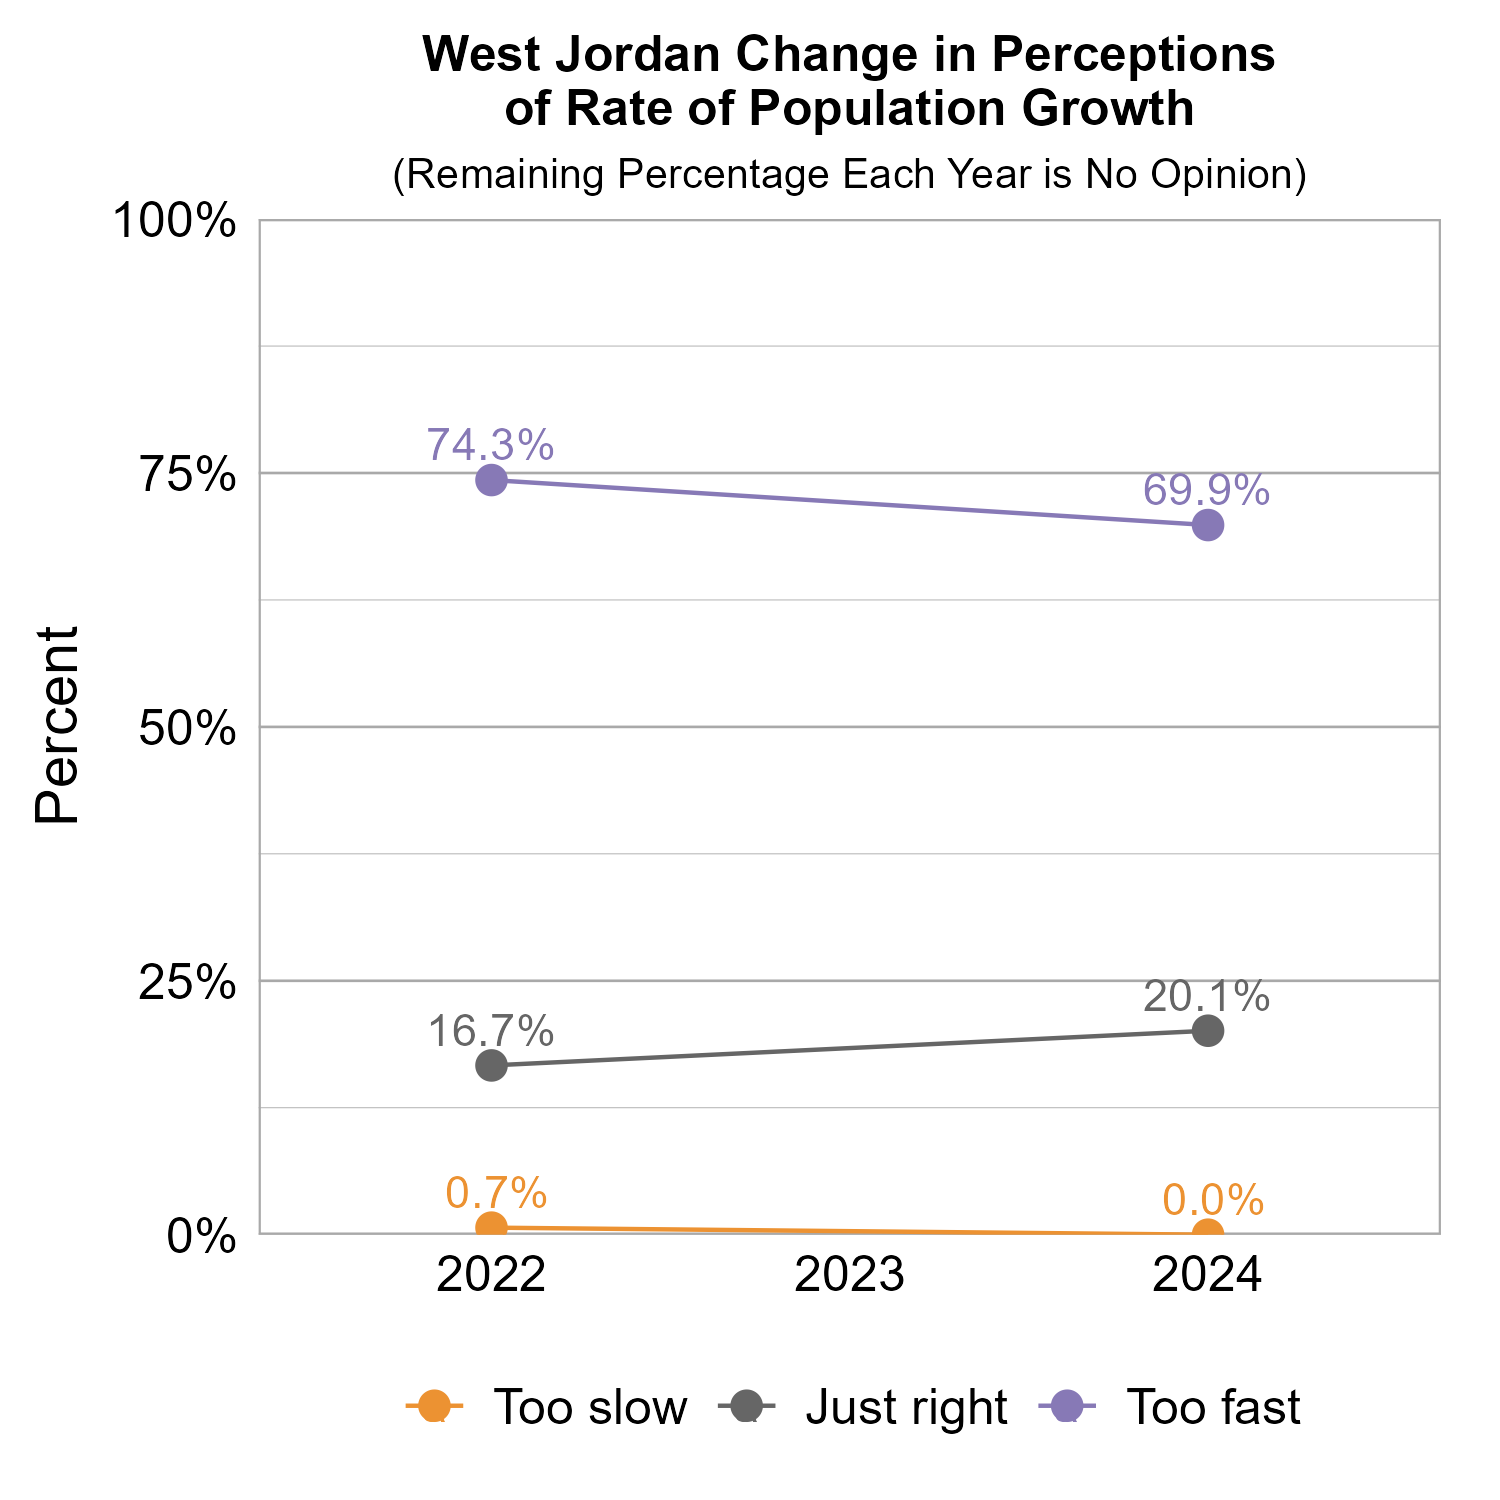
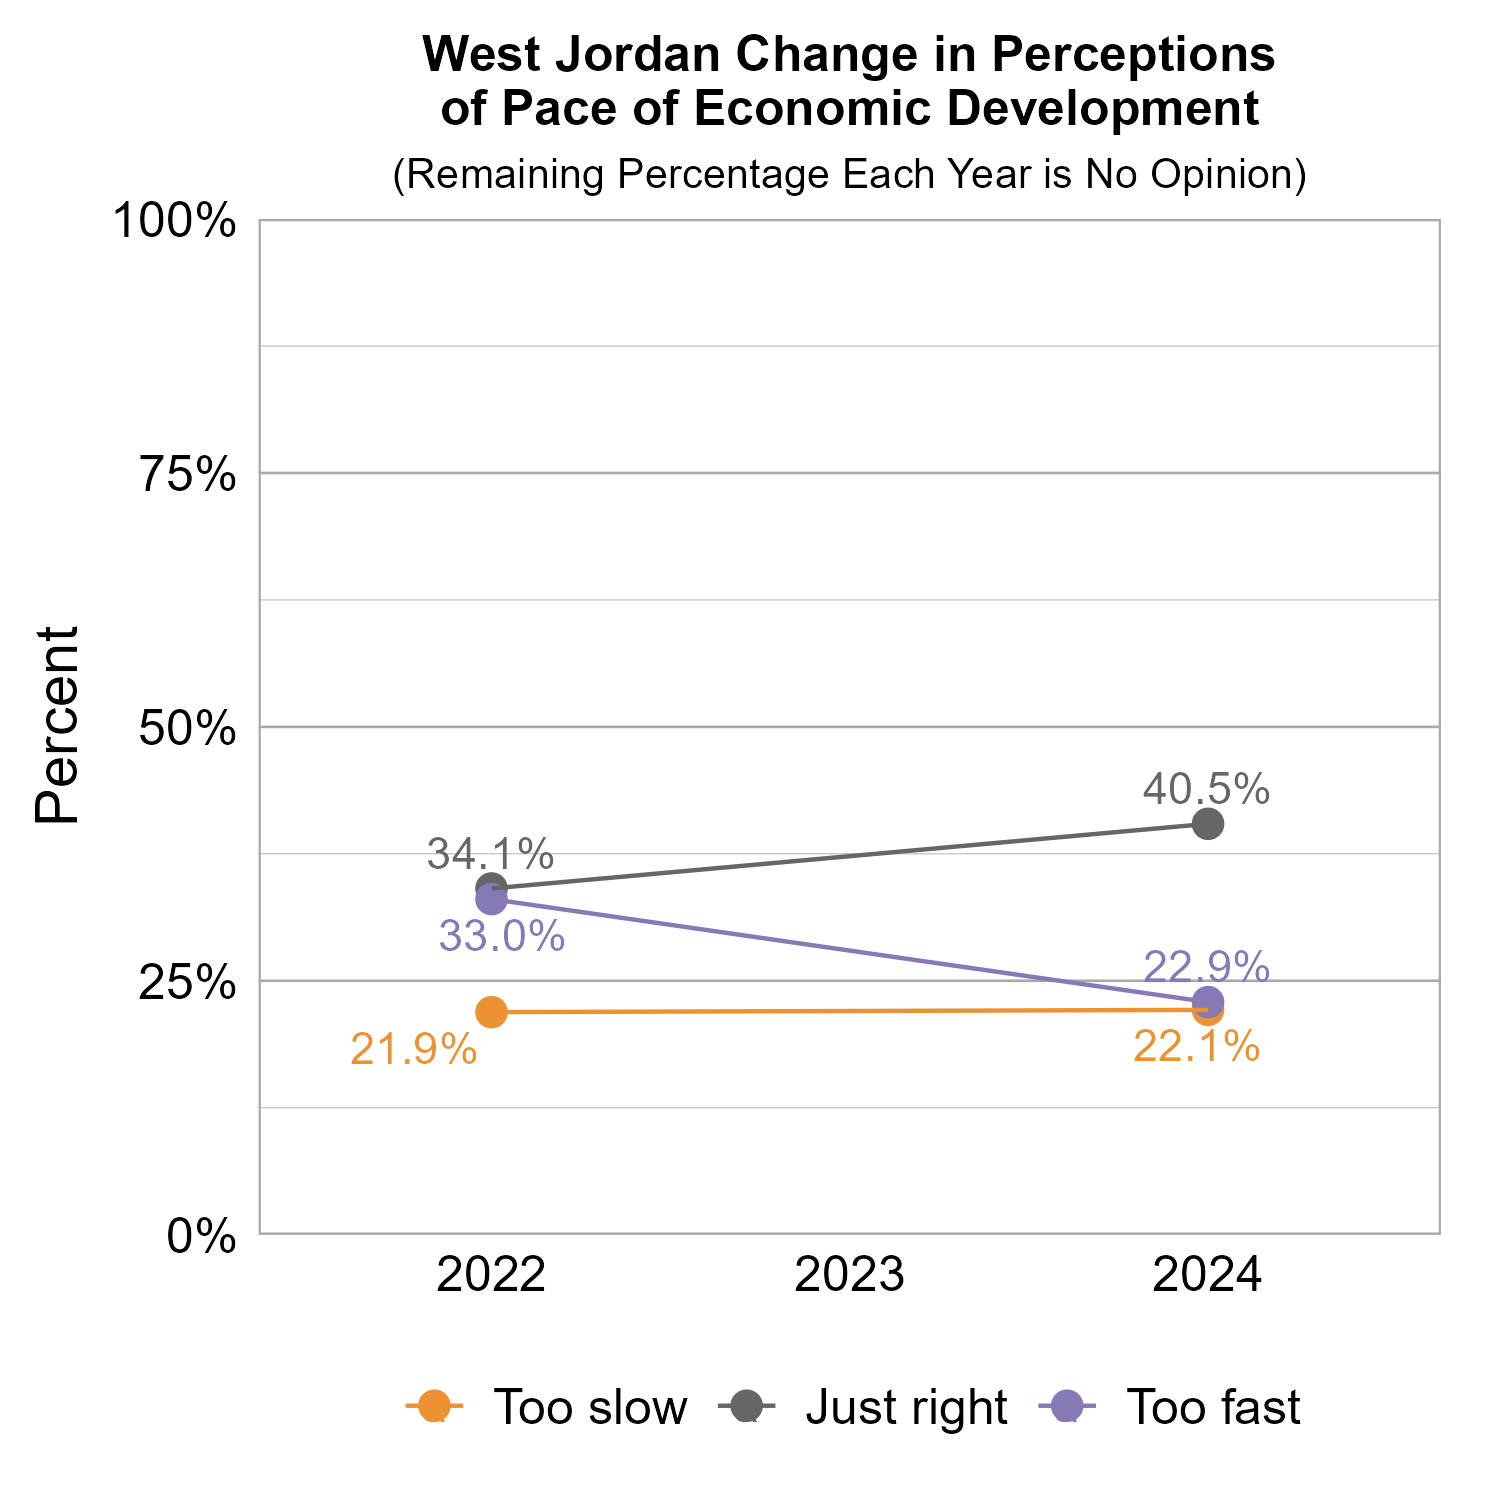
The graphs below show how perceptions of population growth and economic development in West Jordan have varied across recent years of Wellbeing Surveys. The majority of respondents indicated that the rate of population growth is too fast in both survey years, while the majority of respondents have indicated that the pace of economic development is just right in both survey years and that proportion increased in 2022.
The graphs below show perceptions of population growth and economic development for West Jordan compared to other participating cities and towns in the Cities of the 1st & 2nd Class cluster.
The graph below illustrates how many respondents perceived the pace of economic development as too slow, just right, too fast, or had no opinion, with additional breakdowns for the number of respondents who provided comments.
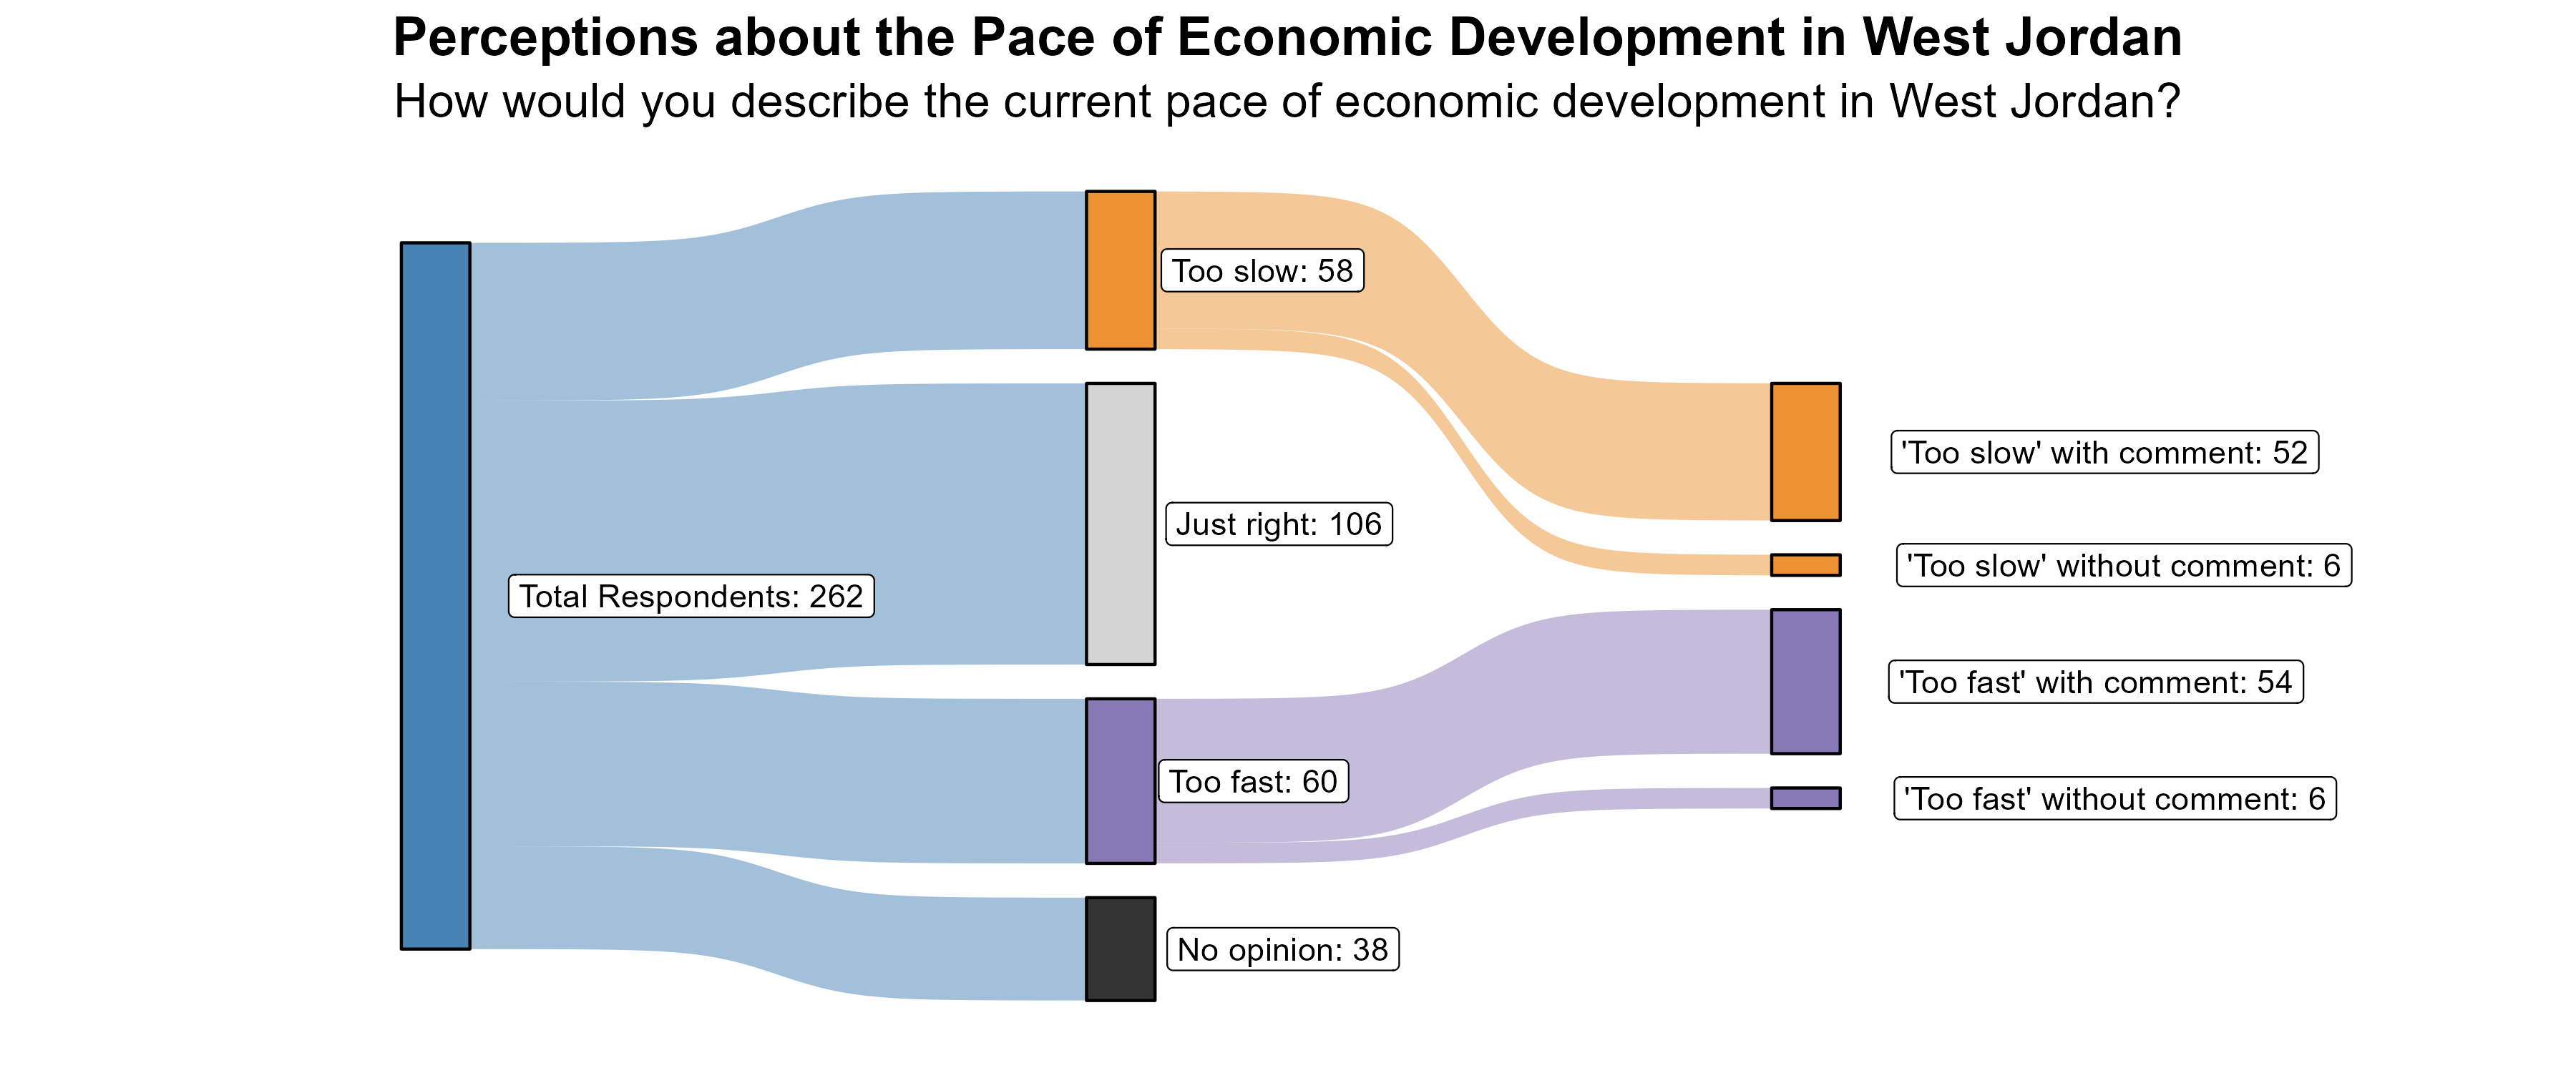
The 22% of respondents who rated the pace of economic growth as “too slow” were further asked what aspects of the local economy they would like to see more of in West Jordan. Respondents mentioned wanting more retail options as well as better access to the existing retail options. Comments noted that traversing shopping areas and parking lots is difficult given the amount of traffic. There were also several comments expressing desire for more local or small businesses in the area, instead of chains. A few people also brought up the need for more employment opportunities.
Additionally, the 23% of respondents who rated the pace of economic growth as “too fast” were further asked what aspects of the local economy they feel are growing too quickly in West Jordan. Comments focused on infrastructure and how that lags behind building and that it is not always well thought out. There were also many comments about too much housing being built and the strain growth puts on resources and open space.
Transportation in West Jordan
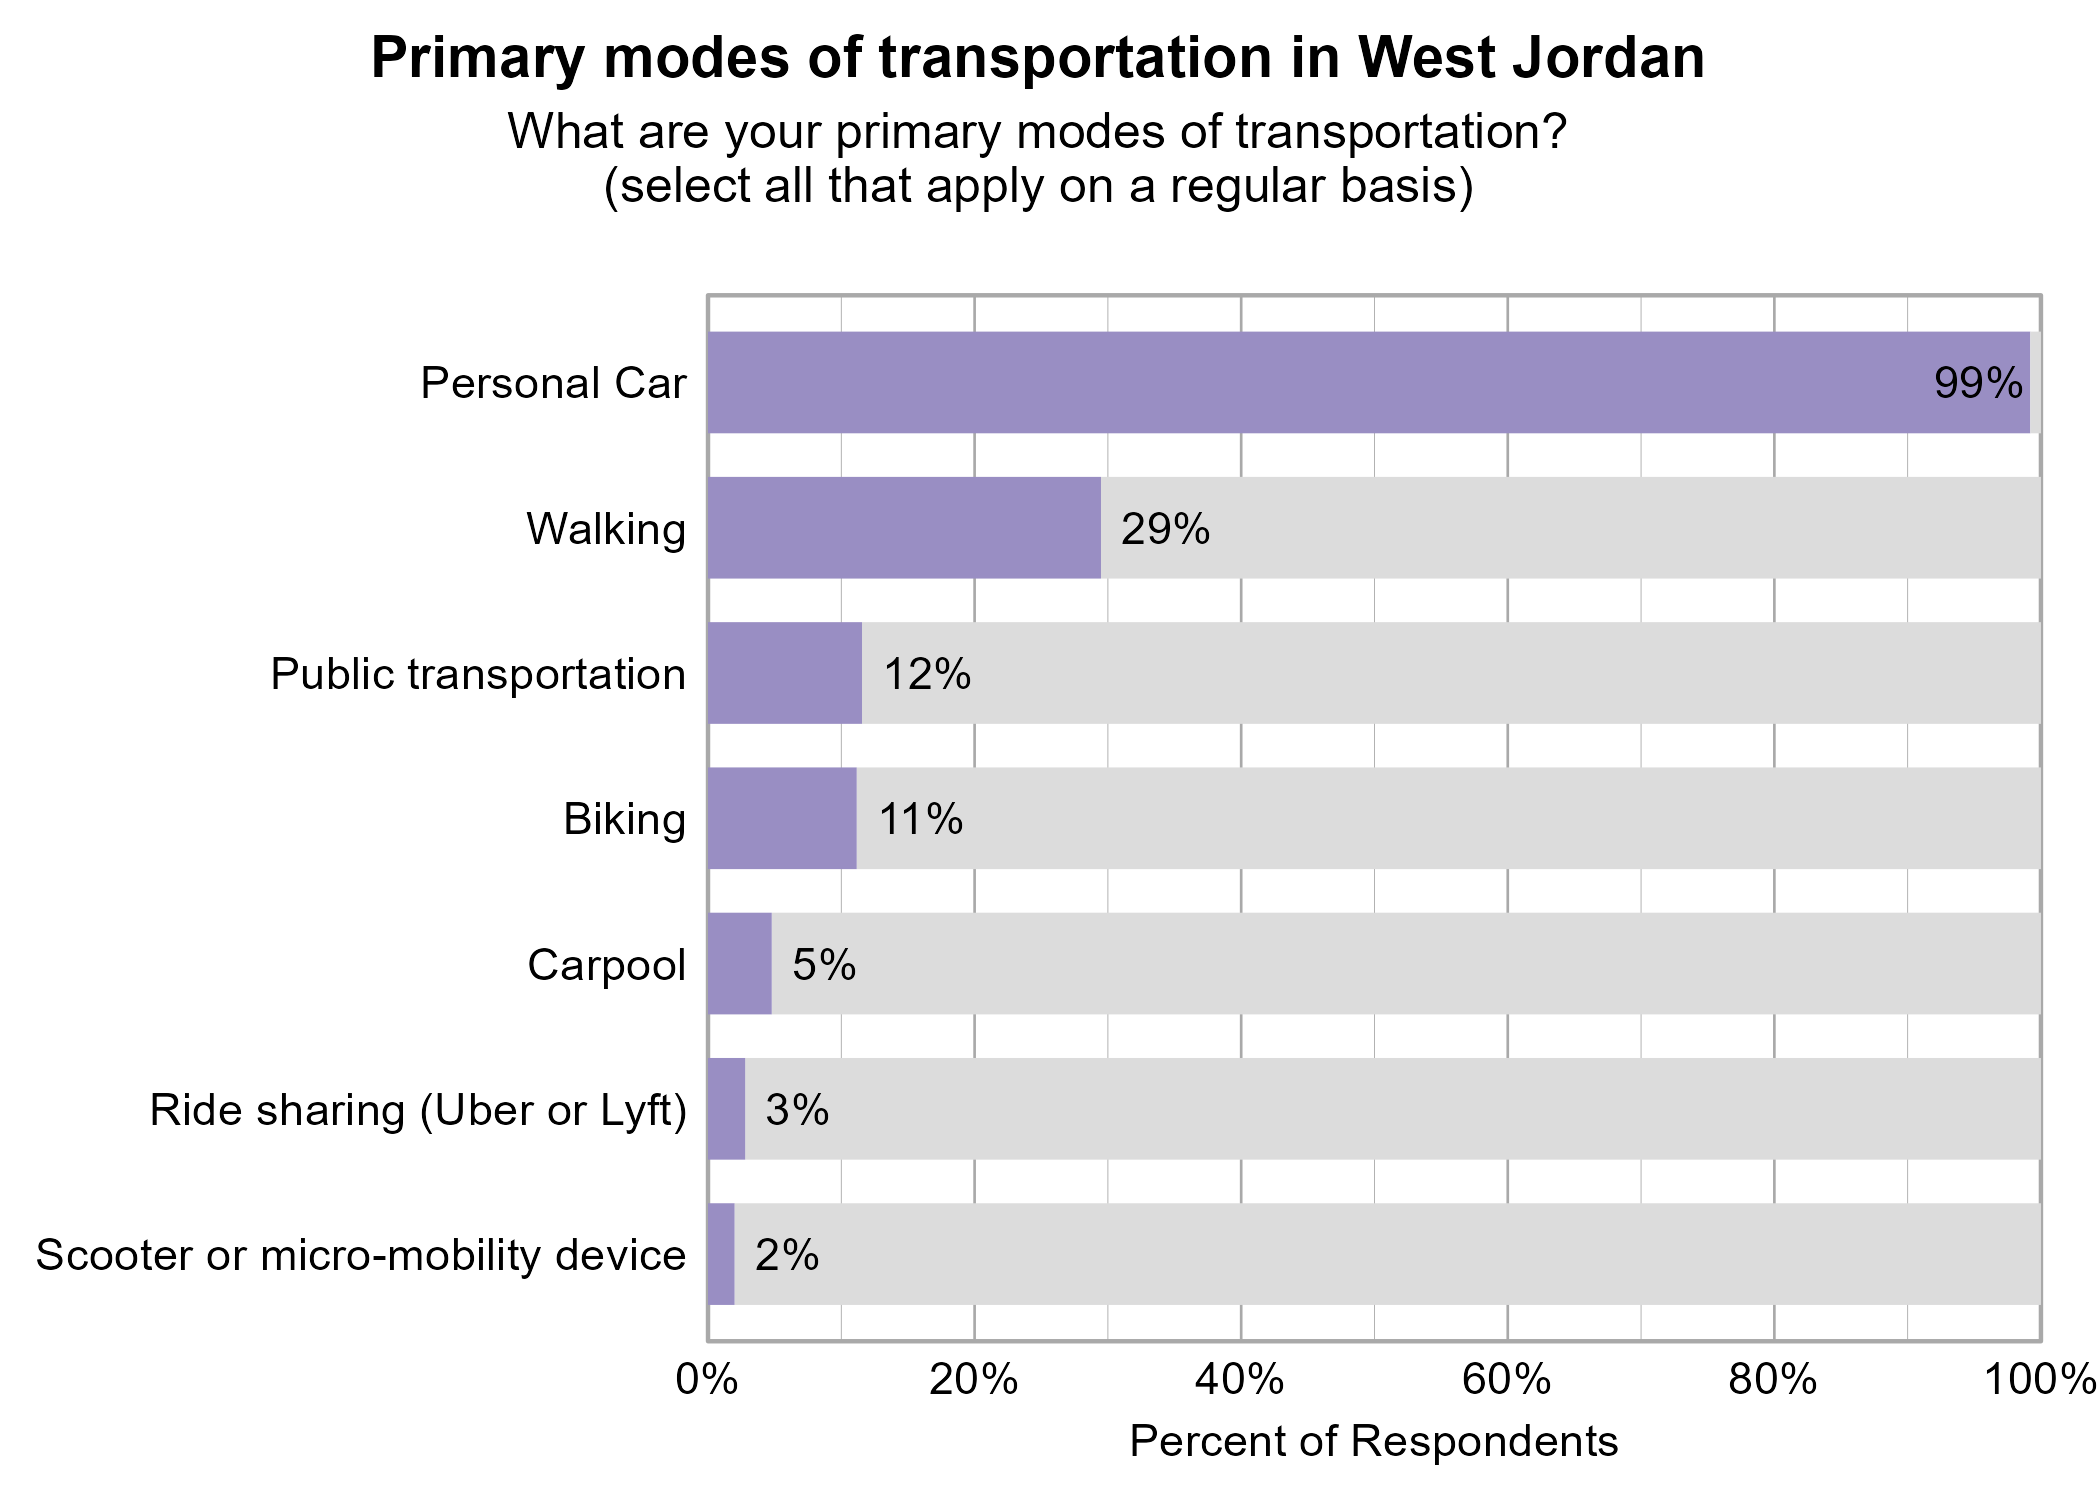
Respondents were asked to indicate all of their primary modes of transportation on a regular basis in West Jordan. The most popular modes of transportation were personal car (99%) and walking (29%).
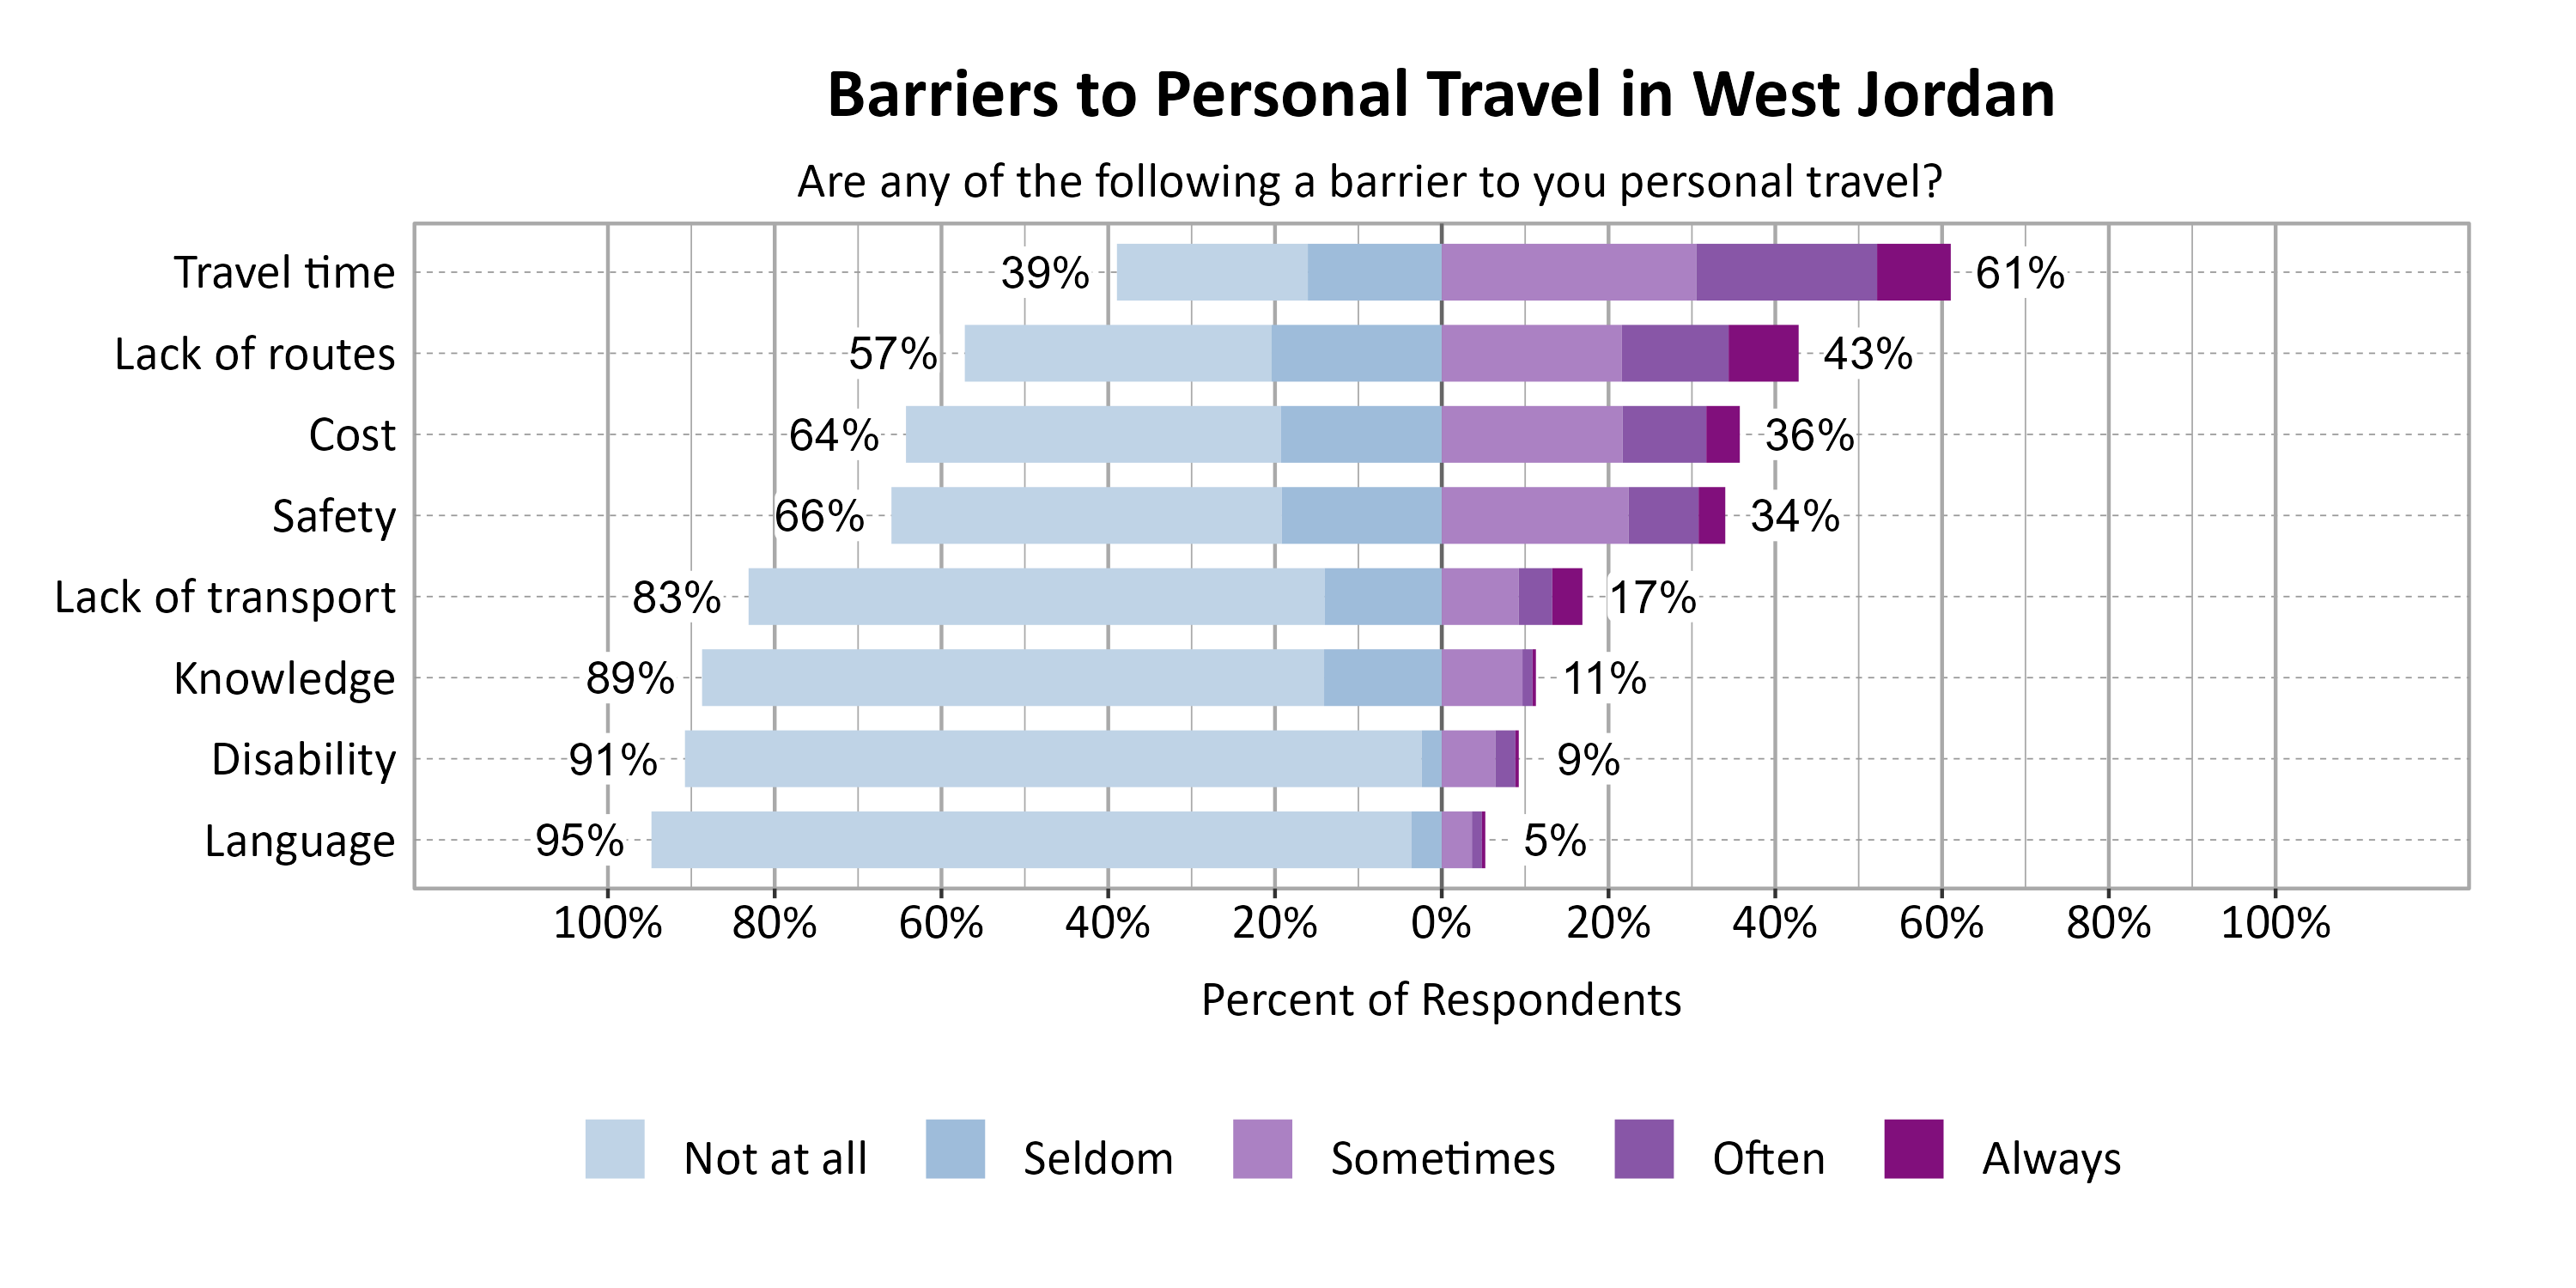
Respondents were asked to indicate the most common barriers to transportation in West Jordan. The most problematic barriers were Travel time (61%) and Lack of routes (43%).
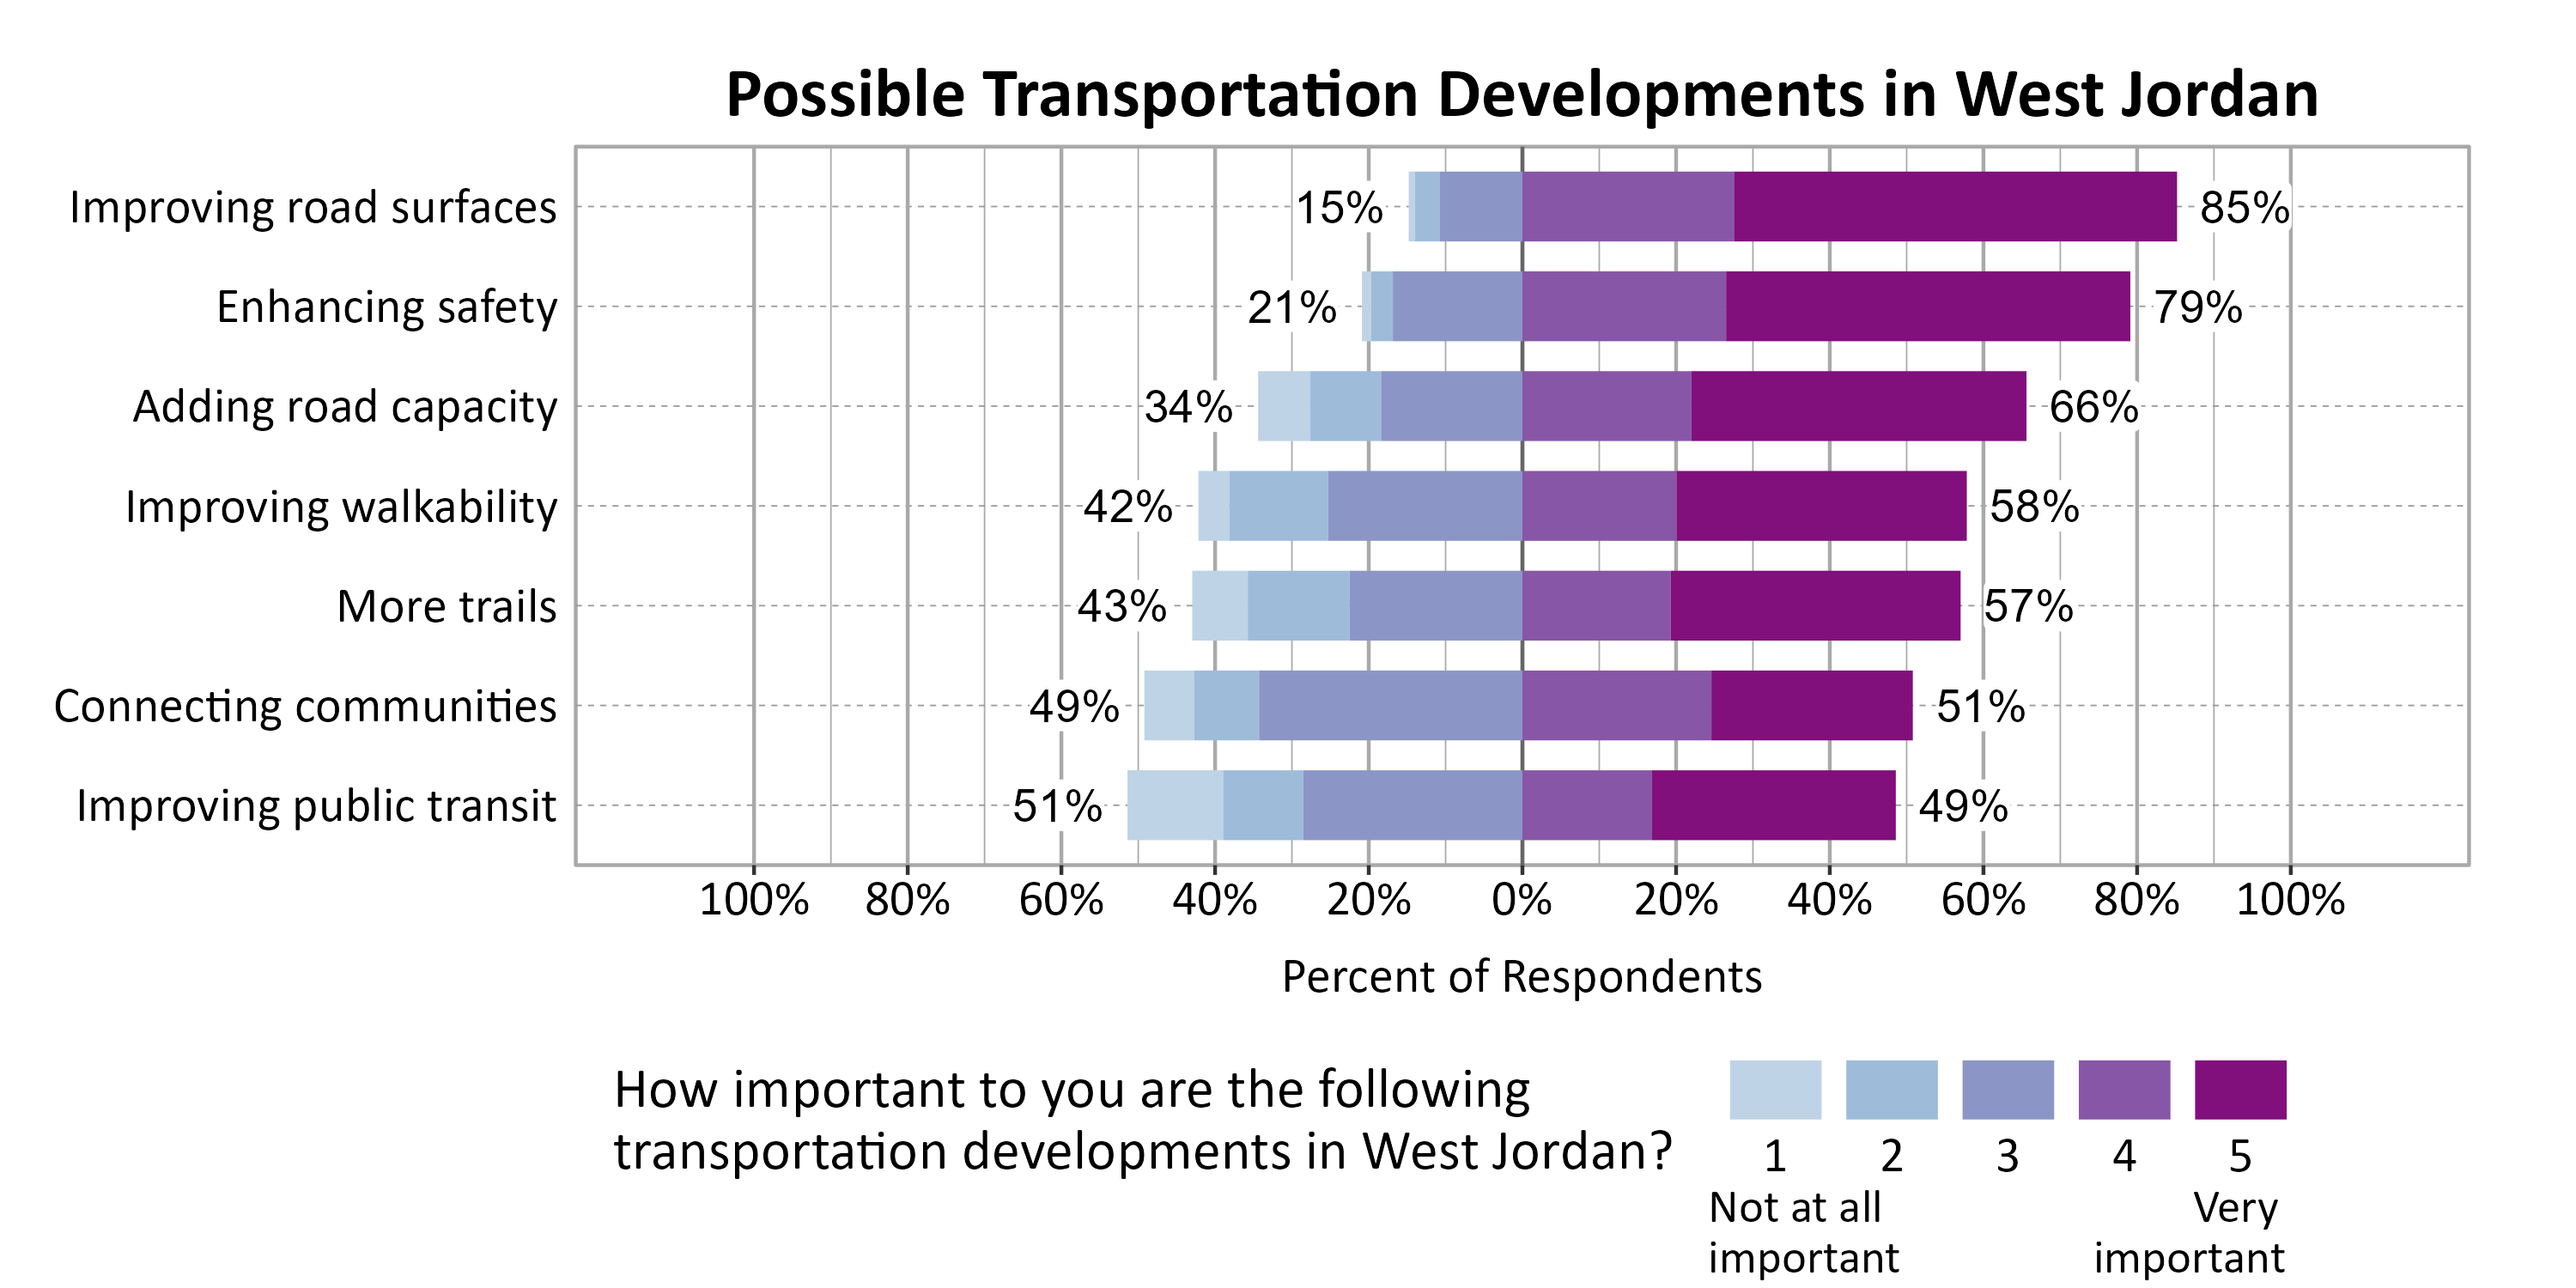
Respondents were asked to indicate the importance of a set of possible transportation developments in West Jordan. The most important development to respondents were Improving road surfaces (85%), Enhancing safety (79%), and Adding road capacity (66%).
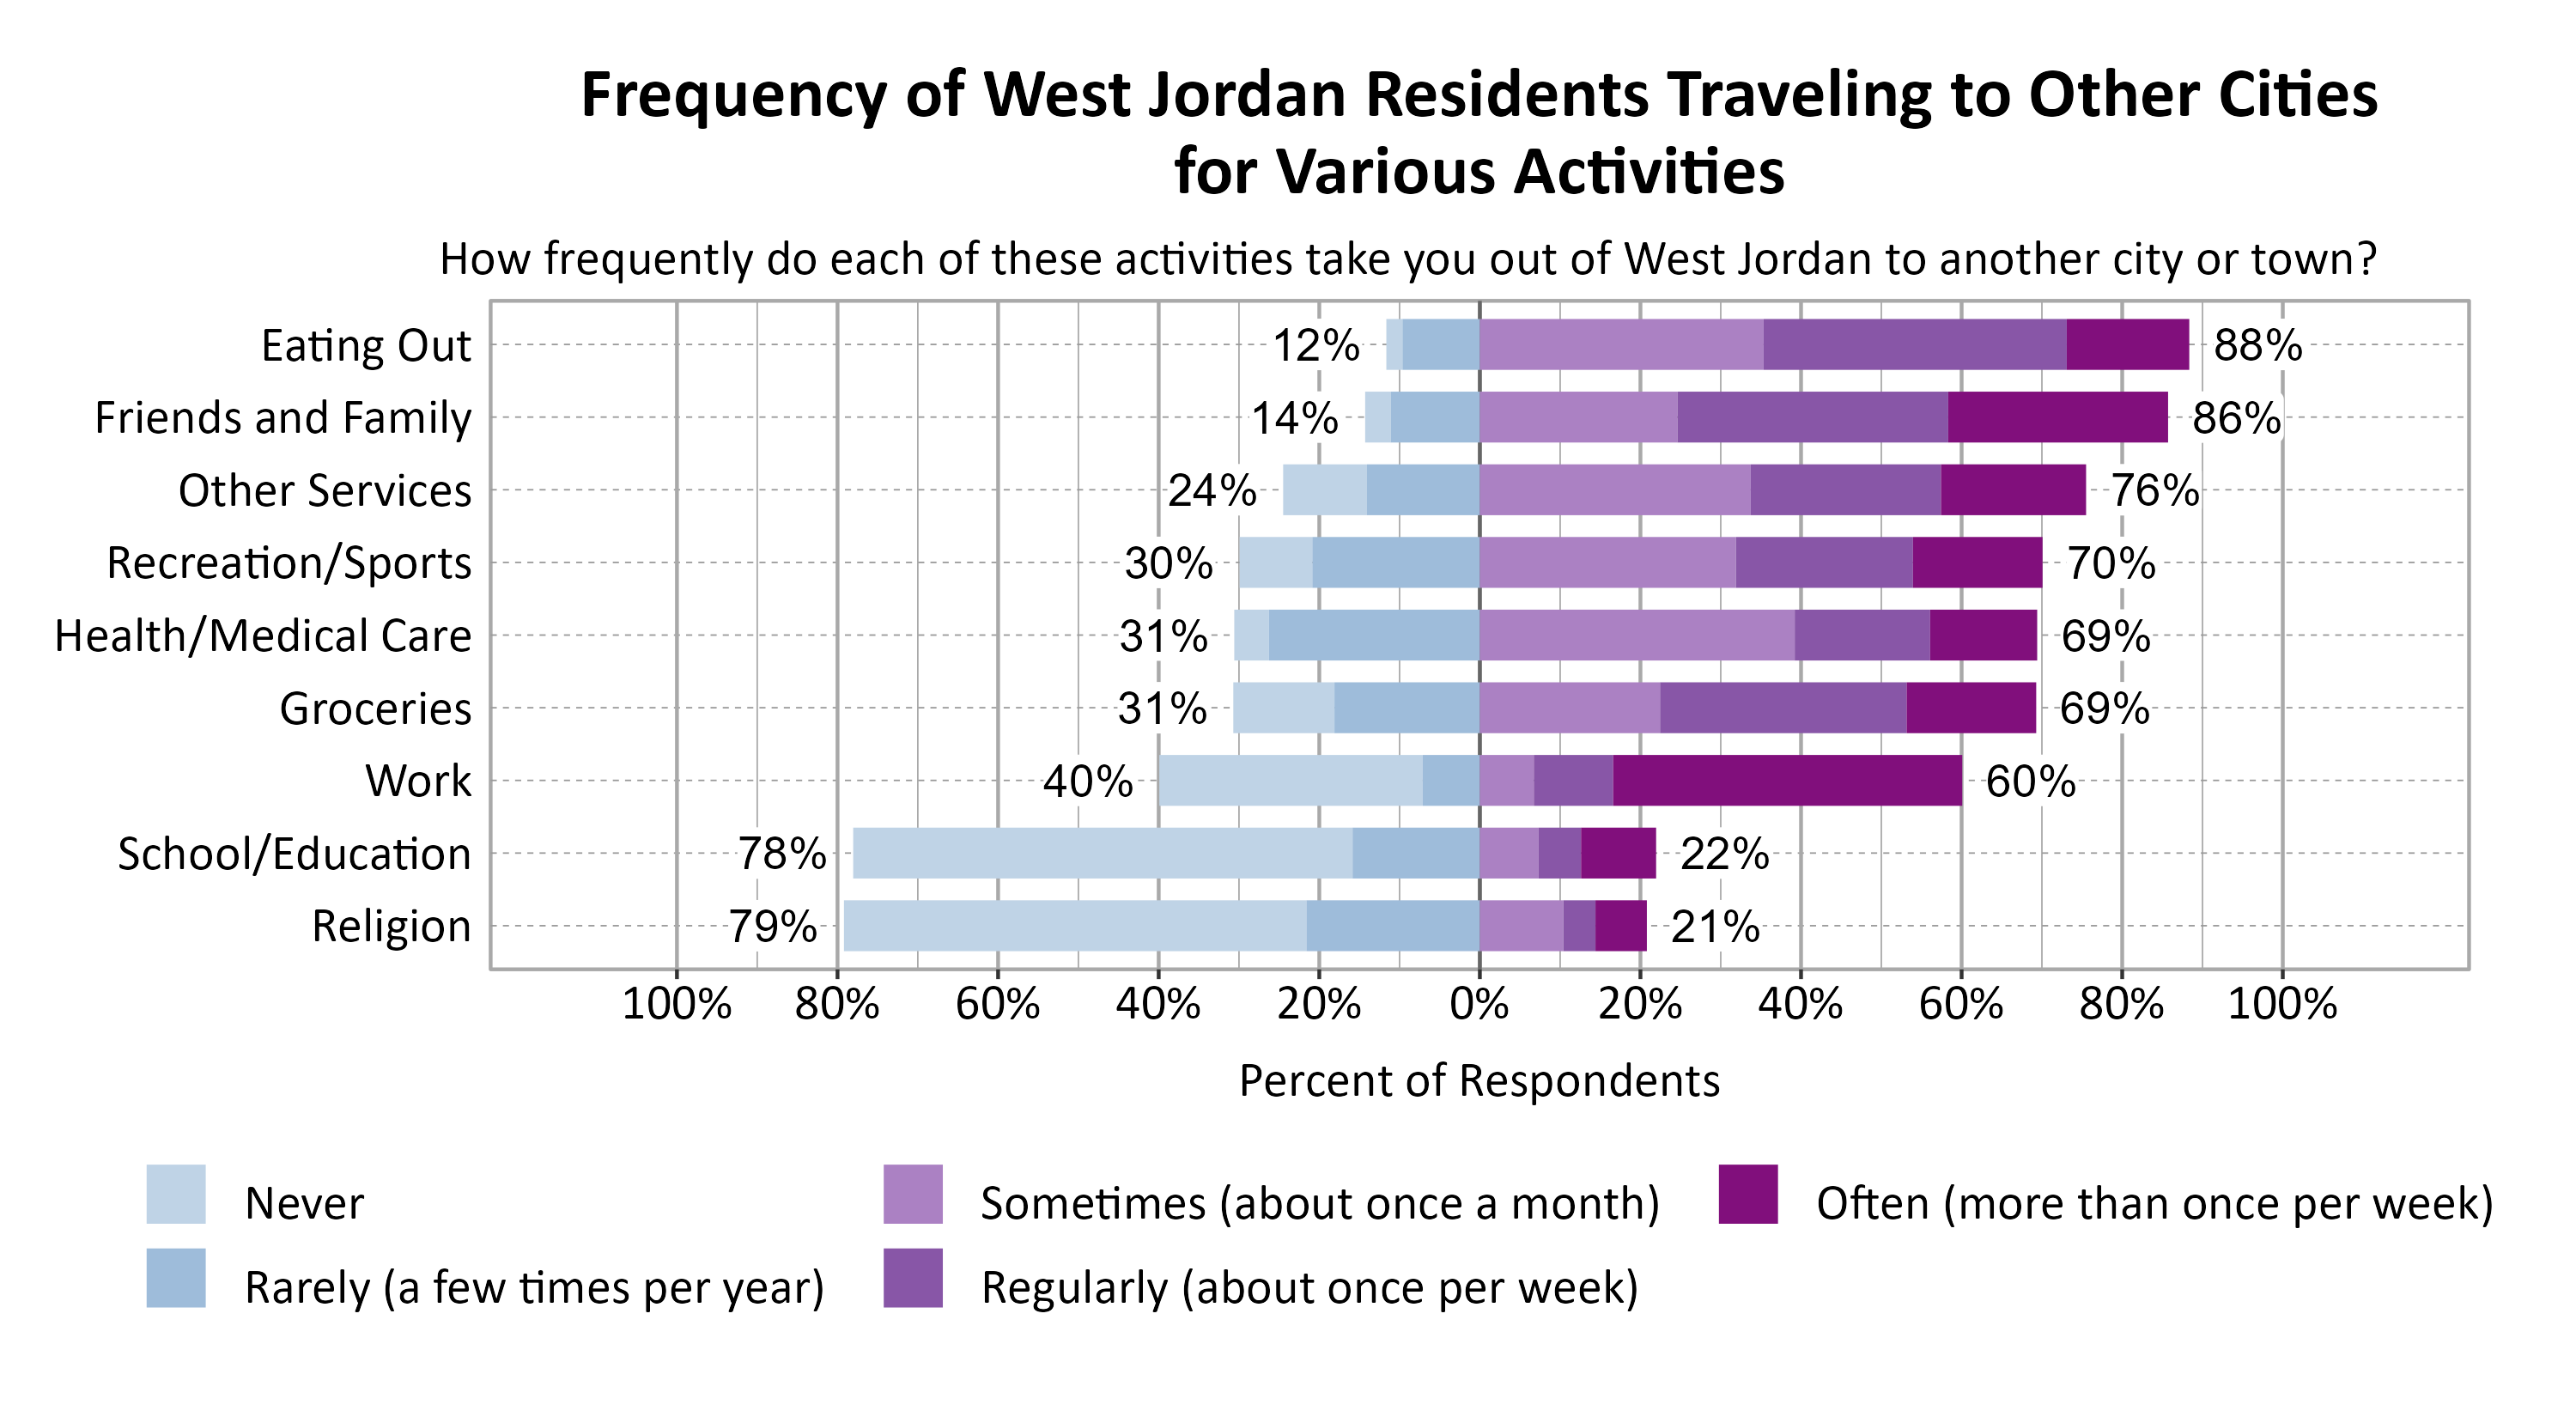
Respondents were asked to indicate how frequently various activities take them out of West Jordan to another city or town. The most commonly indicated reasons for traveling to another city or town at least sometimes or once a month were Eating Out (88%), Friends and Family (86%), and Other Services (76%).
Concerns in West Jordan
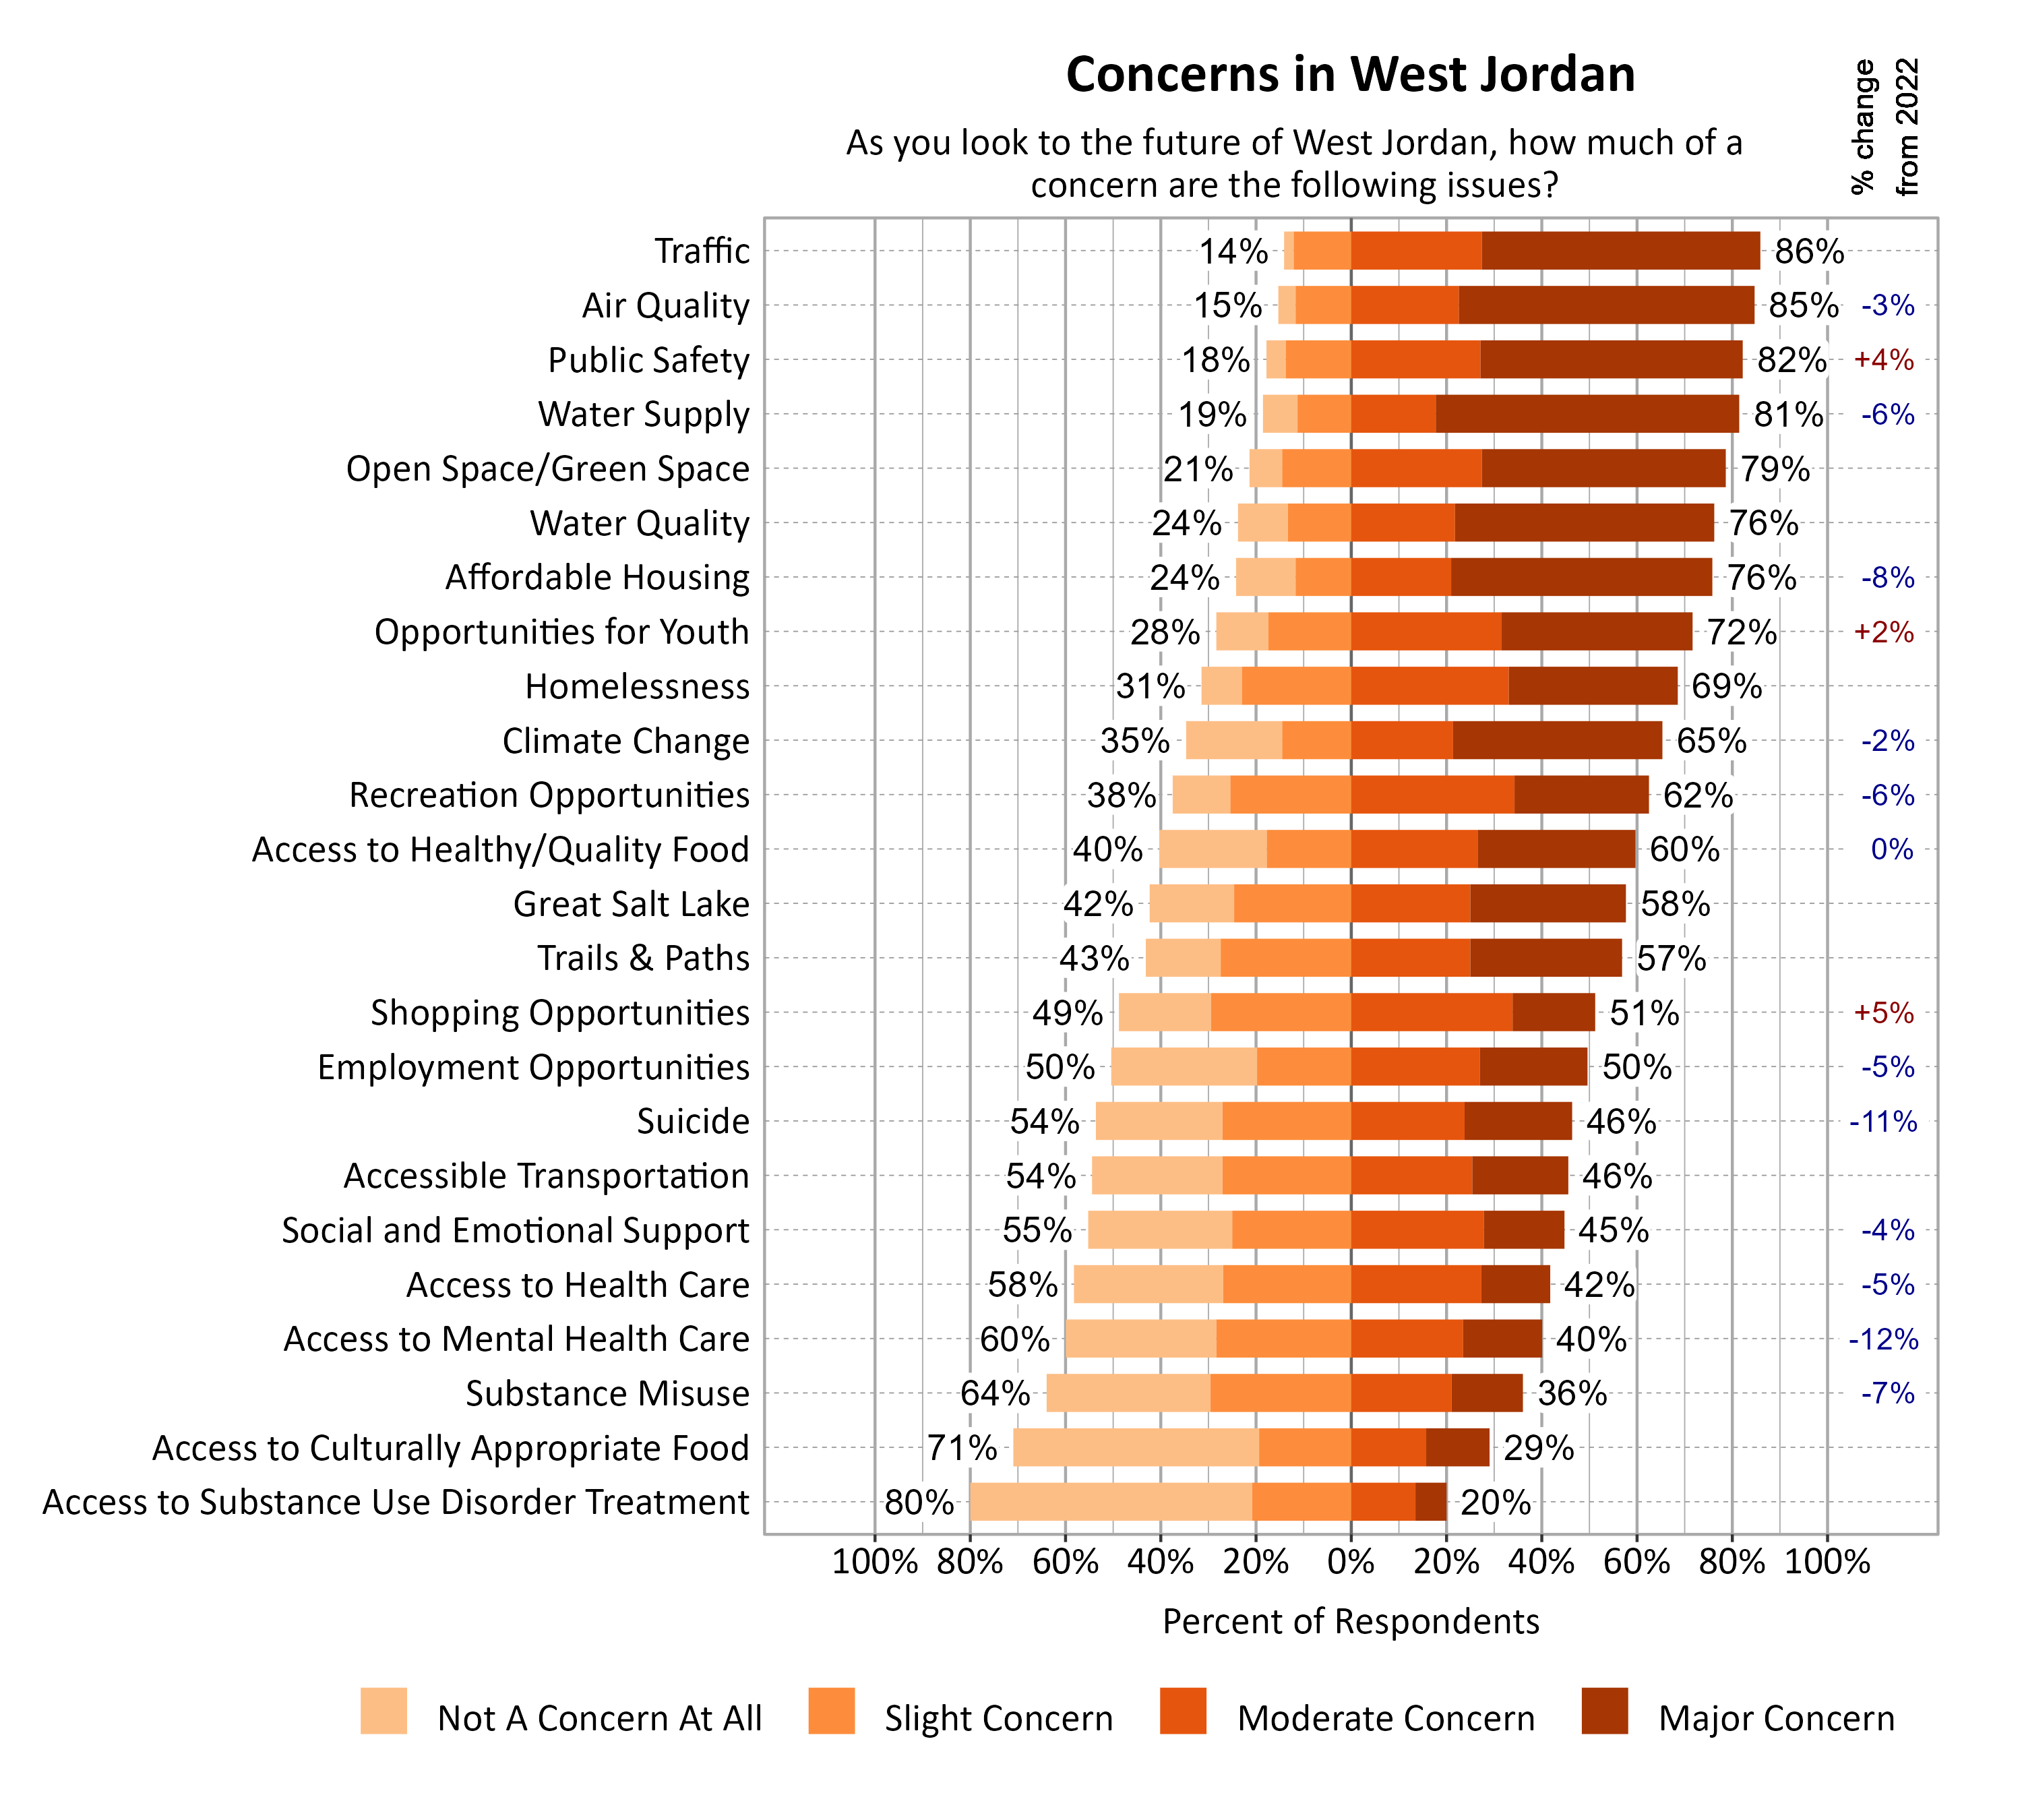
Survey respondents indicated the degree to which a number of possible local issues were a concern as they look to the future of West Jordan. Traffic (86%), Air Quality (85%), Public Safety (82%), and Water Supply (81%) were the top concerns. Since 2022, moderate or major concern about access to mental health care (-12%) and suicide (-11%) notably decreased.
Additional Questions for West Jordan
Communication Methods in West Jordan
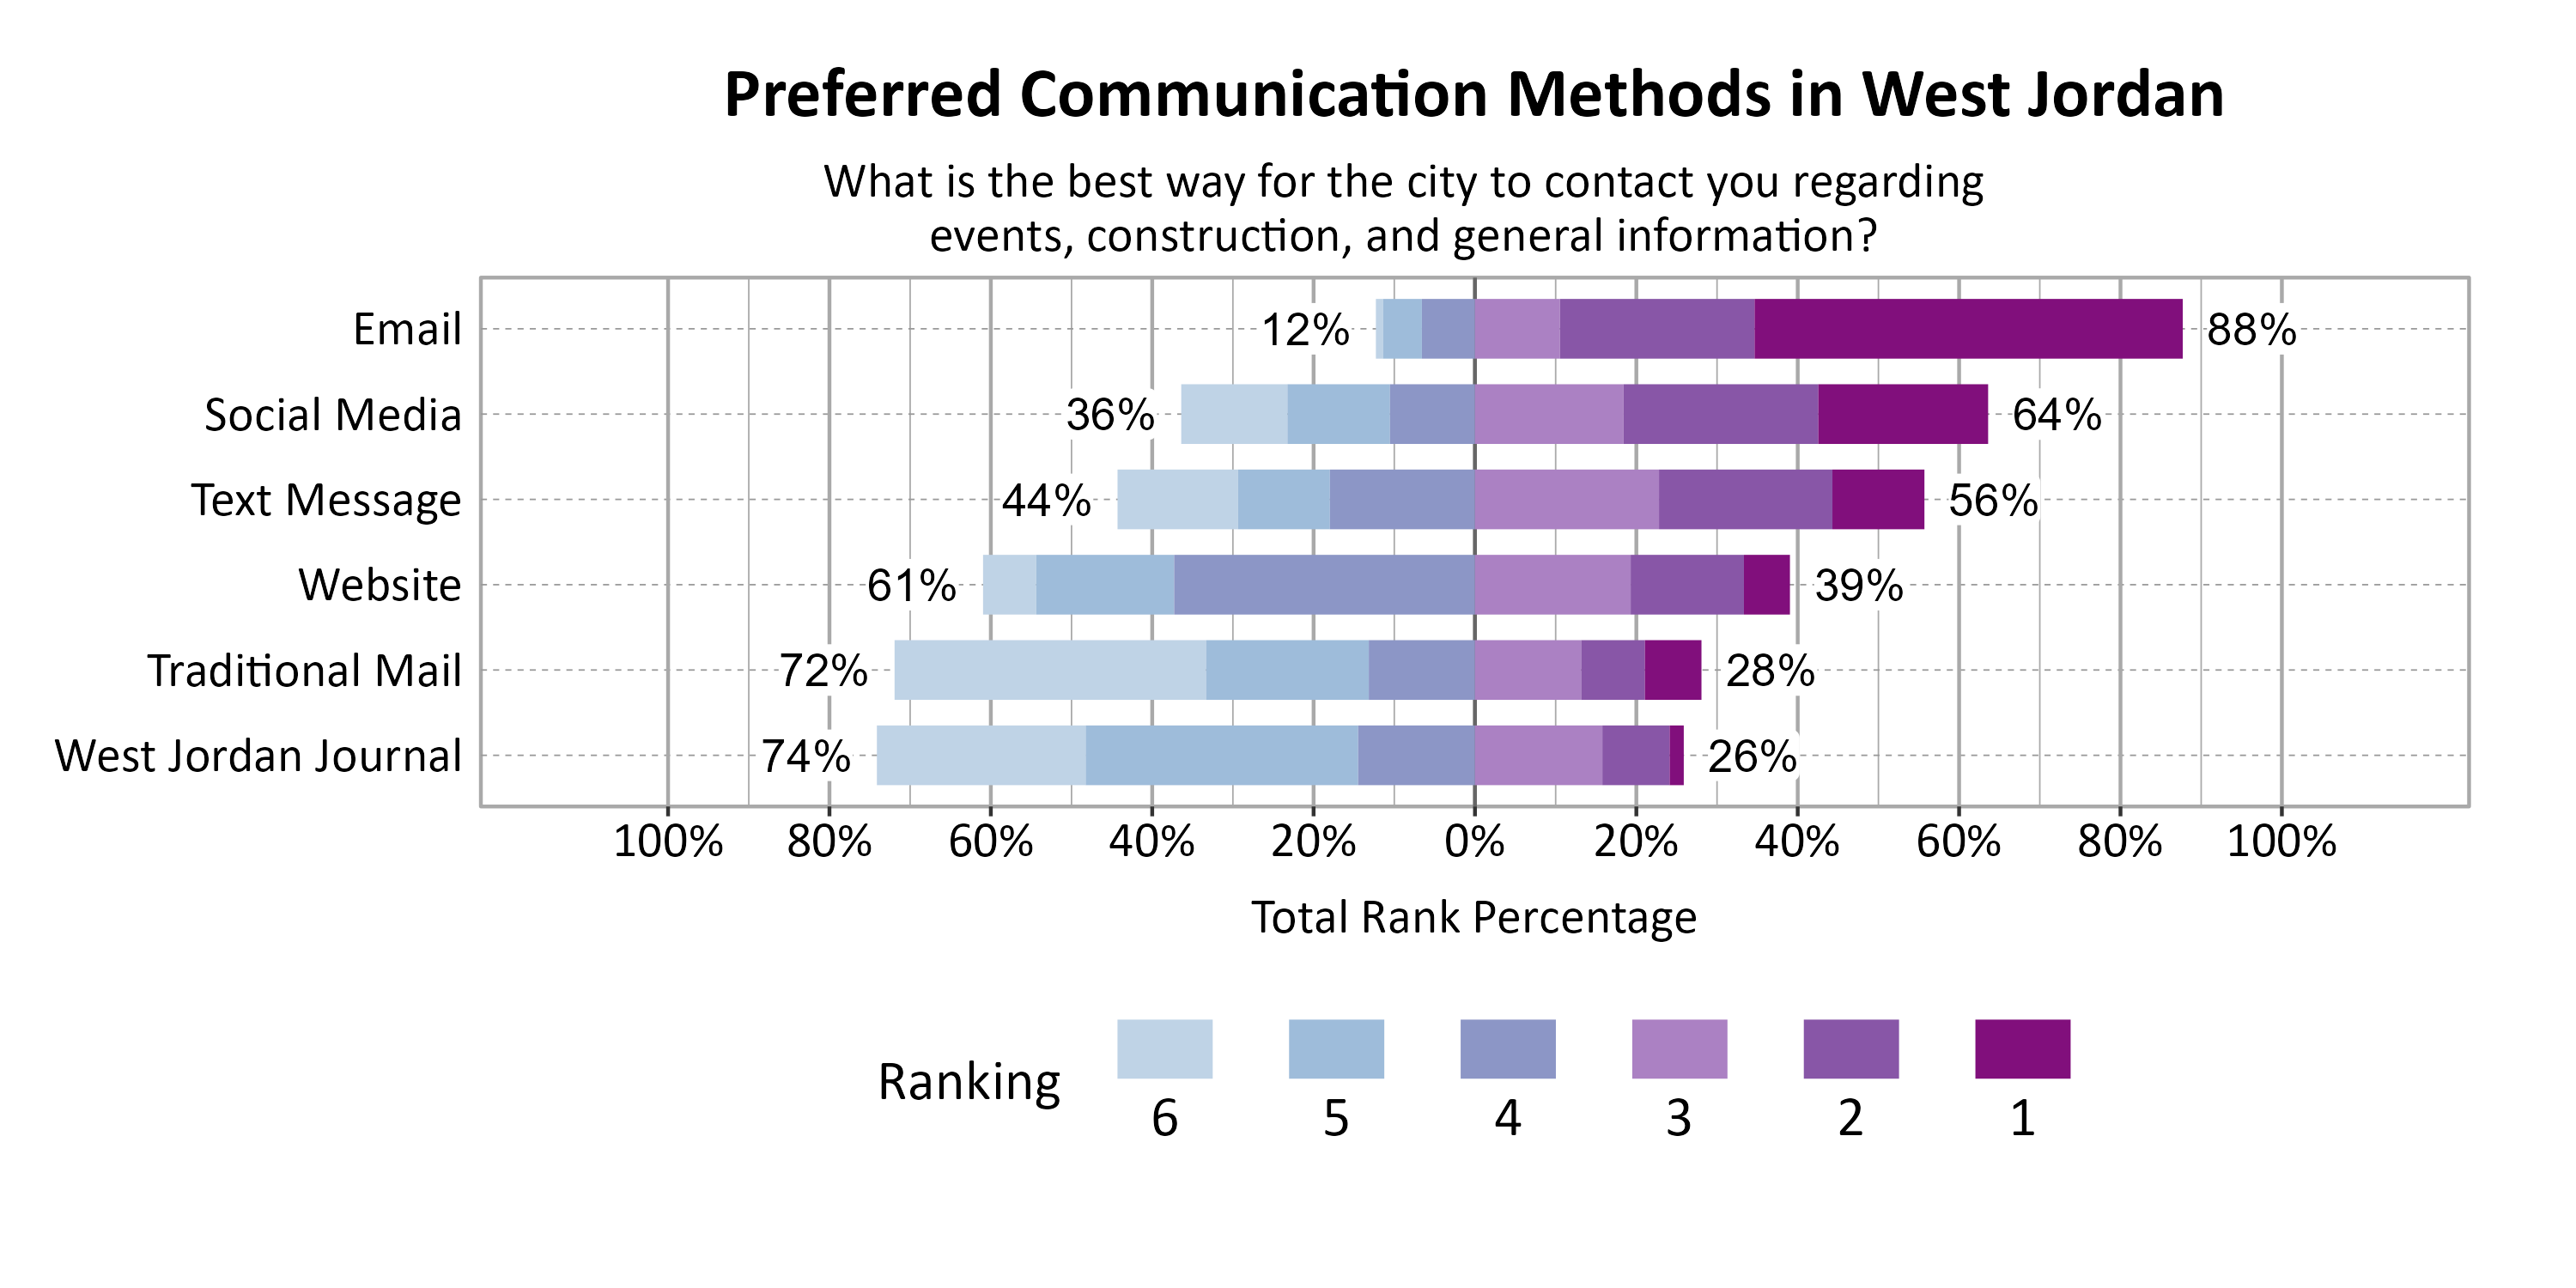
Respondents were asked to rank the following options from 1 (most preferred) to 6 (least preferred) of methods for the city to contact residents regarding events, construction, and general information. The highest ranked methods were Email, Social Media, and Text Message.
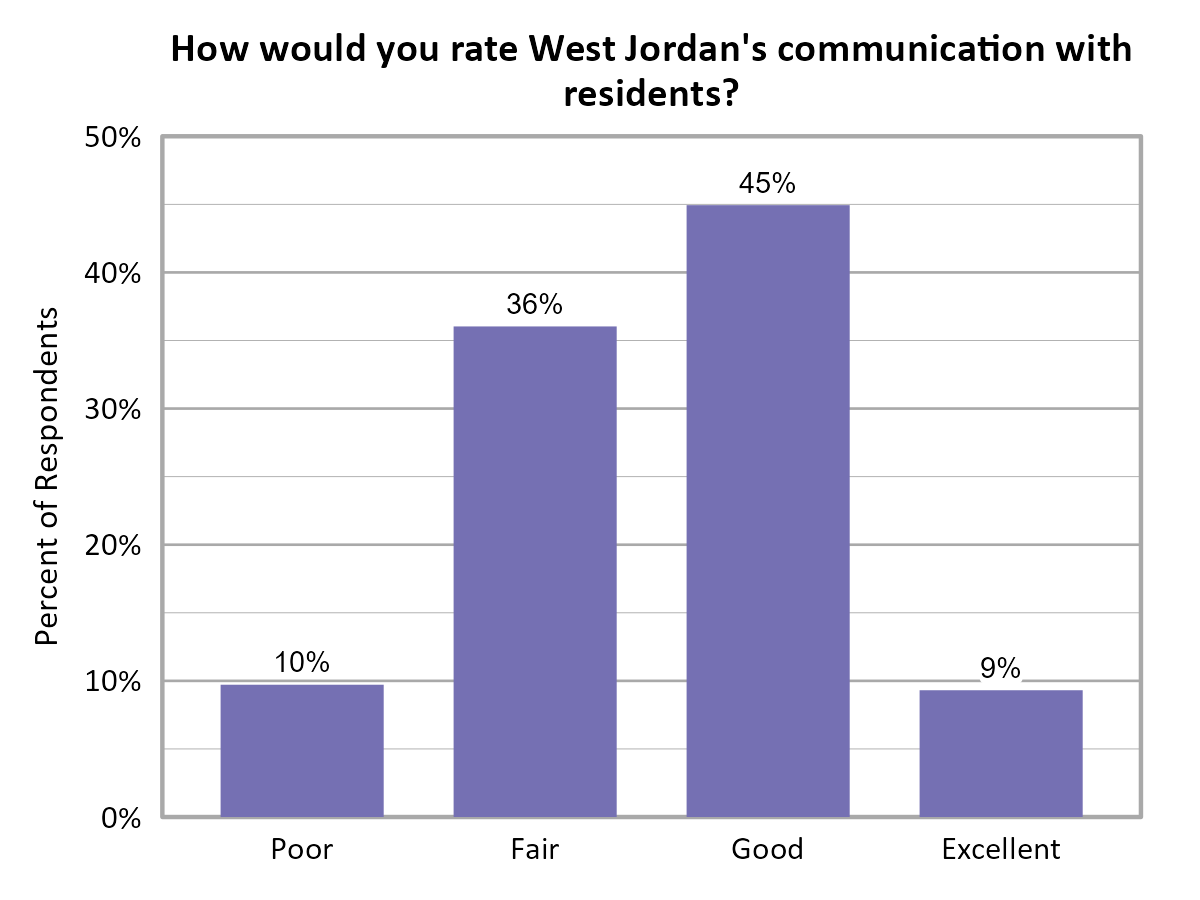
In addition, when asked how they would rate West Jordan’s communication with residents, the largest proportion of respondents indicated it was Good (45%) or Fair (36%).
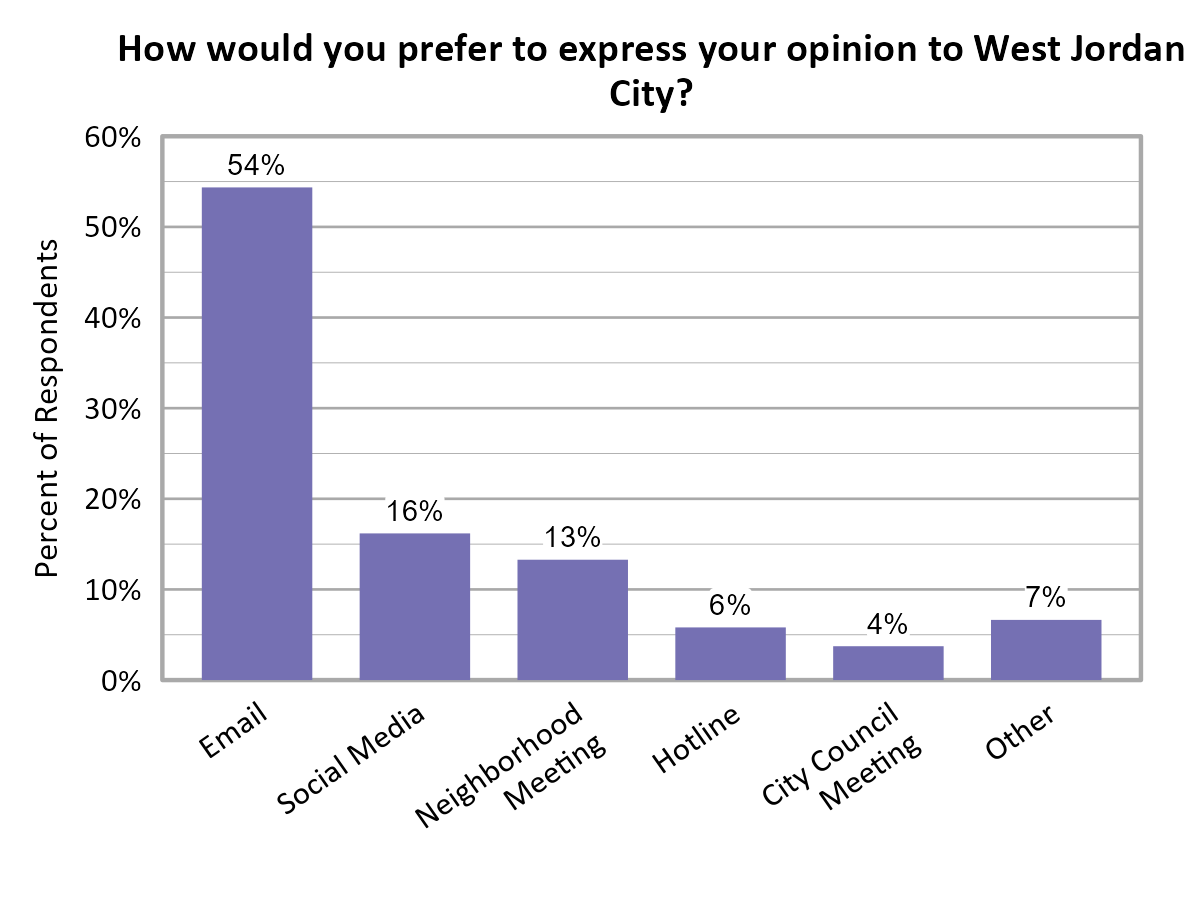
Respondents were also asked how they prefer to express their opinion to West Jordan City. The majority of residents indicated they preferred Email (54%). Other methods that respondents preferred to express their opinion included contacting City Council members or other representatives, contacting city offices, through surveys, or through city websites.
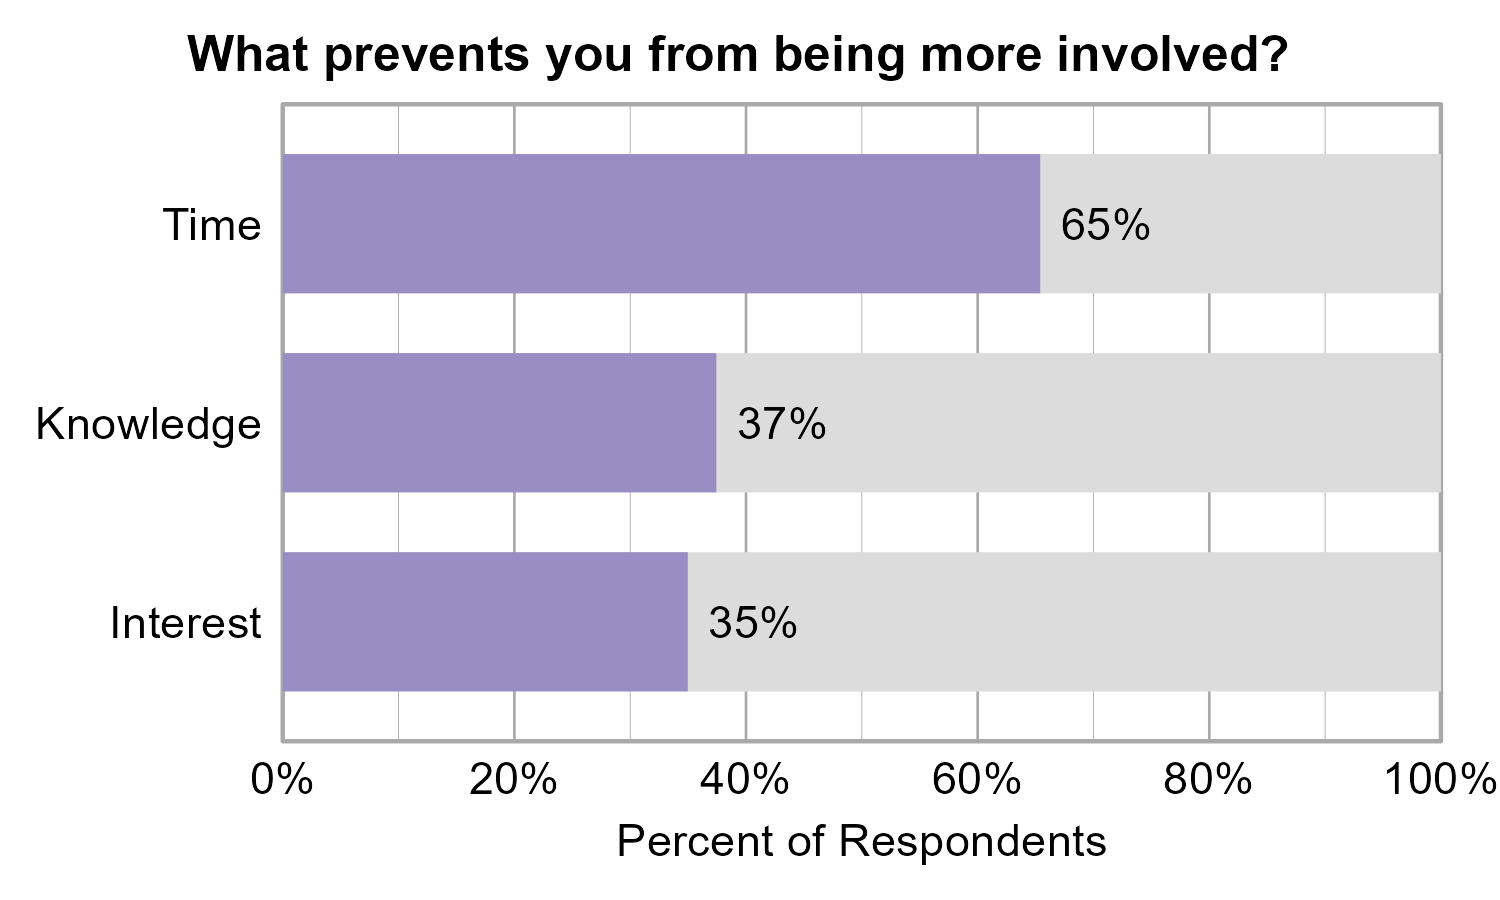
Involvement in West Jordan
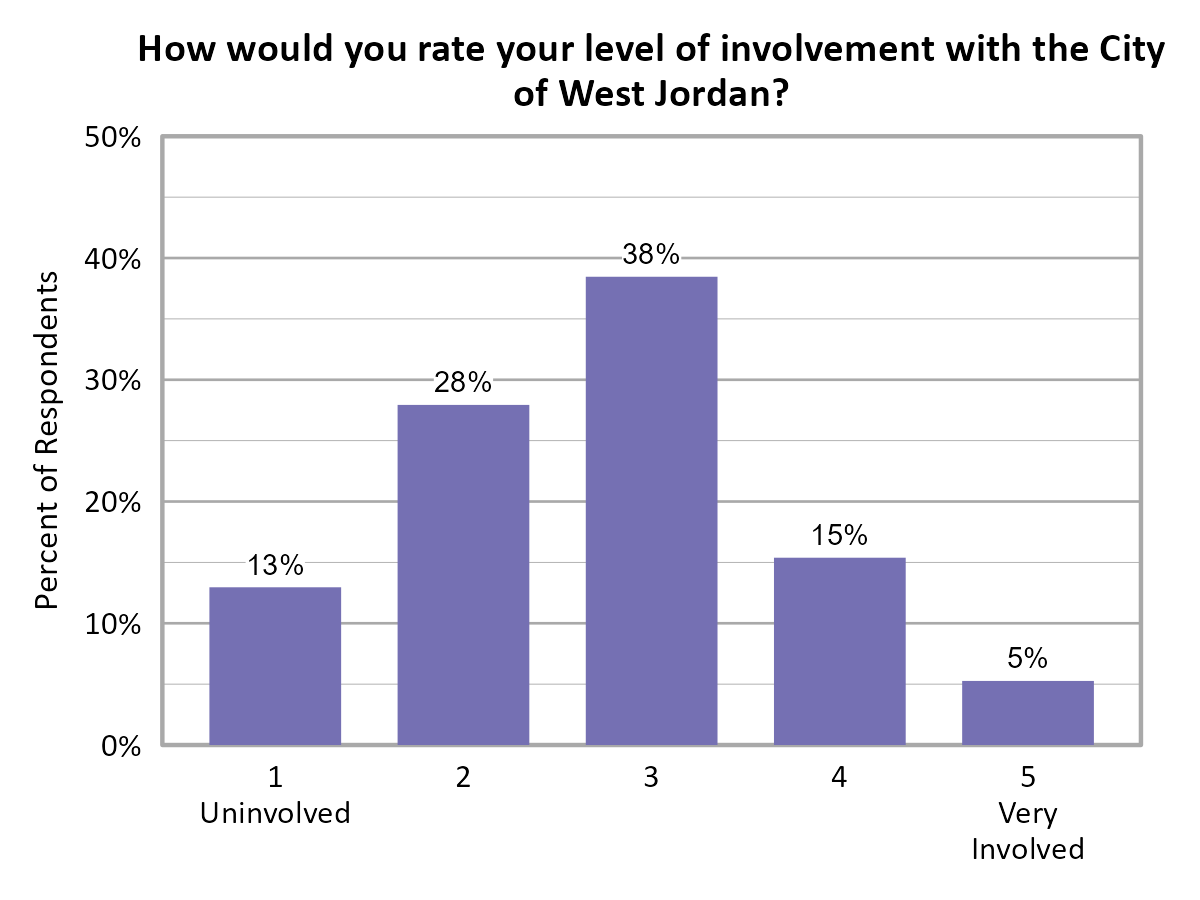
Respondents were asked to rate their level of involvement with the City of West Jordan on a scale of 1 (Uninvolved) to 5 (Very Involved). The largest proportion of residents indicated a 3 (38%). When asked what prevented them from being more involved, the majority of respondents indicated Time (65%).
Open Comments
All open comments collected in the survey were shared with city leaders. General observations and themes are shared here.
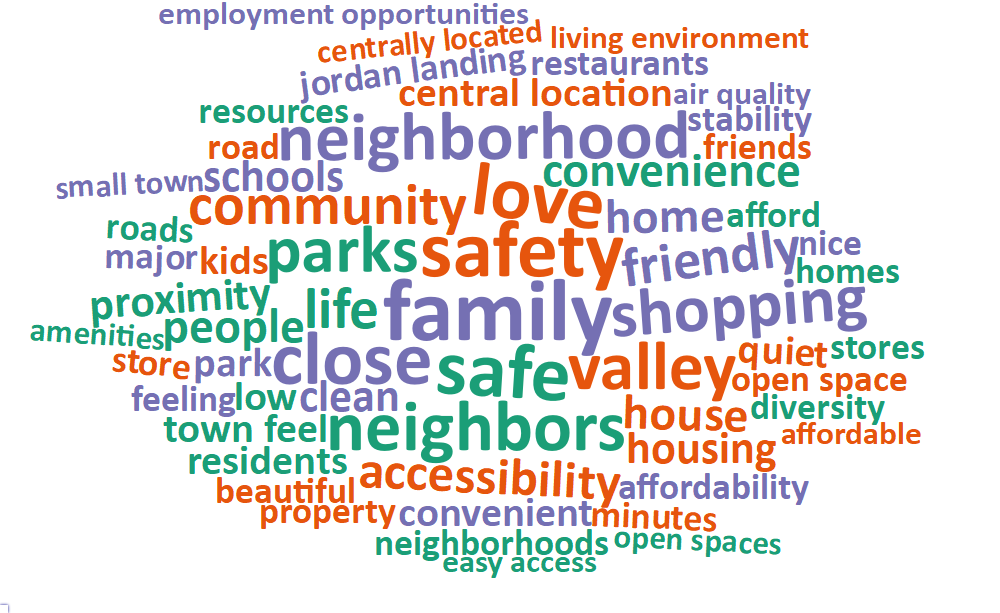
What Respondents Value Most in West Jordan
Survey respondents were asked to comment on what they value most about West Jordan. The most common words and phrases from all city comments are included in the word cloud below. It is possible that negative or unrelated words may appear since these words have been taken out of context, and they may not indicate the respondent’s intended meaning. Respondents highly value the social climate in West Jordan, particularly family, neighborhood, and/or community values. Many expressed that they value the location, saying it is easy to get to everything they need to and that it is central to Salt Lake Valley without feeling like a city. Several mentioned they value the safety, peace, and quiet of West Jordan, as well as the open space and small town/suburban feel.
Local Environmental Quality in West Jordan
The 64% of respondents who rated the Local Environmental Quality domain as 1, 2, or 3 (Poor, Fair, or Moderate) were further asked if there are specific aspects of local environmental quality that they feel are problematic. Comments regarding local environmental quality mentioned that traffic contributes to air and noise pollution and congestion is a major concern for residents. Car exhaust, inversions, and the Great Salt Lake were also mentioned. Respondents mentioned that green spaces are lacking, dirty, and unkept. Growth was said to diminish the amount of green space and raises concern for water usage in the area.
Improving Wellbeing in West Jordan
Survey respondents were asked if there is anything that could be done to improve wellbeing in West Jordan. Many respondents mentioned transportation issues, with concerns about traffic, construction, public transportation and walkability/bike-ability. Transportation safety was a concern, particularly related to speeding and running red lights. Several raised concerns about growth, asking for slower and more intentional growth, with several related comments about zoning issues and choices by city government. Environmental concerns were also mentioned, often related to appearance and upkeep, trash cleanup, air quality, and noise pollution.
Additional Comments
Respondents were also asked if they had any additional comments on wellbeing in West Jordan. Most additional comments on wellbeing in West Jordan addressed government, with some compliments to the government’s ability to listen to and respond to citizens, and some negative comments about government regarding diversity, city upkeep, code enforcement, etc. A few comments addressed traffic concerns and called for better public transit.