Emissions Estimates for Various Oil and Gas Facility Types
We are completing final testing and deploy a drone-based system designed to measure methane emissions in the region. These measurements will help improve understanding of where and how methane is being released. At the same time, we will continue analyzing existing datasets and work with industry and regulatory partners to obtain additional data that can improve emissions estimates. We will also develop new methods that use satellite and other remote sensing data—such as information available through Google Earth Engine—to estimate emissions across different areas and scales. These approaches will help provide a more complete picture of methane emissions across the basin.
Seth Lyman, Colleen Jones, Arjun Kulathuvayal, Trevor O'Neil; In partnership with Shalyn Drake at USU-Eastern, and Gus Williams at Brigham Young University
Project End: Not Established
Funding: Utah Legislature, SSD1, IEEE

Project Updates
Updated March 2026
- Major Findings:
- None to report yet.
- None to report yet.
- Current and Upcoming Work:
-
- Drone Work
- Drone Work
- We are currently testing methods for collecting methane measurements using drones and developing techniques to estimate emissions from those data. As part of this work, we are also designing controlled release experiments that allow us to test and validate the accuracy of our measurement and analysis methods under known conditions.
- In mid-spring, we plan to deploy drones for the first time to collect methane measurements at oil and gas well sites. These flights will help test the drone-based system under real-world conditions and provide new data to improve estimates of methane emissions in the region.
- By summer or fall, we expect to begin collecting methane measurement data on a routine basis using the drone system. Establishing regular data collection will allow us to build a more consistent dataset and improve our understanding of methane emissions over time.
- Other Remote Sensing Data:
- Other Remote Sensing Data:
- We have developed methods to track methane emission trends across the Uinta Basin over time at an approximate spatial resolution of 5 kilometers. We are continuing to refine these methods to improve their accuracy and reliability. In addition, we plan to develop an online tool that will allow researchers, stakeholders, and the public to access and explore these data more easily. As part of this work, we will also examine long-term trends in other important air pollutants, including nitrogen oxides (NOx) and formaldehyde.
- Our overall goal is to examine how trends in pollutants detected by satellite and other remote sensing methods relate to changes in oil and gas development across different parts of the Uinta Basin. Understanding these relationships will help provide a clearer picture of how industrial activity and emissions patterns have changed over time in the region.
-
- Problems:
- None to report.
More Information
Improve Emissions Estimates
Our team has carried out work to better characterize several Uinta Basin emission source types, including emissions from well pads (Lyman et al., 2019b; Wilson et al., 2020), liquid storage tanks (Lyman and Tran, 2015; Lyman et al., 2019b; Wilson et al., 2020), produced water ponds (Lyman et al., 2018; Mansfield et al., 2018; Tran et al., 2017), subsurface leaks (Lyman et al., 2020b; Lyman et al., 2017), and pumpjack engines (Lyman et al., 2022c). We have measured emissions of NOX, methane, non-methane hydrocarbons, alcohols, carbonyls, and other gases from emission sources. Many oil and gas-related emission sources remain poorly characterized, however. According to surveys we conducted, many stakeholders feel that additional emissions measurements are needed (see Section 17.2 in our 2020 Annual Report and Section 15.2 in our 2021 Annual Report). Also, we have talked with many stakeholders over that past few months who are concerned that new measurements of oil and gas infrastructure are needed to answer questions such as these:
- How do emissions from older, low-producing wells compare to those of newer, high-producing wells?
- How have new technologies, such as no-bleed pneumatics, combustors on tanks, systems to allow for unloading tanks without venting, etc., changed emissions profiles of oil and gas wells?
- How do emissions from oil and gas wells differ?
We will work to answer these and other questions with a combination of new measurements and analysis of existing datasets. Some aspects of the planned work are outlined below. The details of these plans will be determined in concert with our stakeholder guidance committee, and we will execute the project with input from the committee.
Drone-based Emission Measurements
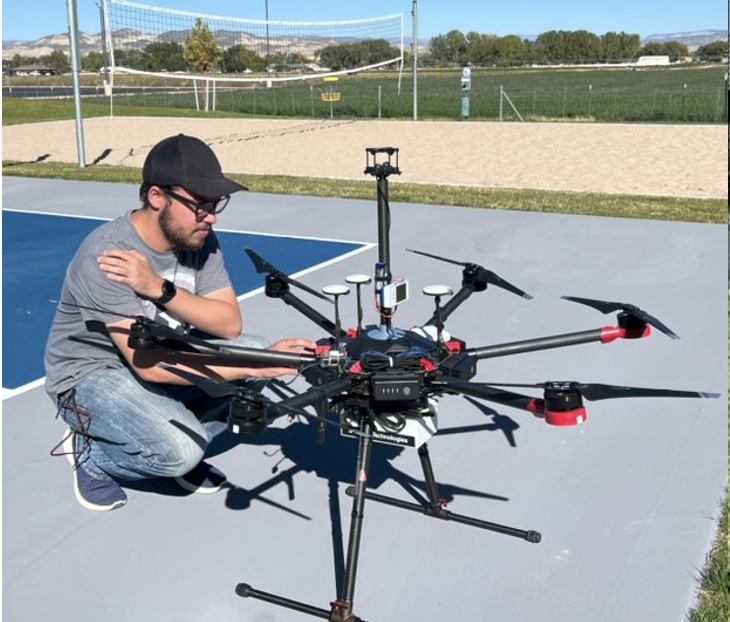
The methods we used to measure emissions in the past are component-specific, labor-intensive, and require site access. They are accurate and specific, but the time and coordination required to carry them out limits the number of samples that we can collect. Also, the methods we used in the past can’t be used efficiently for characterization of pipeline emissions. New drone-based methods have shown great promise for measuring emissions from a variety of sources. Drones equipped with new lightweight sensors for methane, ethane, and meteorological conditions can rapidly determine emission rates by mapping the net transport of methane and ethane away from a source relative to background values.
We have outfitted a drone with chemical and meteorological sensors following the methods of Gålfalk et al. (2021) and will use their method for calculating emission rates (also see mass balance methods in Hollenbeck et al. (2021)). Drone-based emissions measurement systems have mostly been used for methane and ethane, but we also need to measure emissions of speciated non-methane organics, NOX, and sometimes CO and CO2. We can measure NOX, CO, and CO2 using a drone with lightweight electrochemical sensors, but speciated non-methane organics must be collected in large sample containers that are analyzed in our laboratory. We will collect these samples from a sampling tube with an inlet at the drone’s height. We will first characterize the emission source with on-board sensors. Then, we will use the drone’s real-time data stream to determine the downstream location(s) where methane and ethane emissions are elevated, and we will lift a sample inlet tube to that location. We will flush the inlet tube with air and then collect samples from the tube while the drone collects data at the same location(s). We will analyze the samples in our laboratory. We will follow the method of Gålfalk et al. to calculate emissions of pollutants measured by the drone in real-time, and we will calculate emissions of individual organics from the ratio of those organics to methane and ethane.
Our drone can collect the real-time methane and wind condition data needed to measure emissions. We are working on the off-line code needed to convert measurements into emissions estimates. Next, we will use a calibration system to verify that emissions determined using the drone are accurate. The calibration system will consist of certified source gases (we already have source gases for methane, a suite of non-methane organics, NOX, and CO), a mass flow controller to regulate the emission rate, and tubing from which the gases will be released. UB Tech, the technical college next to the USU Vernal Campus, has non-functional oil and gas equipment on its grounds for training purposes. We have permission from UB Tech to release calibration gas from different points on these pieces of equipment to simulate actual emissions from real oil and gas equipment.
We anticipate the following tasks for 2026:
- Calibration and Validation: Finalize testing using certified calibration gases (methane, non-methane organics, NOx, and CO) and a mass flow controller to simulate controlled emission rates. UB Tech’s non-functional oil and gas equipment will be used to conduct calibration trials and assess system accuracy across multiple emission points.
- Software and Real-Time Processing: Complete programming of a data processing system capable of integrating GPS, meteorological, and chemical data to calculate emission fluxes using the mass balance method outlined by Gålfalk et al. (2021).
- Field Deployments: Establish collaborations with regional energy companies to conduct on-site methane emission measurements from active oil and gas facilities.
- Visualization and Reporting: Finalize the 3D visualization and post-flight analysis tools to support data interpretation and reporting for regulatory and research use.
The project remains on track to complete system validation and begin operational field measurements within the next year. Once fully implemented, this drone-based methane monitoring system will provide an efficient, scalable, and cost-effective approach to emissions detection—advancing both scientific research and practical environmental management.
Analysis of Existing Emissions Data
New aircraft and satellite-based techniques are available to map specific methane emission sources across the Uinta Basin. Emissions speciation data can be used to calculate non-methane organics emissions from those data. We obtained aircraft survey data from two Uinta Basin companies, and we are analyzing those data to determine the source types and areas that are most likely to have methane emissions. As this work continues, we will also use data available for specific days from Carbon Mapper, which provides publicly available, location-specific emissions data for large methane sources, and other similar public datasets. By comparing these data against the Basin-wide emissions estimates, available emissions inventory data, and oil and gas activity data, we will determine which emission source types are most important to ozone production, and how emissions are changing over time. We will also solicit additional data from the Utah Division of Air Quality and oil and gas companies to add to our understanding of emissions across the Uinta Basin, including leak detection and repair reports and activity and equipment-level data.
We will work to make the data and our analyses public, but only in a generalized and anonymized way, to protect the interests of individual oil and gas companies in the Uinta Basin.
Satellite-based Remote Sensing and Interactive Modeling of Emission Rates
Satellite-based remote sensing offers a powerful, scalable means of quantifying greenhouse gas emissions and detecting spatial patterns of atmospheric methane, carbon dioxide, and related pollutants over large geographic areas (Wilson et al., 2025). Unlike ground- or drone-based systems, satellite observations enable consistent temporal and spatial monitoring across entire energy basins, providing critical data for emissions assessment, regulatory compliance, and environmental policy development (Haske et al., 2024). Recent advances in cloud-based platforms such as Google Earth Engine have transformed the way scientists process and analyze large-scale geospatial data. Google Earth Engine integrates global satellite archives with advanced computing power and coding tools, enabling automated workflows for image processing, classification, and trend analysis. These capabilities allow researchers to visualize emission sources, quantify changes through time, and correlate emissions with industrial activity, meteorological patterns, and land use characteristics.
This project builds upon the Bingham Research Center’s drone-based monitoring program by extending its spatial and temporal reach through satellite-based analysis. Conducted in collaboration with Dr. Gus Williams of Brigham Young University’s Civil and Environmental Engineering Department, the project integrates engineering modeling with satellite data analytics to advance emission quantification and visualization. Specifically, it aims to develop an interactive, web-based modeling tool that integrates satellite data, emission rate estimation algorithms, and meteorological data. The tool will be built using Google Earth Engine, Python, and web-based dashboards to support stakeholders, researchers, and policy makers in tracking emissions and evaluating mitigation strategies.
In 2026, we will use data available on Google Earth Engine for:
- Integrated Modeling: We will combine drone, ground, and satellite observations to validate emission estimates for methane, nitrogen dioxide, carbon dioxide, and ozone. Advanced dispersion algorithms developed in Google Earth Engine (GEE) and Python will improve emission mapping and temporal trend analysis.
- Interactive Dashboard: We will create and deploy a stakeholder-accessible dashboard visualizing satellite and UAS data for emission tracking, regulatory compliance, and mitigation planning.
- Partnership Expansion: We will continue collaboration with Dr. Gus Williams (BYU Civil Engineering) to integrate engineering-based atmospheric dispersion models with remote sensing data, enhancing emission accuracy and student research opportunities.
- IEEE Methane Standard Development: We will conduct field tests at the USU Bingham Research Center to evaluate GETBag® calibration targets for quantitative methane measurement. These tests—conducted with the IEEE GRSS Methane Working Group (USU, BYU, and Condor Calibration Services)—will provide foundational data toward establishing an IEEE Standard for airborne and spaceborne methane sensor calibration.
Our work on this project will deliver an integrated satellite–drone emission monitoring framework, support IEEE standardization for methane quantification, and provide hands-on training for USU and BYU students in advanced remote sensing and atmospheric monitoring.