
Numerical Simulations of the Uinta Basin
A recent project looks at the meteorology, rather than the chemistry, of poorly simulated high-ozone cases like January 2013. The goal is to create a more faithful depiction of the atmosphere around the Basin - especially the creation of persistent cold-air pools (inversion)- to hand off for air-chemistry simulations.
John Lawson and Michael Daviese
Project Ongoing
Funding: Utah Legislature, Uintah Co., SSD1
Project Updates
Updated: July 2026
- Recent Developments:
- A submitted paper to MDPI Air shows out simulations of cold air pooiing in the basin is highly sensitive to the US-scale ot global data that kicks off the simulation.
- The errors between these initial datasets can be as large as the error correction from field experiments with tethersondes (weather balloons on a wire).
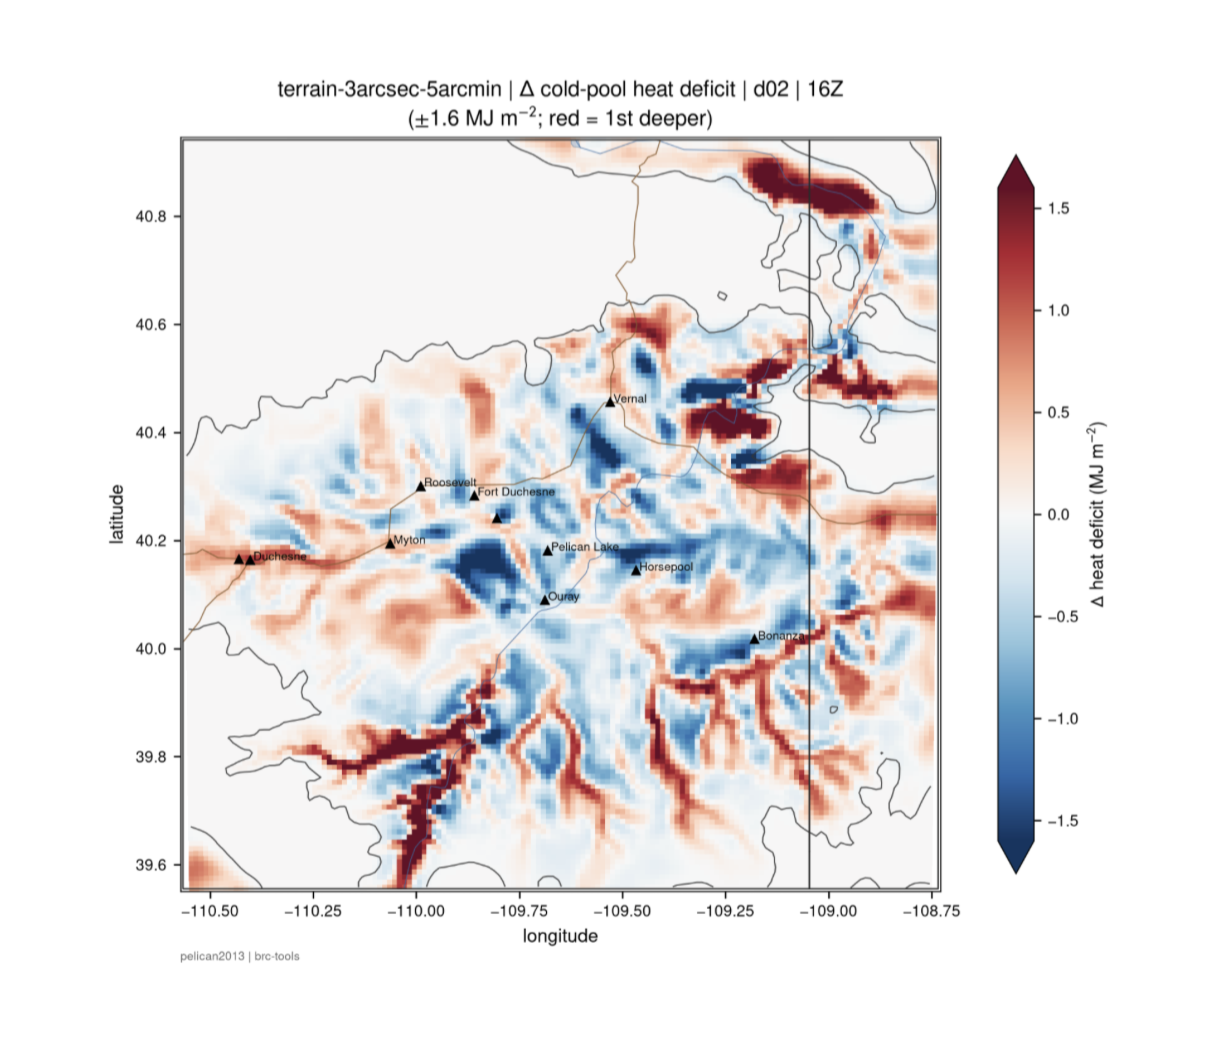
- We found smoother terrain and valley makes for colder temperatures, but the volume of cold air is smaller than when we use high-detail terrain. When the model can "see" more fine details, valleys can become "reservoirs" for cold air. This drains more slowly into the Basin with more bumps and valleys obstructing the sinking cold air. This may make the inversion appear less severe as surface temperature at the Basin's weather stations, but potentially the cold air fills a larger volume.
- Current and upcoming work:
- How better can we do simulations with 2026 datasets? This includes the US-wide initial weather datasets, different ways of configuring the weather model, and how to trade off between uncertainty (running many slightly different models to see what might happen) and resolution (seeing more of the fine-scale flow around mountain canyons).
- Linking this work to air chemistry: can we create a better initial state of key ozone events than what exists already?
- Image:
- We ran two simulations that created a cold pool: one with coarse, smooth terrain (mountains, valleys), and another that was detailed. We subtraccted the differences in cold-pool strength. The image shows wher the biggest differences occurred in a stronger cold pool by increasing detail of the mountainous terrain: red means the cold pool is stronger for the high-resolution detail (blue is stronger cold pool for smoother terrain). We see around sunrise here that cold air has pooled faster when terrain is smooth (blue colours at the Basin floor) but there are "Reservoirs" of cold air that appear deep red in the (more detailed) canyons and valleys.