INLAND PORT AREA WITH HIGHER HEAT INTENSITY | AARON FORTIN
TAKEAWAY
Data from a Heat Watch campaign in July 2023 shows extreme heat can impact the west side of Salt Lake City more than the east side.
The west side of Salt Lake City has less tree coverage, more unshaded concrete and asphalt that concentrate heat, and fewer resources to mitigate extreme heat.
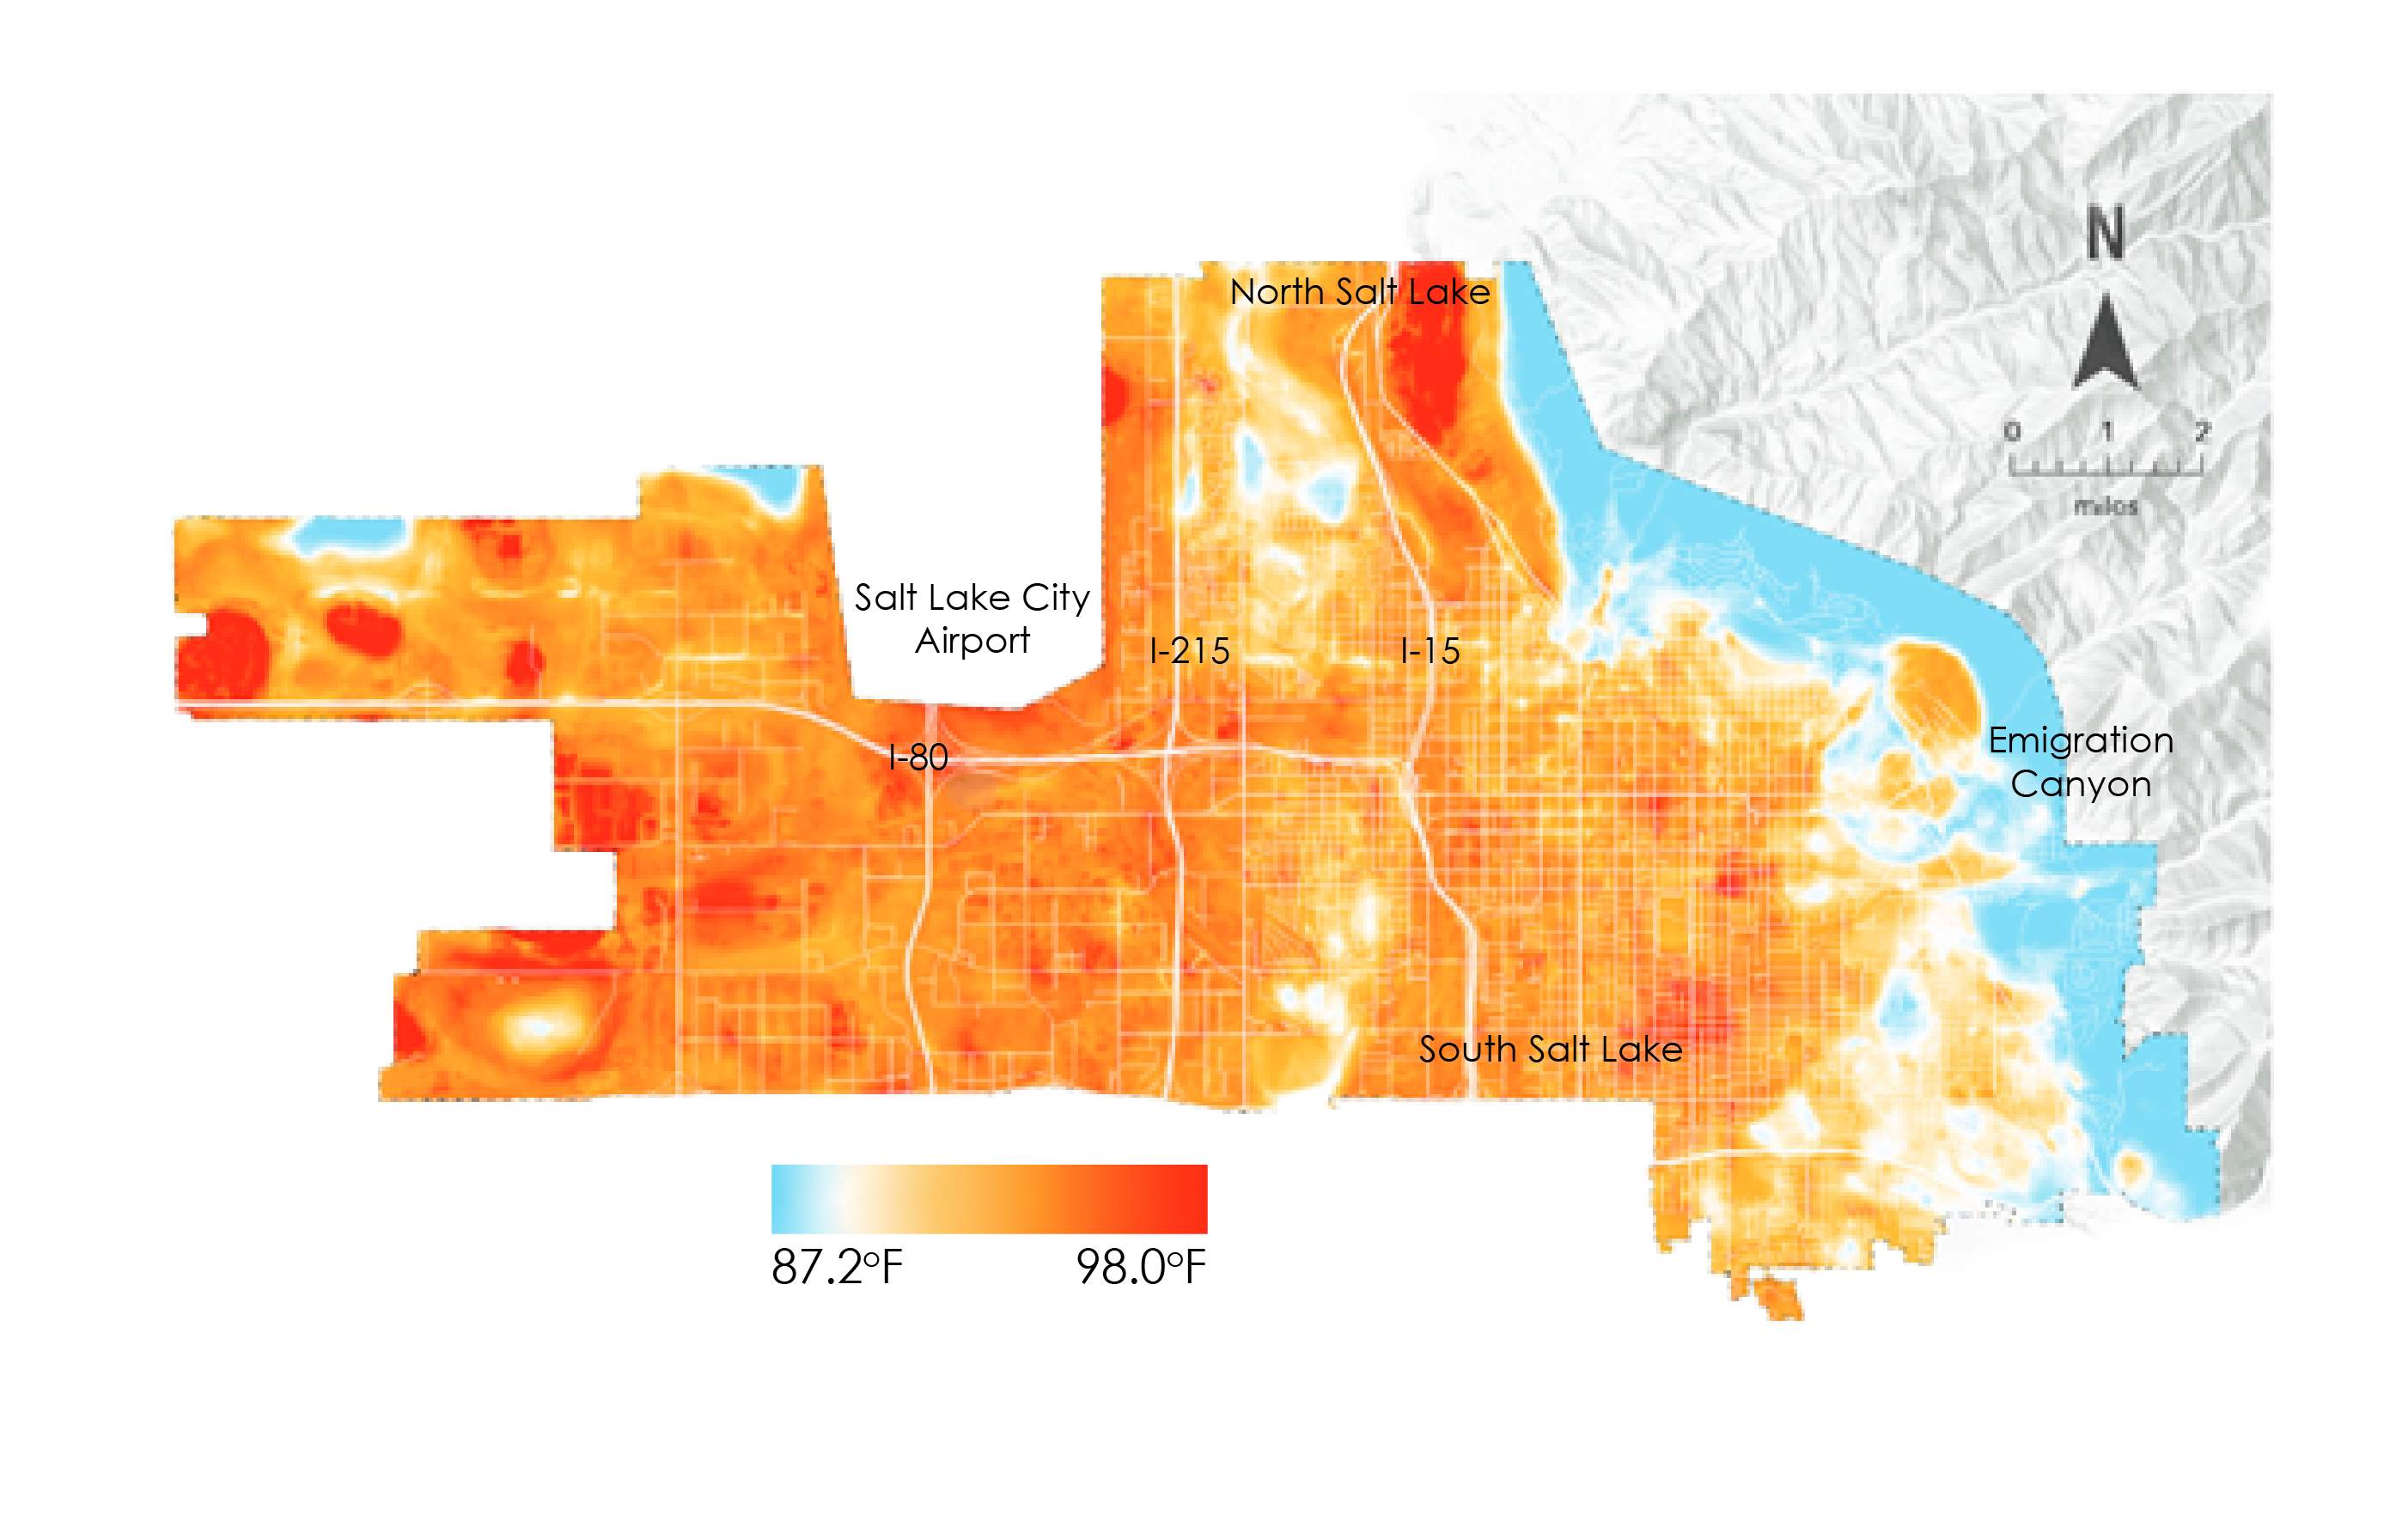
Extreme heat is one of the deadliest natural disasters, and its impacts are not evenly distributed across places and communities. People living in underserved communities are typically hit the hardest by the effects of extreme heat. Historically, data on extreme heat events has lacked sufficiently detailed geographic coverage. With support from the National Oceanic and Atmospheric Administration’s National Integrated Heat Health Information System, a team led by Utah State University scientists accomplished a Heat Watch campaign in Salt Lake City in July 2023. The detailed heat mapping results—based on 58,707 temperature measurements over an area of 72.6 square miles—show that the west side of Salt Lake City suffers more extreme heat than the east side (Figure 3.D.1). Among the reasons for this difference are that the west side of the city has less tree coverage, more unshaded concrete and asphalt that concentrate heat, and fewer resources to mitigate extreme heat. This campaign lays the groundwork for future adaptation efforts amidst escalating extreme heat risks. By employing community engagement and sensor innovations, a high-resolution heat description has been developed for the region, fostering local partnerships to address the inequitable risks associated with extreme heat.
Utah State University’s co-leadership in the Center for Collaborative Heat Monitoring, funded by the National Oceanic and Atmospheric Administration, empowers communities through science-based observations and data collection on local heat impacts. Utah’s proactive stance exemplifies its crucial role in tackling nationwide extreme heat challenges.
Figure 3.D.1 Heat mapping results for Salt Lake City for 3-4 pm in summer 2023
References
- CAPA Strategies and NOAA NIHHIS. (2023, August 7). Heat Watch Salt Lake City. Open Science Framework. Retrieved June 2023. https://osf.io/vhkga