Historic Wildfires
L.4.1 Historic burn areas
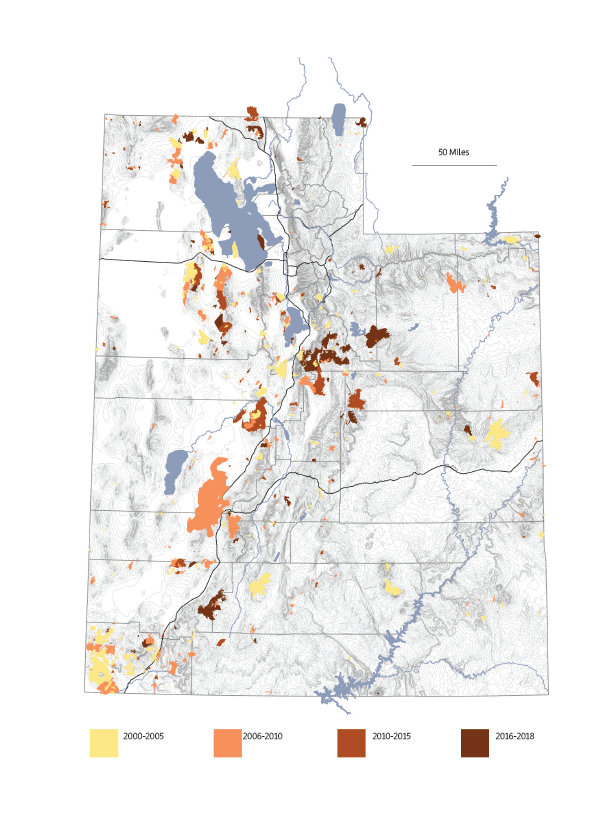
This map highlights data from the Monitoring Trends in Burn Severity interagency project. These datasets capture footprints of historic burn areas and keep point data of present and historic fires. Highlighted here are historic burn areas colorized by year.
Wildfire Response History
This dataset from the Geospatial Multi-Agency Coordination Group (GEOMAC) contains historic wildfire perimeter and area information. Including comprehensive geospatial information on wildfire incidents across Utah, this dataset contains key attributes such as the location, size, and extent of each fire. Using a spatial join, wildfires from this dataset are assigned to the county containing a majority of the burn area. Fire size and responding agencies are included below; data is summed by county.
L.4.2 Statewide wildfire history
| Year | Acres Burned | Bureau of Land Management |
United States Forest Service |
Division of Forestry, Fire, and State Lands |
Other State Agency |
|---|---|---|---|---|---|
| 2000 | 195,036 | 32 | 0 | 0 | 59 |
| 2001 | 88,489 | 0 | 0 | 0 | 65 |
| 2002 | 240,786 | 0 | 0 | 0 | 59 |
| 2003 | 102,505 | 51 | 12 | 0 | 1 |
| 2004 | 92,393 | 57 | 5 | 0 | 1 |
| 2005 | 226,754 | 91 | 11 | 0 | 14 |
| 2006 | 325,413 | 160 | 8 | 0 | 19 |
| 2007 | 593,052 | 91 | 5 | 0 | 19 |
| 2008 | 17,700 | 42 | 4 | 0 | 5 |
| 2009 | 102,664 | 37 | 12 | 0 | |
| 2010 | 58,853 | 21 | 11 | 0 | 3 |
| 2011 | 48,866 | 65 | 7 | 0 | 2 |
| 2012 | 414,910 | 90 | 10 | 0 | 20 |
| 2013 | 78,518 | 14 | 11 | 0 | 4 |
| 2014 | 15,618 | 8 | 8 | 0 | 1 |
| 2015 | 5,542 | 9 | 5 | 0 | 6 |
| 2016 | 90,216 | 14 | 29 | 9 | 1 |
| 2017 | 184,091 | 26 | 9 | 13 | 1 |
| 2018 | 343,588 | 36 | 17 | 18 | 8 |
References
- MTBS. (2024). Direct Download. [Data set] MTBS.gov. https://www.mtbs.gov/direct-download