National and State Park Visitation
The National Park Service tracks visitor numbers for national parks, while the Utah Department of Natural Resources monitors visitation at state parks. These datasets provide annual visitor statistics, spanning from the start of reporting for each selected park up to the most recent calendar year. Each park also has an issued set of counting procedures to record the number of visitors in the park. These methods can range from traffic counters, door counters, or are done manually.
L.5.1 National park visitation
| Year | Arches | Bryce Canyon | Canyonlands | Capitol Reef | Zion |
|---|---|---|---|---|---|
| 2003 | 757,781 | 903,760 | 386,986 | 535,441 | 2,458,792 |
| 2004 | 733,131 | 987,253 | 371,706 | 549,708 | 2,677,342 |
| 2005 | 781,670 | 1,017,681 | 393,381 | 550,255 | 2,586,665 |
| 2006 | 833,049 | 890,676 | 392,537 | 511,511 | 2,567,350 |
| 2007 | 860,181 | 1,012,563 | 417,560 | 554,907 | 2,657,281 |
| 2008 | 928,795 | 1,043,321 | 436,715 | 604,811 | 2,690,154 |
| 2009 | 996,312 | 1,216,377 | 436,241 | 617,208 | 2,735,402 |
| 2010 | 1,014,405 | 1,285,492 | 435,908 | 662,661 | 2,665,972 |
| 2011 | 1,040,758 | 1,296,000 | 473,773 | 668,834 | 2,825,505 |
| 2012 | 1,070,577 | 1,385,352 | 452,952 | 673,345 | 2,973,607 |
| 2013 | 1,082,866 | 1,311,875 | 462,242 | 663,670 | 2,807,387 |
| 2014 | 1,284,767 | 1,435,741 | 542,431 | 786,514 | 3,189,696 |
| 2015 | 1,399,247 | 1,745,804 | 634,607 | 941,029 | 3,648,846 |
| 2016 | 1,585,718 | 2,365,110 | 776,218 | 1,064,904 | 4,295,127 |
| 2017 | 1,539,028 | 2,571,684 | 742,271 | 1,150,165 | 4,504,812 |
| 2018 | 1,663,557 | 2,679,478 | 739,449 | 1,227,627 | 4,320,033 |
| 2019 | 1,659,702 | 2,594,904 | 733,996 | 1,226,519 | 4,488,268 |
| 2020 | 1,238,083 | 1,464,655 | 493,914 | 981,038 | 3,591,254 |
| 2021 | 1,806,865 | 2,104,600 | 911,594 | 1,405,353 | 5,039,835 |
| 2022 | 1,460,652 | 2,354,660 | 779,147 | 1,227,608 | 4,692,417 |
| 2023 | 1,482,045 | 2,461,269 | 800,322 | 1,268,861 | 4,623,238 |
L.5.2 State park visitation
| Year | Anasazi Indian Village State Park |
Antelope Island State Park |
Bear Lake State Park |
Camp Floyd - Stage Coach Inn State Park |
Coral Pink Sand Dunes State Park |
|---|---|---|---|---|---|
| 2003 | 33,145 | 268,732 | 32,230 | 12,348 | 128,675 |
| 2004 | 34,076 | 255,155 | 45,228 | 12,293 | 122,832 |
| 2005 | 32,959 | 272,381 | 105,849 | 15,422 | 65,270 |
| 2006 | 27,614 | 250,886 | 232,825 | 15,850 | 66,468 |
| 2007 | 26,958 | 281,266 | 225,985 | 15,018 | 69,509 |
| 2008 | 24,309 | 256,901 | 198,141 | 16,331 | 62,741 |
| 2009 | 24,883 | 273,510 | 175,049 | 16,213 | 58,943 |
| 2010 | 21,850 | 285,390 | 229,669 | 16,656 | 56,939 |
| 2011 | 20,605 | 282,145 | 242,749 | 16,703 | 52,676 |
| 2012 | 20,119 | 292,662 | 234,095 | 16,609 | 58,734 |
| 2013 | 19,166 | 307,239 | 185,113 | 13,527 | 64,430 |
| 2014 | 19,836 | 328,139 | 213,346 | 13,472 | 73,156 |
| 2015 | 19,253 | 394,748 | 245,780 | 15,446 | 78,737 |
| 2016 | 21,221 | 409,246 | 281,717 | 13,657 | 92,010 |
| 2017 | 18,771 | 475,371 | 321,277 | 14,360 | 130,016 |
| 2018 | 19,751 | 499,469 | 364,199 | 13,774 | 117,922 |
| 2019 | 19,477 | 528,865 | 458,344 | 16,933 | 128,558 |
| 2020 | 14,236 | 815,445 | 638,798 | 6,278 | 177,655 |
| 2021 | 21,640 | 1,074,569 | 603,297 | 8,605 | 252,623 |
| 2022 | 17,301 | 885,078 | 539,173 | 18,303 | 229,527 |
| 2023 | 19,949 | 936,147 | 569,905 | 12,238 | 229,005 |
L.5.3 State park visitation continued
| Year | Dead Horse Point State Park |
Deer Creek State Park |
East Canyon State Park |
Echo State Park | Edge Of The Cedars State Park |
|---|---|---|---|---|---|
| 2003 | 161,774 | 176,975 | 71,101 | - | 19,309 |
| 2004 | 145,800 | 202,740 | 56,641 | - | 41,315 |
| 2005 | 137,265 | 209,149 | 55,904 | - | 10,446 |
| 2006 | 169,206 | 355,003 | 95,543 | - | 17,420 |
| 2007 | 172,176 | 326,038 | 98,010 | - | 17,555 |
| 2008 | 184,560 | 260,299 | 79,731 | - | 13,516 |
| 2009 | 179,157 | 295,993 | 99,663 | - | 11,981 |
| 2010 | 169,595 | 359,365 | 83,967 | - | 12,416 |
| 2011 | 182,419 | 305,748 | 100,250 | - | 14,286 |
| 2012 | 200,620 | 360,565 | 82,731 | - | 10,881 |
| 2013 | 266,263 | 225,873 | 64,410 | - | 9,656 |
| 2014 | 351,743 | 218,886 | 95,166 | - | 8,950 |
| 2015 | 398,094 | 255,946 | 92,571 | - | 10,858 |
| 2016 | 416,180 | 334,357 | 92,120 | - | 10,121 |
| 2017 | 704,841 | 400,383 | 120,307 | 5,777 | 12,489 |
| 2018 | 880,678 | 422,119 | 142,452 | 6,451 | 12,212 |
| 2019 | 978,380 | 433,855 | 159,881 | 55,488 | 12,735 |
| 2020 | 792,099 | 707,836 | 252,273 | 77,726 | 5,196 |
| 2021 | 1,265,223 | 688,619 | 190,084 | 44,512 | 12,402 |
| 2022 | 1,069,571 | 587,052 | 205,561 | 25,255 | 13,776 |
| 2023 | 1,080,536 | 702,506 | 232,674 | 133,437 | 13,616 |
L.5.4 State park visitation continued
| Year | Escalante Petrified Forest State Park |
Fremont Indian State Park |
Goblin Valley State Park |
Goosenecks State Park |
Great Salt Lake Marina State Park |
|---|---|---|---|---|---|
| 2003 | 36,105 | 71,465 | 67,913 | 57,098 | 139,254 |
| 2004 | 82,584 | 58,190 | 46,065 | 87,170 | 38,196 |
| 2005 | 37,455 | 66,235 | 56,597 | 58,910 | 57,966 |
| 2006 | 40,451 | 64,116 | 30,081 | 40,761 | 138,763 |
| 2007 | 39,554 | 72,184 | 39,529 | 50,340 | 250,478 |
| 2008 | 42,978 | 74,919 | 63,343 | 58,096 | 214,127 |
| 2009 | 39,599 | 82,486 | 52,771 | 66,722 | 213,289 |
| 2010 | 40,229 | 78,055 | 46,270 | 65,545 | 249,085 |
| 2011 | 57,934 | 101,993 | 61,435 | 63,778 | 254,317 |
| 2012 | 51,774 | 113,892 | 80,628 | 69,670 | 272,842 |
| 2013 | 53,315 | 70,960 | 94,222 | 28,891 | 136,530 |
| 2014 | 46,521 | 13,092 | 108,914 | - | 177,380 |
| 2015 | 48,678 | 16,621 | 158,404 | 45,351 | 423,012 |
| 2016 | 53,512 | 19,488 | 220,738 | 61,941 | 110,845 |
| 2017 | 61,477 | 25,000 | 251,004 | 66,523 | 112,154 |
| 2018 | 63,471 | 25,037 | 279,555 | 63,445 | 77,390 |
| 2019 | 66,730 | 32,490 | 305,325 | 66,313 | 94,687 |
| 2020 | 57,669 | 45,317 | 309,039 | 25,256 | 118,119 |
| 2021 | 86,049 | 52,423 | 453,937 | 49,385 | 149,194 |
| 2022 | 73,969 | 48,540 | 408,343 | 55,660 | 136,170 |
| 2023 | 90,821 | 51,605 | 398,962 | 56,367 | 169,377 |
L.5.5 State park visitation continued
| Year | Green River State Park | Gunlock State Park | Huntington State Park | Hyrum State Park | Frontier State Park |
|---|---|---|---|---|---|
| 2003 | 83,951 | 82,665 | 41,270 | 74,411 | 16,549 |
| 2004 | - | 37,835 | 61,947 | 17,139 | 166,457 |
| 2005 | 20,937 | - | 54,833 | 62,712 | 13,176 |
| 2006 | 22,857 | 60,891 | 47,848 | 67,980 | 18,498 |
| 2007 | 20,217 | 45,222 | 19,043 | 82,480 | 15,853 |
| 2008 | 21,142 | 51,915 | 37,197 | 70,705 | 16,904 |
| 2009 | 25,190 | 41,225 | 59,459 | 62,961 | 16,881 |
| 2010 | 23,282 | 60,189 | 60,035 | 131,973 | 16,272 |
| 2011 | 23,571 | 55,912 | 67,418 | 89,885 | 17,617 |
| 2012 | 23,740 | 55,574 | 71,757 | 124,958 | 20,127 |
| 2013 | 35,482 | 36,474 | 38,048 | 83,526 | 12,826 |
| 2014 | 47,326 | 13,684 | 32,276 | 50,827 | 18,546 |
| 2015 | 52,189 | 14,621 | 29,660 | 73,225 | 8,435 |
| 2016 | 56,988 | 14,142 | 31,435 | 76,239 | 10,126 |
| 2017 | 68,039 | 24,022 | 35,911 | 90,280 | 11,778 |
| 2018 | 74,498 | 40,126 | 38,157 | 89,305 | 12,302 |
| 2019 | 82,335 | 71,052 | 36,803 | 109,971 | 12,385 |
| 2020 | 84,413 | 114,923 | 63,789 | 146,846 | 8,277 |
| 2021 | 120,653 | 73,335 | 55,579 | 139,555 | 14,669 |
| 2022 | 106,154 | 61,021 | 43,233 | 146,212 | 15,039 |
| 2023 | 90,002 | 269,603 | 42,124 | 152,788 | 15,287 |
L.5.6 State park visitation continued
| Year | Jordanelle State Park | Jordan River OHV State Park | Kodachrome Basin State Park | Lost Creek State Park | Millsite State Park |
|---|---|---|---|---|---|
| 2003 | 112,169 | - | 57,689 | - | 17,130 |
| 2004 | 59,463 | - | 21,856 | - | - |
| 2005 | 182,895 | - | 49,700 | - | 28,044 |
| 2006 | 198,592 | - | 49,804 | - | 20,353 |
| 2007 | 310,348 | - | 52,523 | - | 34,923 |
| 2008 | 296,781 | - | 52,712 | - | 32,383 |
| 2009 | 290,326 | 17,477 | 50,939 | - | 34,266 |
| 2010 | 265,208 | 15,364 | 52,654 | - | 34,782 |
| 2011 | 257,675 | 11,921 | 49,806 | - | 40,487 |
| 2012 | 323,689 | 18,347 | 48,407 | - | 40,959 |
| 2013 | 261,528 | 13,968 | 66,858 | - | 20,615 |
| 2014 | 275,225 | 91,710 | 73,002 | - | 19,960 |
| 2015 | 380,995 | 10,015 | 102,840 | - | 13,030 |
| 2016 | 485,292 | 13,046 | 110,517 | - | 30,902 |
| 2017 | 576,536 | 19,366 | 118,790 | - | 14,078 |
| 2018 | 624,103 | 59,796 | 130,860 | - | 11,065 |
| 2019 | 652,705 | 55,123 | 132,202 | - | 13,348 |
| 2020 | 977,252 | 69,293 | 150,144 | 10,520 | 62,708 |
| 2021 | 821,719 | 86,873 | 199,555 | 11,599 | 44,914 |
| 2022 | 712,633 | 101,398 | 160,956 | 93 | 18,558 |
| 2023 | 829,944 | 113,729 | 152,777 | 13,381 | 23,828 |
L.5.7 State park visitation continued
| Year | Otter Creek State Park | Palisade State Park | Piute State Park | Point of the Mountain Sky Park | Quail Creek State Park |
|---|---|---|---|---|---|
| 2003 | 47,346 | 125,624 | 9,647 | - | 514,718 |
| 2004 | 151,111 | 8,502 | 164,945 | - | 27,550 |
| 2005 | 43,689 | 125,017 | 21,990 | - | 165,702 |
| 2006 | 65,267 | 211,646 | 29,609 | - | 108,482 |
| 2007 | 70,973 | 233,739 | 47,918 | - | 112,534 |
| 2008 | 83,042 | 290,682 | 26,230 | - | 95,239 |
| 2009 | 72,722 | 313,501 | 29,249 | - | 97,110 |
| 2010 | 57,786 | 141,458 | 18,294 | - | 101,967 |
| 2011 | 57,942 | 167,869 | 17,531 | - | 72,366 |
| 2012 | 51,875 | 195,596 | 16,739 | - | 64,980 |
| 2013 | 36,654 | 135,271 | 7,983 | - | 58,555 |
| 2014 | 25,838 | 100,059 | 2,143 | - | 72,110 |
| 2015 | 29,903 | 110,946 | 1,636 | - | 78,854 |
| 2016 | 36,708 | 123,063 | 1,184 | - | 88,054 |
| 2017 | 37,363 | 140,950 | 1,084 | - | 107,622 |
| 2018 | 31,257 | 151,383 | 793 | - | 141,879 |
| 2019 | 38,222 | 173,421 | 1,408 | - | 169,137 |
| 2020 | 137,867 | 105,477 | 4,481 | 159,376 | 168,067 |
| 2021 | 112,705 | 96,229 | 9,167 | 186,592 | 206,807 |
| 2022 | 43,833 | 184,404 | 535 | 5,234 | 283,321 |
| 2023 | 47,820 | 257,874 | 1,322 | 3,827 | 336,676 |
L.5.8 State park visitation continued
| Year | Red Fleet State Park | Rockport State Park | Sand Hollow State Park | Scofield State Park | Snow Canyon State Park |
|---|---|---|---|---|---|
| 2003 | 33,162 | 159,570 | 135,749 | 106,942 | 277,285 |
| 2004 | 184,504 | 352,949 | 103,336 | 287,132 | 106,366 |
| 2005 | 23,959 | 172,783 | 172,179 | 78,276 | 206,606 |
| 2006 | 30,818 | 117,683 | 186,685 | 102,276 | 255,643 |
| 2007 | 38,274 | 127,832 | 203,753 | 126,895 | 385,963 |
| 2008 | 39,210 | 135,937 | 175,587 | 108,975 | 299,233 |
| 2009 | 37,222 | 137,697 | 185,141 | 79,862 | 308,126 |
| 2010 | 28,617 | 132,415 | 193,633 | 75,584 | 321,752 |
| 2011 | 31,822 | 146,314 | 183,691 | 45,160 | 344,915 |
| 2012 | 45,142 | 157,575 | 217,367 | 39,779 | 353,870 |
| 2013 | 28,647 | 105,717 | 225,849 | 36,561 | 292,332 |
| 2014 | 24,979 | 104,683 | 320,150 | 24,889 | 220,643 |
| 2015 | 28,096 | 110,458 | 386,340 | 19,789 | 261,043 |
| 2016 | 27,632 | 130,282 | 498,644 | 20,968 | 291,573 |
| 2017 | 37,032 | 146,928 | 575,184 | 22,952 | 318,294 |
| 2018 | 49,580 | 130,020 | 763,564 | 22,167 | 391,444 |
| 2019 | 56,331 | 153,244 | 864,751 | 28,249 | 509,348 |
| 2020 | 186,888 | 864,853 | 580,051 | 298,635 | 418,421 |
| 2021 | 122,726 | 759,199 | 870,299 | 532,605 | 381,620 |
| 2022 | 36,344 | 190,419 | 1,089,087 | 35,482 | 735,329 |
| 2023 | 14,008 | 206,574 | 1,415,554 | 45,497 | 954,572 |
L.5.9 State park visitation continued
| Year | Fred Hayes State Park at Starvation | Steinaker State Park | Territorial Statehouse State Park | Utah Field House of Natural History State Park | Utah Lake State Park |
|---|---|---|---|---|---|
| 2003 | 110,301 | 35,400 | 30,091 | 52,150 | 83,076 |
| 2004 | 27,612 | 38,109 | 78,133 | 166,211 | 843,772 |
| 2005 | 51,957 | 35,136 | 34,894 | 60,179 | 252,565 |
| 2006 | 54,398 | 45,615 | 46,794 | 52,027 | 265,271 |
| 2007 | 61,351 | 57,621 | 50,169 | 47,070 | 270,836 |
| 2008 | 56,294 | 70,312 | 53,493 | 42,409 | 284,740 |
| 2009 | 64,609 | 73,378 | 20,562 | 36,464 | 336,952 |
| 2010 | 61,539 | 81,517 | 8,817 | 40,356 | 278,664 |
| 2011 | 70,044 | 91,434 | 22,564 | 44,290 | 285,359 |
| 2012 | 89,697 | 43,522 | 29,079 | 44,786 | 280,422 |
| 2013 | 79,967 | 27,732 | 14,785 | 48,680 | 234,032 |
| 2014 | 83,729 | 25,024 | 5,264 | 45,206 | 150,899 |
| 2015 | 96,972 | 36,893 | 7,751 | 60,324 | 140,546 |
| 2016 | 109,588 | 40,684 | 7,776 | 54,821 | 117,029 |
| 2017 | 119,830 | 39,365 | 9,023 | 53,700 | 143,802 |
| 2018 | 116,148 | 26,577 | 5,697 | 56,448 | 89,622 |
| 2019 | 112,753 | 16,686 | 10,117 | 57,381 | 150,475 |
| 2020 | 90,482 | 24,517 | 31,307 | 155,516 | 410,395 |
| 2021 | 109,355 | 22,280 | 45,365 | 183,179 | 255,170 |
| 2022 | 139,477 | 52,933 | 6,615 | 61,657 | 215,687 |
| 2023 | 153,538 | 79,299 | 9,520 | 60,704 | 342,885 |
L.5.10 State park visitation continued
| Year | UtahRaptor State Park | Wasatch Mountain State Park | Willard Bay State Park | Yuba State Park |
|---|---|---|---|---|
| 2003 | - | 799,617 | 206,968 | 66,660 |
| 2004 | - | 138,868 | 92,149 | - |
| 2005 | - | 915,963 | 297,038 | 138,233 |
| 2006 | - | 412,283 | 325,933 | 122,964 |
| 2007 | - | 279,176 | 192,224 | 180,045 |
| 2008 | - | 298,195 | 171,589 | 180,059 |
| 2009 | - | 341,881 | 304,441 | 194,947 |
| 2010 | - | 359,871 | 340,645 | 225,213 |
| 2011 | - | 357,696 | 337,072 | 140,965 |
| 2012 | - | 256,887 | 348,534 | 237,708 |
| 2013 | - | 358,095 | 144,008 | 112,217 |
| 2014 | - | 280,030 | 227,315 | 99,237 |
| 2015 | - | 284,865 | 260,798 | 102,902 |
| 2016 | - | 340,697 | 366,251 | 100,514 |
| 2017 | - | 353,400 | 482,391 | 109,231 |
| 2018 | - | 353,727 | 503,808 | 92,830 |
| 2019 | - | 360,274 | 645,381 | 124,471 |
| 2020 | 508,761 | 271,566 | 372,526 | 77,218 |
| 2021 | 370,997 | 440,934 | 352,145 | 58,710 |
| 2022 | 2,486 | 574,185 | 540,910 | 120,829 |
| 2023 | 17,571 | 678,082 | 880,331 | 152,987 |
Visitation by Region
L.5.9 State park visitation history by region
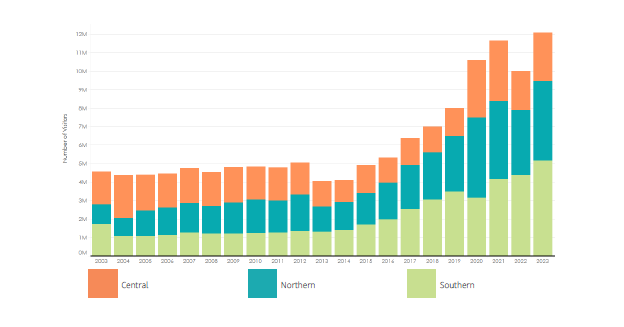
This chart was made using the state park visitation data from the Utah Department of Natural Resources, covering the years 2003 to 2024. It displays the total number of park visits each year, with the data categorized and color-coded by region: northern, central, and southern Utah
References
- National Park Service. (2024). National Park Service Visitor Use Statistics – Park Reports. [Data set]. U.S. Department of the Interior. https://irma.nps.gov/Stats/Reports/Park
- Utah Division of State Parks. (2024). Park Visitation Data. [Data set]. Utah Department of Natural Resources. https://stateparks.utah.gov/resources/park-visitation-data/
CANYONLANDS NATIONAL PARK WHITE RIM OVERLOOK | AARON FORTIN