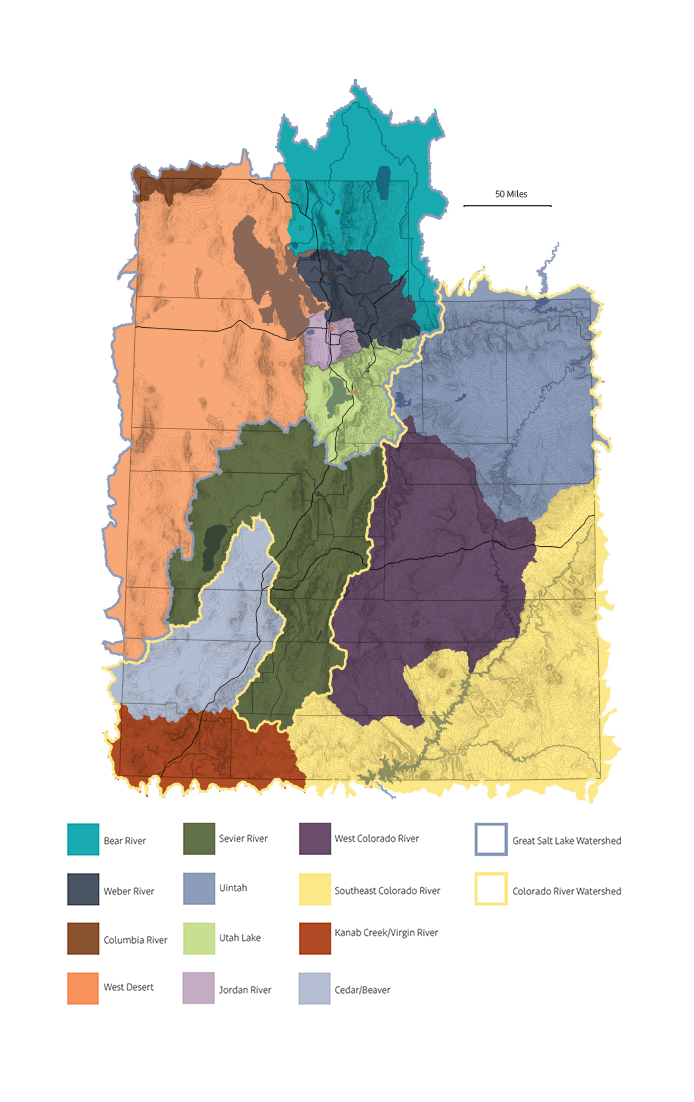
Utah's Watershed Basins
W.3.1 Watersheds and basin areas
Precipitation and Depletions by Basin Area
The Utah Department of Natural Resources Water Budget Model gathers data from agricultural, municipal and industrial, wetland, reservoir, climate, and water supply inputs and calculates the major inputs and outputs for each sub-basin by year. Tables are broken down by basin area and contain annual precipitation, and categorical depletions for the years 2010-2022. Precipitation measures the amount of rain and snowfall within the region. Depletions in each category measure the amount of water drawn lost from the system due to consumptive use. Water is measured in acre-ft.
W.3.2 Cedar/Beaver basin (in acre feet)
| Year | Precipitation | Agricultural Depletions | Municipal and Industrial Depletions | Mineral Depletions |
|---|---|---|---|---|
| 2010 | 6,670,852.86 | 220,632.89 | 23,404.86 | - |
| 2011 | 4,500,150.53 | 207,678.49 | 23,573.60 | - |
| 2012 | 4,029,005.16 | 225,812.54 | 23,581.38 | - |
| 2013 | 4,179,570.40 | 218,748.06 | 23,589.30 | - |
| 2014 | 4,204,188.00 | 210,648.13 | 23,597.38 | - |
| 2015 | 4,632,036.90 | 206,705.05 | 22,441.53 | - |
| 2016 | 4,159,315.02 | 224,824.57 | 63,260.49 | - |
| 2017 | 4,397,591.12 | 209,617.88 | 49,840.76 | - |
| 2018 | 4,194,275.90 | 193,831.53 | 64,566.95 | - |
| 2019 | 5,542,285.65 | 231,775.19 | 45,224.47 | - |
| 2020 | 2,112,928.96 | 225,397.98 | 46,306.47 | - |
| 2021 | 5,304,898.33 | 198,510.65 | 48,135.40 | - |
| 2022 | 4,137,055.35 | 210,337.83 | 48,638.99 | - |
W.3.3 Kanab Creek/Virgin River basin (in acre feet)
| Year | Precipitation | Agricultural Depletions | Municipal and Industrial Depletions | Mineral Depletions |
|---|---|---|---|---|
| 2010 | 5,608,051.14 | 44,985.71 | 17,603.18 | - |
| 2011 | 2,814,075.56 | 42,859.03 | 17,698.87 | - |
| 2012 | 3,149,683.43 | 46,080.24 | 17,707.22 | - |
| 2013 | 3,225,423.25 | 43,185.07 | 17,716.24 | - |
| 2014 | 2,970,246.95 | 38,355.44 | 17,725.99 | - |
| 2015 | 3,882,318.82 | 37,770.57 | 18,086.82 | - |
| 2016 | 3,919,746.11 | 38,264.03 | 19,549.84 | - |
| 2017 | 3,051,904.22 | 33,751.75 | 19,666.93 | - |
| 2018 | 3,268,835.58 | 37,617.55 | 20,642.55 | - |
| 2019 | 5,253,698.80 | 34,116.07 | 18,539.70 | - |
| 2020 | 1,793,734.77 | 37,696.23 | 19,668.48 | - |
| 2021 | 4,088,234.49 | 36,840.52 | 19,836.14 | - |
| 2022 | 3,116,298.10 | 31,962.03 | 20,433.64 | - |
W.3.4 West Colorado River basin (in acre feet)
| Year | Precipitation | Agricultural Depletions | Municipal and Industrial Depletions | Mineral Depletions |
|---|---|---|---|---|
| 2010 | 9,942,720.11 | 178,954.77 | 40,064.98 | - |
| 2011 | 7,840,817.62 | 196,410.74 | 40,403.95 | - |
| 2012 | 6,378,647.87 | 173,173.03 | 40,405.96 | - |
| 2013 | 9,299,734.80 | 173,223.78 | 40,407.98 | - |
| 2014 | 7,455,383.82 | 196,690.65 | 40,410.02 | - |
| 2015 | 10,040,399.39 | 184,209.20 | 38,799.10 | - |
| 2016 | 8,223,825.76 | 182,721.97 | 29,960.48 | - |
| 2017 | 6,788,958.48 | 195,560.58 | 32,021.52 | - |
| 2018 | 6,524,514.94 | 169,225.15 | 30,355.69 | - |
| 2019 | 9,597,519.56 | 195,297.13 | 32,803.74 | - |
| 2020 | 4,074,818.17 | 191,202.90 | 29,070.86 | - |
| 2021 | 9,141,652.46 | 144,444.64 | 34,414.72 | - |
| 2022 | 6,618,809.34 | 184,012.93 | 31,308.70 | - |
W.3.5 Southeast Colorado River basin (in acre feet)
| Year | Precipitation | Agricultural Depletions | Municipal and Industrial Depletions | Mineral Depletions |
|---|---|---|---|---|
| 2010 | 11,688,185.99 | 34,926.09 | 4,544.39 | - |
| 2011 | 7,787,316.35 | 30,741.67 | 4,968.82 | - |
| 2012 | 6,451,450.89 | 34,556.39 | 5,017.39 | - |
| 2013 | 10,361,524.79 | 26,909.22 | 4,990.65 | - |
| 2014 | 7,502,902.90 | 25,365.35 | 4,991.14 | - |
| 2015 | 13,794,074.75 | 27,860.72 | 4,445.80 | - |
| 2016 | 9,364,980.43 | 30,966.30 | 4,257.18 | - |
| 2017 | 7,453,219.90 | 30,707.79 | 3,863.86 | - |
| 2018 | 7,212,611.03 | 27,585.75 | 3,442.20 | - |
| 2019 | 11,291,343.51 | 35,763.41 | 3,779.34 | - |
| 2020 | 4,800,896.45 | 29,628.25 | 3,419.05 | - |
| 2021 | 9,457,485.01 | 23,297.71 | 3,402.95 | - |
| 2022 | 8,488,298.79 | 22,880.94 | 3,114.90 | - |
W.3.6 Uinta basin (in acre feet)
| Year | Precipitation | Agricultural Depletions | Municipal and Industrial Depletions | Mineral Depletions |
|---|---|---|---|---|
| 2010 | 11,845,343.79 | 422,585.45 | 9,223.81 | - |
| 2011 | 11,345,429.70 | 447,350.04 | 9,499.77 | - |
| 2012 | 7,315,686.45 | 386,580.81 | 9,508.77 | - |
| 2013 | 9,781,317.83 | 408,634.35 | 9,517.97 | - |
| 2014 | 10,101,707.79 | 389,541.75 | 9,106.22 | - |
| 2015 | 11,028,626.74 | 444,333.58 | 8,296.63 | - |
| 2016 | 11,492,630.97 | 427,974.51 | 28,716.90 | - |
| 2017 | 9,820,698.37 | 480,840.71 | 24,615.98 | - |
| 2018 | 7,846,571.19 | 399,533.01 | 29,927.26 | - |
| 2019 | 12,248,240.00 | 461,286.12 | 11,072.96 | - |
| 2020 | 6,097,238.84 | 448,491.16 | 12,876.77 | - |
| 2021 | 11,771,512.84 | 371,768.62 | 12,140.09 | - |
| 2022 | 9,730,635.50 | 428,308.19 | 14,704.22 | - |
W.3.7 Bear River basin (in acre feet)
| Year | Precipitation | Agricultural Depletions | Municipal and Industrial Depletions | Mineral Depletions |
|---|---|---|---|---|
| 2010 | 9,526,605.00 | 824,984.68 | 32,444.89 | - |
| 2011 | 9,508,094.32 | 800,772.22 | 32,715.65 | - |
| 2012 | 6,975,978.35 | 912,165.95 | 32,725.56 | - |
| 2013 | 6,301,025.56 | 839,333.41 | 32,735.60 | - |
| 2014 | 10,294,662.52 | 799,126.37 | 32,745.78 | - |
| 2015 | 8,051,354.78 | 744,953.60 | 27,285.92 | - |
| 2016 | 10,145,513.29 | 809,932.69 | 27,793.70 | - |
| 2017 | 11,196,162.02 | 891,685.32 | 29,263.40 | - |
| 2018 | 6,843,050.71 | 995,984.98 | 32,092.28 | - |
| 2019 | 10,217,422.26 | 839,046.90 | 30,195.29 | - |
| 2020 | 6,764,716.26 | 952,054.77 | 35,166.58 | - |
| 2021 | 8,436,673.41 | 986,085.06 | 33,441.20 | - |
| 2022 | 7,681,217.49 | 950,223.65 | 31,573.66 | - |
W.3.8 West Desert basin (in acre feet)
| Year | Precipitation | Agricultural Depletions | Municipal and Industrial Depletions | Mineral Depletions |
|---|---|---|---|---|
| 2010 | 14,031,140.22 | 152,034.08 | 8,306.12 | 83,831.67 |
| 2011 | 12,690,796.29 | 151,548.32 | 8,473.85 | 107,111.41 |
| 2012 | 10,765,479.58 | 191,953.68 | 8,483.49 | 104,775.32 |
| 2013 | 10,805,614.75 | 197,329.33 | 8,496.61 | 119,060.06 |
| 2014 | 13,017,388.84 | 179,912.56 | 8,508.97 | 75,594.94 |
| 2015 | 13,367,911.02 | 182,284.37 | 6,740.58 | 116,508.87 |
| 2016 | 13,390,987.60 | 204,637.78 | 6,805.69 | 80,208.66 |
| 2017 | 12,483,297.48 | 150,288.69 | 7,190.71 | 62,705.88 |
| 2018 | 10,406,940.86 | 133,373.70 | 8,408.48 | 84,747.64 |
| 2019 | 17,229,204.20 | 159,322.42 | 7,302.74 | 65,670.49 |
| 2020 | 6,482,933.35 | 165,742.98 | 7,179.12 | 85,986.55 |
| 2021 | 12,101,354.76 | 146,732.08 | 6,365.62 | 65,373.34 |
| 2022 | 10,414,754.01 | 135,867.17 | 6,673.75 | 120,955.74 |
W.3.9 Sevier River basin (in acre feet)
| Year | Precipitation | Agricultural Depletions | Municipal and Industrial Depletions | Mineral Depletions |
|---|---|---|---|---|
| 2010 | 11,363,629.61 | 560,334.66 | 35,292.27 | - |
| 2011 | 9,371,904.52 | 513,046.44 | 36,125.29 | - |
| 2012 | 7,639,750.19 | 613,360.90 | 36,137.63 | - |
| 2013 | 8,317,781.03 | 557,828.74 | 36,150.11 | - |
| 2014 | 8,411,597.07 | 547,187.45 | 36,162.74 | - |
| 2015 | 8,265,413.35 | 545,613.22 | 37,655.40 | - |
| 2016 | 7,662,917.71 | 590,835.28 | 26,708.00 | - |
| 2017 | 7,856,806.80 | 523,352.52 | 28,684.17 | - |
| 2018 | 7,409,199.83 | 519,710.38 | 28,331.67 | - |
| 2019 | 10,266,087.92 | 517,144.97 | 26,174.19 | - |
| 2020 | 4,112,432.22 | 573,602.37 | 26,378.80 | - |
| 2021 | 9,621,313.58 | 516,487.91 | 25,239.85 | - |
| 2022 | 7,137,013.33 | 511,647.96 | 24,523.41 | - |
W.3.10 Columbia River basin (in acre feet)
| Year | Precipitation | Agricultural Depletions | Municipal and Industrial Depletions | Mineral Depletions |
|---|---|---|---|---|
| 2010 | 732,607.38 | 11,161.37 | 2.10 | - |
| 2011 | 600,845.71 | 12,260.03 | 4.34 | - |
| 2012 | 578,930.57 | 16,194.42 | 4.36 | - |
| 2013 | 493,361.65 | 19,671.70 | 4.37 | - |
| 2014 | 828,088.89 | 17,182.10 | 4.38 | - |
| 2015 | 669,716.26 | 18,647.00 | 3.55 | - |
| 2016 | 800,071.46 | 21,514.23 | 3.56 | - |
| 2017 | 910,645.63 | 11,002.74 | 3.57 | - |
| 2018 | 666,867.97 | 9,582.26 | 3.58 | - |
| 2019 | 1,032,385.84 | 10,202.60 | 0.51 | - |
| 2020 | 630,151.51 | 10,944.67 | 0.37 | - |
| 2021 | 696,837.26 | 10,911.90 | 0.29 | - |
| 2022 | 678,902.91 | 8,689.45 | 0.28 | - |
W.3.11 Utah Lake basin (in acre feet)
| Year | Precipitation | Agricultural Depletions | Municipal and Industrial Depletions | Mineral Depletions |
|---|---|---|---|---|
| 2010 | 4,252,792.78 | 222,273.29 | 63,564.06 | - |
| 2011 | 3,713,625.41 | 196,510.85 | 64,129.43 | - |
| 2012 | 2,969,833.72 | 259,789.69 | 64,192.33 | - |
| 2013 | 2,816,034.03 | 227,097.87 | 64,261.39 | - |
| 2014 | 3,662,927.43 | 198,520.55 | 64,337.25 | - |
| 2015 | 2,951,061.53 | 218,346.63 | 62,310.91 | - |
| 2016 | 3,237,628.19 | 236,498.16 | 66,532.91 | - |
| 2017 | 3,872,002.75 | 177,630.74 | 74,651.53 | - |
| 2018 | 3,307,059.33 | 249,783.44 | 68,333.87 | - |
| 2019 | 4,610,443.10 | 186,160.13 | 75,705.15 | - |
| 2020 | 1,915,329.30 | 245,930.12 | 83,812.16 | - |
| 2021 | 3,819,275.24 | 244,068.56 | 77,350.49 | - |
| 2022 | 3,163,330.07 | 208,122.00 | 82,604.46 | - |
W.3.12 Jordan River basin (in acre feet)
| Year | Precipitation | Agricultural Depletions | Municipal and Industrial Depletions | Mineral Depletions |
|---|---|---|---|---|
| 2010 | 1,124,306.86 | 17,319.86 | 197,554.04 | - |
| 2011 | 1,150,283.31 | 14,700.50 | 197,535.95 | - |
| 2012 | 820,241.64 | 21,950.81 | 197,535.95 | - |
| 2013 | 819,334.01 | 19,681.59 | 197,535.96 | - |
| 2014 | 989,594.32 | 12,863.09 | 197,535.96 | - |
| 2015 | 953,486.83 | 14,641.63 | 190,259.43 | - |
| 2016 | 965,041.94 | 15,186.45 | 184,777.67 | - |
| 2017 | 1,087,204.01 | 10,715.55 | 187,728.68 | - |
| 2018 | 921,482.28 | 15,022.38 | 186,996.16 | - |
| 2019 | 1,453,964.87 | 10,010.10 | 158,430.56 | - |
| 2020 | 644,005.40 | 15,683.25 | 152,237.64 | - |
| 2021 | 1,074,799.49 | 14,496.93 | 137,786.76 | - |
| 2022 | 925,623.70 | 12,606.21 | 136,299.21 | - |
W.3.13 Weber River basin (in acre feet)
| Year | Precipitation | Agricultural Depletions | Municipal and Industrial Depletions | Mineral Depletions |
|---|---|---|---|---|
| 2010 | 3,894,741.32 | 159,044.14 | 67,856.94 | 136,284.08 |
| 2011 | 3,896,362.46 | 141,173.83 | 68,024.13 | 98,408.18 |
| 2012 | 2,792,724.48 | 203,329.78 | 68,029.31 | 141,477.95 |
| 2013 | 2,561,133.22 | 184,789.51 | 68,034.57 | 128,187.38 |
| 2014 | 3,560,415.05 | 147,477.37 | 68,039.92 | 139,938.04 |
| 2015 | 3,112,197.46 | 142,852.37 | 62,657.30 | 108,832.87 |
| 2016 | 3,625,607.03 | 154,594.99 | 66,325.93 | 71,332.78 |
| 2017 | 4,148,921.14 | 147,281.37 | 65,210.91 | 122,853.63 |
| 2018 | 2,724,973.18 | 180,718.49 | 68,459.95 | 119,410.46 |
| 2019 | 4,213,144.56 | 131,142.33 | 61,212.21 | 92,291.31 |
| 2020 | 2,245,854.70 | 182,278.40 | 80,552.15 | 119,973.71 |
| 2021 | 3,446,322.73 | 183,980.40 | 67,300.43 | 104,015.03 |
| 2022 | 3,245,873.22 | 158,400.92 | 63,707.61 | 74,092.70 |
References
- Utah Division of Water Resources. (2022). Water Budget Data. [Data set]. Utah Department of Natural Resources. https://dwre-utahdnr.opendata.arcgis.com/pages/water-budget-data
- Esri. (2024). Water Related Land Use Dashboard. [Data set]. Utah Department of Natural Resources. https://dwreutahdnr.opendata.arcgis.com/pages/wrlu-apps
RUTH LAKE, HIGH UINTAS WILDERNESS | KORI KURTZEBORN