Additional Resources
The following content addresses even more information supporting the first report for the Institute for Land, Water and Air.
Water
Addressing Utah’s water availability
Precipitation
Precipitation totals have not changed significantly in Utah over the past 50 years, but considerable changes in precipitation properties have been found in the historical record and in future projections. These include more rain than snowfall and fewer precipitation events with more intensity. Considering the increasing temperatures across the mountains of the Intermountain West, these trends have led to a diminishing snowpack and earlier melt. These trends are also predicted to continue by state-of-the-art climate models due to the fact that reduced snowpack results in less reflection of sunrays. Together, increases in warming and evaporation hamper streamflow.
Cloud seeding
The only way humans might possibly prevent snowpack from diminishing is through cloud seeding operations and the government of Utah has been funding winter orographic snow enhancement projects for 40 years. Evaluation studies performed in other states like Wyoming indicate a ~10% increase in winter snowfall over the mountains as a result of such efforts. However, cloud seeding and optimization effects in Utah have not been quantified and require further exploration.
Wet-dry cycle
High precipitation and drought periods in Utah follow a distinct “wet-dry cycle” spanning 10-15 years. This wet-dry cycle is reflected in the Great Salt Lake and groundwater levels, as well as the Colorado River water supply. The cause of this oscillatory behavior in Utah’s water resources lies in the world’s oceans. Oceans change slowly and climate cycles in the oceans can affect North America, modulating our snowpack, soil moisture, groundwater, and subsequently the Great Salt Lake levels. In practical terms, this means that retaining water from good years to cope with bad years is possible if we can predict this wet-dry cycle, and we can!
Tools to forecast drought and water availability:
USU researchers have spent a decade understanding the wet-dry cycle in Utah and their research has led to an 8-year prediction of the Great Salt Lake level and northern Utah’s precipitation, as well as a 5-year prediction of the Colorado River water supply, which updates every year to provide the outlook for natural water resources in the near future. Efforts to translate these predictions to watershed-scale management practices are needed.
Digital snowpack monitoring provides an assessment of recentsnowpack evolution across the state and tree-ring reconstructions of snowpack provide a historical perspective of snowpack change in Utah.
The prediction of drought in Utah is being accomplished by combining National Weather Service forecast model products and statistical methods, providing final products with regional and local features several months in advance.


Reservoirs and portfolio-based management
Utah’s reservoirs currently store 2.8 million acre-feet, are at 52% of capacity, and levels are declining. The situation is more dire when including Lake Powell and Flaming Gorge. In an era of declining reservoir levels, we see need for portfolio management. Portfolio management integrates existing reservoirs, new supplies, urban and agricultural water conservation, water banking, aquifer storage and recovery, monitoring of consumptive use, data-based management, adaptive management, and other tools to address declining supply this year and in coming years.
Portfolio management was endorsed in the State Water Strategy and the Cache Water Master plan (J-U-B Engineers, 2019).Portfolio management is a hallmark of modern water management and used by small and large water conservancy districts and utilities across the United States.
Portfolio management can create more water sooner at lower cost, engage more parties, enhance ecosystems, and provide more flexibility with less controversy. Cost estimates for new reservoirs only rise over their long planning horizons.As a state, Utah can figure out what portfolio, data-based, and adaptive management mean, how they work together, and what they look like when adopted in different locations around the state. For example:
- Each place will be unique.
- Identify flow, storage, and other system trigger points.
- Include more parties.
- Think ahead across a broader set of supply, demand, public values, and other scenarios.
- Identify synergies.
- Create more flexibility for managers to adapt in the face of crisis.
- Establish strategic water reserves and storage criteria that provide water supply for critical downstream aquatic, floodplain, and wetland habitat services including for endangered species.
USU has expertise in portfolio management, reservoir operations, policy, data-based and adaptive management, ecology, and environmental water flows, and can assist these efforts.
References
Everitt, J. (2020). "Weber Basin Water Conservancy District Bottom-Up Climate Vulnerability Study Using RiverWare," Utah State University, Logan. https://digitalcommons.usu.edu/gradreports/1474.
Great Salt Lake Advisory Council. "Great Salt Lake benefits our economy, our environment, and our ecology." https://documents.deq.utah.gov/water-quality/standards-technical-services/gsl-website-docs/DWQ-2021-013131.pdf. [Accessed on: October 22, 2021].
J-U-B Engineers. (2019). "Cache Water Plan." Cache Water District. https://www.cachewaterdistrict.com/water-master-plan.
Stagge, J. H., Rosenberg, D. E., DeRose, R. J., and Rittenour, T. M. (2018). "Monthly paleostreamflow reconstruction from annual tree-ring chronologies." Journal of Hydrology, 557, 791-804. https://www.sciencedirect.com/science/article/pii/S0022169417308855.
Agricultural water use
Agriculture is by far the largest water user in Utah. Annually about 70-80% of the diverted water is used to support a $500 million crop industry (mainly alfalfa, hay, wheat, and corn) in the state that contributes $400 million in cash receipts from milk production and helps feed over 2 million livestock [USDA-National Ag Statistics Service (NASS), 2020]. Water optimization in agriculture is a high priority given mounting concerns about water scarcity due to rapid urban growth, depleting water supplies in some areas, and anticipated water shortages and weather extremes due to climate change. This has been especially apparent in 2020-2021 with record droughts.
As water shortages and rights reallocations toward urban and other uses become more common, efforts to measure effective water use in agriculture are being addressed by synergistic collaborations between Utah State University and the state’s Agricultural Water Optimization Task Force. Additional products coming from the scientific community (OpenET), are leveraging satellite information across the state, providing cost-effective methods to monitor and standardize methodologies for measuring effective water use.
There are several solutions for optimizing agricultural water use and Utah State University (USU) and several other state entities are working to find the most economical and ideal solutions. Identifying best solutions is key since a recent analysis of USDA-NASS data by USU indicates that financial barriers are the most common barrier to water optimization in Utah (Figure 1).
Optimizing water in Utah agriculture requires a multi-faceted approach. Several solutions for optimizing water exist. Utah State University and several other organizations have been working to find the most economic and ideal solutions. This is key becausea recent analysis of USDA-NASS data by USU indicates that financial barriers are the most common barrier to water optimization in Utah (Figure 1). The solution list is long and includes among others improvements in water delivery, storage, flow monitoring, reuse, banking, and demand management. There are also several options to optimize water once it reaches the farm. USU has partnered with several other state and local organizations to test ways to optimize on-farm water use and defend against drought. Major findings to date include:
- Sprinkler Technologies - Advanced pivot irrigation systems such as low-elevation spray application (LESA) and low-energy precision application (LEPA) can often improve water use efficiency by 20% thereby reducing water diversions. Mobile drip irrigation for pivots improves water use efficiency but isnot feasible for most Utah farms due to high installation, labor, and maintenance costs.
- Biochar – Biochar (similar to wood charcoal) did not consistently improve soil moisture nor benefit crop yield or quality and is not a viable method for buffering irrigation diversion reductions.
- Advanced irrigation scheduling methods – Advanced irrigation scheduling methods utilizing sensors, weather data, or commercial tools can reduce water use by about 10% without having any negative impacts on crop production.
- Irrigation reductions – Small reductions in irrigation rates of 10% in many field trials showed minor or no impacts on crop production in most cases. This indicates opportunity for small cutbacks.
- Deficit irrigation – Targeting deficit irrigation to critical crop stages has not consistently improve crop production more than a uniform deficit all season. The amount of deficit irrigation is nearly equivalent to yield loss (e.g., 50% of the total irrigation needs produced about 50% of the yield of full irrigation levels)
- Crop genetics – Drought tolerant corn or alfalfa varieties have not consistently improved water use efficiency and likely will not help optimize water use in a significant way.
- Cover crops – Cover crops help improve soil health but the enhanced benefits do not offset the additional water required to grow most cover crops.
- Alternative crops – Many crops use less total water than alfalfa, but largescale economic alternatives to alfalfa are not available to most Utah farmers. Small grain forages are grown in Utah more frequently than in the past and have become a way for growers to reduce irrigation needs.

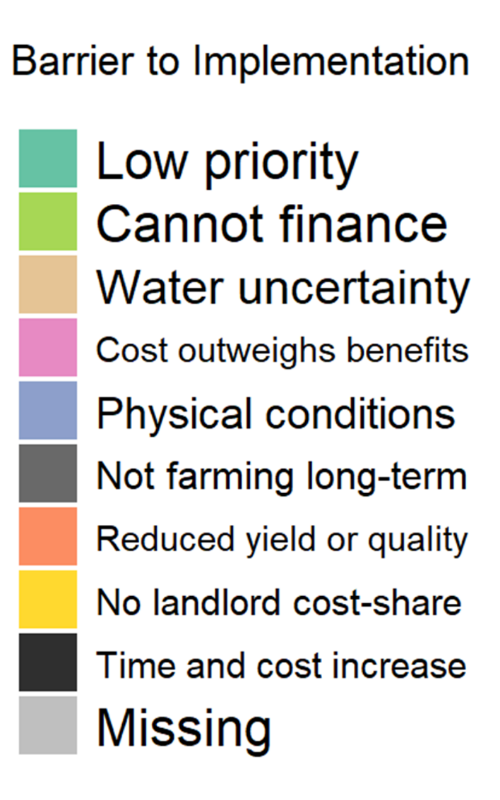
Figure 1. Primary barriers to implementing irrigation improvements. Average responses across four USDA-NASS survey years (2003, 2008, 2013, 2018).
Municipal and industrial (M&I) water use
Sixty-four percent of water used in the municipal, industrial, and institutional sector is applied to ornamental landscapes as irrigation. However, Utahn’s typically apply twice as much water as landscape plants require, presenting the opportunity for substantial improvements in water use efficiency and water conservation in the M&I sector.
WaterMAPS™, a custom software application developed by USU, may be used to quantify capacity to conserve on urban landscapes. The integration of parcel data and land cover data with water meter data and weather data (Figure 2) produces and maps parcel-scale Landscape Irrigation Ratios (LIRs) which compare landscape water use to landscape water need across an entire utility service area. The LIRs represent an efficiency standard with values at or under 1 representing efficient water use and higher ratios indicating locations where water savings may be realized.
Once identified by high LIRs, properties may be evaluated to determine the source of irrigation inefficiencies. USU’s Water Check program has a long history conducting such evaluations in many areas of the state. The program identifies irrigation system and other landscape inefficiencies for owners and managers, providing a customized irrigation schedule to participants based on location and current landscape conditions, as well as improvements to irrigation systems.
The multi-layered challenge of M&I water use can benefit from a multi-layered solution, however, and landscape water use efficiency may be further improved by layering additional conservation measures onto properties identified by WaterMAPS™ and evaluated by Water Checks. For example, climate and wi-fi based irrigation controllers–which have been studied by USU’s Center for Water Efficient Landscaping–have been shown to reduce landscape irrigation by 30-48% from typical amounts, are currently eligible for rebates from the state (Evans, 2020, Kopp et al., 2016). Numerous and ongoing trials of turfgrasses have also been conducted at USU, helping to identify genetically superior varieties of commonly used grasses requiring at least30% less water. Ornamental plant trials of both native and drought-adapted species are also conducted and have led to research-based recommendations of plant materials that may replace higher water use species in Utah’s landscapes.

Figure 2. Calculation of Landscape Irrigation Ratios (LIR).
More on Utah's water quality
Across the state of Utah, 23% (~11,000 river miles) of rivers, streams, and canals and 32% of lakes, reservoirs, and ponds (~600,000 acres) are fully supporting these beneficial uses or show no signs of impairment, while 31% of rivers, streams, and canals (~45,000 river miles) and 49% of lakes, reservoirs, and ponds (~300,000 acres) show evidence of impairment¹ (Figure 1). Most waterbody impairments result from low oxygen levels, high temperatures, pH levels, nutrients, heavy metals, E. coli, sediment, and habitat degradation. Environmental change has increased the stressors on water quality in the state by increasing the transport of these pollutants to waterbodies, reducing natural retention and filtration processes that filter runoff before entering waterbodies, and increasing temperatures and extreme weather events that impact important ecosystem processes that regulate these impairments.
Increasing population, aging infrastructure, and mountain development has led to increased nutrients (nitrogen and phosphorus) entering our streams and lakes, especially Utah Lake, Jordan River, and Farmington Bay. Poor water quality has economic, ecological, and human consequences. Economic consequences include increased cost of water treatment, impacts to recreation industries, and periodic loss of water for crop irrigation. Ecological consequences include reduced fishery quality and ecosystem function, and increased occurrences of harmful algal blooms. Human consequences include reduced recreation opportunities, exposure to environmental toxins and disease, and loss of aesthetic value.
Urban river water quality suffers from a legacy of historic infrastructure designed to route runoff and wastewater directly to the closest river so that waste could be removed from the immediate area. Thus, a large amount of human-derived pollutants enter urban rivers, impairing water quality. The Jordan River exhibits typical characteristics of urban streams, including a flashy hydrograph, elevated concentrations of nutrients, wide daily fluctuations in dissolved oxygen, homogenized channel morphology, and reduced biodiversity dominatedby pollution-tolerant species. Aside from stormwater inputs, the Jordan River is fed by Utah Lake, and four water reclamation facilities discharge treated sewage effluent into the river. As a result, total nitrogen concentrations average 5.2 mg N/L and total phosphorus concentration averages 0.9 mgP/L over the course of the year. These concentrations are stoichiometrically balanced to grow algae and bacteria (Epstein et al. 2016). Organic matter, a measure of energy available to the food web, is a pollutant of concern because decomposition of organic material can lead to low dissolved oxygen. Treated sewage is a source for 30-40% of fine organic matter and 25-30% of dissolved organic matter (Kelso and Baker 2020). Fertilizers, compost, pesticides, and herbicides are applied to agricultural areas to improve productivity and crop yield, but when applied in excess, these compounds can be transported to waterbodies during rainfall and snowmelt. Livestock also have significant impacts to water quality by walking in streams or lakes, which damages the physical integrity of the system, or by way of their waste, which is high in nutrients, E. coli, and heavy metals (Water Quality Extension).
The atmospheric deposition of nutrients (N, P) and contaminants (e.g. plastics) have the potential to influence the ecology of waterbodies. In general, nitrate, a contributor to acid rain, has been declining over the last few decades. However, total nitrogen has been on the rise due to elevated ammonium deposition. The latter are higher near the mountainous and populated regions in the north of Utah (NADP). Climate and land use have resulted in greater soil losses to theatmosphere. The resulting dust can influence remote water bodies. Dust in Utah is moderate compared to other western states (Brahney 2020a). Nevertheless, mountain lakes in the Uinta Ranges have exhibited increased nutrient concentrations that are dominantly driven by dust deposition (Scholz and Brahney). The atmospheric transport of microplastics is a novel mechanism for bringing microplastic pollution to remote waterbodies. Deposition rates in Utah range from 48 to 120 microplastics per square meter per day mid-range for the American West (Brahney 2020b). Water bodies across Utah, including high-mountain streams and their biota, contain microplastics.
Researchers at USU are evaluating many avenues for restoration and protection of the state’s water resources and water quality, including the use of green infrastructure and soil restoration to treat urban runoff (Rivers et al. 2020, Dupont 2017), beaver ponds and beaver dam analogues as natural water quality improvement tools and facilitate the removal of nutrients from mountain rivers (Jordan et al. 2019, Murray et al. 2021, in progress), wetland restoration to recover from invasive species (Kettenring and Tarsa 2020). USU Extension is providing many community resources in the form of trainings, outreach and volunteer programs, and small grants opportunities to improve water quality protection.
¹Assessment determinations are categorized by the Utah Division of Water Quality: Here we use unimpaired to describe waterbodies in Categories 1 & 2 (waterbody has attained all beneficial uses (BUs) or that some BUs are attained by not enough data to determine if all BUs are attained), and we use impaired to describe waterbodies in Categories 4 & 5 (waterbodyis impaired for one or more BUs by a pollutant).

Figure 1. Map of Utah watershed assessment of water quality. Highlighted areas indicate the assessment category for beneficial uses (from Utah Division of Water Quality Integrated Report).

Figure 2. Nutrient and chlorophyll-a (algae) concentrations in Utah Lake from 1996-present (Utah Lake Data Explorer).
More on the Colorado River
The recently announced ‘Declaration of Shortage’in the Lower Colorado River Basin places unprecedented focus on thedwindling water supplyfrom the river. Natural flow at Lees Ferry isnow 17%less annually than the average for last century, partlydue to warmingtemperatures, increased evapotranspiration,and drier soils. The researchof USU’s Center for Colorado River Studiestakes an in-depth look at how declining runoff and increased water use will impact community water supplies and ecosystems. Controlling future demands on the riverwill requireamix of limits onwater use growth for the Upper Basin and a reduction in existing Lower Basin uses. The Center’sresearch illustrates the difficult choices ahead by examiningmanagement alternatives under differentfuture scenariossincesound planning for the future can only occur by developing strategies adaptable to a wide range of possible water scenarios. The risks of drought and climate change are both uncertain and potentially severe; however, our ability to control these futures is limited comparedto our ability to control the future demands for water.

Figure 1. End-of-year combined storage of Lake Powell and Lake Mead storage based on conditions modeled from the Millennium Drought (2000-2018). Results demonstrate the effects of a range of Upper Basin demand limits along with a range of Lower Basin shortages triggered when storage falls below 15 million acre feet (combined).
Wetland restoration strategies
USU researchers have long worked to develop strategies and practices, engage with managers, and inform policy to support Utah’s stewardship, utilization, and protection of its scarce water resources. Helping Utah develop water supplies and the capacity to respond to droughts has been a university-wide emphasis since its founding. In our current context, USU researchers are increasingly enriching our understanding of water’s vital role in sustaining arid region ecosystems. They are documenting the connections between ecosystem healthand human health, as well as the broader, multiple, but often unrecognized benefits and services that ecosystems provide for Utah’s people and communities. This perspective comes into even greater focus as they look at the connections between water, land,and air. Rooted in its land grant history and mission, USU is committed to help sustain the environment that underpins Utah’s economy and way of life. This commitment includes making human and ecological communities more resilient and adaptable to short-and long-term cycles of variability in water supply.
Why wetlands matter and what are they
In the arid West, aquatic ecosystems sustain humans, our livelihoods, and our recreation. Wetlands—literally wet land that is flooded for all or part of the year—are a critical part of aquatic ecosystems in the region. Wetlands encircle Great Salt Lake, Utah Lake, and Bear Lake and line rivers and streams throughout the state. They also form in small depressions in the landscape and where agricultural irrigation has created seasonal flooding to support wetland plants and wildlife. Wetlands range from more permanently flooded areas with bulrushes to the briefly-spring-flooded playas (see pictures at right).
Wetlands are prized by those in the know because of their critical role in supporting wildlife especially waterfowl cherished for duck hunting and fish valued for fishermen. Wetlands can also help protect people from flooding, drought, dust, polluted water, and climate change. Their beauty inspires nature enthusiasts, writers, and artists.
How wetlands have been impacted by humans
As an arid state, Utah has never been replete with wetlands and what few wetlands existed naturally have been greatly impacted by humans. Wetlands currently make up <1% of Utah’s land area.These wetlands are continually under threat from upstream diversions, a water rights system that does not account for the importance of wetlands in protecting humans, excessive nutrient inputs, and invasive species. What can be done to protect, restore, and better manage this vital resource?
Restoring Phragmites-invaded wetlands
A major threat to wetlands in Utah and across North America is the non-native grass Phragmites australis (called common reed or phragmites). This extremely tall, dense grass crowds out native wetland plants and degrades the important habitat and other benefits wetlands naturally provide. Also, phragmites is an extremely thirsty plant that depletes wetlands and other aquatic habitats of the water they so desperately need. Phragmites currently occupies many tens of thousands of acres along Great Salt Lake, Utah Lake, and Bear Lake, as well as lines ditches along roadways, railways, and canals. Extensive efforts are underway to control this plant across the state and to prevent new infestations. Hundreds of thousands of dollars are spent each year by the state and other land managers on phragmites control. Researchers from USU have partnered with numerous land managers to develop effective techniques for managing phragmites and for reestablishing native plant communities that form critical wildlife habitat and provide other benefits.
Restoring wetlands with beavers, beaver dams, and beaver dam analogues (BDAs)
Withincreasing temperatures and evaporation due to climate change, substantial upstream diversions, and a loss of beavers and their dams, many rivers and streams in Utah (and the West in general) become substantially dewatered in the summer. Fish and other wildlife can be heavily impacted. However, restoration of beavers, beaver dams, and artificial beaver dams (beaver dam analogues; BDAs) in headwaters have emerged as a promising way to restore fish habitat and protect (stretch) water for downstream human andwildlife uses. BDAs and beaver dams allow water to be naturally stored in headwater areas and more slowly and consistently release the water throughout the growing season to sustain downstream ecosystems and human uses. USU researchers have pioneered theuse of BDAs and are reintroducing beaver throughout the arid west to support aquatic ecosystem restoration.
Policy barriers and opportunities to keeping water in wetlands
Without water, wetlands cannot support the multitude of ecosystem services they provide to society. Utah’s legal framework for prioritizing and allocating water is an impediment to supporting wetlands and other aquatic systems. Many wetlands fail to receive the water they need to function and conserved water upstream does not necessarily reach downstream aquatic ecosystems if it is slated for next-in-line water right holders. The catastrophically low levels of the Great Salt Lake in 2021 (and associated habitat and dust impacts) underscore the consequences of insufficient water for aquatic ecosystems. USU researchers are studying policy and public actions that can provide water for wetlands.

Invasive Phragmites in foreground and background. In many of Utah’s wetlands, Phragmites forms a dense, impenetrable thicket that thwarts wildlife and humans.

Beaver dams and their restoration are essential to keep aquatic ecosystems healthy and human water needs met throughout the year.

An emergent wetland with native bulrushes in the foreground.

A playa wetland with native saltgrass in the foreground and unvegetated areas (because of naturally high salinity) in the background.
Metrics to monitor year over year
Tracking Changes in Utah’s Water Availability
- Annual precipitation amounts (rain vs. snow)
- Annual air temperatures
- Streamflow (percentage above/below average)
Quantifying Utah’s Water Supply and Use
- Water supply
- Precipitation (rain vs. snow)
- Groundwater mining and inflow
- Natural system use (excluding GSL evaporation)
- Interstate Compact decreases
- GSL evaporation
- M&I depletions
- Agricultural depletions
- Water supply by basin
- Water use
- Population
- GPCD
- Land use data (agricultural, urban/suburban)
- Annual evapotranspiration amounts
Maintaining Utah’s Water Quality
- pH, temperature, dissolved solids, particulate matter, dissolved oxygen, suspended sediment of indicator lakes and ponds
- E. coli and cyanobacteria in lakes and ponds
- Number of impaired water bodies
Protecting Utah’s Watersheds and the Great Salt Lake
- GSL levels
- Stream corridor traits
- Wetland numbers and size
- Watershed land use/land cover patterns
Conserving Water for the Natural Environment
- Streamflow (levelsyear over year)
Air
The health impacts and costs of air pollution
It is undeniable that air pollutants have a profound effect on illness and deaths, as they are indiscriminately inhaled, can travel through the bloodstream, and interact with multiple organs, including the heart and arteries, lungs, and brain (Figure 1). Deaths from heart disease, the leading cause of death in Utah, may be prevented by reducing PM2.5in the air (Ou et al., 2020). In Utah, the risk for the most severe type of heart attack was found to be increased by 15% for every 10 μg/m3increase in PM2.5(Pope et al., 2015). Cancer is the second leading cause of death in Utah. Utah-specific data show that PM2.5exposure at levels above the long-term NAAQS standard of 12 μg/m3increases risk for mortality up to 50% for certain cancers in young adults (Ou et al., 2020). Since air pollutants can cross the placenta, reducing PM2.5and other pollutants can assist with healthy births and infant neurodevelopment (Steib et al., 2012; Klepac et al., 2018; loftus et al., 2019; Zhang et al., 2020). With every 10 μg/m3increase in PM2.5, Utah women have a 16% increased risk for pregnancy loss (miscarriage) (Leiser et al., 2019). While the percent increase in risk may appear small, exposure to air pollutants is so widespread that these small changes have large impacts on actual numbers and dollars. A Utah-based study found that consistently reducing PM2.5to ≤12 μg/m3would save $476,000-$806,598 in annual hospital facility costs because those reductions would prevent 112 hospitalizations for pneumonia every year (Pirozzi et al., 2018). For the nearly 365,000 seniors older than 65 and living in Utah, their age and resulting complex health needs leave them highly vulnerable to disease and increased healthcare costs because of pollution-related illness. Even at low levels of PM2.5, defined as <12 μg/m3, seniors had a 7% increase in deaths that were related to pollution alone (Di et al, 2017).

Figure 1. Health impacts of air pollution (from Ou et al., 2020).
Reducing air pollutants has positive impacts on human health, life expectancy, and economic activity. Assessing cost versus benefits over two decades, in 2011, the U.S. EPAestimated the economic value of improving air quality may reach up to $2 trillion by the year 2020, compared to pollutant control implementation costs of $65 billion (see Figure 2). These societal gains stem from preventing illness and premature deaths that result in lost economic output, decreases in illnesses that lead to absenteeism in work and education, and increased savings from lowering the frequency of healthcare visits for pollution-related illness. An evaluation of the impact of the Clean Air Actestimated that adherence to the NAAQS for fine particulate matter (PM2.5) and ozone prevented 237,100 adult deaths, 17 million lost work days, 135,000 hospital admissions, and 120,000 emergency room visits in the U.S. (EPA, 2011).

Figure 2. Estimated pollutant control costs to societal economic benefits for 2000, 2010, and 2020 (EPA, 2011).
The scientific evidence strongly shows positive health and economic impacts that originate from reducing ambient levels of PM2.5, ozone, nitrogen dioxide, and otherpollutants to and below the concentrations defined by the National Ambient Air Quality Standards (NAAQS). While statewide efforts have improved Utah’s air since the enactment of the Clean Air Act, several Utah’s airsheds continue to face challenges in meeting the current NAAQS.
Di, Q., Wang, Y., Zanobetti, A., Wang, Y., Koutrakis, P., Choirat, C., Dominici, F., & Schwartz, J. D. (2017). Air Pollution and Mortality in the Medicare Population. The New England journal of medicine, 376(26), 2513–2522. https://doi.org/10.1056/NEJMoa1702747.
EPA (2011) Benefits and costs of the Clean Air Act 1990-2020. A Summary Report: documents and graphics. Clean Air Act Overview. https://www.epa.gov/clean-air-act-overview/benefits-and-costs-clean-air-act-1990-2020-report-documents-and-graphics. Accessed Oct. 2021.
Klepac P, Locatelli I, Korošec S, Künzli N, Kukec A. (2018). Ambient air pollution and pregnancy outcomes: A comprehensive review and identification of environmental public health challenges. Environ Res.,167:144-159, doi: 10.1016/j.envres.2018.07.008., PMID: 30014896.
Leiser, C.L., H.A. Hanson, K. Sawyer, J. Steenbilk, R. Al-Dulaimi, T. Madsen, K. Gibbons. J.M. Hotalin Y.O. Ibrahim, J.A. Vanderslice, and M. Fuller. (2019) Acuteeffects of air pollutants on spontaneous pregnancy loss: a case-crossover study. Fertility and Sterility, 111(2), 341-347, https://doi.org/10.1016/j.fertnsteri.2018.10.028.
Loftus CT, Hazlehurst MF, Szpiro AA, Ni Y, Tylavsky FA, Bush NR, Sathyanarayana S, Carroll KN, Karr CJ, LeWinn KZ. (2019) Prenatal air pollution and childhood IQ: Preliminary evidence of effect modification by folate. Environ Res., 176:108505. doi: 10.1016/j.envres.2019.05.036. PMID: 31229778; PMCID: PMC6710141.
Pope III, CA., R.T. Burnett, M.C. Turner, A. Cohen, D. Krewski, M. Jerrett, S.M. Gaspar, and M.J. Thun. (2011) Lung cancer and cardiovascular disease mortality associated with ambient ir pollution and cigarette smoke: Shape of the exposure-response relationships. A Review. Eviron Health Perspect, 119, 1616-1621.
Ou J.Y., Hanson H.A., Ramsay J.M., Kaddas H.K., Pope C.A. 3rd, Leiser C.L., VanDerslice J., Kirchhoff A.C. (2020) Fine Particulate Matter Air Pollution and Mortality among Pediatric, Adolescent, and Young Adult Cancer Patients. Cancer Epidemiol Biomarkers Prev., (10):1929-1939. doi: 10.1158/1055-9965.EPI-19-1363. Epub 2020 May 13. PMID: 32404444; PMCID: PMC7541555.
Ou, J., C.S. Pirozzi, B.D. Horne, H.A. Hanson, A.C. Kirchoff, L.E. Mitchell, N.C. Coleman, and C.A. Pope III. (2020) Historic and modern air pollution studies conducted in Utah. Atmosphere, 11, 1094, 14 pp.
Pirozzi, C.S., B.E. Jones, J.A. Vanderslice, Y. Zhang, R. Paine III, and N.C. Dean (2018). Short-term air pollution and incident pneumonia: A case-crossover study. AnnalsATS, 15(4), 449-459, DOI: 10.1513/AnnalsATS.201706-495OC.
Pope, C. A., Muhlestein, J. B., Anderson, J. L., Cannon, J. B., Hales, N. M., Meredith, K. G., Le, V., & Horne, B. D. (2015). Short-Term Exposure to Fine Particulate Matter Air Pollution Is Preferentially Associated With the Risk of ST-Segment Elevation Acute Coronary Events. Journal of the American Heart Association, 4(12), e002506. https://doi.org/10.1161/JAHA.115.002506.
Stieb, D.M., L. Chen, M. Eshoul, and S. Judek (2012). Ambient air pollution, birth weight and preterm birth: a systematic review and meta-analysis. Environ Res, 117:100-11, doi: 10.1016/j.envres.2012.05.007.
Zhang X, Spear E, Gennings C, Curtin PC, Just AC, Bragg JB, Stroustrup A. (2020). The association of prenatal exposure to intensive traffic with early preterm infant neurobehavioral development as reflected by the NICU Network Neurobehavioral Scale(NNNS). Environ Res., 183:109204. doi: 10.1016/j.envres.2020.109204. PMID: 32311904; PMCID.
More on Utah's PM2.5
As described in 40 CFR 50.7, PM2.5is legally defined as particles in the ambient air with an aerodynamic diameter less than or equal to a nominal 2.5 micrometers (2.5 μm).
At present, the Cache Valley airshed has been redesignated as PM2.5“maintenance” (Jun. 18, 2021), while Box Elder, Weber, Davis, Salt Lake, Toole, and Utah counties remain listed as “non-attainment” (EPA, 2021). Additionally, although the data have not been finalized, the most recent three years suggest that the Utah County airshed may also be designated for “maintenance” listing.
The Utah Winter Fine Particulate Study (UWFPS) was a remarkable cooperative study designed to characterize much of the local wintertime chemistry, source attribution, and meteorology from Cache Valley, along the Wasatch Front, and down through Utah County (Baasandorj and Brown et al., 2018). To be certain, uncertainties still exist. Many of the authors of the UWFPS manuscript collaborated on a recent whitepaper outlining suggested future research priorities and are in the process of trying to organize future campaigns (Hallar et al., 2021).
Baasandorj, M., S. Brown, and 31 other authors (2018). 2017 Utah Winter Fine Particulate Study: Final Report. Submitted to the Utah Division of Air Quality (UDAQ), March 16, 2018. https://deq.utah.gov/air-quality/utah-winter-fine-particulate-study-uwfps, accessed Nov. 2021.
Hallar, A.G. and 44 other authors (2021). Coupled air quality and boundary-layer meteorology in western U.S. basins during winter: Design and Rationale for a comprehensive study. Bulletin Amer. Meteor. Soc., 102(10), pp 2012-2033, https://doi.org/10.1175/BAMS-D-20-0017.1.
Mackun, P., J. Comenetz, and L. Spell (2021). More than half of US counties were smaller in 2020 than in 2010: Around four-fifths of all US metro areas grew between 2010 and 2020. US Census Bureau, https://www.census.gov/library/stories/2021/08/more-than-half-of-united-states-counties-were-smaller-in-2020-than-in-2010.html, accessed Oct. 2021.
More on Utah's ozone
Explicitly, in the Uinta Basin, portions of Duchesne and Uintah counties are listed as “marginal” non-attainment. Along the Wasatch Front, Weber, Davis, Salt Lake, Toole, and Utah counties are also listed as “marginal” non-attainment (EPA, 2021). It must also be mentioned, however, that uncertainties in adequately characterizing ozone issues in the Salt Lake airshed may result with the EPA redesignating that airshed to the more stringent “moderate” category in the next few months.
Many recent studies addressing Utah’s ozone formation are available from Utah Division of Air Quality (UDAQ, 2021b).
Factors which may complicate future ozone minimization plans in the Uinta Basin include differences between the regulatory authority over state-and tribal-controlled lands; the fact that since 2013, inversions have been relatively weak and the ground has often lacked snow cover; and, perhaps, the most immediate concern is that, owing to sustained increases in oil and gas prices, drilling and production has increased approximately five-fold, resulting in commensurate increases in NOxand VOCs that have been seen throughout the past decade. If a period of strong inversions were to develop, it is reasonable to speculate the excessive ozone will also be observed.
As previously indicated, more work on the Wasatch Front needs to be completed to understand the detailed photochemistry involved, including better delineation of the relative abundance of speciated reactive VOCs, the contribution of biogenic (vegetation-based) VOCs, and potential long-range transport of ozone and precursors (NOx/VOCs) into the local airshed. Addressing the latter, a modeling study, funded by the Utah Petroleum Industry and the Utah Mining Association, was performed by the consulting engineering group Ramboll to assess the potential of long-range contributions to observed excess ozone. The objective of the consultant study was to submit an International Transport Demonstration (179B(b)) to the EPA, which if accepted, would help the area avoid redesignation to the “moderate” category, thereby avoiding more stringent control requirements. However, there appear to be weaknesses in some of the modeling assumptions, which are discussed and available via the UDAQ website (UDAQ, 2021c). The EPA has targeted early 2022 for acceptance or decline notification.
UDAQ, 2021c. 179B(b) demonstration packet. Utah Department of Environmental Quality, Division of Air Quality, https://documents.deq.utah.gov/air-quality/planning/air-quality-policy/DAQ-2021-005764.pdf, accessed Oct. 2021.
More on the Utah Inland Port development
The Utah Inland Port Authority (UIPA) was created by the state legislature in 2018 to promote the production and movement of goods in and out of Utah. The UIPAjurisdiction area covers approximately 16,000 acres, with about 7,000 acres available for development west and southwest of the Salt Lake City International Airport. While there are significant debates and discussions on several levels, it seems as if theInland Port transportation hub is coming in some form or another, and the increased concentration of area, stationary and mobile air pollutant sources likely cannot be avoided.Thus far, there has been very little information regarding the potential increased VMTs and operational numbers, which can, in turn, be used to understand changes in emissions.There is a provision in the Clean Air Act and the SIPs that calls for “transportation conformity,”which basically means that any air pollutant emission increasesfrom the Inland Port will have to be balanced with reductions elsewhere within the airshed. Given the necessity to accurately account for all air pollutant emissions in airsheds with already compromised air quality, it is critical for the local regulatory and research communities to work with the UIPA and develop emissions inventories based accurately on the planned development.
As plans for the inland port develop, it is vital to consider and use possible guidelines, such as clean air plans developed by other ports (e.g. Long Beach and Los Angeles). As examples, many of these facilities have developed regulations that govern the types of allowable equipment within these port systems. If the Utah Inland Port does not implement plans to govern allowable equipment, it is conceivable that the airshed will receive the old equipment that is not permitted in other ports. This has been seen in the transportation sector and oil and gas industry with previous region-specific regulations.
Long-range transport of air pollutants
Long-range transport of criteria air pollutants, their precursors, or air toxic compounds is not an uncommon phenomenon. Although Utah has strong documentation of locally generated air pollutant issues, Utah also has an unfortunate history of well-referenced long-range incidences, such as the Regional Haze and Downwinder issues affecting Utah’s population and environment. The Regional Haze issue relates to long-range intra-and interstate pollutant issues targeting airsheds around national parks and wilderness areas (www.epa.gov/visibility). Downwinder issues typically refer to areas within the continental U.S. wherein populations were unintentionally exposed to radioactive materials released during nuclear weapons testing and production/research accidental releases. Recognition of the cancer-related impacts resulted in the 1990 passage of the Radiation Exposure Compensation Act (RECA). RECA authorizes the payment of up $50,000 per individual, for those who were likely exposed to fallout from testing events between 1951-1958 and the summer of 1962. Specific counties in Utah listed within RECA include Beaver, Garfield, Iron, Kane, Millard, Piute, San Juan, Sevier, Washington, and Wayne. The act is set to expire in July 2022, but there is a public campaign to authorize an extension.

Figure ##. National exposure map of Downwinder radioactive exposures.
Equity of air quality impacts
The EPA and UDAQ have recently begun to take Environmental Justice (EJ) issues into consideration in regulatory decisions and have or are considering various partnerships, strategic planning, and even grants/funding for furthering this issue. As defined byStevenson and Cawley (2020), environmental justice is the observation that environmental exposure and associated health impacts are unevenly distributed across geographic and social space. It is further no secret that economically disadvantaged areas are often the areas where excessive pollutants across all media may be found. Social, economic, and environmental conditions often place additional stresses on poor populations, and these can lead to situations that may result in greater susceptibility to the health effects of air pollution. From a research perspective, these communities are worth studying because they react to air pollutants at higher levels than the general population. Thus, by identifying levels that increase risk for poor health among thesepopulations, protections would be in place for Utahans that are not living in these same stressful conditions.
As a local example, the Rose Park neighborhood and the surrounding areas are often the highest in regards to winter PM2.5 and summer ozone. Figure 6 shows a contour plot compiling the total number of ozone exceedances for the month of July 2021 across UDAQ’s monitoring stations along the Wasatch Front, compared to the region’s spatial distribution of household income. As can be seen, the areas west of the I-15 corridor, including the areas around the proposed inland port, showed the highest ozone levels. It should be noted that an annual violation is considered when there are ≥4 observed violations of the 8-hr NAAQS. These areas are also coincident with the lower household incomes. Analogous distributions can be found if based on racial or other diversity parameters. Similar pollutant gradients can also be observed during winter PM2.5episodes, with perhaps even greater spatial resolution using low-cost sampler networks such as the University of Utah’s Air Quality & U network or the commercial Purple Air network, although caution must be used do to potential calibration inconsistencies.

Figure 6.
Stevenson, M.A. and D. Cawley (2020). Environmental Justice and Advocacy. in Utah’s Air Quality Issues: Problems and Solutions, H. Crimmel (ed.), The University of Utah Press, SLC, UT, ISBN 9781607817093.
Cross-Cutting Issues
Full list of threatened and endangered species
Table 1. Sensitive species in Utah, their listing status, population trends, and principal threats. EN - Endangered, TH - Threatened, NL – Not listed, SS – State sensitive species, I – Imperiled, NE- Nonessential. Credit: Iceclyn Ionel, Dr. Jessica Tegt, and Dr. Terry Messmer.
| Species | Listing Status¹ | 2021 Population Trend | Recov.Plan Appr. | Species Conservation Threats |
|---|---|---|---|---|
| Terrestrial | ||||
| Black-Footed Ferret | EN/NE | Increasing | 2013 | Exotic diseases and habitat destruction |
| Utah Prairie Dog | TH/TH | Increasing | 2012 | Plague, habitat destruction, invasive plants, and predation |
| Mexican Spotted Owl | TH/I | Increasing | 2012 | Habitat loss and wildlife fires |
| Southwestern Willow Flycatcher | EN/TH | Stable | 2002 | Habitat loss |
| Aquatic | ||||
| Humpback Chub | EN/EN | Increasing | 1990 | Drought and invasive species |
| Bonytail | EN/EN | Stable | 2002 | Habitat loss, introduction of nonnative fishes |
| Razorback Sucker | EN/EN | Stable | 2002 | Habitat loss, nonnative fishes, overgrazing, pollution |
| June Sucker | TH/TH | Increasing | 1999 | Habitat loss, drought, invasive species |
| Virgin River Chub | EN/EN | Increasing | 2019 | Water use, decreased water quality, and exotic fishes |
| Colorado Squawfish | EN/EN/EN | Increasing | 2002 | Habitat issues and noonnative species |
| Woundfin | EN/EN | Increasing | 1995 | Low flows and high temperatures |
| Reptiles/Amphibians | ||||
| Desert Tortoise | TH/TH | Decreasing | 2011 | Habitat loss, invasive species, disease |
| Boreal Toad | NL/SS | Decreasing | N/A | Disease, habitat destruction, pesticides and pollutants, loss of genetic diversity. |
| Plants | ||||
| Dwarf bear-poppy | EN/EN | Decreasing | 1985 | Urban Development |
| Shivwits milk-vetch | EN/EN | Increasing | 2006 | Human Activities and invasive exotic plants |
| Holmgren milk-vetch | EN/END | Decreasing | 2006 | Urban development, livestock grazing, and mining |
| Barneby ridge-cress | EN/EN | Stable | 2019 | Oil and gas development, recreational OHV use |
| Kodachrome bladderpod | EN/EN | Stable | 2009 | Oil and gas development, new road construction, OHV use, cattle grazing |
| San Rafael cactus | EN/EN | Stable | 2016 | Over collection for horticultural purposes, OHV impacts |
| Clay phacelia | EN/EN | Stable | 2019 | Overgrazing, roads, and invasive species |
| Autumn buttercup | EN/EN | Decreasing | 2019 | Small mamal herbivory and inappropriate grazing practices |
| Barneby reed-mustard | EN/EN | Stable | 1994 | Oil and gass exploration, oil-shale mining, stone quarrying, and OHV use |
| Shrubby reed-mustard | EN/EN | Stable | 2019 | Overgrazing |
| Wright fishhook cactus | EN/EN | Stable | 1985 | Potential exploration and development of mineral resources and OHV use |
| Welsh's milkweed | TH/TH | Stable | 1992 | OHV use, mineral and energy development, road building, and livestock grazing |
| Heliotrope milk-vetch | TH/TH | Stable | 1995 | Grazing, and oil and gas surface disturbing activities |
| Jones cycladenia | TH/TH | Stable | 2021 | Energy and mineral development |
| Winkler cactus | TH/TH | Stable | 2016 | OHV use, mineral development, road and utility development, and livestock trampling |
| Maguire primrose | TH/TH | Increasing | 2019 | Rock climbing and rappelling, transportation and utility construction, and campground and trail development |
| Clay reed-mustard | TH/TH | Stable | 1994 | Oil and gas exploration, oil-shale mining, stone quarrying, and OHV use |
| Pariette cactus | TH/TH | Stable | 2010 | Mineral and energy development, illegal collection, OHV use, and grazing |
| Uinta Basin hookless cactus | TH/TH | Stable | 2010 | Mineral and energy development, illegal collection, OHV use, and grazing |
| Ute ladies'-tresses | TH/TH | Stable | 1995 | Habitat loss and degredation, and water use |
| Last Chance townsendia | TH/TH | Decreasing | 1993 | Coal mining, road development, OHV use, and grazing |
More on equity of environmental impacts
The state of Utah is bequeathed with a wealth of extractive natural resources with a combined value of $6.5 billion, including metals and industrial minerals, natural gas, crude oil and coal (Boden, Krahulec, Berg, & Rupke, 2016). Utah also has a diverse wealth of geographical and ecological resources ─ mountains, forests, red rock, Great Basin deserts, andthe largest saltwater lake in the Western Hemisphere─ enjoyed by Utahans and domestic and international visitors. However, use and access to these resources are not representative of the state’s population in general. These disparities must be addressed so that Utah can fulfill the vision in the One Utah Roadmap by creating greater access to water, land, recreation, and healthy environments for all Utahns. (Cox, Spencer, andDeidre M. Henderson, 2021).
Outdoor Recreation
2.5 million Utahns participate in outdoor recreation each year. In national parks alone, visitors spent $1.2 Billion dollars in 2019 despite the government shutdown (Leaver, 2019). Most recreationists are white (92-98%), female (52-58%), and the largest proportion is under the age of 16 (17-24%). Other racial and ethnic groups such as Black, Hispanic, and Hawaiian and Pacific Islanders are underrepresented in all major national forests in Utah (Smith & Miller, 2020).
Drought and Fire Hazards
We cannot control droughts, but we can take steps to mitigate the effects by preparing our communities to be more resilient. Drought conditions affect all Utahns but incomes of the counties but Figures 1 and 2 illustrate that exceptional drought conditions occur in lower-income counties, and these counties have also experienced more fires in 2021

Figure 1. Utah drought conditions and median income

Figure 2. Figure 2. Locations of wildfires. Data Source: U.S. Drought Monitor, National Drought Mitigation Center, GISData Download. Note: Overlayed Image is from Utah Wildfire Board. It displays 1,131 wildfires through October 31,2021. Red dots indicate human-caused fires, yellow dots indicate natural-caused fires.
Water Use
The primary source for water comes from precipitation, particularly the snow melt from mountainous areas that occurs from January to May. Roughly 87% goes toward agricultural use, 9% for city use, and 4% for industry us (Utah State University Extension, 2020). Utahns pay low water rates because most Utah water districts are heavily subsidized by property taxes, which discourages conservation. Disparities in water use are more evident during the summer in Salt Lake City, where homeowners in wealthier neighborhoods may use about five times the water than in lower income areas. Lower income households may pay a higher proportion of their total summertime water costs through property taxes, compared to wealthier households (Podmore, 2021).
Air Quality
Overall, Utah air quality is clean for a large majority of the year, there are however, some areas that experience summertime problems along the Wasatch front but also there may be unhealthy air pollution levels during winter in the Uinta Basin due to inversions. One of the areas with the poorest air quality areas due anthropogenic sources can be found in Salt Lake City around the Inland Port communities where there is the highest proportion of people of color with the lowest income. These communities are disproportionately influenced by poor air quality, specifically PM2.5 and Ozone as seen in Figures 3 and 4.

Figure 3. PM 2.5 Emission Level (State Percentiles) from EPA EJSCREEN

Figure 4. Ozone Emission Level (State Percentiles) from EPA EJSCREEN
These disparities may be lessened through education and outreach to underserved communities to promote outdoor recreation activities, mitigation plans for drought and fire hazards, air quality, and water conservation measures for all Utahns.
References
Backlund, M., Bateman, M., Brandley, A., Christensen, M., Dean, P., Downen, J., . . . Hollingshaus, M. (2021). Diversity in utah.
Boden, T., Krahulec, K., Berg, M. V., & Rupke, A. (2016). Utah’s extractive resource industries 2015 Utah Geological Survey.
Cox, Spencer and Deidre M. Henderson. (2021). One utah roadmap.().
Leaver, J. (2019). The state of utah’s travel and tourism industry 2019. Salt Lake,
Mills, S., Rupke, A., Berg, M. D. V., & Boden, T.Utah mining 2019. Circular, 130, 24-26.
Podmore, Z. (2021). Drought brings scrutiny to utah's high water use, low rates. Retrieved from https://apnews.com/article/business-droughts-personal-taxes-utah-salt-lake-city-63c0e10ee5c9ecbd79d4a00c012b3871
Smith, J., & Miller, A. B. (2020). The state of outdoor recreation in utah 2020.
U.S. national parks by state. (2021). Retrieved from https://www.nationalparktrips.com/parks/us-national-parks-by-state-list/
Utah State University Extension. (2020). Water quality. Retrieved from https://extension.usu.edu/waterquality/learnaboutsurfacewater/watersheds/utahmajorwatersheds